


Languages
Pages
Legal

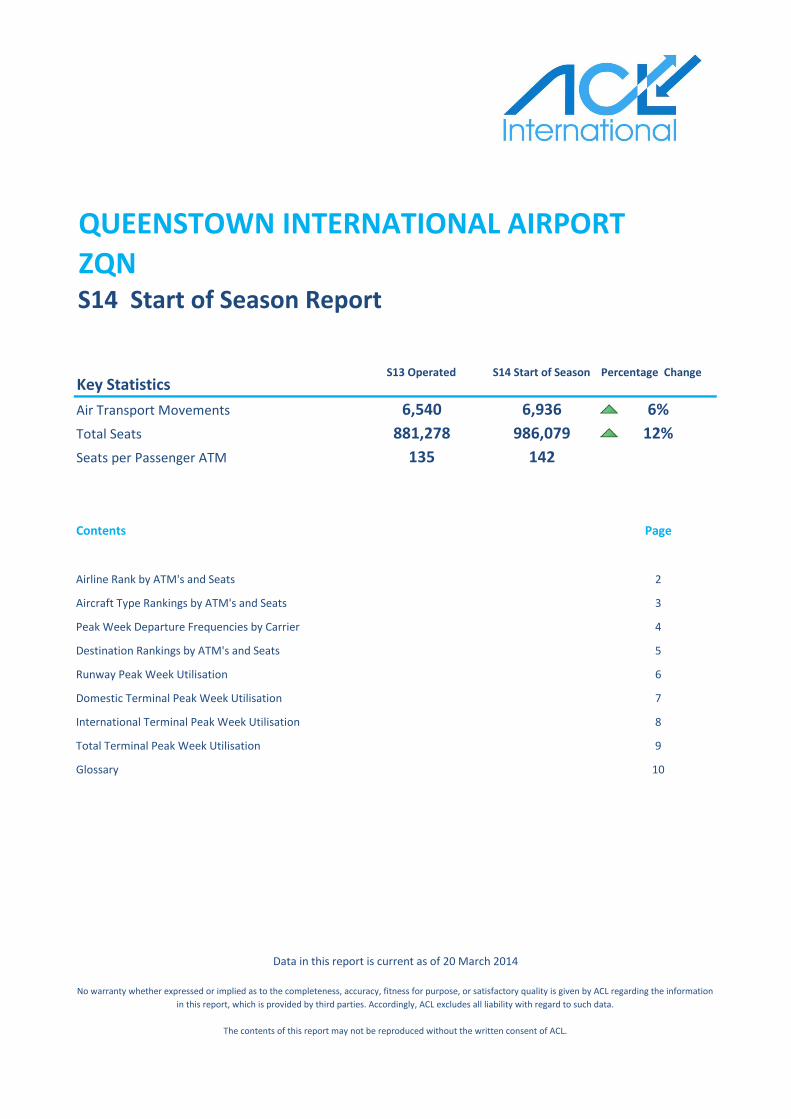
Key Statistics
Air Transport Movements 6,540 6,936 6%
Total Seats 881,278 986,079 12%
Seats per Passenger ATM 135 142
Contents Page
Airline Rank by ATM's and Seats 2
Aircraft Type Rankings by ATM's and Seats 3
Peak Week Departure Frequencies by Carrier 4
Destination Rankings by ATM's and Seats 5
Runway Peak Week Utilisation 6
Domestic Terminal Peak Week Utilisation 7
International Terminal Peak Week Utilisation 8
Total Terminal Peak Week Utilisation 9
Glossary 10
QUEENSTOWN INTERNATIONAL AIRPORT
ZQN
S14 Start of Season
Data in this report is current as of 20 March 2014
No warranty whether expressed or implied as to the completeness, accuracy, fitness for purpose, or satisfactory quality is given by ACL regarding the information
in this report, which is provided by third parties. Accordingly, ACL excludes all liability with regard to such data.
The contents of this report may not be reproduced without the written consent of ACL.
S14 Start of Season Report
Percentage ChangeS13 Operated

Airline MovementsAir New Zealand 4679
Jetstar 1483
Virgin Australia 418
Qantas 356
Airline SeatsAir New Zealand 585763
Jetstar 266940
Virgin Australia 73568
Qantas 59808
Airlines by Air Transport Movements (ATMs)
Airlines by Seats
Air New Zealand 68%
Jetstar 21%
Virgin Australia 6%
Qantas 5%
Air New Zealand 59%
Jetstar 27%
Virgin Australia 8%
Qantas 6%
2

Airline MovementsAirbus A320 4108
ATR72 2054
Boeing 737-800 774
Airline SeatsAirbus A320 713031
ATR72 139672
Boeing 737-800 133,376
Aircraft Types by Air Transport Movements (ATMs)
Aircraft Types by Seats
Airbus A320 59%
ATR72 30%
Boeing 737-800 11%
Airbus A320 72%
ATR72 14%
Boeing 737-800 14%
3
Page 4
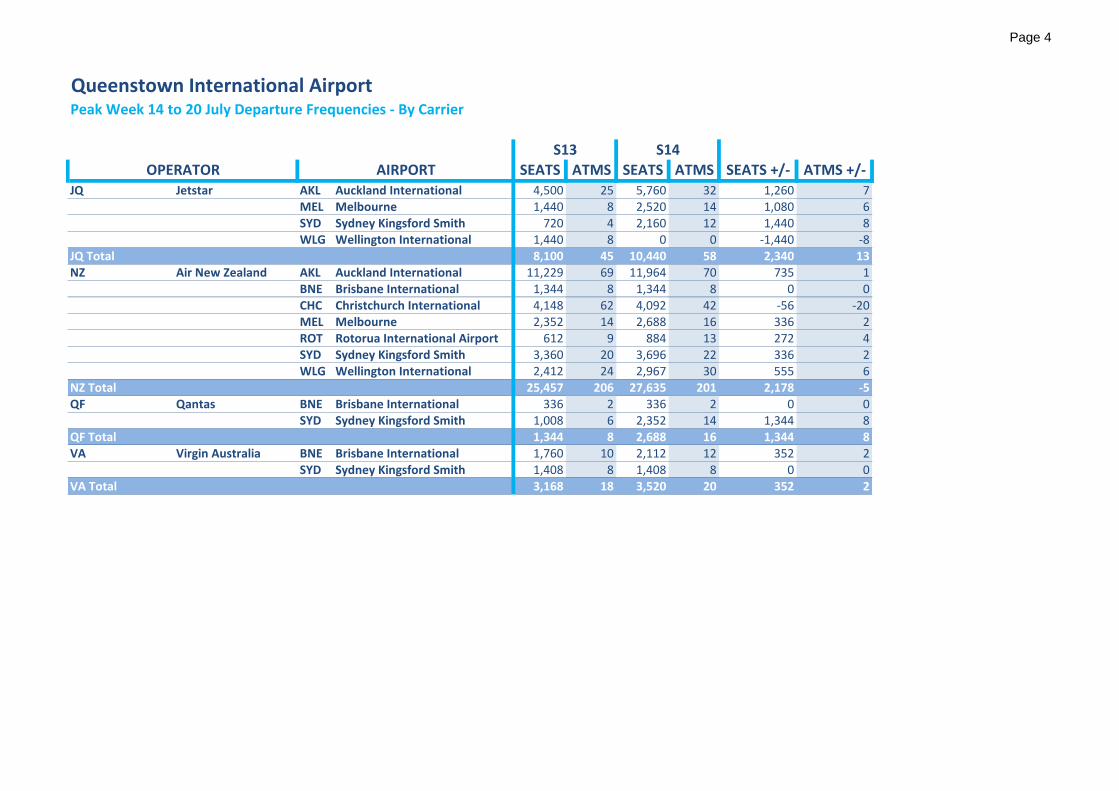
Queenstown International AirportPeak Week 14 to 20 July Departure Frequencies - By Carrier
SEATS ATMS SEATS ATMS SEATS +/- ATMS +/-JQ Jetstar AKL Auckland International 4,500 25 5,760 32 1,260 7
MEL Melbourne 1,440 8 2,520 14 1,080 6 SYD Sydney Kingsford Smith 720 4 2,160 12 1,440 8 WLG Wellington International 1,440 8 0 0 -1,440 -8
JQ Total 8,100 45 10,440 58 2,340 13NZ Air New Zealand AKL Auckland International 11,229 69 11,964 70 735 1
BNE Brisbane International 1,344 8 1,344 8 0 0 CHC Christchurch International 4,148 62 4,092 42 -56 -20 MEL Melbourne 2,352 14 2,688 16 336 2 ROT Rotorua International Airport 612 9 884 13 272 4 SYD Sydney Kingsford Smith 3,360 20 3,696 22 336 2 WLG Wellington International 2,412 24 2,967 30 555 6
NZ Total 25,457 206 27,635 201 2,178 -5QF Qantas BNE Brisbane International 336 2 336 2 0 0
SYD Sydney Kingsford Smith 1,008 6 2,352 14 1,344 8QF Total 1,344 8 2,688 16 1,344 8VA Virgin Australia BNE Brisbane International 1,760 10 2,112 12 352 2
SYD Sydney Kingsford Smith 1,408 8 1,408 8 0 0VA Total 3,168 18 3,520 20 352 2
S13 S14
OPERATOR AIRPORT
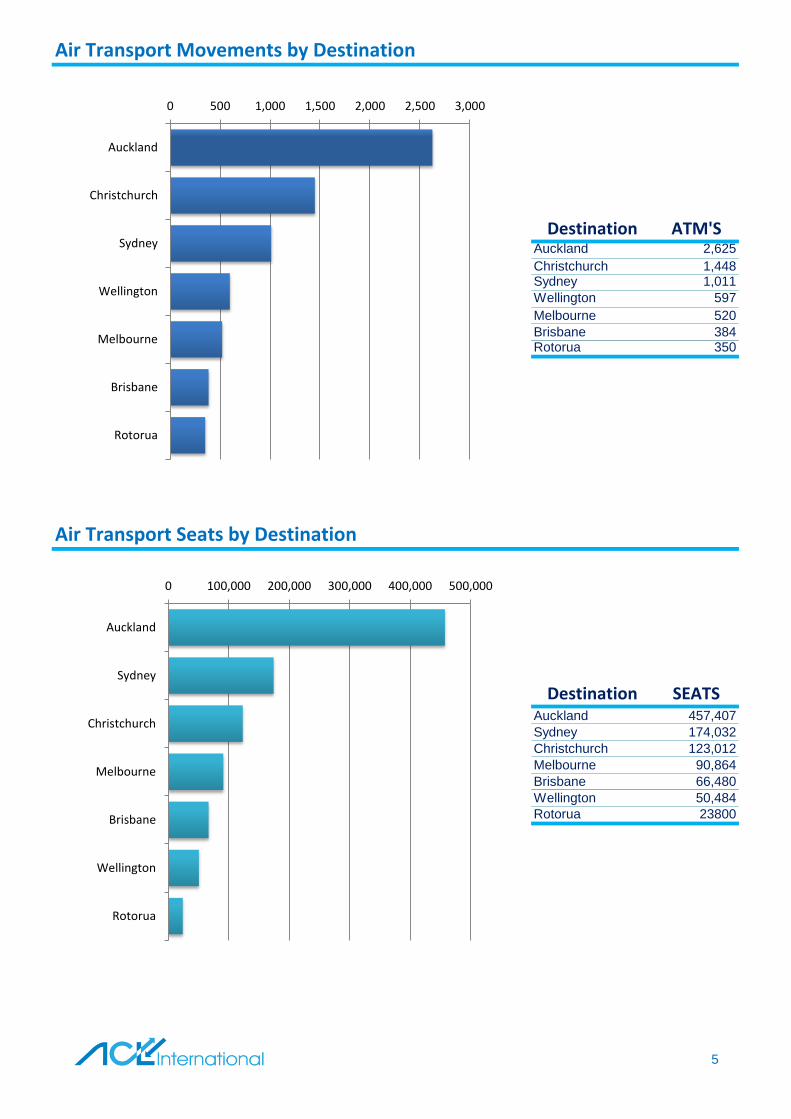
Destination ATM'SAuckland 2,625
Christchurch 1,448Sydney 1,011
Wellington 597
Melbourne 520
Brisbane 384Rotorua 350
Destination SEATSAuckland 457,407
Sydney 174,032
Christchurch 123,012
Melbourne 90,864
Brisbane 66,480
Wellington 50,484
Rotorua 23800
Air Transport Seats by Destination
Air Transport Movements by Destination
0 500 1,000 1,500 2,000 2,500 3,000
Auckland
Christchurch
Sydney
Wellington
Melbourne
Brisbane
Rotorua
0 100,000 200,000 300,000 400,000 500,000
Auckland
Sydney
Christchurch
Melbourne
Brisbane
Wellington
Rotorua
5
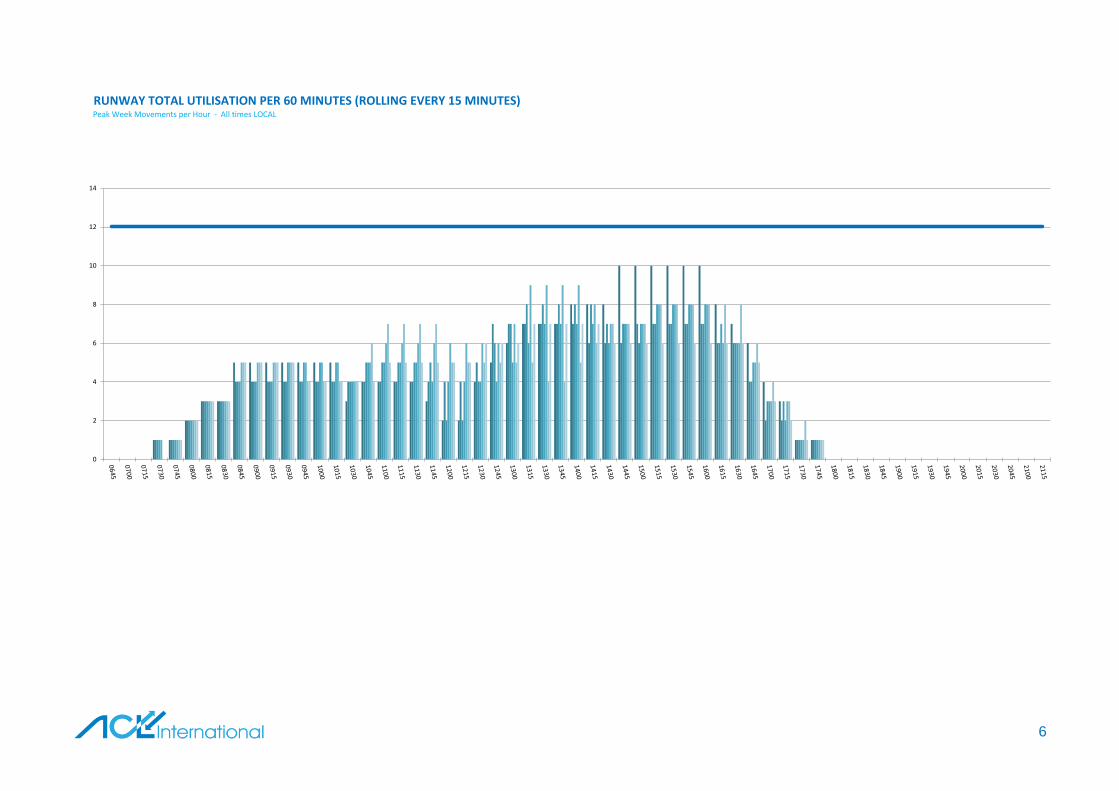
RUNWAY TOTAL UTILISATION PER 60 MINUTES (ROLLING EVERY 15 MINUTES)Peak Week Movements per Hour - All times LOCAL
S13 Operated S14 POST -IATA
0
2
4
6
8
10
12
14
6
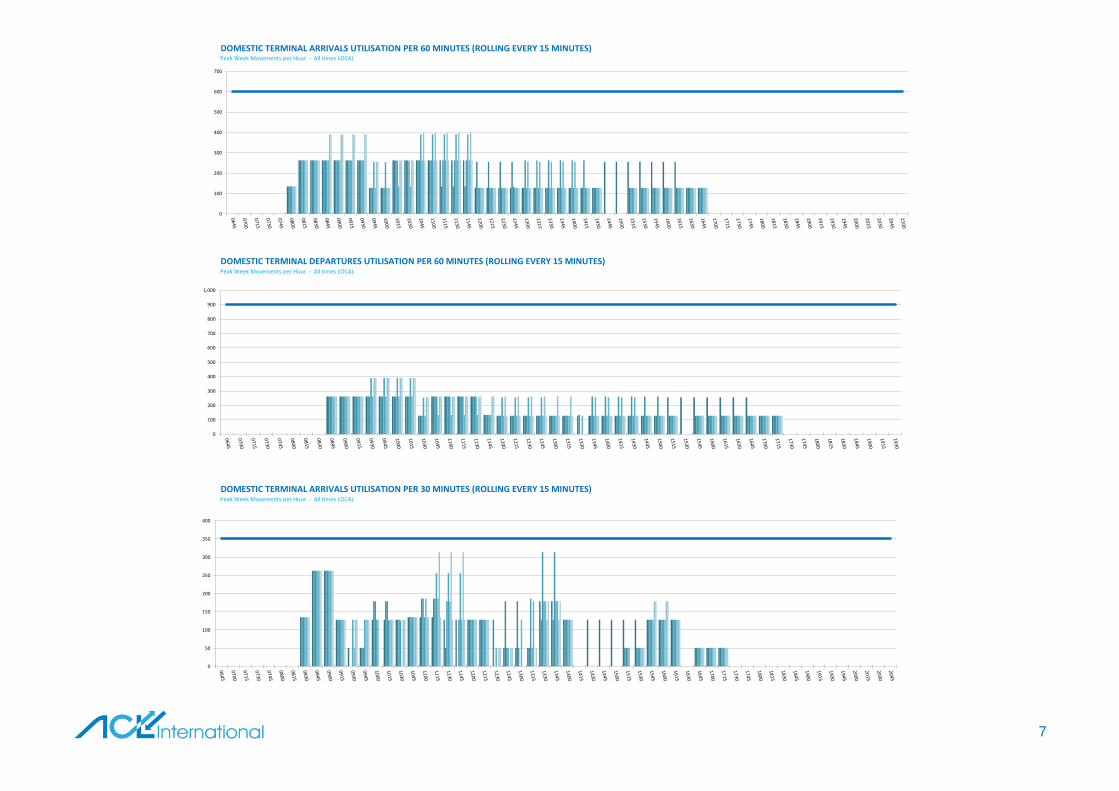
DOMESTIC TERMINAL ARRIVALS UTILISATION PER 60 MINUTES (ROLLING EVERY 15 MINUTES)Peak Week Movements per Hour - All times LOCAL
S13 Operated S14 POST -IATA
DOMESTIC TERMINAL DEPARTURES UTILISATION PER 60 MINUTES (ROLLING EVERY 15 MINUTES)Peak Week Movements per Hour - All times LOCAL
DOMESTIC TERMINAL ARRIVALS UTILISATION PER 30 MINUTES (ROLLING EVERY 15 MINUTES)Peak Week Movements per Hour - All times LOCAL
1830
1845
1900
1915
1930
0
100
200
300
400
500
600
700
0
100
200
300
400
500
600
700
800
900
1,000
0
50
100
150
200
250
300
350
400
7

INTERNATIONAL TERMINAL ARRIVALS UTILISATION PER 60 MINUTES (ROLLING EVERY 15 MINUTES)Peak Week Movements per Hour - All times LOCAL
S13 Operated S14 POST -IATA
INTERNATIONAL TERMINAL DEPARTURES UTILISATION PER 60 MINUTES (ROLLING EVERY 15 MINUTES)Peak Week Movements per Hour - All times LOCAL
INTERNATIONAL TERMINAL ARRIVALS UTILISATION PER 30 MINUTES (ROLLING EVERY 15 MINUTES)Peak Week Movements per Hour - All times LOCAL
1830
1845
1900
1915
1930
0
100
200
300
400
500
600
0
100
200
300
400
500
600
700
800
0
50
100
150
200
250
300
350
400
450
8
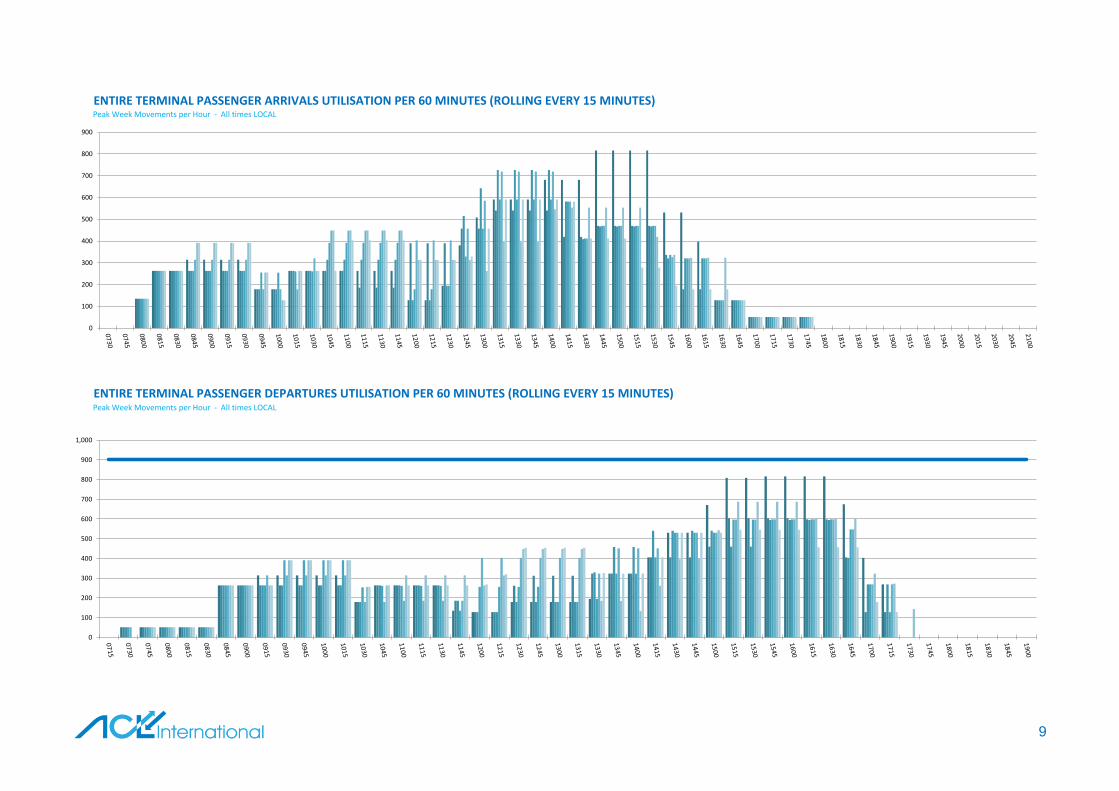
ENTIRE TERMINAL PASSENGER ARRIVALS UTILISATION PER 60 MINUTES (ROLLING EVERY 15 MINUTES)Peak Week Movements per Hour - All times LOCAL
S13 Operated S14 POST -IATA
ENTIRE TERMINAL PASSENGER DEPARTURES UTILISATION PER 60 MINUTES (ROLLING EVERY 15 MINUTES)Peak Week Movements per Hour - All times LOCAL
0
100
200
300
400
500
600
700
800
900
0
100
200
300
400
500
600
700
800
900
1,000
9
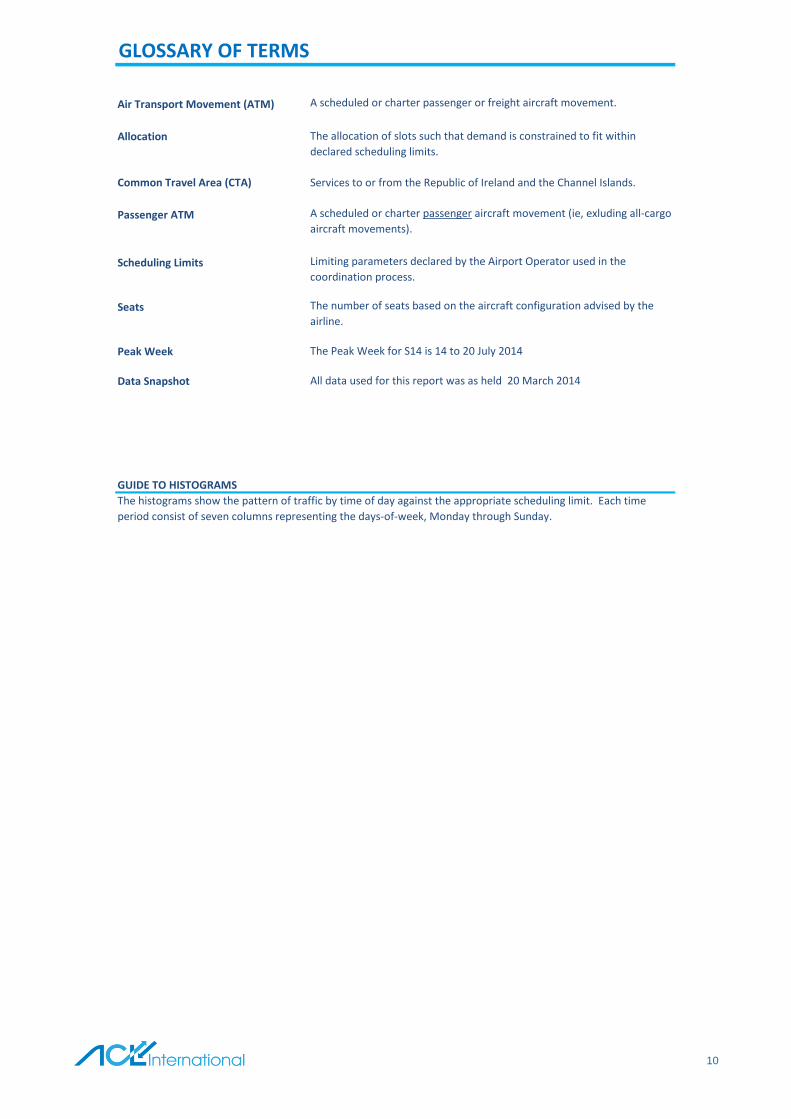
Air Transport Movement (ATM) A scheduled or charter passenger or freight aircraft movement.
Allocation The allocation of slots such that demand is constrained to fit within
declared scheduling limits.
Common Travel Area (CTA) Services to or from the Republic of Ireland and the Channel Islands.
Passenger ATM A scheduled or charter passenger aircraft movement (ie, exluding all-cargo
aircraft movements).
Scheduling Limits Limiting parameters declared by the Airport Operator used in the
coordination process.
Seats The number of seats based on the aircraft configuration advised by the
airline.
Peak Week The Peak Week for S14 is 14 to 20 July 2014
Data Snapshot All data used for this report was as held 20 March 2014
GUIDE TO HISTOGRAMS
The histograms show the pattern of traffic by time of day against the appropriate scheduling limit. Each time
period consist of seven columns representing the days-of-week, Monday through Sunday.
GLOSSARY OF TERMS
10
Top Related