


Languages
Pages
Legal

Quality Management Processes
• Plan Quality Management• Perform Quality Assurance• Control Quality
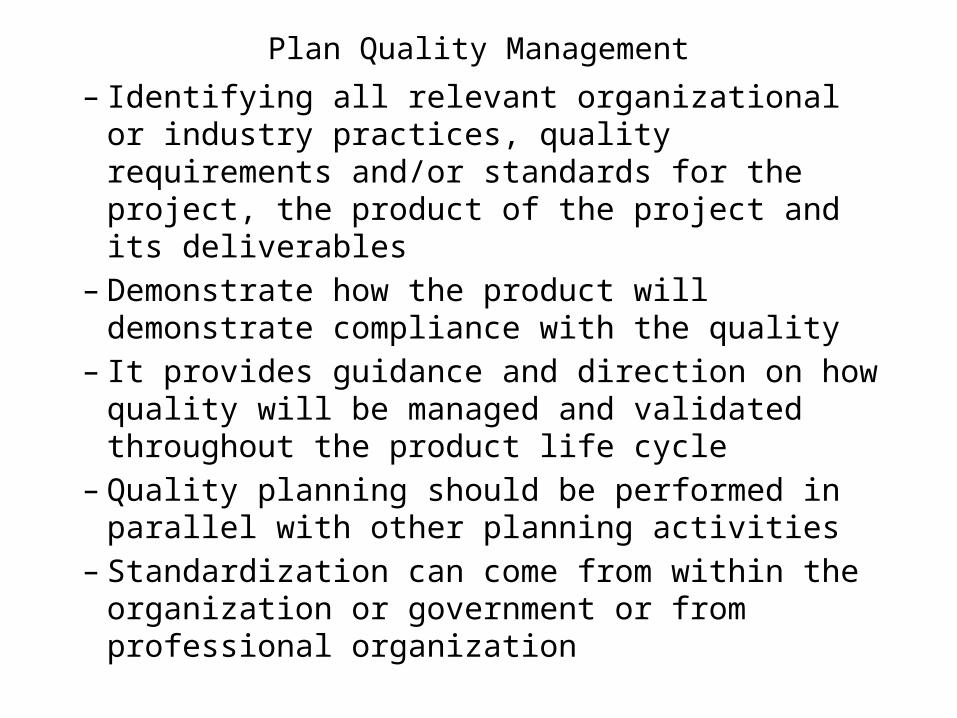
Plan Quality Management
– Identifying all relevant organizational or industry practices, quality requirements and/or standards for the project, the product of the project and its deliverables
– Demonstrate how the product will demonstrate compliance with the quality
– It provides guidance and direction on how quality will be managed and validated throughout the product life cycle
– Quality planning should be performed in parallel with other planning activities
– Standardization can come from within the organization or government or from professional organization
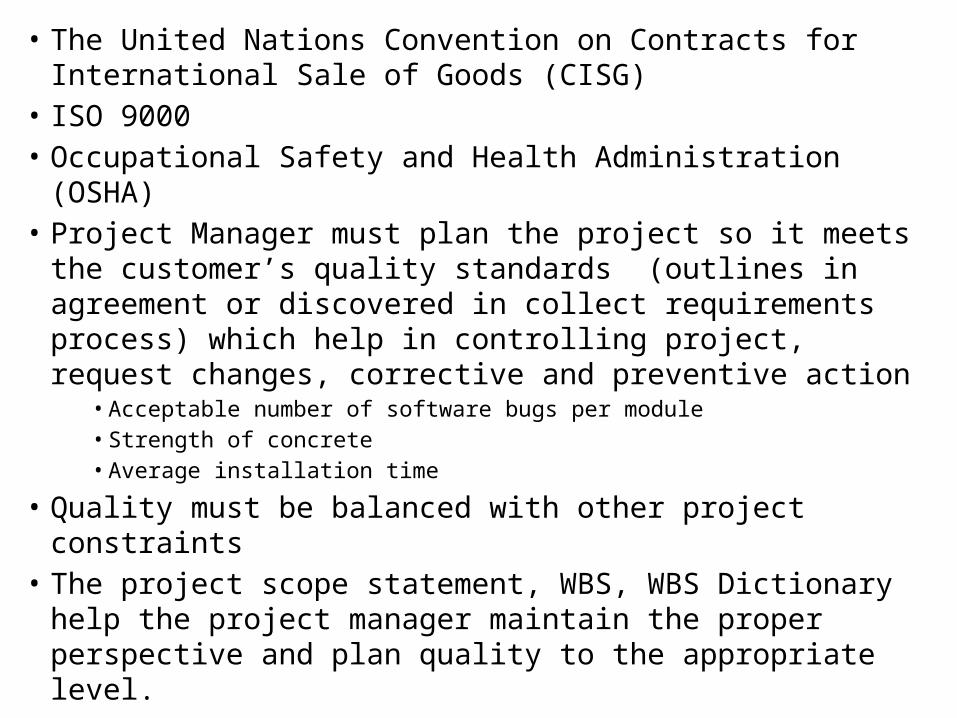
• The United Nations Convention on Contracts for International Sale of Goods (CISG)
• ISO 9000• Occupational Safety and Health Administration (OSHA)• Project Manager must plan the project so it meets the
customer’s quality standards (outlines in agreement or discovered in collect requirements process) which help in controlling project, request changes, corrective and preventive action
• Acceptable number of software bugs per module• Strength of concrete• Average installation time
• Quality must be balanced with other project constraints• The project scope statement, WBS, WBS Dictionary help the
project manager maintain the proper perspective and plan quality to the appropriate level.
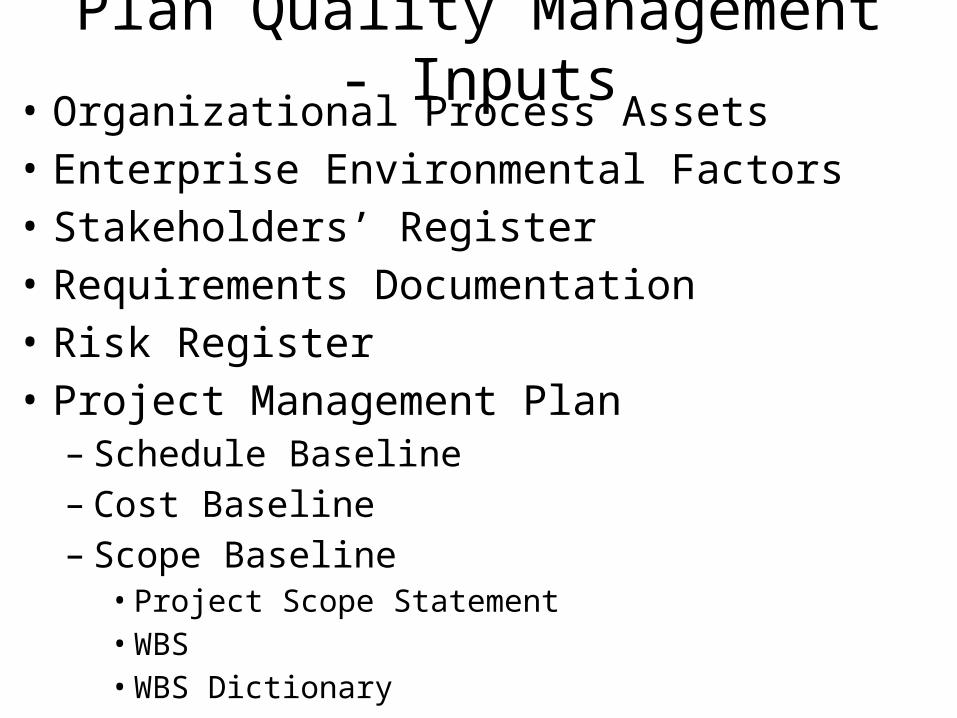
Plan Quality Management - Inputs• Organizational Process Assets• Enterprise Environmental Factors• Stakeholders’ Register• Requirements Documentation• Risk Register• Project Management Plan– Schedule Baseline– Cost Baseline– Scope Baseline• Project Scope Statement• WBS• WBS Dictionary
Plan Quality Management - Outputs
• Addition or changes to the Project Management Plan
• Project Documents update
Plan Quality Management-Tools and Techniques
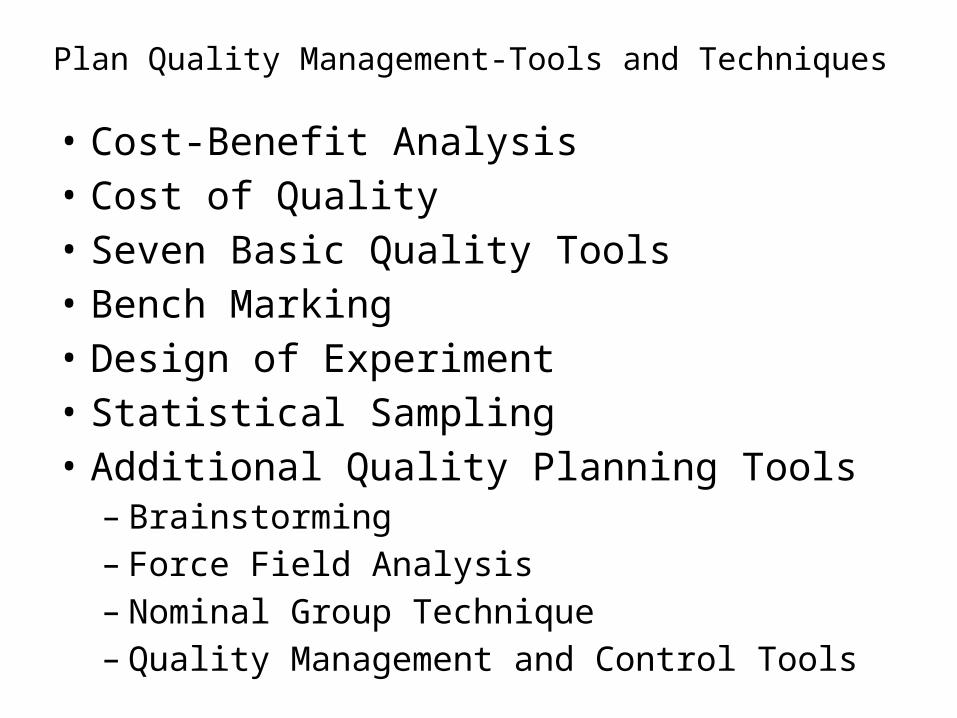
• Cost-Benefit Analysis• Cost of Quality• Seven Basic Quality Tools• Bench Marking• Design of Experiment• Statistical Sampling• Additional Quality Planning Tools– Brainstorming– Force Field Analysis– Nominal Group Technique– Quality Management and Control Tools
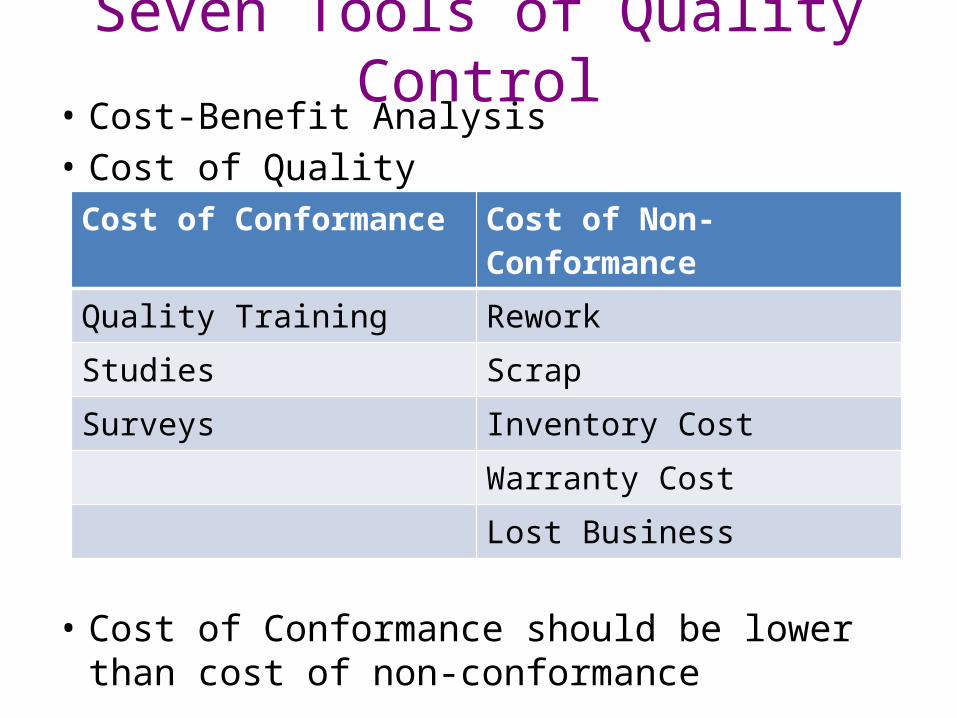
Seven Tools of Quality Control• Cost-Benefit Analysis• Cost of Quality
• Cost of Conformance should be lower than cost of non-conformance
Cost of Conformance Cost of Non-Conformance
Quality Training Rework
Studies Scrap
Surveys Inventory Cost
Warranty Cost
Lost Business
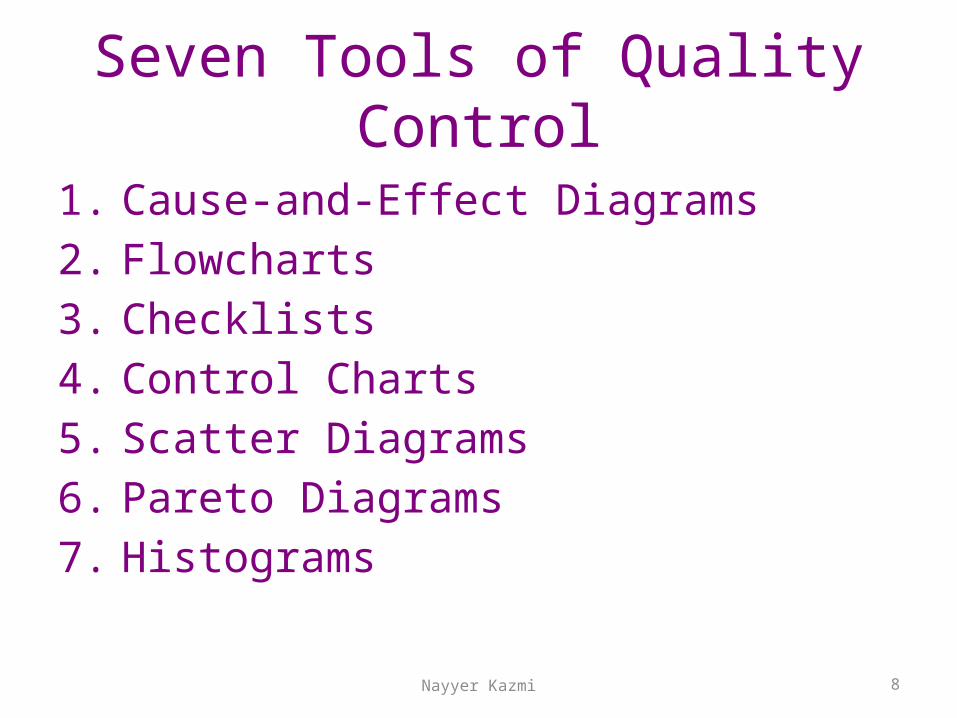
Seven Tools of Quality Control
1. Cause-and-Effect Diagrams2. Flowcharts3. Checklists4. Control Charts5. Scatter Diagrams6. Pareto Diagrams7. Histograms
Nayyer Kazmi 8
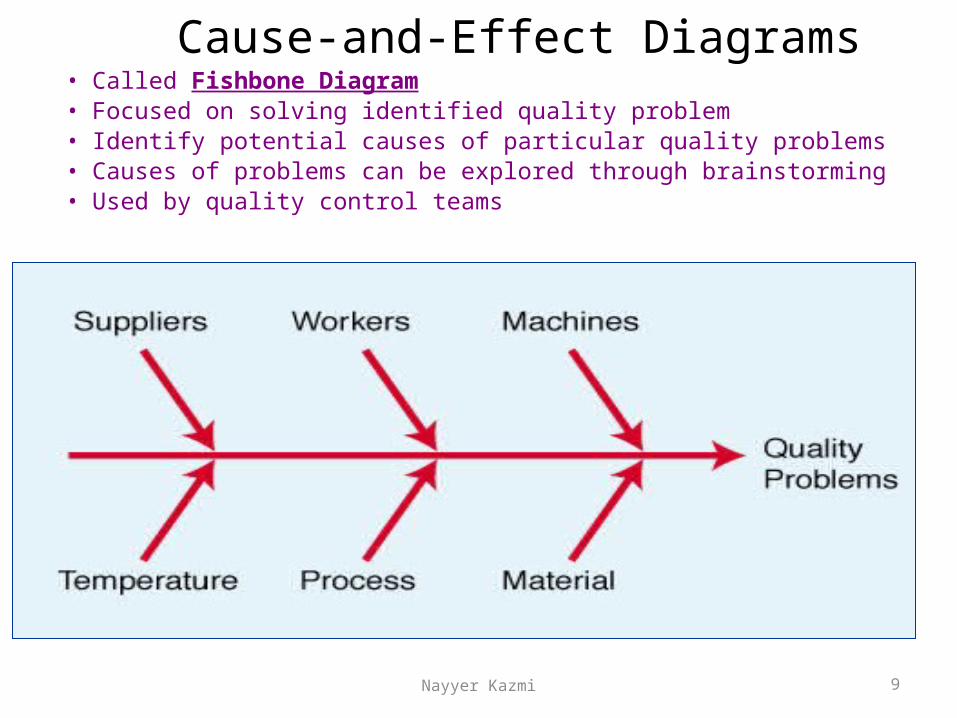
Cause-and-Effect Diagrams• Called Fishbone Diagram• Focused on solving identified quality problem• Identify potential causes of particular quality problems• Causes of problems can be explored through brainstorming• Used by quality control teams
Nayyer Kazmi 9
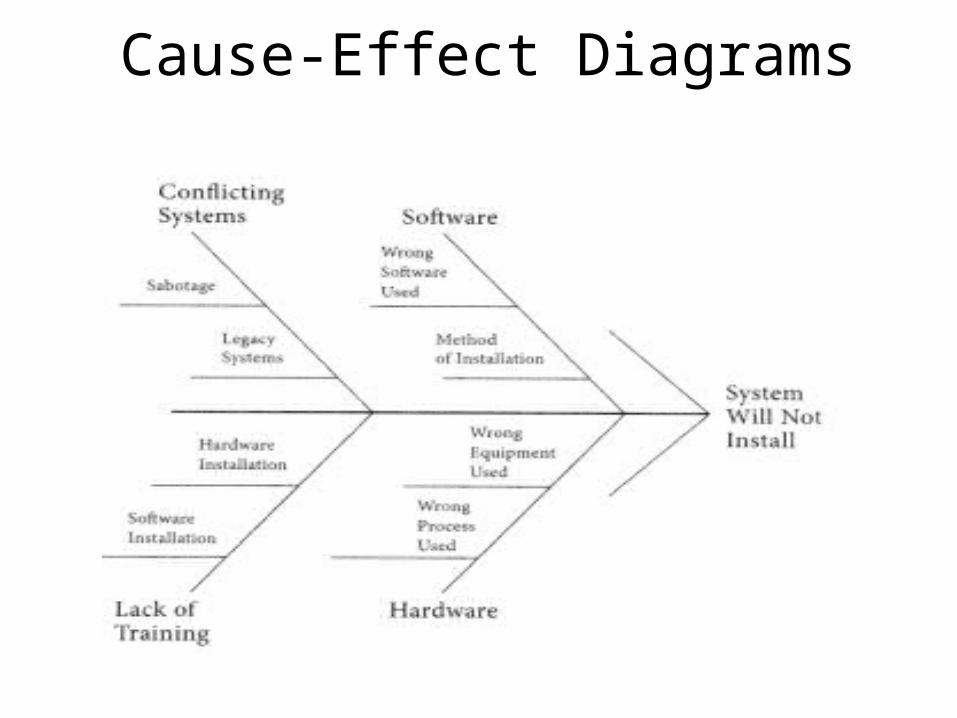
Cause-Effect Diagrams
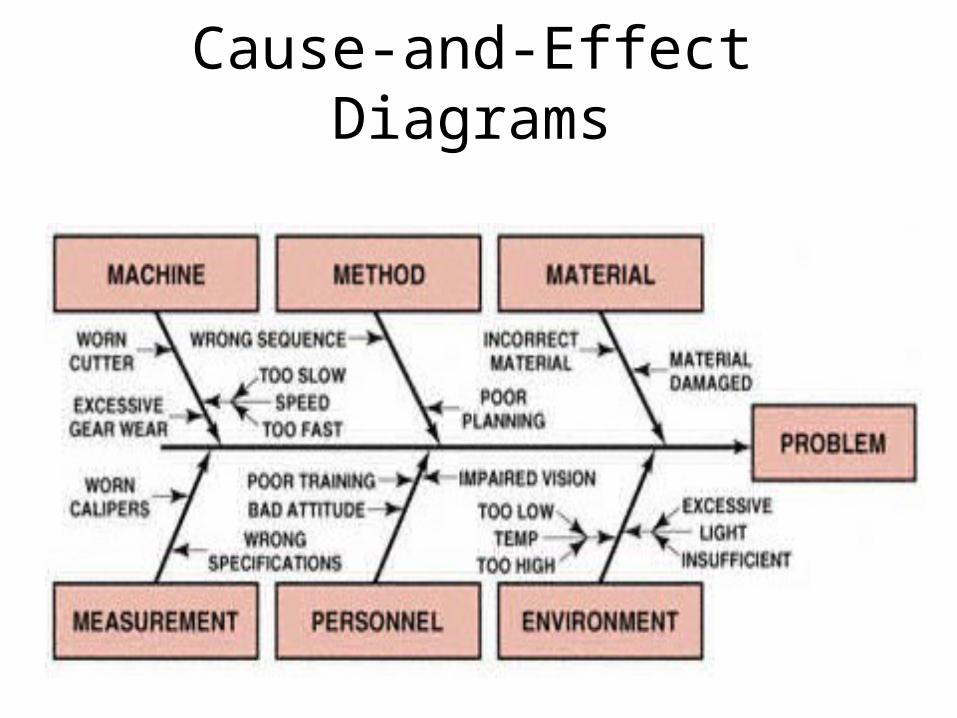
Cause-and-Effect Diagrams
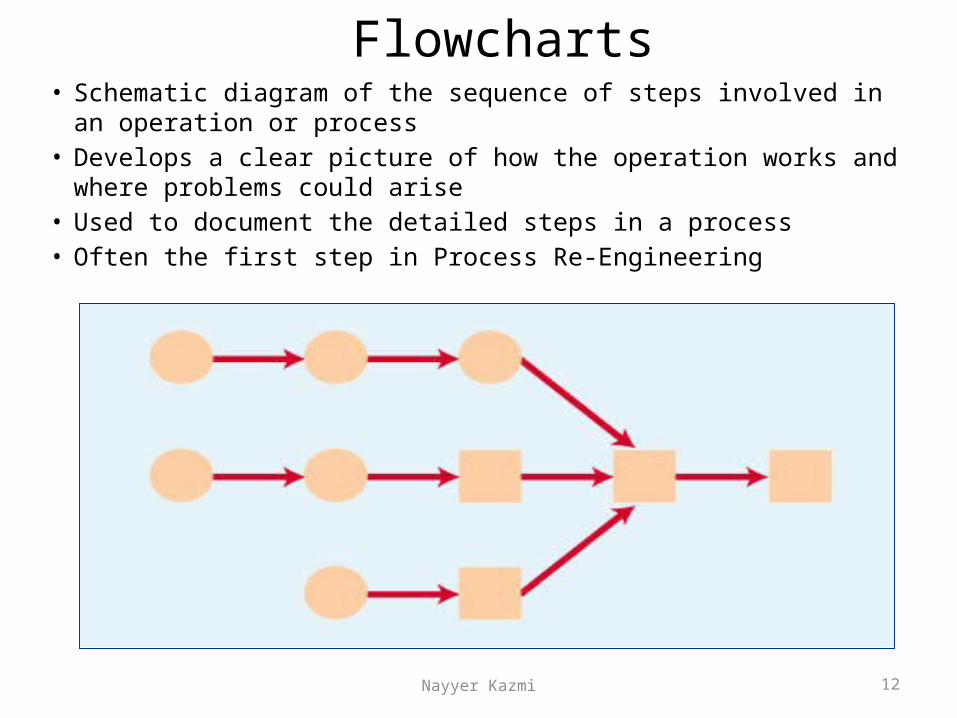
Flowcharts• Schematic diagram of the sequence of steps involved in an operation or
process• Develops a clear picture of how the operation works and where problems
could arise• Used to document the detailed steps in a process• Often the first step in Process Re-Engineering
Nayyer Kazmi 12
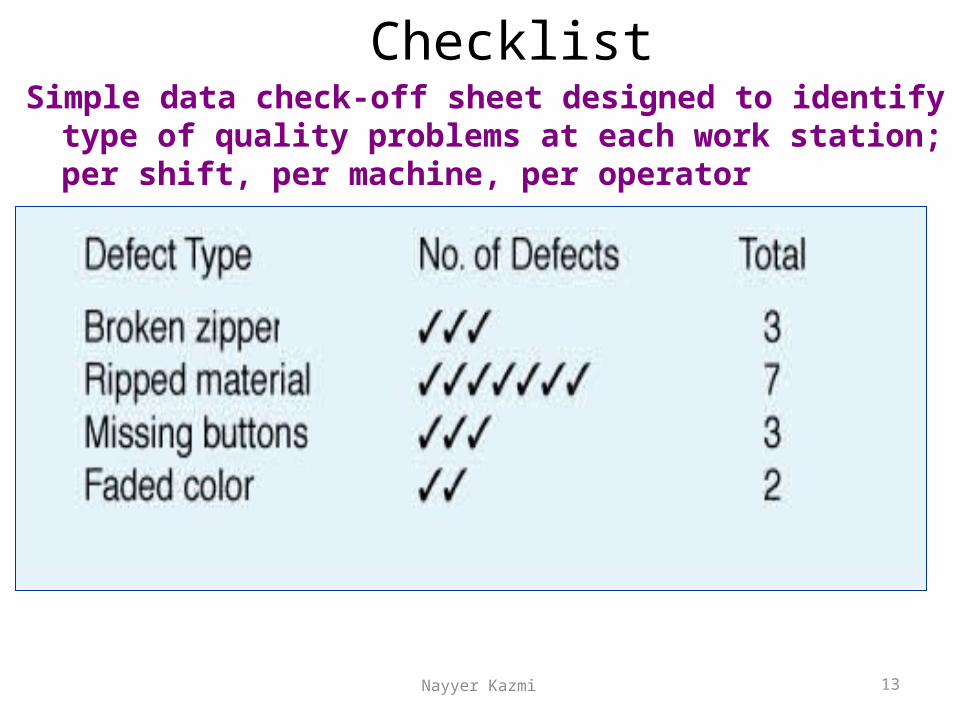
ChecklistSimple data check-off sheet designed to identify type of quality
problems at each work station; per shift, per machine, per operator
Nayyer Kazmi 13
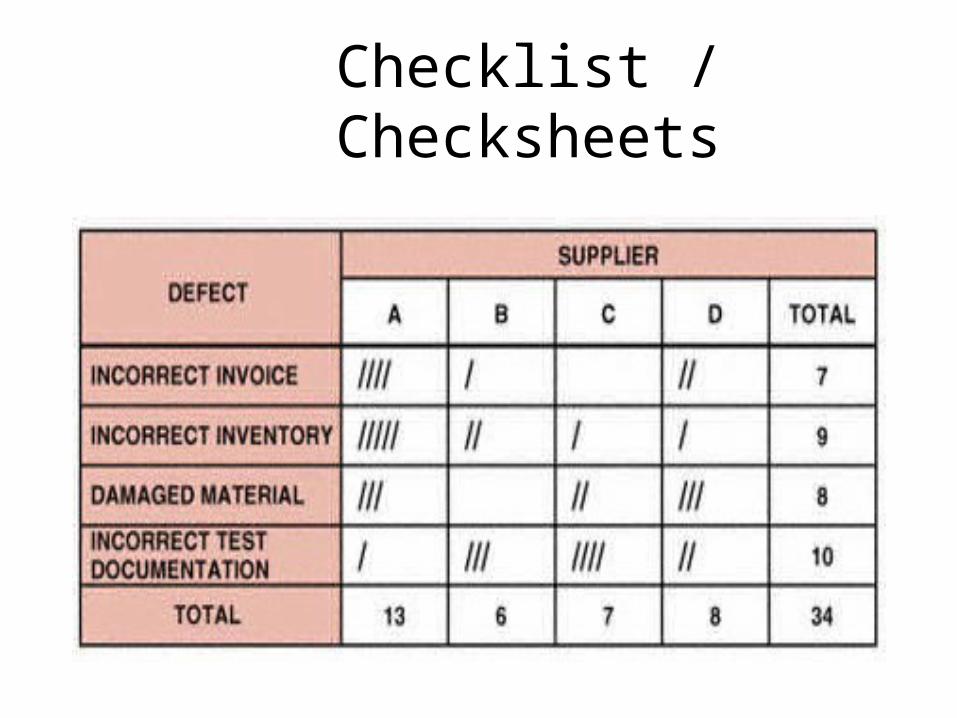
Checklist / Checksheets
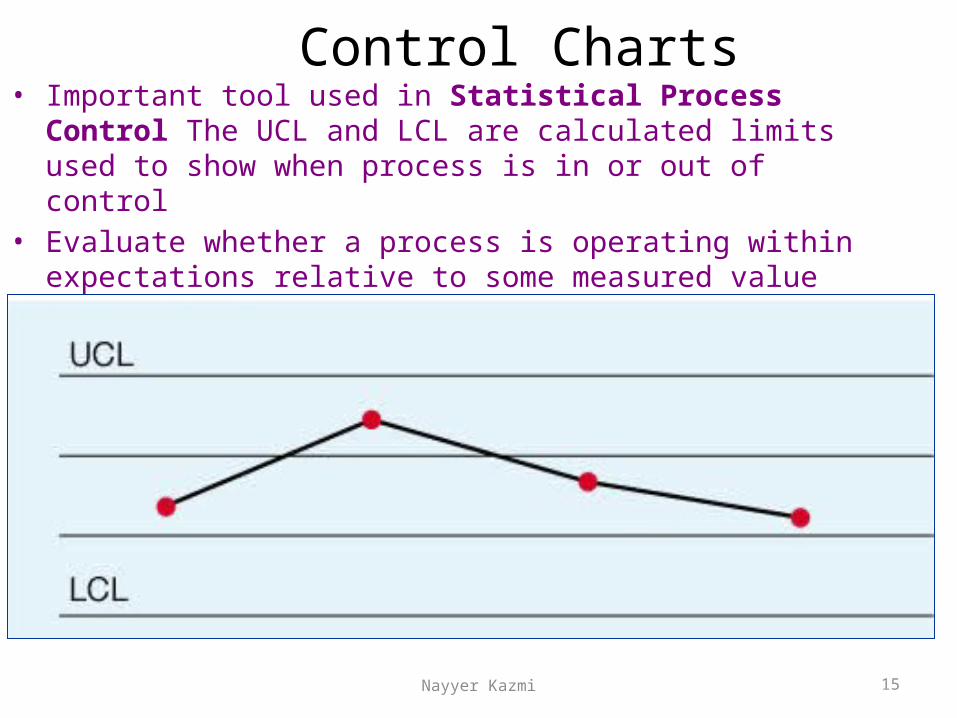
Control Charts• Important tool used in Statistical Process Control The UCL and LCL are
calculated limits used to show when process is in or out of control• Evaluate whether a process is operating within expectations relative to
some measured value• Regularly measure the variable of interest and plot it on a control chart
Nayyer Kazmi 15
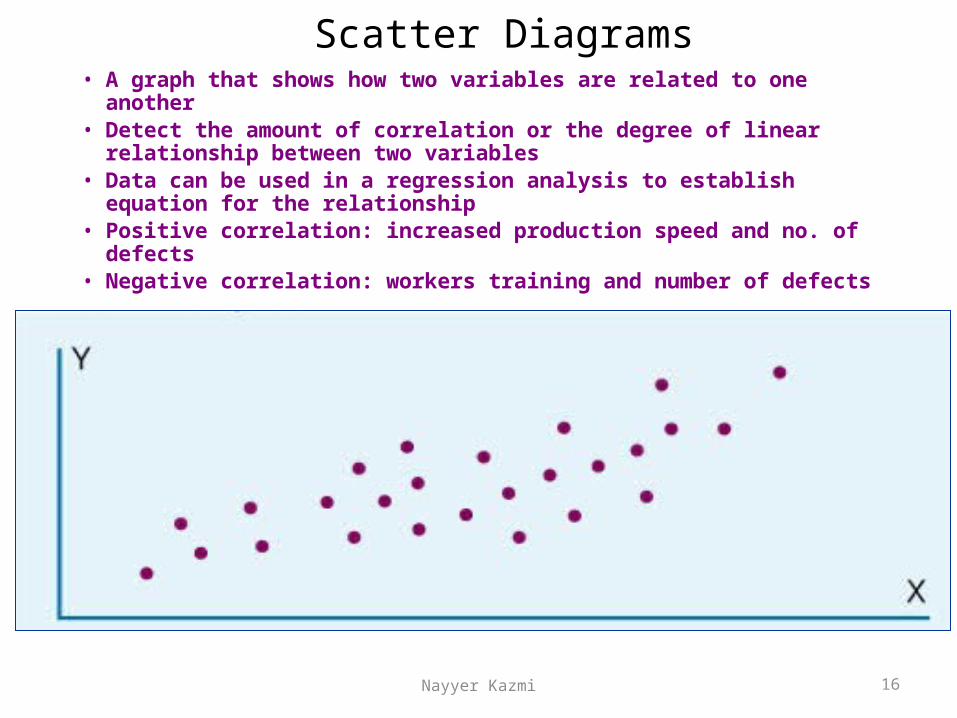
Scatter Diagrams• A graph that shows how two variables are related to one another• Detect the amount of correlation or the degree of linear
relationship between two variables• Data can be used in a regression analysis to establish equation for
the relationship• Positive correlation: increased production speed and no. of defects• Negative correlation: workers training and number of defects
Nayyer Kazmi 16
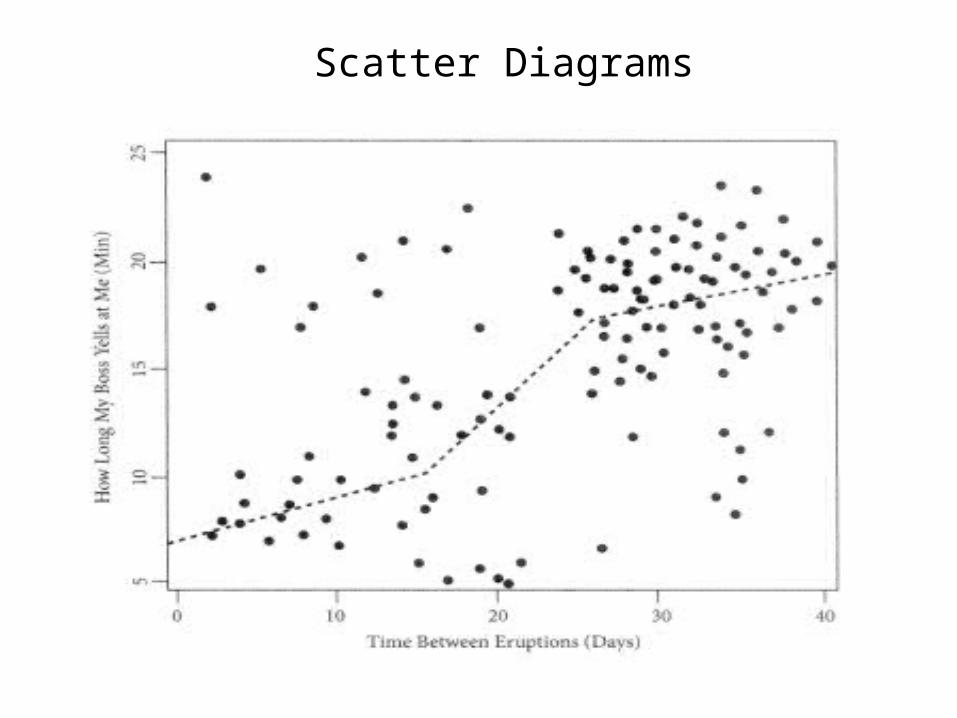
Scatter Diagrams
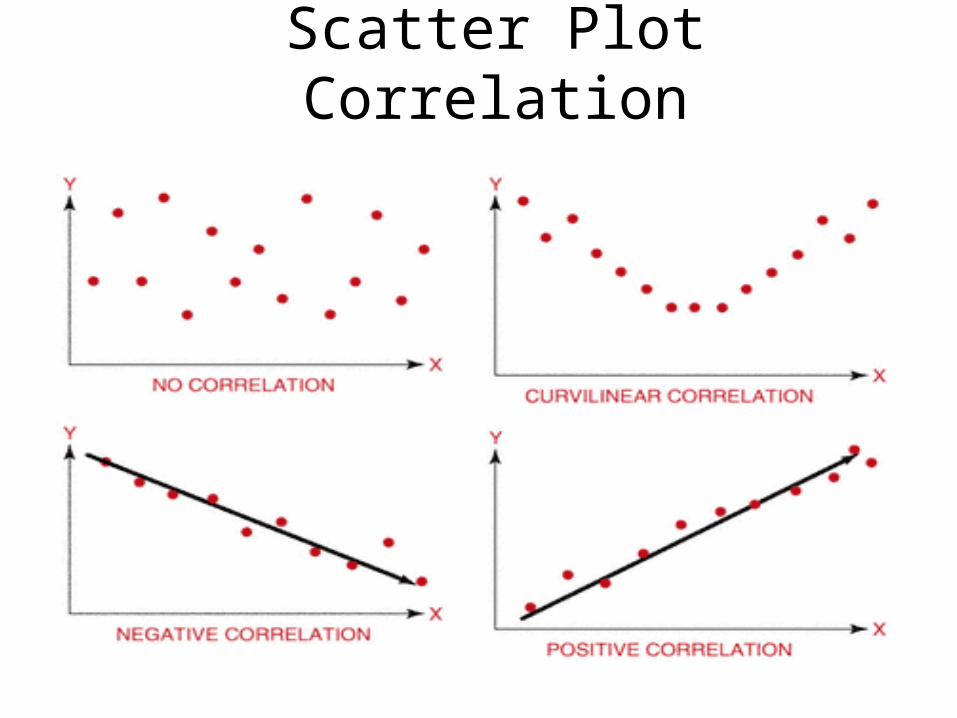
Scatter Plot Correlation
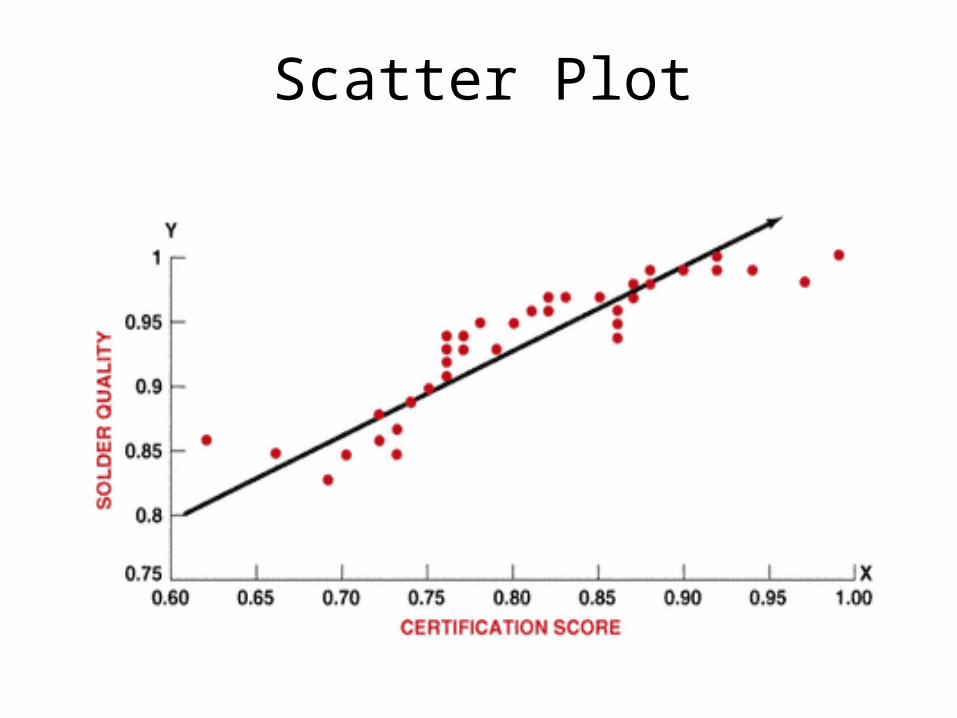
Scatter Plot
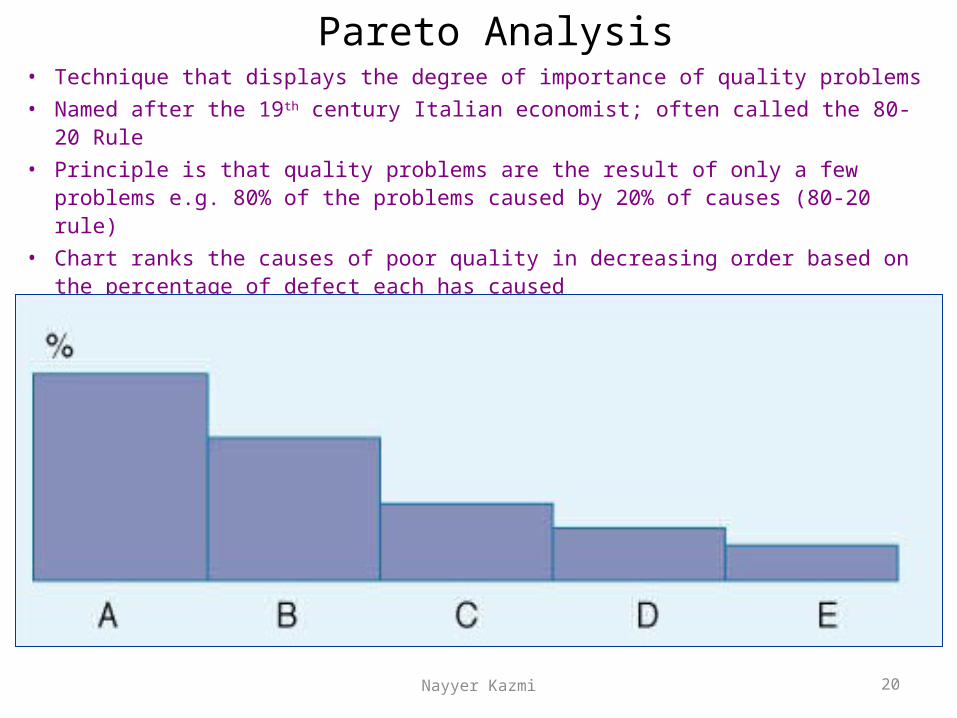
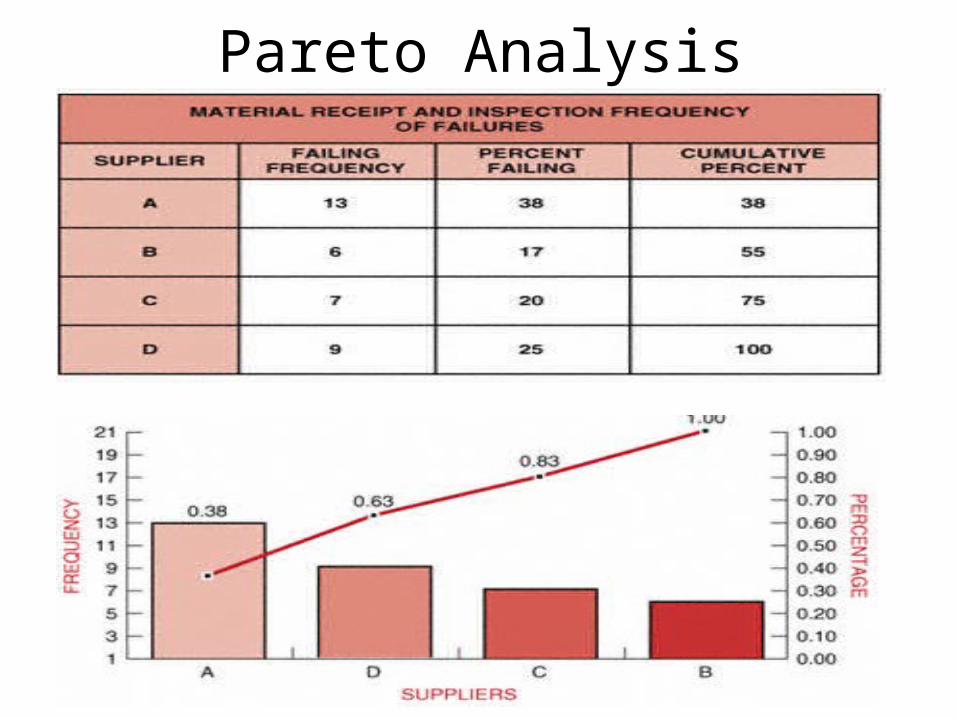
Pareto Analysis• Technique that displays the degree of importance of quality problems• Named after the 19th century Italian economist; often called the 80-20 Rule• Principle is that quality problems are the result of only a few problems e.g. 80%
of the problems caused by 20% of causes (80-20 rule)• Chart ranks the causes of poor quality in decreasing order based on the
percentage of defect each has caused
Nayyer Kazmi 20
Pareto Analysis
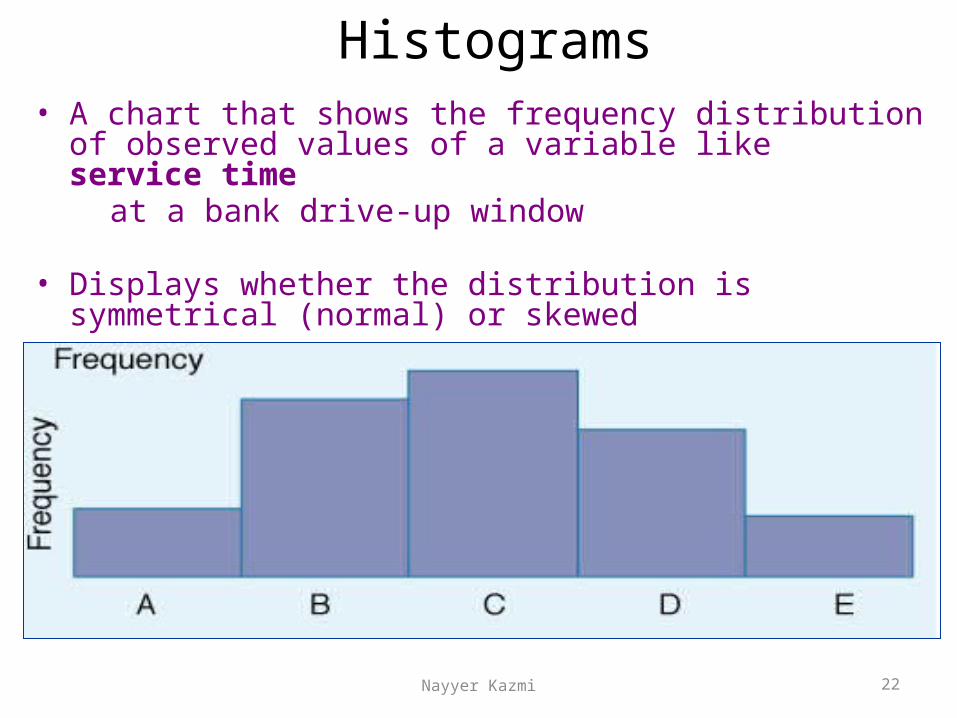
Histograms• A chart that shows the frequency distribution of observed values
of a variable like service time at a bank drive-up window
• Displays whether the distribution is symmetrical (normal) or skewed
Nayyer Kazmi 22
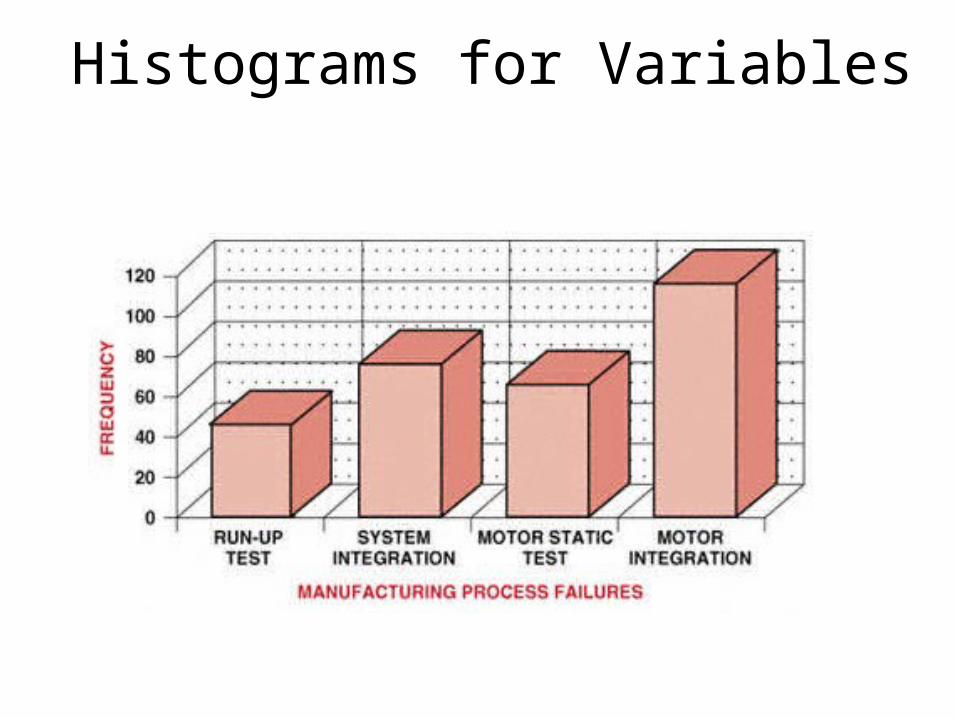
Histograms for Variables
Product Design - Quality Function Deployment
• Critical to ensure product design meets customer expectations• Useful tool for translating customer specifications into technical
requirements is Quality Function Deployment (QFD)• QFD encompasses– Customer requirements– Competitive evaluation– Product characteristics– Relationship matrix– Trade-off matrix– Setting Targets
Nayyer Kazmi 24
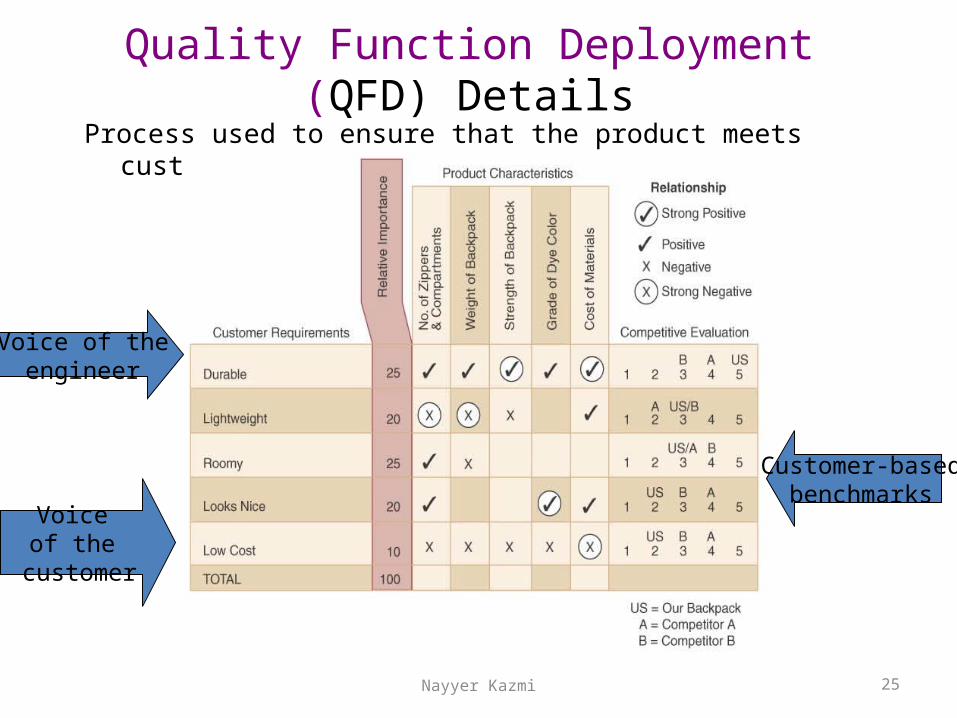
Quality Function Deployment(QFD) Details
Process used to ensure that the product meets customer specifications
Nayyer Kazmi 25
Voice of theengineer
Voice of the
customer
Customer-basedbenchmarks
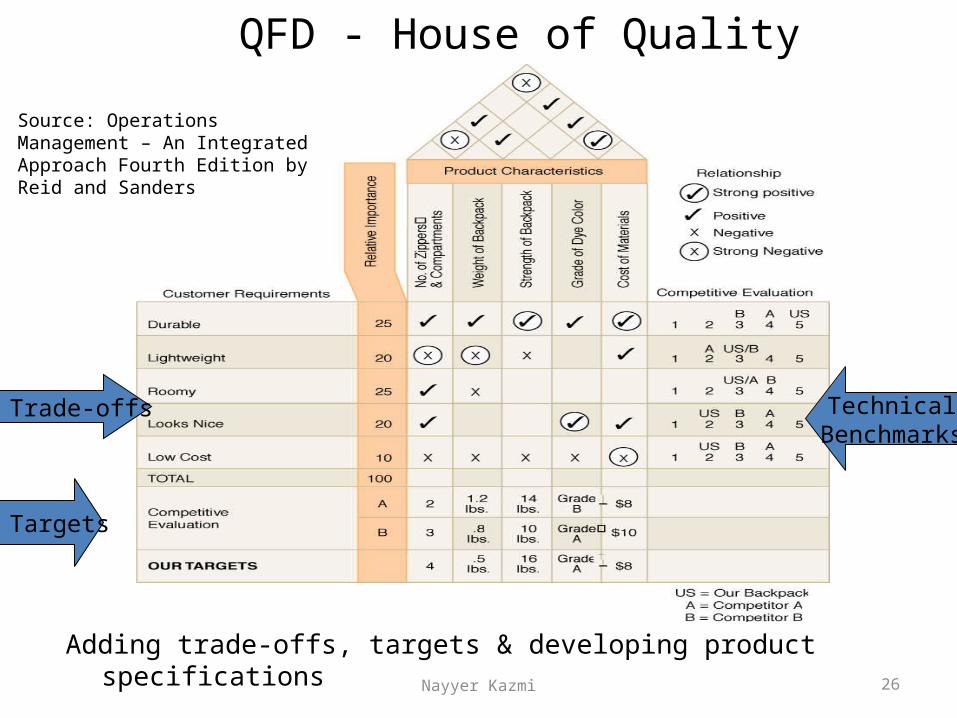
QFD - House of Quality
Adding trade-offs, targets & developing product specificationsNayyer Kazmi 26
Trade-offs
Targets
TechnicalBenchmarks
Source: Operations Management – An Integrated Approach Fourth Edition by Reid and Sanders
Top Related