


Languages
Pages
Legal


125 Maiden Lane, 5th Floor
New York, New York 10038
tel: 212-785-9123
fax: 212-785-6114
July 9, 2010 United States Army Corps of Engineers Kansas City District 601 East 12th Street, Room 463 Kansas City, Missouri 64106-2896 ATTN: CENWK-PM-ES/Buckrucker
CONTRACT: W912DQ-08-D-0018
PROJECT: Lower Passaic River Restoration Project Remedial Investigation/Feasibility Study Oversight
Lower Passaic River Study Area, New Jersey
SUBJECT: Quality Assurance Project Plan, Final Addendum #4 Surface Sediment Samples Co-located with Small Forage Fish Tissue Samples - Collected in conjunction with the Summer 2010 Benthic Community Survey
Dear Ms. Buckrucker: CDM Federal Programs Corporation (CDM) is pleased to submit this electronic copy of the Quality Assurance Project Plan, Final Addendum #4, Surface Sediment Samples Co-located with Small Forage Fish Tissue Samples collected in conjunction with the Summer 2010 Benthic Community Survey for the Oversight of the Remedial Investigation/Feasibility Study in support of the Lower Passaic River Restoration Project in the Lower Passaic River Study Area, New Jersey. This document is based on the CPG’s Benthic QAPP Addendum Number 2 and has been updated to reflect comments received from EPA. If you have any comments concerning this submittal, please contact me at (212) 377-4056. Very truly yours, CDM FEDERAL PROGRAMS CORPORATION
Frank Tsang, P.E. Task Order Manager Attachment cc: S. Vaughn, EPA Bill Sy, EPA
J. Mosher, P.E., CDM (Letter Only) S. Budney, CHMM, CDM G. Molnar, CDM J. Oxford, CHMM, CDM Project File
CDM

US Army Corps of Engineers Kansas City District
Quality Assurance Project Plan Final Addendum #4 Collection of Surf ace Sediment Samples co-located with Small Forage Fish Tissue Samples during the Summer 2010 Benthic Inverterbrate Community Survey
Remedial Investigation/Feasibility Study Oversight Lower Passaic River Restoration Project Lower Passaic River Study Area, New Jersey
USACE Contract No. W912DQ-08-D-0018. Task Order No. 014
July 9, 2010

LOWER PASSAIC RIVER RESTORATION PROJECT OPERABLE UNIT (OU) 2
Remedial Investigation/Feasibility Study Oversight
Quality Assurance Project Plan Final Addendum #4
Collection of Surface Sediment Samples Co-located with the Small Forage Fish Tissue Samples
During Summer 2010 Benthic Invertebrate Community Survey
Lower Passaic River Study Area, New Jersey
USACE CONTRACT No. W912DQ-08-D-0018
TASK ORDER No. 014
July 9, 2010
Prepared for: U.S. Army Corps of Engineers
Kansas City District
Prepared by: CDM
Raritan Plaza 1, 6th Floor Raritan Center
Edison, New Jersey 08837

PWCM/Generic QAPP Final Addendum No. 4 Surface Sediment Sampling co-located with Small Forage Range Fish Tissue Samples
Revision: 0 July 9, 2010 Page i of vii
A
TABLE OF CONTENTS
Acronym List
Section 1 – Introduction 1.1 Summary of Surface Sediment Samples Collection
Section 2 – Uniform Federal Policy for Quality Assurance Project Plans (UFP-QAPP) QAPP Worksheet #1. Title and Approval Page ................................................................................... 1 QAPP Worksheet #2. QAPP Identifying Information ......................................................................... 2 QAPP Worksheet #3. Distribution List ................................................................................................. 3 QAPP Worksheet #10. Problem Definition ............................................................................................. 4 QAPP Worksheet #11. Project Quality Objectives/Systematic Planning Process Statements ........ 6 QAPP Worksheet #12. Measurement Performance Criteria Table ...................................................... 9 QAPP Worksheet #14. Summary of Project Tasks ............................................................................... 19 QAPP Worksheet #15. Reference Limits and Evaluation Table ........................................................ 21 QAPP Worksheet #16. Project Schedule Timeline Table .................................................................... 31 QAPP Worksheet #18. Sampling Locations and Methods/SOP Requirements Table ................... 32 QAPP Worksheet #19. Analytical SOP Requirements Table ............................................................. 33 QAPP Worksheet #20. Field Quality Control Sample Summary Table .................................................................................................................. 34 QAPP Worksheet #23. Analytical SOP References Table ................................................................... 35 QAPP Worksheet #24. Analytical Instrument Calibration Table ...................................................... 37 QAPP Worksheet #28. QC Samples Table for Physical Water Column Study ................................ 40 QAPP Worksheet #30. Analytical Services Table ................................................................................ 51 QAPP Worksheet #36. Validation (Steps IIa and IIb) Summary Table .................................................................................................................. 52 QAPP Worksheet #37. Usability Assessment ....................................................................................... 53 Literature Cited ........................................................................................................................................... List of Appendices Appendix G – Figure 1 Excerpted from QAPP Addendum No. 2: Collection of Surface Sediment
Samples co-located with the Small Forage Fish Tissue Samples
CDM Field Oversight Form in Appendix B of the Physical Water Column Monitoring/Generic Final QAPP dated March 9, 2010 will be used during the Surface Sediment Sampling.
Note: Worksheets not included herein are included in the Physical Water Column Monitoring/Generic Final QAPP dated March 9, 2010.
PWCM/Generic QAPP Final Addendum No. 4 Surface Sediment Sampling co-located with Small Forage Range Fish Tissue Samples
Revision: 0 July 9, 2010 Page ii of vii
A
Acronyms % percent
%D percent difference
%R percent recovery
µg/g microgram per gram
µg/L microgram per liter
A analytical
AAS atomic absorption spectrometry
ABS absolute difference
AES atomic emission spectrophotometry
ANSETS Analytical Services Tracking System
ASC analytical services coordinator
ASTM American Society of Testing and Materials
BS Bachelor of Science
CA corrective action
CAS Chemical Abstract Service
CCV continuing calibration verification
CD compact disk
CDM Camp, Dresser & McKee
CERCLA Comprehensive Environmental Response, Compensation, and Liability Act
CHMM Certified Hazardous Materials Manager
CIH certified industrial hygienist
CLP Contract Laboratory Program
COC chain of custody
CPG Cooperating Parties Group
CRM certified reference material
CRQL contract required quantitation limits
CVAFS cold vapor atomic fluorescence spectrometry
DESA Division of Environmental Science and Assessment
DL detection limit
DOC dissolved organic carbon
DoD Department of Defense
DQA data quality assessment
DQI data quality indicators
DQL data quality level
DQO data quality objectives
DV data validation

PWCM/Generic QAPP Final Addendum No. 4 Surface Sediment Sampling co-located with Small Forage Range Fish Tissue Samples
Revision: 0 July 9, 2010 Page iii of vii
A
EDD electronic data deliverable
EPA United States Environmental Protection Agency
EQL estimated quantitation limit
ESAT EPA data validation contractor
FAR Federal Acquisition Regulations
FASTAC Field and Analytical Services Teaming Advisory Committee
FID flame ionization detector
FS feasibility study
FSP field sampling plan
FTL field task leader
GC/MS gas chromatograph / mass spectroscopy
H&S health and safety
H&SM health and safety site manager
HASP Health and Safety Plan
HDPE high density polyethylene
HPLC High Pressure Liquid Chromatography
HQ headquarters
HRGC/HRMS High Resolution Gas Chromatography / High Resolution Mass Spectrometry
HRGC/LRMS High Resolution Gas Chromatography / Low Resolution Mass Spectrometry
ICAL initial calibration
ICP inductively coupled plasma
ICP-AES Inductively Coupled Plasma – Atomic Emission Spectrometry
ICP-MS Inductively Coupled Plasma – Mass Spectrometry
ID identification
IPR initial precision and recovery
IR infra-red
KC Kansas City
LAN local area network
LC lethal concentration
LCS laboratory control samples
LCSD laboratory control sample duplicates
LPR Lower Passaic River
Ltd. limited
MDL method detection limit
mg/kg milligram per kilogram
mg/L milligram per liter
MPI Malcolm Pirnie Inc.
MS matrix spike

PWCM/Generic QAPP Final Addendum No. 4 Surface Sediment Sampling co-located with Small Forage Range Fish Tissue Samples
Revision: 0 July 9, 2010 Page iv of vii
A
MS/ MSD matrix spikes /matrix spike duplicate
NA not available or not applicable
ng/g nanogram per gram
ng/kg nanogram per kilogram
NJ New Jersey
NJDEP New Jersey Department of Environmental Protection
NJDOT New Jersey Department of Transportation
NOAA National Oceanic Atmospheric Administration
NY New York oC degrees Celsius
OPR ongoing precision and recovery
OU operable unit
oz ounce
PAH polycyclic aromatic hydrocarbon
PAL project action limit
PCB polychlorinated biphenyl
PCDD/PCDF polychlorodibenzodioxin /polychlorodibenzofurans
pg/g picogram per gram
PPE Personal Protection Equipment
ppt parts per thousand (salinity unit)
PQL project quantitation limit
PQLG project quantitation limit goal
PQO project quality objective
PREmis Passaic River Estuary Management Information System
PRP potentially responsible party
PT Performance Test
QA quality assurance
QAC quality assurance coordinator
QAPP quality assurance project plan
QC quality control
QCS quality control sample
QL quantitation limit
QP quality procedure
RA remedial action
RAS routine analytical services
RI/FS Remedial Investigation / Feasibility Study
RPD relative percent difference
RPM remedial project manager

PWCM/Generic QAPP Final Addendum No. 4 Surface Sediment Sampling co-located with Small Forage Range Fish Tissue Samples
Revision: 0 July 9, 2010 Page v of vii
A
RSCC Regional Sample Control Coordinator
RSD relative standard deviation
S&A sampling and analytical
SA self assessment
SDG Sample Delivery Group
SM Standard Method
SOP standard operating procedure
SOW scope of work
SVOC semivolatile organic compound
TAL target analyte list
TBD to be determined
TCL target compound list
TOC total organic carbon
TOM task order manager
TSOP Technical Standard Operating Procedure
USACE United States Army Corps of Engineers
USEPA United States Environmental Protection Agency
USFWS United States Fish and Wildlife Service
WS worksheet
Dioxin and Furans:
HpCDD hepta-chlorodibenzo-p-dioxin
HpCDF hepta-chlorodibenzofuran
HxCDD hexa-chlorodibenzo-p-dioxin
HxCDF hexa-chlorodibenzofuran
OCDD octa-chlorodibenzo-p-dioxin
OCDF octa-chlorodibenzofuran
PeCDD penta-chlorodibenzo-p-dioxin
PeCDF penta-chlorodibenzo-furan
TCDD tetrachloro-dibenzo-p-dioxin
TCDF tetrachloro-dibenzo-furan
PWCM/Generic QAPP Final Addendum No. 4 Surface Sediment Sampling co-located with Small Forage Range Fish Tissue Samples
Revision: 0 July 9, 2010 Page vi of vii
A
Introduction CDM Federal Programs Corporation (CDM) will perform oversight and accept split surface sediment samples from the Cooperating Parties Group (CPG) during the Summer 2010 Benthic Invertebrate Community Survey. This Quality Assurance Project Plan (QAPP) Addendum (No. 4) and the Lower Passaic River RI/FS Oversight Final QAPP, Physical Water Column Monitoring and Generic Information for Upcoming Tasks, dated March 2010 (hereafter referred to as the Final QAPP) is the governing document for execution of this oversight. CDM will use the various plans prepared by the CPG contractors to verify proper execution of the surface sediment sampling during the Summer 2010 Benthic Invertebrate Community Surveys, conducted as part of the RI/FS. The March 2010 Final QAPP indicated that future oversight tasks assigned to CDM would be appended with selected worksheets. The following worksheets are included in this addendum to reflect the CPG QAPPs, Surface Sediment Chemical Analyses and Benthic Invertebrate Toxicity and Bioaccumulation Testing (Windward 2009) and Benthic QAPP Addendum No. 2 (Windward 2010): Worksheet No. 1 contains the title and approval pages for the addendum Worksheet No. 2 contains the QAPP identifying information Worksheet No. 3 provides the distribution list Worksheet No. 10 describes the specific problem definition Worksheet No. 11 provides the project quality objectives Worksheet No. 14 provides a summary of project tasks Worksheet No. 16 provides the schedule and timeline Worksheet No. 18 provides the proposed survey locations Worksheet No. 37 provides the usability assessment (field summary report) Worksheets 12, 15, 19, 20, 23, 24, 28, 30, and 36 are also included in this addendum to address the sampling and analytical requirements of this event. The CPG’s Benthic QAPP Addendum No. 2 and the CPG’s original Benthic QAPP provide procedures for conducting the sediment sampling. 1.1 Summary of Surface Sediment Samples Collection CDM’s oversight program is designed to provide technical review, verify the accuracy of the CPG’s sediment sample results and evaluate the CPG-implemented QAPPs for sediment sampling. Oversight will include field observation and acceptance of split sediment samples from areas of small forage range fish catch success, and as part of the triad approach used to evaluate risks to benthic communities. Split samples will be analyzed for select contaminants as requested by EPA and USACE and include: PCB congeners, polychlorinated dibenzo-dioxin and furans (PCDD/PCDF) congeners, polyaromatic hydrocarbon (PAH) compounds, pesticides, SVOC, metals (including mercury and methylmercury), and physical parameters [percent moisture and total organic carbon (TOC)]. Additional oversight activities will include review of CPG-selected sampling locations to verify and supporting documents.

PWCM/Generic QAPP Final Addendum No. 4 Surface Sediment Sampling co-located with Small Forage Range Fish Tissue Samples
Revision: 0 July 9, 2010
Page vii of vii
A
This oversight QAPP details the planning and execution processes for conducting field oversight; and accepting, preparing and shipping samples for analysis.

PWCM/Generic QAPP Addendum No. 4 Surface Sediment Sampling co-located with Small Forage Range Fish Tissue Samples
Revision: 0 July 9, 2010
Page 1 of 55
QAPP Worksheet #1 Title and Approval Page
Document Title: LPR Restoration Project Quality Assurance Project Plan (QAPP) Addendum No. 4, Collection of Surface Sediment Samples Co-located with the Small Forage Fish Tissue Samples
Lead Organization: United States Army Corps of Engineers (USACE) - Northwestern Division
Preparer's Name and Organizational Affiliation: Jeniffer Oxford, CDM
Preparer' s Address, Telephone Number, and E-mail Address: 125 Maiden Lane, New York, NY 10038; 212-377-4536; [email protected]
Preparation Date (Day/Month/Year): July 9, 2010
CDM
Investigative Organization's Task Order Manager/Date:
Signature Frank Tsang/CDM
Investigative Organization's Project QA Manager/Date: 5"' U4 ~ r S ignature
Doug Updike/CDM
Lead Organization's Project Manager/Date: Signature
Elizabeth Buckrucker/USACE - KC District
EPA Remedial Project Manager /Date: Signature
Stephanie Vaughn
EPA Quality Assurance Officer / Date: Signature
William Sy
Document Control Numbering System: Not Applicable (N/ A)
PWCM/Generic QAPP Final Addendum No. 4 Surface Sediment Sampling co-located with Small Forage Range Fish Tissue Samples
Revision: 0 July 9, 2010
Page 2 of 55
A
QAPP Worksheet #2 QAPP Identifying Information
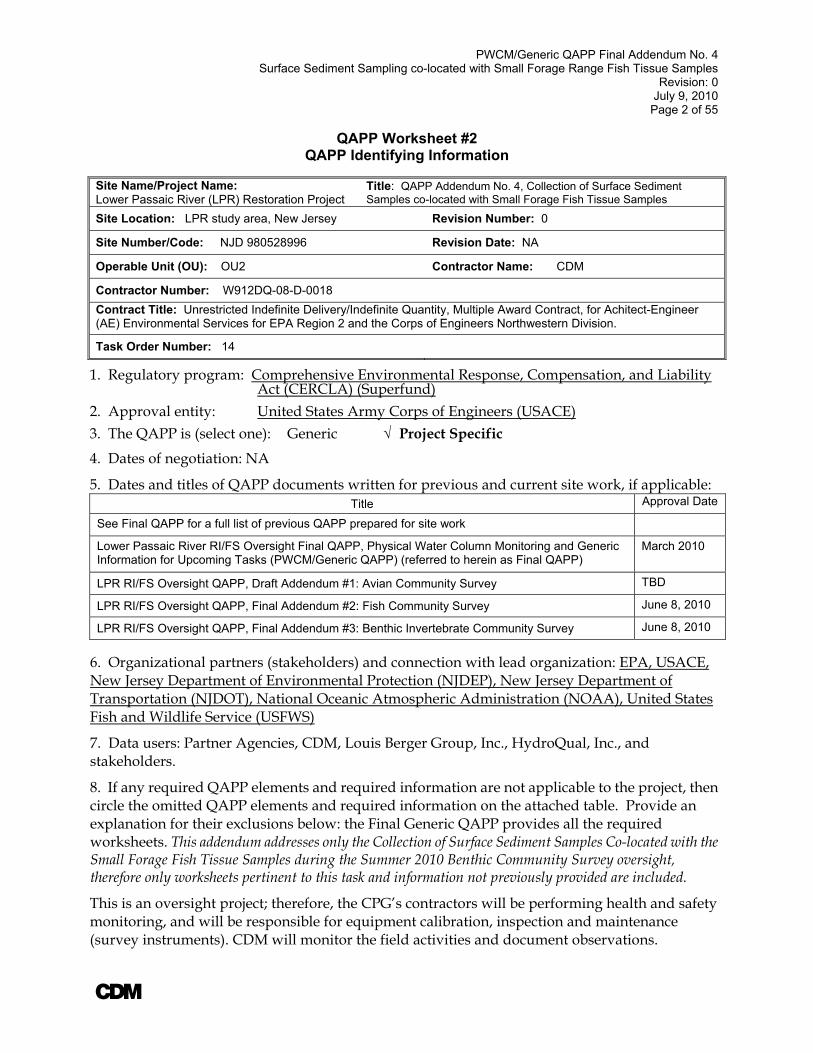
Site Name/Project Name: Lower Passaic River (LPR) Restoration Project
Title: QAPP Addendum No. 4, Collection of Surface Sediment Samples co-located with Small Forage Fish Tissue Samples
Site Location: LPR study area, New Jersey Revision Number: 0
Site Number/Code: NJD 980528996 Revision Date: NA
Operable Unit (OU): OU2 Contractor Name: CDM
Contractor Number: W912DQ-08-D-0018
Contract Title: Unrestricted Indefinite Delivery/Indefinite Quantity, Multiple Award Contract, for Achitect-Engineer (AE) Environmental Services for EPA Region 2 and the Corps of Engineers Northwestern Division.
Task Order Number: 14
1. Regulatory program: Comprehensive Environmental Response, Compensation, and Liability Act (CERCLA) (Superfund)
2. Approval entity: United States Army Corps of Engineers (USACE)
3. The QAPP is (select one): Generic √ Project Specific
4. Dates of negotiation: NA
5. Dates and titles of QAPP documents written for previous and current site work, if applicable: Title Approval Date
See Final QAPP for a full list of previous QAPP prepared for site work
Lower Passaic River RI/FS Oversight Final QAPP, Physical Water Column Monitoring and Generic Information for Upcoming Tasks (PWCM/Generic QAPP) (referred to herein as Final QAPP)
March 2010
LPR RI/FS Oversight QAPP, Draft Addendum #1: Avian Community Survey TBD
LPR RI/FS Oversight QAPP, Final Addendum #2: Fish Community Survey June 8, 2010
LPR RI/FS Oversight QAPP, Final Addendum #3: Benthic Invertebrate Community Survey June 8, 2010
6. Organizational partners (stakeholders) and connection with lead organization: EPA, USACE, New Jersey Department of Environmental Protection (NJDEP), New Jersey Department of Transportation (NJDOT), National Oceanic Atmospheric Administration (NOAA), United States Fish and Wildlife Service (USFWS)
7. Data users: Partner Agencies, CDM, Louis Berger Group, Inc., HydroQual, Inc., and stakeholders.
8. If any required QAPP elements and required information are not applicable to the project, then circle the omitted QAPP elements and required information on the attached table. Provide an explanation for their exclusions below: the Final Generic QAPP provides all the required worksheets. This addendum addresses only the Collection of Surface Sediment Samples Co-located with the Small Forage Fish Tissue Samples during the Summer 2010 Benthic Community Survey oversight, therefore only worksheets pertinent to this task and information not previously provided are included.
This is an oversight project; therefore, the CPG’s contractors will be performing health and safety monitoring, and will be responsible for equipment calibration, inspection and maintenance (survey instruments). CDM will monitor the field activities and document observations.

PWCM/Generic QAPP Final Addendum No. 4 Surface Sediment Sampling co-located with Small Forage Range Fish Tissue Samples
Revision: 0 July 9, 2010
Page 3 of 55
A Lower Passaic River Oversight
QAPP Worksheet #3 Distribution List
QAPP Recipients Title Organization Telephone Number Fax Number E-mail Address
Stephanie Vaughn Remedial Project Manager (RPM)
EPA (212) 637-4427 (212) 637-4393 [email protected]
Elizabeth Buckrucker Project Manager (PM) USACE (816) 389-3581 [email protected]
William Sy QA Officer EPA (732) 632-4766 (732) 321-6622 [email protected]
Janine MacGregor Partner Agency NJDEP (609) 633-0784 [email protected]
Elkins Green Partner Agency NJDOT (609) 530-8075 [email protected]
Tim Kubiak Partner Agency USFWS (609) 646-9310 [email protected]
Reyhan Mehran Partner Agency NOAA (212) 637-3257 [email protected]
Jeanne Litwin Project Manager CDM (212) 377-4524 (212) 785-6114 [email protected]
Frank Tsang Task Order Manager CDM (212) 377-4056 (212) 785-6114 [email protected]
Sharon Budney Deputy Task Order Manager CDM (732) 590-4662 (732) 225-7851 [email protected]
Jeniffer Oxford or other assigned QAC
Regional QA Coordinator (RQAC)/ Project QA Officer
CDM (212) 377-4536 (212) 785-6114 [email protected]
George Molnar Field Task Leader CDM (732) 590-4633 (732) 225-7851 [email protected]
Scott Kirchner Analytical Services Coordinator
CDM (732) 590-4677 (732) 225-7851 [email protected]
James Fitzpatrick Sediment Transport Modeler HydroQual (201) 529-5151 (201) 529-5728 [email protected]

PWCM/Generic QAPP Final Addendum No. 4 Surface Sediment Sampling co-located with Small Forage Range Fish Tissue Samples
Revision: 0 July 9, 2010
Page 4 of 55
A Lower Passaic River Oversight
QAPP Worksheet #10 Problem Definition
The problem to be addressed by the project:
Surface sediment sampling: Oversight will include field observation and collection of sediment split samples from areas of small forage-range fish catch success, and as part of the triad approach used to evaluate risks to benthic communities.
The environmental questions being asked:
Does the CPG data adequately describe the site conditions and is it representative for project decisions?
Is the CPG and CDM data complete and accurate?
Are the data sets comparable?
Are the CPG versus CDM data relative percent difference (RPD)’s within the measurement performance criteria?
Secondary data: See Worksheet #13 of the CPG Benthic QAPP (Windward 2009)
The possible classes of contaminants and the affected matrices:
Split sediment samples will be collected for the following chemical analyses:
polychlorinated biphenyls (PCB) congeners
polychlorodibenzodioxin/polychlorodibenzofurans (PCDD/PCDF) congeners
organochlorine pesticides
polycyclic aromatic hydrocarbons (PAHs), and semi-volatile organic compounds (SVOCs)
metals including inorganic total mercury
methylmercury
percent moisture
total organic carbon (TOC)
Split samples will not be accepted for the following analytes which will be analyzed by the CPG contractors: VOCs, alkylated PAHs, PCB Aroclors, herbicides, total petroleum hydrocarbons, butyltins, sulfide, total phosphorus, total Kjeldahl nitrogen, cyanide, ammonia, acid volatile sulfide/simultaneously extracted metals, and grain size.
The rationale for inclusion of chemical and non-chemical analyses:
The split samples will be used to support the goals of the oversight program. The analyses selected to be split were determined to be more critical for oversight evaluation; the analyses that will not be split are ancillary parameters and not major risk drivers. VOCs were identified as contaminants of potential ecological concern in sediment but are not bioaccumulative and herbicides have low bioaccumulation potential. The field observations and split sample data will enable CDM to perform technical review and evaluation on the CPG field program, analytical data and reports and to qualitatively assess any potential bias in the CPG dataset.
PWCM/Generic QAPP Final Addendum No. 4 Surface Sediment Sampling co-located with Small Forage Range Fish Tissue Samples
Revision: 0 July 9, 2010
Page 5 of 55
A Lower Passaic River Oversight
QAPP Worksheet #10 Problem Definition
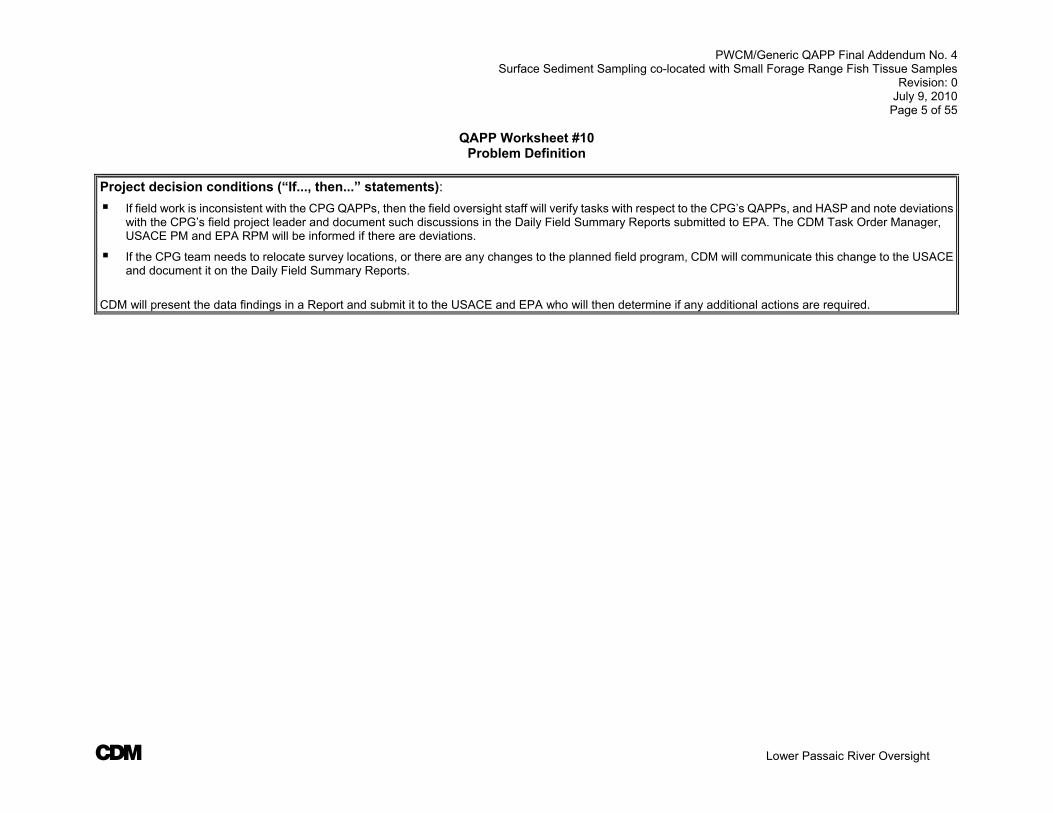
Project decision conditions (“If..., then...” statements):
If field work is inconsistent with the CPG QAPPs, then the field oversight staff will verify tasks with respect to the CPG’s QAPPs, and HASP and note deviations with the CPG’s field project leader and document such discussions in the Daily Field Summary Reports submitted to EPA. The CDM Task Order Manager, USACE PM and EPA RPM will be informed if there are deviations.
If the CPG team needs to relocate survey locations, or there are any changes to the planned field program, CDM will communicate this change to the USACE and document it on the Daily Field Summary Reports.
CDM will present the data findings in a Report and submit it to the USACE and EPA who will then determine if any additional actions are required.

PWCM/Generic QAPP Final Addendum No. 4 Surface Sediment Sampling co-located with Small Forage Range Fish Tissue Samples
Revision: 0 July 9, 2010
Page 6 of 55
A Lower Passaic River Oversight
QAPP Worksheet #11 Project Quality Objectives /Systematic Planning Process Statements
Who Will Use the Data? USACE, EPA and other partner agencies, CDM, and stakeholders (as necessary).
What Will the Data be Used For?
The CPG will use the sediment data to support the ecological risk assessment (ERA) and, in conjunction with tissue chemical concentrations, develop biota-sediment accumulation factors. Oversight activities will monitor the CPG-implemented surface sediment sampling program to verify that elements of the approved RI/FS QAPPs are fulfilled. The oversight field crew will also review the CPG-selected sampling locations. CDM’s split sample results will be compared to the data obtainedby the CPG to determine if a bias exists in the data produced by the CPG and if the data is complete and accurate and compliant with the approved QAPPs.
A comparison of the split sample data and the CPG parent sample data will only be completed for parameters that were analyzed and detected by both the CPG program and the oversight program. Data comparison will not be conducted on concentrations that are considered non-detect by either the CPG validators or oversight validators. (Note that if a consistent bias in detections is observed in either the split samples or CPG samples, an evaluation of detection limits will be completed.) The data comparison will be presented in a table showing the relative percent difference for values that are 5 times the quantitation limits. As appropriate, alternative data comparisons will be provided. For each location, a mean and variance of the sample concentrations may also be calculated. These statistics will be compared to the CPG samples. For analytical groups that contain multiple parameters (e.g., congeners), the data comparison will be completed on select parameters per chemical class. Because of the overlap of the SVOC and PAH chemical classes, some analytes will be reported twice in the split sample program. For the data comparison, PAH results reported by Axys Analytical Services using the HRGC/LRMS method will take precedence over the PAH data generated by DESA or EPA CLP during the SVOC analysis. CDM’s QC data will be used to determine CDM’s split samples data quality and comparability with the CPG’s data and whether sample results are acceptable based on the established project data quality objectives (DQOs). QC sample results will be compared to the measurement performance criteria (MPC) of the data quality indicators (DQIs).
To further achieve these objectives, CDM field personnel will observe the CPG’s contractors field implementation of the RI/FS QAPPs and note any deviations. Deviations will be brought to the attention of the CPG’s contractor, and reported to the CDM task order manager who will communicate this information to the USACE PM and EPA RPM. These will be documented in the Daily Field Summaries and in the Final Report and include a discussion of the impact of the deviation(s) on the data quality. The CPG contractor’s activities will be documented in the field logbook and oversight forms. A copy of the oversight form is provided in Appendix B of CDM’s Final QAPP.
What Type of Data is Needed?
CDM will observe and document the surface sediment sampling activities conducted by the CPG’s contractor to facilitate verification of the chemical data suitability for the ecological risk assessment. Split samples will be collected at random locations selected by the CDM Field team or as directed by the CDM Deputy TOM or the USACE/EPA project managers. Chemical and physical data, PCB congeners, PCDD/PCDF congeners, organochlorine pesticides, PAHs, and SVOCs, metals including inorganic total mercury, methylmercury, such as percent moisture and TOC will be determined from the split samples accepted from the CPG. Low limits are required for mercury and methylmercury as shown on QAPP Worksheet # 15

PWCM/Generic QAPP Final Addendum No. 4 Surface Sediment Sampling co-located with Small Forage Range Fish Tissue Samples
Revision: 0 July 9, 2010
Page 7 of 55
A Lower Passaic River Oversight
QAPP Worksheet #11 Project Quality Objectives /Systematic Planning Process Statements
How much data are needed? Oversight observations will be made at the locations shown on Figure 1 of the CPG’s Benthic QAPP Addendum No. 2, Collection of Surface Sediment Samples Co-located with the Small Forage Fish Tissue Samples. CDM will observe the CPG’s Contractor sampling at all locations and will accept split samples at approximately 10 percent of the sampling locations. Worksheets #. 11 and 18 of the CPG’s Benthic QAPP Addendum No. 2 and Figure 1 (Appendix G) show the planned locations for sampling. How “good” do the data need to be in order to support the environmental decision? The oversight observation will mirror the CPG locations to allow data comparability. CDM’s oversight staff will document whether the sampling program is consistent with the CPG’s Benthic QAPPs. The representativeness of the data is dependent on the sampling design.
Definitive level data is required for full validation of the data. The laboratory reporting limits (contract required quantitation limits (CRQLs) for CLP data), need to be below or equal to the CPG’s project required detection limits or the CPG’s achievable laboratory quantitation limits. CDM will notify EPA’s RSCC or subcontract laboratory and request lower reporting limits to achieve the project data quality objectives for sensitivity. Validation of data will be performed by DESA/ EPA; however samples analyzed by a subcontract laboratory will be validated by CDM. In addition, to ensure that measurement performance criteria for usability (criteria for measures of precision, accuracy, representativeness, comparability, completeness, and sensitivity) are met, all CDM data will be subject to a data usability assessment. The inputs will be the EPA generated validation reports and subcontract laboratory QC summaries. Measurement performance criteria for the assessment are presented in Worksheets #12, 28, 35 and 36. The results will be presented in a CDM data report. The data usability assessment will evaluate whether appropriate field procedures were followed and whether data met the approved QAPP and project DQOs and are usable for the stated project needs.
Where, when, and how should the data be collected?
When - The surface sediment samples will be collected by the CPG’s contractor and split with the CDM oversight staff during the summer benthic invertebrate survey. Oversight will be performed according to the CPG’s schedule. The exact survey date is currently to be determined.
Where - The survey locations are shown in the CPG’s Benthic QAPP Addendum No. 2, Figure 1. At locations selected by CDM in consultation with the USACE and EPA, additional sediment mass will be collected to generate sufficient mass for both sample sets.
How - Field sampling procedures are described in the CPG’s Benthic QAPP (Worksheet # 11 and Attachment D) and the Benthic QAPP Addendum No. 2 which details the sampling procedures which describe how the samples will be collected. CDM will accept the split samples and prepare them for shipment.

PWCM/Generic QAPP Final Addendum No. 4 Surface Sediment Sampling co-located with Small Forage Range Fish Tissue Samples
Revision: 0 July 9, 2010
Page 8 of 55
A Lower Passaic River Oversight
QAPP Worksheet #11 Project Quality Objectives /Systematic Planning Process Statements
Who will collect and generate the data?
CDM oversight staff will record field observations and accept splits of the selected locations while the field sampling program is being conducted by the CPG. The analytical laboratories outlined in this QAPP will generate the data.
How will the data be reported?
Field observations will be recorded as described in CDM’s Final QAPP using field oversight forms provided in Appendix B therein. Oversight staff will also record notes in field logbooks in accordance with TSOP 4-1 provided in Appendix C of the CDM Final QAPP.
Results will be reported in text format and will include a discussion of the data quality, deviations from the QAPP, and oversight data comparability with the CPGsdata. This review will be used to evaluate the accuracy of the CPG data.
Sample results generated by the DESA or EPA CLP laboratory will be e-mailed to CDM for use in the data assessment and evaluation
Sample results generated by CDM’s subcontract laboratory will be e-mailed to CDM for review and validation.
Data reporting is further covered in the CDM Final QAPP.
How will the data be archived?
Hard copies of data will be kept in the Edison office until archived in the project file; if requested survey data will be uploaded to a PREmis or equivalent database.
The CDM March 2010 Final QAPP contains other archival information.
PWCM/Generic QAPP Final Addendum No. 4 Surface Sediment Sampling co-located with Small Forage Range Fish Tissue Samples
Revision: 0 July 9, 2010
Page 9 of 55
A Lower Passaic River Oversight
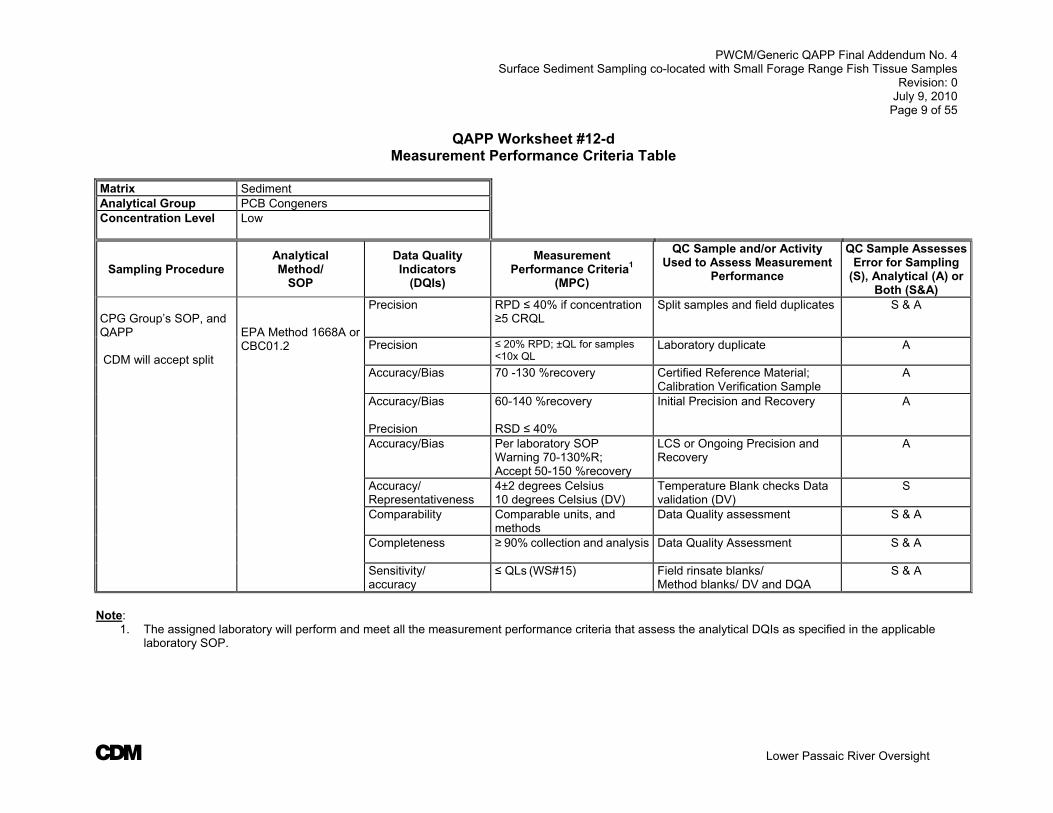
QAPP Worksheet #12-d Measurement Performance Criteria Table
Matrix Sediment Analytical Group PCB Congeners Concentration Level
Low
Sampling Procedure Analytical Method/
SOP
Data Quality Indicators
(DQIs)
Measurement Performance Criteria1
(MPC)
QC Sample and/or Activity Used to Assess Measurement
Performance
QC Sample Assesses Error for Sampling
(S), Analytical (A) or Both (S&A)
CPG Group’s SOP, and QAPP CDM will accept split
EPA Method 1668A or CBC01.2
Precision RPD ≤ 40% if concentration ≥5 CRQL
Split samples and field duplicates S & A
Precision ≤ 20% RPD; ±QL for samples <10x QL
Laboratory duplicate A
Accuracy/Bias
70 -130 %recovery
Certified Reference Material; Calibration Verification Sample
A
Accuracy/Bias Precision
60-140 %recovery RSD ≤ 40%
Initial Precision and Recovery A
Accuracy/Bias
Per laboratory SOP Warning 70-130%R; Accept 50-150 %recovery
LCS or Ongoing Precision and Recovery
A
Accuracy/ Representativeness
4±2 degrees Celsius 10 degrees Celsius (DV)
Temperature Blank checks Data validation (DV)
S
Comparability Comparable units, and methods
Data Quality assessment S & A
Completeness ≥ 90% collection and analysis Data Quality Assessment S & A
Sensitivity/ accuracy
≤ QLs (WS#15) Field rinsate blanks/ Method blanks/ DV and DQA
S & A
Note:
1. The assigned laboratory will perform and meet all the measurement performance criteria that assess the analytical DQIs as specified in the applicable laboratory SOP.
I I I

PWCM/Generic QAPP Final Addendum No. 4 Surface Sediment Sampling co-located with Small Forage Range Fish Tissue Samples
Revision: 0 July 9, 2010
Page 10 of 55
A Lower Passaic River Oversight
QAPP Worksheet #12-e Measurement Performance Criteria Table
Matrix Sediment Analytical Group PCDD/PCDF Congeners Concentration Level
Low
Sampling Procedure Analytical Method/
SOP
Data Quality Indicators
(DQIs)
Measurement Performance Criteria1
(MPC)
QC Sample and/or Activity Used to Assess Measurement
Performance
QC Sample Assesses Error for Sampling
(S), Analytical (A) or Both (S&A)
CPG Group’s SOP, and QAPP CDM will accept split
USEPA Method 1613B – Axys Analytical Services SOP MSU-018 (EPA Method 1613B) Method is proprietary can be provided upon request
Precision RPD ≤ 40% if concentration ≥5 CRQL
Split samples and field duplicates S & A
Precision ±20% of mean if concentration >10DL
Laboratory duplicate A
Accuracy/Bias Precision
70-130 %recovery (or per laboratory SOP) RPD ≤ 20% if >10 QL
LCS; MS/MSD MS/MSD
S & A
Accuracy/ Representativeness
4±2 degrees Celsius 10 degrees Celsius (DV)
Temperature Blank checks Data validation (DV)
S
Precision 15-50% RSD or per laboratory SOP Table 1
Initial precision and recovery A
Accuracy/Bias
Various % recovery per laboratory SOP Table 1
Accuracy/Bias 15-50% RSD or per laboratory SOP Table 1
Ongoing precision and recovery A
Accuracy/Bias 17-130% recovery Surrogate standards A
Comparability Comparable units, and methods
Evaluated during Data Quality Assessment
S & A
Completeness ≥ 90% collection and analysis Evaluated during Data Quality Assessment
S & A
Sensitivity/ accuracy
≤ QLs (WS#15) Field rinsate blanks/ Method blanks/ DV and DQA
S & A
Note:
1. The assigned laboratory will perform and meet all the measurement performance criteria that assess the analytical DQIs as specified in the applicable laboratory SOP.
I I I

PWCM/Generic QAPP Final Addendum No. 4 Surface Sediment Sampling co-located with Small Forage Range Fish Tissue Samples
Revision: 0 July 9, 2010
Page 11 of 55
A Lower Passaic River Oversight
QAPP Worksheet #12-f Measurement Performance Criteria Table
Matrix Sediment Analytical Group Chlorinated Pesticides
Concentration Level
Low
Sampling Procedure Analytical Method/
SOP
Data Quality Indicators
(DQIs)
Measurement Performance Criteria1
(MPC)
QC Sample and/or Activity Used to Assess Measurement
Performance
QC Sample Assesses Error for Sampling
(S), Analytical (A) or Both (S&A)
CPG Group’s SOP, and QAPP CDM will accept split
EPA Method 1613B Modified Lab SOP MLA-028 R05 Method is proprietary can be provided upon request
Precision RPD ≤ 40% if concentration ≥5 QL
Split samples and field duplicates S & A
Precision ±20% of mean if concentration >10DL
Laboratory duplicate A
Accuracy/Bias
Per laboratory or method SOP ±20%
Certified Reference Material Calibration Verification
S & A
Accuracy/Bias 50-130% recoveries per SOP MLA-028 (Tables 4 and 5)
On-going Precision and Recovery /Matrix Spike
A
Accuracy/ Representativeness
4±2 degrees Celsius 10 degrees Celsius (DV)
Temperature Blank checks Data validation (DV)
S
Accuracy/Bias 30-150% recovery (See Table 4 for individual limits)
Surrogate A
Comparability Comparable units, and methods
Evaluated during Data Quality Assessment
S & A
Completeness ≥ 90% Collection and ≥ 90% Valid data
Evaluated during Data Quality Assessment
S & A
Sensitivity/ accuracy
≤ QLs (WS#15 and Table 4 of SOP)
Field rinsate blanks/Method blanks/ DV checked during DQA
S & A
Note: The assigned laboratory must perform and meet all the quality assurance requirements specified in MLA-028 including: performance of initial and ongoing studies, calibration verification, addition of internal standards, analyses of blanks and determination of detection limits.
I I I

PWCM/Generic QAPP Final Addendum No. 4 Surface Sediment Sampling co-located with Small Forage Range Fish Tissue Samples
Revision: 0 July 9, 2010
Page 12 of 55
A Lower Passaic River Oversight
QAPP Worksheet #12-g Measurement Performance Criteria Table
Matrix Sediment Analytical Group PAHs Concentration Level
Low
Sampling Procedure Analytical Method/
SOP
Data Quality Indicators
(DQIs)
Measurement Performance Criteria1
(MPC)
QC Sample and/or Activity Used to Assess Measurement
Performance
QC Sample Assesses Error for Sampling
(S), Analytical (A) or Both (S&A)
CPG Group’s SOP, and QAPP CDM will accept split
Axyx SOP MLA-021 based on GC/MS Isotope dilution Method is proprietary can be provided upon request
Precision RPD ≤ 40% if concentration ≥5 CRQL
Split samples and field duplicates S & A
Precision ±20% of mean if concentration >10DL
Laboratory duplicate or MS/MSD A
Accuracy/Bias 50-200 %recovery (Table 2 of laboratory SOP for individual limits)
Matrix Spike S & A
Accuracy/Bias 15-130% recovery (See Table 2 for individual limits)
Perdeuterated Surrogate A
Accuracy/ Representativeness
4±2 degrees Celsius 10 degrees Celsius (DV)
Temperature Blank checks Data validation (DV)
S
Comparability Comparable units, and methods
Evaluated during Data Quality assessment
S & A
Completeness ≥ 90% Collection and ≥ 90% Valid data
Evaluated during Data Quality Assessment
S & A
Sensitivity/ accuracy
≤ QLs (WS#15) and Table 4 of laboratory SOP)
Field rinsate blanks/ Method blanks/ DV and DQA
S & A
Note: 1. The assigned laboratory will perform and meet all the measurement performance criteria that assess the analytical DQIs as specified in the applicable laboratory SOP.
I I I

PWCM/Generic QAPP Final Addendum No. 4 Surface Sediment Sampling co-located with Small Forage Range Fish Tissue Samples
Revision: 0 July 9, 2010
Page 13 of 55
A Lower Passaic River Oversight
QAPP Worksheet #12-h Measurement Performance Criteria Table
Matrix Sediment Analytical Group SVOC Concentration Level
Low
Sampling Procedure Analytical Method/
SOP
Data Quality Indicators
(DQIs)
Measurement Performance Criteria1
(MPC)
QC Sample and/or Activity Used to Assess Measurement
Performance
QC Sample Assesses Error for Sampling
(S), Analytical (A) or Both (S&A)
CPG Group’s SOP, and QAPP CDM will accept split
SW-846 Method 8270C/SOM01.2
Precision RPD ≤ 40% if concentration ≥5 CRQL
Split samples and field duplicates S & A
Precision Per laboratory SOP; DESA %RPD <30% (see note 2)
LCS/LCSD; MS/MSD2
A
Accuracy/Bias
Per CLP SOW or per laboratory SOP (compound specific)
LCS; MS/MSD2 A
Accuracy Per CLP SOW or per laboratory SOP; DESA recoveries 30-120% for base neutrals and 20-120% for acids
Surrogate A
Accuracy/ Representativeness
4±2 degrees Celsius 10 degrees Celsius (DV)
Temperature Blank checks Data validation (DV)
S & A
Comparability Comparable units, and methods
Evaluated during Data Quality assessment
S & A
Completeness ≥ 90% Collection and ≥ 90% Valid data
Evaluated during Data Quality Assessment
S & A
Sensitivity/ accuracy
≤ QLs (WS#15) Field rinsate blanks/ Method blanks/ DV and DQA
S & A
Note: 1. DESA or CLP laboratories will perform the analysis, and meet the measurement performance and QC criteria in their SOP or Statement of Work. 2. MS/MSD analysis is not required for EPA CLP Region 2 analysis.

PWCM/Generic QAPP Final Addendum No. 4 Surface Sediment Sampling co-located with Small Forage Range Fish Tissue Samples
Revision: 0 July 9, 2010
Page 14 of 55
A Lower Passaic River Oversight
QAPP Worksheet #12-i Measurement Performance Criteria Table
Matrix Sediment Analytical Group Metals Concentration Level
Low
Sampling Procedure Analytical Method/
SOP
Data Quality Indicators
(DQIs)
Measurement Performance Criteria1
(MPC)
QC Sample and/or Activity Used to Assess Measurement
Performance
QC Sample Assesses Error for Sampling
(S), Analytical (A) or Both (S&A)
CPG Group’s SOP, and QAPP CDM will accept split
SW-846 Method 6010B and 6020 /ILM05.4 ICP-AES and ICP-MS
Precision RPD ≤ 40% if concentration ≥5 CRQL
Split samples and field duplicates S & A
Precision RPD ≤ 35% if concentration ≥5 CRQL – DESA limit: 25% RPD
Laboratory duplicate
A
Accuracy/Bias
90-110 %recovery 75-125 %recovery
LCS; MS/MSD
A
Accuracy/ Representativeness
4±2 degrees Celsius 10 degrees Celsius (DV)
Temperature Blank checks Data validation (DV)
S & A
Comparability Comparable units, and methods
Evaluated during Data Quality assessment
S & A
Completeness ≥ 90% Collection and ≥ 90% Valid data
Evaluated during Data Quality Assessment
S & A
Sensitivity/ accuracy
≤ CRQLs (WS#15) Field rinsate blanks/ Method blanks/ DV and DQA
S & A
Note:
1. The assigned laboratory will perform and meet all the measurement performance criteria that assess the analytical DQIs as specified in the applicable laboratory SOP.
I I I

PWCM/Generic QAPP Final Addendum No. 4 Surface Sediment Sampling co-located with Small Forage Range Fish Tissue Samples
Revision: 0 July 9, 2010
Page 15 of 55
A Lower Passaic River Oversight
QAPP Worksheet #12-j Measurement Performance Criteria Table
Matrix Sediment Analytical Group Methyl mercury Concentration Level
Low
Sampling Procedure Analytical Method/
SOP
Data Quality Indicators
(DQIs)
Measurement Performance Criteria1
(MPC)
QC Sample and/or Activity Used to Assess Measurement
Performance
QC Sample Assesses Error for Sampling
(S), Analytical (A) or Both (S&A)
CPG Group’s SOP, and QAPP CDM will accept split
EPA Method – 1630 Laboratory TBD
Precision RPD ≤ 40% if concentration ≥5 CRQL
Split samples and field duplicates S & A
Accuracy RPD ≤ 35% for values ≥5 MDL. No more than 35% of RSDs >35%
Laboratory duplicate
A
Accuracy/Bias
65-135 %recovery MS/MSD A
Precision RPD ≤ 35% MS/MSD A
Accuracy 67-133%R of certified value Ongoing Precision and Recovery (Standard Reference Material)
Accuracy/ Representativeness
4±2 degrees Celsius 10 degrees Celsius (DV)
Temperature Blank checks Data validation (DV)
S & A
Comparability Comparable units, and methods
Evaluated during Data Quality assessment
S & A
Completeness ≥ 90% Collection and ≥ 90% Valid data
Evaluated during Data Quality Assessment
S & A
Sensitivity/ accuracy
≤ QLs (WS#15) ≤ 5MDLs
Field rinsate blanks/ Method blanks/ DV and DQA
S & A
Note: 1. The assigned laboratory must perform and meet all the measurement performance criteria that assess the analytical DQIs as specified in USEPA Method 1630.
I I I
PWCM/Generic QAPP Final Addendum No. 4 Surface Sediment Sampling co-located with Small Forage Range Fish Tissue Samples
Revision: 0 July 9, 2010
Page 16 of 55
A Lower Passaic River Oversight
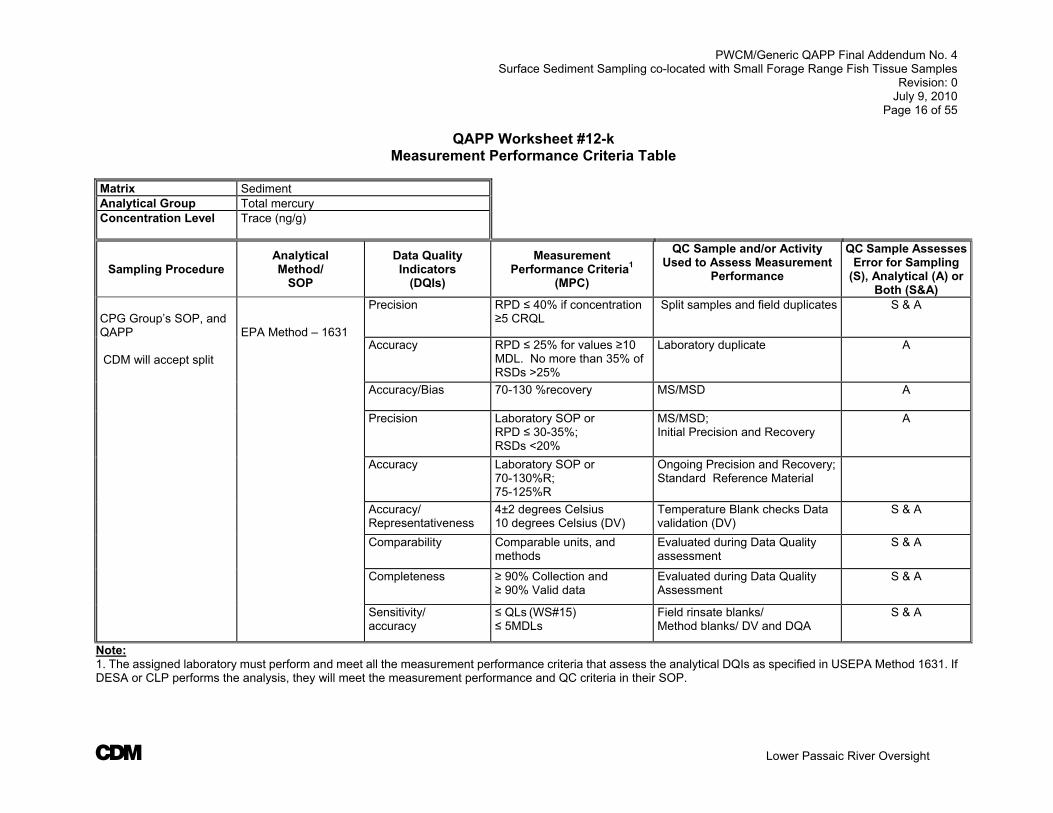
QAPP Worksheet #12-k Measurement Performance Criteria Table
Matrix Sediment Analytical Group Total mercury Concentration Level
Trace (ng/g)
Sampling Procedure Analytical Method/
SOP
Data Quality Indicators
(DQIs)
Measurement Performance Criteria1
(MPC)
QC Sample and/or Activity Used to Assess Measurement
Performance
QC Sample Assesses Error for Sampling
(S), Analytical (A) or Both (S&A)
CPG Group’s SOP, and QAPP CDM will accept split
EPA Method – 1631
Precision RPD ≤ 40% if concentration ≥5 CRQL
Split samples and field duplicates S & A
Accuracy RPD ≤ 25% for values ≥10 MDL. No more than 35% of RSDs >25%
Laboratory duplicate
A
Accuracy/Bias
70-130 %recovery MS/MSD A
Precision Laboratory SOP or RPD ≤ 30-35%; RSDs <20%
MS/MSD; Initial Precision and Recovery
A
Accuracy Laboratory SOP or 70-130%R; 75-125%R
Ongoing Precision and Recovery; Standard Reference Material
Accuracy/ Representativeness
4±2 degrees Celsius 10 degrees Celsius (DV)
Temperature Blank checks Data validation (DV)
S & A
Comparability Comparable units, and methods
Evaluated during Data Quality assessment
S & A
Completeness ≥ 90% Collection and ≥ 90% Valid data
Evaluated during Data Quality Assessment
S & A
Sensitivity/ accuracy
≤ QLs (WS#15) ≤ 5MDLs
Field rinsate blanks/ Method blanks/ DV and DQA
S & A
Note: 1. The assigned laboratory must perform and meet all the measurement performance criteria that assess the analytical DQIs as specified in USEPA Method 1631. If DESA or CLP performs the analysis, they will meet the measurement performance and QC criteria in their SOP.
I I I

PWCM/Generic QAPP Final Addendum No. 4 Surface Sediment Sampling co-located with Small Forage Range Fish Tissue Samples
Revision: 0 July 9, 2010
Page 17 of 55
A Lower Passaic River Oversight
QAPP Worksheet #12-l Measurement Performance Criteria Table
Matrix Sediment Analytical Group TOC Concentration Level
Low
Sampling Procedure Analytical Method/
SOP
Data Quality Indicators
(DQIs)
Measurement Performance Criteria1
(MPC)
QC Sample and/or Activity Used to Assess Measurement
Performance
QC Sample Assesses Error for Sampling
(S), Analytical (A) or Both (S&A)
CPG Group’s SOP, and QAPP CDM will accept split
EPA Method - Lloyd Kahn
Precision RPD ≤ 40% if concentration ≥5 CRQL
Split samples and field duplicates S & A
Accuracy 80-120% Mid range CCV A
Accuracy/Bias
75-125 %recovery Near detection limit standard A
Precision Laboratory RPD ≤ 20% Laboratory duplicate A
Accuracy/ Representativeness
4±2 degrees Celsius 10 degrees Celsius (DV)
Temperature Blank checks Data validation (DV)
S & A
Comparability Comparable units, and methods
Evaluated during Data Quality assessment
S & A
Completeness ≥ 90% Collection and ≥ 90% Valid data
Evaluated during Data Quality Assessment
S & A
Sensitivity/ accuracy
≤ QLs (WS#15) Field rinsate blanks/ Method blanks/ DV and DQA
S & A
Note: 1. The assigned laboratory must perform and meet all quality assurance requirements specified in USEPA Method Lloyd Kahn.
I I I

PWCM/Generic QAPP Final Addendum No. 4 Surface Sediment Sampling co-located with Small Forage Range Fish Tissue Samples
Revision: 0 July 9, 2010
Page 18 of 55
A Lower Passaic River Oversight
QAPP Worksheet #12-m Measurement Performance Criteria Table
Matrix Sediment
Analytical Group Moisture
Concentration Level
Low
Sampling Procedure Analytical Method/
SOP
Data Quality Indicators
(DQIs)
Measurement Performance Criteria1
(MPC)
QC Sample and/or Activity Used to Assess Measurement
Performance
QC Sample Assesses Error for Sampling
(S), Analytical (A) or Both (S&A)
CPG Group’s SOP, and QAPP CDM will accept split
SM 2540G Modified
Precision
≤ 20% RPD
Laboratory duplicate
A
Note: 1. The assigned laboratory must perform and meet all quality assurance requirements specified in the method.
I I I
PWCM/Generic QAPP Final Addendum No. 4 Surface Sediment Sampling co-located with Small Forage Range Fish Tissue Samples
Revision: 0 July 9, 2010
Page 19 of 55
A Lower Passaic River Oversight
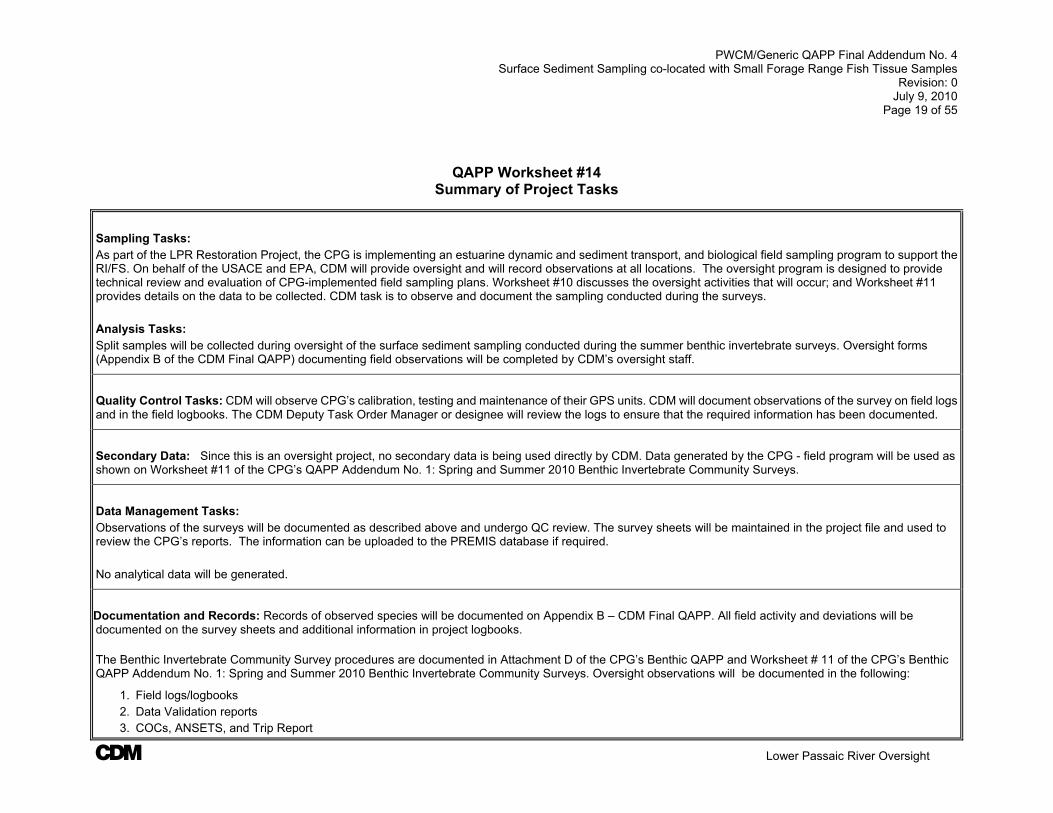
QAPP Worksheet #14 Summary of Project Tasks
Sampling Tasks: As part of the LPR Restoration Project, the CPG is implementing an estuarine dynamic and sediment transport, and biological field sampling program to support the RI/FS. On behalf of the USACE and EPA, CDM will provide oversight and will record observations at all locations. The oversight program is designed to provide technical review and evaluation of CPG-implemented field sampling plans. Worksheet #10 discusses the oversight activities that will occur; and Worksheet #11 provides details on the data to be collected. CDM task is to observe and document the sampling conducted during the surveys. Analysis Tasks: Split samples will be collected during oversight of the surface sediment sampling conducted during the summer benthic invertebrate surveys. Oversight forms (Appendix B of the CDM Final QAPP) documenting field observations will be completed by CDM’s oversight staff.
Quality Control Tasks: CDM will observe CPG’s calibration, testing and maintenance of their GPS units. CDM will document observations of the survey on field logs and in the field logbooks. The CDM Deputy Task Order Manager or designee will review the logs to ensure that the required information has been documented.
Secondary Data: Since this is an oversight project, no secondary data is being used directly by CDM. Data generated by the CPG - field program will be used as shown on Worksheet #11 of the CPG’s QAPP Addendum No. 1: Spring and Summer 2010 Benthic Invertebrate Community Surveys.
Data Management Tasks: Observations of the surveys will be documented as described above and undergo QC review. The survey sheets will be maintained in the project file and used to review the CPG’s reports. The information can be uploaded to the PREMIS database if required. No analytical data will be generated.
Documentation and Records: Records of observed species will be documented on Appendix B – CDM Final QAPP. All field activity and deviations will be documented on the survey sheets and additional information in project logbooks.
The Benthic Invertebrate Community Survey procedures are documented in Attachment D of the CPG’s Benthic QAPP and Worksheet # 11 of the CPG’s Benthic QAPP Addendum No. 1: Spring and Summer 2010 Benthic Invertebrate Community Surveys. Oversight observations will be documented in the following:
1. Field logs/logbooks 2. Data Validation reports 3. COCs, ANSETS, and Trip Report

PWCM/Generic QAPP Final Addendum No. 4 Surface Sediment Sampling co-located with Small Forage Range Fish Tissue Samples
Revision: 0 July 9, 2010
Page 20 of 55
A Lower Passaic River Oversight
QAPP Worksheet #14 Summary of Project Tasks
4. Oversight summary report 5. Data Quality and Usability Summary Report
All procedures will be documented in accordance with TSOP 4-1 provided in Appendix C of the CDM Final QAPP. Assessment/Audit Tasks: See CDM Final QAPP for assessment tasks (CDM 2009)
Data Review Tasks: The CPG Benthic Invertebrate Community Surveys Data Report will be reviewed by CDM. A data quality evaluation will be performed based on the CPG compliance with the approved QAPP. A comparison of CDM’s field staff observations and surface sediment sample results with the CPG data report will be included in the data quality evaluation and submitted to the USACE.

PWCM/Generic QAPP Final Addendum No. 4 Surface Sediment Sampling co-located with Small Forage Range Fish Tissue Samples
Revision: 0 July 9, 2010
Page 21 of 55
A Lower Passaic River Oversight
QAPP Worksheet #15-d Reference Limits and Evaluation Table
Matrix: Sediment Analytical Group: PCB Congeners by CBC01.2 or 1668A Concentration Level: Low (picogram per gram [pg/g])
Analyte
CAS Number
Project
Action Limit1
Project
Quantitation Limit Goal (PQLG) 2
CBC01.2 Analytical Method3
Method 1668A Achievable
Laboratory Limits 4, 5
MDLs Method CRQLs
MDLs
QLs
All individual Congeners PCB-1 through PCB-209
List is provided in method
TBD Equal to the CPG’s laboratory achievable QLs for each congener
NA 2.0 ng/kg See summary in method
0.1 to 0.2 pg/g
Notes:
1. Project-specific screening levels have not been developed and approved by the EPA for this project. Data Quality Levels (DQLs) for individual PCB Congeners are listed for the CPG RI/FS QAPP in the Final Surface Sediment Chemical Analyses and Benthic Invertebrate Toxicity and Bioaccumulation Testing QAPP, October 2009. A data quality level of 0.0227 mg/kg has been set by the CPG for PCB congeners.
2. The listed PQLGs are from the CPG’s QAPP and are based on their laboratory’s Quantitation Limits.
3. Method does not include MDLs which will be determined by the selected laboratory. .
4. Achievable QLs listed are based on typical Axys Analytical Services laboratory detection limits expected to range from 0.1 to 2.0 pg/g, with exceptions (particularly co-eluting congeners). The assigned laboratory will report PCB congeners to sample specific detection limits, which may be different depending upon the samples. The achievable QLs shown above are generally below the PQLGs listed in the CPG RI/FS QAPP, so that split sample data should be suitable for comparison. Laboratory results will be reported in dry weight.
5. Actual QLs may be higher and are dependent on the sample moisture content and matrix effects.

PWCM/Generic QAPP Final Addendum No. 4 Surface Sediment Sampling co-located with Small Forage Range Fish Tissue Samples
Revision: 0 July 9, 2010
Page 22 of 55
A Lower Passaic River Oversight
QAPP Worksheet #15-e Reference Limits and Evaluation Table
Matrix: Sediment Analytical Group: PCDD/PCDF by EPA 1613B Concentration Level: Low (ng/kg = nanogram per kilogram)
Analyte
CAS
Number
Project Action Limit1
Data
Quality Levels1
Project Quantitation Limit Goals (PQLGs)2
(ng/kg)
EPA DLM0.2 Analytical Method3 Method 1613B Achievable
Laboratory Limits
MDLs
(ng/kg) 3
Method QLs3
(ng/kg)
MDLs
(ng/kg) 4
QLs
(ng/kg) 4
2378-TCDD 1746-01-6 TBD 0.12 0.49 NA 1.0 0.031 0.05 12378-PeCDD 40321-76-4 TBD 4.5 0.76 NA 5.0 0.13 0.10 123678-HxCDD 57653-85-7 TBD 45 1.35 NA 5.0 0.19 0.10 123478-HxCDD 39227-28-6 TBD 45 1.43 NA 5.0 0.18 0.10 123789-HxCDD 19408-74-3 TBD 45 1.49 NA 5.0 0.17 0.10 1234678-HpCDD 35822-46-9 TBD 450 5.79 NA 5.0 0.17 0.10 OCDD 3268-87-9 TBD 15,000 2.74 NA 10 0.83 0.5 2378-TCDF 51207-31-9 TBD 45 0.37 NA 1.0 0.015 0.05 12378-PeCDF 57117-41-6 TBD 150 0.74 NA 5.0 0.095 0.10 23478-PeCDF 57117-31-4 TBD 15 0.63 NA 5.0 0.096 0.10 123678-HxCDF 57117-44-9 TBD 45 0.7 NA 5.0 0.091 0.10 123789-HxCDF 72918-21-9 TBD 45 0.81 NA 5.0 0.12 0.10 123478-HxCDF 70648-26-9 TBD 45 0.7 NA 5.0 0.093 0.10 234678-HxCDF 60851-34-5 TBD 45 0.75 NA 5.0 0.12 0.10 1234678-HpCDF 67562-39-4 TBD 450 1.77 NA 5.0 0.099 0.10 1234789-HpCDF 55673-89-7 TBD 450 2.43 NA 5.0 0.088 0.10 OCDF 39001-02-0 TBD 15,000 2.13 NA 10 0.28 0.50
Notes:
1. Project-specific action levels have not been developed. Data Quality Levels (DQLs) for the individual PCDD/PCDF Congeners listed are from the CPG RI/FS QAPP, Final Surface Sediment Chemical Analyses and Benthic Invertebrate Toxicity and Bioaccumulation Testing QAPP, October 2009. The split sample data should be low enough for data comparison. Differences in laboratory detection limits will be considered when comparing the data.
2. The PQLGs listed are from the CPG’s QAPP and are based on their laboratory’s Quantitation Limits.
3. Specific MDLs for solids are not given in USEPA Method 1613B, but the QLs listed are the minimum levels published in Table 2 of USEPA Method 1613B and CLP method DLM0.2, Exhibit C, Section 1. The actual detection limits are usually dependent on the level of interference rather than instrument limitations.
4. The MDLs listed are the statistically-derived MDLs. These MDLs and QLs listed were obtained from Axys Analytical Services.
PWCM/Generic QAPP Final Addendum No. 4 Surface Sediment Sampling co-located with Small Forage Range Fish Tissue Samples
Revision: 0 July 9, 2010
Page 23 of 55
A Lower Passaic River Oversight
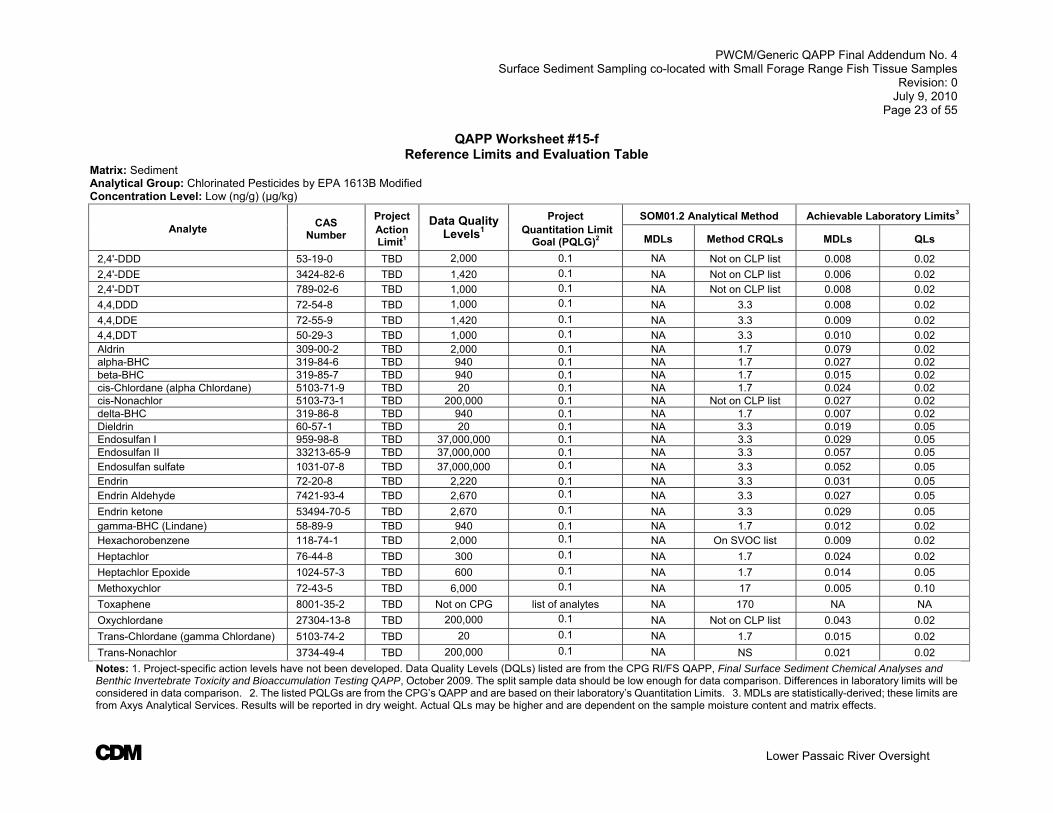
QAPP Worksheet #15-f Reference Limits and Evaluation Table
Matrix: Sediment Analytical Group: Chlorinated Pesticides by EPA 1613B Modified Concentration Level: Low (ng/g) (µg/kg)
Analyte
CAS
Number
Project Action Limit1
Data Quality Levels1
Project Quantitation Limit
Goal (PQLG)2
SOM01.2 Analytical Method Achievable Laboratory Limits3
MDLs Method CRQLs MDLs QLs
2,4'-DDD 53-19-0 TBD 2,000 0.1 NA Not on CLP list 0.008 0.02
2,4'-DDE 3424-82-6 TBD 1,420 0.1 NA Not on CLP list 0.006 0.02
2,4'-DDT 789-02-6 TBD 1,000 0.1 NA Not on CLP list 0.008 0.02
4,4,DDD 72-54-8 TBD 1,000 0.1 NA 3.3 0.008 0.02
4,4,DDE 72-55-9 TBD 1,420 0.1 NA 3.3 0.009 0.02
4,4,DDT 50-29-3 TBD 1,000 0.1 NA 3.3 0.010 0.02 Aldrin 309-00-2 TBD 2,000 0.1 NA 1.7 0.079 0.02 alpha-BHC 319-84-6 TBD 940 0.1 NA 1.7 0.027 0.02 beta-BHC 319-85-7 TBD 940 0.1 NA 1.7 0.015 0.02 cis-Chlordane (alpha Chlordane) 5103-71-9 TBD 20 0.1 NA 1.7 0.024 0.02 cis-Nonachlor 5103-73-1 TBD 200,000 0.1 NA Not on CLP list 0.027 0.02 delta-BHC 319-86-8 TBD 940 0.1 NA 1.7 0.007 0.02 Dieldrin 60-57-1 TBD 20 0.1 NA 3.3 0.019 0.05 Endosulfan I 959-98-8 TBD 37,000,000 0.1 NA 3.3 0.029 0.05 Endosulfan II 33213-65-9 TBD 37,000,000 0.1 NA 3.3 0.057 0.05 Endosulfan sulfate 1031-07-8 TBD 37,000,000 0.1 NA 3.3 0.052 0.05 Endrin 72-20-8 TBD 2,220 0.1 NA 3.3 0.031 0.05 Endrin Aldehyde 7421-93-4 TBD 2,670 0.1 NA 3.3 0.027 0.05
Endrin ketone 53494-70-5 TBD 2,670 0.1 NA 3.3 0.029 0.05 gamma-BHC (Lindane) 58-89-9 TBD 940 0.1 NA 1.7 0.012 0.02 Hexachorobenzene 118-74-1 TBD 2,000 0.1 NA On SVOC list 0.009 0.02
Heptachlor 76-44-8 TBD 300 0.1 NA 1.7 0.024 0.02
Heptachlor Epoxide 1024-57-3 TBD 600 0.1 NA 1.7 0.014 0.05
Methoxychlor 72-43-5 TBD 6,000 0.1 NA 17 0.005 0.10
Toxaphene 8001-35-2 TBD Not on CPG list of analytes NA 170 NA NA
Oxychlordane 27304-13-8 TBD 200,000 0.1 NA Not on CLP list 0.043 0.02
Trans-Chlordane (gamma Chlordane) 5103-74-2 TBD 20 0.1 NA 1.7 0.015 0.02
Trans-Nonachlor 3734-49-4 TBD 200,000 0.1 NA NS 0.021 0.02
Notes: 1. Project-specific action levels have not been developed. Data Quality Levels (DQLs) listed are from the CPG RI/FS QAPP, Final Surface Sediment Chemical Analyses and Benthic Invertebrate Toxicity and Bioaccumulation Testing QAPP, October 2009. The split sample data should be low enough for data comparison. Differences in laboratory limits will be considered in data comparison. 2. The listed PQLGs are from the CPG’s QAPP and are based on their laboratory’s Quantitation Limits. 3. MDLs are statistically-derived; these limits are from Axys Analytical Services. Results will be reported in dry weight. Actual QLs may be higher and are dependent on the sample moisture content and matrix effects.

PWCM/Generic QAPP Final Addendum No. 4 Surface Sediment Sampling co-located with Small Forage Range Fish Tissue Samples
Revision: 0 July 9, 2010
Page 24 of 55
A Lower Passaic River Oversight
QAPP Worksheet #15-g Reference Limits and Evaluation Table
Matrix: Sediment Analytical Group: PAH by Axys SOP MLA-021 Concentration Level: Low (µg/kg)
Analyte
CAS
Number
Project Action Limit1
Data Quality Levels1
Project Quantitation Limit Goal2
Analytical Method3
Achievable Laboratory Limits4
MDLs SOM01.2 CRQLs 8270 QLs MDLs QLs
1-Methylnaphthalene 90-12-0 TBD 22,000 1.0 NA Not Listed Not Listed NA 1.0 1-Methylphenanthrene 832-69-9 TBD 1,700,000 1.0 NA Not Listed Not Listed 0.28 1.0
2,3,5-Trimethylnaphthalene 2245-38-7 TBD 3,900 1.0 NA Not Listed Not Listed 0.60 1.0 2,6-Dimethylnaphthalene 581-42-0 TBD 3,900 1.0 NA Not Listed Not Listed 0.25 1.0 2-Methylnaphthalene 91-57-6 TBD 20.2 1.0 NA 170 660 0.29 1.0 Acenaphthene 83-32-9 TBD 6.71 1.0 NA 170 660 0.16 0.5 Acenaphthylene 208-96-8 TBD 5.87 1.0 NA 170 660 0.20 0.5 Anthracene 120-12-7 TBD 46.9 1.0 NA 170 660 0.41 0.5 Benzo[a]anthracene 56-55-3 TBD 31.7 1.0 NA 170 660 0.18 0.5 Benzo[a]pyrene 50-32-8 TBD 15.0 1.0 NA 170 660 0.14 0.5 Benzo[b]fluoranthene 205-99-2 TBD 150.0 1.0 NA 170 660 0.61 Benzo[e]pyrene 192-97-2 TBD 170,000 1.0 NA Not Listed Not Listed 0.17 0.5 Benzo[g,h,i]perylene 191-24-2 TBD 170.0 1.0 NA 170 660 0.21 1.0 Benzo[j]fluoranthene 205-82-3 TBD 240 (for k) 1.0 NA Not Listed Not Listed 0.10 0.5 Benzo[k]fluoranthene 207-08-9 TBD 240 (for k) 1.0 NA 170 660 0.10 0.5 Chrysene 218-01-9 TBD 57.1 1.0 NA 170 660 0.20 0.5 Dibenzo[a,h]anthracene 53-70-3 TBD 6.22 1.0 NA 170 660 0.23 1.0 Dibenzothiophene 135-65-0 TBD NA 1.0 NA Not Listed Not Listed 0.23 1.0 Fluoranthene 206-44-0 TBD 111.0 1.0 NA 170 660 0.17 0.5 Fluorene 86-73-7 TBD 19.0 1.0 NA 170 660 0.17 0.5 Indeno[1,2,3-c,d]-pyrene 193-39-5 TBD 150.0 1.0 NA 170 660 0.17 1.0 Naphthalene 91-20-3 TBD 34.6 1.0 NA 170 660 1.55 0.5 Perylene 198-55-0 TBD 170,000 1.0 NA Not Listed Not listed 0.18 1.0 Phenanthrene 85-01-8 TBD 41.9 1.0 NA 170 660 0.13 0.5 Pyrene 129-00-0 TBD 53.0 1.0 NA 170 660 0.18 0.5 Notes: 1. Project-specific action levels have not been developed. The listed Data Quality Levels (DQLs) are taken from the CPG RI/FS QAPP, Final Surface Sediment Chemical
Analyses and Benthic Invertebrate Toxicity and Bioaccumulation Testing, October 2009, Revision 0. 2. The PQLGs reported are from the CPG’s QAPP and are based on their laboratory’s Quantitation Limits. The split sample data should be low enough for data comparison;
lower limits than those listed in methods 8270 and SOM01.2 will be required. Differences in laboratory detection limits will be considered when comparing the data. 3. Specific MDLs are not given in the listed methods. 4. Achievable MDLs listed are the statistically-derived MDLs. These MDLs and QLs are based on Axys Analytical Service typical sample specific detection limits. Results will be
reported in dry weight. Actual QLs may be higher and are dependent on the sample moisture content and matrix effects. MDLs and QLs are limits that an individual laboratory can achieve when performing the analytical method.

PWCM/Generic QAPP Final Addendum No. 4 Surface Sediment Sampling co-located with Small Forage Range Fish Tissue Samples
Revision: 0 July 9, 2010
Page 25 of 55
A Lower Passaic River Oversight
QAPP Worksheet #15-h
Reference Limits and Evaluation Table
Matrix: Sediment Analytical Group: SVOCs by EPA SOM01.2 or SW-846, 8270C/D Concentration Level: Low (mg/kg)
Analyte CAS
Number
Project Action Limit1
Project Quantitation Limit Goal2
Analytical Method3
Achievable DESA Laboratory Limits
MDLs
8270 CRQLs3 SOM01.2 CRQLs MDLs 4 QLs4
1,1'-Biphenyl 92-52-4 262 0.4 NA NA 0.17 0.017 120 2,2'-Oxybis (1-Chloropropane) 108-60-1 3.50 0.4 NA 0.66 0.17 0.017 NL 2,4,5-Trichlorophenol 5 95-95-4 0.003 0.4 NA 0.66 0.17 0.036 0.12 2,4,6-Trichlorophenol 5 88-06-2 0.006 0.4 NA 0.66 0.17 0.044 0.12 2,4-Dichlorophenol 5 120-83-2 0.005 0.8 NA 0.66 0.17 0.041 0.12 2,4-Dimethylphenol 5 105-67-9 0.304 0.4 NA 0.66 0.17 0.041 0.12 2,4-Dinitrophenol 5 51-28-5 0.00621 1.6 NA 3.3 0.33 0.360 0.12 2,4-Dinitrotoluene 5 121-14-2 0.0144 0.4 NA 0.66 0.17 0.015 0.12 2,6-Dinitrotoluene 606-20-2 0.70 0.4 NA 0.66 0.17 0.015 0.12 2-Chloronaphthalene 5 91-58-7 0.417 0.4 NA 0.66 0.17 0.015 0.12 2-Chlorophenol 5 95-57-8 0.008 0.4 NA 0.66 0.17 0.028 0.12 2-Methylnaphthalene5 91-57-6 0.0202 0.4 NA 0.66 0.17 0.015 0.12 2-Methylphenol 95-48-7 310 0.4 NA 0.66 0.17 0.036 0.12 2-Nitroaniline 88-74-4 18.0 0.4 NA 3.3 0.33 0.024 0.12 2-Nitrophenol 88-75-5 1,800e 0.4 NA 0.66 0.17 0.035 0.12 3,3'-Dichlorobenzidine5 91-94-1 0.127 0.4 NA 1.3 0.17 0.058 0.12 3-Nitroaniline 99-09-2 18.0 0.4 NA 3.3 0.33 0.013 0.12 4,6-Dinitro-2-methylphenol5 534-52-1 0.610 1.6 NA 3.3 0.17 0.035 0.12 4-Bromophenyl-phenylether 101-55-3 NAf 0.4 NA 0.66 0.17 0.022 0.12 4-Chloro-3-methylphenol 59-50-7 10,000 0.4 NA 1.3 0.17 0.040 0.12 4-Chloroaniline 106-47-8 2.4 0.4 NA 1.3 0.17 0.014 0.12 4-Chlorophenyl-phenyl ether 7005-72-3 NAf 0.4 NA 0.66 0.17 0.022 0.12 4-Methylphenol 106-44-5 31.0 0.4 NA 0.66 0.17 0.045 0.12 4-Nitroaniline 100-01-6 24.0 0.4 NA NA 0.33 0.021 0.12 4-Nitrophenol 5 100-02-7 0.0133 0.8 NA 3.3 0.33 0.043 0.12 Acenaphthene5 83-32-9 0.0067 0.4 NA 0.66 0.17 0.018 0.12 Acenaphthylene5 208-96-8 0.0059 0.4 NA 0.66 0.17 0.014 0.12 Acetophenone 98-86-2 2.00 0.4 NA NA 0.17 0.016 0.12 Anthracene5 120-12-7 0.0469 0.4 NA 0.66 0.17 0.014 0.12 Atrazine 1912-24-9 2.10 0.4 NA NA 0.17 0.021 0.12 Benzaldehyde 100-52-7 780 0.4 NA NA 0.17 0.097 0.12 Benzo(a)anthracene5 56-55-3 0.0317 0.4 NA 0.66 0.17 0.020 0.12
I I
I I
I I
I I
I
I
I
I I I
I
I

PWCM/Generic QAPP Final Addendum No. 4 Surface Sediment Sampling co-located with Small Forage Range Fish Tissue Samples
Revision: 0 July 9, 2010
Page 26 of 55
A Lower Passaic River Oversight
QAPP Worksheet #15-h Reference Limits and Evaluation Table
Matrix: Sediment Analytical Group: SVOCs by EPA SOM01.2 or SW-846, 8270C/D Concentration Level: Low (mg/kg)
Analyte CAS
Number
Project Action Limit1
Project Quantitation Limit Goal2
Analytical Method3
Achievable DESA Laboratory Limits
MDLs
8270 CRQLs3 SOM01.2 CRQLs MDLs 4 QLs4
Benzo(a)pyrene5 50-32-8 0.015 0.4 NA 0.66 0.17 0.014 0.12 Benzo(b)fluoranthene5 205-99-2 0.150 0.4 NA 0.66 0.17 0.018 0.12 Benzo(g,h,i)perylene5 191-24-2 0.170 0.4 NA 0.66 0.17 0.016 0.12 Benzo(k)fluoranthene5 207-08-9 0.240 0.4 NA 0.66 0.17 0.017 0.12 bis-(2-Chloroethoxy)methane 111-91-1 18.0 0.4 NA 0.66 0.17 0.017 0.12 bis-(2-Chloroethyl)ether5 111-44-4 0.190 0.4 NA 0.66 0.17 0.016 0.12 bis(2-Ethylhexyl)phthalate 5 117-81-7 0.182 0.4 NA 0.66 0.17 0.017 0.12 Butylbenzylphthalate 5 85-68-7 0.063 0.4 NA 0.66 0.17 0.017 0.12 Caprolactam 105-60-2 3,100 0.4 NA NA 0.17 0.027 0.12 Carbazole 86-74-8 24.0 0.4 NA NA 0.17 0.014 0.12 Chrysene5 218-01-9 0.0571 0.4 NA 0.66 0.17 0.015 0.12 Dibenzo(a,h)-anthracene5 53-70-3 0.00622 0.4 NA 0.66 0.17 0.016 0.12 Dibenzofuran 132-64-9 NA 0.4 NA 0.66 0.17 0.016 0.12 Diethylphthalate 5 84-66-2 0.006 0.4 NA 0.66 0.17 0.015 0.12 Dimethylphthalate 131-11-3 46.0 0.4 NA 0.66 0.17 0.016 0.12 Di-n-butylphthalate 5 84-74-2 0.058 0.4 NA NA 0.17 0.021 0.12 Di-n-octylphthalate 117-84-0 46.0 0.4 NA 0.66 0.17 0.015 0.12 Fluoranthene5 206-44-0 0.111 0.4 NA 0.66 0.17 0.015 0.12 Fluorene5 86-73-7 0.0190 0.4 NA 0.66 0.17 0.016 0.12 Hexachlorobenzene 5 118-74-1 0.00200 0.4 NA 0.66 0.17 0.019 0.12 Hexachlorobutadiene 5 87-68-3 0.0013 0.4 NA 0.66 0.17 0.016 0.12 Hexachloroethane 5 67-72-1 0.073 0.4 NA 0.66 0.17 0.022 0.12 Hexachlorocyclopentadiene5 77-47-4 0.0070 0.4 NA 0.66 0.17 0.031 0.12 Indeno(1,2,3-cd)-pyrene 5 193-39-5 0.150 0.4 NA 0.66 0.17 0.012 0.12 Isophorone 5 78-59-1 0.432 0.4 NA 0.66 0.17 0.029 0.12 Naphthalene5 91-20-3 0.0346 0.4 NA 0.66 0.17 0.013 0.12 Nitrobenzene 5 98-95-3 0.145 0.4 NA 0.66 0.17 0.015 0.12 n-Nitroso-di-n-propylamine 5 621-64-7 0.0690 0.4 NA 0.66 0.17 0.021 0.12 n-Nitrosodiphenylamine 86-30-6 99.0 0.4 NA 0.66 0.17 0.022 0.12 Pentachlorophenol5 87-86-5 0.017 0.4 NA 3.3 0.33 0.043 0.12 Phenanthrene 5 85-01-8 0.0419 0.4 NA 0.66 0.17 0.013 0.12 Phenol 5 108-95-2 0.0491 0.4 NA 0.66 0.17 0.025 0.12 Pyrene5 129-00-0 0.0530 0.4 NA 0.66 0.17 0.015 0.12
I I I
I I
I I
I
I I
I
I
I I
I I
I I
I
I I
I
I I
I I

PWCM/Generic QAPP Final Addendum No. 4 Surface Sediment Sampling co-located with Small Forage Range Fish Tissue Samples
Revision: 0 July 9, 2010
Page 27 of 55
A Lower Passaic River Oversight
1. At this time, project-specific screening levels or action levels have not been developed. The values listed are the Data Quality Levels (DQLs) taken from the CPG RI/FS QAPP, Final Surface Sediment Chemical Analyses and Benthic Invertebrate Toxicity and Bioaccumulation Testing, October 2009, Revision 0. The split sample data QLs should be low enough for data comparison. Differences in laboratory detection limits will be considered when comparing the data.
2. The PQLGs reported are from the CPG’s QAPP and are based on their laboratory’s Quantitation Limits. 3. Specific MDLs are not given in the listed methods. 4. Achievable MDLs and QLs are limits that an individual laboratory can achieve when performing the analytical method. Actual MDLs and QLs will vary based on sample-specific factors. The QLs listed are based on detection limits achieved by the DESA Laboratories.
5. The project action limit for highlighted cells are below the method 8270 quantitation limits and/or the SOM01.2 as shown above. The laboratory requester should ensure that the laboratory is provided with the PALs and project quantitation limit goals to attempt to achieve the sensitivity requirements above and to match the CPG’s laboratory limits.
Additional note:
Analyte may also be reported from the lower limits GC/MS method for PAH analysis; the PAH method results will take precedence over SOM01.2/SW846 Method 8270C results. The analytes 1-methylnaphthalene, 1-methylphenanthrene, 2,3,5-trimethylnaphthalene, 2,6-dimethylnaphthalene, benzo(e)pyrene, dibenzothiophene, and perylene, will be reported by the PAH method only.
PWCM/Generic QAPP Final Addendum No. 4 Surface Sediment Sampling co-located with Small Forage Range Fish Tissue Samples
Revision: 0 July 9, 2010
Page 28 of 55
A Lower Passaic River Oversight
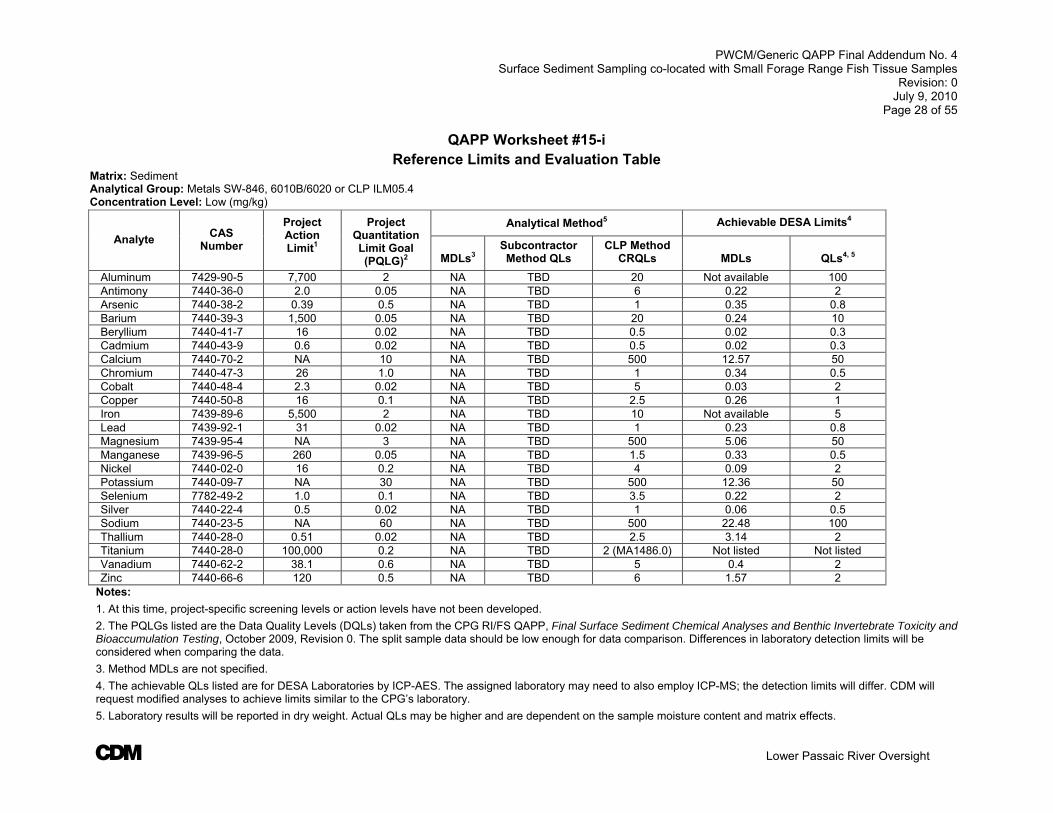
QAPP Worksheet #15-i Reference Limits and Evaluation Table
Matrix: Sediment Analytical Group: Metals SW-846, 6010B/6020 or CLP ILM05.4 Concentration Level: Low (mg/kg)
Analyte CAS
Number
Project Action Limit1
Project Quantitation Limit Goal (PQLG)2
Analytical Method5 Achievable DESA Limits4
MDLs3
Subcontractor Method QLs
CLP Method CRQLs
MDLs
QLs4, 5
Aluminum 7429-90-5 7,700 2 NA TBD 20 Not available 100 Antimony 7440-36-0 2.0 0.05 NA TBD 6 0.22 2 Arsenic 7440-38-2 0.39 0.5 NA TBD 1 0.35 0.8 Barium 7440-39-3 1,500 0.05 NA TBD 20 0.24 10 Beryllium 7440-41-7 16 0.02 NA TBD 0.5 0.02 0.3 Cadmium 7440-43-9 0.6 0.02 NA TBD 0.5 0.02 0.3 Calcium 7440-70-2 NA 10 NA TBD 500 12.57 50 Chromium 7440-47-3 26 1.0 NA TBD 1 0.34 0.5 Cobalt 7440-48-4 2.3 0.02 NA TBD 5 0.03 2 Copper 7440-50-8 16 0.1 NA TBD 2.5 0.26 1 Iron 7439-89-6 5,500 2 NA TBD 10 Not available 5 Lead 7439-92-1 31 0.02 NA TBD 1 0.23 0.8 Magnesium 7439-95-4 NA 3 NA TBD 500 5.06 50 Manganese 7439-96-5 260 0.05 NA TBD 1.5 0.33 0.5 Nickel 7440-02-0 16 0.2 NA TBD 4 0.09 2 Potassium 7440-09-7 NA 30 NA TBD 500 12.36 50 Selenium 7782-49-2 1.0 0.1 NA TBD 3.5 0.22 2 Silver 7440-22-4 0.5 0.02 NA TBD 1 0.06 0.5 Sodium 7440-23-5 NA 60 NA TBD 500 22.48 100 Thallium 7440-28-0 0.51 0.02 NA TBD 2.5 3.14 2 Titanium 7440-28-0 100,000 0.2 NA TBD 2 (MA1486.0) Not listed Not listed Vanadium 7440-62-2 38.1 0.6 NA TBD 5 0.4 2 Zinc 7440-66-6 120 0.5 NA TBD 6 1.57 2 Notes:
1. At this time, project-specific screening levels or action levels have not been developed.
2. The PQLGs listed are the Data Quality Levels (DQLs) taken from the CPG RI/FS QAPP, Final Surface Sediment Chemical Analyses and Benthic Invertebrate Toxicity and Bioaccumulation Testing, October 2009, Revision 0. The split sample data should be low enough for data comparison. Differences in laboratory detection limits will be considered when comparing the data.
3. Method MDLs are not specified.
4. The achievable QLs listed are for DESA Laboratories by ICP-AES. The assigned laboratory may need to also employ ICP-MS; the detection limits will differ. CDM will request modified analyses to achieve limits similar to the CPG’s laboratory.
5. Laboratory results will be reported in dry weight. Actual QLs may be higher and are dependent on the sample moisture content and matrix effects.

PWCM/Generic QAPP Final Addendum No. 4 Surface Sediment Sampling co-located with Small Forage Range Fish Tissue Samples
Revision: 0 July 9, 2010
Page 29 of 55
A Lower Passaic River Oversight
QAPP Worksheet #15-j Reference Limits and Evaluation Table
Matrix: Sediment Analytical Group: Mercury by EPA 1630/1631 Concentration Level: Low (ng/g)
Analyte CAS
Number
Project Action Limit1
Project Quantitation Limit Goal (PQLG) 2
Analytical Method
Achievable Laboratory Limits 4, 5
MDLs
3 Method QLs
ILM05.4 CLP Method CRQLs
MDLs
QLs
Mercury 7439-97-6 150 ng/g 0.15 NA See method EPA 1631
0.1/10-3 0.04 1
Methyl mercury 22967-92-6 150 ng/g 0.025 NA See method EPA 1630
NA 0.02 0.05
Notes:
1. At this time, project-specific screening levels or action levels have not been developed.
2. The PQLGs listed are the Data Quality Levels (DQLs) taken from the CPG RI/FS QAPP, Final Surface Sediment Chemical Analyses and Benthic Invertebrate Toxicity and Bioaccumulation Testing, October 2009, Revision 0. The split sample data should be low enough for data comparison. Differences in laboratory detection limits will be considered when comparing the data based on the laboratory achievable quantitation limits and should be adequate for data comparison.
3. Method MDLs are not specified.
4. The achievable QLs listed are for Accutest Laboratories as an example. The subcontract laboratory has not been determined at this time. The assigned laboratory detection limits will differ.
5. Laboratory results will be reported in dry weight. Actual QLs may be higher and are dependent on the sample moisture content and matrix effects.

PWCM/Generic QAPP Final Addendum No. 4 Surface Sediment Sampling co-located with Small Forage Range Fish Tissue Samples
Revision: 0 July 9, 2010
Page 30 of 55
A Lower Passaic River Oversight
QAPP Worksheet #15-k Reference Limits and Evaluation Table
Matrix: Sediment Analytical Group: TOC by Lloyd Kahn Method Concentration Level: Low (mg/kg)
Analyte
CAS Number
Project
Action Limit 1
Project
Quantitation Limit Goal (PQLG) 2
Analytical Method Achievable Laboratory Limits3,
4
MDLs (mg/kg)
Method QLs
(mg/kg)
MDLs
(mg/kg)
QLs
(mg/kg)
TOC D3590-89-02 Not Available 0.01% Not listed 100 25.15 100
Moisture 2540G Modified Not Available Not applicable NA Not applicable Not Available Not Available
Notes:
1. At this time, there are no project-specific screening levels or action levels approved by the EPA for this parameter for this project. Differences in laboratory detection limits will be considered when comparing the data.
2. The target PQLG listed is based on the laboratory’s achievable QL.
3. The QL and MDL are based on Accutest Laboratories data as an example. The laboratory’s QL is anticipated to be low enough to allow comparison of the split sample data to the CPG data. If another laboratory were assigned to perform this test their detection limits may differ.
4. Laboratory results will be reported in dry weight. Actual QLs may be higher and are dependent on the sample moisture content and matrix effects.

PWCM/Generic QAPP Final Addendum No. 4 Surface Sediment Sampling co-located with Small Forage Range Fish Tissue Samples
Revision: 0 July 9, 2010
Page 31 of 55
A Lower Passaic River Oversight
QAPP Worksheet #16 Project Schedule Timeline Table
Activities Organization Anticipated
Date(s) of Initiation Anticipated Date of
Completion Deliverable Deliverable Due Date Prepare and submit: Oversight QAPP Addendum for Surface Sediment Sampling to EPA and USACE
CDM June 4, 2010 June 24, 2010 UFP-QAPP addendum June 2010
Prepare and submit: Revised oversight QAPP Addendum for Surface Sediment Sampling
CDM As soon as comments are received
July 9, 2010 UFP-QAPP addendum July 9, 2010
Oversight/ acceptance of splits and sample handling activities
CDM Mid July 2010 - TBD 10 days after commencement date
Summary report of field notes including photographs
To be determined
Laboratory Analysis EPA CLP/ DESA and/subcontract laboratories
July through August 2010 To be determined; data collection will be dependent on the CPG schedule
Data Package To be determined; will be dependent on the CPG schedule For standard analyses, 21 days after the last sample is received; however, specialized analyses may take additional time
Validation and verification of sample data
CDM August 2010 August 2010 Validated data report To be determined; will be dependent on CPG schedule
Oversight /Data Evaluation CDM To be determined To be determined Oversight Summary Report/ Data Quality Summary Report
To be determined
Review Surface Sediment Sampling Data Report
CDM 90 days after each survey event
1 month after receipt of report
Comments on Benthic Invertebrate Community Survey Data Report
1 month after receipt of report

PWCM/Generic QAPP Final Addendum No. 4 Surface Sediment Sampling co-located with Small Forage Range Fish Tissue Samples
Revision: 0 July 9, 2010
Page 32 of 55
A Lower Passaic River Oversight
QAPP Worksheet #18 Sampling Locations and Methods/SOP Requirements Table
Survey Location ID Depth Analytical Group Concentration
Level
Estimated Number of Samples
(identify field duplicates)
Sampling SOP Reference Rationale for
Sampling Location
Refer to QAPP prepared by Windward Environmental (Windward) for the CPG
Sediment split samples
Analytical group for split samples includes:
PCB congeners, PCDD/PCDF,
chlorinated pesticides,
PAH and SVOC,
metals (including mercury, and methylmercury),
percent moisture, and
TOC
Low All sampling locations will be observed. Approximately 10 percent of CPG samples will be split.
Attachment D of CPG Benthic QAPP (SOP-Collection and Processing of Sediment Grab Samples) of CPG QAPP (Windward 2009) and Benthic QAPP Addendum (see footnotes)
Sediment split samples will be collected judgmentally by the on-site oversight staff in consultation with the TOM, deputy TOM and USACE/EPA
Notes: Refer to the QAPP prepared by Windward for the CPG (Worksheet # 10 and 18 and Figure 1) titled, Benthic QAPP Addendum No. 1: Spring and Summer 2010 Benthic Invertebrate Community Surveys (April 14, 2010) for sampling information.

PWCM/Generic QAPP Final Addendum No. 4 Surface Sediment Sampling co-located with Small Forage Range Fish Tissue Samples
Revision: 0 July 9, 2010
Page 33 of 55
A Lower Passaic River Oversight
QAPP Worksheet #19 Analytical SOP Requirements Table
Matrix1 Analytical
Group
Concentr-ation Level
Analytical and Preparation Method/SOP Reference2
Sample Volume
Containers (number, size,
and type)
Preservation Requirements (chemical, temperature, light
protected)3 Maximum Holding Time 4 (preparation/
analysis)
Sediment
PCB Congeners
Low CBC01.2 or EPA 1668A for HRGC/HRMS
10 g minimum 1- 4 oz amber glass jar
Maintain in the dark at less than 4 CC from collection until receipt at the laboratory
If stored at less than -10o C solid multiphase samples can be stored for up to one year. Sample extracts can be stored at less than -10 degrees Celsius for up to one year
Pesticides Low EPA Method 1613B Modified (HRGC/HRMS) Minimum mass
= 50 g (combine mass for pesticide, PCDD/PCDF, and PAH)
1-4 oz amber glass jar (ship one jar for pesticide, PCDD/PCDF, and PAH)
Maintain in the dark at less than 4 degrees Celsius (CC) from collection until receipt at the laboratory
14 days to extraction, 40 days to analysis at 4o C. Pesticide samples can be stored 299 days if frozen.
PCDD/PCDF Congeners
Low EPA 1613B for HRGC/HRMS
Maintain in the dark at less than 4 CC from collection until receipt at the laboratory
If stored at less than -10oC, solid multiphase samples can be stored up to one year. Sample extracts can be stored at less than -10oC for up to one year
PAH Low Axys SOP MLA-021
Maintain in the dark at less than 4 oC from collection until receipt at the laboratory
14 days to extraction, 40 days to analysis at 4oC (For this study PAH samples can be stored 199 days if frozen.)
Percent Moisture
Low
SM2540G Modified (Axys SOP EGN007-07)
Minimum mass = 5-10 g
1- 4 oz amber Cool to 4 CC ± 2 CC Analyze as soon as possible
Sediment
TCL SVOC Low SOM01.2 or SW846 Method 8270C
Minimum mass= 30 grams
1- 8 oz glass jar (ship one jar for SVOC, metals, TOC, and percent moisture
Cool to 4 CC ± 2 CC 14 days to extraction; 40 days to analysis at 4 CC
Metals Low SW846 Method 6010B/6020 or ILM05.4
Minimum mass = 2 g
Cool to 4 CC ± 2 CC
6 months
TOC Low Lloyd Kahn
Minimum mass = 1 g
14 days
Sediment Total mercury and methyl mercury
Low EPA 1630/1631 Minimum mass = 1 g
1- 4 oz pre-tared polyethylene bottle
Cool to 4 CC ± 2 CC and freeze as soon as possible
1 year [ if aliquoted, weighed and frozen at <-15 CC]
Notes:
1: Sediment matrix refers to sediment split sample analyzed for sediment chemical concentration.
2: DESA and CLP Laboratory SOPs are not available. The Axys laboratory SOPs are available upon request. A backup CDM analytical subcontract laboratory for TOC, mercury and methyl mercury is TBD.
3. The actual jar size may vary depending on the need of the assigned laboratory. The sampler should confirm sample volumes with the laboratory prior to mobilizing to the field.
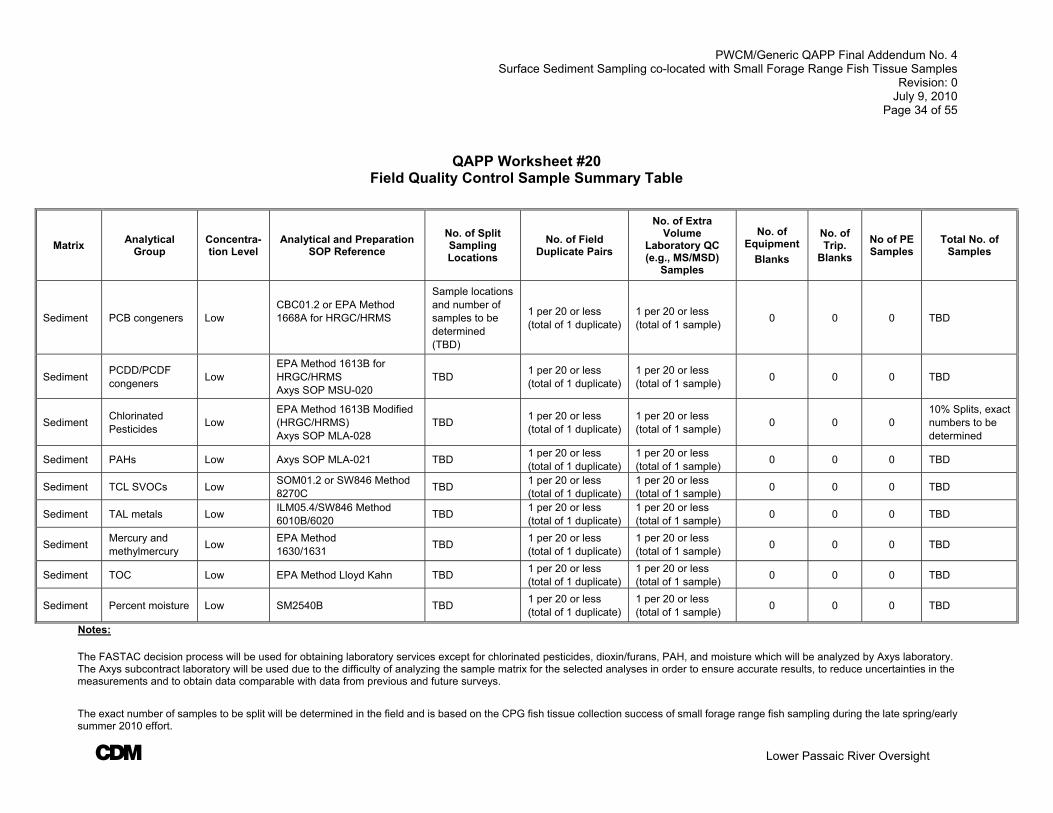
PWCM/Generic QAPP Final Addendum No. 4 Surface Sediment Sampling co-located with Small Forage Range Fish Tissue Samples
Revision: 0 July 9, 2010
Page 34 of 55
A Lower Passaic River Oversight
QAPP Worksheet #20 Field Quality Control Sample Summary Table
Matrix Analytical
Group Concentra-tion Level
Analytical and Preparation SOP Reference
No. of Split Sampling Locations
No. of Field Duplicate Pairs
No. of Extra Volume
Laboratory QC (e.g., MS/MSD)
Samples
No. of Equipment
Blanks
No. of Trip.
Blanks
No of PE Samples
Total No. of Samples
Sediment PCB congeners Low CBC01.2 or EPA Method 1668A for HRGC/HRMS
Sample locations and number of samples to be determined (TBD)
1 per 20 or less (total of 1 duplicate)
1 per 20 or less (total of 1 sample)
0 0 0 TBD
Sediment PCDD/PCDF congeners
Low EPA Method 1613B for HRGC/HRMS Axys SOP MSU-020
TBD 1 per 20 or less (total of 1 duplicate)
1 per 20 or less (total of 1 sample)
0 0 0 TBD
Sediment Chlorinated Pesticides
Low EPA Method 1613B Modified (HRGC/HRMS) Axys SOP MLA-028
TBD 1 per 20 or less (total of 1 duplicate)
1 per 20 or less (total of 1 sample)
0 0 0 10% Splits, exact numbers to be determined
Sediment PAHs Low Axys SOP MLA-021 TBD 1 per 20 or less (total of 1 duplicate)
1 per 20 or less (total of 1 sample)
0 0 0 TBD
Sediment TCL SVOCs Low SOM01.2 or SW846 Method 8270C
TBD 1 per 20 or less (total of 1 duplicate)
1 per 20 or less (total of 1 sample)
0 0 0 TBD
Sediment TAL metals Low ILM05.4/SW846 Method 6010B/6020
TBD 1 per 20 or less (total of 1 duplicate)
1 per 20 or less (total of 1 sample)
0 0 0 TBD
Sediment Mercury and methylmercury
Low EPA Method 1630/1631
TBD 1 per 20 or less (total of 1 duplicate)
1 per 20 or less (total of 1 sample)
0 0 0 TBD
Sediment TOC Low EPA Method Lloyd Kahn TBD 1 per 20 or less (total of 1 duplicate)
1 per 20 or less (total of 1 sample)
0 0 0 TBD
Sediment Percent moisture Low SM2540B TBD 1 per 20 or less (total of 1 duplicate)
1 per 20 or less (total of 1 sample)
0 0 0 TBD
Notes:
The FASTAC decision process will be used for obtaining laboratory services except for chlorinated pesticides, dioxin/furans, PAH, and moisture which will be analyzed by Axys laboratory. The Axys subcontract laboratory will be used due to the difficulty of analyzing the sample matrix for the selected analyses in order to ensure accurate results, to reduce uncertainties in the measurements and to obtain data comparable with data from previous and future surveys.
The exact number of samples to be split will be determined in the field and is based on the CPG fish tissue collection success of small forage range fish sampling during the late spring/early summer 2010 effort.

PWCM/Generic QAPP Final Addendum No. 4 Surface Sediment Sampling co-located with Small Forage Range Fish Tissue Samples
Revision: 0 July 9, 2010
Page 35 of 55
A Lower Passaic River Oversight
QAPP Worksheet #23 Analytical SOP References Table
Reference Number Title, Revision Date, and/or
Number Definitive or
Screening Data Analytical Group Instrument Organization
Performing Analysis Modified for
Project Work?
CBC01.2 or EPA Method 1668A for HRGC/HRMS
Analysis of PCB Congeners by EPA Method 1668A. May 2006.
Definitive PCB Congeners HRGC/HRMS EPA Headquarters
Laboratory No
EPA 1613B for HRGC/HRMS Axys SOP: MSU-020
Analysis of Polychlorinated Dioxins and Furans by EPA Method 1613B. June 2005.
Definitive PCDD/PCDF Congeners
HRGC/HRMS
Axys Analytical Services Laboratory
2045 Mills Road West Sidney, British Columbia, Canada
Contact: Candice NavaroliPhone:1-888-373-0881
No
EPA 1613B Modified/ Axys SOP: MLA-028
Analysis of Organochlorine Pesticides by HRGC/HRMS in [Water, Solids, Biosolids and Tissue]. September 2009.
Definitive Chlorinated Pesticides
HRGC/HRMS Axys Analytical Services Analyte list per WS#15
Axys SOP: MLA-021 Analysis of Polycyclic Aromatic Hydrocarbons (PAH) and Alkylated PAH by method MLA-021. February 2009.
Definitive PAH HRGC/HRMS Axys Analytical Services No
SM2540G Modified
Total, Fixed, and Volatile Solids in Soil and Semisolid Samples. Standard Methods for Examination of Water and Wastewater. 19th Edition 1995.
Definitive Moisture Furnace, Balance, Oven
Axys Analytical Services Yes
SOM01.2
EPA Contract Laboratory Program (CLP) Statement of Work (SOW) for Multi-Media, Multi-Concentration, Organic Analytical Service for Superfund. August 2007.
Definitive TCL SVOC GC/MS
CLP No
C-90 (SOM01.2 or 8270C)
Analysis of Base /Neutral and Acid Compounds in Aqueous, Soil/ Sediment and Waste Oil/Waste Organic Solvent Samples. Rev 2.0, March 2007.
DESA No

PWCM/Generic QAPP Final Addendum No. 4 Surface Sediment Sampling co-located with Small Forage Range Fish Tissue Samples
Revision: 0 July 9, 2010
Page 36 of 55
A Lower Passaic River Oversight
QAPP Worksheet #23 Analytical SOP References Table
Reference Number Title, Revision Date, and/or
Number Definitive or
Screening Data Analytical Group Instrument Organization
Performing Analysis Modified for
Project Work?
C-109
Determination of Trace Elements in Aqueous Trace Metals in Aqueous, Soil/Sediment/Sludge-ICP-AES. Rev 2.0. March 2007.
Definitive Metals ICP-AES DESA No
ILM05.4 CLP SOW for Multi-Media, Multi-Concentration Inorganic Analysis. December 2006
Definitive Metals ICP-AES ICP-MS
CLP No
C-112
Trace Metals in Aqueous, Soil/ Sediment/Sludge/Waste Oil/Organic and Biological tissue by Inductively Coupled Plasma-Mass Spectrometry. Rev 2.0. March 2007.
Definitive Metals ICP-MS DESA No
EPA 1631 Total Mercury in Aqueous Samples by Cold Vapor Atomic Fluorescence. March 2009.
Definitive Total mercury CVAFS CDM Subcontract: TBD No
EPA 1630
Methylmercury in Tissue and Sediment by Cold Vapor Atomic Fluorescence. August 2007.
Definitive Methyl mercury CVAFS CDM Subcontract: TBD No
C-88 Total Organics in Soil. Rev 1.0. January 2005.
Definitive TOC Carbon Analyzer
DESA No
Lloyd Kahn
Determination of TOC in Sediment. July 1998 and Attachment B, Supplemental Technical Direction and Additional QC Procedures
CDM subcontract laboratory TBD
No
Notes:
The titles above may change dependent on the assigned laboratories.
1: As necessary, the assigned laboratories will perform additional clean-up of split samples (via gel permeation chromatography) prior to analysis of organic compounds.

PWCM/Generic QAPP Final Addendum No. 4 Surface Sediment Sampling co-located with Small Forage Range Fish Tissue Samples
Revision: 0 July 9, 2010
Page 37 of 55
A Lower Passaic River Oversight
QAPP Worksheet #24 Analytical Instrument Calibration Table
Instrument Calibration Procedure
Frequency of Calibration Acceptance Criteria
Corrective Action (CA)
PersonResponsible for
CA SOP Reference1
TOC Analyzer Per vendor, instrument manual and laboratory SOP
Check daily
Calibration and corrective action as per laboratory SOP and Manufacturer’s instruction. No samples shall be analyzed if instrument calibration exceeds the acceptance criteria.
Laboratory analyst / QA officer - TBD
Lloyd Kahn SOP DESA - C-88 Subcontract Laboratory - TBD
HRGC/ HRMS and HRGC/LRMS
Initial Calibration and calibration verification check: Per laboratory SOP
After set up, prior to run and after instrument changes or failures of checks.
% RSD and % recovery per laboratory SOPs.
Check, correct; re-calibrate and rerun all samples analyzed after last valid calibration check
Laboratory analyst / QA officer - TBD
Axys SOP for PAH analysis: MLA-021 EPA Lab SOP for PCB Congeners by CBC01.2 or 1668A - TBD Axys SOP for Chlorinated pesticides by EPA 1613B Mod: MLA-028 Axys SOP for PCDD/ PCDF by EPA 1613B: MSU-020
Calibration checks: CCVs per laboratory SOP
Daily: Beginning of run and after every 10 samples and at end of analytical run
% recovery per laboratory SOP
Check, correct; re-calibrate and rerun all samples analyzed after last valid cal check
Laboratory analyst / QA officer - TBD
GC/MS for TCL SVOC - SOM01.2 or SW-846 8270C
Initial calibration: 5 points standards
Upon award of the contract, whenever the laboratory takes corrective action which may change or affect the initial calibration criteria (e.g., ion source cleaning or repair, column replacement, etc.), or if the continuing calibration acceptance criteria have not been met.
relative response factor (RRF) ≥ minimum acceptable RRF listed in Table 5 of procedure; All target compounds, initial relative standard deviation (RSD) ≤ 10% or 20% and correlation coefficient (r)> 0.995. %RSD ≤ value in Table 5 of SOM01.2 or other laboratory SOP as applicable.
Inspect system for problems (e.g., clean ion source, change the column, service the purge and trap device), correct problem, re-calibrate.
EPA CLP Laboratory GC/MS
Technician
DESA SOPs: C-89 & C-90 CLP Laboratory - TBD

PWCM/Generic QAPP Final Addendum No. 4 Surface Sediment Sampling co-located with Small Forage Range Fish Tissue Samples
Revision: 0 July 9, 2010
Page 38 of 55
A Lower Passaic River Oversight
QAPP Worksheet #24 Analytical Instrument Calibration Table
Instrument Calibration Procedure
Frequency of Calibration Acceptance Criteria
Corrective Action (CA)
PersonResponsible for
CA SOP Reference1
GC/MS
Continuing calibration (CCV)
Once every 12 hours or as per laboratory SOPs
%D ≤15% or <30% or as per laboratory SOPs
Inspect system; correct problem; recalibrate the instrument, reanalyze affected samples and standards.
EPA CLP Laboratory GC/MS
Technician SOM01.2/8270C
GC/MS Calibration Standards Verification
Each lot of standards As per laboratory established control limits
Inspect system; correct problem; re-run standard and affected samples
EPA CLP Laboratory GC/MS
Technician SOM01.2/8270C
GC/MS Tuning Daily: every 12 hours Response factors and RRF as method specified
Inspect system; correct problem; re-run standard and affected samples
EPA CLP Laboratory GC/MS
Technician SOM01.2/8270C
CVAFS Per method and laboratory SOP
Calibration Per method/ laboratory SOP. ICAL ≤15%RSD.
Inspect the system, correct problem, re-calibrate, and re-analyze samples.
Assigned laboratory personnel
EPA 1630/1631 Subcontract Laboratory - TBD
ICV: Check daily when instrument is in use
85-115% R for Total mercury; 80-120%R for methyl mercury
CCV: Beginning and after every 10 samples
77-123% R for total mercury; 67-133%R for methyl mercury
ICP-AES and ICP-MS
See ILM05.4; as per instrument manufacturer’s recommended procedures
Initial calibration: daily or once every 24 hours and each time the instrument is set up.
ICP-AES: As per instrument manufacturer’s recommended procedures, with at least 2 standards.
Inspect the system, correct problem, re-calibrate, and re-analyze samples.
TBD
DESA Laboratory, EPA CLP
Laboratory or Subcontractor
ICP-AES / ICP-MS
Technician/ analyst / QA officer
ILM05.4 or SW-846, 6010B/6020 SOPs: DESA Lab: C-109 & C-112 CLP: NA
Initial calibration Daily; after tuning and optimizing instrument
r >0.995; minimum of 3 standards and a blank
Repeat analysis; re-prepare calibration standards and reanalyze
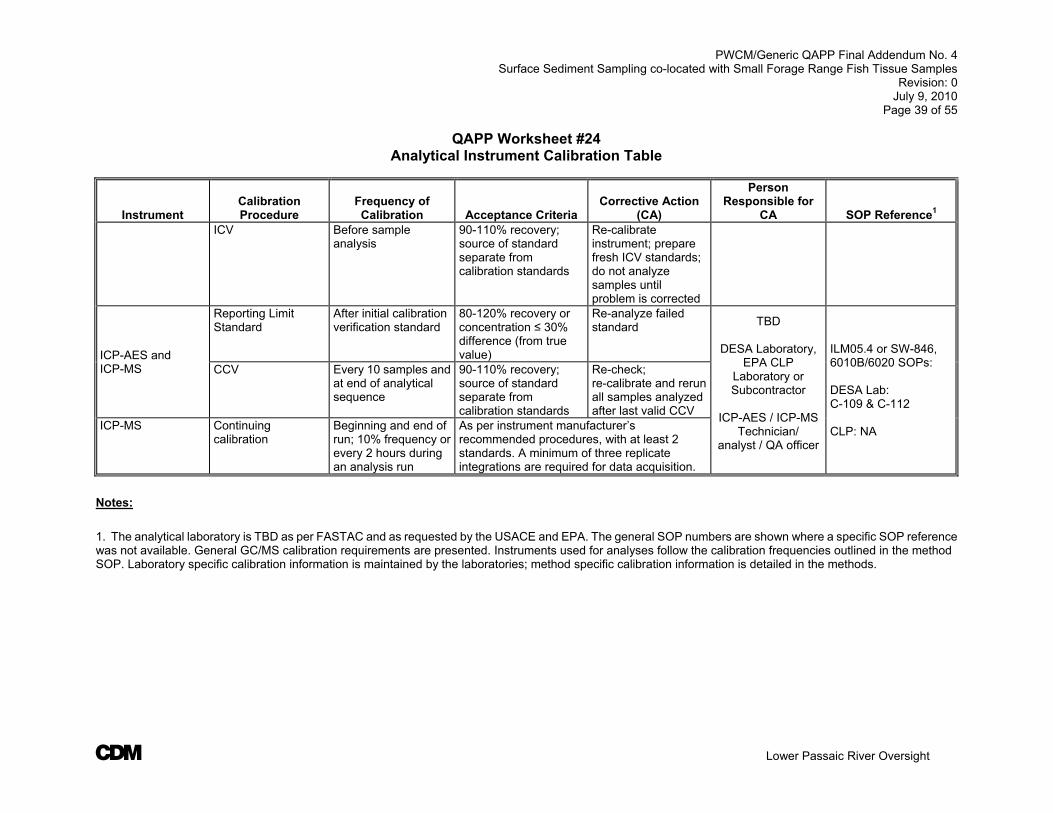
PWCM/Generic QAPP Final Addendum No. 4 Surface Sediment Sampling co-located with Small Forage Range Fish Tissue Samples
Revision: 0 July 9, 2010
Page 39 of 55
A Lower Passaic River Oversight
QAPP Worksheet #24 Analytical Instrument Calibration Table
Instrument Calibration Procedure
Frequency of Calibration Acceptance Criteria
Corrective Action (CA)
PersonResponsible for
CA SOP Reference1 ICV Before sample
analysis 90-110% recovery; source of standard separate from calibration standards
Re-calibrate instrument; prepare fresh ICV standards; do not analyze samples until problem is corrected
ICP-AES and ICP-MS
Reporting Limit Standard
After initial calibration verification standard
80-120% recovery or concentration ≤ 30% difference (from true value)
Re-analyze failed standard TBD
DESA Laboratory,
EPA CLP Laboratory or Subcontractor
ICP-AES / ICP-MS
Technician/ analyst / QA officer
ILM05.4 or SW-846, 6010B/6020 SOPs: DESA Lab: C-109 & C-112 CLP: NA
CCV Every 10 samples and at end of analytical sequence
90-110% recovery; source of standard separate from calibration standards
Re-check; re-calibrate and rerun all samples analyzed after last valid CCV
ICP-MS Continuing calibration
Beginning and end of run; 10% frequency or every 2 hours during an analysis run
As per instrument manufacturer’s recommended procedures, with at least 2 standards. A minimum of three replicate integrations are required for data acquisition.
Notes:
1. The analytical laboratory is TBD as per FASTAC and as requested by the USACE and EPA. The general SOP numbers are shown where a specific SOP reference was not available. General GC/MS calibration requirements are presented. Instruments used for analyses follow the calibration frequencies outlined in the method SOP. Laboratory specific calibration information is maintained by the laboratories; method specific calibration information is detailed in the methods.
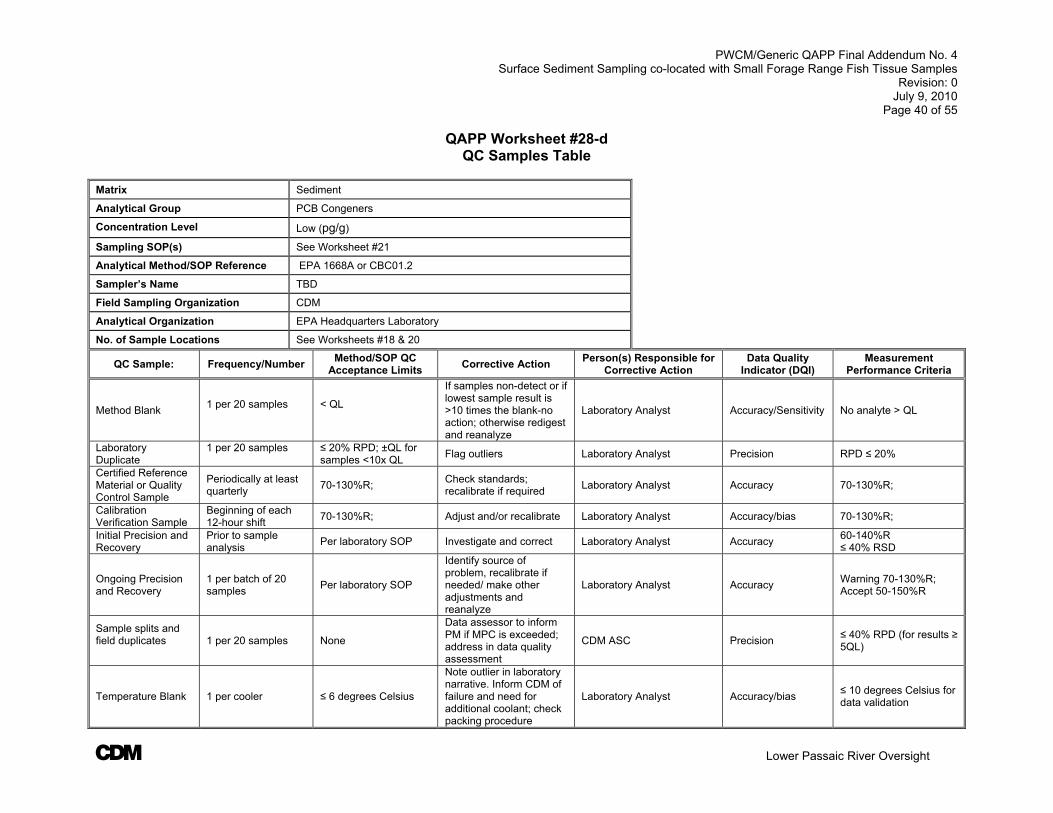
PWCM/Generic QAPP Final Addendum No. 4 Surface Sediment Sampling co-located with Small Forage Range Fish Tissue Samples
Revision: 0 July 9, 2010
Page 40 of 55
A Lower Passaic River Oversight
QAPP Worksheet #28-d QC Samples Table
Matrix Sediment
Analytical Group PCB Congeners
Concentration Level Low (pg/g)
Sampling SOP(s) See Worksheet #21
Analytical Method/SOP Reference EPA 1668A or CBC01.2
Sampler’s Name TBD
Field Sampling Organization CDM
Analytical Organization EPA Headquarters Laboratory
No. of Sample Locations See Worksheets #18 & 20
QC Sample: Frequency/Number Method/SOP QC
Acceptance Limits Corrective Action
Person(s) Responsible for Corrective Action
Data Quality Indicator (DQI)
Measurement Performance Criteria
Method Blank 1 per 20 samples
< QL
If samples non-detect or if lowest sample result is >10 times the blank-no action; otherwise redigest and reanalyze
Laboratory Analyst Accuracy/Sensitivity No analyte > QL
Laboratory Duplicate
1 per 20 samples
≤ 20% RPD; ±QL for samples <10x QL
Flag outliers Laboratory Analyst Precision RPD ≤ 20%
Certified Reference Material or Quality Control Sample
Periodically at least quarterly
70-130%R; Check standards; recalibrate if required
Laboratory Analyst Accuracy 70-130%R;
Calibration Verification Sample
Beginning of each 12-hour shift
70-130%R; Adjust and/or recalibrate Laboratory Analyst Accuracy/bias 70-130%R;
Initial Precision and Recovery
Prior to sample analysis
Per laboratory SOP Investigate and correct Laboratory Analyst Accuracy 60-140%R ≤ 40% RSD
Ongoing Precision and Recovery
1 per batch of 20 samples
Per laboratory SOP
Identify source of problem, recalibrate if needed/ make other adjustments and reanalyze
Laboratory Analyst Accuracy Warning 70-130%R; Accept 50-150%R
Sample splits and field duplicates
1 per 20 samples None
Data assessor to inform PM if MPC is exceeded; address in data quality assessment
CDM ASC Precision ≤ 40% RPD (for results ≥ 5QL)
Temperature Blank 1 per cooler ≤ 6 degrees Celsius
Note outlier in laboratory narrative. Inform CDM of failure and need for additional coolant; check packing procedure
Laboratory Analyst Accuracy/bias ≤ 10 degrees Celsius for data validation
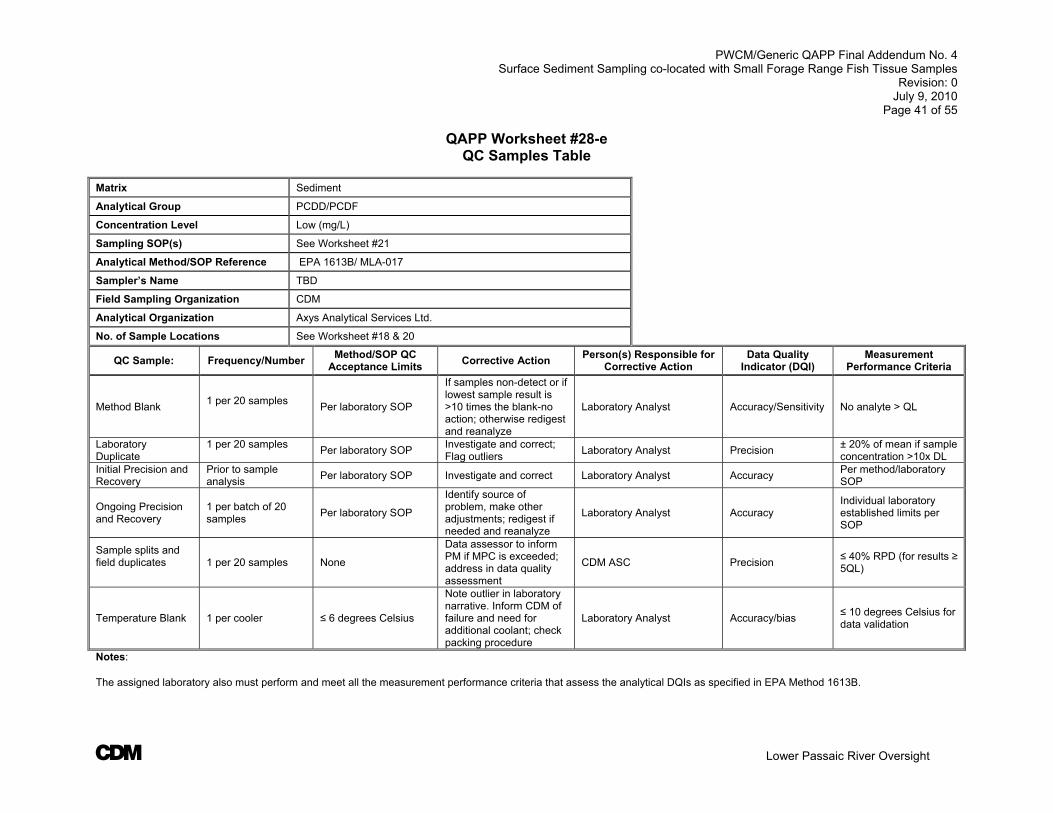
PWCM/Generic QAPP Final Addendum No. 4 Surface Sediment Sampling co-located with Small Forage Range Fish Tissue Samples
Revision: 0 July 9, 2010
Page 41 of 55
A Lower Passaic River Oversight
QAPP Worksheet #28-e QC Samples Table
Matrix Sediment
Analytical Group PCDD/PCDF
Concentration Level Low (mg/L)
Sampling SOP(s) See Worksheet #21
Analytical Method/SOP Reference EPA 1613B/ MLA-017
Sampler’s Name TBD
Field Sampling Organization CDM
Analytical Organization Axys Analytical Services Ltd.
No. of Sample Locations See Worksheet #18 & 20
QC Sample: Frequency/Number Method/SOP QC
Acceptance Limits Corrective Action
Person(s) Responsible for Corrective Action
Data Quality Indicator (DQI)
Measurement Performance Criteria
Method Blank 1 per 20 samples
Per laboratory SOP
If samples non-detect or if lowest sample result is >10 times the blank-no action; otherwise redigest and reanalyze
Laboratory Analyst Accuracy/Sensitivity No analyte > QL
Laboratory Duplicate
1 per 20 samples
Per laboratory SOP Investigate and correct; Flag outliers
Laboratory Analyst Precision ± 20% of mean if sample concentration >10x DL
Initial Precision and Recovery
Prior to sample analysis
Per laboratory SOP Investigate and correct Laboratory Analyst Accuracy Per method/laboratory SOP
Ongoing Precision and Recovery
1 per batch of 20 samples
Per laboratory SOP
Identify source of problem, make other adjustments; redigest if needed and reanalyze
Laboratory Analyst Accuracy Individual laboratory established limits per SOP
Sample splits and field duplicates
1 per 20 samples None
Data assessor to inform PM if MPC is exceeded; address in data quality assessment
CDM ASC Precision ≤ 40% RPD (for results ≥ 5QL)
Temperature Blank 1 per cooler ≤ 6 degrees Celsius
Note outlier in laboratory narrative. Inform CDM of failure and need for additional coolant; check packing procedure
Laboratory Analyst Accuracy/bias ≤ 10 degrees Celsius for data validation
Notes: The assigned laboratory also must perform and meet all the measurement performance criteria that assess the analytical DQIs as specified in EPA Method 1613B.
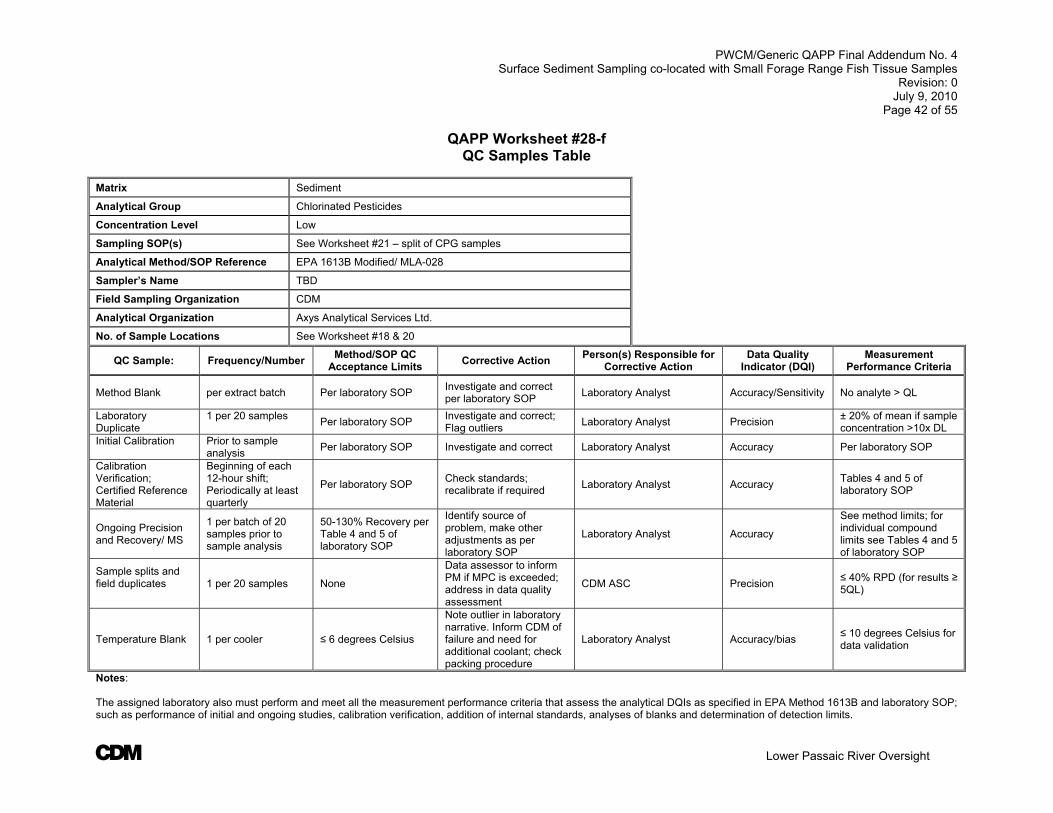
PWCM/Generic QAPP Final Addendum No. 4 Surface Sediment Sampling co-located with Small Forage Range Fish Tissue Samples
Revision: 0 July 9, 2010
Page 42 of 55
A Lower Passaic River Oversight
QAPP Worksheet #28-f QC Samples Table
Matrix Sediment
Analytical Group Chlorinated Pesticides
Concentration Level Low
Sampling SOP(s) See Worksheet #21 – split of CPG samples
Analytical Method/SOP Reference EPA 1613B Modified/ MLA-028
Sampler’s Name TBD
Field Sampling Organization CDM
Analytical Organization Axys Analytical Services Ltd.
No. of Sample Locations See Worksheet #18 & 20
QC Sample: Frequency/Number Method/SOP QC
Acceptance Limits Corrective Action
Person(s) Responsible for Corrective Action
Data Quality Indicator (DQI)
Measurement Performance Criteria
Method Blank per extract batch Per laboratory SOP Investigate and correct per laboratory SOP
Laboratory Analyst Accuracy/Sensitivity No analyte > QL
Laboratory Duplicate
1 per 20 samples
Per laboratory SOP Investigate and correct; Flag outliers
Laboratory Analyst Precision ± 20% of mean if sample concentration >10x DL
Initial Calibration
Prior to sample analysis
Per laboratory SOP Investigate and correct Laboratory Analyst Accuracy Per laboratory SOP
Calibration Verification; Certified Reference Material
Beginning of each 12-hour shift; Periodically at least quarterly
Per laboratory SOP Check standards; recalibrate if required
Laboratory Analyst Accuracy Tables 4 and 5 of laboratory SOP
Ongoing Precision and Recovery/ MS
1 per batch of 20 samples prior to sample analysis
50-130% Recovery per Table 4 and 5 of laboratory SOP
Identify source of problem, make other adjustments as per laboratory SOP
Laboratory Analyst Accuracy
See method limits; for individual compound limits see Tables 4 and 5 of laboratory SOP
Sample splits and field duplicates
1 per 20 samples None
Data assessor to inform PM if MPC is exceeded; address in data quality assessment
CDM ASC Precision ≤ 40% RPD (for results ≥ 5QL)
Temperature Blank 1 per cooler ≤ 6 degrees Celsius
Note outlier in laboratory narrative. Inform CDM of failure and need for additional coolant; check packing procedure
Laboratory Analyst Accuracy/bias ≤ 10 degrees Celsius for data validation
Notes: The assigned laboratory also must perform and meet all the measurement performance criteria that assess the analytical DQIs as specified in EPA Method 1613B and laboratory SOP; such as performance of initial and ongoing studies, calibration verification, addition of internal standards, analyses of blanks and determination of detection limits.
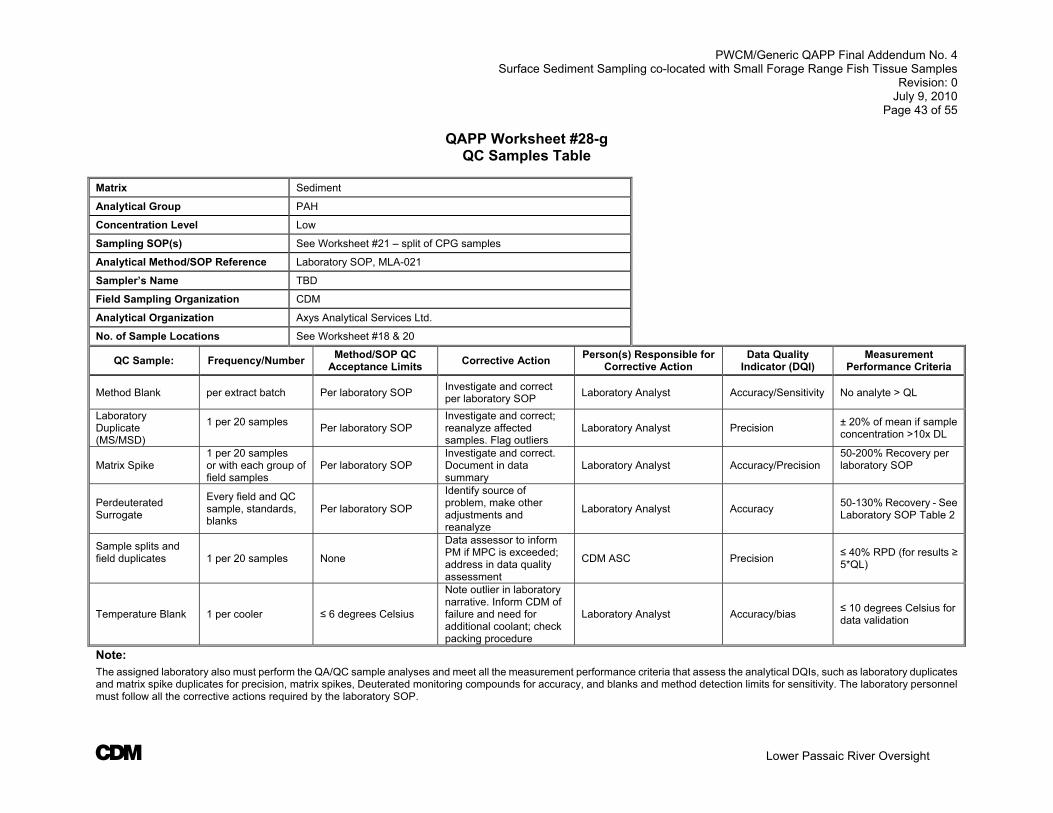
PWCM/Generic QAPP Final Addendum No. 4 Surface Sediment Sampling co-located with Small Forage Range Fish Tissue Samples
Revision: 0 July 9, 2010
Page 43 of 55
A Lower Passaic River Oversight
QAPP Worksheet #28-g QC Samples Table
Matrix Sediment
Analytical Group PAH
Concentration Level Low
Sampling SOP(s) See Worksheet #21 – split of CPG samples
Analytical Method/SOP Reference Laboratory SOP, MLA-021
Sampler’s Name TBD
Field Sampling Organization CDM
Analytical Organization Axys Analytical Services Ltd.
No. of Sample Locations See Worksheet #18 & 20
QC Sample: Frequency/Number Method/SOP QC
Acceptance Limits Corrective Action
Person(s) Responsible for Corrective Action
Data Quality Indicator (DQI)
Measurement Performance Criteria
Method Blank per extract batch Per laboratory SOP Investigate and correct per laboratory SOP
Laboratory Analyst Accuracy/Sensitivity No analyte > QL
Laboratory Duplicate (MS/MSD)
1 per 20 samples
Per laboratory SOP Investigate and correct; reanalyze affected samples. Flag outliers
Laboratory Analyst Precision ± 20% of mean if sample concentration >10x DL
Matrix Spike 1 per 20 samples or with each group of field samples
Per laboratory SOP Investigate and correct. Document in data summary
Laboratory Analyst Accuracy/Precision 50-200% Recovery per laboratory SOP
Perdeuterated Surrogate
Every field and QC sample, standards, blanks
Per laboratory SOP
Identify source of problem, make other adjustments and reanalyze
Laboratory Analyst Accuracy 50-130% Recovery - See Laboratory SOP Table 2
Sample splits and field duplicates
1 per 20 samples None
Data assessor to inform PM if MPC is exceeded; address in data quality assessment
CDM ASC Precision ≤ 40% RPD (for results ≥ 5*QL)
Temperature Blank 1 per cooler ≤ 6 degrees Celsius
Note outlier in laboratory narrative. Inform CDM of failure and need for additional coolant; check packing procedure
Laboratory Analyst Accuracy/bias ≤ 10 degrees Celsius for data validation
Note: The assigned laboratory also must perform the QA/QC sample analyses and meet all the measurement performance criteria that assess the analytical DQIs, such as laboratory duplicates and matrix spike duplicates for precision, matrix spikes, Deuterated monitoring compounds for accuracy, and blanks and method detection limits for sensitivity. The laboratory personnel must follow all the corrective actions required by the laboratory SOP.

PWCM/Generic QAPP Final Addendum No. 4 Surface Sediment Sampling co-located with Small Forage Range Fish Tissue Samples
Revision: 0 July 9, 2010
Page 44 of 55
A Lower Passaic River Oversight
QAPP Worksheet #28-h QC Samples Table
Matrix Sediment
Analytical Group SVOC
Concentration Level Low
Sampling SOP(s) See Worksheet #21 – split of CPG samples
Analytical Method/SOP Reference SOM01.2 or 8270C
Sampler’s Name TBD
Field Sampling Organization CDM
Analytical Organization As per FASTAC [DESA or EPA CLP Laboratory]
No. of Sample Locations See Worksheet #18 & 20
QC Sample: Frequency/
Number Method/SOP QC Acceptance Limits Corrective Action
Person(s) Responsible for
Corrective Action
Data Quality Indicator (DQI)
Measurement Performance
Criteria
Method Blank per extract batch Per method/laboratory SOP Investigate and correct per laboratory SOP
Laboratory Analyst Accuracy/ Sensitivity
No analyte > QL
Temperature Blank
1 per cooler ≤ 6 degrees Celsius
Note outlier in laboratory narrative. Inform CDM of failure and need for additional coolant; check packing procedure
Laboratory Analyst Accuracy/bias ≤ 10 degrees Celsius for data validation
Sample splits and field duplicates
1 per 20 samples None
Data assessor to inform PM if MPC is exceeded; address in data quality assessment
CDM ASC Precision ≤ 40% RPD (for results ≥ 5QL)
MS/MSD
1 per 20 samples or with each group of field samples
Per method/laboratory SOP Note: not required for Region 2 CLP analysis
Investigate and correct; reanalyze affected samples. Flag outliers Document in case narrative
Laboratory Analyst Precision
Individual limits listed as per laboratory established limits
MS/MSD and LCS Laboratory Analyst Accuracy
Individual limits listed as per laboratory established limits
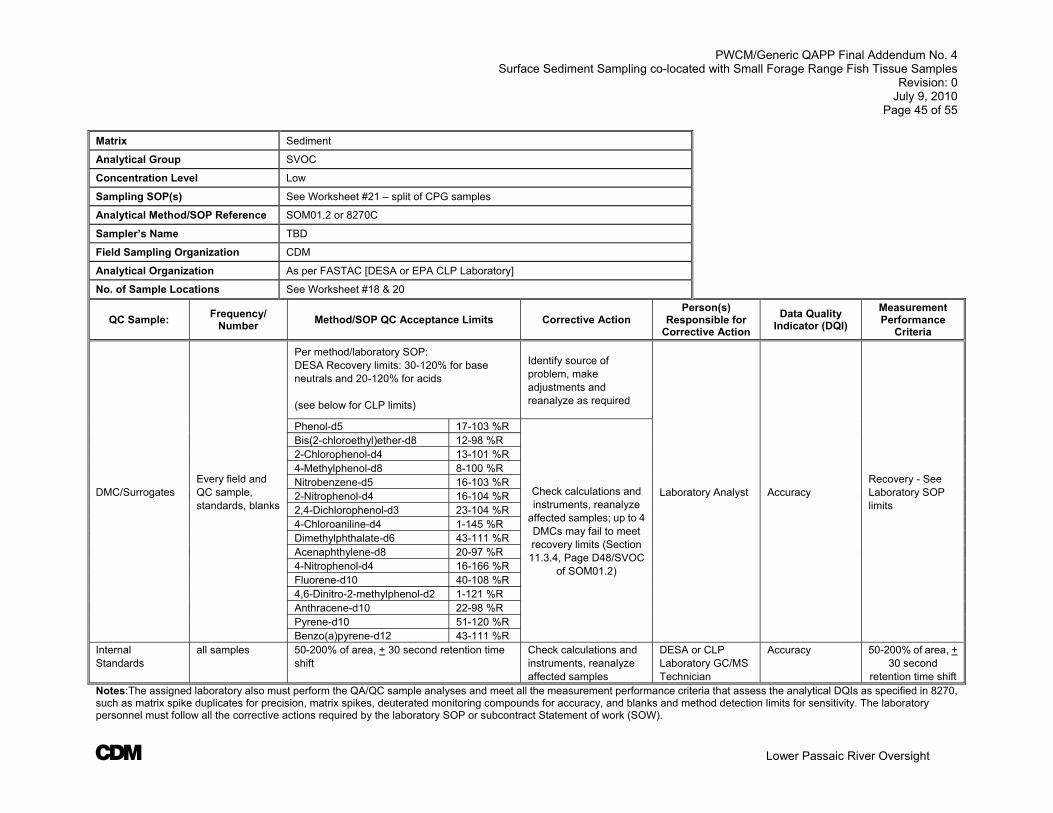
PWCM/Generic QAPP Final Addendum No. 4 Surface Sediment Sampling co-located with Small Forage Range Fish Tissue Samples
Revision: 0 July 9, 2010
Page 45 of 55
A Lower Passaic River Oversight
Matrix Sediment
Analytical Group SVOC
Concentration Level Low
Sampling SOP(s) See Worksheet #21 – split of CPG samples
Analytical Method/SOP Reference SOM01.2 or 8270C
Sampler’s Name TBD
Field Sampling Organization CDM
Analytical Organization As per FASTAC [DESA or EPA CLP Laboratory]
No. of Sample Locations See Worksheet #18 & 20
QC Sample: Frequency/
Number Method/SOP QC Acceptance Limits Corrective Action
Person(s) Responsible for
Corrective Action
Data Quality Indicator (DQI)
Measurement Performance
Criteria
DMC/Surrogates Every field and QC sample, standards, blanks
Per method/laboratory SOP: DESA Recovery limits: 30-120% for base neutrals and 20-120% for acids (see below for CLP limits)
Identify source of problem, make adjustments and reanalyze as required
Laboratory Analyst Accuracy Recovery - See Laboratory SOP limits
Phenol-d5 17-103 %R
Check calculations and instruments, reanalyze
affected samples; up to 4 DMCs may fail to meet recovery limits (Section
11.3.4, Page D48/SVOC of SOM01.2)
Bis(2-chloroethyl)ether-d8 12-98 %R 2-Chlorophenol-d4 13-101 %R 4-Methylphenol-d8 8-100 %R Nitrobenzene-d5 16-103 %R 2-Nitrophenol-d4 16-104 %R 2,4-Dichlorophenol-d3 23-104 %R 4-Chloroaniline-d4 1-145 %R Dimethylphthalate-d6 43-111 %R Acenaphthylene-d8 20-97 %R 4-Nitrophenol-d4 16-166 %R Fluorene-d10 40-108 %R 4,6-Dinitro-2-methylphenol-d2 1-121 %R Anthracene-d10 22-98 %R Pyrene-d10 51-120 %R Benzo(a)pyrene-d12 43-111 %R
Internal Standards
all samples 50-200% of area, + 30 second retention time shift
Check calculations and instruments, reanalyze affected samples
DESA or CLP Laboratory GC/MS Technician
Accuracy 50-200% of area, + 30 second
retention time shift Notes:The assigned laboratory also must perform the QA/QC sample analyses and meet all the measurement performance criteria that assess the analytical DQIs as specified in 8270, such as matrix spike duplicates for precision, matrix spikes, deuterated monitoring compounds for accuracy, and blanks and method detection limits for sensitivity. The laboratory personnel must follow all the corrective actions required by the laboratory SOP or subcontract Statement of work (SOW).

PWCM/Generic QAPP Final Addendum No. 4 Surface Sediment Sampling co-located with Small Forage Range Fish Tissue Samples
Revision: 0 July 9, 2010
Page 46 of 55
A Lower Passaic River Oversight
QAPP Worksheet #28-i
QC Samples Table Matrix Sediment
Analytical Group Metals (no mercury)
Concentration Level Low
Sampling SOP(s) See Worksheet #21 – split of CPG samples
Analytical Method/SOP Reference SW-846 6010B/6020 or ILM05.4
Sampler’s Name TBD
Field Sampling Organization CDM
Analytical Organization As per FASTAC [DESA or EPA CLP Laboratory]
No. of Sample Locations See Worksheet #18 & 20
QC Sample: Frequency/Number Method/SOP QC
Acceptance Limits Corrective Action
Person(s) Responsible for
Corrective Action
Data Quality Indicator (DQI)
Measurement Performance Criteria
Sample splits and field duplicates
1 per 20 samples None Data assessor to inform PM if MPC is exceeded; address in data quality assessment
CDM ASC Precision ≤ 40% RPD (for results ≥ 5QL)
Temperature Blank 1 per cooler ≤ 6 degrees Celsius Note in laboratory narrative. CDM will use more coolant; check packing procedure
Laboratory Analyst Accuracy/bias ≤ 10 degrees Celsius for data validation
Preparation Blank 1 per 20 samples No constituent > CRQL Suspend analysis until source rectified; re-digest and reanalyze affected samples
Laboratory Analyst Accuracy/Sensitivity No result > CRQL
Laboratory duplicate 1 per 20 samples or each group
± 20% RPD** Investigate and correct; Flag outliers; Note in case narrative
Laboratory Analyst Precision ≤ 35% RPD if result >5CRQL
Spike
1 per 20 samples 75-125%R* Flag outliers Laboratory Analyst Accuracy 75-125%R*
Post-Digestion Spike
after any analyte (except Ag) fails spike %R
75-125%R Flag outliers Laboratory Analyst Accuracy 75-125%R
Interference Check Sample [ICP Analysis Only]
beginning, end and periodically during run (twice each 8 hr)
± 2 *CRQL of true value or ± 20% of true value, whichever is greater
Check calculations and instruments, reanalyze affected samples
Laboratory Analyst Sensitivity ± 2 * CRQL of true value or ± 20% of true value, whichever is greater
Laboratory Control Sample
1 per 20 samples Control limits established by EPA*
Suspend analysis rectify source; re-digest and reanalyze affected samples
Laboratory Analyst Accuracy 90-110%R
Notes:
The assigned laboratory also must perform the QA/QC sample analyses and meet all the measurement performance criteria that assess the analytical DQIs as specified in the method or laboratory SOP and or subcontract Statement of work (SOW) as applicable.

PWCM/Generic QAPP Final Addendum No. 4 Surface Sediment Sampling co-located with Small Forage Range Fish Tissue Samples
Revision: 0 July 9, 2010
Page 47 of 55
A Lower Passaic River Oversight
QAPP Worksheet #28-j QC Samples Table
Matrix Sediment
Analytical Group Methyl Mercury
Concentration Level Low
Sampling SOP(s) See Worksheet #21 – split of CPG samples
Analytical Method/SOP Reference EPA 1630
Sampler’s Name TBD
Field Sampling Organization CDM
Analytical Organization CDM Subcontract Laboratory-TBD
No. of Sample Locations See Worksheet #18 & 20
QC Sample: Frequency/Number Method/SOP QC
Acceptance Limits Corrective Action
Person(s) Responsible for
Corrective Action
Data Quality Indicator (DQI)
Measurement Performance Criteria
Sample splits and field duplicates
1 per 20 samples None Data assessor to inform PM if MPC is exceeded; address in data quality assessment
CDM ASC Precision ≤ 40% RPD (for results ≥ 5QL)
Temperature Blank 1 per cooler ≤ 6 degrees Celsius or frozen as applicable
Note in laboratory narrative. CDM will use more coolant; check packing procedure
Laboratory Analyst Accuracy/bias ≤ 10 degrees Celsius or per WS 19 and 37 for data validation
Preparation Blank 3 per 20 samples or batch
No constituent > QL Per laboratory SOP
Suspend analysis until source rectified; re-distill and reanalyze affected samples if results are <10 times the blank
Laboratory Analyst Accuracy/Sensitivity No result > 5*MDL
Laboratory duplicate 1 per 20 samples ≤ 35% RPD or ± 2 x PQL if sample < 5PQL or per laboratory SOP
Investigate and correct; Flag outliers; Note in case narrative. Multiple failures require re-distillation and reanalysis.
Laboratory Analyst Precision ≤ 35% RPD if result >5QL
Certified Reference Material or Ongoing Precision and Recovery Samples
1 per 20 samples or with each group of field samples
Per laboratory SOP Check calculations and instruments, reanalyze affected samples
Laboratory Analyst Accuracy 67-133%R of true value
MS/MSD 1 per 20 samples or with each group of field samples
Per laboratory SOP Investigate matrix effects and note in data narrative.
Laboratory Analyst Accuracy
65-135%R
Laboratory Analyst Precision RPD ≤35%
Notes:
The assigned laboratory also must perform the QA/QC sample analyses and meet all the measurement performance criteria that assess the analytical DQIs as specified in the method or laboratory SOP and or subcontract Statement of work (SOW) as applicable.

PWCM/Generic QAPP Final Addendum No. 4 Surface Sediment Sampling co-located with Small Forage Range Fish Tissue Samples
Revision: 0 July 9, 2010
Page 48 of 55
A Lower Passaic River Oversight
QAPP Worksheet #28-k QC Samples Table
Matrix Sediment
Analytical Group Total Mercury
Concentration Level Low
Sampling SOP(s) See Worksheet #21 – split of CPG samples
Analytical Method/SOP Reference EPA 1631
Sampler’s Name /Organization TBD /CDM
Analytical Organization CDM Subcontract Laboratory-TBD
No. of Sample Locations See Worksheet #18 & 20
QC Sample: Frequency/Number Method/SOP QC
Acceptance Limits Corrective Action
Person(s) Responsible for
Corrective Action
Data Quality Indicator (DQI)
Measurement Performance Criteria
Sample splits and field duplicates
1 per 20 samples None Data assessor to inform PM if MPC is exceeded; address in data quality assessment
CDM ASC Precision ≤ 40% RPD (for results ≥ 5QL)
Temperature Blank 1 per cooler ≤ 6 degrees Celsius or frozen as applicable
Note in laboratory narrative. CDM will use more coolant; check packing procedure
Laboratory Analyst Accuracy/bias ≤ 10 degrees Celsius or per WS 19 and 37 for data validation
Preparation Blank 3 per 20 samples or batch
Per laboratory SOP
Reanalyze. Suspend analysis until source rectified; re-distill and reanalyze affected samples if results are <10 times the blank
Laboratory Analyst Accuracy/Sensitivity No result > 5MDL
Laboratory duplicate 1 per 20 samples Per laboratory SOP
Investigate and correct; Flag outliers; Note in case narrative. Multiple failures require re-distillation and reanalysis.
Laboratory Analyst Precision ≤ 35% RPD if result >5CRQL
Certified Reference Material or Ongoing Precision and Recovery Samples
1 per 20 samples or with each group of field samples
Per laboratory SOP
Check calculations and instruments, reanalyze affected samples. Report in case narrative.
Laboratory Analyst Accuracy 70-130%R for OPR <20 RSD for IPR 75-125%R for CRM/IPR
MS/MSD 1 per 20 samples or with each group of field samples
Per laboratory SOP Investigate matrix effects and note in data narrative.
Laboratory Analyst Accuracy
70-130%R
Laboratory Analyst Precision RPD ≤35% (30 per method)
Notes:
The assigned laboratory also must perform the QA/QC sample analyses and meet all the measurement performance criteria that assess the analytical DQIs as specified in the method or laboratory SOP and or subcontract Statement of work (SOW) as applicable.

PWCM/Generic QAPP Final Addendum No. 4 Surface Sediment Sampling co-located with Small Forage Range Fish Tissue Samples
Revision: 0 July 9, 2010
Page 49 of 55
A Lower Passaic River Oversight
QAPP Worksheet #28-l QC Samples Table
Matrix Sediment
Analytical Group TOC
Concentration Level Low
Sampling SOP(s) See Worksheet #21 – split of CPG samples
Analytical Method/SOP Reference Lloyd Kahn
Sampler’s Name TBD
Field Sampling Organization CDM
Analytical Organization As per FASTAC [DESA or CDM Subcontract Laboratory]
No. of Sample Locations See Worksheet #18 & 20
QC Sample: Frequency/Number Method/SOP QC
Acceptance Limits Corrective Action
Person(s) Responsible for Corrective Action
Data Quality Indicator (DQI)
Measurement Performance Criteria
Preparation Blank per extract batch ≤ 100 mg/kg Investigate and correct ; recalibrate if still outlying
Laboratory Analyst Accuracy/Sensitivity No result > QL
Laboratory duplicate 1 per 20 samples or with each group of field samples
≤ 20% RPD
Investigate and correct; reanalyze affected samples. Flag outliers Document in case narrative
Laboratory Analyst Precision ≤ 25% RPD
Detection Limit Verification Standard
per batch ± 25% of true value Investigate and correct; reanalyze with affected samples.
Laboratory Analyst Accuracy ± 25% of true value
Sample splits and field duplicates
1 per 20 samples None
Data assessor to inform PM if MPC is exceeded; address in data quality assessment
CDM ASC Precision ≤ 40% RPD (for results ≥ 5QL)
Temperature Blank 1 per cooler ≤ 6 degrees Celsius
Note outlier in laboratory narrative. Inform CDM of failure and need for additional coolant; check packing procedure
Laboratory Analyst Accuracy/bias ≤ 10 degrees Celsius for data validation
Notes:
The assigned laboratory also must perform the QA/QC sample analyses and meet all the measurement performance criteria that assess the analytical DQIs as specified in the method or laboratory SOP and or subcontract Statement of work (SOW) as applicable.
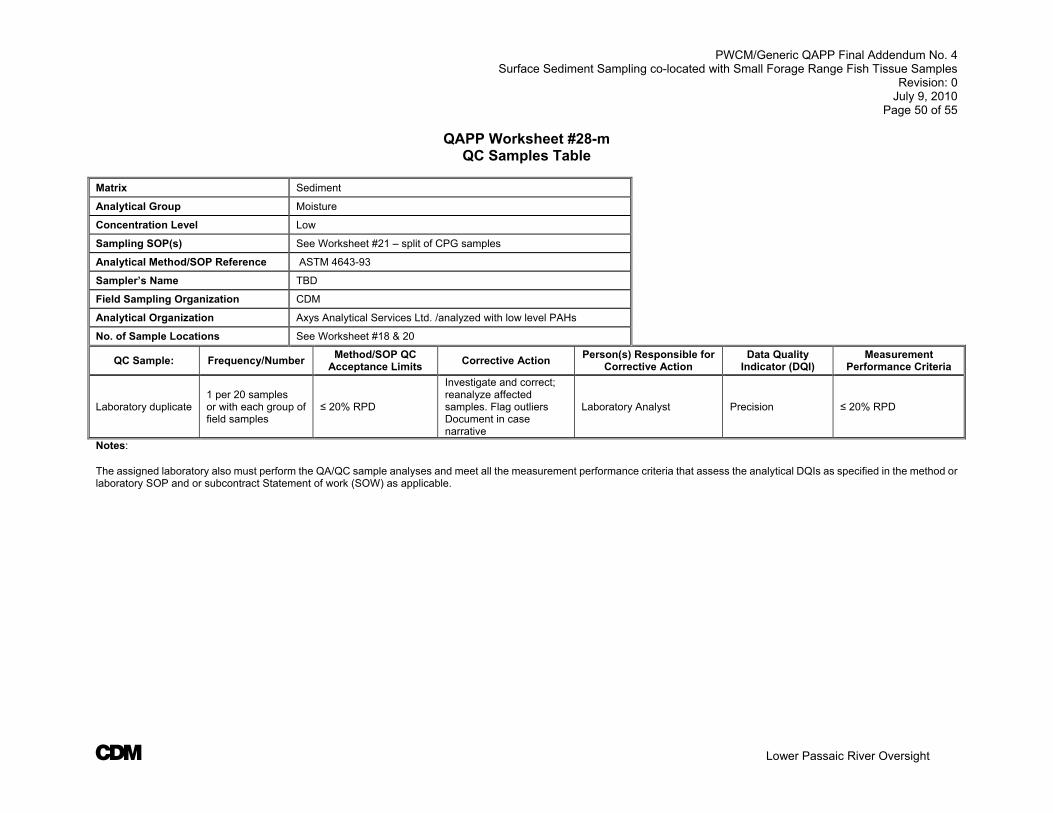
PWCM/Generic QAPP Final Addendum No. 4 Surface Sediment Sampling co-located with Small Forage Range Fish Tissue Samples
Revision: 0 July 9, 2010
Page 50 of 55
A Lower Passaic River Oversight
QAPP Worksheet #28-m QC Samples Table
Matrix Sediment
Analytical Group Moisture
Concentration Level Low
Sampling SOP(s) See Worksheet #21 – split of CPG samples
Analytical Method/SOP Reference ASTM 4643-93
Sampler’s Name TBD
Field Sampling Organization CDM
Analytical Organization Axys Analytical Services Ltd. /analyzed with low level PAHs
No. of Sample Locations See Worksheet #18 & 20
QC Sample: Frequency/Number Method/SOP QC
Acceptance Limits Corrective Action
Person(s) Responsible for Corrective Action
Data Quality Indicator (DQI)
Measurement Performance Criteria
Laboratory duplicate 1 per 20 samples or with each group of field samples
≤ 20% RPD
Investigate and correct; reanalyze affected samples. Flag outliers Document in case narrative
Laboratory Analyst Precision ≤ 20% RPD
Notes: The assigned laboratory also must perform the QA/QC sample analyses and meet all the measurement performance criteria that assess the analytical DQIs as specified in the method or laboratory SOP and or subcontract Statement of work (SOW) as applicable.

PWCM/Generic QAPP Final Addendum No. 4 Surface Sediment Sampling co-located with Small Forage Range Fish Tissue Samples
Revision: 0 July 9, 2010
Page 51 of 55
A Lower Passaic River Oversight
Worksheet 30 Analytical Services Table
Matrix Analytical
Group Concentration
Level
Sample Location/ ID
Numbers Analytical SOP
Validated Data Package
Turnaround Time
Laboratory/Data Validation
Laboratory/ Organization (Name and Address, Contact person and Telephone Number)
Backup Laboratory/Organization
(Name and Address, Contact person and Telephone
Number1
Sediment PCB Congeners Low
TBD
EPA Method 1668A or CBC01.2
65 days (35 days /30 days)2
EPA Headquarters Laboratory
CDM Subcontract
Sediment PCDD/PCDF Low EPA Method 1613B + DLM02.0/2.1 – Axys
SOP MLA-017
65 days (35 days /30 days)2
Axys Analytical Services Ltd.
TBD
Sediment Chlorinated Pesticides
Low EPA Method 1613B/ Axys SOP MLA-028
65 days (35 days for laboratory analysis/
30 days for data validation)2
Axys Analytical Services Ltd.
TBD
Sediment Percent Moisture Medium SM2540G/ Axys SOP
EGN007-07 see above
Axys Analytical Services Ltd.
TBD
Sediment PAH Low Axys SOP MLA-021 65 days
(35 days /30 days)2 Axys Analytical Services
Ltd. TBD
Sediment TCL SVOC Low SOM01.2 or SW846
Method 8270C 51 days
(21 days / 30 days) DESA EPA CLP
Sediment Metals Low SW846 Method
6010B/6020 51 days
(21 days / 30 days) DESA EPA CLP
Sediment Total Mercury
/Methyl mercury Low EPA Method 1630/1631
51 days (21 days / 30 days)
CDM Subcontract TBD
Sediment TOC Low Lloyd Kahn 51 days
(21 days / 30 days) DESA CDM Subcontract
Notes:
1: Sediment matrix refers to sediments split sample analyzed for sediment chemical concentration.
2: Subcontract laboratories will communicate with the ASC on split sample status and potential analytical difficulties (if any arise). With the approval of the ASC and Task Leader, the turn-around-time for the laboratory data package deliverable can be adjusted to account for re-analysis or additional quality control as necessary.

PWCM/Generic QAPP Final Addendum No. 4 Surface Sediment Sampling co-located with Small Forage Range Fish Tissue Samples
Revision: 0 July 9, 2010
Page 52 of 55
A Lower Passaic River Oversight
QAPP Worksheet #36 Validation (Steps IIa and IIb) Summary Table
Step IIa/IIb Matrix Analytical Group Concentration
Level Validation Criteria1, 3 Data Validator (title and
organizational affiliation)
IIa /IIb
Sediment
Chlorinated Pesticides –EPA 1613B Modified
Low-trace Region 2 - National Functional Guidelines* CDM
IIa /IIb PCB Congeners – CBC01.2 or EPA 1668A
Low Region 2 - Data Validation Guidelines SOP HW-46, rev 0 or National Functional Guidelines*
EPA Region 2
IIa /IIb PCDD/PCDF Congeners – EPA 1613B
Low EPA SOP HW-19 or 25, Validating PCDD/PCDF by HRGC/HRMS, Revision 1 or National Functional Guidelines*
CDM ASC, Scott Kirchner or designee
IIa /IIb PAH – Axys Laboratory SOP Low-trace National Functional Guidelines* CDM ASC, Scott Kirchner or designee
IIa /IIb SVOCs - SOM01.2 Modified or 8270C
Low Region 2 – Data Validation Guidelines SOP HW-35, rev 1 or National Functional Guidelines*
DESA or ESAT
IIa /IIb Metals - 6010B/6020 or ILM05.4 Low/Medium Region 2 - Data Validation Guidelines SOP HW-2, rev 13 or National Functional Guidelines*
DESA or ESAT
IIa /IIb Methyl mercury - EPA 1630 Trace National Functional Guidelines modified by QAPP Worksheets #12,15,19 and 24
CDM ASC, Scott Kirchner or designee
IIa /IIb Total Mercury - EPA 1631 Trace National Functional Guidelines modified by QAPP Worksheets 12,15,,19 and 24
CDM ASC, Scott Kirchner or designee
IIa /IIb TOC - Lloyd Kahn Low DESA validation SOP or CDM 029A SOP modified by QAPP Worksheets #12,15,,19 and 24
DESA or CDM ASC, Scott Kirchner or designee
Notes:
1. Results will be validated if analyzed by a subcontract laboratory by the process of data verification and assessment utilizing the laboratory QC summaries.
2. All validation procedures will utilize the measurement performance criteria in the QAPP and any additional method requirements.

PWCM/Generic QAPP Final Addendum No. 4 Surface Sediment Sampling co-located with Small Forage Range Fish Tissue Samples
Revision: 0 July 9, 2010
Page 53 of 55
A Lower Passaic River Oversight
QAPP Worksheet #37
Usability Assessment
An Oversight Summary Report and Data Quality Summary Report will be prepared by CDM personnel. Frank Tsang, Task Order Manager, will be responsible for its content and for assigning this task to CDM personnel. The data comparability review and usability assessment will be conducted on validated data. The effectiveness of control actions will be evaluated during the laboratory review of the data, data validation and data evaluation and data quality assessment process. Data information will be documented in the laboratory narrative, data validation report and in the Data Comparability Report. The report will include an overall assessment of the CPG’s analytical data using the results of the split sampling and field oversight including the field oversight observations of deficiencies and compliance; and an assessment of the split sampling data quality. The following items will be assessed for CDM split samples and conclusions drawn based on their results:
Precision – Results of laboratory duplicates will be assessed during data validation and data will be qualified according to the data validation procedures cited on Worksheet #36. Split samples will be compared by matrix using the relative percent difference (RPD) for each pair of results reported above quantitation limits (QL) or for organic and inorganic analyses respectively. RPD acceptance criteria of less than or equal those listed in this QAPP will be used to access sampling precision. Absolute difference will be used when one or both results are at or below the QL. An absolute difference of less than five times the QL will be the acceptance criteria. A discussion summarizing the results of laboratory precision and any limitations on the use of the data will be described in the report.
Accuracy/Bias Contamination – Results for all laboratory blanks will be assessed as part of the data validation. During the validation process, the validator will qualify the data following the procedures described on Worksheet #36. A discussion summarizing the results of laboratory accuracy and bias based on contamination will be presented and any limitations on the use of the data will be described in the report.
Representativeness –The representativeness of the survey data will be evaluated based on the ability to implement the surface sediment sampling as written in the QAPP. A determination will be made based on the observations completed during the surveys, whether the data results accurately represent the sediment concentrations in the study area during the summer benthic survey, and whether the results are comparable with those made in previous events.
Comparability –The results of this oversight will be used in conjunction with the CPG’s data to support the investigation results. The data will be handled, analyzed and reported in a manner that is comparable to the CPG’s data set. The RPD between CDM’s and the CPG’s data will be calculated.
Completeness – A completeness check will be performed on the split sample data generated by the laboratories. Completeness will be determined based on whether all CPG planned (or modified) sampling locations were sampled at the pre-determined frequencies and the obtained data set compared to the project completeness goal of 90 percent. A discussion summarizing the results of project completeness and any limitations on the use of the data will be described in the report.
PWCM/Generic QAPP Final Addendum No. 4 Surface Sediment Sampling co-located with Small Forage Range Fish Tissue Samples
Revision: 0 July 9, 2010
Page 54 of 55
A Lower Passaic River Oversight
For sampling, completeness will be calculated as the number of samples collected and analyzed divided by the number of planned for collection. For each analyte, completeness will also be calculated as the number of data points that meet measurement performance criteria divided by the total number of data points for that analyte. A discussion summarizing the results of project completeness and any limitations on the use of the data will be described in the report.
The results will be presented in text of the Data Comparability Report. Data gaps will be evaluated if requested by USACE/EPA. The report will discuss the completeness of the planned and collected data and the affect on the data objective of evaluating the accuracy of the CPG’s data.
Sensitivity – Data results will be compared to project action limits provided on Worksheet #15. A discussion summarizing any conclusions about sensitivity of the analyses will be presented, and any limitations on the use of the data will be described in the report.
Reconciliation – The PQLGs presented in Worksheet #12 will be examined to determine if the objectives were met. This examination will include a combined overall assessment of the results of each analysis pertinent to an objective. Each analysis will first be evaluated separately in terms of major impacts observed from data validation, data quality indicators and measurement performance criteria assessments. Based on the results of these assessments, the quality of the data will be determined. Based on the quality determined, the usability of the data for each analysis will be determined. Based on the combined usability of the data from all analyses for an objective, it will be determined if the PQLG was met and whether project goals were achieved. As part of the reconciliation of each objective, conclusions will be drawn and any limitations on the usability of any of the data will be described.
The following equations will be used:
1. To calculate split sample precision: RPD = 100 * 2 |X1 - X2 | / (X1 + X2)
where X1 and X2 are the reported concentrations for each duplicate or replicate
2. To calculate split data completeness:
% Completeness = V/n * 100 - where V= number of measurements judged valid; n = total number of measurements made and
% Completeness = C/x * 100 - where C= number of samples collected; x = total number of measurements planned
The investigation results will be presented in table and figures and in the text of the Data Comparability Report. Data gaps will be evaluated if requested by USACE/EPA. The report will discuss the completeness of the planned and collected data and the affect on the data objective of evaluating the accuracy of the CPG’s data.
PWCM/Generic QAPP Final Addendum No. 4 Surface Sediment Sampling co-located with Small Forage Range Fish Tissue Samples
Revision: 0 July 9, 2010
Page 55 of 55
A Lower Passaic River Oversight
References: Malcolm Pirnie and Battelle Duxbury Operations. 2009. Oversight Quality Assurance Project Plan. Biological Sampling, Community Surveys, and Toxicity and Bioaccumulation Testing. August. Windward Environmental. 2009. Lower Passaic River Restoration Project. Quality Assurance Project Plan. Final Surface Sediment Chemical Analyses and Benthic Invertebrate Toxicity and Bioaccumulation Testing”. Revision 0. October 8. Windward Environmental. 2010. Lower Passaic River Restoration Project. Lower Passaic River Study Area RI/FS. Collection of Surface Sediment Samples Co-located with Small Forage Fish Tissue Samples. Addendum [2] to the QAPP. Surface Sediment and Benthic Invertebrate Toxicity and Bioaccumulation Testing. Draft. May 12.

Appendix G
Figure 1 Excerpted from CPG’s Benthic QAPP
Addendum No. 2: Collection of Surface Sediment
Sampling co-located with the Small Forage Fish Tissue
Samples
during the Summer 2010
Benthic Invertebrate Community Surveys

0 0.25 0.5
Miles
0 0.5 1
Kilometers
Freshwater river zone
Estuarine river zone
Seco nd River
LPRC9A
LPRC9B
LPRC10A
RM 10
RM 9
RM 9.5
RM 8
RM 8.5
RM 10.5
Reach 5
Reach 4
Reach 6
Reach 5
Reach 4
Reach 3
LPRC7A
LPRC8A
LPRC7B
LPRC6A
RM 7
RM 7.5
RM 6.5
RM 5.5
RM 6 T
hird River
Reach 7
Reach 6
LPRC13BLPRC13A
LPRC14A
LPRC11C
LPRC11B
LPRC12B
LPRC12A
LPRC11A
RM 11
RM 13
RM 13.5
RM 11.5
RM 12.5
RM 12
Created by LSM 4/5/10, map 4165; W:\Projects\06-58-01 Passaic RI\Data\GIS\Analysis_and_Maps\Benthic2010
Saddle
River
Dundee Canal
Dundee Dam
Reach 8
Reach 7
LPRC17C
LPRC17B
LPRC16A
LPRC15A
LPRC17A
LPRC14B
RM 17R
M 15
RM 16.5
RM 16
RM 15.5
RM
14.
5
RM 14
RM 13.5
LPRC5B
LPRC5A
LPRC4B
LPRC4A
LPRC4D
LPRC4C
LPRC3A
LPRC3B
LPRC2B
Reach
2
Reach
1 RM
2
RM 3
RM 2.5
RM 4
RM
5
RM 3.5
RM 4.5
Reach 3
Reach 2
Newark Bay
Morris Canal
LPRC3ALPRC3B
LPRC2B
LPRC2A
LPRC1C
LPRC1B
LPRC1A
Reach 2
Reach 1
RM 0.5
RM 0
RM 1
RM 1.5
RM 2
RM
2.5
Mapframe
positions
S econd R.
Third R.
SDundee Dam
Newark
Bay
12
3
6
5
4
Estuarine
Freshwater
2 ±
±
± ± ± ± 1 3 4 5 6
±
LLCWindWardenvironmental
Proposed sample locationAlternate locations identified by USEPA/PASampling reach boundary
Mudflats and gravel flats
River mile
LPRSAEstuarine river sectionFreshwater river sectionUpper Passaic River or tributary DRAFT
Mudflat and gravel flat locations are determined as those areas where the river bottom slope is ≤6° and the depth is ≥-4.5 ft NGVD29 (i.e. -2 ft ft MLLW). LPRSA bathymetry is taken from the 2007 bathymetric survey conducted by Gahagan & Bryant Associates, Inc. (GBA), except for the area outside Kearny Point; bathymetry in the southeast part of this area is estimated based on NOAA data. In the GBA survey area, multibeam data are used where available and single-beam data are used where they are not.
Figure 1. Potential distribution of co-located sediment sampling locations for small forage fish collection
□
• D D D
D
Top Related