


Languages
Pages
Legal


Purchasing Wine in the Information Age:The Role of Quick Response (QR) Codes
Lindsey HigginsMitch Wolf
Marianne McGarry Wolf
California Polytechnic State UniversitySan Luis Obispo, CA
Selected paper prepared for the 2013 AAWE conference in Stellenbosch, South Africa

Motivation
Wine as an experiential good
Wine as information laden Implications for purchase decisions
Cooper-Martin (1991)Thach (2008)
Top purchase decision criteria:
Prior tasting experience

Motivation
Technology empowers consumers

Motivation

Motivation
Quick Response (QR) Codes Developed as supply chain strategy tool

Motivation
Comscore (2012) QR code use in Europe increased 96% from 2011 to 2012
17.4 million users in July of 2012 3 out of 4 users scanned the QR code for product information October of 2011, 20.4 million Americans used their smart
phone to scan a QR code for product information
Okazaki and Barwise (2011) QR codes as an area of emerging research and growth in
retailing

QR Codes Information Purchase Decision
• Product knowledge is key in consumer decision-making (Raju, Lonial, and Mangold, 1993)
• Information search as the primary method of risk reduction in the wine purchase decision (Mitchell and Greatorex, 1989)
• One step closer to interactive marketing (Shin, Jung, and Chang, 2012)
• Younger wine consumers?• purchase out of convenience• little wine knowledge• more likely to be engaged
electronically (Lecat and Pelet, 2011)


Objectives
Explore the role of QR codes in the wine purchase decision desirability of QR codes on wine labels
Determine the segment of consumers most likely to respond to QR codes wine consumption behavior demographics wine knowledge other sources of wine information

Methods
25 question survey designed demographics, reported behavior QR code concept exposure
Administered during the fall of 2012 to wine consumers nationally recognized test market location intercept approach

The hands that tend our vineyards are the same that craft our wine, a rare tradition in today’s wine industry. For three generations our family’s vineyard-to-bottle ideology has allowed us to create lively, approachable wines with plenty of character.
$11.99 $9.99
Our back label has a QR code.


Methods
11 point purchase intent scale (Juster, 1966) Verbal anchors and probability estimates

Results: Demographics
631 usable responses
52% Male

Results: Features
11 features
5 point scale Extremely desirable (5) to Not desirable at all (1)
The following is a list of features people may look for when purchasing wines. Please indicate the
desirability of each feature to you when you purchase wine.

Results: Features
Feature % Extremely / Very Desirable Feature % Extremely/
Very DesirableGood value for the money 85.3% Screwcap closure 11.4%
Locally produced 52.2% Organically grown 31.9%Grown in an enviro. friendly way 47.1% Sustainably grown 33.9%
Recommended by friends 73% Grown using biotechnology 11.9%
Varietal I like 79.3% From a family owned winery 46.9%
Feature % Extremely / Very Desirable % Not Desirable at all
QR Code 7.4% 43.9%

Results: Concept Exposure
50% of respondents said there was at least 60 chances in 100 they would buy the new wine

Results: Concept Exposure
Respondents indicated they were likely to purchase 11.33 bottles of wine in the next 3 months
If available, respondents likely to purchase 3.44 bottles of the concept wine in the next 3 months

Results: Concept QR
Increase purchase interest?
38% reported that it definitely did not increase their purchase interest
31.2% reported that it probably did not increase their purchase interest

Results: QR Increase Segment
Reported influence of QR code Few demographic differences
No difference in: Age Beer consumption Wine consumption or spending Gender Relationship status Education Employment Income
QR increased purchase interest
11.6%
QR did not increase purchase interest
88.4%
VS.

Results: QR Increase Segment
Reported influence of QR code Few demographic differences No differences in closure preferences More likely to regularly use apps
QR Increased purchase interest
11.6%
QR did not increase purchase interest
88.4%
VS.

Results: QR Segments and Features
Feature QR likely to Increase
QR not likely to increase P-value
QR Code 3.08 1.8 .000
Locally produced 3.88 3.51 .004
Produced in an enviro. friendly way 3.75 3.31 .001
Organically grown 3.45 2.96 .000Certified Sustainable 3.38 3.00 .005Biotech used 2.62 2.37 .042Family owned 3.71 3.34 .006
5= Extremely desirable, 4=Very desirable, 3=Somewhat desirable, 2=Not very desirable, 1= Not desirable at all

Results: QR Segments and Info
Info Source QR likely to Increase
QR not likely to increase P-value
Google 56% 35% .000
Facebook 33% 21% .024
Youtube 14% 5% .006Facebook ads 8% 2% .002Blogs 16% 7% .003
Which of the following do you regularly use to get news or find information about wine?
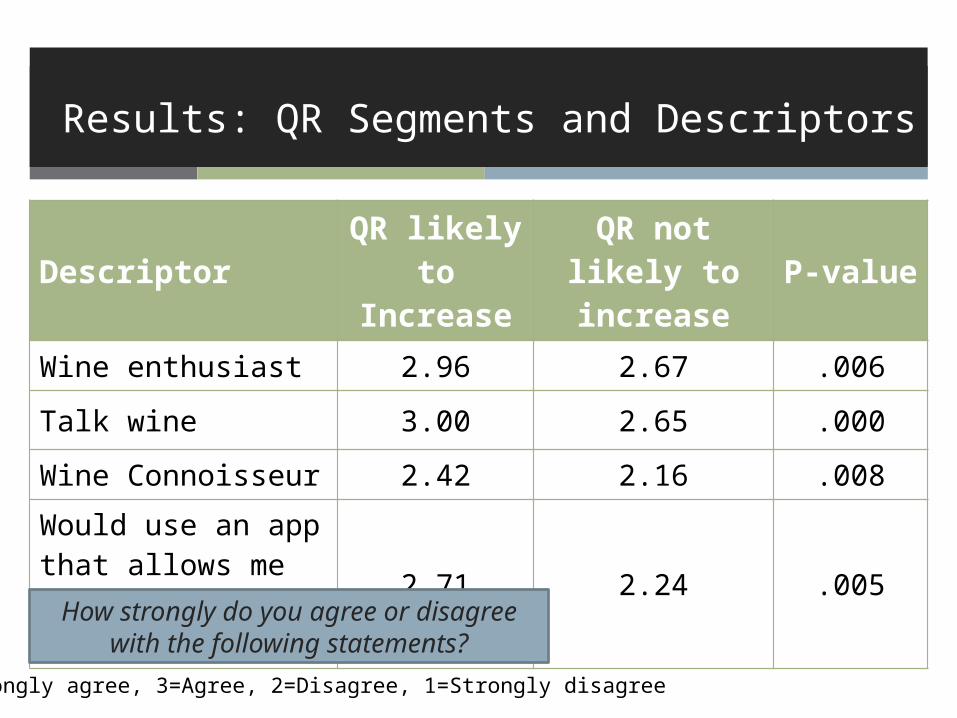
Results: QR Segments and Descriptors
Descriptor QR likely to Increase
QR not likely to increase P-value
Wine enthusiast 2.96 2.67 .006
Talk wine 3.00 2.65 .000
Wine Connoisseur 2.42 2.16 .008Would use an app that allows me to instantly purchase wine
2.71 2.24 .005
4=Strongly agree, 3=Agree, 2=Disagree, 1=Strongly disagree
How strongly do you agree or disagree with the following statements?

Conclusions
Little importance to most No differences by age Marketers may be more fond of QR codes than consumers
Some differences related to information Interested in production characteristics Interested in learning more Interested in talking about wine
QR code becomes very
useful tool

Conclusions
Targeted Group
Learn More About Wine
Production CharacteristicsTalk About Wine
2%
13%
9%
.6%
.6%
2% 2%
.6% of 631 consumers
= 4 consumers

Concluding Remarks
Questions
Contact information:
Lindsey [email protected]
Marianne McGarry [email protected]
Top Related