


Languages
Pages
Legal


Q1 2018 Supplemental Financial Information February 1, 2018
Q1 2018 Supplemental Financial Information 1
This presentation may contain "forward-looking statements" within the meaning of the Private Securities
Litigation Reform Act of 1995. These statements relate to future events or our future financial
performance. In some cases, you can identify forward-looking statements by terminology such as
“anticipate,” “believe,” “continue,” “could,” “estimate,” “expect,” “intend,” “may,” “might,” “plan,” “potential,”
“predict,” “should” or “will,” or the negative of such terms or other comparable terminology. These forward-
looking statements are only predictions based on the current intent and expectations of the management
of Esterline, are not guarantees of future performance or actions, and involve risks and uncertainties that
are difficult to predict and may cause Esterline’s or its industry’s actual results, performance or
achievements to be materially different from any future results, performance or achievements expressed
or implied by the forward-looking statements. Esterline’s actual results and the timing and outcome of
events may differ materially from those expressed in or implied by the forward-looking statements due to
risks detailed in Esterline’s public filings with the Securities and Exchange Commission including its most
recent Annual Report on Form 10-K.
This presentation also contains references to non-GAAP financial information subject to
Regulation G. The reconciliations of each non-GAAP financial measure to its comparable GAAP measure
as well as further information on management’s use of non-GAAP financial measures are included in
Esterline’s press release dated February 1, 2018, included as Exhibit 99.1 to Form 8-K filed with the SEC
on the same date, as well as in this presentation.
Q1 2018 Supplemental Financial Information
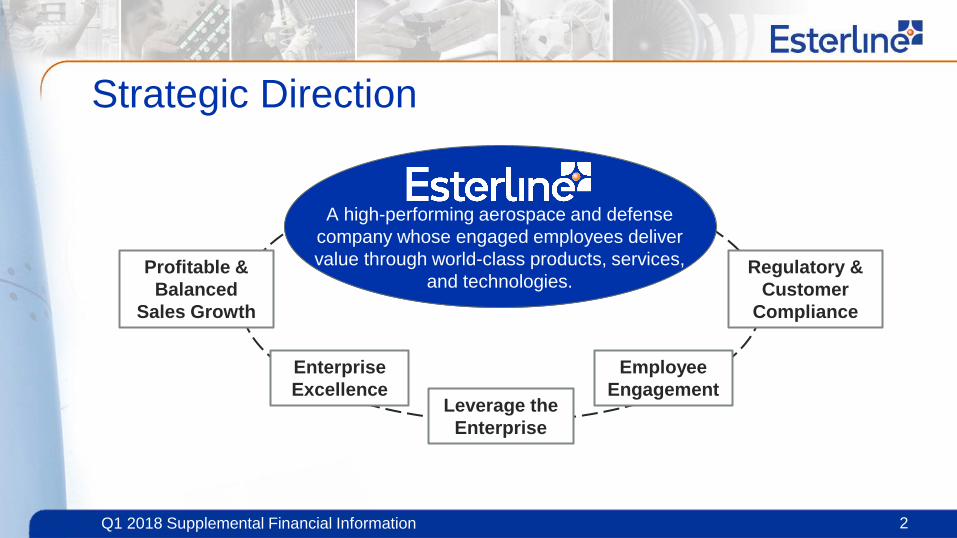
Strategic Direction
2
A high-performing aerospace and defense
company whose engaged employees deliver
value through world-class products, services,
and technologies. Profitable &
Balanced
Sales Growth
Enterprise
Excellence Leverage the
Enterprise
Employee
Engagement
Regulatory &
Customer
Compliance
Q1 2018 Supplemental Financial Information
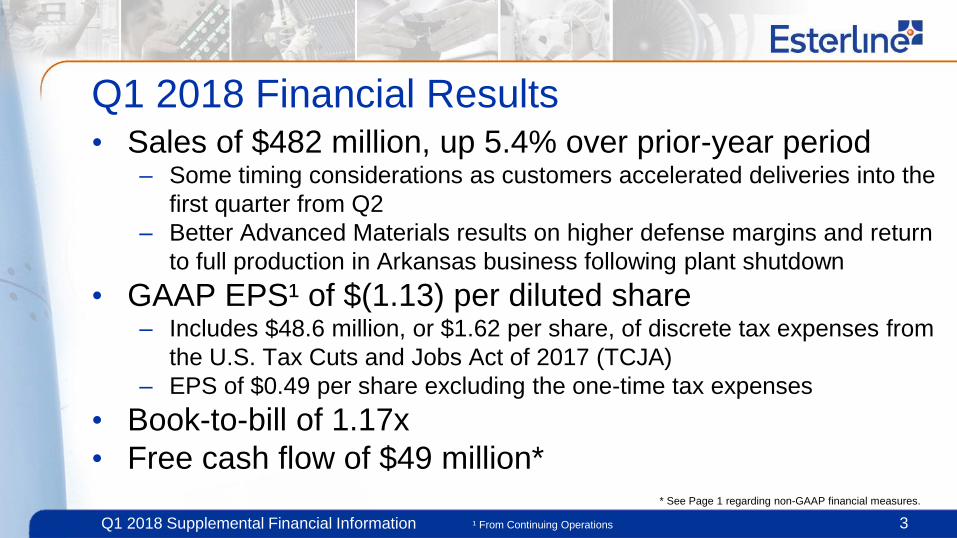
Q1 2018 Financial Results • Sales of $482 million, up 5.4% over prior-year period
– Some timing considerations as customers accelerated deliveries into the
first quarter from Q2
– Better Advanced Materials results on higher defense margins and return
to full production in Arkansas business following plant shutdown
• GAAP EPS¹ of $(1.13) per diluted share – Includes $48.6 million, or $1.62 per share, of discrete tax expenses from
the U.S. Tax Cuts and Jobs Act of 2017 (TCJA)
– EPS of $0.49 per share excluding the one-time tax expenses
• Book-to-bill of 1.17x
• Free cash flow of $49 million*
3 ¹ From Continuing Operations
* See Page 1 regarding non-GAAP financial measures.
Q1 2018 Supplemental Financial Information
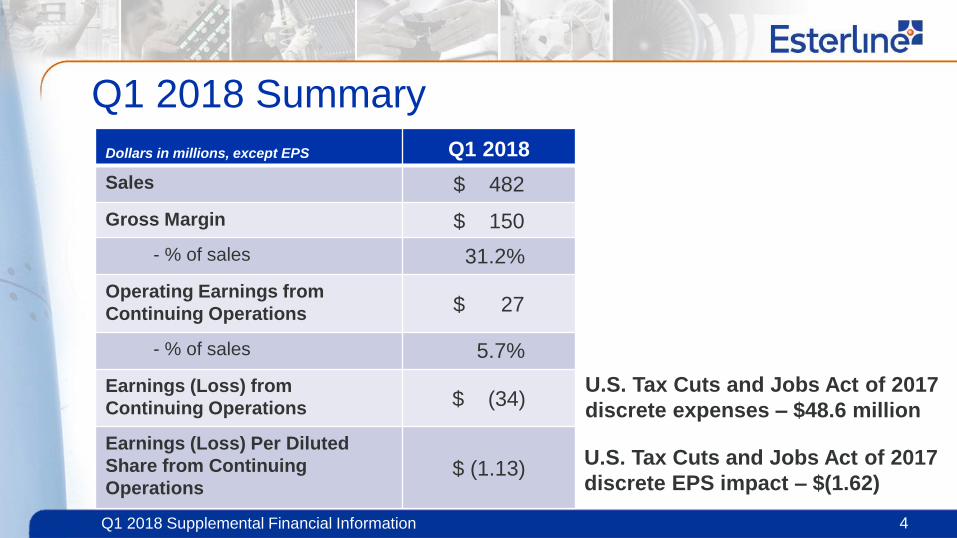
Q1 2018 Summary
4
Dollars in millions, except EPS Q1 2018
Sales $ 482
Gross Margin $ 150
- % of sales 31.2%
Operating Earnings from
Continuing Operations $ 27
- % of sales 5.7%
Earnings (Loss) from
Continuing Operations $ (34)
Earnings (Loss) Per Diluted
Share from Continuing
Operations $ (1.13)
U.S. Tax Cuts and Jobs Act of 2017
discrete expenses – $48.6 million
U.S. Tax Cuts and Jobs Act of 2017
discrete EPS impact – $(1.62)
Q1 2018 Supplemental Financial Information
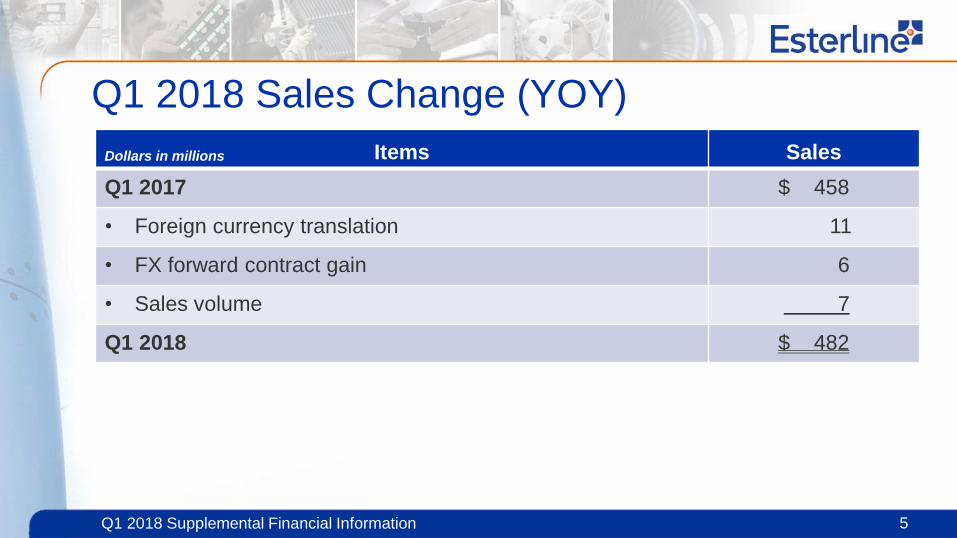
Q1 2018 Sales Change (YOY)
Items Sales
Q1 2017 $ 458
• Foreign currency translation 11
• FX forward contract gain 6
• Sales volume 7
Q1 2018 $ 482
Dollars in millions
5
Q1 2018 Supplemental Financial Information
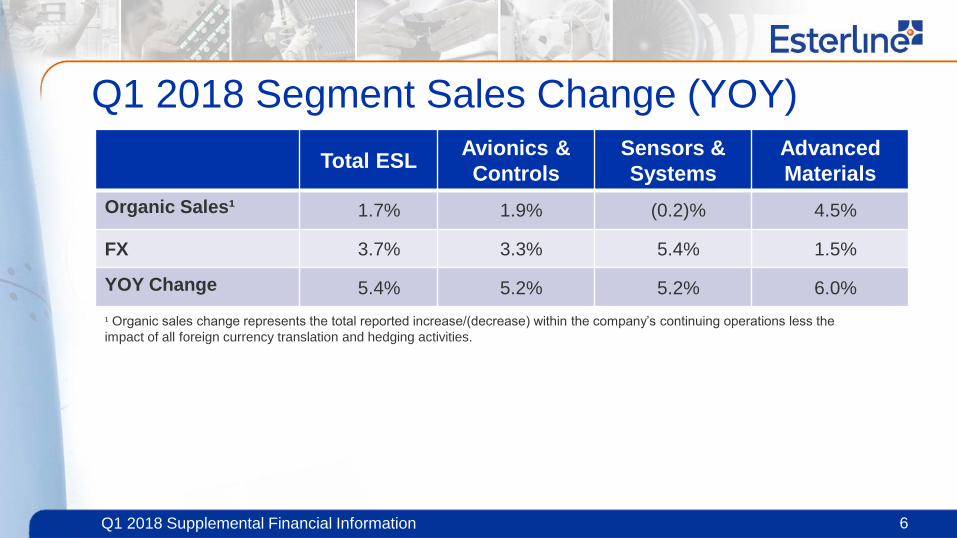
Q1 2018 Segment Sales Change (YOY)
Total ESL Avionics &
Controls
Sensors &
Systems
Advanced
Materials
Organic Sales¹ 1.7% 1.9% (0.2)% 4.5%
FX 3.7% 3.3% 5.4% 1.5%
YOY Change 5.4% 5.2% 5.2% 6.0%
¹ Organic sales change represents the total reported increase/(decrease) within the company’s continuing operations less the
impact of all foreign currency translation and hedging activities.
6
Q1 2018 Supplemental Financial Information
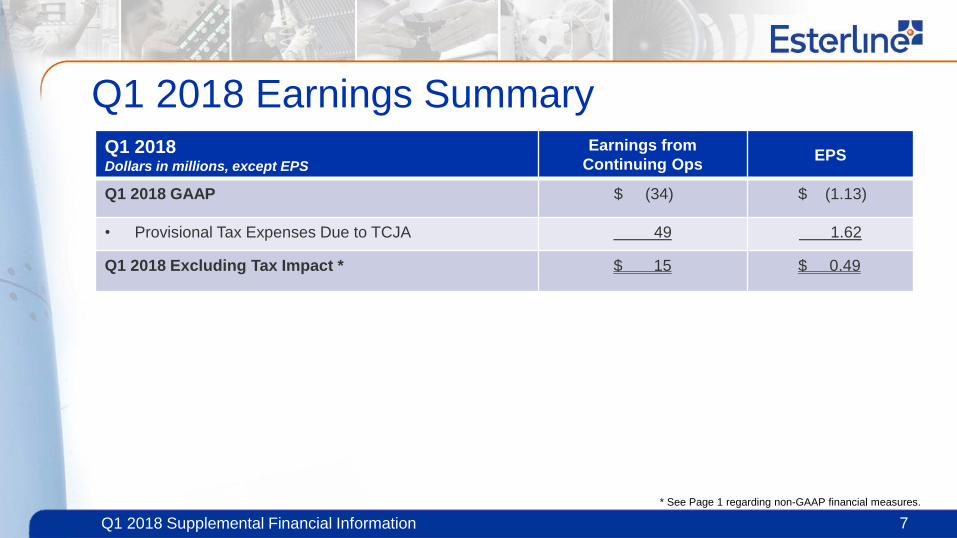
Q1 2018 Earnings Summary
7
* See Page 1 regarding non-GAAP financial measures.
Q1 2018 Dollars in millions, except EPS
Earnings from
Continuing Ops EPS
Q1 2018 GAAP $ (34) $ (1.13)
• Provisional Tax Expenses Due to TCJA 49 1.62
Q1 2018 Excluding Tax Impact * $ 15 $ 0.49
Q1 2018 Supplemental Financial Information
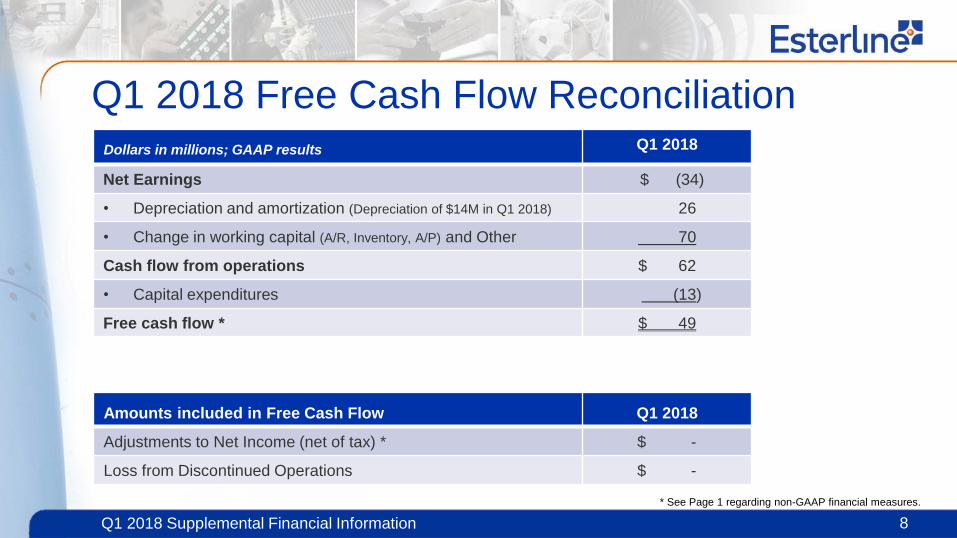
Q1 2018 Free Cash Flow Reconciliation
8
Q1 2018
Net Earnings $ (34)
• Depreciation and amortization (Depreciation of $14M in Q1 2018) 26
• Change in working capital (A/R, Inventory, A/P) and Other 70
Cash flow from operations $ 62
• Capital expenditures (13)
Free cash flow * $ 49
Dollars in millions; GAAP results
Amounts included in Free Cash Flow Q1 2018
Adjustments to Net Income (net of tax) * $ -
Loss from Discontinued Operations $ -
* See Page 1 regarding non-GAAP financial measures.
Q1 2018 Supplemental Financial Information
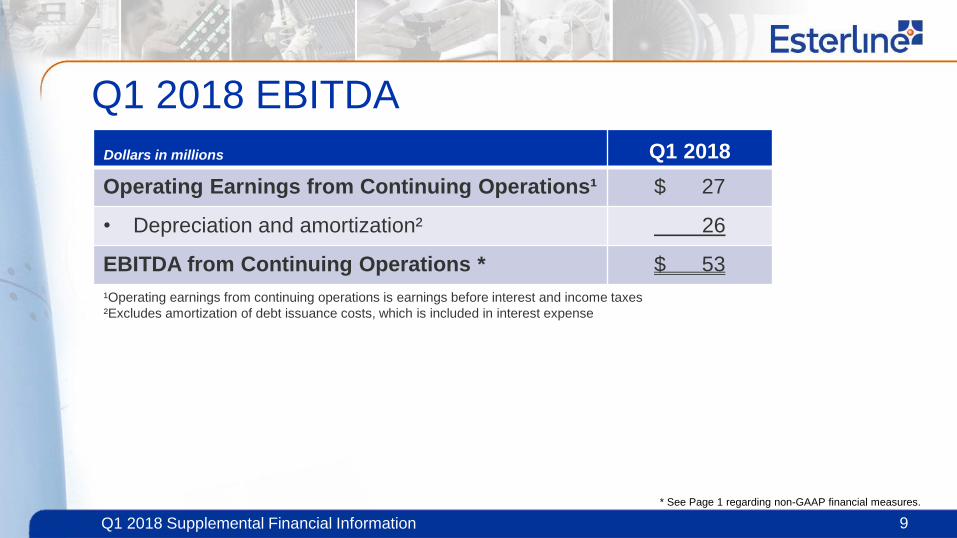
Q1 2018 EBITDA
9
Q1 2018
Operating Earnings from Continuing Operations¹ $ 27
• Depreciation and amortization² 26
EBITDA from Continuing Operations * $ 53
Dollars in millions
¹Operating earnings from continuing operations is earnings before interest and income taxes
²Excludes amortization of debt issuance costs, which is included in interest expense
* See Page 1 regarding non-GAAP financial measures.
Q1 2018 Supplemental Financial Information
0%
20%
40%
Q1 Q2 Q3 Q4
FY 2018 U.S. Tax Rate (Excluding one-time items)
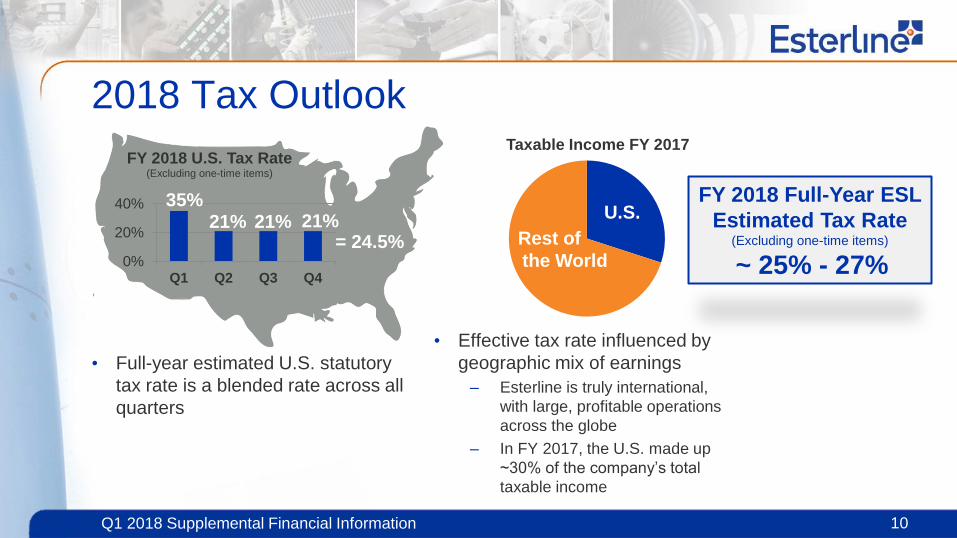
2018 Tax Outlook
10
FY 2018 Full-Year ESL
Estimated Tax Rate (Excluding one-time items)
~ 25% - 27%
21% 21% 21% 35%
• Full-year estimated U.S. statutory
tax rate is a blended rate across all
quarters
= 24.5%
Taxable Income FY 2017
Rest of
the World
U.S.
• Effective tax rate influenced by
geographic mix of earnings
– Esterline is truly international,
with large, profitable operations
across the globe
– In FY 2017, the U.S. made up
~30% of the company’s total
taxable income
Q1 2018 Supplemental Financial Information
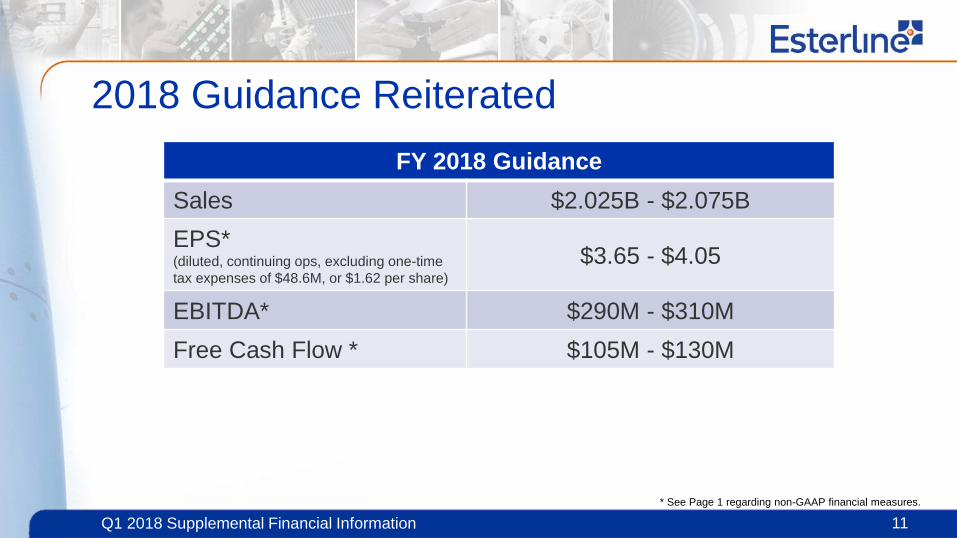
2018 Guidance Reiterated
FY 2018 Guidance
Sales $2.025B - $2.075B
EPS* (diluted, continuing ops, excluding one-time
tax expenses of $48.6M, or $1.62 per share)
$3.65 - $4.05
EBITDA* $290M - $310M
Free Cash Flow * $105M - $130M
11
* See Page 1 regarding non-GAAP financial measures.
Q1 2018 Supplemental Financial Information
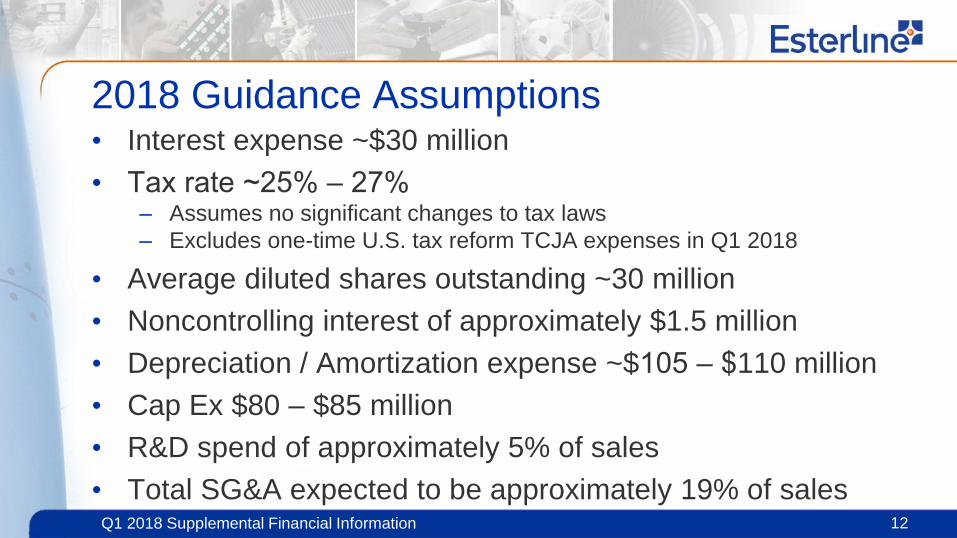
2018 Guidance Assumptions • Interest expense ~$30 million
• Tax rate ~25% ‒ 27% – Assumes no significant changes to tax laws
– Excludes one-time U.S. tax reform TCJA expenses in Q1 2018
• Average diluted shares outstanding ~30 million
• Noncontrolling interest of approximately $1.5 million
• Depreciation / Amortization expense ~$105 ‒ $110 million
• Cap Ex $80 ‒ $85 million
• R&D spend of approximately 5% of sales
• Total SG&A expected to be approximately 19% of sales 12
Q1 2018 Supplemental Financial Information
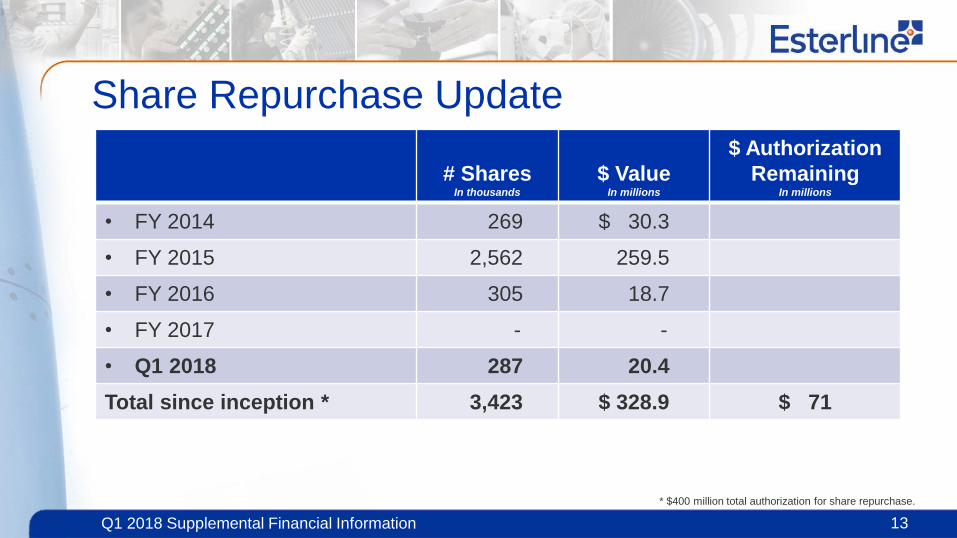
Share Repurchase Update
# Shares In thousands
$ Value In millions
$ Authorization
Remaining In millions
• FY 2014 269 $ 30.3
• FY 2015 2,562 259.5
• FY 2016 305 18.7
• FY 2017 - -
• Q1 2018 287 20.4
Total since inception * 3,423 $ 328.9 $ 71
* $400 million total authorization for share repurchase.
13
Top Related