


Languages
Pages
Legal


PUBLIC TRANSPORT ORGANIZATIONAL MODELS:
ROLES FOR THEROLES FOR THEPUBLIC and PRIVATE SECTORS
Outline • Organizational Models • UK B UK Bus IInddusttry EExperiience • US Transit Industry • Prospects for the future • Public/Private Roles in Rail SystemsPublic/Private Roles in Rail Systems

Transit vs Other Modes
Key differences between urban public transport and examples of fairly recent US deregulation:
• US transit has been operated by public sector for past 3040 years
• US transit has been operated at a deficit for past 30-40 years
1.201, Lecture 19 Fall 2009
2
US vs Europe
• US has been the leader in deregulation outside transit
• UK,, and now Europpe,, the leader in restructuringg transit organizations
1.201, Lecture 19 Fall 2009
3

Organizational Models
• Unregulated/Deregulated
• Reggulated Comppetition
• Threatened Competition
• Private Monopoly
•• Public MonopolyPublic Monopoly
• Contracting Out
1.201, Lecture 19 Fall 2009
4

Six Organizational Models
MODELS
Unregulated Regulated
Competition Threatened Competition
Private Monopoly
Public Monopoly
Contracting Out
Regulation Minimum Yes Yes* Yes Yes Yes*
Financing PR PR PR PR PU PR
F U N
Planning PR PU & PR PU & PR PR & PU PU PU
Ownership PR PR PR PR PU PR (or PU)
C T I
Operation PR PR PR PR PU PR
Maintenance PR PR PR PR PU PR
I O N SS
* The model is regulated in the form of contracts PU: Public Sector; PR: Private Sector PU: Public Sector; PR: Private Sector
. 1.201, Lecture 19
Fall 2009 5
UK Experience with Bus Industry Restructuring
• Background • Bus Deregulation outside London
• London strategygy • Results to date
1.201, Lecture 19 Fall 2009
6

t
Background
• Prior to mid-1980s, UK local bus industry broadly comparable to US transit industry:
bli hi l l l• public ownership at local levell • heavily subsidized • sllowlly ddecli liniing rid idershiphi • little innovation in technology, service, or management • little responsiveness to public needs or concerns little responsiveness to public needs or concerns
• Buses played a larger role than in US because of lower car ownershihip llevells and hi d highher car operatiting costts
1.201, Lecture 19 Fall 2009
7

Bus Deregulation Outside London (1986)
Basic premises behind bus deregulation:
• deregulation would produce a competitive market
• competition would substantially reduce costs
• a comppetitive market would impprove resource allocation
• there would be no significant negative side effects
1.201, Lecture 19 Fall 2009
8

•
Basic Elements of UK Bus Deregulation
•• Bus markets were divided between commercial and non Bus markets were divided between commercial and noncommercial, with the following definitions and rules for each:
CommercialCommercial • Defined as any service that an operator is prepared to offer
with the only government support being
• concessionary fares reimbursement • fuel tax rebate
• Services are registered including the route and timetable Services are registered including the route and timetable, andand changes become effective after 6 weeks notice
• Fares can be changed with no prior notice • Unrestricted entry and exit from the market • Known as "Competition In the Market”
1.201, Lecture 19 Fall 2009
9
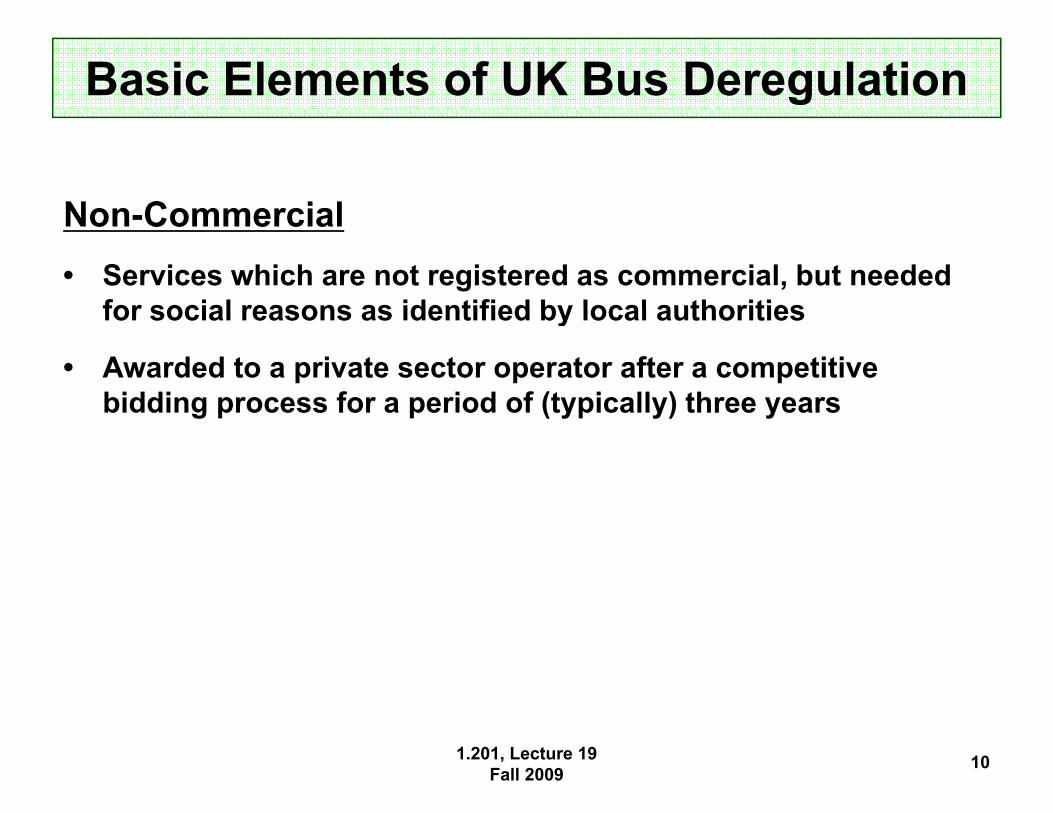
Basic Elements of UK Bus Deregulation
NonNon-CommercialCommercial • Services which are not registered as commercial, but needed
for social reasons as identified by local authoritiesforsocial reasons as identified by local authorities
• Awarded to a private sector operator after a competitive bidding process for a period of (typically) three yearsbidding process for a period of (typically) three years
1.201, Lecture 19 Fall 2009
10
Public Transport Authority Reorganization
• As a transitional strategy, public transport authorities were to be "corporatized," i.e., held at arm's length from governmentarm s length from government
• Could receive subsidy only as a result of success in a competiti e bidding processacompetitive bidding process
• Eventually they were to be privatized
• These large operations were not broken up into smaller competitive units
1.201, Lecture 19 Fall 2009
11
not introduced in London because of
London Strategy
• Deregulation not introduced in London because ofDeregulation concerns about: • the effects of free entry on congestion in Central London • rail system interaction effects
• London Transport (now Transport for London) opted to retain control over all planning functions but to move to privatization through competition for i t l i f th L d b t kincremental pieces of the London bus network
• TfL controls routes, frequencies, quality standards, and fd fares
• Known as "Competition For the Market"
1.201, Lecture 19 Fall 2009
12

London Buses Reorganization
•• Decentralization of London Buses Limited (LBL) Decentralization of London Buses Limited (LBL) operations, giving progressively more independence to LBL depots
• Put out to competitive bid about 10% of the bus network annually
• Awarding approximately 50% of competitive tenders to LBL subsidiaries with the remainder to independent private bus operators
• Used competitive pressure to induce LBL subsidiaries to restructure labor contracts and management strategy
• In 1994 all LBL subsidiaries were privatized
1.201, Lecture 19 Fall 2009
13

14
Table 1: Key bus operating statistics, GB d L d 1985/86 2004/2005 GB and London, 1985/86 to 2004/2005
Bus km Bus km Pax trips Pax trips Subsidy Subsidy Operating costs Operating costs (mil) (mil) per bus-km
(in 2000 dollars) Total £m Per bus km
Per pax trip
London 1985/1986 273 1152 £335 £1.23 £0.29 £2.71 1989/1990 292 1188 £238 £0.82 £0.20 £2.23 1994/1995 356 1167 £177 £0.50 £0.15 £1.59 1999/2000 365 1307 £134 £0.37 £0.10 £1.49 2004/2005 450 1793 £601 £1.34 £0.34 £1.95 GB Outside London 1985/1986 1804 4489 £904 £0.50 £0.20 £1.51 1989/19901989/1990 21502150 38863886 £682£682 £0.32£0.32 £0.18£0.18 £1.02£1.02 1994/1995 2293 3253 £620 £0.27 £0.19 £0.86 1999/2000 2234 2972 £613 £0.27 £0.21 £0.76 2004/20052004/2005 21462146 29442944 £730£730 £0 34 £0.34 £0 25 £0.25 £0 87 £0.87
1.201, Lecture 19
Source: Transport Statistics GB 2007 and earlier editions
Fall 2009
Note: Subsidy includes concessionary fares payments; Operating Costs and Subsidies are in constant 1999/2000 prices
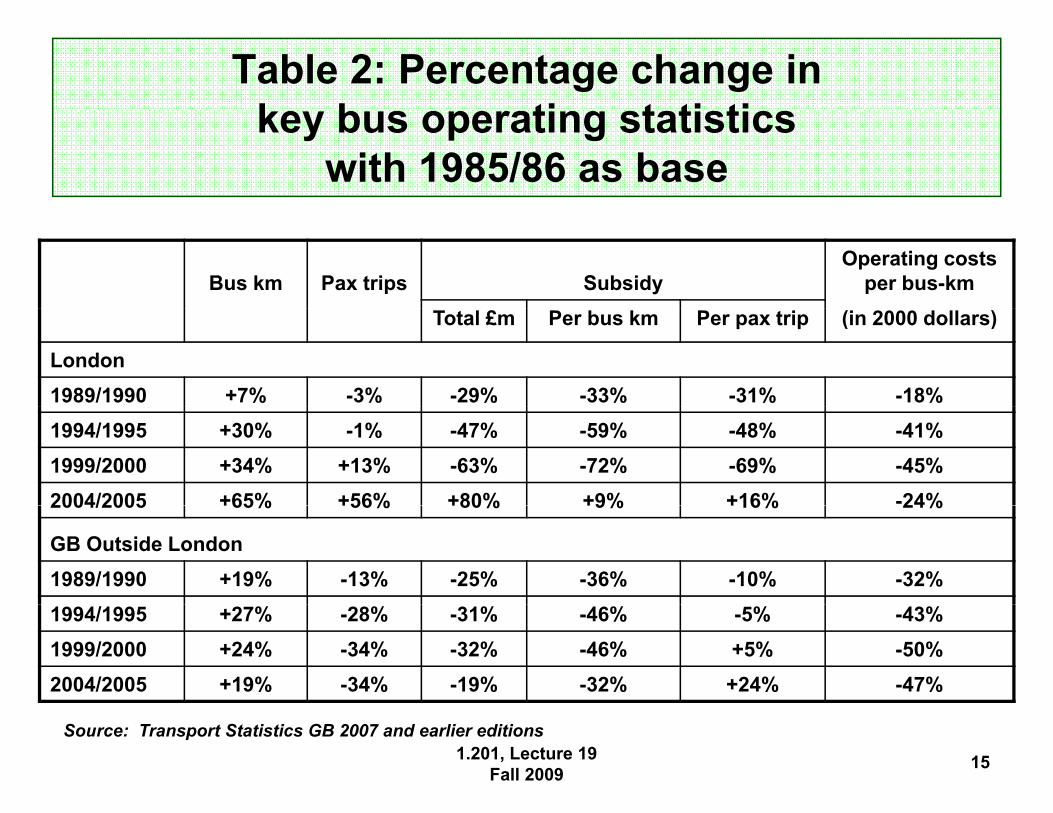
Table 2: Percentage change in k b ti t ti ti key bus operating statistics
with 1985/86 as base
Bus km Pax trips Subsidy Operating costs
per bus-km (in 2000 dollars)Total £m Per bus km Per pax trip
London 1989/1990 +7% -3% -29% -33% -31% -18% 1994/1995 +30% -1% -47% -59% -48% -41% 1999/2000 +34% +13% -63% -72% -69% -45% 2004/20052004/2005 +65%+65% +56%+56% +80%+80% +9%+9% +16%+16% -24%24%
GB Outside London 1989/1990 +19% -13% -25% -36% -10% -32% 1994/1995 +27% -28% -31% -46% -5% -43% 1999/2000 +24% -34% -32% -46% +5% -50% 2004/2005 +19% -34% -19% -32% +24% -47%
Source: Transport Statistics GB 2007 and earlier editions 1.201, Lecture 19
Fall 2009 15

Results of Bus Deregulation (1)
• Operating costs dropped significantly -- by about 50%, most of impact immediately after deregulation
• Bus kilometers of service increased substantially immediately after deregulation, but now again is in modest declinemodest decline
• Fares rose significantly, particularly in major t litmetropolitan areas
• Relatively little sustained on-the-street competition
1.201, Lecture 19 Fall 2009
16

Results of Bus Deregulation (2)
• Great majority of services (80-85%) are operated in commercial regime
• Subsidies have declined by about 30% since deregulation
• Ridership has declined significantly since deregulation
• Subsidy per passenger has remained approximatelySubsidy per passenger has remained approximately constant despite major decline in subsidy per vehicle kilometer
• Perceptions of service instability
1.201, Lecture 19 Fall 2009
17

Typical Trajectory Following Deregulation
• Incumbent operator registered most of pre-existing network as commercialnetwork as commercial
• Reduced costs and raised entry cost by converting to minibusesminibuses
• Establishing a foothold for a new entrant via competitive bidding proved difficult
• Price competition proved to be ineffective relative to frequency competition
• Large bus holding companies emerged through mergers and acquisitions
• The urban bus market as it developed in the UK proved not to be truly contestable
• LLocal b l bus pllanniing sttaff ff were llargelly elili miinattedd 1.201, Lecture 19
Fall 2009 18
London Results
• Similarities: • Unit cost reductions in London are close to those attained
outside Londonoutside London
• Service provided increased by a similar amount to outside London
• Differences: • Ridership in London has experienced modest growth
• Subsidy initially declined much more substantially in LondonLondon
than elsewhere -- prior to Congestion Charging effects
1.201, Lecture 19 Fall 2009
19

European Strategy
• Several major European cities adopted London-like schemes, e.g., Copenhagen, Stockholm
• Separation of public sector from direct operation is an accepted principal
• Contractual agreements developed between the planning and oversight agency (in the public sector) and the operators ((in the private sector))
1.201, Lecture 19 Fall 2009
20
US Transit Industry
• Organizational Models in the US A. Traditional regional transit authority
B EExpanddedd regiional t l transitit auththoritityB. C. Split policy/operations: Single service providers D Split policy/operations: Multiple service providers Multiple service providersD. Split policy/operations:
• Industry Structure
1.201, Lecture 19 Fall 2009
21
Transit Industry Structure
• Remarkably little change since the early 1970s: • regional transit authorities regulating, planning and directly
operating most services
• principal use of private sector is in providing purchased services to transit authoritiesservices to transit authorities
1.201, Lecture 19 Fall 2009
22
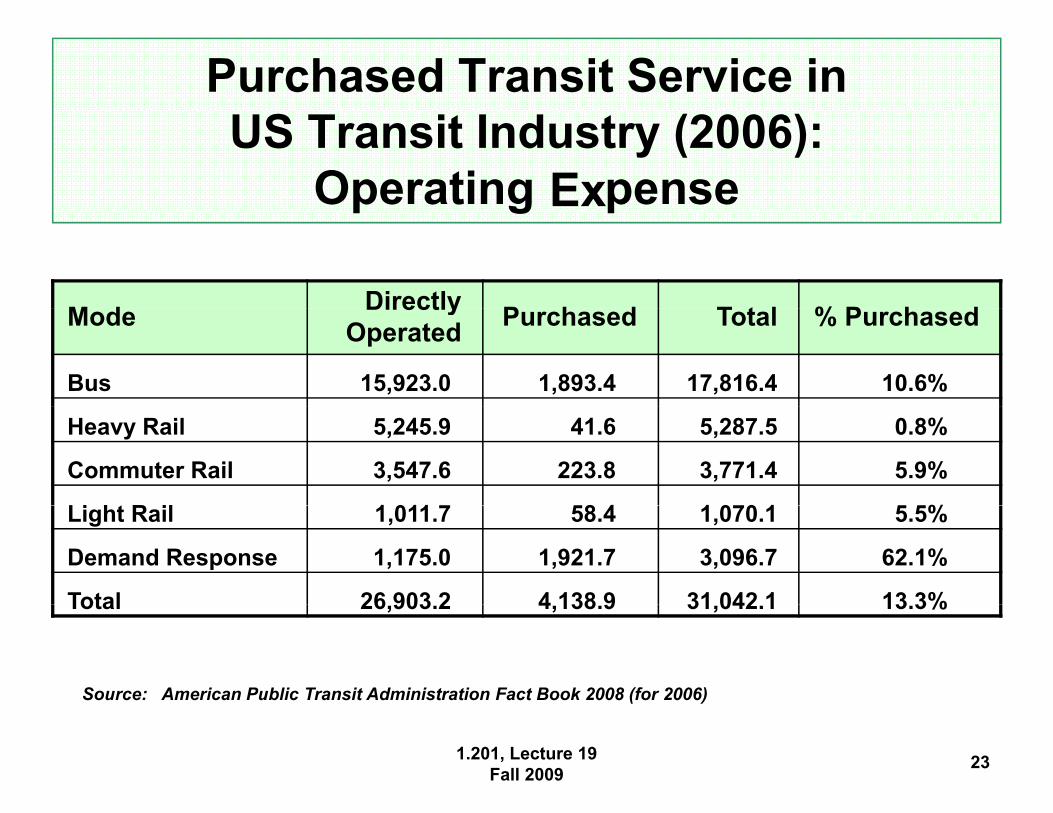
Purchased Transit Service in US Transit Industry (2006):
Opperatingg Exppense
M dMode DirectlyDirectly Operated P h dPurchased T t lTotal % P h d% Purchased
Bus 15,923.0 1,893.4 17,816.4 10.6%
Heavy Rail 5,245.9 41.6 5,287.5 0.8%
Commuter Rail 3,547.6 223.8 3,771.4 5.9%
Li ht R il Light Rail 1 011 7 1,011.7 58 4 58.4 1 070 1 1,070.1 5 5% 5.5%
Demand Response 1,175.0 1,921.7 3,096.7 62.1%
Total Total 26 903 2 26,903.2 4 138 9 4,138.9 31 042 1 31,042.1 13 3% 13.3%
Source: American Public Transit Administration Fact Book 2008 ((for 2006))
1.201, Lecture 19 Fall 2009
23
Use of Purchased Transit Services
• Dominant for demand-responsive service
• Little or none for urban rail services
• Modest for fixed route bus services
1.201, Lecture 19 Fall 2009
24
Fixed Route Bus Services
• Represents more than 50% of all services in the US
• Could clearly be operated efficiently and effectively by the private sector under contract
• The real ppotential for siggnificant exppansion for the private sector in transit
1.201, Lecture 19 Fall 2009
25
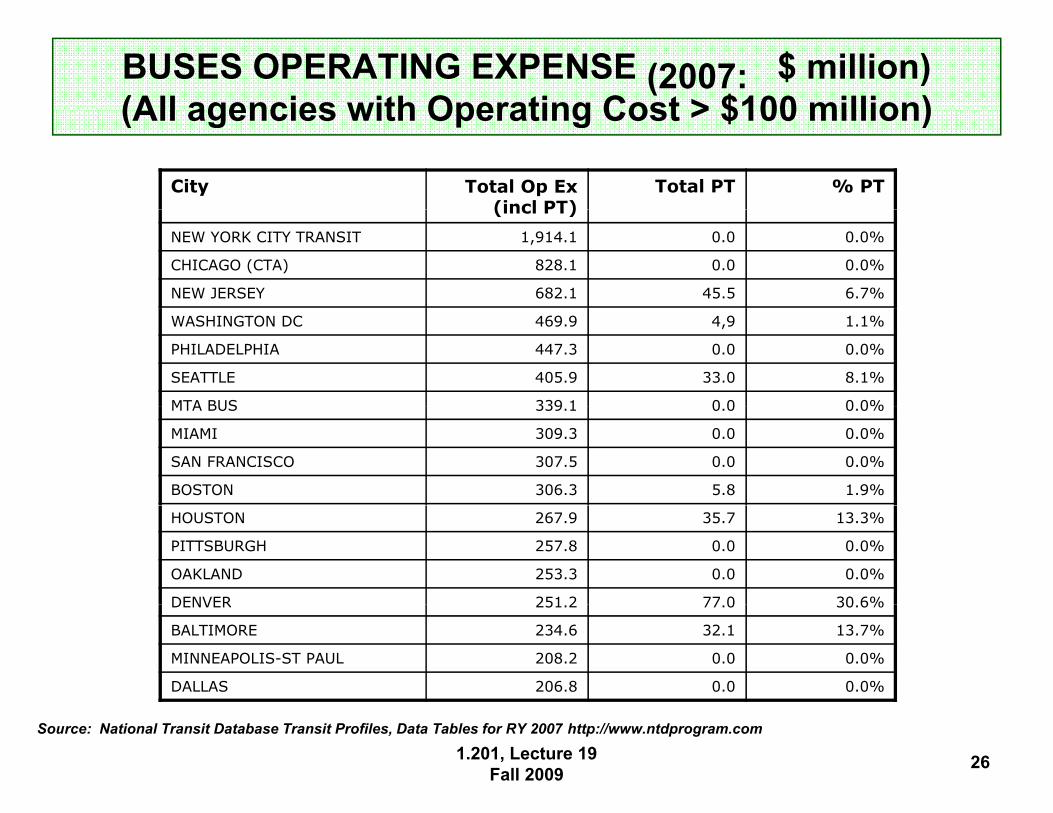
BUSES OPERATING EXPENSE (2007: $ million) (All agencies with Operating Cost > $100 million)(All agencies with Operating Cost > $100 million)
City Total Op Ex (incl PT) (incl PT)
Total PT % PT
NEW YORK CITY TRANSIT 1,914.1 0.0 0.0%
CHICAGO (CTA) 828.1 0.0 0.0%
NEW JERSEY 682.1 45.5 6.7%
WASHINGTON DC 469.9 4,9 1.1%
PHILADELPHIA 447.3 0.0 0.0%
SEATTLE 405.9 33.0 8.1%
MTA BUS MTA BUS 339 1 339.1 0 00.0 0 0% 0.0%
MIAMI 309.3 0.0 0.0%
SAN FRANCISCO 307.5 0.0 0.0%
BOSTON 306.3 5.8 1.9%
HOUSTON 267.9 35.7 13.3%
PITTSBURGH 257.8 0.0 0.0%
OAKLAND 253.3 0.0 0.0%
DENVER DENVER 251 2 251.2 77 0 77.0 30 6% 30.6%
BALTIMORE 234.6 32.1 13.7%
MINNEAPOLIS-ST PAUL 208.2 0.0 0.0%
DALLAS 206.8 0.0 0.0%
Source: National Transit Database Transit Profiles, Data Tables for RY 2007 http://www.ntdprogram.com
1.201, Lecture 19 Fall 2009
26
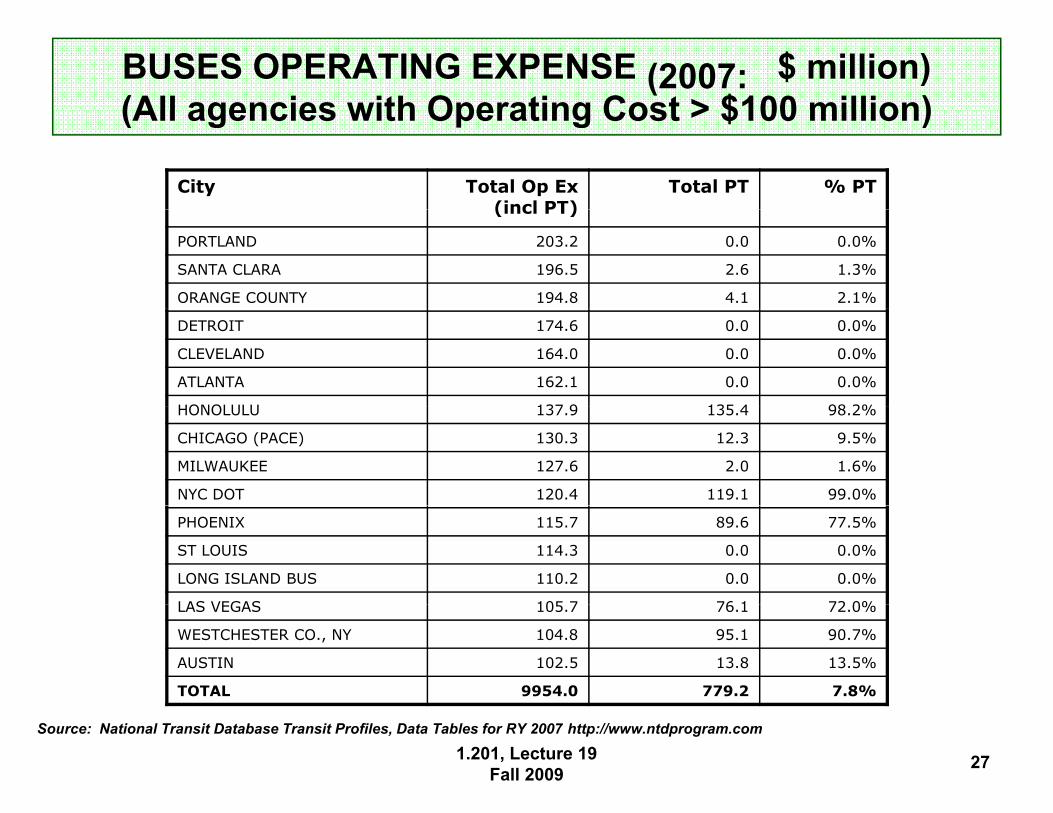
BUSES OPERATING EXPENSE (2007: $ million) (All agencies with Operating Cost > $100 million)(All agencies with Operating Cost > $100 million)
City Total Op Ex (incl PT) (incl PT)
Total PT % PT
PORTLAND 203.2 0.0 0.0%
SANTA CLARA 196.5 2.6 1.3%
ORANGE COUNTY 194.8 4.1 2.1%
DETROIT 174.6 0.0 0.0%
CLEVELAND 164.0 0.0 0.0%
ATLANTA 162.1 0.0 0.0%
HONOLULUHONOLULU 137 9 137.9 135 4 135.4 98 2% 98.2%
CHICAGO (PACE) 130.3 12.3 9.5%
MILWAUKEE 127.6 2.0 1.6%
NYC DOT 120.4 119.1 99.0%
PHOENIX 115.7 89.6 77.5%
ST LOUIS 114.3 0.0 0.0%
LONG ISLAND BUS 110.2 0.0 0.0%
LAS VEGAS LAS VEGAS 105 7 105.7 76 1 76.1 72 0% 72.0%
WESTCHESTER CO., NY 104.8 95.1 90.7%
AUSTIN 102.5 13.8 13.5%
TOTAL 9954.0 779.2 7.8%
Source: National Transit Database Transit Profiles, Data Tables for RY 2007 http://www.ntdprogram.com
1.201, Lecture 19 Fall 2009
27

t t t t
Largest 33 Bus Operators
• Less than 8% of bus service is currently provided under purchase of service arrangements
• 16 of 33 agencies do not provide any purchased bus service
• Only 9 agencies provide more than 10% of bus services under contract: New York City (Department of T i ) H l l W h C Ph i LTransportation), Honolulu, Westchester Co, Phoenix, Las Vegas, Denver, Baltimore, Austin, and Houston
1.201, Lecture 19 Fall 2009
28
•
Agencies Using Purchased Services Extensively Fall Into Three Groups
• Agencies which took over financial responsibility for franchise operators: New York City Department offranchise operators: New York City Department of Transportation
• Agencies taking over franchised services and/orAgencies taking over franchised services and/or expanding services through purchase agreements: Baltimore ((MTA), ), and Chicaggo ((PACE))
• Agencies required to transfer core services to purchased service arrangements: Denverpurchased service arrangements: Denver
1.201, Lecture 19 Fall 2009
29

•
Prospects for the Future
Key ingredients for private sector participation: • service is new and different • external intervention • incomplete assimilation of private operators
Direct transit authority operation is highly stable in Direct transit authority operation is highly stable in North America:
• small leverage for central government; 13(c) labor protection clause
• at state/local levels of government organized labor is a powerful forcepowerful force
likely to resist change
• confrontational/ideological nature of the debateconfrontational/ideological nature of the debate 1.201, Lecture 19
Fall 2009 30

Possible Strategies
Development of non confrontational incremental • Development of non-confrontational, incremental change proposals
•• Contingency plans Contingency plans
• Replacement of marginally performing routes bycontracted van or minibus servicecontracted van or minibus service
• Develop a database on results of initiatives bycredible agencycredible agency
• Split policy board from operating functions
• Corporatization and privatization of bus depots in large metropolitan areas
1.201, Lecture 19 Fall 2009
31
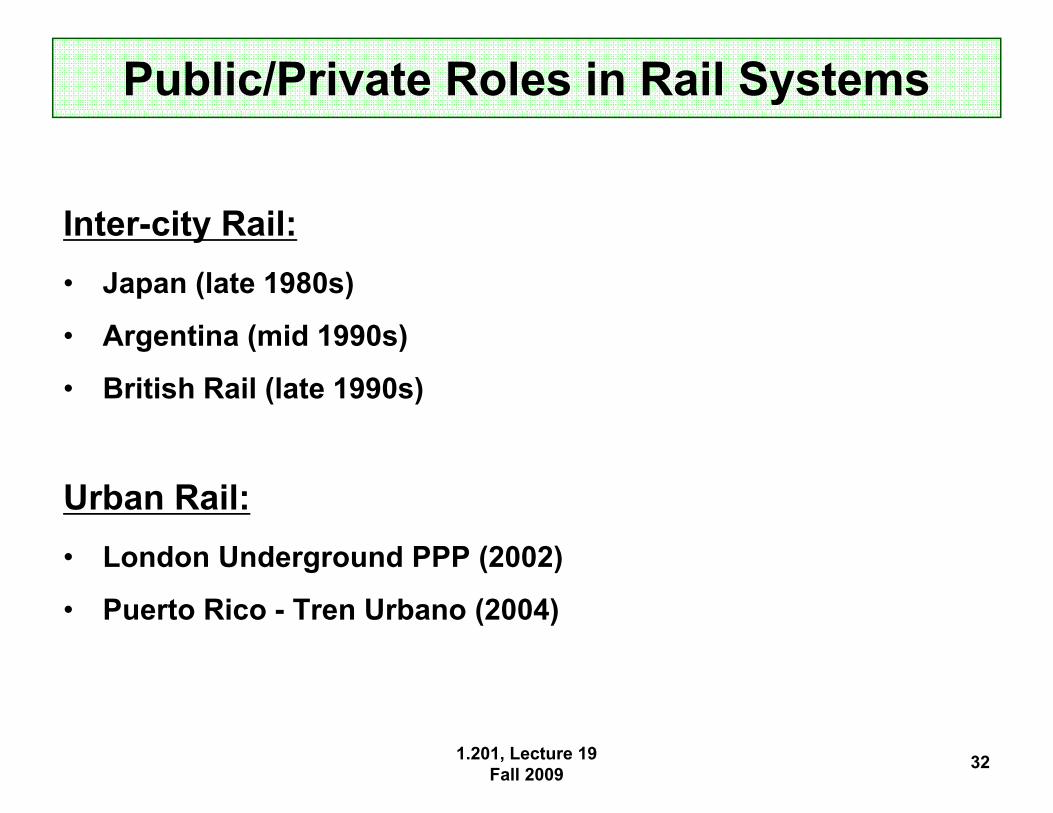
Public/Private Roles in Rail Systems
Inter-city Rail: • Japan (late 1980s)
• Argentina (mid 1990s)
• British Rail (late 1990s)
Urban Rail:Urban Rail: • London Underground PPP (2002)
• P erto Rico Tren Urbano (2004) Puerto Rico - Tren Urbano (2004)
1.201, Lecture 19 Fall 2009
32
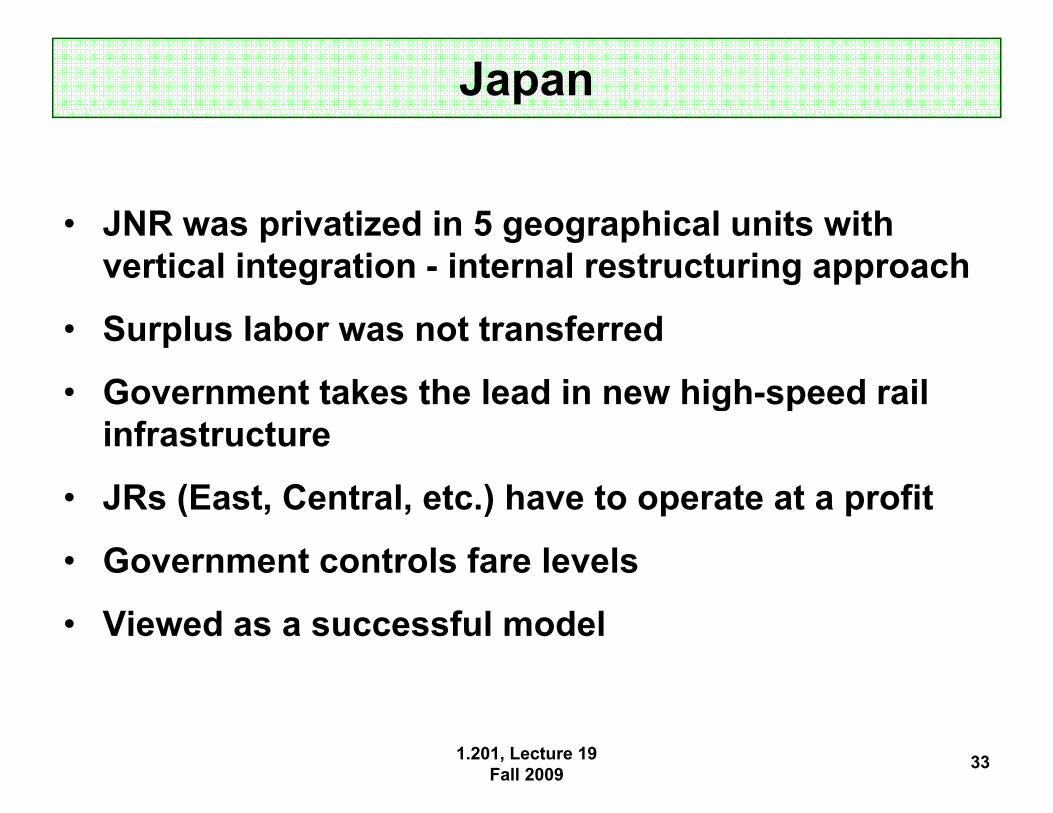
Japan
• JNR was privatized in 5 geographical units with vertical integration - internal restructuring approach
• Surplus labor was not transferred
• Government takes the lead in new higgh-sppeed rail infrastructure
• JRs (East, Central, etc.) have to operate at a profitJRs (East, Central, etc.) have to operate at a profit
• Government controls fare levels
• Viewed as a successful model
1.201, Lecture 19 Fall 2009
33

Argentina
• National, regional rail and subway system serving Buenos Aires with – massiive ffare evasiion – excess labor and many "no show" employees – inadeqquate maintenance – no investment – strong labor unions
• Restructured as 7 separate bid packages with vertical integration
• Public sector owns facilities and sets fares, schedules, investment requirements
• Contractor keeps fare revenue
• 20-year concessions agreements
• Subsidy to be continued with awards based on minimum subsidy bid
1.201, Lecture 19 Fall 2009
34
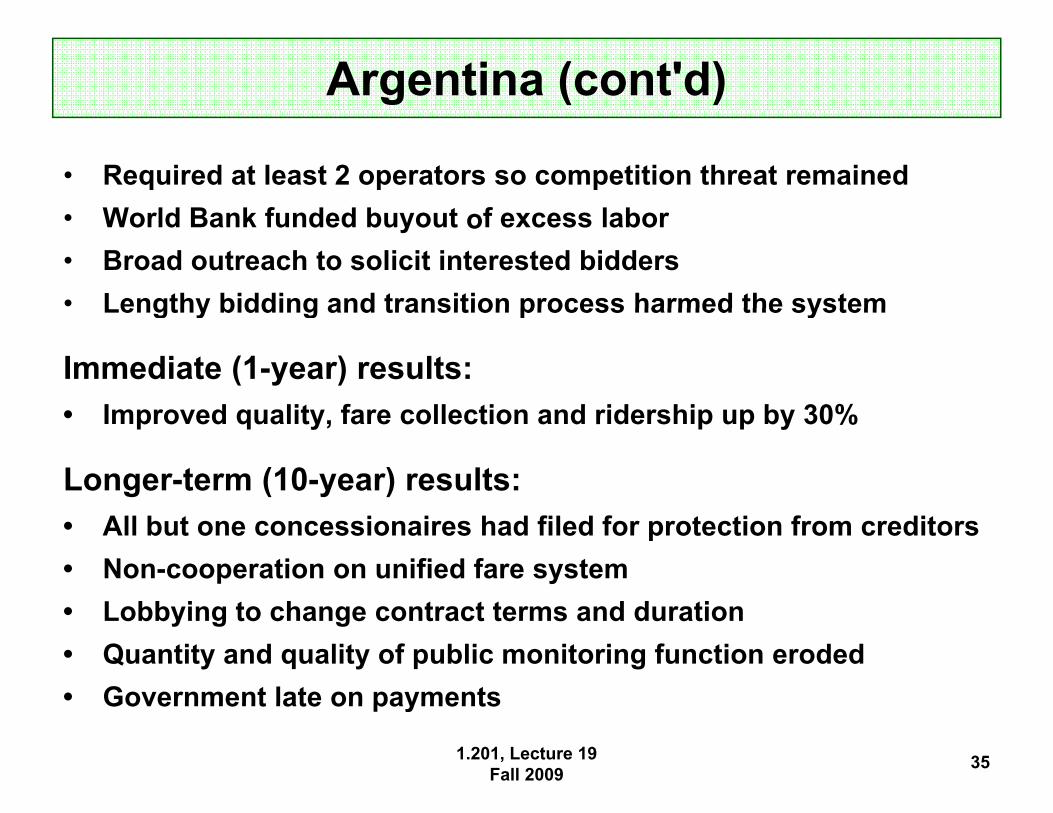
Argentina (cont'd)
• Required at least 2 operators so competition threat remained • W ld B World Bank f k fundded b d buyoutt off excess llabbor • Broad outreach to solicit interested bidders • Lengthy bidding and transition process harmed the systemLengthy bidding and transition process harmed the system
Immediate (1-year) results: • I d lit f ll ti d id hi b 30%Improved quality, fare collection and ridership up by 30%
Longer-term (10-year) results: • All but one concessionaires had filed for protection from creditors • Non-cooperation on unified fare system • L bb Lobbyiing tto chhange contract t t terms and durati tiont d d • Quantity and quality of public monitoring function eroded • Government late on payments Government late on payments
1.201, Lecture 19 Fall 2009
35

Premises Underlying British Rail Restructuring
• markets, contracts, and regulation would serve better than a central unit making top-down decisions than a central unit making top down decisions
• the private sector would provide better service
• separation from Government would free the railways from Treasury restrictions
• vertical integration was not the required model
• the railways would be profitablethe railways would be profitable
1.201, Lecture 19 Fall 2009
36
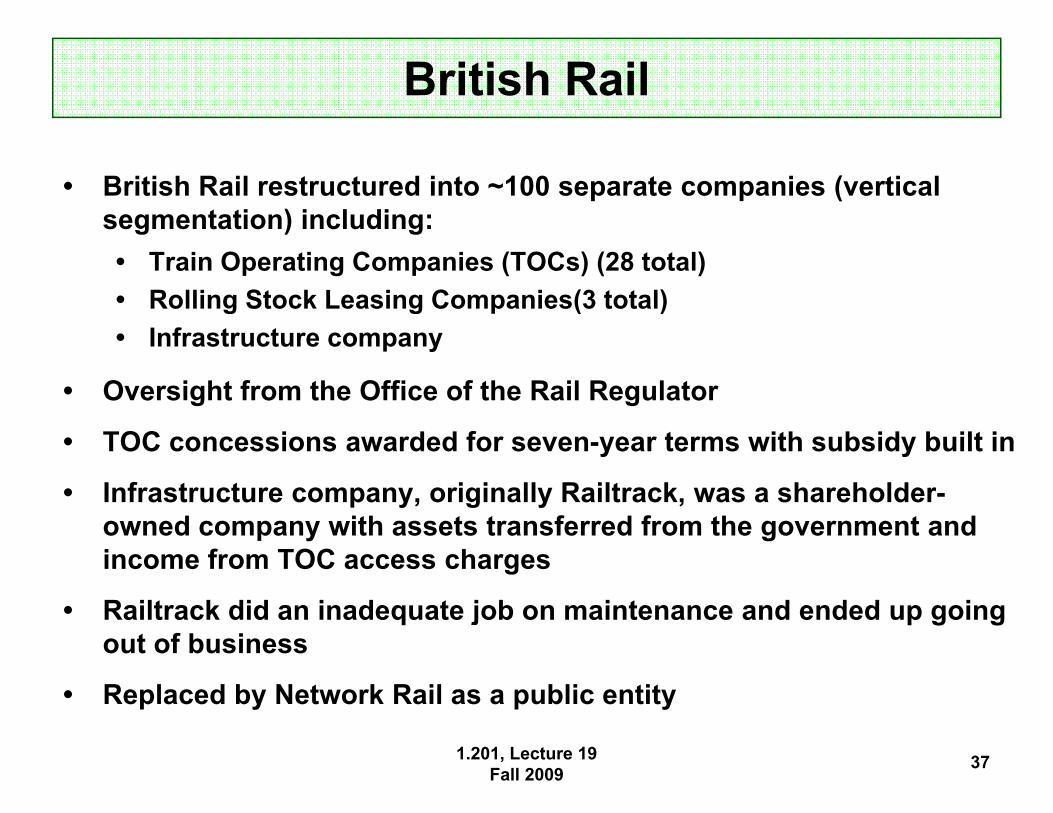
British Rail
• British Rail restructured into ~100 separate companies (vertical i ) i di segmentation) inclluding:
• Train Operating Companies (TOCs) (28 total) • Rolling Stock Leasing Companies(3 total)Rolling StockLeasing Companies(3 total) • Infrastructure company
• Oversight from the Office of the Rail Regulator
• TOC concessions awarded for seven-year terms with subsidy built in
• Infrastructure company, origginally Railtrack,, was a shareholderp y, y owned company with assets transferred from the government and income from TOC access charges
• RRailtiltrack did an iinaddequatte jobb on maiinttenance and endded up goiingk did j d dout of business
• Replaced by Network Rail as a public entity Replaced byNetwork Rail as a public entity
1.201, Lecture 19 Fall 2009
37

The Privatized Structure (simplified)
Government Regulators Operators Suppliers Suppliers
HSE
Railtrack Infrastructure Sub-
DTP
ORR
Opraf
Railtrack
TOCs
Infrastructure maintenance
Roscos
contractors
Rolling stock
Passengers
maintenance
Passengers and freight
1.201, Lecture 19 Fall 2009
38

• -
British Rail Restructuring Results
• accident rates have continued long-term decline accident rates have continued long term decline
• passenger km increased by 38% since privatization
• train services have increased by 20% • more imaginative pricing and promotion • declines in reliability due to deteriorating
infrastructure • substantial increases in operations cost • increased subsidies increased subsidies - from £1bill/yr to £3-4 bill/yr• from £1bill/yr to £3 4 bill/yr • maybe vertical integration benefits outweigh the
costscosts 1.201, Lecture 19
Fall 2009 39

PPP Approaches in Urban Rail Systems
INFRASTRUCTUREINFRASTRUCTURE Public Private
OPERATIONS Public Public Provision (USA) London Underground Private Operating Concessions
(Buenos Aires, Rio, San Juan)
Share Issue Privatization Share Issue Privatization (Singapore)
DBFO (Kuala Lumpur)
Share Issue Privatization Share Issue Privatization (Hong Kong)
1.201, Lecture 19 Fall 2009
40

London Underground PPP Background
• public provision and financing dominant until lastpublic provision and financing dominant until last few years
•• long term inadequacy of investment and annual long-term inadequacy of investment and annual funding cycle led to chronic operations and maintenance pproblems
• poor project management track record in LUL
• Kings Cross fire in 1987 highlighted operational and cultural problems in LUL
1.201, Lecture 19 Fall 2009
41

O e at o o U de ou d e a s es o s b t o
•
London Underground PPP
• Operation of Undergground remains responsibilityy ofp pLUL - a public sector entity
• Three infrastructure companies awarded long termThree infrastructure companies awarded long-term (30-year) concessions to finance, improve, and maintain the rolling stock and infrastructuremaintain the rolling stock and infrastructure – produce £8 bill of infrastructure investment in 15 years – Tube Lines and Metronet consortium selected – NPV of £16 billion with set-up cost of £455 million
• Approach was highly controversial Approach was highly controversial, with LULwith LUL transferred to TfL in 2003 after the contracts had been siggned
1.201, Lecture 19 Fall 2009
42

London Underground PPP Performance Measures
11. Contractual Performance Measures: Contractual Performance Measures: actual performance actual performance • Availability – measured by lost customer hours • Capability – long-term capacity and journey times • Ambience – quality of travelling environment measured by MSS
2. Maintenance and Asset Performance Measures • Rolling stock – MMBF • Average duration of delays > 2 mins • Lift and escalators – time between failures, avg time to repair
3. Renewals and Upgrades • Track renewal • Lift and escalator replacement • Station enhancements • Line upgrades Line upgrades
1.201, Lecture 19 43Fall 2009
See TfL report on PPP performance at: http://www.tfl.gov.uk/assets/download s/LU-PPP-report-data-summary-06-07.pdf

Tren Urbano
• New heavy rail/metro system for San Juan metropolitan area
• Design-Build-Operate-Maintain approach taken
• Public sector controls schedules and fares and retains fare revenue, but with operator revenue incentive
• Aggressive outreach for consortia to bid on RFP
1.201, Lecture 19 Fall 2009
44
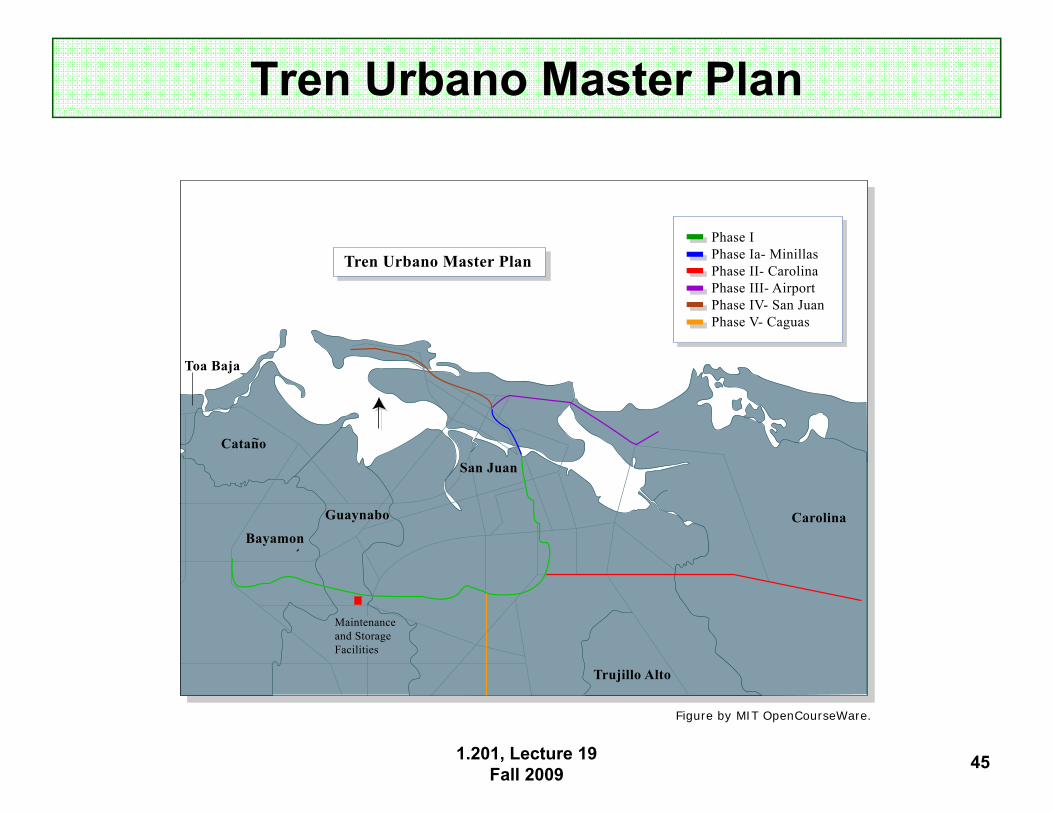
Tren Urbano Master Plan
1.201, Lecture 19 Fall 2009
45
Carolina
Trujillo Alto
San Juan
Guaynabo
Bayamon
Catano
Toa Baja
~
`
Phase IPhase Ia- MinillasPhase II- CarolinaPhase III- AirportPhase IV- San JuanPhase V- Caguas
Tren Urbano Master Plan
Maintenanceand Storage Facilities
Figure by MIT OpenCourseWare.
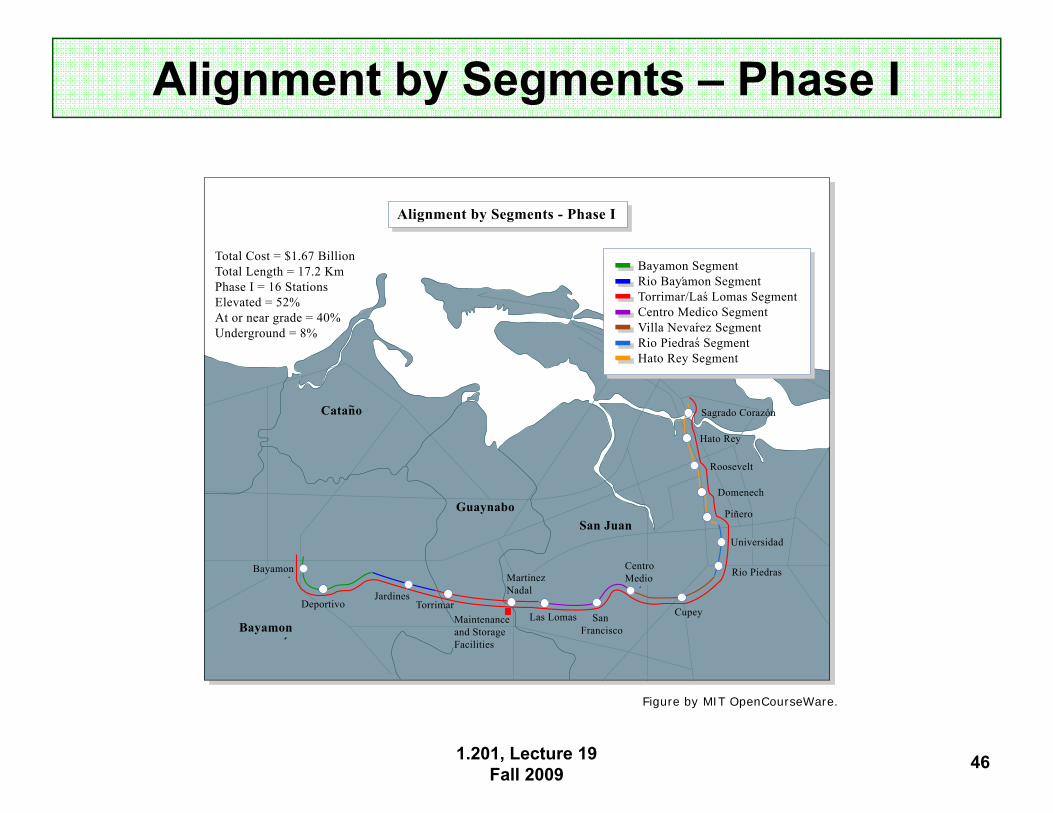
Alignment by Segments – Phase I
1.201, Lecture 19 Fall 2009
46
Catano
GuaynaboSan Juan
~
Bayamon`
Bayamon
DeportivoJardines
Torrimar
MartinezNadal
Las Lomas San Francisco
Centro Medio
Cupey
Rio Piedras
Domenech
Roosevelt
Hato Rey
Sagrado Corazón
Universidad
Piñero
Maintenanceand Storage Facilities
`
`
Total Cost = $1.67 BillionTotal Length = 17.2 KmPhase I = 16 StationsElevated = 52%At or near grade = 40%Underground = 8%
Bayamon SegmentRio Bayamon SegmentTorrimar/Las Lomas SegmentCentro Medico SegmentVilla Nevarez SegmentRio Piedras SegmentHato Rey Segment
``
``
Alignment by Segments - Phase I
Figure by MIT OpenCourseWare.
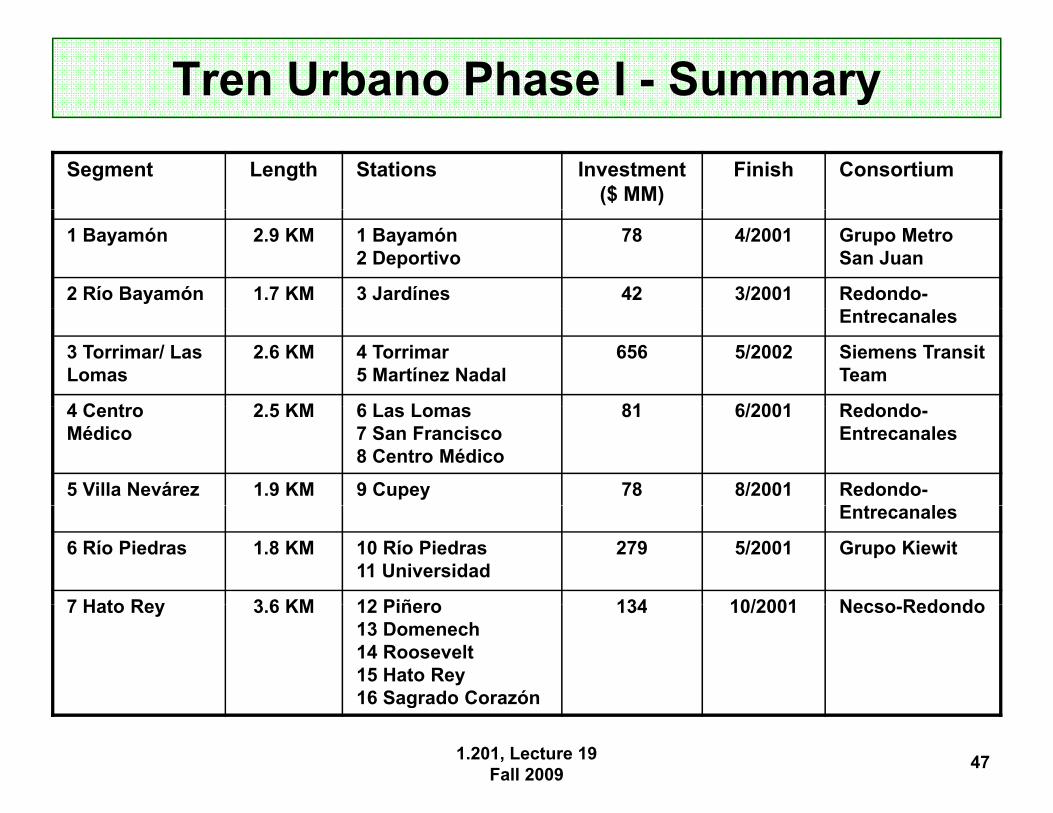
Tren Urbano Phase I - Summary
Segment Length Stations Investment ($ MM)
Finish Consortium
1 Bayamón 2.9 KM 1 Bayamón 2 Deportivo
78 4/2001 Grupo Metro San Juan
2 Río Bayamón 1.7 KM 3 Jardínes 42 3/2001 Redondo-Entrecanales
3 Torrimar/ Las Lomas
2.6 KM 4 Torrimar 5 Martínez Nadal
656 5/2002 Siemens Transit Team
4 C t4 Centro Médico
2 5 KM 2.5 KM 6 L L6 Las Lomas 7 San Francisco 8 Centro Médico
8181 6/20016/2001 R d dRedondo-Entrecanales
5 Villa Nevárez 1.9 KM 9 Cupey 78 8/2001 Redondo-E t lEntrecanales
6 Río Piedras 1.8 KM 10 Río Piedras 11 Universidad
279 5/2001 Grupo Kiewit
7 Hato Rey 7 Hato Rey 3 6 KM 3.6 KM 12 Piñero 12 Piñero 13 Domenech 14 Roosevelt 15 Hato Rey 16 Sagrado Corazón 16 Sagrado Corazón
134134 10/200110/2001 Necso Redondo Necso-Redondo
1.201, Lecture 19 Fall 2009
47

t t t
Tren Urbano: Short-term Results
• SSuccessfful in getting construction underway quickly compared with traditional approach
• O ' i i fl d h dOperator's perspective influenced the desiign
• Many interfaces created major problems
• Inadequate public sector oversight of construction process
• Major contractor problems resulted in significant delays and cost overruns
• Ridership far below prediction (40K vs 115K pass/day) because of lack of system integration
1.201, Lecture 19 Fall 2009
48
MIT OpenCourseWarehttp://ocw.mit.edu
1.258J / 11.541J / ESD.226J Public Transportation SystemsSpring 2010
For information about citing these materials or our Terms of Use, visit: http://ocw.mit.edu/terms.
Top Related