


Languages
Pages
Legal

Public Health & Policy Issues: Illegal Drugs
Sheila M. BirdMRC Biostatistics Unit, Cambridge
Collaborations:
Sharon Hutchinson & David Goldberg, HPSBrian Tom, Bo Fu & Elizabeth Merrall, BSU
Ruth King & Gordon Hay @ St Andrews & Glasgow

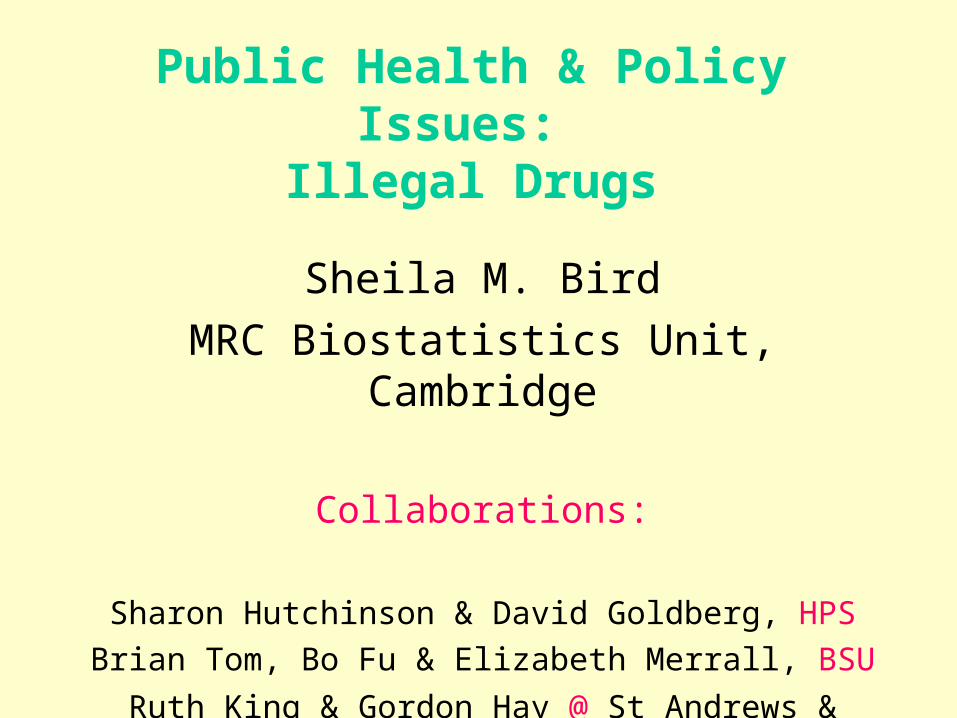
Keep Injecting iLLEgal Drugs
MurderSuicideOverdoseLate sequelae of Hepatitis CLate sequelae of HIVLate sequelae of alcohol as co-factorPublic costs.
IDU socially transmissible diseaseIDU courts, prison, health & drug services
Keep Injecting iLLEgal Drugs
Projecting Scottish IDUs’ late HCV sequelae required
Past & recent injector incidencePast & recent off-injecting ratesPast & recent drug-related death ratesOther causes’ death-rate for ex-IDUsBBV transmission model: HCV infectiousness &
prevalence, injecting frequency/partnersBBV progression model: age at HCV infection, sex,
alcohol co-factor, antiviral treatmentBBV late sequelae: database linkage from HCV
diagnoses (minimally)Costs overlay; policy changes; “if scenarios”.
Year
Liv
ing
IDU
s (t
ho
usa
nd
s)
1960 1970 1980 1990 2000
0
20
40
60
80
100
120
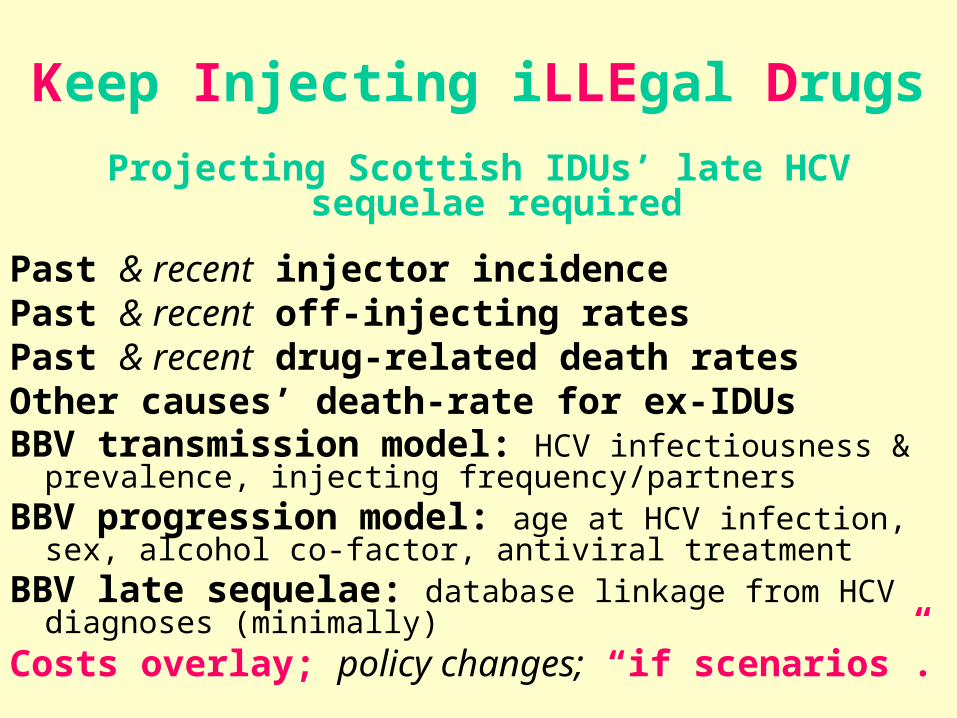
Modelled prevalent IDUs in Scotland
? doubled from 1980-84 and again from 1985-89
Current & former IDUs
Current IDUs

Scotland’s HCV Action Plan(Hutchinson, Bird & Goldberg. Hepatology 2005; 42: 711-723)
Despite harm reduction policies, high HCV incidence ~ 20-30 per 100 susceptible IDU-years.
Past IDU epidemic’s current consequences: epidemic wave of DRDs in older current-IDUs
ex-IDUs aged 30-49 years: HCV test & treat (to halt HCV progression)
Clean needles don’t prevent DRDs: off-injecting does + reducing IDU initiations.
Only HCV-contaminated works infect: ? count HCV-contaminated injections since last –ve test.

National Institute for Health & Clinical Excellence: threshold of £20-30K per QALY
NICE on Needle Exchange (NE): without comment, high baseline cost-per-QALY for IDUs of £38K to £45K. (UK-unaffordable)
Possible NICE decision = HCV test every 6 months. This was not modelled . . .
NICE Appraisal is Evidence + Judgment.
Decision follows from 30% to 50% HCV prevalence among IDUs, transmission risk of 2% or 3% per contaminated injection 25% HCV risk after 10 contaminated injections.
“What if” added IDU-years/DRDs facilitated by NE: was not modelled.

Missed UK target
20% reduction in Drug-Related Deaths by 2005
Policy implications?

Drugs-related deaths & Capture-Recapture (CR) in Scotland:
2000+01+02; 2003+04+05; 2006+2007
Era Drugs-related deaths
Classically-analysed CR of current injectors
2000+01+02 1006 ~ 25,000 (reference year 2000/01)
2003+04+05 1009 ~ 20,000 (reference year 2003/04)
2006+07 421 + 455 Oops . . . !!!

Scotland’s drug-related deaths by: age-group, gender, region
Era Scotland (male, female)
Greater Glasgow
(29%)
Elsewhere in Scotland
15 – 34 years of age (83% male) public health success?
2000+01+02 672 (558, 114) 210 4622003+04+05 572 (482, 90) 161 411
Since 2005
2006+07 466 (402, 64) 130 336

Scotland’s drug-related deaths by: age-group, gender, region
Era Scotland (male, female)
Greater Glasgow
(35%)
Elsewhere in Scotland
35+ years of age (76% male) Ageing epidemic increase!
2000+01+02 334 (269, 65) 116 2182003+04+05 437 (322,115) 151 286
Since 2005
2006+07 410 (325, 85) 145 265

Scotland’s drugs-related deaths & Bayesian CR estimates for current
injectors (minor & major modes, King et al., SMMR in press)
3-year Era Drugs-Related Deaths
Bayesian Capture-Recapture estimated for current IDUs: annual DRDs per 100 IDUs
2000 – 02 1 006 26 500 (re 2000/01): 1.32003 - 05 1 009 27 400 (re 2003/04): 1.2
(HPDI: 20 700 to 32 100)

Bayesian Capture-Recapture
Not all DRDs occur in IDUs . . .
Prior beliefs: % DRDs who are injectors?
80% for DRDs aged 15-44 years (75% to 85%)
20% for DRDs aged 45+ years (15% to 35%).

Bayesian Capture-Recapture, 2003-05 80,20 estimate iDRD rate per 100 IDUs
Gender &
Age-group
Greater Glasgow
Elsewhere in Scotland
BCRIDUs
Rate(HPDI)
BCR IDUs
Rate:(HPDI)
M, 15-34yrs 3 300 1.1(0.9, 1.4)
10 060 0.9(0.8, 1.2)
M, 35+ 2 320 1.1(0.9, 1.5)
3 450 1.3(1.0, 1.7)
F, 15-34yrs 1 600 0.4(0.3, 0.6)
4 890 0.4(0.3, 0.5)
F, 35+ 700 1.0(0.7, 1.4)
1 040 1.3(1.0, 1.7)

21st Century Drugs and Statistical Science in UK Surveys, Design & Statistics Subcommittee of HOSAC
1. Landscape: Nowsurveys with/without biological samples; databases;
cohorts; biological sample collections; tangle of technologies
2. Methodology MattersDatabase linkage & ‘virtual’ cohorts; Capture-recapture methods to estimate #injectors; Epidemics – initiations & removals; Evidence-synthesis, and biases; Formal experiments: randomization & cost-effectiveness;Genetics3. Essential New Questions4. New Prospects
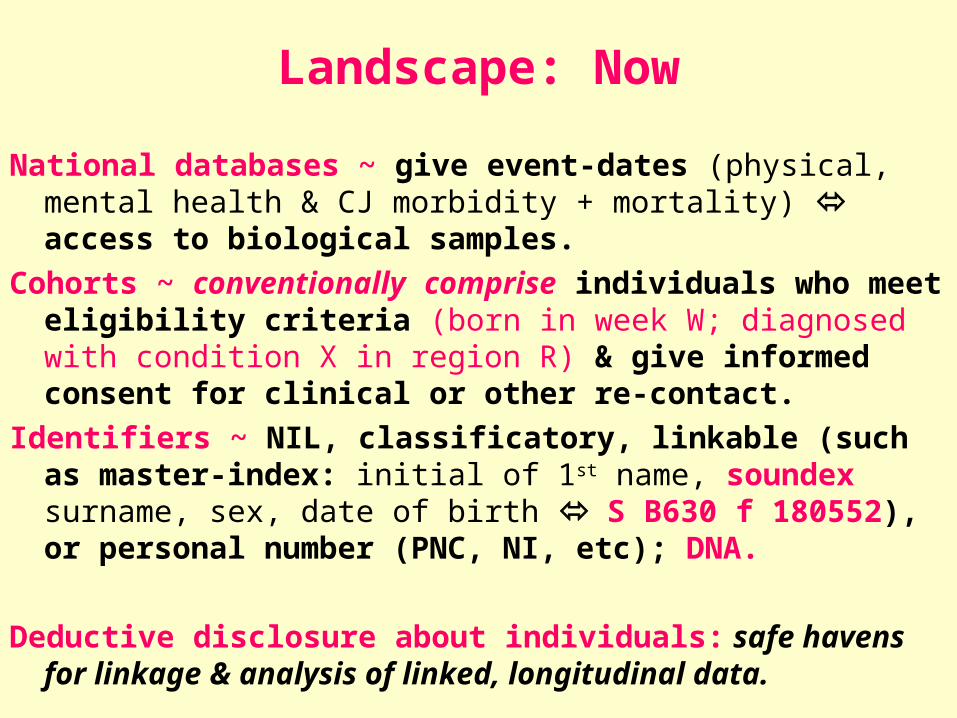
Landscape: Now
National databases ~ give event-dates (physical, mental health & CJ morbidity + mortality) access to biological samples.
Cohorts ~ conventionally comprise individuals who meet eligibility criteria (born in week W; diagnosed with condition X in region R) & give informed consent for clinical or other re-contact.
Identifiers ~ NIL, classificatory, linkable (such as master-index: initial of 1st name, soundex surname, sex, date of birth S B630 f 180552), or personal number (PNC, NI, etc); DNA.
Deductive disclosure about individuals: safe havens for linkage & analysis of linked, longitudinal data.

Gamut of surveys, databases, cohorts, biological sample collections.
Representative surveillance? Health sitesSelf-report + biological sample? SchoolsNew questions? Incidence & recovery (Ro)New tests? HCV-RNA for injectors
Longitudinal linkage of “health”, drug referral, criminal databases? Coherent reports of IDU debut; powerful re trajectories.
Birth & at-risk cohorts? Costly, losses, lack power‘Virtual’ cohorts? Event-dates without context.
Formal experiments in criminal justice? Efficacy, safety & cost-effectiveness.

Methodology Matters
Capture-recapture methods to estimate # current injectors
POLICY PRIORITY for local estimates, v. capture propensities: 22 models v. all 2-way interactions . . .
Assumptions matter: new CR results for England.

New estimates for current injectors: England
REGION Bayesian estimate(95% credible interval)
Localised, classical estimate (95% CI)
East England 11.1K ( 9.6K; 12.9K) 9.4K ( 6.3K; 13.1K)
LONDON 45.8K (34.8K; 60.6K) 17.9K (16.2K; 24.0K)
North West 35.4K (31.5K; 39.7K) 22.1K (18.8K; 25.2K)
South West 19.3K (16.8K; 22.0K) 17.4K (15.9K; 19.5K)
York+Humber 31.8K (28.4K; 35.8K) 21.0K (19.9K; 22.8K)
ENGLAND 204K (189K; 223K)
137K (133K; 149K)

Epidemics: initiations into, & removals from injecting
Back-calculation from overdose deaths to heroin/IDU incidence: needs duration of injecting
Assumptions matter: surely, removal rate increased in 21st C?
Injector careers: snapshot samples.

Referral to Edinburgh’s liver clinic in late 20th C: non-uniformKAPLAN, typically in last half/quarter of incubation period to cirrhosis (Fu et al., 2007)
Clinic patients (if only 5% of community patients routinely referred, rest near to cirrhosis): over-estimate % fast progressors
e.g. 55% v. 33% re community
Covariate effect size in clinic patients (such as heavy drinking): under-estimated re true effect in community

Judges prescribe sentence on lesser evidence than doctors
prescribe medicines
Is
public
aware?

Drug Treatment &Testing Orders (DTTOs)
• England & Wales: 210 clients
• Scotland: 96 clients
• Targets for DTTO clients in E&W: 6,000+ per annum
• DTTO clients: 21,000+ by end 2003
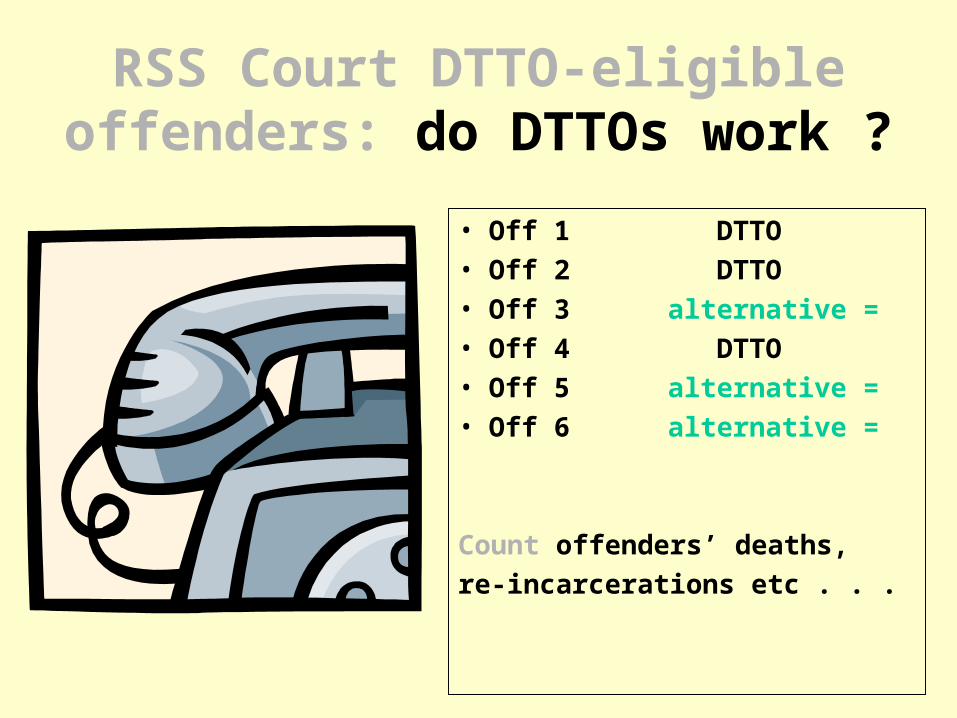
RSS Court DTTO-eligible offenders: do DTTOs work ?
• Off 1 DTTO• Off 2 DTTO• Off 3 alternative =• Off 4 DTTO• Off 5 alternative =• Off 6 alternative =
Count offenders’ deaths, re-incarcerations etc . . .

UK courts’ DTTO-eligible offenders: ? guess
• Off 7 DTTO [ ? ]• Off 8 DTTO [ ? ]• Off 9 DTTO [ ? ]• Off10 DTTO [ ? ]• Off11 DTTO [ ? ]• Off12 DTTO [ ? ]• Off13 DTTO [ ? ]• Off14 DTTO [ ? ]
(before/after) Interviews versus . . . [ ? ]

Evaluations-charade• Failure to randomise
• Failure to find out about major harms
• Failure even to elicit alternative sentence funded guesswork on relative cost-effectiveness
• Volunteer-bias in follow-up interviews
• Inadequate study size re major outcomes . . .

The ‘business’ of judging &
Judicial counting . . .

Custodial sentence lengths0
20
04
00
60
0
Fre
qu
en
cy
Common assault
05
00
15
00
Fre
qu
en
cy
Theft from shop
01
00
02
50
0
Fre
qu
en
cy
Driving whilst disqualified
30 60 90 120 150 180
01
02
03
0
Days
Fre
qu
en
cy
Supply and possession of class A drug
Male, Adults,Magistrates’ court, single offences,2004 E&W

Awash with data . . . urines . . . Compulsory Drugs Testing in
the British Army

10% reduction in opiate +ve rate,
weekday pattern in cannabis positive rates.
National Offender Management Service in 21st C.
1. Weekend v. Mon-Wed v. Thurs/Fri testing.
2. Different test rate by prison: annual election for or against 5% rMDT!
3. Lowered % positive for cannabis & opiates between eras.
4. Prescribed methadone ~ rarely.

T=tests, P=prescribed methadone, O=opiates, C=cannabis (95% CI for rate per 1,000)
Prisons which elected for 5% rMDT2000/01 to 2002/03
Tests 87 300P= 12 O 4 298 (48, 51)C 6 906 (77, 81)
2004/05 to 2006/07
Tests 110 204P=419 O 4 739 (42, 44)C 7 503 (66, 70)
Prisons which elected against 5% rMDT2000/01 to 2002/03
Tests 70 997P= 4 O 2 449 (33, 36)C 4 670 (64, 68)
2004/05 to 2006/07
Tests 66 113P=332 O 2 040 (30, 32)C 3 277 (48, 51)

O=opiates, C=cannabis (95% CI: rate per 1,000)
3-years Mon+Tues+Wed Thurs+Friday Sat+Sunday
Prisons which elected for 5% rMDT2000/01 to 2002/03
Tests 48 996 O= (46, 50)
C = (78, 83)
Tests 26 169 (51, 56)
(76, 85)
Tests 12 135(40, 48)
(69, 78)2004/05 to 2006/07
Tests 58 614 O= (41, 45)
C = (70, 73)
Tests 32 108 (42, 46)
(64, 70)
Tests 19 482(38, 44)
(56, 63)
Prisons which elected against 5% rMDT2000/01 to 2002/03
Tests 38 044 O= (32, 36)
C= (67, 72)
Tests 21 301(32, 37)
(59, 65)
Tests 11 652(33, 40)
(56, 66)2004/05 to 2006/07
Tests 35 137 O= (29, 33)
C= (51, 56)
Tests 18 352(30, 35)
(45, 52)
Tests 12 624(26, 32)
(40, 47)

Formal experiments: drugs courts
“Hugs, not Drugs”

Harveian Oration: De Testimonio
Evidence + Judgment
Efficacy (typically in RCTs)v. Safety (rare events) + Effectiveness (promise into practice)
Designs that are fit for purpose . . . (delayed judgments . . . )
Signal:noise ratio (usual outcome).

Guardian Society: 17 Nov. 2004
“Some statisticians are so severe that they would stop social policy
making in its tracks.
For example, Bird would forbid the government to introduce any policy that had not been assessed through
controlled trials. . . ”

Increased Efficiency at Detection masked trend in soldiers’ cocaine use
British Army, 2003 - 2007
1. Accentuated Monday testing
2. Differential testing by rank: privates!
3. Lowered threshold for cocaine

Privates in British Army: cocaine
Year:
% of all tests on Mondays
Monday Tuesday Wednesday Mon-Wed.Positives in 3*15,000 tests
Tests to nearest 100;
cocaine positive rate per 1,000
2007:
54%
24,500
9.8
12,000
7.3
5,800
5.5338
2005:
44%
23,000
7.8
13,400
8.2
10,500
5.1315
2003:
36%
19,200
3.4
14,300
3.0
9,600
1.1113
2003-07Cocaine+ve Rate per 1,000
7.0 6.2 3.4
3-fold increase in 5 years;
Wed. rate =
half Mon. rate

Essential New Questions [1]
Age at/year of starting to inject & at off-injecting. {up to 5 snapshots}
# Periods “off-injecting for a least 1 year” since injecting debut.
# New initiates to injecting, in your presence, in the past year.
{3 present: count each 1/3rd responsible}
# Injectors, known to you, who gave up injecting in past 2 years v. # injectors who died in past 2 years. {pause for reflection}

Four PQs for every CJ initiative• PQ1: Minister, why no randomised controls?
• PQ2: Minister, why have judges not even been asked to document offender’s alternative sentence that this CJ initiative supplants?
{cf electronic tagging}
• PQ3: What statistical power does Ministerial pilot have re well-reasoned targets?
{or, just kite flying . . .}
• PQ4: Minister, cost-effectiveness is driven by longer-term health & CJ harms, how are these ascertained? { database linkage}

Bayesian Capture-Recapture 80,20 point-estimate iDRD rate per 100 IDUs applied
to 2006+2007
Gender &
Age-group
Greater Glasgow
Elsewhere in Scotland
06+07 Rate
Rate(HPDI)
06+07 Rate
Rate(HPDI)
M,15-34yrs 1.3 1.1(0.9, 1.4)
1.2 0.9(0.8, 1.2)
M,35+ 1.4 1.1(0.9, 1.5)
1.9 1.3(1.0, 1.7)
F, 15-34yrs 0.9 0.4(0.3, 0.6)
0.5 0.4(0.3, 0.5)
F, 35+ 1.4 1.0(0.7, 1.4)
1.4 1.3(1.0, 1.7)
Top Related