

Languages
Pages
Legal


Document of
The World Bank
FOR OFFICIAL USE ONLY
Report No. 83144-ST
INTERNATIONAL DEVELOPMENT ASSOCIATION
INTERNATIONAL FINANCE CORPORATION
MULTILATERAL INVESTMENT GUARANTEE AGENCY
COUNTRY PARTNERSHIP STRATEGY
FOR THE
DEMOCRATIC REPUBLIC OF SÃO TOMÉ AND PRÍNCIPE
FOR THE PERIOD FY14-FY18
May 28, 2014 São Tomé and Príncipe Country Management Unit (AFCC1) Africa Region The International Finance Corporation (IFC) The Multilateral Investment Guarantee Agency (MIGA) This document is being made publicly available prior to Board consideration. This does not imply a presumed outcome. This document may be updated following Board consideration and the updated document will be made publicly available in accordance with the Bank’s policy on Access to Information.
Pub
lic D
iscl
osur
e A
utho
rized
Pub
lic D
iscl
osur
e A
utho
rized
Pub
lic D
iscl
osur
e A
utho
rized
Pub
lic D
iscl
osur
e A
utho
rized
Pub
lic D
iscl
osur
e A
utho
rized
Pub
lic D
iscl
osur
e A
utho
rized
Pub
lic D
iscl
osur
e A
utho
rized
Pub
lic D
iscl
osur
e A
utho
rized
The date of the last Interim Strategy Note was May 19, 2011.
CURRENCY EQUIVALENTS (US$1 = 17,676 dobras as of March 12, 2014)
GOVERNMENT FISCAL YEAR
January 1- December 31
ABBREVIATIONS AND ACRONYMS
AAA Analytical and Advisory Activities AfDB African Development Bank ANP/NPA National Petroleum Agency BPC Business Plan Competition CAS Country Assistance Strategy CASCR Country Assistance Strategy Completion Report CEM Country Economic Memorandum CEMAC Economic and Monetary Community of Central Africa CIIP Competitive Industries Innovation Program CPS Country Partnership Strategy CSO Civil Society Organization DeMPA Debt Management and Performance Assessment DP Development Partner DPO Development Policy Operation DSA Joint Bank-IMF Debt Sustainability Analysis DTIS Diagnostic Trade Integration Study ECCAS Economic Community of Central African States ECF IMF Extended Credit Facility EEZ Exclusive Economic Zone EITI Extractive Industries Transparency Initiative EMAE Empresa de Água e Electricidade (Water and Electricity Utility Company) ENCO Fuel Import Company ESMAP Energy Sector Management Assistance Program EU European Union FAO Food and Agriculture Organization FDI Foreign direct investment FPD Financial and Private Sector Development GDP Gross domestic product GEF Global Environment Facility GNI Gross national income GPE Global Partnership for Education HDI UNDP Human Development Index HIPC Heavily Indebted Poor Country HIV/AIDS Human Immunodeficiency Virus/Acquired Immunodeficiency Syndrome ICT Information and communication technology IDA International Development Association IDF Institutional Development Fund IFAD International Fund for Agricultural Development IFC International Finance Corporation ILO International Labor Organization IMF International Monetary Fund ISN Interim Strategy Note JDZ Joint Development Zone JSAN Joint Staff Assessment Note MDG Millennium Development Goals MDTF Multi-donor Trust Fund MIGA Multilateral Investment Guarantee Agency MSME Micro, Small, and Medium Enterprise
i

NGO Non-Governmental Organization NOA National Oil Account ODA Official Development Assistance ORML Oil Revenue Management Law PAP Priority Action Plan PEFA Public Expenditure and Financial Accountability PER Public Expenditure Review PFM Public Financial Management PIU Project Implementation Unit PPP Purchasing Power Parity PREM Poverty Reduction and Economic Management PRI Political Risk Insurance PRSP Poverty Reduction Strategy Paper PPIAF Public-Private Infrastructure Advisory Facility PSD Private Sector Development PWP Public Works Program RBCSP Results-Based Country Strategy Paper, AfDB ROSC Report on Observance of Standards and Codes SDR Special Drawing Rights SMEs Small and Medium Enterprises SOE State-Owned Enterprise SPS Sanitary and Phytosanitary Measures SSA Sub-Saharan Africa STP São Toméan Dobra STP São Tomé and Príncipe TA Technical Assistance TBT Technical Barriers to Trade TF Trust Fund UNICEF United Nations Children’s Fund UNDP United Nations Development Program UNEP United Nations Environmental Program UNFPA United Nations Population Fund WBG World Bank Group WDI World Development Indicators WDR World Development Report WFP World Food Program WHO World Health Organization WTO World Trade Organization
IDA IFC MIGA Vice President: Director: Task Team Leader:
Makhtar Diop Gregor Binkert Yisgedullish Amde
Jean Philippe Prosper Saran Kebet-Koulibaly Henri E. Rabarijohn and Boris Divjak
Michel Wormser Ravi Vish Conor Healy
Team Members: The Country Partnership Strategy for the Democratic Republic of São Tomé and Príncipe was prepared by a core team consisting of Elisa Gamberoni, Geraldo João Martins, Mazen Bouri, Sofia U. Bettencourt, Julio E. Revilla, Boris Divjak, and Zafar Ahmed; with contributions from Andrew Osei Asibey, Dirk Bronselaer, Domingas de Fatima Pegado, Eneida Fernandes, Furqan Ahmad Saleem, Isabel Neto, Julio E. Revilla, Manuel Salazar, Stefan Rajaonarivo, Monica Sawyer, Rafael Saute, and Silvia Martinez Romero. Initial overall guidance was provided by Laurence Clarke. Editorial and processing support was provided by Domingas de Fatima Pegado, Salma Chande and Anta Lo.
ii


FY14 - FY18 COUNTRY PARTNERSHIP STRATEGY FOR THE DEMOCRATIC REPUBLIC OF SÃO TOMÉ AND PRÍNCIPE
TABLE OF CONTENTS
EXECUTIVE SUMMARY ................................................................................................ v
I. INTRODUCTION ........................................................................................................ 1
II. COUNTRY CONTEXT AND DEVELOPMENT AGENDA ..................................... 5
A. Political Context............................................................................................................ 5
B. Social Context ............................................................................................................... 5
C. Economic Development ................................................................................................ 6
D. Development Challenges and Opportunities .............................................................. 13
III. WORLD BANK GROUP PARTNERSHIP STRATEGY ......................................... 16
A. Government Priorities and Medium-Term Strategy ................................................... 16
B. Proposed World Bank Group Partnership Strategy .................................................... 16
Theme 1: Supporting Macroeconomic Stability and National Competitiveness ......... 21
Theme 2: Reducing Vulnerability and Strengthening Human Capacity ........................ 26
IV. MANAGING RISKS .................................................................................................. 31
Annex 1: São Tomé and Príncipe: CPS (FY14-FY18): Results Framework.................... 33
Annex 2: São Tomé and Príncipe: Seminar on Small Island Economies ......................... 38
Annex 3: São Tomé and Príncipe - Poverty Profile .......................................................... 41
Annex 4: São Tomé and Príncipe - Statistical Issues ....................................................... 45
Annex 5: São Tomé and Príncipe - CAS Completion Report .......................................... 46
Annex 6: São Tomé and Príncipe: Financial Management and Procurement Systems .... 66
Annex 7: São Tomé and Príncipe: Trust Funds ................................................................ 69
Annex 8: Development Assistance Provided to São Tomé and Príncipe ........................ 70
CPS Standard Annexes ..................................................................................................... 71
Annex A2: Country At-A-Glance ..................................................................................... 71
Annex B2 .......................................................................................................................... 74
Annex B3 .......................................................................................................................... 75
Annex B3 (IFC) ................................................................................................................ 76
Annex B4 .......................................................................................................................... 77
Annex B6 .......................................................................................................................... 78
Annex B7 .......................................................................................................................... 80
Annex B8 .......................................................................................................................... 81
Annex B8 (IFC) ................................................................................................................ 82
iii

Map of São Tomé and Príncipe ........................................................................................ 83
LIST OF BOXES Box 1: Small Island Economies: South-South Sharing of Experiences.................................... 2 Box 2: STP's Tourism Potential ......................................................................................................... 3 Box 3: Addressing Poverty Reduction and Shared Prosperity ................................................. 28 LIST OF FIGURES Figure 1: São Tomé and Príncipe Poverty headcount rate in urban and rural areas, 2000 and 2010 ............................................................................................................................ 12 Figure 2: : São Tomé and Príncipe: Incidence of poverty across regions ........................ 12 LIST OF TABLES Table 1: Selected Social Indicators: São Tomé and Príncipe and Similar Small Island Countries ..................................................................................................................................................... 6 Table 2: Selected Economic Indicators: São Tomé and Príncipe .......................................... 8 Table 3: Theme 1: Supporting Macroeconomic Stability and National Competitiveness 21 Table 4: Theme 2: Reducing Vulnerability and Strengthening Human Capacity .............. 27
iv

EXECUTIVE SUMMARY i. This World Bank Group (WBG) Country Partnership Strategy (CPS) for the Democratic Republic of São Tomé and Príncipe (STP), covering the period FY14 to FY18, is designed to support implementation of STP’s Second Poverty Reduction Strategy Paper (PRSP II). It builds on the most recent Country Assistance Strategy (CAS), which was extended into FY12 through an Interim Strategy Note (ISN) to allow the Government to finalize the new PRSP. PRSP II is designed to reduce poverty in STP by creating the conditions needed for growth and job creation. Growth prospects have recently been affected by the fact that oil production is not likely to commence as expected in 2015. ii. With per capita Gross National Income (Atlas method, 2012) of about US$1,310, but a small population of about 190,000, STP is one of the smallest economies in Africa. It covers 1,000 square kilometers in the Gulf of Guinea. A lower middle- income country, it is vulnerable to shocks due to a narrow export base, climate change, and environmental degradation. A recent seminar in STP on lessons from other small island economies underscored the importance of maintaining macroeconomic stability, fostering competitiveness and diversity, and the role of parliament in forming consensus on the design and implementation of critical reform programs to facilitate private sector-led growth. iii. Although STP is largely peaceful and has been free of political violence since the first multiparty elections in 1991, internal political wrangling has led to repeated changes in government. The previous minority government was replaced by an all-opposition government in late 2012 following a vote of no-confidence, and the political situation remains fragile. National elections are not expected until August 2014. iv. For the past decade the country’s GDP growth has been averaging 5.7 percent. STP maintained macroeconomic stability despite a series of shocks. Per capita income has increased steadily, driven by rising world prices for cocoa, bonus payments for petroleum exploration, and foreign direct investments (FDI) in tourism. Although STP has made major advances in human development outcomes in health and education, it appears from current trends that STP will probably not meet all the Millennium Development Goals (MDGs), particularly those related to gender, and sanitation. However, it has made notable progress in improving the investment climate and the business environment. v. Unfortunately, robust GDP growth has not significantly reduced poverty. The national poverty rate declined from 66.8 percent in 2000 to 61.7 percent in 2010. There are differences by region, gender, and the educational attainments of household heads. For instance, analysis has identified limited opportunities in urban areas and gains in agricultural productivity as possible reasons for a relatively higher urban poverty rate and underscores the importance of job creation, particularly for unemployed youth, and addressing skills mismatches. vi. The CPS is directed to the twin goals of poverty reduction and shared prosperity by strengthening the conditions for job creation. The intent is to create an environment that encourages increased private sector initiative and investment, including FDI, in key sectors of tourism (already growing and with excellent potential based on STP’s biodiversity and scenic, cultural, and historical assets); fisheries and agribusiness (especially cocoa, by
v

addressing the investment climate. credit constraints, and land policy); and potentially also non-tourism services.1 The strategy is to respond to STP’s current priorities through targeted activities and policy reforms to unblock the various constraints with a view to prepare the groundwork for increased external earnings while further improving the stability of the macroeconomy and moving towards a more coordinated and transformational program. The proposed WBG program is nestled within and complementary to the full matrix of donor support. The CPS has two broad themes: (a) supporting macroeconomic stability and national competitiveness, and (b) reducing vulnerability and strengthening human capacity. Gender, partnership, and capacity- building are elements that cut across all the proposed engagements. Under these themes, WBG engagement and policy dialogue will support the Government to improve areas such as public finance and natural resource management, private sector capacity (including tourism and SMEs), business climate and trade regulations, jobs, primary education and skills development, and addressing climate change concerns. WBG will partner with STP to respond to the needs of the vulnerable and poorest of its citizens by providing temporary public works, training, and better targeted social protection. The objective is to ensure that by the end of the CPS period STP has progressed significantly in preparing the groundwork to increase external non-oil earnings and has built upon its strengths and recent gains to harness opportunities for the transformation of the economy. vii. The expected financial envelope for the FY14–FY18 strategy period will include an IDA16/17 allocation equivalent of about US$20 million (excluding new regional IDA activities).2 Given the limited size of IDA funding, selectivity and complementarity will be required: the WBG will engage in areas where it has comparative advantage and can provide support in coordination with other development partners (DPs). IDA resources will be complemented by new resources from DPs, trust funds (TFs), and possible IFC investments and MIGA guarantees. Since recent assessments have validated the effectiveness of Development Policy Operations (DPO) at this stage of STP’s development, this CPS continues the DPO series. Specific investments are envisaged to improve the quality of primary education, address vulnerability to climate change, and enhance job creation by promoting the private sector, with a focus on tourism and agribusiness. These activities will be supported by analytical and advisory activities (AAA), technical assistance (TA), and TFs. viii. The CPS proposes measures to mitigate the numerous risks to the WBG strategy. The main risks are political uncertainty, inadequate institutional and implementation capacity, possible macroeconomic instability and external shocks, a weak nexus between growth and poverty reduction, and issues of economic governance.
1 For instance, STP can in the long-term build the platform to exploit information and communication technology (ICT) potential by developing appropriate skills, and addressing land and promotion policies. 2 IDA allocations for the years beyond FY14 are indicative. Actual allocations may vary depending on: (i) total IDA resources available, (ii) the country’s performance rating, GNI per capita, and population; (iii) the terms of IDA assistance (grants/credits) and the allocation deductions associated with MDRI annual debt service foregone; (iv) the performance, other allocation parameters, and IDA assistance terms for other IDA borrowers; and (v) the number of IDA-eligible countries. Also, IDA allocations are provided in SDR terms, while the US dollar equivalent amount is provided at the exchange rate of US$1.50233/SDR (applicable for IDA16) for FY14 and US$1.50718/SDR (applicable for the remaining years). The exchange rate for each operation depends on the applicable prevailing rate at the time of approval.
vi

FY14-FY18 COUNTRY PARTNERSHIP STRATEGY FOR THE DEMOCRATIC REPUBLIC OF SÃO TOMÉ AND PRÍNCIPE
I. INTRODUCTION
1. Covering the period from FY14 to FY18, this World Bank Group (WBG) Country Partnership Strategy (CPS) for the Democratic Republic of São Tomé and Príncipe (STP) is timed to support the implementation of STP’s Second Poverty Reduction Strategy Paper (PRSP II). The Cabinet approved PRSP II (2012–16) in July 2012, and the IDA-IMF Joint Staff Advisory Note (JSAN) on the strategy was submitted to the two boards on March 18, 2013. PRSP II targets priority areas to create and ensure the conditions essential for growth and job creation—and thus poverty reduction—before the start of oil production. Since it is now not clear when oil production will begin, PRSP II incorporates two macroeconomic scenarios: a baseline with oil production commencing in 2015, and an alternate where oil production does not materialize during the period covered by PRSP II. 2. STP is a small and fragile island state. A lower-middle-income country—an archipelago of just over 1,000 square kilometers in the Gulf of Guinea—STP is one of the smallest economies in Africa. It has just over 190,000 inhabitants and per capita gross national income (GNI) of about US$1,310 (2012, Atlas method, current US$).3 During 2000–10, STP experienced average growth of 5.7 percent. Meanwhile, however, the absolute national poverty rate declined only from 66.8 to 61.7 percent. Limited job opportunities and high urban unemployment, particularly among youth, are among the root causes why poverty is stagnant. Furthermore, the economy has a narrow export base and is highly dependent on external support. It also has a small internal market, faces environmental degradation, and frequent turnover in government. 3. To achieve its poverty reduction goals, STP can build on significant recent achievements:
• With a more stable macroeconomic framework—inflation has fallen, domestic primary deficit targets have been met, and its international reserves are comfortable — STP, with the support of its DPs, essentially is ready to harness its natural-resource potential to achieve sustained, broad-based growth, and to avoid the “resource curse.”
• Income distribution is equitable and the Gini coefficient is relatively low.4 • The country has significantly improved its Doing Business ranking and tops the list of
global reformers of business regulation.5 • Its human development outcomes are promising. For example, its ranking on the
UNDP Human Development Index (HDI) is higher than the sub-Saharan African average, the literacy rate is 90 percent, and health and education indicators are good though there are issues regarding the quality of services.
3 PPP GNI per capita in 2012 was US$1,810 (current US$); World Development Indicators (WDI) 2013. 4 Though still low, the Gini coefficient has increased slightly in the past 10 years. 5 Heritage Foundation Index of Economic Freedom
1
• STP has enhanced transparency in the use of public resources, with higher Public Expenditure and Financial Accountability (PEFA) scores, and is now a candidate for membership in the Extractive Industries Transparency Initiative (EITI).
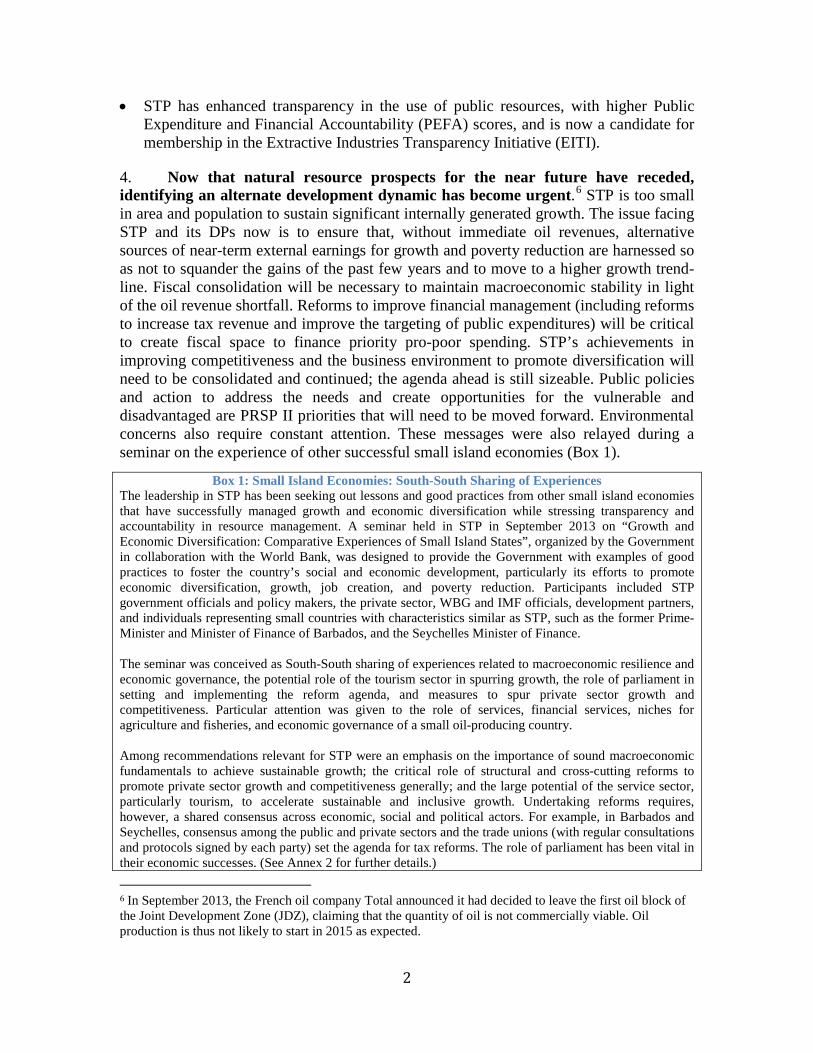
4. Now that natural resource prospects for the near future have receded, identifying an alternate development dynamic has become urgent.6 STP is too small in area and population to sustain significant internally generated growth. The issue facing STP and its DPs now is to ensure that, without immediate oil revenues, alternative sources of near-term external earnings for growth and poverty reduction are harnessed so as not to squander the gains of the past few years and to move to a higher growth trend-line. Fiscal consolidation will be necessary to maintain macroeconomic stability in light of the oil revenue shortfall. Reforms to improve financial management (including reforms to increase tax revenue and improve the targeting of public expenditures) will be critical to create fiscal space to finance priority pro-poor spending. STP’s achievements in improving competitiveness and the business environment to promote diversification will need to be consolidated and continued; the agenda ahead is still sizeable. Public policies and action to address the needs and create opportunities for the vulnerable and disadvantaged are PRSP II priorities that will need to be moved forward. Environmental concerns also require constant attention. These messages were also relayed during a seminar on the experience of other successful small island economies (Box 1).
6 In September 2013, the French oil company Total announced it had decided to leave the first oil block of the Joint Development Zone (JDZ), claiming that the quantity of oil is not commercially viable. Oil production is thus not likely to start in 2015 as expected.
Box 1: Small Island Economies: South-South Sharing of Experiences The leadership in STP has been seeking out lessons and good practices from other small island economies that have successfully managed growth and economic diversification while stressing transparency and accountability in resource management. A seminar held in STP in September 2013 on “Growth and Economic Diversification: Comparative Experiences of Small Island States”, organized by the Government in collaboration with the World Bank, was designed to provide the Government with examples of good practices to foster the country’s social and economic development, particularly its efforts to promote economic diversification, growth, job creation, and poverty reduction. Participants included STP government officials and policy makers, the private sector, WBG and IMF officials, development partners, and individuals representing small countries with characteristics similar as STP, such as the former Prime-Minister and Minister of Finance of Barbados, and the Seychelles Minister of Finance. The seminar was conceived as South-South sharing of experiences related to macroeconomic resilience and economic governance, the potential role of the tourism sector in spurring growth, the role of parliament in setting and implementing the reform agenda, and measures to spur private sector growth and competitiveness. Particular attention was given to the role of services, financial services, niches for agriculture and fisheries, and economic governance of a small oil-producing country. Among recommendations relevant for STP were an emphasis on the importance of sound macroeconomic fundamentals to achieve sustainable growth; the critical role of structural and cross-cutting reforms to promote private sector growth and competitiveness generally; and the large potential of the service sector, particularly tourism, to accelerate sustainable and inclusive growth. Undertaking reforms requires, however, a shared consensus across economic, social and political actors. For example, in Barbados and Seychelles, consensus among the public and private sectors and the trade unions (with regular consultations and protocols signed by each party) set the agenda for tax reforms. The role of parliament has been vital in their economic successes. (See Annex 2 for further details.)
2

5. A number of drivers of growth and job creation can accelerate progress towards poverty reduction and greater shared prosperity. Regardless of the timing of oil production, inclusive growth can be achieved by building upon present potential in tourism and related services, and agriculture (including cocoa, fisheries, and agribusiness) as well as hydropower. In the longer-term, STP can take advantage of the country’s strengths (e.g., high literacy rate, improved internet and regional connectivity) to expand in areas such as ICT and related areas. Despite their potential, these strengths also have some limitations that need to be addressed while STP responds to the vulnerable and poorest of its citizens by providing temporary public works, training, and better targeted social protection.
• Tourism is now the primary source of foreign exchange, having replaced cocoa. It represents about 5 percent of GDP and over 40 percent of total export earnings. The sector also has considerable potential to generate income and employment through backward linkages to the local economy. STP has several major strengths for tourism development (See Box 2). Given its natural and cultural assets, STP can become a preferred tourism destination in the west and central Africa and beyond in Europe. However, the cumbersome visa approval process needs simplification, and an open skies policy and better airport facilities7 would expand STP’s currently minimal connectivity. Appropriate skills in demand are also scarce. Given tourism’s untapped potential, a speedy adoption of the medium-term tourism development strategy that will prioritize public and private investment and attract FDI, will be important for STP. A sound marketing plan and work force training are therefore needed to build up the sector.
Box 2: STP's Tourism Potential
Tourism can serve as the key engine of growth for STP. Unlike many of its neighbors, STP remains peaceful with untapped natural resources and cultural assets. STP’s cultural heritage includes remains of the colonial Portuguese architecture in the capital city of São Tome, the plantations – roças - on both islands with their own rail network, and its history; while its natural endowment includes small nested beaches and several eco-systems including rainforests that host one of the most bio diverse areas in the world (from large sea turtles and fish, to birdlife and butterflies, as well as orchids and other endemic flowers and plants). One can also find pristine lakes and waterfalls, various types of vegetation and animals, making STP ideal as an adventure and trekking destination. STP can easily be branded as an “ecotourism” destination—indeed, the limited advertising it has engaged in already uses biodiversity as its theme. The geographic location of the island at the “center of the world” has also been used as part of the marketing of the destination. Tourism packages that combine: sun and sea, cultural heritage and history, biodiversity and science, and sports and adventure may be the winning formula for tourism development.
7 Frequency of weekly flights from Europe to STP is planned to increase from just once to three times beginning in July 2014, and airport facilities are being upgraded with support from Angola. However, the new weekly flights will last longer and will transit via Ghana. Ghana and STP however do not share a bilateral air transit agreement. Similarly STP does not have commercial agreements with countries that possess regional and international hubs; namely, South Africa, Kenya, and Spain.
3

• Agriculture and fisheries can benefit from recent economic growth and reforms. Though the primary sector has declined in importance, it still accounts for about 20 percent of GDP and a large share of household income. Cocoa’s productivity remains low and its production fell with the collapse of the large plantations (roças) and lack of support to smallholders, even though at the turn of the 20th century, the majority of global cocoa production originated from STP. Cocoa and emerging crops such as coffee and palm oil are cash crops with a ready international market. A quick way to revive production is by supporting cooperatives and attracting agribusiness operators and traders to stimulate production and processing focusing on higher-end niches (e.g., high quality and organic production). This will gradually boost employment and incomes for the population, which would address both poverty and shared prosperity issues. But again there is little access to credit or FDI, land rights are unclear and land plots dispersed, marketing and branding are not coordinated, and little value is added locally.8 Nevertheless, the tourism-related development of roças, through their privatization and less rigid land ownership approach, may gradually re-launch niche agricultural production at these plantations. WBG’s proposed approach is to start an engagement in the sector given its importance for growth, employment, and relevance for the poorest. As an entry point, the WBG proposes to initiate sectoral AAA to update the knowledge base. Policy aspects in agriculture may also be explored (e.g., land) to help advance the dialogue. Progress in these initiatives will be assessed around the CPS midpoint (CPSPR) and consideration will be given to ramping up engagement in the sector based on the preliminary findings.
6. The WBG strategy supports the Government’s response to these opportunities and challenges by its alignment with PRSP II objectives and its coordination with other DPs. The strategy will help create an environment that encourages private sector initiative and investment, including FDI, through both targeted activities and policy reforms. Because the IDA envelope is limited, selectivity and complementarity are necessary. The WBG will engage in areas where it has comparative advantage and can coordinate with other DPs. Better donor coordination, at a meaningful level of detail and specificity to close gaps and eliminate overlaps, is paramount. The UNDP-led exercise in preparing the donor support matrix is the focal point, and the CPS is positioned to be an integral part of donor- coordinated support to STP. The strategy is responsive to current priorities and the need to prepare the groundwork to generate external earnings while building on the macro-economic and structural gains, leading ultimately to economic transformation. 7. The CPS proposes engagements to strengthen STP’s competitiveness and the business environment within a stable macroeconomic framework, and to promote its ability to deliver better services by enhancing human capacity and skills development while reducing vulnerabilities. Thus the CPS thematic focus is to support STP to (i) maintain macroeconomic stability and improve competitiveness, and (ii) reduce vulnerability and build up human capacity. A program of activities supported by
8 DTIS, December 2013
4

IDA and TFs, with focused AAA to underpin the engagements proposed, will accompany the policy dialogue. IFC and MIGA will be close partners in supporting reforms and generating deals. Given the small size of STP, even a few of the right type of transactions can have a transformational impact on growth, jobs creation, and regional connectivity.
II. COUNTRY CONTEXT AND DEVELOPMENT AGENDA A. Political Context 8. Although STP has been largely free of conflict and political violence since its first multiparty elections in 1991, internal political wrangling has caused repeated changes in government. Following a political confrontation in December 2012 and a no-confidence vote, the minority government led by Prime Minister Patrice Trovoada was replaced by an all-opposition government headed by Prime Minister Gabriel da Costa. Although this new government holds a narrow majority with 29 of the 55 seats in Parliament, the cohesiveness of the coalition is untested; an unsuccessful vote of no-confidence in July 2013 is testimony to this fragility. Though national legislative elections are not expected until August 2014,9 the political situation remains delicate. The new government’s parliamentary backing is fragmented, leading to the possibility of an early election should members of the current governing coalition fall out. The fragmented political scene is likely to make policy implementation and legislative action difficult, although the policy environment has been stable despite the many government changes in the past decade. B. Social Context 9. STP’s human development outcomes have significantly improved. It ranks 144th out of 186 countries in the HDI—higher than the sub-Saharan Africa (SSA) average—and its indicators are improving consistently. The country continues to make progress in expanding access to education and health services. Its health outcomes are good: life expectancy is 66 years, and mortality and morbidity rates are far below the SSA averages (see table 1). An increase in the proportion of births attended by skilled birth attendants has brought about a steep decline in maternal and child mortality; the incidence of malaria has fallen from 1,27310 (2004) to 62 (2012) per 1,000 children under 5, and HIV/AIDS prevalence is less than 1.5 percent. STP has also made good progress in education, especially at the primary level, and at about 89 percent literacy is high (2010). Secondary education has not yet achieved universal coverage, however; supply is limited to the main urban areas. 10. STP is not likely to meet all the Millennium Development Goals (MDGs). Progress has been made in some of the key human development indicators (e.g., primary education, albeit with quality issues; maternal and child mortality rates; halting the spread of HIV/AIDS; access to safe water). However, significant strides are still necessary in the areas of gender, partnering for development (see Annex A2), and sanitation. Appropriate
9 Economist Intelligence Unit (EIU), Country Report. 10 A figure above 1,000 signifies more than one episode of malaria per child per year.
5

sanitation facilities are lacking in STP for large parts of the communities in rural and sub-urban areas11. 11. The STP constitution and subsequent laws emphasize gender equality. The 2004 Country Gender Assessment noted a dichotomy between official gender equality laws and policies and actual gender-associated socioeconomic status. Although women are well-represented at the highest political level, at lower levels their influence on political decision-making is limited. Women’s labor force participation is also lower than that of men and their unemployment rate higher (see Annex 3: Poverty Profile, which has gender-specific data on most indicators). In 2010, of all those older than 15, 84.7 percent of women were literate compared to 93.9 percent of men; yet for those aged 15–24, the 95.9 percent literacy rate of women overtook that of men (94.7 percent)(WDI).
Table 1: Selected Social Indicators: São Tomé and Príncipe and Similar Small Island Countries
Data for 2012 (unless otherwise noted)
Sub-Saharan Africa
(Developing)
São Tomé
and Príncipe
Cabo Verde
Comoros
Maldives
Seychelles Population (million) 910.4 0.188 0.494 0.718 0.338 0.088 GNI per capita, Atlas method (current US$) 1,351 1,310 3,830 840 5,750 12,260 HDI Index (UNDP HDI 2012) 0.475 0.525 0.586 0.429 0.688 0.806 School enrollment, primary (% gross) 2011 100.0 127.8 111.5 106.2 .. 106.9 School enrollment, primary, female (% gross) 2011
96.3 125.9 107.1 97.2 .. 109.6
Mortality rate, under-5 (per 1,000 live births) 97.6 53.2 22.2 77.6 10.5 13.1 Maternal mortality ratio (modeled estimate, per 100,000 live births) 2010
500 70 79 280 60 ..
Improved water source (% of population with access) 2011
62.6 97.0 88.7 95.1 (2010)
98.6 96.3
Improved sanitation facilities (% of population with access) 2011
30.5 34.3 63.3 35.4 (2010)
98.0 97.1
Internet users (per 100 people) 15.4 21.6 34.7 6.0 38.9 47.1 Telephone lines (per 100 people) 1.4 (2011) 4.7 13.9 3.1 7.1 33.1
Source: World Development Indicators; UNDP Human Development Index C. Economic Development Recent Economic Developments 12. Growth rates for STP have been high in recent years. In the past decade real GDP growth averaged 5.7 percent, compared to just 1.4 percent for the 1990s. Propelled by rising world cocoa prices, bonus payments for petroleum exploration, and FDI in tourism,12 growth led to a sustained increase in per capita income for the first time since independence. 13. When in the first nine years of this century fiscal expansion led to double-digit inflation and a steep depreciation of the dobra,13 in 2010 the Authorities
11 DPs such as the European Community, Brazil, and the United Nations are supporting water and sanitation projects. 12 Country Economic Memorandum (CEM), 2011. 13 Ibid.
6
pegged the exchange rate to the euro. Together with falling food and fuel prices the peg brought inflation down dramatically, from 32 percent in 2008 to 10.6 percent in 2012. International reserves, estimated at US$53.4 million in 2013, represent more than 4.5 months of non-factor imports, well above the IMF program floor of 3 months.14 14. STP is on a fiscal consolidation path. As a result of the exchange rate peg, fiscal policy has been the main tool for maintaining macroeconomic stability. The country has reduced nonessential current expenditures, contained the nominal growth of the wage bill, and reduced arrears between the Treasury and parastatals. 15. STP is continuously improving the transparency of its management of public resources. In the 2012 Open Budget Index, the STP rank jumped from 94th (the bottom position) to 62nd, and it was recognized as one of the top reformers in the world in budget transparency. Also, in 2013 STP for the first time prepared a Citizens’ Budget for transparent public discussion of the allocation of resources. Although STP still gives minimal information to the public in its budget documents, continued reforms are expected to further improve the transparency of and accountability for public resources. 16. These efforts have helped STP to maintain macroeconomic stability despite a series of shocks. STP’s growth in 2013 is estimated around 4 percent amid the persistent economic slowdown among key European partners. Beginning in 2012, STP has been experiencing a deceleration of growth, down from 4.9 percent in 2011, because of lower-than-expected official transfers financing capital expenditures and FDI. Nevertheless, fiscal consolidation efforts helped STP to maintain a domestic primary deficit of 3.1 percent in 2013, in line with the IMF Extended Credit Facility (ECF) target. (Table 2) 17. Yet STP is still highly vulnerable because of its narrow export base. The current account deficit excluding official transfers is projected at 34.1 percent of GDP in 2013. Current account deficits have been covered by private capital inflows and donor support. Official net overseas remittances have increased, but still only account for 3 percent of GDP. After reaching 25 percent of GDP in 2010, FDI has continuously declined reaching 8.4 percent of GDP in 2012. 18. Behind-the-border barriers have limited STP’s trade competitiveness. Given the fixed exchange rate, the inflation differential with the euro zone resulted in a real exchange rate appreciation that negatively affected exports. However, constraints on competitiveness are mainly rooted in microeconomic issues. The Diagnostic Trade Integration Study (DTIS) Update, while hailing the government efforts in setting up a single window for foreign trade transactions, streamlining bureaucracy and creating a single point of contact for the entrepreneurs, suggests strengthening transparency and reducing costs, removing infrastructure bottlenecks, improving the technical skills of the labor force, and strengthening regional integration.
14 IMF First Review under the Extended Credit Facility (ECF) Arrangement, July 2013.
7

Table 2: Selected Economic Indicators: São Tomé and Príncipe 2011 2012 2013 2014 2015 2016 2017
Real EconomyGDP (billions of Dobras) 4375.5 5021.3 5732.1 6524.1 7064.3 7588.7 8179.7GDP at constant prices 4.9 4.0 4.0 5.0 5.5 5.5 6.0Imports of goods and non factor services 20.7 16.1 0.3 7.0 10.2 6.7 8.6Exports of goods and non factor services 22.0 -5.4 5.4 9.1 7.5 5.6 6.4Unemployment rate 14.7 14.2 13.8CPI (period average) 14.3 10.6 8.2 7.1 5.0 3.5 3.0CPI (End of period) 11.9 10.4 8.0 6.0 4.0 3.0 3.0
Fiscal AccountsTotal revenue, grants, and signature bonuses1 37.1 33.6 31.7 31.9 32.7 33.4 34.2
Total revenue 18.0 15.3 16.9 16.6 16.9 17.1 17.4Tax revenue 16.6 14.0 15.2 15.3 15.6 15.8 16.1Nontax revenue 1.4 1.3 1.7 1.3 1.3 1.3 1.3
Grants 18.3 17.5 13.2 15.3 15.8 16.3 16.8Oil signature bonuses 0.8 0.8 1.6 0.0 0.0 0.0 0.0
Total expenditure 49.0 44.3 39.0 38.9 38.6 38.5 38.4Current expenditure 19.4 17.4 18.3 18.1 17.8 17.7 17.6
Of which: personnel costs 8.4 8.4 8.5 8.2 8.1 8.1 8.1Interest due 0.5 0.6 0.4 0.6 0.6 0.5 0.5Goods and services 5.3 3.9 4.0 4.0 3.9 3.8 3.8Transfers 4.1 3.8 4.8 4.6 4.6 4.6 4.6Other current expenditure 1.0 0.8 0.6 0.6 0.6 0.6 0.6
Capital expenditure 28.9 26.6 20.3 20.3 20.3 20.3 20.3Of which: financed by the Treasury 1.5 1.5 1.7 1.7 1.7 1.7 1.7Financed by external sources 27.5 25.1 18.6 18.6 18.6 18.6 18.6
HIPC Initiative-related social expenditure 0.7 0.3 0.5 0.5 0.5 0.5 0.5Domestic primary balance 2 -3.0 -3.3 -3.1 -3.0 -2.6 -2.3 -2.0Overall balance (commitment basis) -12.0 -10.8 -7.3 -7.0 -6.0 -5.1 -4.2
Selected Monetary AccountsBase Money -0.7 28.6 42.9 10.0 9.0 5.5 7.0Credit to the economy 14.5 9.6 9.4 9.9 10.2 11.1 11.1Central bank reference interest rate (percent) 15.0 14.0 ... ... ... ... ...Bank lending rate (percent) 27.0 26.2 ... ... ... ... ...Bank deposit rate (percent) 12.4 12.9 ... ... ... ... ...
Balance of paymentCurrent Account Balance (exclud official transfer) -46.5 -38.9 -34.1 -32.0 -31.0 -30.1 -29.3Current Account Balance (including official transfer) -26.6 -20.5 -20.2 -15.9 -14.5 -13.0 -11.6
Imports -59.4 -53.7 -48.1 -45.3 -44.2 -42.9 -41.9Exports 11.8 12.9 11.0 10.2 10.2 10.1 10.0
Foreign Direct Investments 12.8 8.4 9.0 7.0 7.0 7.0 7.0Other investment (net) 11.9 16.8 14.2 10.0 7.2 5.7 5.8
of which public sector net 9.1 5.8 8.9 6.5 5.1 4.8 4.0Gross Reserves (in millions US$)3,4,5 39.7 43.8 53.4 59.0 65.2 70.3 75.8
In months of next years imports6 4.6 4.8 5.5 5.7 6.0 6.1 6.2National Oil Account (US$ millions) 8.3 9.0 12.2 9.9 8.0 6.5 5.3Real effective exchange rate 11.7 5.0Exchange rate (dobras per US$; end of period )7 19008.5 18584.5 18288.0 18046.2 17822.9 17640.2 17470.5External Debt8 73.3 84.1 80.8 76.8 75.8 74.8 73.0
Other memo itemsGDP nominal in US$ (millions) 248.3 263.3 310.2 359.1 393.9 428.0 465.9Sources: São Tomé and Príncipe authorities and IMF staff estimates and projections.1 Includes HIPC and MDRI debt rel ief.2 Excludes oi l related revenues , grants , interest earned, scheduled interest payments , and foreign-financed capi ta l outlay.3 Gross international reserves exclude the National Oi l Account and commercia l banks ' foreign currency depos i ts at the BCSTP in order to meet reserve requirements and foreign currency depos i ts of commercia l banks used appl ication depos i ts for new l icens ing or for meeting capi ta l requirements . 4 For 2009, includes the proceeds from the privatization of the government's share in the National Fuel Company (ENCO) of $32 mi l l ion. Of this , $10 mi l l ion were used to pay back some of ENCO's debt to Sonangol , $0.96 mi l l ion were used to audit the transaction and $21.4 mi l l ion were put in the BCSTP to boost reserves .5 For 2009, includes new a l location of SDR 6.5 mi l l ion.6 Imports of goods and nonfactor services excluding imports of investment goods and technica l ass is tance. 7 Centra l Bank (BCSTP) mid-point rate.8 It includes debt in dispute
Annual percentage changesProjected
Percentage of GDP
Annual percentage changes
Percentage of GDP
8
19. STP relies heavily on external donor assistance for both recurrent and capital expenditures (Table 2). More than 90 percent of the public investment program is supported by donors and most pro-poor recurrent expenditures are financed by Official Development Assistance (ODA). Sector-wide approaches and direct budget support are seldom used, and donor-financed projects often bypass government institutions entirely. This undermines fiscal sustainability as recurrent expenditures on donor projects are not adequately accounted in budget documents.15 20. Despite positive results from the Government’s fiscal consolidation reforms and recent progress in reforming state-owned enterprises (SOEs), the SOEs are still characterized by poor service and weak financial performance. Their shaky financial position, particularly that of the national electricity and water utility (EMAE), has generated contingent liabilities and necessitated transfers from the Government that undermine its own fiscal position. Arrears between EMAE and the now partially privatized national oil importer, ENCO, have not yet been settled. In addition to these arrears, ENCO is claiming additional payments from the Government to cover losses arising from government restrictions on the prices ENCO is allowed to charge.16 Economic Prospects 21. Though near-term STP’s economic outlook is clouded, the longer-term outlook is positive. In 2014 growth is expected to accelerate, mainly driven by investments in construction to support tourism, agriculture, and fisheries. Large private investments include requalification of the airport in Príncipe and oil palm projects. Donors will continue to finance most public capital spending. 22. Growth prospects have been undermined by the fact that oil production is no longer expected to start in 2015. GDP growth had been expected to jump to about 38 percent in 2015, but in September 2013, Total, the French oil company, announced its decision to leave the first oil block of the Joint Development Zone (JDZ),17 citing findings that exploration based on the given oil quantity is not commercially viable. In its first public response, the Ministry of Infrastructure and Energy declared that enough oil is available and that medium-size enterprises are currently evaluating the possibility of replacing Total. The shortfall in expected government revenue will necessitate fiscal adjustments to control debt and will likely affect foreign investment, which had been based on expectations for the development of the oil sector.
15 In July 2013, the Government held a second donor meeting and presented the draft Priority Action Plan (PAP) to support the policy areas identified in the PRSP II and the related PAP. Donor meetings are now held on a quarterly basis to exchange information about ongoing and planned projects. 16 ENCO is not allowed to sell petroleum products at “real” prices, since their retail prices, which are set by the Government, do not include import costs, taxes, and distribution margins. The Government sets ad hoc official retail prices for petroleum products, and there is no system to automatically adjust them to international prices. Hence, retail prices are often below the real prices. 17 In 2001, STP and Nigeria signed the Joint Petroleum Exploration Treaty to manage the joint exploration of potential oil resources in the JDZ.
9

23. Reserves are expected to be sufficient to keep the peg credible and keep inflation on a downward path. International reserves are projected to remain well above the standard metric of three months of imports during 2014. The credibility of the peg has been enhanced by a €25 million credit line from Portugal18 and access to the US$9.9 million deposit to the National Oil Account (NOA). Inflation is estimated to have been 8.2 percent in 2013 and projected to fall to about 7 percent in 2014 due to an increase in agricultural production and stable international food prices. 24. The Government is committed to accelerate fiscal consolidation in order to maintain macroeconomic stability. In recent years STP was able to finance sizable domestic primary fiscal deficits from oil-signature bonuses and privatization receipts. However, with the privatization account depleted, the Government is likely to have few options for domestic financing in 2014–15. The Authorities will concentrate on the fiscal adjustment agenda, with continued efforts to raise domestic revenues. They plan to broaden the tax base (adding an estimated 3,000 taxpayers by year-end 2014) and better manage tax collections (using the ASYCUDA World system to make customs collection more efficient). The Authorities, as part of the IMF ECF program, plan to strengthen tax administration and with support of the AfDB to set in place a strategy to optimize tax revenues. The Government plans to achieve a domestic primary fiscal deficit of 3 percent of GDP by 2014 and then gradually reduce it to 2 percent by 2017. 25. The Debt Sustainability Analysis (DSA 2013) notes that STP is at high risk of debt distress over the medium term, and debt sustainability will require fiscal adjustment and borrowing on highly concessional terms. Reaching a debt profile that is consistent with manageable (though high-risk) debt dynamics would require the additional fiscal adjustment of 1 percent of GDP over 2015–17 as projected; continued heavy reliance on grants and highly concessional lending; and intensified efforts over the medium term to diversify the economy and expand the export base. The DSA also recommended fiscal prudence, particularly in the run-up to the 2014 elections. Debt service indicators are particularly sensitive to changes in the terms of public borrowing, suggesting that STP is highly exposed to changes in loan concessionality, and needs to seek out only highly concessional financing. STP is subject to IDA’s non-concessional borrowing policy (NCBP) which requires that the country adopts a prudent external borrowing policy reliant on grants and highly concessional loans. STP’s medium- and long-term public and publicly guaranteed external debt was estimated at US$221.6 million (84 percent of GDP) as of December 2012. The debt burden increased from US$200.1 million at end-2011 (due to disbursements from Portugal and Nigeria) yet remains significantly below the pre-debt relief high of US$359.5 million at end-2006. The share of multilateral debt declined from nearly 60 percent before the HIPC completion point to 20 percent. Portugal is now the country’s main bilateral creditor, and IDA is its main multilateral creditor, although since FY2008, STP’s IDA financing has been provided on 100% grant terms in response to STP’s high risk of debt distress. In March 2014, however, the authorities signed an agreement with Angola for a loan
18 The credit line is a buffer against a potential worsening of the balance of payments and automatically kicks in when reserves fall below 3 months of imports.
10

amounting to US$40 million to be spent during 2014-2015, which does not meet the minimum concessionality element of 50 percent agreed upon under the IMF program and required by the NCBP. A new joint WB-IMF DSA is under preparation and is expected to be completed by the end of May 2014. The DSA will analyze the impact of this loan on debt sustainability indicators. In the meantime, the Bank is deepening its policy dialogue with the authorities on this issue, and will assess the borrowing in the context of the NCBP. Poverty Profile19 26. STP’s robust GDP growth in recent years has not translated into high level of poverty reduction. Indeed, between 2001 and 2010, the growth elasticity of poverty (with respect to growth in per capita income) was about 0.5, meaning that for each 1 percent increase in per capita income, poverty decreased only by 0.5 percent.20 27. There are also disparities in poverty between regions. The Center region, which is predominantly rural, has the lowest poverty rate (57.3 percent), though even there rates21 in urban areas are higher (Figures 1 and 2), with the capital, Água Grande, at 62 percent. In the poorest southern regions, where many coastal fishing villages are located, 74 percent of the population is poor. Finally, the poverty rate on the island of Príncipe, very isolated as well as mostly rural, is a high 69 percent. The Center region experienced a major fall in poverty (about 7 percentage points) between 2000 and 2010. Poverty rates in southern STP are almost invariant. 28. Though still relatively low, STP’s income inequality has increased between 2000 and 2010, particularly in urban areas. This partly explains the small gains in poverty reduction despite an increase in GDP per capita. Despite this increase, STP remains among the countries with the most equal income distribution in SSA. The Gini index in 2010 was 33.6, well below the median Gini index for SSA (42.7)22, with urban areas recording a Gini index of 34.3 compared to 32.7 in rural areas, and with a faster increase in urban areas. 29. Poverty reduction has been larger for households whose head is more educated. In 2010, the poverty rate was 73.8 percent when the head of household had no formal education, 66 percent when the head had some primary education, 55.1 when the head had finished secondary school, and 31.9 percent when the head had tertiary education. The poverty rate did not change between 2000 and 2010 when the head of the household had no education, but rates went down 9.1 percent for households whose heads had primary education and 10.1 percent for those whose heads had tertiary education.
19 This section draws on the forthcoming World Bank São Tomé and Príncipe Poverty Assessment. 20 Data for GDP per capita start in 2001 (WDI database). Poverty rates are based on the STP 2000 and 2010 Household Surveys. To ensure consistency, the change in poverty rate between 2001 and 2010 is constructed using a linear interpolation. 21 Unless otherwise stated, poverty rates refer to absolute poverty. 22 Calculations based on the latest available data in Povcalnet.
11

Figure 1: São Tomé and Príncipe Poverty
headcount rate in urban and rural areas, 2000 and 2010
Figure 2: : São Tomé and Príncipe: Incidence of poverty across regions
Source: World Bank staff estimates based on São Tomé and Príncipe Household Surveys 2000 and 2010. 30. Female-headed households are poorer, and their poverty rate was reduced less than for male-headed households. This probably relates to differences in education: 67 percent of female heads of household have no formal education versus 33 percent for male heads. The poverty rate for female-headed households fell from 71.4 percent in 2000 to 67 percent in 2010, compared to a drop from 64.7 percent to 58.6 percent for male-headed households. 31. Few job opportunities may explain why the poverty rate has stagnated in urban areas. Urban poverty rates are mainly driven by the labor market of the capital, Água Grande, which accounts for 72.4 percent (2010) of the total urban population. According to preliminary census findings, the population of Água Grande increased by 41 percent between 2001 and 2012. Concurrently there were increases in labor market participation (the inactive rate went down 15 percent) and in the unemployment rate (by 7 percentage points). One reason for the increase in active workers is the emergence of a tertiary sector, with hotels, banks, and supermarkets. This has generated new economic interactions but is unable to integrate all new workers entering the labor market due to problems of both supply (skills mismatch, given a low-skilled labor force) and demand (small and weak firms) issues. 32. Productivity gains in agriculture might explain the lower poverty rate in the center of the country. The center has benefitted from DP programs to support creation of cocoa farmers’ and fishermen’s cooperatives, which have pushed up agricultural productivity. These programs began in the mid-1990s with PNAPAF (the National Support to Smallholders Program) and continued with PAPAFPA (the Participatory Smallholder Agriculture and Artisanal Fisheries Development Project). They offer advice on microcredit, extension services, and diversification, and build rural infrastructure. In the south-west, by contrast, the agriculture sector, though crucial, is poorly developed and infrastructure is lacking, which makes the region highly vulnerable to price variations and a deeply inadequate basic food supply.
12

D. Development Challenges and Opportunities 33. As noted, STP has considerable opportunities to reduce poverty and foster shared growth, especially through tourism, niche agriculture, and fisheries. There is also hydropower potential and new oil production potential (although viability is not certain).
• Despite frequent changes in government, STP has been relatively peaceful. This bodes well for accelerating poverty reduction and shared growth, since conflict retards development.23
• Access to education and health services has greatly improved. The 2011 CEM indicates that education was a major driver of economic growth in STP. Thus, productive sectors can draw more easily on well-developed human resources.
• The country has impressively improved its business climate. It was acknowledged as one of the 10 top reformers in the 2012 Doing Business Report (it shot up in ranking from 180 out of 183 countries to 160 out of 185 countries),24 and that same year the Heritage Foundation’s Index of Economic Freedom named it the top global reformer of business regulations (for instance, in 2011 STP increased registered businesses by about 35 percent.)25 IFC and the Bank have supported an initiative to simplify customs clearance procedures.26 STP has also advanced licensing reforms (also with support from IFC and the Bank) and instituted an e-visa system to encourage tourism. Since the country became a member of the Multilateral Investment Guarantee Agency (MIGA) in December 2012, potential investors can now tap opportunities to insure against political risk. It is expected that MIGA will seek out opportunities to work with the WBG team.27
• Governance and transparency in the management of public resources are continuously improving. STP is currently ranked 72nd out of 176 countries on the Transparency International Corruption Perception Index, up from 111th in 2009.28 There has been an increased public participation in the budget process and in the transparency and comprehensiveness of the budget documents. Public financial management (PFM) is more professional and recent laws will make it more effective. STP has adopted an oil revenue management law (ORML) to establish the basis for good management of oil-related institutions and has become a candidate for EITI membership. But, as noted below, challenges remain.
• STP is more active in regional cooperation initiatives, as is critical given its limited economies of scale and its insularity. It is a member of the Economic Community of Central African States (ECCAS) and the Community of
23 The nexus between development and conflict is discussed in the World Development Report, 2011. 24 Doing Business rankings for 2014 have declined by a few notches to 169 out of 189; the “dealing with construction permits” measure regressed the most, by 10 places. 25 However, the EIU Country Report indicates a slowdown in the momentum for reforms after initial enthusiasm, reflecting perhaps government complacency or a lack of support to implement policy reforms; STP’s drop by three places in the 2013 Doing Business Index illustrates this loss of momentum. (EIU Country Report, 2nd Quarter 2013, p.17). 26 Ibid, p.17. 27São Tomé and Príncipe CAS Completion Report (see Annex 5). 28 EIU Country Report, 2nd Quarter 2013.
13
Portuguese Speaking Countries. Angola has extended STP a line of credit and the two countries have signed a partnership agreement to improve port and airport infrastructure. Brazil is cooperating with STP on a technical training center, and STP has a fisheries agreement with the European Union (EU). All these activities should help STP to integrate more closely with neighboring countries for trade and other forms of economic cooperation.
34. Yet if it is to significantly reduce poverty, the country needs to tackle major challenges. Since its recent robust GDP growth has not had much impact on poverty, STP needs to put into action a game-changing strategy to meet the ambitious PRSP II goal of reducing poverty by another 10 percent by 2016.
• Unemployment and skills development: The unemployment rate grew from 12 to 14 percent between 2000 and 2010, and even more in urban areas. Of the working age population, 58.3 percent are employed, 19 percent unemployed, and 22.7 percent inactive.29 Though the employment rate for men is 90 percent, for women it is 81.3 percent. Unemployment is also high among youth: about 23 percent of those aged 15–24 are unemployed and another 29 percent are inactive. About 25 percent of the poor are unemployed, and another 35 percent are inactive. According to the 2011 CEM, STP needs to create 31,000 new jobs within 10 years—a 70 percent increase from the current level. Skills mismatch also contributes to unemployment.
• Macroeconomic stability: Because a stable macro-economy is a precondition for growth, STP needs to commit to tight fiscal discipline. Fiscal consolidation efforts will be crucial to provide the space needed to finance vital, especially pro-poor, expenditures. They include reforms to step up tax collection, revise the fuel pricing mechanism, clear the arrears between EMAE and ENCO, and make public spending more efficient—for instance, electricity subsidies are not well targeted30
• Governance and institutional capacity: Despite significant progress, debt management and other PFM reforms are still at an early stage. The credibility of budget execution is minimal. Auditing and procurement processes need to be tightened. Regulations still need to be drafted to fully operationalize the debt law.
• Private sector development, competitiveness, and investment flow: Property rights, particularly for land, need to be clarified; small and dispersed land plots raise the cost of agriculture; and red tape abounds. Limited access to credit is a major problem and the majority of the population, especially the poor and those in agricultural cooperatives, lack access to financial resources; unclear property rights make use of collateral difficult. There is thus an urgent need to couple regulatory and macro reforms with catalytic interventions to build capacity, improve the competitiveness of the private sector, and promote access to finance in order to take advantage of new niche opportunities.
• Diversification and trade integration: STP’s product concentration is very high even when controlling for the size of the domestic market. Tourism has replaced cocoa as the primary source of foreign exchange. The CEM recommends a focus on
29 Profil de la Pauvreté a São Tomé et Príncipe en 2010, Version du 22 décembre 2011, p.42. 30 Draft Poverty Assessment.
14

growing sectors that have the most export potential, such as tourism and related services. The Bank’s DTIS Update provides recommendations on high-priority areas identified based on STP’s main trade challenges.
• Infrastructure deficits: STP suffers from a shortage of electrification (60 percent) and its high cost; frequent blackouts represent economic losses of about 4 percent of GDP a year. PRSP-II emphasizes the need to expand the capacity of EMAE, partly by exploring options for alternative power generation. Also, the lack of access to low-cost, high-quality telecommunications services limits the potential for growth, although the new submarine cable, put in place with Bank support31 and operational since early 2013, is expected to ease communication shortcomings and lead to possible growth in ICT-based services in the longer term. Finally, there is a need to explore sustainable development of ports in STP.
• Service delivery and quality of human capital: Large numbers of the poor find it difficult to access basic services like secondary education, health care, and nutrition because of barriers related to both supply (lack of services) and demand (lack of household income) constraints. Quality of education is a major concern. Teachers are not well-qualified and learning time is limited by a multiple shift regime.32 Quality indicators based on standardized tests are absent. Repetition rates at all levels, though they have been brought down substantially, are still high. Health sector issues include limited and imbalanced distribution of qualified human resources, a weak health information system, and low-quality local services. STP has a high number of fatalities associated with road traffic injuries, and the incidence of non-communicable diseases is increasing.
• Social protection: The population is highly vulnerable to unpredictable shocks, such as food shortages and climate change. STP has some social protection programs, mostly in social assistance, but their coverage and effectiveness are low. Social insurance involves several contributory programs, including elderly pensions, disability, medical, and maternity and other subsidies. There is an array of small and underfunded social assistance interventions implemented by several agencies as well as nongovernmental organizations (NGOs) and DPs.
• Environmental protection: STP is naturally prone to flooding and coastal erosion. High rates of erosion, caused both by removal of sand for construction and by storm surges, threaten coastal residents, who are among the poorest communities in STP, the poor having traditionally settled in marginal lowland areas left vacant by old plantations. The vulnerability of coastal settlements is therefore increasing rapidly, particularly as floods and sea storms intensify and property loss worsens. High rates of youth unemployment have also increased pressures on natural resources, particularly fishing and forestry. STP’s vulnerability to climate change can only increase: the forecast is for temperatures to climb by an average of 2°C as
31 The World Bank’s Regional Central African Backbone Project supported financing of the cable. 32 Almost one-third of the primary schools (grades 1– 4) used to work on a triple-shift system, with average class-time of only two or three hours daily. Attrition was also high; only 47 percent of STP children reach 6th grade. By eliminating triple shifts and constructing new classrooms, teaching time now averages 3.5 hours per day, and survival rate from grades 1 to 6 has increased (ICR Social Support Project, Report No. ICR00002683).
15
precipitation drops by about 15 percent; that means longer dry seasons and more flooding and fogs, which have contributed to an STP fishermen mortality rate that is triple the world average.
• Statistical information: STP’s statistics still need further improvement (see Annex 4). A household survey was conducted in 2010, and the Bank is supporting government preparation of a poverty assessment. The dearth of demographic data and the lack of targeted surveys, such as enterprise and labor market surveys, make it harder to analyze aspects of the economy and estimate the true scale of poverty. Better data are also needed to evaluate critical sectors, such as an agricultural census that will be crucial for designing policy that promotes agricultural investment (DTIS Update).
III. WORLD BANK GROUP PARTNERSHIP STRATEGY
A. Government Priorities and Medium-Term Strategy 35. PRSP II identifies priority areas of intervention for 2012–16. Its goals are to create and ensure maintenance of conditions essential for growth and job creation, and thus poverty reduction. PRSP II has four pillars: (i) promoting good governance and public-sector reform; (ii) supporting sustainable and inclusive economic growth; (iii) enhancing human capital and extending basic social services; and (iv) reinforcing social cohesion and social protection, particularly for vulnerable groups.33 PRSP-II prioritizes good governance, competitiveness and diversification, and natural resource management, especially transparency in the use of oil revenues and capacity in the oil sector. The Bank-IMF JSAN observed that the PRSP II presents a coherent analysis and offers appropriate policies for long-term poverty reduction and sustainable economic growth. It also noted that the primary poverty reduction objective – a 10 percent decrease in the poverty rate over the next four years–is ambitious. B. Proposed World Bank Group Partnership Strategy Lessons from the CAS Completion Report 36. The CAS Completion Report (CASCR, Annex 5) discusses major lessons learned from WBG engagement during the last CAS and ISN period. In preparing the current CPS, these lessons were taken into account:
• Broad-based macroeconomic support is key to ensuring successful implementation of a CPS. Bank support anchored on policy instruments and macroeconomic performance, such as DPOs, provided structure and mitigated political instability and frequent changes in government priorities. The reforms supported by the WBG including the ongoing DPO series are in line with PRSP-II, which was developed through an extensive consultative process, including
33 Democratic Republic of São Tomé and Príncipe, Second National Poverty Reduction Strategy (2012-2016), March 2012.
16

representatives of the Government, its cooperating partners, STP’s major political parties, civil society organizations, and other stakeholders throughout the country.
• Close coordination between the Bank and the IFC has helped STP to make significant progress in making the business environment more attractive. To consolidate these gains, that coordination should continue. Now that STP has also joined MIGA, this CPS is based on a WBG program that benefits from close collaboration among IFC, MIGA, and IDA.
• STP might now be served better by shorter, timely, and more focused policy notes in critical areas, since major analytical pieces such as the CEM, Poverty Assessment, and DTIS Update, have already been produced.
• Support to the petroleum sector through the EITI should continue. This would help to ensure that efforts to build capacity are pursued and that reforms are put in place to allow solicitation of new contracts to explore the Exclusive Economic Zone (EEZ). The WBG should also support the Government to continue to build on recent gains in transparency and accountability in the general public sector as well as the petroleum sector.
• To consolidate recent gains, the CPS should continue its engagements in the social sectors. The Social Sector Service Project (SSSP, US$8.6 million) has had encouraging results in both health and education, and further support is expected through the Global Partnership for Education (GPE).
• Poor donor coordination has led to ineffective use of funds and other inefficiencies. After sporadic inefficient donor coordination efforts, the Government, with support from the UNDP, convened donors’ meetings in December 2011 and December 2012, and in July 2013 it presented a draft Priority Action Plan (PAP) to support the policy areas identified in the PRSP II. Quarterly donor meetings to exchange information are now planned. Since the country is highly dependent on donor support, the WBG should take on a greater coordinating role in its areas of expertise. The capacity of the Authorities to coordinate and integrate donor programs should be built up.
• In this spirit, the Bank should continue to promote a multi-stakeholder approach to harness the unique contribution of DPs to provide an interconnected program of knowledge, projects, and technical assistance (TA).
• Dedicated staff in STP can move the program forward faster. Given the limited program and resource envelope, it is recommended that fiduciary staff representing financial management, procurement, and accounting within the Ministry of Planning serve as a Project Implementation Unit (PIU), with dedicated project staff added as needed, rather than separate PIU for each project.
Lessons from the Client Survey 37. The CPS also draws on the findings of a June 2012 client survey in which about 200 stakeholders were invited to give their opinions on the Bank’s assistance to STP. Of these, 40 percent were from ministries and implementation agencies. Among lessons from the survey applied in preparing this CPS were that:
17

• Those within government could become more familiar with the WBG. Knowledge of the WBG was extremely low—not surprisingly, since there is no WBG office in STP and the portfolio is focused on a few sectors. A question would be how to strengthen key relationships with government officials.
• Energy, agricultural development, and foreign direct investment are seen as crucial if poverty is to be reduced effectively.
• Other issues identified as important in the survey were whether the Bank supports programs that are realistic for STP; the effectiveness of Bank support; and concerns about Bank flexibility and timeliness. Asked what factor is most responsible for slowing reforms, a third of the respondents cited inadequate citizen participation.
Lessons from Stakeholder Consultations 38. In preparing the CPS, the WBG team met with a wide range of stakeholders, including civil society organizations (CSOs), the media, business associations, NGOs, and members of Parliament. Some CSOs, such as FoNG (an NGO umbrella group), provide services while others are professional associations with limited scope of action. Some enthusiastic youth groups could benefit from training in leadership and demand-side governance to better impress their footprint on society, and many indicated that unemployment and lack of access to finance to start businesses are major problems. Members of Parliament consulted explicitly asked for support to set up specialized commissions to deal with development challenges related to, e.g., PFM, climate change, extractive industries, and fragility. The Bank is identifying programs that could respond to that request. Overview of the WBG Partnership Strategy 39. The proposed CPS is aligned with the development vision of the Government as outlined in PRSP II and the twin WBG goals of poverty reduction and shared prosperity. The strategy proposes to partner with the Government to respond to STP’s current priorities through targeted activities and policy reforms to unblock the various constraints that hinder private sector initiatives and investment flows. This will help generate increased external earnings by further improving the stability of the macroeconomic framework; enhancing skills and reducing vulnerabilities; and moving towards a more coordinated and transformational program. It focuses on two broad themes—(i) supporting macroeconomic stability and national competitiveness; and (ii) reducing vulnerability and strengthening human capacity. Gender, partnership, and capacity building are elements cross-cutting all CPS activities. To support these themes, WBG engagements during the CPS period will be directed to reinforcing PFM; unblocking major policy constraints to investment flow; developing the right skills mix; brokering transactions to bring in investments and expertise; and addressing vulnerabilities while filling in critical knowledge gaps. The first theme recognizes the importance for STP of ensuring macroeconomic stability, making management of public and natural resources more transparent, and building up the private sector and trade integration. The second theme is directed to more effective social protection, delivering
18

better-quality services, and supporting skills development. The associated Results Framework identifies outcomes linked to both current and proposed WBG activities (Annex 1). 40. The CPS is particularly attentive to both the WBG agenda on jobs (WDR 2013) and the Africa Region’s continuing work on youth employment. These have helped focus the CPS on such interventions as enhancing the business environment (e.g., access to finance and infrastructure, increased electrification, and ICT), human capital (quality of education and skills development), youth employment, diversification, and as common for small island nations, connectivity to the global market. Engagement Areas and Objectives 41. Given limited WBG resources, selectivity is crucial. The CPS proposes limited engagements that respond to client demands and will contribute most effectively to poverty reduction and shared prosperity. Expected outcomes from the proposed activities (as outlined in Box 3) will be achieved by leveraging Trust-Funds and partnerships, and by undertaking key analytics to complement the limited IDA envelop. Criteria for program selection are:
• Knowledge as the foundation: The WBG will leverage the AAAs already available (e.g., PER, CEM, DTIS Update, Poverty Assessment with analysis of gender-disaggregated data) to prioritize proposed interventions. Certain areas of knowledge work are identified, such as the tourism strategy, skills, and social protection, as building blocks for future interventions. The CPS proposes to undertake demand-driven and flexible just-in-time policy advice in areas critically linked to WBG activities (e.g., DPO series). AAA can also serve to build knowledge in new areas where the WBG would like to be engaged, for instance, agriculture where AAA would provide the platform to advance policy issues such as land reforms.
• Comparative advantage and readiness: Proposed interventions will be assessed based on WBG comparative advantage in the area, availability of WBG staff with relevant expertise, implementation capacity, realistic assessment of risks, and flexibility given capacity constraints. Since STP needs are high, staff will also call on trust fund (TF) and other resources to support priority activities.
• Closer coordination and harmonization with DPs in priority areas will be vital to access additional resources and enhance their effectiveness. For example, while water and sanitation needs are significant, this CPS does not propose WBG engagement given the substantial engagement of the EU, Brazil, and the UN, among other DPs. Similarly, the health sector receives considerable support from other donors. In recent years, IFAD and the UN have been lead agencies in the agricultural sector; the WBG hopes to complement their efforts by focusing on policies and institutions (e.g., land policy, agribusiness support, and access to credit), and perhaps through IFC transactions.
• Any proposed activity will leverage all the institutions in the WBG. For instance: IFC will continue to support competitiveness/investment climate-related reforms
in collaboration with the Poverty Reduction and Economic Management
19

(PREM) and the Financial and Private Sector Development (FPD) units. It may also seek to operate in transactions that facilitate development of the targeted tourism, and agriculture/ agribusiness sectors.
MIGA will explore offering political risk insurance (PRI) guarantees across a range of products to encourage investment, especially in tourism and possibly natural resources. As an IDA country, STP is a strategic priority for MIGA.
42. The CPS will continue the DPO series. Currently, the WBG is the only donor providing budget support, and the CASCR confirmed the effectiveness of the DPOs (with a focus on governance and competitiveness), which have produced desirable policy outcomes. Continuation of the DPO series, informed by related analytical work and complementing a TA on improving the business climate, will be used to consolidate these outcomes, supplemented by specific instruments to address vulnerability, skills development, and private sector development (PSD)/job creation objectives. Within the DPO series, the possibility of engaging in the agriculture sector, for example, by looking at policies related to land reforms, will be explored provided there is consensus and ownership. 43. There are significant synergies among the proposed CPS activities. For instance, the DPO-supported policy and institutional reforms will be complemented by the private sector operation, TA, AAA, and IFC/MIGA activities in order to ensure that the reforms undertaken have the desired impact on private sector led growth. Skills development is incorporated into components within the private sector support, social protection, and ongoing teacher training projects, along with analytical work on skills strategy. Finally, employment generation is enhanced through the private sector initiatives, and specific (though small-scale) employment activities are included in the private sector, social protection, and adaptation to climate change operations. 44. These proposed activities have particular focus on the identified engines of growth. While proposed activities to support the tourism sector are explicit, the WBG proposes to undertake an agriculture sector AAA (including assessing the export potential of niche products to the region), and to increase the sector’s linkages with the tourism sector. For instance, the business plan competition of the proposed PSD project will support SMEs/farmers interested in increasing the linkages between the agricultural and tourism sectors (e.g., by providing fruits and vegetable to hotels), thus sharing the prosperity from the envisioned tourism growth. In addition, although coffee and cocoa are covered by donor programs (such as a PAPAFPA) and by the exporters already operating in the country, given the climatic conditions of STP, there is potential to export other niche products such as tropical flowers and fruits, especially to neighboring countries. The envisioned agriculture AAA will assess the regional export markets for niche products to neighboring countries like Angola, Equatorial Guinea, and Gabon, and will also propose agricultural policy issues that can be addressed as part of the DPO series.
20

Theme 1: Supporting Macroeconomic Stability and National Competitiveness
Table 3: Theme 1: Supporting Macroeconomic Stability and National Competitiveness
Outcomes Indicators 1. Strengthened public financial and natural resource management
- Availability of budget information to the public - Preparation, auditing, and presentation of State annual financial statements for legislative scrutiny - Percentage of direct contracting in procurement - Existence of a debt management strategy - Public disclosure of new fishing agreements and licenses within one month of signing agreements or issuing licenses - Improved accountability in oil sector governance
2. Enhanced statistical system - Population and housing census 3. Improved private sector capacity with a focus on the tourism sector and SMEs
- Medium-term tourism development strategy with an Action Plan - Number of entities engaged in provision of tourism services - Occupancy of private sector tourist capacities - Number of entrepreneurs receiving business development services (40% women) - Number of micro-enterprises and SMEs benefitting from access to finance as a result of business plan development and IFC’s MSME risk sharing program - Number of private sector employees benefitting from training (50% women)
4. Improved business environment and trade regulations
- Number of days required to obtain a construction permit - Average cost of compliance with business regulations (as percent of per capita income) - Number of days to export and import
5. Better targeting of energy subsidies
- Tariff rates and targeting of subsidies
6. Improved regional broadband connectivity
- Retail price of internet services
45. Maintaining macroeconomic stability is fundamental for robust economic growth, diversification, poverty reduction, and shared prosperity. The importance of prudent macroeconomic management was underscored at the seminar on small island economies (Box 1 and Annex 2). To this end, collecting more tax revenue and using public resources more efficiently will be crucial, as will more effective delivery of essential public goods and services on which the poor rely most heavily. WBG support will again buttress government efforts to move forward with critical reforms in these areas. Diversifying STP’s small economy, harnessing PSD-led growth, and enhancing trade integration are critical if poverty reduction is to accelerate. The drivers of growth such as tourism and agribusiness, have not yet fully benefited from reforms to date due to constraints in capacity and access to finance, as well as complex business procedures. Attracting more FDI, as well as greater regional integration, could be furthered by using TF and other resources while leveraging the DPO series, the PSD project, and possible IFC initiatives. Cross-sector interventions range from investing in sea and air transit and rural infrastructure to reduce trade costs and improving labor force vocational and technical skills to sector-specific and trade-related policy reforms.
21

46. Outcome 1: Strengthened public financial and natural resource management: Consolidating macroeconomic gains and dismantling critical barriers to harnessing drivers of growth are major objectives (e.g., a more viable energy sector, more efficient public spending, and more transparency in petroleum and fisheries operations). Proposed AAA on agriculture should also begin to highlight possible areas for policy dialogue and future reforms (e.g., land). The new DPO series will support selected policy areas working in close coordination with the IMF and other DPs.
• Increasing tax collections and the efficiency of public spending. Enhancing tax revenue collection, and reducing cross-arrears between Treasury, EMAE, and ENCO, will be vital to create fiscal space and reduce the dependence of the budget on external resources. The Authorities, as part of the IMF ECF program, are planning to introduce measures to strengthen tax administration and, with the support of the AfDB, identifying a plan to optimize tax revenues. Supported by DPO2, the Government has committed budget resources to pay utility bills of public sector bodies to EMAE.34 The Authorities, as part of the ECF program, are further elaborating a plan to improve the financial sustainability of EMAE and in turn, to clear arrears from EMAE to ENCO. The WBG, in close collaboration with the IMF and AfDB, will support the government efforts to implement these plans and to identify a strategy to revise the fuel price mechanism. These efforts will be informed by the forthcoming Poverty and Social Impact Analysis (PSIA) on electricity subsidies and a proposed policy note on public spending.
• Improving PFM transparency and accountability. The WBG program will help STP to build up financial statement preparation, auditing and public procurement systems. This relatively young PFM system faces quantitative as well as qualitative capacity constraints. STP has gone through the first steps of legislative and institutional public procurement reform, but poor capacity constraints at central level institutions as well as in the Procurement Management Units at sector level hamper good public procurement system performance. Apart from current and planned DPO actions, AAA is proposed to analyze the procurement system performance with special attention to quantitative and qualitative capacity constraints aimed at increased performance of a small island procurement system and Value for Money (VfM) for beneficiaries (see Annex 6).
• Public debt management. Although with support from the DPO series the Government has begun to manage debt better, the pace of reform has been slow. The WBG, working with the IMF and other DPs, will support the Government to update the 2011 reform plan and elaborate a medium-term debt strategy and related legislation.
• Parliamentary oversight. Parliamentary debate on public policy and oversight by specialized committees are inadequate. The critical role of Parliament in formulating and overseeing reforms was emphasized in the Seminar on Small Island Economies. Based on a specific request from Parliament for help in becoming more efficient, the Bank has outlined such possible areas of
34 This follows the recommendations of the Energy Sector Action Plan prepared by the Bank and IFC, with support from an Energy Sector Management Assistance Program (ESMAP) TA grant.
22

collaboration as South-South knowledge exchanges; formal training and capacity building; and the possibility for STP legislators to take part in WBG-sponsored parliamentarian network gatherings.
• Fisheries management. Fisheries have significant potential to generate public revenues but need to be transparently managed, with tighter monitoring of fishing agreements and licenses. The DPO series is helping to firm up the laws related to disclosure of fishing agreements and licenses information. The Bank has emphasized the need for further reforms to enhance public revenue collection, deter corruption, and curb illegal fishing. Data to monitor fishing activities is essential to achieve these goals. Improving safety for small-scale fishermen is being addressed by Adaptation to Climate Change project financed by the Global Environment Facility (GEF).
• Oil sector governance. Since STP is now an EITI candidate, building the capacity of the National Petroleum Agency (ANP) is a PRSP II objective. The WBG will continue to provide TA on implementing EITI principles through an EITI Multi-Donor Trust Fund (MDTF) to ensure that STP is in compliance by October 2015. The WBG will also offer support for building the capacity of ANP staff and help the Government to review the laws governing the oil industry with a view to making it more competitive and attractive to investors.
47. Outcome 2: Enhanced statistical system. As part of the DPO series, the WBG proposes to help the Government to build up its national statistical system, working in close collaboration with bilateral donors providing assistance dedicated to data collection. There are also a number of areas (e.g., land, fisheries, and enterprise surveys) where improved data will be needed to inform the policy discussions and options.
48. Outcome 3: Improved private sector capacity with a focus on the tourism sector and SMEs. Lack of access to financing and high interest rates,35 together with lack of management capacity and ill-targeted marketing strategies, have depressed private sector development and diversification, narrowing the sector’s employment potential. Legal and institutional reforms in agriculture and land will also need to be addressed to spur agribusiness investment, land productivity, and use of collateral to access financing. The support envisaged will build upon IFC TA and DPO reforms.
• Tourism: The WBG, including IFC and possibly MIGA, will support tourism by continued support to simplify regulation and visa processes, and by enhancing STP capacity to implement a tourism strategy. TA on management will be provided to the Directorate of Tourism. The sector may also be supported by TFs, such as the CIIP linked to the Private Sector Development Project. The proposed agricultural sector AAA would also explore the linkages and supply chains for the tourism sector. IFC will work with the Bank to define conditions for increased private investment in the STP tourism and hospitality industry through a feasibility and market assessment study, and will actively explore new markets
35 In STP interest rates are high—31 percent on short-term bank loans, compared to 18 percent in Gabon and 10.5 percent in Burkina Faso.
23

and partnerships, e.g., with Brazil. MIGA can support this effort by offering political risk guarantees, for example, to ensure land concessions for tourism development against the risks of breach of contract and expropriation, thus eliminating a potential obstacle to FDI. Moreover, MIGA analysis of potential engagements may help to identify other obstacles to foreign investment and hence feed into WBG private sector development work. Backward linkages with the local economy may also be evaluated, which may lead to jobs being created in manufacturing, services, and agriculture and also help improve infrastructure. These linkages can be supported through the proposed BPC Project, which would unfold a continuum of support for promising entrepreneurs with the assistance of local partners. All this should lead to more job opportunities and greater entrepreneurial skills for young people.
• Support to SMEs: The package of support to SMEs, focusing on tourism as the key growth service sector, and niche agribusiness (including cooperatives), will center around two pillars: promoting access to finance and building SME capacity. The agenda for promoting financial inclusion is broad and covers areas of legal framework and collateral registry system; capacity building; implementation of a leasing program under IFC’s Africa Leasing Facility to enable acquisition of productive assets by local SMEs; promotion of financial literacy; and entrepreneurship and SME skills development through a business plan competition (BPC)36. An early intervention would support the Authorities to develop a financial sector development strategy that would define, prioritize, and cost key measures for promoting financial inclusion and ensure financial sector stability. Specific training to SMEs may also be provided by IFC’s Sustainable Business Advisory Services through the “Business Edge” product program. The proposed IDA Private Sector Development Project will provide direct capacity building support to entrepreneurs and employees for SMEs in the priority sectors of tourism and related services as well as agribusinesses. Existing Bank and IFC TFs will seek to be utilized to advance the microfinance agenda.37. IFC also plans to launch SME toolkit activities with the private sector. This initiative would be complemented through parallel financing by TFs such as the Competitive Industries and Innovation Program (CIIP) focusing on sectors such as tourism, the Financial Sector Reform and Strengthening (FIRST) Initiative advancing financial inclusion, and other donor initiatives that aim to promote private sector development. To foster small enterprise access to commercial loans, IFC will aim to enter into a Risk-Sharing Facility with one of STP’s leading commercial banks (IDA MSME Risk Sharing Facility).
49. Outcome 4: Improved business environment and trade regulations. The STP Government has adopted a plan to reform the investment climate and has already moved forcefully, with IFC TA. The Authorities now plan to establish an electronic Business Registry System, online incorporation and other public services, draft a new Construction
36 This initiative will link with the Outcome on skills development strategy. 37 IFC research on feasibility of microfinancing in STP found that there appears to be no current initiatives, or appropriate institutional and legal frameworks.
24

Act, introduce insolvency legislation, streamline municipal licensing of microbusinesses, and build up commercial courts. The Bank’s support to create an alternative dispute mechanism that may be endorsed by IFC may result in an arbitration tribunal being set up, which would bypass the current lack of judicial capacities. These efforts would be supported by TA from the IFC Investment Climate Reform Program, complemented by TFs such as CIIP, with policy reforms supported by the new DPO series. These reforms will help existing enterprises to grow, help businesses to move beyond the informal sector, and increase their likelihood to access business development services and finance. To improve energy supply, the WBG will continue its support to the sector and also draw on the findings of on-going analytical work on power sector efficiency improvement; the goal is to identify key interventions to reduce electrical losses and to make one of STP’s hydropower plants more efficient. The CPS also proposes to support STP’s efforts to reduce costs of trading. IFC and the Bank together will support the Government in defining a roadmap for sustainable port development on STP islands, taking into account competing regional port infrastructure. The WBG may also help the Government identify a strategy on regional integration opportunities and reforms to reduce the costs, time, and paperwork required to import and export, and establish a single electronic trade window. 50. Outcome 5: Better targeting of energy subsidies. The energy sector faces many challenges, including inability to carry out adequate power utility management. The WBG will continue its support to the energy sector and also draw on the findings of the ongoing AAA on Power Sector Efficiency Improvement. It will focus on identifying the key interventions to reduce electrical losses (technical and commercial). The WBG, in close collaboration with the IMF and AfdB, will support the Government to implement these plans and to identify a strategy to revise the fuel price mechanism. These efforts will be informed by the forthcoming Poverty and Social Impact Analysis (PSIA) on electricity subsidies and a planned policy note on public spending. The WBG proposes to provide capacity building to improve energy utility management, including a gap analysis of the current situation, and developing a methodology to calculate technical losses. It will also support the training of local workforce in the application of the methodology. Other agencies are currently working in the sector: UNDP is preparing a GEF project to promote environmentally sustainable and climate resilient grid-based hydroelectric electricity through an integrated approach, to promote investments in renewable energy and reduction of pressure on natural resources from competing land uses. 51. Outcome 6: Improved regional broadband connectivity. While it was dependent on satellite communications, STP was ill-placed to compete in the global economy, given that countries connected to submarine cables access international capacity at a fraction of the cost.38 This limited its potential to create jobs, expand production of goods and services, and trade competitively with the rest of the world.
38In East Africa in particular, where three submarine cables arrived in the last three years, the volume of traffic has increased almost 20-fold, and prices have dropped by a factor of almost 10—from US$3,750/Mbps/month before cables arrived in 2007 to US$400/Mbps/month today. Prices are down to US$100 in Morocco and Australia, and as low as US$10 in Europe.
25

However, a submarine cable (supported by the Bank39) has been operational since early 2013 and has eased STP’s communication problems (Annex 5, CASCR). A second telecommunication operator has now been selected, which should lead to even more affordable communication services and harness the potential of ICT to create jobs and opportunities. STP may also request and benefit from follow-up projects, such as the Central African Backbone (CAB6) regional program. The Government has expressed its wish to connect Princípe Island to the backbone, which may be possible through planned projects between Equatorial Guinea and Príncipe, but is not yet confirmed.
Theme 2: Reducing Vulnerability and Strengthening Human Capacity 52. The poor are highly vulnerable to shocks, both economic and climate-related, that affect household income and consumption. Thus, there is a need for a social protection strategy to help the extremely poor to better manage risks and cope with shocks, while promoting investment in child development by improving access to social services and participation in income-generating activities. The Government has made modest progress, with support from DPs, in drafting a social protection strategy and making a safety net system operational. In 2011, with the support of UNICEF and ILO, the Government analyzed the social protection system and is currently drawing up a social protection strategy focused on noncontributory interventions. 53. Delivering quality social services and providing an appropriately skilled labor force has been a challenge for STP. The quality of education is low: there is no learning assessment system, 60 percent of teachers are unqualified, and education management is poor. STP, with support from the WBG, has increased access to primary education, but even with high youth literacy, there is a large gap in skills development since the secondary completion rate is less than 60 percent and achievement in vocational and technical education beyond that is even lower. As a result youth unemployment is twice the national level and the inactivity period after graduation is very long.40 54. Outcome 7: Improved poverty targeting. The Social Protection Policy and Strategy being discussed recognizes the need to better target safety net interventions if extreme poverty is to be eliminated by 2023; other social indicators also need significant improvement. Given how little it has been reduced in the past 10 years, it is necessary to understand the dynamics of poverty to identify optimal poverty reduction and shared prosperity measures. The WBG is working with the Government on a thorough assessment of poverty dynamics so that targeting and policy formulation can be improved. The current PSIA on energy will also inform policy makers on how to better target the poor. The WBG will provide TA to the Government, in collaboration with other DPs (particularly UNICEF), to support design and realization of the social protection policy and strategy. Bank support would include the analysis of options to minimize targeting errors including geographical identification of areas, community
39 The Bank Regional Central African Backbone Project supported financing for the cable. 40 According to the African Development Bank (African Economic Outlook 2012), it takes the average graduate five years to get a job.
26
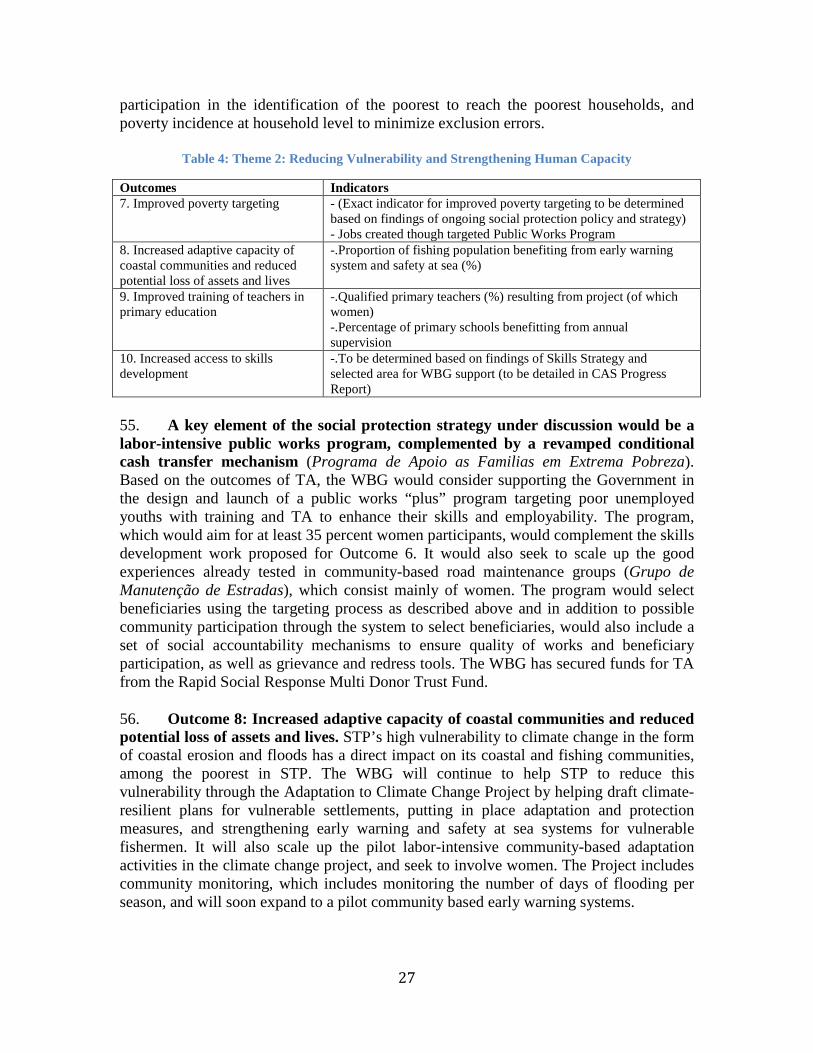
participation in the identification of the poorest to reach the poorest households, and poverty incidence at household level to minimize exclusion errors.
Table 4: Theme 2: Reducing Vulnerability and Strengthening Human Capacity
Outcomes Indicators 7. Improved poverty targeting - (Exact indicator for improved poverty targeting to be determined
based on findings of ongoing social protection policy and strategy) - Jobs created though targeted Public Works Program
8. Increased adaptive capacity of coastal communities and reduced potential loss of assets and lives
-.Proportion of fishing population benefiting from early warning system and safety at sea (%)
9. Improved training of teachers in primary education
-.Qualified primary teachers (%) resulting from project (of which women) -.Percentage of primary schools benefitting from annual supervision
10. Increased access to skills development
-.To be determined based on findings of Skills Strategy and selected area for WBG support (to be detailed in CAS Progress Report)
55. A key element of the social protection strategy under discussion would be a labor-intensive public works program, complemented by a revamped conditional cash transfer mechanism (Programa de Apoio as Familias em Extrema Pobreza). Based on the outcomes of TA, the WBG would consider supporting the Government in the design and launch of a public works “plus” program targeting poor unemployed youths with training and TA to enhance their skills and employability. The program, which would aim for at least 35 percent women participants, would complement the skills development work proposed for Outcome 6. It would also seek to scale up the good experiences already tested in community-based road maintenance groups (Grupo de Manutenção de Estradas), which consist mainly of women. The program would select beneficiaries using the targeting process as described above and in addition to possible community participation through the system to select beneficiaries, would also include a set of social accountability mechanisms to ensure quality of works and beneficiary participation, as well as grievance and redress tools. The WBG has secured funds for TA from the Rapid Social Response Multi Donor Trust Fund. 56. Outcome 8: Increased adaptive capacity of coastal communities and reduced potential loss of assets and lives. STP’s high vulnerability to climate change in the form of coastal erosion and floods has a direct impact on its coastal and fishing communities, among the poorest in STP. The WBG will continue to help STP to reduce this vulnerability through the Adaptation to Climate Change Project by helping draft climate-resilient plans for vulnerable settlements, putting in place adaptation and protection measures, and strengthening early warning and safety at sea systems for vulnerable fishermen. It will also scale up the pilot labor-intensive community-based adaptation activities in the climate change project, and seek to involve women. The Project includes community monitoring, which includes monitoring the number of days of flooding per season, and will soon expand to a pilot community based early warning systems.
27

57. Outcome 9: Improved training of teachers in primary education. The WBG has been actively supporting STP to deliver better deliver education and health services; it also provided technical support to prepare the education Country Status Report 2012, and the Education Sector Plan 2011–13. The assistance has helped to build capacity to deliver health and education services. The on-going Quality Education for All Project (FY14), funded by IDA and a GPE grant, aims to improve in-service teacher training. Partnership is being sought with Portugal, which is quite active in the sector. 58. Outcome 10: Increased access to skills development. Given both high youth unemployment and skills mismatches, the CPS proposes to support enhancements of technical and vocational training by preparing a comprehensive strategy that outlines vision, objectives, and expected medium- and long-term outcomes for the sector. The strategy will provide a coherent umbrella policy covering all the currently sparse and segmented vocational training interventions offering by various DPs. The WBG will work on the strategy with the Government, the private sector, and Brazil, Portugal, and the AfDB, among other partners. Design of any engagement will also draw upon the Africa Region Flagship Report on Skills Development, and to the extent possible also link to the private sector and social protection initiatives that include skills training to SMEs and those participating in labor-intensive employment .
Box 3: Addressing Poverty Reduction and Shared Prosperity
The proposed WBG activities will be designed to address the twin WBG goals through clear linkages: • The DPO series will help maintain macroeconomic stability and trade related reforms that are essential for
growth. Transparency-related reforms will help enhance value-for-money in public spending. Reforms to increase revenue collection, reduce arrears, and improve efficiency and use of public resources will create fiscal space to support priority spending and enhance the delivery of essential public goods and services on which the poor rely most heavily. Reforms to simplify business and trade procedures and spur tourism will help to foster private sector and employment and attract new investments, extending growth benefits to wider population
• Social sector protection and vulnerability reduction interventions will (i) help to identify social safety net programs and targeting mechanisms that will best support the poorest 40 percent, helping to reduce extreme poverty and improve the lives of the lowest two economic quintiles; and (ii) partner with the Government to design and pilot a labor-intensive public works program to support the poorest, smooth consumption, and provide skills training to directly address one of the main reasons that keep certain groups below the poverty line. These activities are intended to support backward linkages, supply chains, and skills development. The Adaptation to Climate Change Project is already reducing the vulnerability of very poor coastal communities by increasing their capacity to adapt to the harmful effects of climate change.
• The PSD-related initiatives include a project that will directly support capacity building for SME entrepreneurs and employees to foster investment and employment creation, so that these entrepreneurs will be in a much better position to access credit and other financial services. It is expected that a growing number of SMEs will cater to agriculture, tourism, and services (e.g., ICT, finance and leasing, vocational training, agribusiness, and agriculture value chains). IFC advisory service, AAA, and TFs will complement private initiatives. The cable regional broad band network project is helping to enhance PSD capacity and connectivity.
• The education and skills activities include a project to improve the quality of primary education and support the transition of better-qualified students to higher education to address the skills shortage and mismatch issues and contribute to greater youth employment in growing sectors. A skills strategy will inform the initiatives in social protection and the private sector.
28

Implementing the FY14–FY18 Country Partnership Strategy Financial Envelope 59. The expected financial envelope for FY14–FY18 will include an IDA allocation (IDA16/17) equivalent to about US$20 million,41 excluding possible new regional IDA activities. IDA allocations for the years beyond FY14 are indicative. Actual allocations may vary depending on: (i) total IDA resources available, (ii) the country’s performance rating, GNI per capita, and population; (iii) the terms of IDA assistance (grants/credits) and the allocation deductions associated with MDRI annual debt service foregone; (iv) the performance, other allocation parameters, and IDA assistance terms for other IDA borrowers; and (v) the number of IDA-eligible countries. Also, IDA allocations are provided in SDR terms, while the US dollar equivalent amount is provided at the exchange rate of US$1.50233/SDR (applicable for IDA16) for FY14 and US$1.50718/SDR (applicable for the remaining years). The exchange rate for each operation depends on the applicable prevailing rate at the time of approval. .New resources will also be leveraged from other DPs, TFs, possible IFC investments, and possible MIGA guarantees. Managing the Program 60. The performance of the portfolio has been largely satisfactory (see Table B2). In its current configuration, the portfolio contains one IDA/GPE Quality Education for all Project which was approved in December 2013; one Regional Central African Backbone APL2 Project (P117652) for US$14.9 million, which has US$1 million left to disburse; a GEF Adaptation to Climate Change Project (P111669) for US$4.37 million, of which 30 percent is disbursed); and TFs (including GEF) totaling US$68.4 million, of which US$64.8 million is disbursed (see Annex 7).42 Efficient PIUs with stable and seasoned staff and experience in managing Bank-financed projects has contributed to the satisfactory performance—there are no problem projects. 61. Management of the program is envisaged to be as follows: Two PIUs are currently managing Bank programs and an EITI Secretariat will be established with MDTF resources. DPOs are handled by the Ministry of Planning and Finance. The CPS proposes a liaison officer to facilitate communication with the Authorities and PIUs, renting space in the UN offices to smooth communication. The CPS also proposes an enhanced PIU within the Ministry of Planning and Finance with fiduciary staff for financial management, procurement, and accounting to support Bank-financed projects, with staff dedicated to particular projects working with the PIU as needed. Although PFM has improved, more needs to be done (see Outcome 1 and Annex 6).
41 This assumes the same IDA17 envelope. IDA 16 envelope for STP was SDR8.5 million (about US$12.8 million—US$4.3 million a year). 42 This amount consists primarily of HIPC Trust Funds.
29
Partnerships and Donor Coordination 62. The WBG works closely with partners in STP to ensure harmonization and better leverage resources. Active multilateral partners in STP include the AfDB, the EU, United Nations agencies (UNDP, UNEP, UNICEF, UNFPA, WFP, WHO, IFAD, FAO), the IMF, and the Global Fund (see Annex 8 for areas of development assistance). Active bilateral partners are Portuguese Cooperation, Brazil, Spain, the French Agency for Development (AFD), the USA, and other countries in the region. In particular: The AfDB is implementing its Results-based Country Strategy Paper (2012–16) to
improve economic and financial governance and strategic planning and programming, and to create a more conducive environment for the private sector. Approved in July 2012, the strategy focuses on a single pillar, “capacity building and institutional strengthening,” to prepare STP for oil production by strengthening key public institutions.
The EU Tenth European Development Fund (2008–13) has projects in transport, trade, public finance, and support to economic reform.
The IMF approved a new Extended Credit Facility (ECF) program in July 2012. This is the third IMF program since 2009. The first review for this new ECF arrangement took place in March 2013. The second review and the Article IV consultation were concluded on December 16 and 19, 2013, respectively.
UNDP, Portuguese Cooperation, and Brazil provide TA for, among other areas, budgetary management. UNDP is also helping STP attain the MDGs and strengthen governance and environmental management, and supports the energy sector. UNDP is the lead agency on donor coordination.
The Millennium Challenge Corporation (MCC) has supported STP as it works to improve both revenue collection and the business environment.
63. In spite of recent progress, there is scope to improve donor coordination. The Authorities met with donors in July 2013 to seek support for the Government’s Priority Action Plan and to discuss donor coordination. Participants noted that the Aid Coordination Unit within the Ministry of Foreign Affairs is inadequate, and most DPs do not have resident representatives. Proposed were quarterly informal coordination meetings and setting up a transparent information system on donor support. The possibility of a multidonor fund to support priority development areas was suggested to reduce transaction costs and improve coordination and management of assistance. At the September 2013 meeting, UNDP presented a consolidated matrix (a first cut) of donor-supported projects. Although the matrix is not yet complete, this represents an important step toward donor coordination. The Government presented a plan for establishing a more effective Aid Coordination Unit, with assistance from UNDP. 64. Moving forward, The World Bank Group will play a larger role in donor coordination. STP is now being overseen by the Gabon Country Office, whose proximity and ease of travel will bode well for enhanced participation in donor coordination.
30

Monitoring and Evaluation 65. Progress on the CPS will be mainly monitored using the Results Matrix (see Annex 1). The results framework links WBG activities to select STP objectives (as articulated in the PRSP II) through chains that clearly identify inputs, outcomes (to be monitored against baseline and target indicators and with gender-disaggregated data where possible) and intermediate milestones. These linkages offer lines of sight to clarify how WBG-supported engagements and partnerships can help STP move toward its objectives of poverty reduction and shared prosperity in STP. A CPS Progress Report at midpoint will offer an opportunity both to assess progress and to make any necessary course corrections. Of particular importance will be what happens in the oil sector. Regular consultations will be undertaken with the client, DPs, and other stakeholders to receive feedback and assess progress. The experience with the community and local feedback mechanisms in the Adaptation to Climate Change Project could be replicated in other WBG engagements, in particular, the Social Protection and Vulnerability Pilot. It is expected that M&E and data-gathering systems already in place or part of other projects in STP will elicit data for measuring results.
IV. MANAGING RISKS 66. The main risk to realization of the CPS emanates from political uncertainty that could slow reform. The current political scene is, as noted, fragmented and fragile; disruptions caused by a sudden change of government could delay or encumber policy reforms, though the major political parties are committed to structural reform. This risk is moderate and is already partially mitigated given that the PRSP-II, which outlines the priorities and policy directions for STP, and with which the proposed CPS program (including the ongoing DPO series) is aligned, was developed through an extensive consultative process and buy-in from wide range of stakeholders including all major political parties. This risk can be further mitigated by a carefully timed sequence of DPOs to advance reforms even with changes in government, complemented by targeted constituency outreach, public information campaigns, stakeholder engagement, and capacity building. Other risks and proposed mitigating measures include:
• Inadequate institutional capacity needs to be resolved. To that end, the WBG has capacity building as a cross-cutting theme in such areas of intervention as economic management, EITI, human development, energy and the business environment.
• Risks to macroeconomic stability are high, also as a result of the high debt level and narrow export base, impacting the DPOs. A new joint WB-IMF DSA is under preparation and is expected to shed more light on the impact of the overall debt on the macro stability. On the Bank’s side, this risk will be mitigated through continuing dialogue with the authorities on this issue. If there is significant deterioration in macroeconomic stability, the Bank will continue providing policy advice but may opt to suspend its DPO program and divert the IDA funds to other programs.
31

• Any global economic slowdown will pose significant risks given STP’s dependence on a narrow export base and limited sources of external earnings. Though the previous global recession did not impact STP strongly, maintaining the focus on prudent macroeconomic management will be key.
• The fiduciary risk related to use of public funds may prove challenging. This risk could be mitigated by tighter internal controls and by the internal and external audits embedded in WBG programs. It would also be helpful to improve fiduciary capacity by strengthening internal controls, improving the quality of accounting records, and producing State financial statements—all of which the CPS proposes.
• Governance may deteriorate. The WBG will continuously monitor aspects of the country situation that might directly affect its programs. The interventions proposed have been carefully selected to ensure appropriate governance.
• Due to compounding risks and challenges all results may not be achieved during the CPS period. Given the small IDA envelope and scale of engagements, a limited administrative budget, constrained staff resources, inadequate STP implementation capacity, and lack of reliable statistical and M&E information, there is a significant risk that all CPS results may not be obtained as scheduled. However, there is demand for WBG resources and advice, and progress achieved in some key areas would substantially unlock the potential for poverty-reducing growth and equitable prosperity.
• The tenuous growth-poverty nexus may continue to be a challenge. Recent economic growth has not translated into commensurate or expected reductions in poverty. The quality of economic growth matters; recent and continuing AAA (CEM, DTIS Update, and Poverty Assessment) will continue to provide the analytical underpinnings of strategies for poverty reduction and their realization. Given the Government’s concerns in this area, WBG has proposed to support a variety of initiatives for poverty reduction and shared prosperity.
32

Annex 1: São Tomé and Príncipe: CPS (FY14-FY18): Results Framework Country Strategic
Objectives
Issues and Obstacles
CPS Outcomes
Milestones
WBG Program
Theme 1: Supporting Macroeconomic Stability and National Competitiveness Improve transparency, and accountability in the use of public resources Strengthen Parliamentary oversight of the Executive Strengthen public debt management Strengthen fisheries sector through improved governance, and management Enhance oil sector governance, accountability, and transparency
Limited fiscal space and high dependence on external financing undermine the ability to sustain spending in priority sectors Lack of transparency in budget preparation, presentation, management; lack of transparency and competitiveness in public procurement Legislative oversight scarcely practiced by the Parliament Lack of a debt strategy and proper legislation Poor monitoring of fishing agreements and licenses; general lack of transparency in the sector Lack of transparency in oil sector management
Outcome 1: Strengthened public financial and natural resource management Indicator 1: Availability of budget information to the public Baseline: 2 out of 6 types of budget information under PEFA methodology made available to the public within one month of their completion (2013) Target: At least 5 out of 6 types of budget information made available within one month(2017) Indicator 2: Preparation, auditing, and presentation of State annual financial statements for legislative scrutiny Baseline: Annual statement for 2010 submitted for audit (2013) Target: Annual statement prepared, audited, and presented within 15 months after close of fiscal year (2017) Indicator 3: Percentage of direct contracting in procurement Baseline: 29% of all contracts (2012) Target: 10% of all contracts (2018) Indicator 4: Existence of a debt management strategy Baseline: No strategy in place (2013) Target: Medium-term debt strategy publicly available (2017) Indicator 5: Public disclosure of new fishing agreements and licenses within one month of signing agreements or issuing licenses Baseline: Not disclosed (2013) Target: Routinely disclosed Indicator 6: Improved accountability in oil sector governance Baseline: EITI reconciliation Report (2013)
• Annual financial statements prepared and submitted to Tribunal of Accounts for audit
• Audit completed and presented to the Parliament for legislative scrutiny and audit report published
• Targeted PFM training/ seminars for parliamentarians conducted
• Debt legislation provides clear authorization to borrow, issue new debt, undertake debt-related transactions, and issue loan guarantees
• EITI Reconciliation Report adopted
Ongoing Financing: • IDA (Regional): Central
African Backbone Phase 2 Project (CAB2)
Indicative Financing: • IDA: DPO3 • IDA: DPO1 (new series) • IDA: DPO2 (new series) • IDA: DPO3 (new series) • IDA: Private Sector
Development Project • IDA (Regional): Central
African Backbone (CAB6) Project (tbc)
• Social Protection and Vulnerability Pilot
• IFC: STP Leasing Program (Africa Leasing Facility)
• IFC: Credit enhancement to support SME financing by local bank (IDA MSME Risk Sharing Facility)
• IFC: Local SME Training through Sustainable Business Advisory Services (Business Edge Program)
• TF: Extractive Industries Transparency Initiative (EITI Multi-Donor TF)
• TF: Competitive Industries
33

Country Strategic
Objectives
Issues and Obstacles
CPS Outcomes
Milestones
WBG Program
Target: EITI Reconciliation Report publicly available and disseminated in the country (2017)
and Innovation Program (CIIP) :
• TF: Financial Inclusion (credit bureau, collateral registry, consumer protection): Financial Sector Reform and Strengthening Initiative (FIRST)
• TF: Strengthening the Institutional Capacity of the Directorate of Tourism (IDF)
Ongoing AAA/Others: • Poverty Assessment • Diagnostic Integrated Trade
Study (DTIS) Update • Poverty and Social Impact
Analysis on Energy (PSIA) • Power Sector Efficiency
Improvement TA • Skills Strategy • IFC: Investment Climate
Reform Program Indicative AAA/Others: • Debt Strategy Reform Plan • Financial Sector Development
Strategy • Policy Note on public
spending • Small Islands Public
Procurement Strategy • Report on Observance of
Strengthen management and reporting of statistics
Weak national statistical capacity and reporting
Outcome 2: Enhanced statistical system Indicator: Population and housing census Baseline: Not completed (2013) Target: Census completed and report published summarizing main findings (2015)
• Population and housing census completed (2014)
Promote micro, small, and medium enterprises (SMEs) Promote environmentally responsible tourism
Lack of access to finance hinders the development of SMEs Weak managerial and technical capacity of SMEs Unclear property rights make the use of collateral difficult Cumbersome visa requirements and procedures impeding tourist arrivals
Outcome 3: Improved private sector capacity with a focus on the tourism sector and SMEs Indicator 1: Medium-term tourism development strategy with an Action Plan Baseline: Not prepared (2013) Target: Adopted and being implemented (2017) Indicator 2: Number of entities engaged in provision of tourism services Baseline: 300 approx. (2013) Target: 400 (2017) Indicator 3: Occupancy of private sector tourist capacities (tourist-days per year) Baseline: 91,000 approx. (2013) Target: 140,000 (2017) Indicator 4: Number of entrepreneurs receiving business development services (40% women) Baseline: 0 Target: Up to 300 individuals/ SMEs supported to develop business plans and benefit from IFC Business Edge training (2017) Indicator 5: Number of micro-enterprises and SMEs benefitting from access to finance as a result of business plan development and IFC’s MSME risk sharing program Baseline: 0 Target: 100-150 MSMEs (2017) Indicator 6: Number of private sector employees
• National business plan competition conducted
• Tourism Strategy’s Action Plan revised and prioritized
• Strategic tourism marketing plan prepared and implemented
• Online visa issuance enabled
• Tourism Tax Law created and implemented
• Number of tourists increased from 5,000 (2012) to 25,000 (2017)
34

Country Strategic
Objectives
Issues and Obstacles
CPS Outcomes
Milestones
WBG Program
benefitting from training (50% women) Baseline: 0 Target: 300 employees (2017)
Standards and Codes – Accounting and Auditing (ROSC A&A)
• Agriculture Sector Issues • Regional integration and trade
facilitation • Analysis on Development of
Transshipment and Overall Ports Sector (PPIAF/IFC)?
• Courses and seminars for parliamentarians
Partners: • AfDB • IMF • Millennium Challenge
Corporation (MCC) • Portugal • UNDP
Reduce and simplify business procedures Strengthen trade competitiveness and regional trade integration Promote export-led growth
Cumbersome regulatory processes and licensing rules which undermine private sector initiatives and investment decisions Outdated custom procedures increase the costs of international trade Absence of regional integration strategy impedes the full exploitation of available opportunities to export
Outcome 4: Improved business environment and trade regulations Indicator 1: Number of days required to obtain a construction permit Baseline: 118 (2013) Target: 90 (2017) Indicator 2: Average cost of compliance with business regulations (as percent of per capita income) Baseline: 386 (2013) Target: <200 (2017) Indicator 3: Number of days to export and import Baseline: export 26; import 28 (2013) Target: <16 (2017)
• Online business registration and other online commercial registry features operational
• Single window for trade established and fully operational
• Modernization of trade related regulations initiated, particularly those related to non-tariff barriers
Enhance enabling environment for the private sector by improving energy sector performance
Energy subsidies do not reach the poor
Outcome 5: Better targeting of energy subsidies Indicator: Tariff rates and targeting of subsidies Baseline: Tariff rates not changed since 2007 and only 40% of electricity subsidies actually reach the poor (2013) Target: Identification of a reform strategy to bring tariff rates closer to cost recovery while improving the targeting of subsidies (2017)
• Studies on electrical losses and efficiency completed and recommendations being implemented
Improve internet connectivity
Poor regional internet connectivity until cable installed
Outcome 6: Improved regional broadband connectivity Indicator: Retail price of internet services (per Mbps,
35

Country Strategic
Objectives
Issues and Obstacles
CPS Outcomes
Milestones
WBG Program
monthly) Baseline: US$410 (2012) Target: US$340 (2014)
Theme 2: Reducing Vulnerability and Strengthening Human Capacity Improve understanding of poverty dynamics in development
Given limited poverty reduction in the past 10 years, need to understand the dynamics of poverty to identify poverty reduction and shared prosperity measures
Outcome 7: Improved poverty targeting Indicator 1: (Exact indicator for improved poverty targeting to be determined based on findings and decisions on completion of ongoing social protection policy and strategy) Indicator 2: Jobs created though targeted Public Works Program (PWP) (Baseline and target to be determined once details of the PWP are designed)
• Assessment of social protection programs completed
• Core interventions for a social safety net system identified
• Social protection strategy adopted
• Key operational tools (targeting system and registry of beneficiaries) developed
• Core social sector programs approved by the Government
Ongoing Financing: • GEF: Adaptation to Climate
Change Indicative Financing: • IDA: Social Protection and
Vulnerability Pilot • TF: Quality Education for All
(Global Partnership for Education - GPE)
• TF: Potential GEF/GFDRR or other Climate Change TF
Ongoing AAA/Others: • Poverty Assessment • Programmatic TA on
Operationalizing the Social Protection Strategy
• Poverty and Social Impact Analysis on Energy (PSIA )
• Social Protection Rapid Social Response
Indicative AAA/Others: • Skills Strategy Partners: • UNICEF
Reduce vulnerability from harmful effects of climate change
Vulnerability to climate change resulting in coastal erosion and floods due to lack of protective barriers, dikes, and retaining walls, and a reliable early warning system
Outcome 8: Increased adaptive capacity of coastal communities and reduced potential loss of assets and lives Indicator: Proportion of fishing population benefiting from early warning system and safety at sea (%) Baseline: 0% (2013) Target: 70% (2016)
• Coastal adaptation/ protection measures implemented
• Flooding exposure of target communities reduced by two-thirds through coastal adaptation measures
Improve quality of primary education
Low levels of teachers’ qualifications and limited learning time
Outcome 9: Improved training of teachers in primary education Indicator 1: Percent of qualified primary teachers resulting from project (of which women)
• At least one student assessment conducted for the target grades
• In-service primary
36

Country Strategic
Objectives
Issues and Obstacles
CPS Outcomes
Milestones
WBG Program
associated with a multiple shift regime; repetition rates remain high
Baseline: 40% (2013) (% women tbd) Target: 75% (2017) (% women tbd) Indicator 2: Percentage of primary schools benefitting from annual supervision Baseline: 0% (2013) Target: 100% (2017)
teacher training program set up
• Student learning assessment system being developed
• EMIS developed and functional
• UNDP • European Commission • Sea, Environment, and
Artisanal Fishing NGO (MARAPA -through AfDB)
• European Space Agency • AfDB • UNICEF • Brazil • Portugal
Enhance relevance of the skills development programs
Gaps in skills development; progress in post-primary education is limited
Outcome 10: Increased access to skills development Indicator: To be determined based on findings of Skills Strategy and selected area for WBG support (to be detailed in CAS Progress Report)
Cross-cutting Theme: Gender, Partnership, and Capacity Building
37

Annex 2: São Tomé and Príncipe: Seminar on Small Island Economies 1. During September 10-12, 2013 a high level seminar was held in São Tome and Príncipe (STP) to discuss the “Growth and Economic Diversification: Small States’ Comparative Experiences,” in particular, small island economies. The seminar was organized by the Government of the Democratic Republic of São Tome and Principe and the World Bank. The main objectives of the seminar were to: (i) assist the Government of STP with inputs, ideas, and good practices to foster the country’s social and economic development and, particularly, efforts for economic diversification, promotion of growth and creation of jobs, and poverty reduction; and (ii) strengthen the WBG’s consultative process to gather inputs for the preparation of the Country Partnership Strategy (CPS). The seminar also aimed to support STP’s preparation for the third International Conference of Small Insular States which will take place in 2014. 2. Contributors to the deliberations included high-level policymakers, STP government officials and stakeholders, and a number of different entities and individuals representing national and multinational institutions and small countries with similar characteristics as STP. Among key participants were: Mr. Alcino de Barros Pinto (Speaker of the National Assembly of STP); Mr. Gabriel Arcanjo da Costa (Prime Minister and Head of Government of STP); Mr Jose Cassandra (President of the Regional Government of STP); Mr. Owen Arthur (former Prime-Minister and Minister of Finance of Barbados); Mr. Pierre Laporte (Minister of Finance of Seychelles); Mr. Agapito Mendes Dias (Executive Director of the World Bank); Mr. Jean-Philippe Prosper (Vice President, IFC); Mr. Julio Revila (acting Country Director of the World Bank for STP), and Mr. Ricardo Veloso (head of IMF mission to STP). 3. The seminar was conceived as South-South sharing of experiences, focusing on (i) macroeconomic resilience and economic governance, (ii) the potential role of the tourism sector to spur growth, (iii) the role of parliament in the reform agenda, and (iv) measures to spur private sector growth and competitiveness. Consultations took place with members of parliament, central government officials, the regional government of Principe, non-governmental organizations (NGOs), and the private sector. The objective was to foster a dialogue and reflections among the main stakeholders. Seminar sessions included:
• Strengthening of the tourism sector in Principe Island • Building resilience and improved economic governance in small states • The role of the parliament in transforming a small economy • Fostering private sector growth and competitiveness
The main conclusion and recommendations that emerged from the seminar were: 4. Sound macroeconomic fundamentals are essential to achieve sustainable growth. This has been the basis of the success of both Barbados and Seychelles in achieving higher levels of development. STP has undertaken several steps to accelerate fiscal consolidation in order to maintain macroeconomic stability and support strong and consistent growth: Significant results have been already achieved, including a primary
38
domestic deficit in line with concessional lending policy and a substantial reduction of inflation. The Government of STP should continue with its efforts on strengthening the macroeconomic fundamentals with the support of the IMF, the World Bank, the AfDB, and other development partners. 5. Structural and cross-cutting reforms are the key to promote private sector growth and overall competitiveness. The experiences of successful small island states show that, in addition to macroeconomic fundamentals, it is very important to develop a clear path of structural reforms aimed at fostering private sector growth. Two comprehensive issues are overall improvement in competitiveness and reduce vulnerabilities. The reform program should be guided by a lucid development strategy with clearly measurable targets, and should be based on the following principles: strengthening of economic governance, human resource development, a comprehensive tax reform that enables and does not hider private sector growth, leadership initiatives for regional integration, institutional reforms, and good governance. STP has undertaken steps to improve the investment climate (for example, the Government’s ongoing Licensing Reform Program is simplifying business registration). But a more ambitious program of reforms needs to be designed and implemented. The development of key infrastructure, such as power and ports, need to be led by a clear commitment to develop financially sustainable provision of services. Further efforts should be made in creating an adequate regulatory, financial and tax framework, beyond only trying to finance these projects. The Government also needs to tackle key reforms in the energy sector, such as improving the financial position and service delivery of the electricity company (EMAE). EMAE has weak finances and provides irregular, low-quality service. Low levels of electrification, with frequent blackouts, represent significant economic losses. 6. The service sector, particularly tourism, has a large potential to accelerate sustainable and inclusive growth. The cases of Barbados and Seychelles offer good guidance on focusing on the service sector, and especially tourism, as a way of fostering broad-based growth with significant generation of employment. A set of principles has been followed in these countries: avoid monopoly, but guarantee property rights; emphasize the niche character of tourism development in the islands combining it with the historical heritage; develop appropriate tourism strategies; let the industry lead and prosper and do not penalize it with taxes and fees; diversify the markets to reduce vulnerability; invest in the maintenance of infrastructure; and balance investments so as not to degrade the environment. STP needs to position itself in the appropriate segment of the service-related value chain for investments. For example, tourism should be focused on high quality and not based on mass tourism. In Príncipe, some of these developments are taking place, but the overall STP tourism strategy needs to be revitalized. 7. Undertaking reforms requires, however, a shared consensus across economic, social and political actors. The experience of Barbados shows that a tripartite consensus - among the public and the private sectors and the trade unions - is key for moving forward the reform agenda. Annual consultations were held and protocols signed by the representatives of each party setting the reform agenda in key areas, such as on the reform of the tax system. The role of parliament has been key in the success of Barbados
39
and Seychelles. Development occurs more easily when there is an environment of transparency and accountability. Parliament should play a bigger role as the guardian of fiscal stability as well as the main actor in dealing with structural reforms. The critical roles include creating consensus, managing sectoral transformations, strengthening the rule of law, and fostering institutional reforms. Training and strengthening capacity in parliament is a constant process (“Parliament is not only a place to talk, but a place to think.”).
40

Annex 3: São Tomé and Príncipe - Poverty Profile 43
1. Almost two-thirds of the population is poor in STP. The incidence, intensity, and severity of poverty are slightly higher in urban areas. In 2010, about 61.7 percent of the population consumed less than a basic basket of goods. A slightly larger share of the total and poor population lives in urban areas. In urban areas, the poverty headcount index was 63.8 percent while in rural areas it was 59.4 percent. The poverty gap, which measures the distance of the poor to the poverty line as a percentage of the latter, is 24.7 percent in urban areas and 21.3 percent in rural areas (Table 1). Table 1: Incidence, intensity and severity of poverty in urban and rural areas, 2010
Figure 1:Incidence of poverty across regions
Poverty Headcount rate
Poverty Gap
Squared poverty Gap
National
61.7 23 11.3
Urban
63.8 24.7 12.2
Rural 59.4 21.3 10.3
Source: World Bank Staff estimates based on São Tomé and Príncipe Household Survey 2010 2. There are also wide disparities across regions in terms of poverty. The lowest poverty rate is observed in the Center Region, which is predominantly rural. The poverty rate44 in the (urban) capital, Água Grande, is 62 percent. In the poorest southern regions (Caue and Lemba), poverty concerns 74 percent of the population, and urban and rural areas display similar poverty levels. The Center (Me-Zochi, Cantagalo and Lobata), which is predominantly rural, has the lowest poverty rate (57.3 percent). Finally, the poverty rate in the island of Príncipe, which is also mostly rural, is a high 69 percent. 3. More than half of the population has two or fewer meals a day. Although poverty is higher in urban areas, city dwellers suffer less risk of food insecurity. In 2010, only 44.1 percent of non-poor households and 30.1 percent of poor households had three meals a day. The proportion of households having three or more meals a day is considerably larger in urban areas (41.2 percent) than in rural areas (32.6 percent).
43 This section draws heavily on the ongoing World Bank, Sao Tome and Principe Poverty Assessment. 44 Unless otherwise stated, poverty rates refer to absolute poverty.
41

Similarly, 11 percent of urban households reported having only one meal compared to 14.5 percent of rural households. 4. Electricity covers less than 50 percent of poor households. There are major differences in the use of energy sources between urban and rural areas. Electricity is more widespread among non-poor families (58.3 percent) compared to poorer families (47.5 percent). Lighting is instead powered by oil to a larger extent in poor households (42.1 percent) than in non-poor households (31.8 percent). The use of energy sources varies widely, with 73.9 percent of households in rural areas using wood for cooking compared to 34.6 percent in urban areas. 5. In the last 10 years, access to water has improved in rural areas helping to close the urban-rural gap, while access to sanitation facilities improved at a slow pace. According to the World Development Indicators, 89 percent of the population living in urban areas, and 88 percent in rural areas, had access to water (2008). These figures represent an improvement compared to the beginning of the decade, when only 70 percent of rural population had access to water. In 2000, only 27 percent of the urban population had access to sanitation facilities; in 2010, the figure had improved marginally to 30 percent. A similar trend is observed in rural areas where there was a very marginal increase (about 4 percent) in the share of the population with access to sanitation facilities between 2000 and 2010. 6. Inequality is low compared to other Sub-Saharan countries and slightly higher in urban areas. STP is among the countries with the most equal income distribution in Sub-Saharan Africa. The Gini index for STP in 2010 was 33.6, well below 42.7, which is the median Gini index for Sub-Saharan Africa45. The Gini index in urban areas is 34.3 compared to 32.7 in rural areas. STP has become slightly more unequal, especially in urban areas. However, the absolute magnitude of these changes is contained: the Gini index rose from 31.8 to 33. 7. Between 2000 and 2010, the poverty rate at the national level declined by 5.1 percentage points from 66.8 to 61.7 percent46. The decline was larger in rural areas compared to urban areas. In urban areas, the poverty rate declined by 4 percentage points from 67.8 to 63.8 percent. In rural areas, the poverty rate decreased by 6.2 percentage points from 65.6 to 59.4 percent. Over time, the center of the country, experienced a major fall in poverty rates (about 7 percentage points) between 2000 and 2010, followed by the capital. Poverty rates in southern STP and in Príncipe remained almost invariant (Figure 2).
45 Calculation based on the latest available data in Povcalnet. 46 Absolute poverty rates for 2000 were calculated by the World Bank team following the imputation methodology proposed by Christiaensen, Luc, Peter Lanjouw, Jill Luoto, and David Stifel (2012), "Small area estimation-based prediction methods to track poverty: validation and applications," Journal of Economic Inequality, 10, issue 2, pp.267-297. This has allowed a comparison of absolute poverty rates between the two years for the first time (see São Tomé and Príncipe Poverty Assessment, forthcoming).
42

8. Differences in agriculture productivity might explain the observed variations in poverty rates across regional rural areas. Agriculture productivity in the Center is higher than the rest of the economy, allowing a higher proportion of its population to move above the poverty line or very close to it. The Center has benefitted from programs that have been supporting the creation of cocoa farmers’ and fishermen’s cooperatives, increasing agriculture productivity. These programs began in the mid-1990s with PNAPAF (National Support to Smallholders Program) and later with PAPAFPA (Participatory Smallholder Agriculture and Artisanal Fisheries Development Project). These programs include advice on microcredit, extension services, diversification, and rural infrastructure. In contrast, the South West is highly dependent on a poorly developed agriculture sector and weaker infrastructure which make the population in the region highly vulnerable to price variations and very poor basic food supply. Figure 2a: Poverty headcount rate in urban and rural areas, 2000 and 2010
Figure 2b: Poverty headcount rate across regions, 2000 and 2010
Source: World Bank staff estimates based on São Tomé and Príncipe Household Surveys 2000 and 2010. 9. The level and trend of the national urban poverty rates are driven by the labor market developments of the capital. Água Grande accounts for 72.4 percent (in 2010) of the total urban population. According to census data, the population of Água Grande increased by 41 percent between 2001 and 2012, and rose from 51,886 to 73,091. Labor market indicators show that Água Grande has experienced a significant decrease (15 percentage points) in the inactive rate, and an increase (8.6 percentage points) in the rate of employment and unemployment (7 percentage points). Reasons that can explain the observed change in the proportion of inactive workers is the emergence of a tertiary sector (that includes hotel, banks, and supermarkets) that generates new economic interactions but is unable to incorporate all new workers entering into the labor market, either for demand problems (small and weak firms) or supply constraints (skill mismatches given a low-skilled labor force). 10. Poverty reduction is higher for households with more educated heads. In 2010, the poverty rate for heads-of-household with no formal education was 73.8 percent, 66 percent for heads of household who have finished some primary education, and declines for those who have finished some lower and higher secondary, or tertiary
43
education (55.1 and 31.9 percent, respectively). Comparing 2000 and 2010 data, the poverty rate did not change for households whose heads have no education. By contrast, the poverty rates for households whose heads have higher education have decreased considerably by 9.1 percent, 1 percent, and 10.1 percent for those households whose heads have some primary, some lower secondary, and some higher secondary or tertiary education, respectively. 11. School enrollments at all levels of education have improved and STP has almost reached universal basic education coverage. According to official figures, the enrollment rate for each level of education has increased since 2006. In 2011, the enrollment rate in basic education was 94.9 percent. Quality indicators based on standardized tests, such as the PISA, are absent. 12. Poverty rates among female-headed households are higher. The rate of poverty reduction for female-headed households is smaller than that for male-headed households due to differences in education levels. The poverty rate for female-headed households declined from 71.4 percent in 2000 to 67 percent in 2010, while it went down from 64.7 percent to 58.6 percent for male-headed households. One possible explanation is that the education level for female-headed households is lower than male-headed households (67 percent of female-headed households have no formal education versus 33 percent of male-headed households). 13. There is a gender gap in literacy rates although it has been closed for young people. According to the World Development Indicators (WDI), 89 percent of adults could read and write a short, simple statement in their everyday life in 2010. This figure is not as compelling when broken down by gender. Only 84.7 percent of women older than 14 years are literate compared to 93.9 percent of men according to the WDI definition. Yet in 2010, the literacy rate of young women overcame the literacy rates of young men.
44

Annex 4: São Tomé and Príncipe - Statistical Issues 1. The latest household survey was completed in 2010. Nevertheless, the scarcity of reliable socioeconomic statistics and weak statistical capacity constrain the design and implementation of public policies. 2. Statistics of National Accounts are at an early stage of development and estimates of GDP by sector composition are weak. 3. Economic policies are often based on administrative sector information which makes it difficult to set priorities and measure progress toward achieving the MDGs or monitor PRSP implementation. 4. The ongoing DPO series supports efforts to strengthen statistical capacity, including the recently completed census of the population and STP membership to AFRISTAT. The Poverty Assessment being analyzed and finalized would also provide related statistics, including gender dimensions. In 2014, the Authorities further aim to submit to the National Assembly, for the first time, an evaluation report of STP’s system of national statistics to raise awareness and improve the management and reporting of statistics.
45

Annex 5: São Tomé and Príncipe - CAS Completion Report I. INTRODUCTION 1. This Country Assistance Strategy (CAS) Completion Report (CASCR) provides an evaluation of the World Bank Group assistance to Sao Tome and Principe during the FY06-12 period supported by the Country Assistance Strategy (Report No. 32078) and Interim Strategy Note (ISN, Report No. 59853-ST). The CASCR is prepared using as background information the CAS and ISN, the latest Implementation Status Reports (ISR) for projects in the portfolio, and Implementation Completion Reports (ICRs) for operations closing during that period. The CASCR evaluation follows the “Guidance to Staff on the Country Assistance Strategy Completion Report” issued in October 2012. Summary of Findings and Ratings 2. The Country Team rates aggregate progress toward achieving CPS outcomes as satisfactory. Across the broad range of engagement areas, the CAS/ISN program achieved results in line with expectations, without reversals or deficiencies despite external shocks and internal political tensions during the CAS/ISN implementation period. The combination of analytical work (AAA), Development Policy Operations (DPOs), and Technical Assistance (TA) provided for a stable macroeconomic base where support and enhancement of investment climate strategies and the strengthening of governance, public institutions, and human capital could take place. 3. The Country Team rates World Bank Group performance as satisfactory. The WBG program grew in scope and size, aided by STP’s membership in IFC. The Bank responded promptly and effectively by supporting the Government to face external shocks (for example, the food and global financial crises) by providing additional resources from the IDA- Crises Response Window. Access to additional resources from Regional allocations, Global Environment Fund (GEF), and Education for All (EFA) was able to promote private sector investments, enhance human capacity, and address climate change adaptation. Country Level Goals 4. The first Poverty Reduction Strategy Paper (PRSP), prepared in 2003, included a comprehensive and extensive consultative process amongst the key stakeholders. In 2005, a set of annexes to the PRSP main document provided updates on the previous two years’ of macroeconomic performance, indicators, and implementation framework, as well as a summary of the new petroleum revenue management law, and a summary of the PRSP implementation experience during 2003-2004. 5. The IMF and World Bank Boards endorsed the PRSP and the related Joint Staff Advisory Note (JSAN). The JSAN noted that the PRSP provided a reliable framework for reducing poverty. In addition, it highlighted the areas of weaknesses in the PRSP that could be strengthened through, inter alia: (i) prioritizing sectoral strategies and making them fully
46

consistent with the annual fiscal budget and the overall medium-term poverty alleviation strategy; and (ii) launching an in-depth analysis of the impact of potential oil revenues on the economy. 6. The CAS (FY06-09) aimed to focus on a few selected areas of intervention to maximize the Bank’s impact and to ensure complementarity with other Development Partners (DPs). This selectivity was also dictated by the limited IDA financial envelope which was available for STP. This would provide an opportunity to build upon ongoing activities and enhance and deepen the strategy laid out in the previous strategy. The CAS objectives were (i) to continue the implementation of ongoing activities, especially with respect to social sector service delivery (Social Sector Support Project, FY04), capacity-building in public finance management (Governance Capacity Building Technical Assistance Project, FY05), institutional support to managing the oil sector, and follow-up on recommendations of the Bank’s knowledge products, and (ii) to gradually move to Development Policy Operations (budget support) starting in FY07 with the objective of strengthening implementation of the PRSP and maximizing IDA’s impact. The DPOs would open the necessary policy space by adopting a demand-driven and flexible approach, which is proving to be an effective engagement strategy in a fragile state with serious capacity constraints. Additionally, to date, the Bank is the only DP that is providing budget support. 7. STP reached the completion point under the enhanced Highly Indebted Poor Countries (HIPC) Initiative in March 2007, thus benefiting from debt relief in the amount of US$314 million from both HIPC the Multilateral Debt Relief Initiative (MDRI)47. Paris Club creditors agreed in May 2007 to cancel all their outstanding claims on the country. As a result of MDRI, the activity of the relevant government office is quite limited and it follows approximately 20 multilateral loans. Most bilateral debt has been cancelled. Major outstanding creditors include Angola, Portugal, Nigeria, and Taiwan, China. Debt Management Performance Analyses were undertaken in 2009 and in 2012. 8. The 2006 JSAN Annual Progress Report48 stressed the need for maintaining macroeconomic stability and strengthening structural reforms in order to achieve the objectives of the PRSP. Moreover, improving the business climate and provision of utility services remain essential to allow the private sector to thrive and promote growth. The Authorities are aware of the need to increase aid absorption capacity (only 68 percent of the 2006 Public Investment Plan was actually executed) and to improve the efficiency and transparency in the use of public resources, including from HIPC/MDRI debt relief and possible future oil revenues in order to achieve the PRSP objectives. The 2008 JSAN Annual Progress Report49 agreed with the importance of debt relief to boost pro-poor spending, the removal of obstacles to economic growth, the continued policy of refraining from new external borrowing on non-concessional terms, and measures to promote private sector participation and strengthening the regulatory framework as important pillars of a strategy to improve public infrastructure under a constrained budget.
47 Report No 40299 48 Report No. 37319-STP 49 Report No. 42633-STP
47

9. Despite high political instability that hampered decision making, changed priorities and policies, and caused inconsistencies and delays in the DPs’ programs, the Authorities were able to mitigate damage with the support of the IMF and Bank by anchoring the macroeconomy and developing priorities around pre-established strategies. The Government has been making consistent progress by establishing the legal frameworks and structures that would gradually improve transparency and accountability in the public and oil sectors including, inter alia: the Organic Law on Public Financial Management, developing the Exclusive Economic Zone (2008), reform of the tax legislation, a new Procurement Law, reforms in the Government financial management system (Sistema de Administração Financeira do Estado - SAFE) to integrate computerized system (e-SAFE) with a harmonized program, rules and procedures, and execution control and assessment of public resources. 10. An Interim Strategy Note (FY11-12)50 extended the CAS period and revised the objectives of the CAS to support the Authorities to develop a new development strategy taking into consideration the uncertainties about when oil revenues would be likely to materialize. The results matrix was also revised: the original CAS outcomes that have been achieved were not included in the revised results matrix. 11. The Second Poverty Reduction Strategy Paper (PRSP-II) was published while the ISN was in place51 and was endorsed by the Boards of the World Bank and IMF (JSAN-II)52. The JSAN-II praised the Government for its focus on (i) immediate policy actions and on the achievement of medium-term goals for good governance and public-sector reform, (ii) continuing to build upon economic performance through implementation of structural reforms and barring a serious deterioration of external conditions or other unpredictable shocks, and (iii) prioritizing reforms that are urgent regardless of whether oil is produced or not, particularly in the areas of good governance, competitiveness, and diversification. 12. This report is organized as follows: Section II below details the assessment of the program’s performance, and provides a concise review of the progress made towards achieving CAS/ISN outcomes and identifies key challenges remaining; Section III details the evaluation of the Bank Group’s performance in designing and implementing the CAS/ISN and managing risks; and Section IV presents key lessons learned and outlines recommendations for future program design and implementation. II. WORLD BANK GROUP PROGRAM ASSESSMENT Program Performance: Satisfactory Bank Performance: Satisfactory 13. The CAS/ISN program is rated satisfactory as the country made progress towards all major expected outcomes despite external shocks and internal political tensions during the
50 Report No. 59853-ST dated April 15, 2011 51 Poverty Reduction Strategy Paper was presented to for IMF and WB review on October 2013. 52 The Joint IDA-IMF Staff Advisory Note on the Second Poverty Reduction Strategy Paper (Report 72388-ST) was issued on March 2013.
48

CAS/ISN implementation period. Program performance has to be viewed in the context of exogenous and unplanned factors that affected STP during the period including the fuel and food price increases, the world economic downturn and political instability. The WBG, through remote collaboration from the Mozambique and Washington DC offices, has been able to support the Government with a combination of analytical work, technical support, and financing for the implementation of the PRSP-I (2005) and development of the PRSP-II. IDA allocation during rounds 14 and 1553 were small but the World Bank team efforts and good partnership with the Authorities ensured that the funds were maximized. 14. During the CAS/ISN period, STP joined the International Finance Corporation (IFC)54 leading to significant progress in improving transparency, fostering competition and improving the business environment. IFC’s advisory and technical assistance has been focusing on the promotion of the private sector, including enhancing the country’s investment climate in order to reduce the cost of doing business and attract investments that will broaden the export base. The benefits of this engagement were reflected in the Doing Business Surveys and Transparency International55 evaluations. On December 20, 2012, DTP became the 178th member of the Multilateral Investment Guarantee Agency (MIGA) following completion of the formal requirements for membership. Following membership, MIGA is open for business in the country offering covers for investors concerned about Transfer Restriction, Breach of Contract, Expropriation, and War and Civil Disturbance risks. MIGA has a strategic priority to focus on IDA countries, such as STP. MIGA will also seek out opportunities to work alongside the Bank team. An example of possible MIGA’s support would be supporting the energy sector by complementing a partial risk guarantee for a power supply agreement or IFC funding for equity projects. MIGA is currently looking at a number of leads in the country and will continue to look for opportunities to support investors into the country and develop a presence for investors concerned about non-commercial risk in STP. 15. The principle CAS objectives were to: (i) support the implementation of the PRSP and strengthen the areas where the PRSP needed to be improved, as highlighted in the JSAN, and (ii) provide assistance to STP to ensure that it was sufficiently prepared to maximize the benefits of future oil revenues. The CAS proposed a results framework, summarized in a Results Matrix. It contained the five PRSP objectives aligned to 18 CAS outcomes. The ISN reaffirmed the relevance of the CAS, adjusted some of the CAS outcomes and included IFC operations in the program of support to the country. Objectives of the Assistance 16. The WBG’s approach to support the country’s development goals was embodied in two strategic objectives: (i) accelerate sustainable and broad-based growth and (ii) strengthen governance, public institutions and human capital. WBG assistance aimed at raising competitiveness and employment while addressing vulnerability and resilience issues. It
53 See Table 1 54 São Tomé and Príncipe becomes a member of the IFC on October 11, 2008 55 http://cpi.transparency.org/cpi2012/results/ (accessed on May 20, 2013)
49
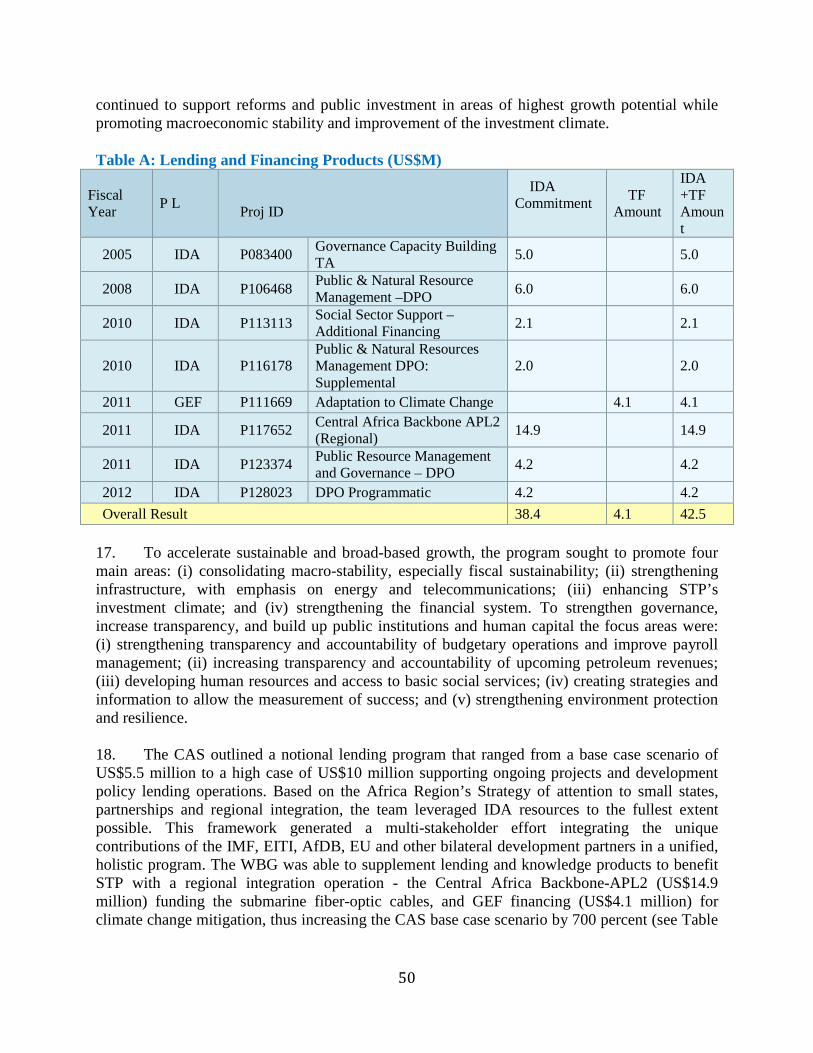
continued to support reforms and public investment in areas of highest growth potential while promoting macroeconomic stability and improvement of the investment climate. Table A: Lending and Financing Products (US$M)
Fiscal Year
P L Proj ID
IDA Commitment
TF Amount
IDA +TF Amount
2005 IDA P083400 Governance Capacity Building TA
5.0
5.0
2008 IDA P106468 Public & Natural Resource Management –DPO
6.0
6.0
2010 IDA P113113 Social Sector Support – Additional Financing
2.1
2.1
2010 IDA P116178 Public & Natural Resources Management DPO: Supplemental
2.0
2.0
2011 GEF P111669 Adaptation to Climate Change
4.1 4.1
2011 IDA P117652 Central Africa Backbone APL2 (Regional)
14.9
14.9
2011 IDA P123374 Public Resource Management and Governance – DPO
4.2
4.2
2012 IDA P128023 DPO Programmatic 4.2
4.2
Overall Result 38.4 4.1 42.5
17. To accelerate sustainable and broad-based growth, the program sought to promote four main areas: (i) consolidating macro-stability, especially fiscal sustainability; (ii) strengthening infrastructure, with emphasis on energy and telecommunications; (iii) enhancing STP’s investment climate; and (iv) strengthening the financial system. To strengthen governance, increase transparency, and build up public institutions and human capital the focus areas were: (i) strengthening transparency and accountability of budgetary operations and improve payroll management; (ii) increasing transparency and accountability of upcoming petroleum revenues; (iii) developing human resources and access to basic social services; (iv) creating strategies and information to allow the measurement of success; and (v) strengthening environment protection and resilience. 18. The CAS outlined a notional lending program that ranged from a base case scenario of US$5.5 million to a high case of US$10 million supporting ongoing projects and development policy lending operations. Based on the Africa Region’s Strategy of attention to small states, partnerships and regional integration, the team leveraged IDA resources to the fullest extent possible. This framework generated a multi-stakeholder effort integrating the unique contributions of the IMF, EITI, AfDB, EU and other bilateral development partners in a unified, holistic program. The WBG was able to supplement lending and knowledge products to benefit STP with a regional integration operation - the Central Africa Backbone-APL2 (US$14.9 million) funding the submarine fiber-optic cables, and GEF financing (US$4.1 million) for climate change mitigation, thus increasing the CAS base case scenario by 700 percent (see Table
50

A). In addition, the WBG team was resourceful in obtaining Trust Fund support through the CAS/ISN period (Table B). Table B – Trust Funds
Trust Fund # Trust Fund Name Funds Recd. to Date
Funds Disb. to Date
% of Funds Disb.
Grant Closing Date
Exec. By
TF052058 JSDF- Sao Tome and Principe: Building Capacity For Civic Engagement and Community-Driven Development for Improved Social Services
649.5 460.3 71% 9/12/2006 Recipient
TF054102 LDC-Sao Tome and Principe: Preparation of a Climate Change National Adaptation Plan to Action (Napa)
200.0 173.6 87% 12/31/2006 Recipient
TF054648 IDF-Sao Tome Principe: Capacity Building in the Justice Sector
326.0 88.3 27% 1/12/2008 Recipient
TF056928 São Tomé and Príncipe Statistical Capacity Building and National Strategy
127.0 126.8 100% 11/30/2009 Recipient
TF090404 Development Policy Credit II 600.0 144.0 24% 6/3/2008 Recipient TF093113 Sao Tome & Principe - Support to
Implementation Of Extractive Industries Transparency Initiative
110.0 0.9 1% 6/30/2010 Recipient
TF093596 Sao Tome And Principe EFA-FTI Fund - Education Sector Expenditure Project (Phase Ii)
3600.0 3600.0 100% 6/30/2011 Recipient
TF094749 Sao-Tome & Principe - EFA FTI Catalytic Fund Supervision
240.0 187.0 78% 12/31/2010 Bank
TF095488 Shared Growth And Diversification Strategy For São Tomé And Príncipe
97.5 87.9 90% 4/30/2011 Bank
TF095958 PPIAF: Sao Tome and Principe: Revitalizing the Energy Sector Through Enhanced Private Sector Participation
334.0 299.6 90% 5/31/2011 Bank
TF096127 Sao Tome and Principe: Adaptation to Climate Change
282.5 269.1 95% 12/31/2011 Recipient
TF096809 Sao Tome Power 100.0 99.8 100% 9/30/2010 Bank TF096978 Adaptation to Climate Change on the
Coast of Sao Tome 50.0 99.9 200% 12/31/2012 Bank
TF098628 Sao Tome License 112.6 110.9 99% 2/28/2015 Bank TF099869 Adaptation to Climate Change Project 4100.0 1045.9 26% 12/31/2016 Recipient TF010563 Sao Tome Heritage Study 20 19.5 98% 12/31/2012 Bank TF132646 SIDS-DOCK: Power sector
efficiencies improvement 175.0 52.0 30% 12/31/2014 Bank
Total 11435.9 6865.1 60% 19. Bank performance is rated “Satisfactory” due to the strong design of the program, the responsiveness of the program to client demand, and the leveraging of partnerships during program implementation to scale up interventions.
51
A. Progress on Strategic Objective I: Promote Broad-Based and Sustainable Economic
Growth 20. The CAS/ISN development goals under the first strategic objective were: (i) consolidate macro-stability especially fiscal sustainability; (ii) strengthen infrastructure, with emphasis on energy and telecommunications; (iii) enhance STP’s investment climate; and (iv) strengthen the financial system. Nine of the 10 results indicators under the CAS/ISN strategic objective have been achieved; one was not achieved, despite having made some progress. Revised CAS Goal 1(i): Consolidate macro-stability especially fiscal sustainability 21. Development Policy Operations56 and knowledge products provided throughout the CAS/ISN period enhanced the Government’s ability to develop a culture of prudent macroeconomic management. The WBG supported the Authorities in accelerating the process of fiscal adjustment through a series of gradual reductions of nonessential expenditures, containing the growth of the wage bill, and enhancing the enforcement of tax collection. The Debt Management Performance Assessment carried out in 2009 and again in 2012 led to the development of a Debt Management Reform Plan being implemented by the Authorities for stronger fiscal controls, thus reducing the domestic primary deficit to 4.1 percent of GDP in 2010 and then to 3.2 percent in 2012. Revised CAS Goal 1(ii): Strengthen infrastructure, with emphasis on energy and telecommunications 22. Infrastructure strengthening in STP benefits from the holistic approach and integration of the Development Partners. The WBG, through the CEM and other knowledge products, provided the support to the Authorities in identifying the top priorities in overcoming the large infrastructure deficit. Telecommunication and energy sectors were recognized as the most transformative and capable of unlocking the country’s development potential by fostering local potential and as a basic pillar to attract foreign direct investments. 23. The Central Africa Backbone APL2 funded extensive improvements in telecommunication with the arrival of the ACE submarine cable in the country in November 2012. With little over a month of operation, the use of capacity has gone up five times (from 50 to 250 Mbs), and given the current cable capacity, it can still increase 18 times more before requiring an upgrade of the international cable capacity. Average prices are already coming down (the operator is offering four to eight times more capacity for the same price). Tender for a second telecommunications operator was launched and one proposal was received on March 8, 2012. In its technical proposal, the proposed licensee shows investments plans for US$16 million including 25 stations in STP. 24. The 2010 “Revitalization of the Power Sector and Private Sector Participation” study carried out with the support of Public-Private Infrastructure Advisory Facility (PPIAF) and the
56 Including the DPOs
52

IFC57 identified systemic constrains within the energy sector and provided ideas on how to overcome them. The Authorities have been evaluating the best way to implement the study recommendations. Amongst other DPs’ complementary efforts on the sector, the Government accepted a grant from the SIDS-DOCK58 Partnership and the Energy Sector Management Assistance Program (ESMAP)59 to fund detailed engineering designs necessary to upgrade the transmission and distribution system and reduce the commercial losses. A campaign to replace incandescent light bulbs with Compact Fluorescent Lamps Reduction is planned for FY13 and has the potential to reduce peak of energy demand in the country. 25. Although the Bank has been providing support to the Government on the energy sector, the design and submission for discussion to key stakeholders of regulations to reduce electricity fraud and theft have not been completed. Revised CAS Goal 1(iii): Enhance STP’s investment climate 26. At the beginning of the CAS period, STP ranked among the least attractive places - 180th out of 183 countries - to start a business according to the Doing Business Survey. Starting in 2007, Development Partners60 started providing technical assistance to STP for the improvement of the investment climate. The IFC advisory services started in 2008 focusing on improving the commercial code, reducing the number of procedures to start a business, and improving access to electricity and telecommunication services, amongst others. With IFC support, STP introduced reforms of the century-old business licenses regime. The reforms left only a few business licenses related to public health, safety and environment. This work complemented the launch of the one-stop shop for business registration (GUE). The GUE started with 57 new registrations in 2010, but with the abolition of alvarás, many more entrepreneurs were attracted to formalize their existing businesses or starting new ones: the number went up by 241, more than quadruple, and then 388 more in 2012 – up by another 62 percent. Improvements in the investment climate earned STP a spot among the top-ten worldwide reformers in the 2012 Doing Business Report (DBR) and a spot in the top 50 worldwide reformers from 2005-2013 in the 2013 DBR. Revised CAS Goal 1(iv): Strengthen the financial system 27. A Public Expenditure Management and Financial Accountability Review, and a Country Integrated Fiduciary Assessment61 were both completed in 2007, and two Public Expenditure and Financial Accountability (PEFA) reviews, conducted in 2007 and 2010, have provided short
57 Project No 29644, Sao Tome Power 58 http://sidsdock.org/ accessed on May 2012, is an initiative among member countries of the Alliance of Small Island States (AOSIS) to provide the Small Island Developing States (SIDS) with a collective institutional mechanism to assist them to transform their national energy sectors into a catalyst for sustainable economic development and help generate financial resources to address adaptation to climate change. 59 See Power Sector Efficiency Improvement (P132646) 60 United States through the U.S. Treasury Office of Technical Assistance (OTA) and the Millennium Challenge Corporation (MCC) helped increase revenue through improved tax and customs administration and enforcement; and streamline business registration procedures. http://www.mcc.gov/pages/countries/program/saeo-tome-and-principe-threshold-program accessed on May 2013 61 Report No. 40130-STP dated June 2007
53

term recommendations which have been implemented by the Authorities with the support of the holistic program by DPs. WBG, through the several DPOs, supported (i) a prudent management of oil signature bonuses combined with careful control of spending which has allowed the Authorities to reduce the domestic primary balance, (ii) creation of a single database with information on all government employees, and (iii) full implementation of a sophisticated SAFE-e software system with modules on human resources and wage management and integration to the treasury, budget, and public accounts. B. Progress on Strategic Objective II: Strengthen Governance, Public Institutions and
Human Capital 28. The CAS/ISN development goals under the second strategic objective are: (i) strengthen transparency and accountability of budgetary operations and improve payroll management; (ii) increase transparency and accountability of upcoming petroleum revenues; (iii) develop human resources and access to basic social services; (iv) create strategies and information to allow measuring success; and (v) strengthen environment protection and resilience. Seventeen of the 18 results indicators under the revised CAS/ISN strategic objective have been achieved; one was not achieved. Revised CAS Goal 2(i): Strengthen transparency and accountability of budgetary operations and improve payroll management 29. Throughout the CAS/ISN period, the program of good governance in STP has yielded extraordinary results. Transparency and accountability introduced by the oil revenue management law in 2004 paved the way for a gradual strengthening of the public sector with significantly improved budget, natural resource management, fiscal and debt management, national statistics management, and the investment climate. Sustainable fiscal stance has also improved through fiscal adjustment underpinned by public administration reform and the reduction of the state’s role in commercial activities. Since 2010, the general budget has been published in the Government website. For the first time in 2012, the Government prepared a Citizen’s Budget (for the 2013 fiscal year) which summarizes key information on budget aggregates and explains it in a simple and didactic language so that it can be easily understood by the general population. The Citizen’s Budget is expected to be approved by the Council of Ministers and published in the Government’s website62. Progress has also been made regarding the comprehensiveness of budget documents, in particular the 2013 Budget Proposal, which now includes an explanation of how the budget will be financed, including a summary of the level and composition of the debt stock and information about debt servicing. 30. Such remarkable progress has not gone unnoticed by the international community. In 2012, Transparency International’s Corruption Perception Index63 ranked STP 72nd in the world, together with Italy and just below South Africa. That is a jump of 28 positions; the previous year the country was ranked 100th. STP was the third-strongest reformer in the world in the Open Budget Index due to substantial reforms in the area of budget transparency and accountability:
62 http://www.min-financas.st/pdf/oge/oge2013f/cid.pdf (accessed on May 20, 2013) 63 http://cpi.transparency.org/cpi2012/results/ (accessed on May 20, 2013)
54

STP improved its OBI score from 0 to 29, out of 100, jumping 25 places to rank 62nd in the world. Improvements in the investment climate earned STP a spot among the top-ten worldwide reformers in the 2012 Doing Business (DB) report, and a spot in the top 50 worldwide reformers from 2005-2013 in the 2013 DB report; STP also became the world’s top reformer in terms of business freedom in the 2012 Heritage Foundation's Index of Economic Freedom. This is a clear result of the reform program supported by the World Bank Group during the CAS/ISN period. Revised CAS Goal 2(ii): Increase transparency and accountability of upcoming petroleum revenues 31. Much progress has been made regarding transparency and accountability related to petroleum revenues during the CAS/ISN period. The Organic Law on Petroleum Operations (2009) has been approved as the principal legislation to guide the granting of licenses for the exploration and extraction of oil in STP. The Oil Revenue Law (2004), which guides the management of oil revenues, established the National Oil Account (NOA), into which all oil-related revenues are to be deposited. It sets a limit of 20 percent of the balance of the preceding year to fund the Government budget. Once oil production starts, the bulk of the current revenues are to be transferred into a sub-account of the NOA - the Permanent Fund of STP. These resources are to be invested with a view to generating a permanent income stream for the NOA. To date, STP oil revenues have been limited signature bonuses for a total of US$87.9 million, equivalent to 30 percent of GDP since 2005, from the issuance of prospecting licenses in the Joint Development Zone (JDZ), resource sharing between Nigeria (60 percent) and STP (40 percent) in 2005 and 2007, as well as in the Exclusive Economic Zone (EEZ) in 2011 and 2012. 32. Through the JDZ, STP became an EITI candidate country in February 2008 but the JDZ EITI Report could not be produced due to coordination issues with Nigeria. As a result, the EITI Board delisted STP from the EITI in April 2010, while Nigeria was granted “near compliant” status in October 2010. STP was encouraged to reapply once circumstances for rapid implementation were more favorable, and it could demonstrate a renewed commitment by providing a clear outline of how it had corrected previous barriers to effective implementation.64 The Government is committed to transparency and accountability and took the following steps to reapply for EITI candidacy: (i) it issued an unequivocal public statement of its intention to implement the EITI; (ii) it expressed its commitment to work with civil society and companies on the implementation of the EITI; (iii) it appointed a high ranking official to lead the EITI implementation; (iv) it restructured the EITI National Committee65 and (v) it agreed and
64 The previous barriers included absence of a clear commitment from the Government with EITI, including (i) absence of financial support, and (ii) insufficient engagement by the coordinator in the process. The Government has addressed these issues as follows: (i) a dedicated budget line was introduced in the national budget; (ii) an office space and meeting facilities have been assigned for EITI at the Ministry of Finance; (iii) the STP-EITI has been placed within the Ministry of Finance and the Minister of Finance has been appointed EITI Champion who will lead the implementation of the Initiative; and (iv) the STP representatives to the JDZ Tripartite Subcommittee have been appointed. In addition, a Permanent EITI Secretary was appointed - a private consultant - currently financed by the World Bank, who has been actively involved in the process. 65 The STP-EITI National Committee consists of three representatives from the Government (Ministry of Finance, Treasury and National Petroleum Agency); three representatives from civil society (NGO WEBETO, Women Lawyers’ Association, and Federation of NGOs); the Chamber of Commerce, Industry and Agriculture; one
55

published a fully costed Work Plan containing measurable targets, and a timetable for implementation. The Government applied for candidacy in September 11, 2012 and was accepted as candidate country by the EITI Board at its meeting in Lusaka on October 26, 2012. STP is expected to become an EITI Compliant Country by April 2015. Revised CAS Goal 2(iii): Develop human resources and access to basic social services 33. The Social Sector Support Project (P075979) and the Social Sector Support Project Additional Financing (P113113) made significant contributions to improving the access of basic services for the STP population. Important improvements in the health sector in STP can be attributed to these operations which contributed to building, equipping and making functional a number of health centers in remote districts, by training health personnel, and by supporting capacity development of the Ministry of Health. Amongst the indicators for the project are: immunization rate for measles, the proportion of pregnant women receiving antenatal care, and the proportion of births attended by qualified birth attendants. Comprehensive donor coordination, partnership, and complementary interventions contributed to progress in the sector indicators. Revised CAS Goal 2(iv): Create strategies and information to allow measuring success 34. The Government has seen the impact of measuring success as recognized by the international community but it remains a challenge for the Authorities. Despite the WBG’s and other DPs’ support to the Government in strengthening the monitoring and evaluation (M&E) capacity of the National Statistics Institute (Instituto Nacional de Estatistica - INE) effective monitoring of poverty indicators continue to be a challenge for the Authorities. In 2006, a Trust Fund Grant for Statistical Capacity Building (TF056928, US$160,000) was provided to the INE to support the development of a National Strategy for the Development for Statistics (NSDS) and improvement of the statistical capacity in the country. TA was provided by the UN and AfDB in preparation of the PRSP-II; nonetheless, there were considerable delays on the production and analysis of the 2010 household survey and completion of the poverty profile. Updates and disaggregation of the data based on gender, age, geography (rural and urban), and socioeconomic status remain to be done. A strategic action plan to strengthen statistical sector capacity needs to be designed, funded and implemented. 35. Based on the experience of PRSP-I and given the inherent constraints on resources, the JSAN66 for the PRSP-II recommended including concrete policy prescriptions in the forthcoming Priority Action Plan (PAP) linking specific PRSP-II goals with quantifiable - to the extent possible - and easy-to-monitor indicators. Support for the statistics and M&E tools and mechanisms should continue to be a priority for the Bank team.
representative of the Regional Government from Principe; one representative from the STP National Radio; and one representative from the oil companies. These representatives were selected after an extensive public consultation with civil society organizations (CSO). A broader focal civil society group will be identified to also get involved in and monitor the implementation of the EITI. 66 Additional information can be obtained from Report No. 72388-ST : The Joint IDA-IMF Staff Advisory Note on the Second Poverty Reduction Strategy paper
56

Revised CAS Goal 2(v): Strengthen environment protection and resilience 36. Erosion and flooding exacerbated by climate change and sand removal for the construction industry have had a severe and negative impact on coastal infrastructure, tourism and housing. The Global Environment Fund - Adaptation to Climate Project together with a national study on climate change trends and future forecasts financed by the European Space Agency (which has been completed) address the damage being inflicted upon the vulnerable coastal communities. Community disaster prevention teams have been training communities throughout the country on readiness and mitigation measures. This needs to be accompanied by a climate-resilient coastal policy and stronger integrated planning taking into account environmental and climate risk. To reduce the vulnerability of the most affected – coastal communities and fishers – a reinforced early warning and safety-at-sea system will be introduced, in conjunction with improved community-based management of coastal areas. IDA would draw upon its comparative global expertise in other SIDS (particularly in the Pacific and Caribbean regions) and coastal areas of Africa to help the STP Government address these vital challenges. STP would be supported through, inter alia, a US$4.1 million GEF Least Developed Country Fund and complementary analytical work (e.g., TFESSD-funded Adaptation to Climate Change on the Coast of Sao Tome) , as well as inputs to other Bank operations aimed at mainstreaming environmental and climate resilience into the Bank’s portfolio. In addition, it would also help strengthen public and private sector awareness of international standards and technical regulations.
III. BANK’S PERFROMANCE IN DESIGNING AND MANAGING THE IMPLEMENTATION OF THE PROGRAM AND MANAGAING RISKS
37. World Bank performance is rated satisfactory. The CAS/ISN was relevant and aligned with the Government’s PRSP-I, and the design and implementation of the Bank program contributed to the achievement of most CAS/ISN outcomes. The Bank performance rating is justified given the efforts made by Bank staff to address the emergencies confronted by STP during the period which helped mitigate the effects of the problems resulting from the economic downturn. The CAS/ISN achievements surpassed expectations and were demonstrated by STP’s remarkable progress in a number of international rankings. In 2012, STP was the third-strongest reformer in the world in the Open Budget Index (OBI) thanks to substantial reforms in the area of budget transparency and accountability: STP improved its OBI score from 0 to 29, out of 100, jumping 25 places to rank 62nd in the world. STP became the world’s top reformer in terms of business freedom in the 2012 Heritage Foundation's Index of Economic Freedom and jumped 28 positions, from 100th place to 72nd in the world on Transparency International’s Corruption Perception Index, well above the average for the Sub-Saharan Africa region. 38. The success achieved owes much to the fact that the CAS/ISN built upon the previous strategies by enhancing and deepening a selective program. The CAS/ISN was aligned with the priorities of the Government and thus had local ownership. The CAS/ISN included a combination of strong knowledge products, budget support and regional integration investment lending which has shown to be an effective approach to addressing structural reforms in this insular nation.
57

39. The risks identified in the CAS related mostly with the complexity and management of future oil revenues; it did not fully recognize the length of time it would talk for the industry to develop the sector. The urgency in developing a framework for the management of oil revenues was beneficial for the strategy expediting the development of an accountability and transparency framework regardless of the political divisions within the country. The CAS focused on supporting the country’s basic needs through a comprehensive set of knowledge and lending products. These contributed to significant achievements in improving the accountability, effectiveness, and level of public resources; and strengthening governance in the petroleum sector while maintaining a stable macroeconomic environment. Support to the social sector has been contributing to improving the delivery of basic health and education services with a focus on greater and equitable access, better quality, and improved local governance of services. 40. The World Bank team was able to respond to risks to the program through a series of knowledge and lending programs that build upon each other. Starting in 2007 with an Integrated Fiduciary Assessment (IFA), the first of its kind for STP, the Bank combined the analysis and policy recommendations from a public expenditure review (PER), a country financial accountability assessment (CFAA), and a country procurement assessment review (CPAR). The goal was to identify the major challenges facing the country in the pre-petroleum era in public finance management (including public enterprises) as part of the implementation of the PRSP with a tight resource envelope. The evaluation took in consideration economic developments and fiscal sustainability analysis vis-à-vis petroleum and non-petroleum scenarios, with corresponding analysis on which of the Millennium Development Goals (MDGs) are reachable. The IFA reported on revenue and expenditure performance from 2001-2007, highlighting issues related to the implementation of the public investment program (PIP) and its coordination with the PRSP, and the budget process, including findings from the Health PER, which highlights a lack of allocative efficiency. It also reported on the financial fragility of state-owned enterprises (SOEs) and the possible fiscal consequences for the central budget, especially regarding the implicit subsidies and tax breaks to (and the hypothetical tariff increases of) the electricity and water company. The Public finance management system (budget preparation, execution, control, governance, and human resources) was also reviewed as well as the reform process to address many of the concerns it raises. 41. In 2008/09 STP was hit hard by the increases in international food and fuel prices and was affected by the global economic downturn through lower-than-expected tourism receipts and donor assistance, lower remittances, and postponement of FDI. The Bank responded with a US$2 million supplemental financing for the Public & Natural Resources Management DPO with funds provided under the IDA Financial Crisis Response Fast Track Facility (FCR FTF) to continue with budget support while promoting transparency and accountability in the management of public resources. 42. The Governance Capacity Building Technical Assistance (CBTA) project (US$5 million) from FY05-10 supported reforms in public finance management, procurement, petroleum management, all of which helped build the basic public financial management systems. The biggest achievement for the GCBTA was support to the Government to create an institutional and legal framework to formulate policies, supervise, and regulate the petroleum sector, and support to public financial management by developing the legal framework for public accounting
58

and build capacity to prepare the public accounts of the State. GCBTA closed in September 2010 and was rated Moderately Satisfactory on its overall performance. 43. The Public and Natural Resource Management Development (PNRMD) DPO (US$6 million), approved in 2008, supported the introduction of modern techniques and approaches in PFM, and aimed at developing mechanisms to ensure that the benefits of future oil extraction materialize optimally within standards of good governance. This operation benefited from supplemental financing (US$2 million), approved in 2010, from IDA’s Crisis Response Window to minimize the risks of the 2009 global financial crisis. PNRMD closed in June 2010 and was rated Moderately Satisfactory on its overall performance. 44. The Public Resource Management and Governance (PRMG) development policy operation (US$4.2 million), approved in May 2011, aimed to raise transparency in public expenditures, improve the management and reporting of public accounts, promote fiscal sustainability, strengthen debt management, and strengthen donor coordination. PRMG closed in February 2012 and was rated Satisfactory on its overall performance. 45. The Social Sector Support Project (SSSP, (US$8.6 million), approved in 2004, aimed at increasing access and equity of the rural population to health services; improving the quality of those services; and contributing to support for the national program to fight HIV/AIDS and malaria. They included rehabilitation, construction and equipment of health centers in the districts to increase coverage; strengthening the institutional capacity of the Ministry of Health and training of health staff in order to improve quality of services; and institutional support to the National Programs to Fight HIV/AIDS and Malaria and provision of condoms, and some drugs and testing kits for HIV and malaria. The Original Financing also included Community-Driven Initiatives (CDI) promoted by NGOs. In 2010, SSSP was extended to support the health sector to consolidate the gains obtained with the Original Financing, while support to the education sector was pursued through the Global Partnership for Education (GPE) Fund. The Supplemental Financing supported institutional strengthening of health institutions at the central and local levels. Thus, main activities included building residences for health staff in remote areas in order to attract skilled staff and to improve service delivery; continuing the program of rehabilitation, expansion and equipment of health centers, including the National Center for Endemic Diseases (CNE, the Government department responsible for malaria and HIV/AIDS programs); and training and capacity development of the Ministry of Health. The Additional Financing also continued to support CDI promoted by NGOs in the area of health through supplemental financing because of the need to provide critical budgetary support to facilitate the continuation of the reform process. The SSSP closed on December 31, 2012 and the completion report is under preparation. The team expects that the SSSP would be rated Moderately Satisfactory on its overall performance. 46. The Central Africa Backbone (CAB2) Adjustable Program Lending 2 (US$14.9 million) was approved in 2011. As of March 2013 CAB2 has disbursed 93 percent of the total - with all payments to the ACE consortium now completed. The ACE submarine cable landed in the country in November 2012 and was commercially launched in February 2012. Within a little over a month of operation the use of capacity went up five times (from 50 to 250 Mbs), and given the current cable capacity it can still increase 18 time more before requiring an upgrade of
59

the international cable capacity. Average prices are already coming down (the operator is offering four to eight times more capacity for the same price). The most recent Implementation Status Report rates the project Satisfactory on its overall performance. 47. The Adaptation to Climate Project financed from the Global Environment Fund (GEF) sources (US$4.1 million) was approved in 2011. This operation is crucial for STP to provide strengthened capacity and financing to address erosion and flooding which are affecting coastal infrastructure, tourism and housing and developing an early warning system to disseminate timely warnings to artisanal fishers prior to fog/storm events. The last ISR indicated that the project implementation is Moderately Satisfactory due to delays in the Coastal Protection for Vulnerable Communities and Coastal Early Warning and Safety at Sea components. Regular and detailed monitoring of the project indicators needs strengthening. 48. Selectivity and coordination have been cornerstones of the CAS. All of the IDA country allocation funded the DPOs, focusing on macroeconomic stability, and increasing the transparency and accountability within the public sector. Since 2008, when IFC started supporting STP, the focus has been on improving the business climate in order to attract FDI. 49. Risks related to the extensive influx of oil signature bonuses were avoided since the large revenues from the sector have not yet materialized. The CAS anticipated the country’s vulnerabilities to external shocks such as the effect of the world economic downturn, and in response the Bank adjusted its assistance program. A mid-term review was not carried out. In reality, the external conditions and frequent internal changes made such a review difficult. Also, a mid-term revision of activities would have been time-consuming and difficult to justify given the length of the CAS period.
IV. KEY LESSONS AND SUGGESTIONS FOR THE NEW CPS 50. The lessons drawn from the review of the CAS/ISN and recommendations for the future CAS are summarized below.
• Broad-based macroeconomic support is needed for successful CAS implementation. The Bank’s successful support to STP was anchored on macroeconomic and development strategies based on pre-established strategies, such as Policy Development Operations. Such an instrument provides structure and mitigates political instability of frequent changes in priorities in the Government.
• Innovation and combination of resources into a holistic program focus on strengthening governance and competitiveness has been the cornerstone for the success of the WBG program in STP, a small island state with limited capacity as it prepares to meet the challenges of an emerging oil sector.
• A multi-stakeholder approach provided an interconnected program supporting knowledge and TA through the integration of unique contributions of the IMF, EITI, AfDB, EU and other bilateral development partners. For instance, the AfDB teamed-up with the Bank to provide TA in support of a set of joint objectives, while the Bank’s team collaborated very closely with UNDP and EU to ensure full harmonization of objectives and activities
60

and support the Government in the preparation of a new Poverty Reduction Strategy Paper.
• IDA should continue to build on recent success and gains on strengthening transparency and accountability on the public and petroleum sectors. IDA support to the Government has been crucial to strengthen their ability to focus on economic stability and strengthening of institutions to address the country’s development challenges and eliminate constrains in preparation for the time when the oil revenues would materialize.
• The World Bank Group’s (IDA and IFC) close coordination during the CAS/ISN period led to extraordinary achievements in STP as described above. Such close coordination should continue in the next strategy.
• To date, STP has been highly dependent on the support of the DPs which have contributed annually between 85 to 93 percent of the country’s capital budget. The absence of the STP Authorities in donor coordination indicates dispersed aid and efforts leading to meager results. In December 2011 the Government convened the first Donors’ Meeting but no concrete action plan was proposed during the meeting and the DPs left without making pledges of coordination and support. Strengthening the Authorities’ ability to lead the coordination and integration of DPs’ programs would be recommended for the next CAS period.
• There are very few people in STP familiar with Bank procedures. Having a common fiduciary staff (Financial Management, Procurement and Accounting) to serve several Project Implementation Units within the Ministry of Finance would enhance the consistency and improve/facilitate implementation progress.
• Make CAS periods longer and allow flexibility in the program. The CAS four years were too short a period to show meaningful results; in fact, the extension of the CAS via the ISN allowed for completion of the program leading to satisfactory results. Considering that it is difficult to carry out mid-term reviews within a short time frame; a longer CAS period (say five years) would permit a mid-term evaluation. Experience in STP shows the importance of building flexibility in the program to permit adjustments when unpredictable situations, which affect outcomes, occur.
• Given the encouraging results of the SSSP and further support of the Global Partnership for Education, it would be important to keep in the next CAS not only policy dialogue but also, if possible, additional financial support to the social sectors, therefore, consolidating current gains.
V. CONCLUSION
51. The WBG’s support to STP’s poverty reduction strategy led to extraordinary outcomes within challenging circumstances. Whether STP follows in the footsteps of other small states that have harnessed their natural-resource potential to achieve rapid, sustained and broad-based growth, or whether it will succumb to the devastating and all-too-familiar consequences of the resource curse, will depend on the Government’s efficiency in implementing ambitious structural reforms and develop the institutional strength and administrative capacity to effectively manage a thriving oil sector and withstand the corrupting influence of resource revenues.
61

Appendix: CASCR Results Matrix
Country Development Goals
Outcomes Status/Evaluation Summary WBG Program
PILLAR 1: Accelerate sustainable and broad-based economic growth
Consolidate macro-stability especially fiscal sustainability
Achieved - Strengthen the fiscal regulatory framework to reduce external debt burden.
Debt Management Law adopted and implemented. The Fiscal Responsibility Framework completed and submitted to key stakeholders. Public expenditure effectiveness improved as measured by an increase in the budget execution of pro-poor expenditures.
IDA / Other Grants FY05 GCBTA, FY08 PNMRD FY09 PNMRD Supplement, FY11 PRMG, FY12 Prog. DPL-1 AAA FY08 PEMFAR, FY09 DeMPA, FY11 CEM, FY11-FY12 Debt Sustainability Analysis, FY12 DeMPA
Achieved - Aid coordination has strengthened around the Government program.
At least one annual donor meeting has been conducted for 2011 and for 2012.
Strengthen infrastructure, with emphasis on energy and telecommunications
Partially achieved - Begin to implement and action plan to bridge the supply demand gaps in electricity.
Regulations to reduce electricity fraud and theft has been designed and submitted to for discussion to key stakeholders A study on required funding for the Energy sector, including an analysis of the tariff system, has been prepared and has been submitted to key stakeholders.
IDA / Other Grants FY11 CAB2 STP AAA FY08 PEMFAR, FY11 Study on the Revitalization of the Power Sector and Private Sector Participation, FY11 CEM IFC
Achieved - Increase competition in telecommunication sector
A second mobile telecommunications operator tender has been launched A PPP for accessing an ACE
62

Country Development Goals
Outcomes Status/Evaluation Summary WBG Program
submarine cable has been defined and established
Enhance STP’s investment climate
Achieved - Streamline licensing for customs and business
Steering Committee has been set up and has developed a reform roadmap to improve the business and custom licensing process.
IDA / Other Grants FY11 IFC Gran, FY12 Prog. DPL-1, AAA FY10, FY11, and FY12 Doing Business Survey, FY11 Study on the Revitalization of the Power Sector and Private Sector Participation, FY11 CEM, FY11 IFC Investment Reform Policy Note
Strengthen the financial system
Achieved - Financial intermediation has been strengthened and access to credit has been broadened.
A study on the potential and feasibility of microcredit has been prepared.
IDA / Other Grants FY12 IFC AMSME, FY13 Prog. DPL 2 AAA FY10, FY11, and FY12 Doing Business Survey, FY11 IFC Microfinance Study
PILLAR 2: Strengthen governance, public institutions and human capital
Strengthen the efficiency, transparency, and accountability of budgetary operations
Achieved - Budget preparation and execution are strengthened.
Public expenditure efficiency improved through links to budget links between budget allocations and policy priorities while improving transparency and accountability of public resources. Publish an updated database of mobile public assets as of December 2011. Public accounting statistics up
IDA / Other Grants FY05 GCBTA, FY08 PNMRD, FY09 PNMRD Supplement, FY11 PRMG, FY12 Prog. DPL 1 AAA FY08 PEMFAR, FY09 DeMPA, FY11 CEM , FY11-FY12 Debt Sustainability Analysis, FY12 DeMPA
63

Country Development Goals
Outcomes Status/Evaluation Summary WBG Program
to September 30, 2011 produced and harmonized with the statistics of the Central Bank.
Strengthen transparency and accountability of up-coming petroleum revenues
Partially Achieved - Strengthen National Petroleum Agency
National Petroleum Agency with 3 staff hired and trained New Petroleum contracts have been published
IDA / Other Grants FY05 GCBTA, FY05 Joint IDA/IMF Advisory Note on PRSP FY08 PNMRD, FY09 PNMRD Supplement. AAA FY08 PEMFAR, FY11 CEM
Human Resources Development and Access to Basic Social Services
Achieved - Improve access, quality and efficiency of education services
Increase survival rate in education from grade 1 to 6 from 85% to 93% Number of teachers trained or retrained reaches 780 Number of textbooks distributed to primary education students reaches 315,000 Effective learning times reaches 4 hours per day The vocational training strategy has been approved by the Council of Ministers
IDA / Other Grants FY09 Education for All/Fast Track Initiative Catalytic Fund Grant, FY10 Education for All Supplemental Financing AAA FY05 Joint IDA/IMF Advisory Note on PRSP, FY08 PEMFAR, FY11 CEM
Achieved - Improve access, quality and efficiency of health services
Increase in coverage of pregnant women receiving prenatal care from 90% to 95% (1 visit) Percentage of births attended by a skilled birth attendant increases from 86% to 90%
64

Country Development Goals
Outcomes Status/Evaluation Summary WBG Program
HIV/AID prevalence among pregnant women remains below 2% Percentage of women who identify correctly ways to prevent HIV/AIDS infection increases from 10% to 55% Number of health personnel trained reaches 150
Create strategies and information to allow measuring success
Achieved - A new development strategy has been completed and submitted to the National Assembly
PRSP Unit created and operational PRSP Annual Progress Implementation Reports completed New results based PRSP completed and submitted to the National Assembly for endorsement
IDA / Other Grants FY05 GCBTA, FY08 PNMRD, FY09 PNMRD Supplement, FY11 PRMG, FY12 Prog. DPL-1 AAA FY05 Joint Bank-IMF PRSP Progress Report, FY08 PEMFAR, FY09 DeMPA, FY11 CEM, FY11-FY12 Debt Sustainability Analysis, FY12 DeMPA
Strengthen environment protection and resilience
Achieved - Increase capacity costal fishers to address climate variation
Complete climate change trends and forecast study, including priority measures to reverse coastal erosion
IDA / Other Grants FY11 Adaption to Climate Change Project AAA FY11 CEM
65

Annex 6: São Tomé and Príncipe: Financial Management and Procurement Systems 1. Laws and regulations provide an enabling framework for effective public financial management (PFM). The 2007 SAFE Law adopted a chart of accounts employing double-entry accounting, which permits a more homogeneous and transparent recording of financial transactions, facilitating the analysis of outcomes. Corporate and personal income tax codes were revised in 2009 to harmonize taxation between enterprises and individuals, simplified the rate structure, and strengthened tax assessment. The Public Debt Management Law specifies the processes and procedures for contracting new public debt. These legislations were followed by elaboration of the chart of accounts, preparation and dissemination of a public accounting manual and a manual of operations for the management of assets, and approval of steps towards preparation of the Government financial statements. The public procurement legal framework has been significantly modernized following the approval, in March 2009, of the Decree-Law nr. 3/2009 and the Law nr. 8/2009, of 26 August 2009 that set up the new legal framework for public works contracts and acquisition of goods and services by the Government. Its scope covers central government entities, public institutes, national agencies, public enterprises, local authorities, and the autonomous region of Príncipe. The new legal regime requires that procurement should be ruled by the principles of economy, efficiency, transparency and publicity. It defines open competition as the preferred method for all procurement, requiring that its non-utilization should be the subject of proper justification. 2. Public fiduciary institutions have been created not so long ago. The systems of financial recording, accounting, and reporting of public resources have been considerably strengthened under the Government reform program supported by development partners. In 2009 the Government created the institutions required to prepare the public accounts, notably the Public Accounting Directorate (PAD) and the Public Assets Management Directorate. Since 2010, both institutions are operational with appropriate budget, personnel allocations, and equipment. PFM improvements, as a result, include consultative preparation of State budget within sectoral ceilings and enhanced comprehensiveness, public disclosure of State budget, enhanced tracking of pro-poor expenditures, a comprehensive inventory of existing mobile public assets (including vehicles) covering all sector ministries, and implementation of government IFMIS (SAFE-e). The new public procurement legal framework also created an independent entity (COSSIL – Gabinete de Coordenação e Seguimento do Sistema de Licitações) to regulate the process of procurement, responsible, amongst other things, for the definition of procurement policies/procedures, for an integrated management of data and information, for approval of bidding documents and validation of Evaluation Reports, and for periodic audits of procurement processes. Under this legal framework, the responsibility for procurement management rests with the spending ministries, through the Unidades de Gestão de Licitações (UGEL – Procurement Management Units) within Direccao Administrativa Financeira (DAF – Financial Administrative Direction). At the same time, the law created a non-judicial Conflict Resolution Commission under the responsibility of the Prime Minister’s Office, responsible for assessing the complaints and appeals submitted during public procurement processes. 3. However, the process of PFM reform is still at an early stage and it will take time and further support to reap the benefits. Overall, the 2009 Public Expenditure and Financial
66

Accountability (PEFA) scores were low. The majority of processes were graded with a “D”, and five processes received a grade of “B” or above (compared to only three processes in the 2008 PEFA out of a total of 28 processes). There has been a modest improvement in eight PEFA indicators between 2008 and 2009, with regard to comprehensiveness and transparency of public finances, and on the predictability and control of budget execution. A PEFA update (2013) is being finalized and draft results indicate improvements in 18 PEFA indicators, whereas only one indicator showed a negative trend. Nevertheless, the lack of public accounts makes it difficult to conduct macroeconomic and public financial analyses and, more importantly, hinders effective internal and external fiduciary control and legislative scrutiny. The 2013 PEFA public procurement indicator (PI-19) has an overall C+ score, with the highest score a B on the open competition sub-indicator (i), and two Cs on (ii) use of less competitive procurement and (iii) the complaints mechanism, which is the same score as the 2009 PEFA, indicating no significant progress Implementation and enhanced ownership of the new legal framework will gradually improve performance. However, poor practices like the non-formal appointment of the members of the Conflict Resolution Commission point towards a lack of robustness leading to the overall C+ P-19 PEFA indicator. In addition, general capacity constraints at central level institutions as well as in the Procurement Management Units at sector level hamper good public procurement system performance. A procurement performance indicator on competitiveness is proposed in the results framework. 4. The Bank program in STP will continue to support consolidation of remaining areas of PFM, particularly strengthening fiscal discipline through implementation of medium-term debt management strategy and legislation, preparation and auditing of State annual financial statements, and enhancing capacity for legislative scrutiny through targeted PFM training/ seminar for parliamentarians. The CPS also proposes to have one enhanced PIU with fiduciary staff (for Financial Management, Procurement and Accounting) to support implementation of Bank-financed projects within the Ministry of Planning and Finance, with dedicated project staff working with the PIU. PEFA Indicators: 2009 and 2013 INDICATOR 2009
Score 2013 Score
A. PFM OUT-TURNS: Credibility of the Budget PI-1 Aggregate expenditure out-turn compared to original
approved budget C C
PI-2 Composition of expenditure out-turn compared to original approved budget
D D+
PI-3 Aggregate revenue out-turn compared to original approved budget
A B
PI-4 Stock and monitoring of expenditure payment arrears C+ C+ B: KEY CROSS-CUTTING ISSUES: Comprehensiveness and Transparency PI-5 Classification of the Budget B B PI-6 Comprehensiveness of information included in budget
documentation C A
PI-7 Extent of unreported government operations C C PI-8 Transparency of inter-governmental fiscal operations B A
67

PI-9 Oversight of aggregate fiscal risk from public sector entities
D+ D+
PI-10 Public access to key fiscal information C B C: BUDGET CYCLE C(i) Policy-based Budgeting PI-11 Orderliness and participation in the annual budget process D B PI-12 Multi-year perspective in fiscal planning, expenditure
policy and budgeting D+ C+
C(ii) Predictability and Control in Budget Execution PI-13 Transparency of tax-payers’ obligations and liabilities B B+ PI-14 Effectiveness of measures for tax-payer registration and
tax assessment B B
PI-15 Effectiveness in collection of tax payments D+ D+ PI-16 Predictability in the availability of funds for commitment
of expenditures D+ B+
PI-17 Recording and management of cash balances, debt and guarantees
D+ C
PI-18 Effectiveness of payroll controls D D+ PI-19 Competition, value for money and controls in procurement C+ C+ PI-20 Effectiveness of internal controls for non-salary
expenditure D+ C
PI-21 Effectiveness of internal audit D+ C+ C(iii) Accounting, Recording and Reporting PI-22 Timeliness and regularity of accounts reconciliation D C PI-23 Availability of information on resources received by
service delivery units D C
PI-24 Quality and timeliness of in-year budget reports D+ C PI-25 Quality and timeliness of annual financial statements D D+ C(iv) External Scrutiny and Audit PI-26 Scope, nature and follow-up of External Audit D+ C+ PI-27 Legislative scrutiny of the annual budget law D+ B+ PI-28 Legislative scrutiny of external audit reports D D D. DONOR PRACTICES D-1 Predictability of Direct Budget Support NA NA D-2 Financial information provided by Donors for budgeting
and reporting on project aid
Pending D
D-3 Proportion of aid that is managed by use of national procedures
Pending D
68

Annex 7: São Tomé and Príncipe: Trust Funds
Donor Name Donor Country
Trust Fund #
Trust Fund Name Project # Project Name Net Grant Amount (US$000)
Grant Closing Date
Recipient Executed World Bank Group Other TF024918 HIPC - IDA - Sao Tome and
Principe EHIPC P076423 .. 6,379.35 12/31/2030
Multiple Donors Other TF024919 HIPC - IDA - Sao Tome (Other Donors)
P076423 .. 711.73 12/31/2030
Multiple Donors Other TF029761 HIPC - AFDB - Sao Tome and Principe
56,422.65 12/31/2030
Multiple Donors Other TF099869 Adaptation to Climate Change Project
P111669 ST - Adaptation to Climate Change (LDC)
4,100.00 12/31/2016
Bank Executed Portugal - Ministry of Finance
Portugal TF012010 Sao Tome IC 32.00 6/30/2015
United Nations Office for Project Services (UNOPS)
Denmark TF013155 EIF STP DTIS Update P132018 ST- Diagnostic Trade Integration Study
190.00 6/30/2014
Multiple Donors Other TF013250 Sao Tome project (SIDS docks)
P132646 Power Sector Efficiency Improvement
320.00 6/30/2014
Multiple Donors Other TF096978 Adaptation to Climate Change on the Coast of Sao Tome
P111669 ST - Adaptation to Climate Change (LDC)
100.00 6/30/2013
Portugal - Ministry of Finance
Portugal TF098628 Sao Tome License IFC-00581727
Sao Tome License 112.57 2/28/2015
Total 68,368.30
69

Annex 8: Development Assistance Provided to São Tomé and Príncipe
Pri
vate
S
ecto
r F
inan
cial
S
ecto
r
Infr
astr
uctu
re
/Tra
nsp
ort
Tra
de
Agr
icul
ture
/ F
ish
erie
s &
R
ura
l Dev
.
Hea
lth
Ed
uca
tion
En
viro
nmen
t
Wat
er &
S
anit
atio
n
Soc
ial
Pro
tect
ion
Pu
bli
c S
ecto
r
Jud
icia
l &
Leg
al R
efor
m
Cap
acit
y/In
st.
Bu
ild
ing
(in
cl. M
&E
)
Sec
uri
ty &
S
tab
ilit
y
Bilateral Assistance Brazil x x x x x x x x x x x x x Cabo Verde x x x x x x x Cuba x x France x x Gabon x x x x x x x Italy Japan x Luxemburg x x x Morocco x x x Nigeria x x x x Portugal x x x x x x x x Spain x x x South Korea x x x United States x x Venezuela x Multilateral Assistance AfDB x x x x x x x BADEA* x European Community x x x x x x x x x IMF x x United Nations x x x x x x x x x x World Bank x x x x x x x x x x Others Global Fund x Taiwan, China x x x x x x x *Arab Bank for Economic Development in Africa Source: Information provided by the Government of São Tomé and Príncipe
70

CPS Standard Annexes Annex A2: Country At-A-Glance
São Tomé and Principe at a glance 12/6/13
São Tomé Sub- LowerKey Development Indicators and Saharan middle
Principe Africa income(2012)
Population, mid-year (millions) 0.19 910 2,507Surface area (thousand sq. km) 1.0 24,262 20,742Population growth (%) 2.7 2.7 1.5Urban population (% of total population) 63 37 39
GNI (Atlas method, US$ billions) 0.2 1,225 4,710GNI per capita (Atlas method, US$) 1,310 1,345 1,879GNI per capita (PPP, international $) 1,850 2,247 3,913
GDP growth (%) 4.0 4.2 4.0GDP per capita growth (%) 1.3 1.5 2.5
(most recent estimate, 2005–2012)
Poverty headcount ratio at $1.25 a day (PPP, %) 28 a 48 27.1Poverty headcount ratio at $2.00 a day (PPP, %) 54 a 70 56.3Life expectancy at birth (years) 66 56 66Infant mortality (per 1,000 live births) 38 64 46Child malnutrition (% of children under 5) 14 21 24
Adult literacy, male (% of ages 15 and older) 94 69 80Adult literacy, female (% of ages 15 and older) 85 51 62Gross primary enrollment, male (% of age group) 129 104 107Gross primary enrollment, female (% of age group) 125 96 104
Access to an improved water source (% of population) 97 63 87Access to improved sanitation facilities (% of population) 34 30 47
Net Aid Flows 1980 1990 2000 2012 b
(US$ millions)Net ODA and official aid 4 54 35 49Top 3 donors (in 2010): Portugal .. 16 11 26 European Union Institutions 1 4 6 6 Japan 0 3 1 4
Aid (% of GNI) .. .. 51.3 24.6Aid per capita (US$) 40 461 250 277
Long-Term Economic Trends
Consumer prices (annual % change) 11.5 42.2 11.0 10.6GDP implicit deflator (annual % change) 25.9 42.2 10.0 10.4
Exchange rate (annual average, local per US$) 34.8 143.3 7,978.2 19,068.4Terms of trade index (2000 = 100) .. 106 100 148
1980–90 1990–2000 2000–12
Population, mid-year (millions) 0.1 0.1 0.1 0.2 2.1 1.7 2.5GDP (US$ millions) 82 120 77 263 -1.1 1.6 5.2
Agriculture 15.7 13.2 12.1 19.8 -1.1 -1.7 6.2Industry 10.2 8.6 10.5 14.2 -1.1 0.6 7.3 Manufacturing .. .. 7.4 6.4 .. .. 3.9Services .. .. 77.4 66.0 -1.1 2.4 4.8
Household final consumption expenditure 86.9 100.4 64.9 82.5 .. .. 3.5General gov't final consumption expenditure 19.7 13.3 45.1 13.1 -0.9 8.6 0.5Gross capital formation 9.6 14.2 26.1 45.8 .. .. 8.0
Exports of goods and services 12.7 6.9 21.2 11.2 -2.7 9.6 -0.9Imports of goods and services 28.9 34.7 57.4 52.6 2.7 2.9 -3.6Gross savings .. .. 12.2 24.4
Note: Figures in italics are for years other than those specified. .. indicates data are not available.a. Country poverty estimate is for earlier period. b. Aid data are for 2010.
Development Economics, Development Data Group (DECDG).
(average annual growth %)
(% of GDP)
10 5 0 5 100-4
15-19
30-34
45-49
60-64
75-79
percent of total population
Age distribution, 2012
Male Female
020406080
100120140160180200
1990 1995 2000 2011
São Tomé and P rincipe Sub-Saharan Af rica
Under-5 mortality rate (per 1,000)
-6-4-202468
101214
95 05
GDP GDP per capita
Growth of GDP and GDP per capita (%)
71

São Tomé and Principe
Balance of Payments and Trade 2000 2012
(US$ millions)Total merchandise exports (fob) 3 12Total merchandise imports (cif) 31 139Net trade in goods and services -28 -109
Current account balance -27 -56 as a % of GDP -34.6 -21.4
Personal transfers and compensation of employees (receipts) 0 7
Reserves, including gold 13 44
Central Government Finance
(% of GDP)Current revenue (including grants) 13.1 17.7 Tax revenue 9.7 15.3Current expenditure 14.7 17.4
Technology and Infrastructure 2000 2011Overall surplus/deficit -6.1 -11.5
Paved roads (% of total) 68.1 ..Highest marginal tax rate (%) Fixed line and mobile phone Individual .. .. subscribers (per 100 people) 3 73 Corporate .. .. High technology exports
(% of manufactured exports) 1.1 14.0External Debt and Resource Flows
Environment(US$ millions)Total debt outstanding and disbursed 304 202 Agricultural land (% of land area) 51 51Total debt service 4 2 Forest area (% of land area) 28.1 28.1Debt relief (HIPC, MDRI) 169 42 Terrestrial protected areas (% of land area) .. ..
Total debt (% of GDP) 396.1 76.5 Freshwater resources per capita (cu. meters) 15,092 11,901Total debt service (% of exports) 26.7 6.9 Freshwater withdrawal (billion cubic meters) .. ..
Foreign direct investment (net inflows) 4 .. CO2 emissions per capita (mt) 0.34 0.56Portfolio equity (net inflows) 0 ..
GDP per unit of energy use (2005 PPP $ per kg of oil equivalent) .. 5.3
Energy use per capita (kg of oil equivalent) .. 269
World Bank Group portfolio 2000 2011
(US$ millions)
IBRD Total debt outstanding and disbursed 0 0 Disbursements 0 0 Principal repayments 0 0 Interest payments 0 0
IDA Total debt outstanding and disbursed 59 14 Disbursements 2 0
Private Sector Development 2000 2012 Total debt service 1 0
Time required to start a business (days) – 7 IFC (fiscal year)Cost to start a business (% of GNI per capita) – 19.1 Total disbursed and outstanding portfolio – 0Time required to register property (days) – 62 of which IFC own account – 0
Disbursements for IFC own account – 0Ranked as a major constraint to business 2000 2012 Portfolio sales, prepayments and (% of managers surveyed who agreed) repayments for IFC own account – 0 n.a. .. .. n.a. .. .. MIGA
Gross exposure – –Stock market capitalization (% of GDP) .. .. New guarantees – –Bank capital to asset ratio (%) .. ..
Note: Figures in italics are for years other than those specified. 12/6/13.. indicates data are not available. – indicates observation is not applicable.
Development Economics, Development Data Group (DECDG).
0.0 25.0 50.0 75.0 100.0
Control of corruption
Rule of law
Regulatory quality
Polit ical stability andabsence of violence
Voice and accountability
Country's percentile rank (0-100)higher values imply better ratings
2012
2000
Governance indicators, 2000 and 2012
Source: Worldw ide Governance Indicators (www.govindicators.org)
IBRD, 0IDA, 14
IMF, 16
Other multi-lateral, 27
Bilateral, 148
Private, 0Short-term, 26
Composition of total external debt, 2011
US$ millions
72

Millennium Development Goals São Tomé and Principe
With selected targets to achieve between 1990 and 2015(estimate closest to date shown, +/- 2 years)
Goal 1: halve the rates for extreme poverty and malnutrition 1990 1995 2000 2011 Poverty headcount ratio at $1.25 a day (PPP, % of population) .. .. 28.2 .. Poverty headcount ratio at national poverty line (% of population) .. .. .. 66.2 Share of income or consumption to the poorest qunitile (%) .. .. 5.2 .. Prevalence of malnutrition (% of children under 5) .. .. 10.1 14.4
Goal 2: ensure that children are able to complete primary schooling Primary school enrollment (net, %) 97 .. 88 98 Primary completion rate (% of relevant age group) 79 .. 46 115 Secondary school enrollment (gross, %) 36 .. .. 69 Youth literacy rate (% of people ages 15-24) 94 .. 95 95
Goal 3: eliminate gender disparity in education and empower women Ratio of girls to boys in primary and secondary education (%) 96 .. .. 102 Women employed in the nonagricultural sector (% of nonagricultural employment) 32 .. .. .. Proportion of seats held by women in national parliament (%) 12 7 9 18
Goal 4: reduce under-5 mortality by two-thirds Under-5 mortality rate (per 1,000) 104 100 87 55 Infant mortality rate (per 1,000 live births) 67 65 57 39 Measles immunization (proportion of one-year olds immunized, %) 71 74 69 91
Goal 5: reduce maternal mortality by three-fourths Maternal mortality ratio (modeled estimate, per 100,000 live births) 150 120 110 70 Births attended by skilled health staff (% of total) .. .. 79 82 Contraceptive prevalence (% of women ages 15-49) .. .. 29 38
Goal 6: halt and begin to reverse the spread of HIV/AIDS and other major diseases Prevalence of HIV (% of population ages 15-49) 0.2 0.5 0.8 1.0 Incidence of tuberculosis (per 100,000 people) 135 124 114 94 Tuberculosis case detection rate (%, all forms) 11 26 60 86
Goal 7: halve the proportion of people without sustainable access to basic needs Access to an improved water source (% of population) .. 74 78 97 Access to improved sanitation facilities (% of population) .. 18 21 34 Forest area (% of land area) 28.1 28.1 28.1 28.1 Terrestrial protected areas (% of land area) .. .. .. .. CO2 emissions (metric tons per capita) 0.4 0.4 0.3 0.6 GDP per unit of energy use (constant 2005 PPP $ per kg of oil equivalent) .. .. .. 5.3
Goal 8: develop a global partnership for development Telephone mainlines (per 100 people) 1.9 2.0 3.3 4.7 Mobile phone subscribers (per 100 people) 0.0 0.0 0.0 68.3 Internet users (per 100 people) 0.0 .. 4.6 20.2 Households with a computer (%) .. 5.0 7.0 ..
Note: Figures in italics are for years other than those specified. .. indicates data are not available. 12/6/13
Development Economics, Development Data Group (DECDG).
São Tomé and Principe
0
25
50
75
100
125
2000 2005 2010
Prim ary net enrollment ratio
Ratio of girls to boys in primary & secondary education
Education indicators (%)
0
10
20
30
40
50
60
70
80
2000 2005 2010
Fixed + m obi le subscribers Internet users
ICT indicators (per 100 people)
0
25
50
75
100
1990 1995 2000 2011
São Tomé and P rincipe Sub-Saharan Af rica
Measles immunization (% of 1-year olds)
73

Annex B2
As Of Date 11/21/2013
Indicator 2011 2012 2013 2014Portfolio AssessmentNumber of Projects Under Implementation a 3 3 2 1Average Implementation Period (years) b 2.4 3.2 1.1 2.5Percent of Problem Projects by Number a, c 0.0 0.0 0.0 0.0Percent of Problem Projects by Amount a, c 0.0 0.0 0.0 0.0Percent of Projects at Risk by Number a, d 0.0 0.0 0.0 0.0Percent of Projects at Risk by Amount a, d 0.0 0.0 0.0 0.0Disbursement Ratio (%) e 20.5 21.1 32.3 3.9Portfolio ManagementCPPR during the year (yes/no)Supervision Resources (total US$)Average Supervision (US$/project)
Memorandum Item Since FY 80 Last Five FYsProj Eval by IEG by Number 13 3Proj Eval by IEG by Amt (US$ millions) 90.8 17.3% of IEG Projects Rated U or HU by Number 38.5 0.0% of IEG Projects Rated U or HU by Amt 46.7 0.0
a. As shown in the Annual Report on Portfolio Performance (except for current FY).b. Average age of projects in the Bank's country portfolio.c. Percent of projects rated U or HU on development objectives (DO) and/or implementation progress (IPd. As defined under the Portfolio Improvement Program.e. Ratio of disbursements during the year to the undisbursed balance of the Bank's portfolio at the beginning of the year: Investment projects only.* All indicators are for projects active in the Portfolio, with the exception of Disbursement Ratio, which includes all active projects as well as projects which exited during the fiscal year.
Selected Indicators* of Bank Portfolio Performance and Management
74

Annex B3
FYDeliveryFY14 1 Series 1 DPO3 2.2
FY14 2 Quality Education for All Project (IDA and GPE) 0.9
FY15 1 New Series DPO1 4.0
FY16 1 Private Sector Development Project 1.0
FY16 1 New Series DPO2 3.5
FY17 1 New Series DPO3 3.5
tbc 1 Regional: Central African Backbone (CAB6) Cable (tbc) 5.0 (tbc)
tbc 2 Social Protection and Vulnerability Pilot 1.0
TOTAL (excluding Regional IDA tbc) 16.1 Notes : tbc: To be confirmed. Theme 1Theme 2
Supporting Macroeconomic Stability and National CompetitivenessReducing Vulnerability and Strengthening Human Capacity
IBRD/IDA Program Summary - Sao Tome and PrincipeAs of Date 2/18/2014
Proposed IBRD/IDA Base-Case Financing ProgramTheme IDA
(US$M)Indicative Financing Program
75

Annex B3 (IFC)
Sao Tome and Principe: IFC Investment Operations Program
2011 2012 2013 2014*
Original Commitments (US$m)IFC and Participants 0.11 0.06 0.20IFC's Own Accounts only 0.11 0.06 0.20
Original Commitments by Sector (%)- IFC Accounts onlyFINANCE & INSURANCE 100 100 100Total 100 100 100 0
Original Commitments by Investment Instrument (%) - IFC Accounts onlyGuarantee 100 100 100Total 100 100 100 0
* Data as of November 01,2013
76

Annex B4
FY Theme Indicative AAA/Others
FY14 1 Report on Observance of Standards and Codes (ROSC) Accounting & Auditing
FY15 1 IFC – Investment Climate Reform Program
FY15 1 Debt Strategy Reform Plan
FY15 1 Analysis on Development of Transshipment and Overall Ports Sector (PPIAF/IFC)
FY15 2 Operationalizing the Social Protection Strategy (Programmatic AAA)
FY15 2 Social Protection - Rapid Social Response Trust Fund
FY15 1, 2 Skills Strategy
FY15 1 Agriculture Sector Issues
FY15/16 1, 2 Small Island Public Procurement Strategy
FY15/16 1, 2 WBI Courses and Seminars for Parliamentarians (tbc)
FY16 1 Policy Note on Public Spending
FY16 1 Strategy on Regional Integration and Trade Facilitation
FY16 1, 2 Financial Sector Development Strategy (FIRST)
Note: tbc: To be confirmedTheme 1Theme 2
Summary of Nonlending Services - Sao Tome and PrincipeAs of Date 3/12/2014
Supporting Macroeconomic Stability and National CompetitivenessReducing Vulnerability and Strengthening Human Capacity
77
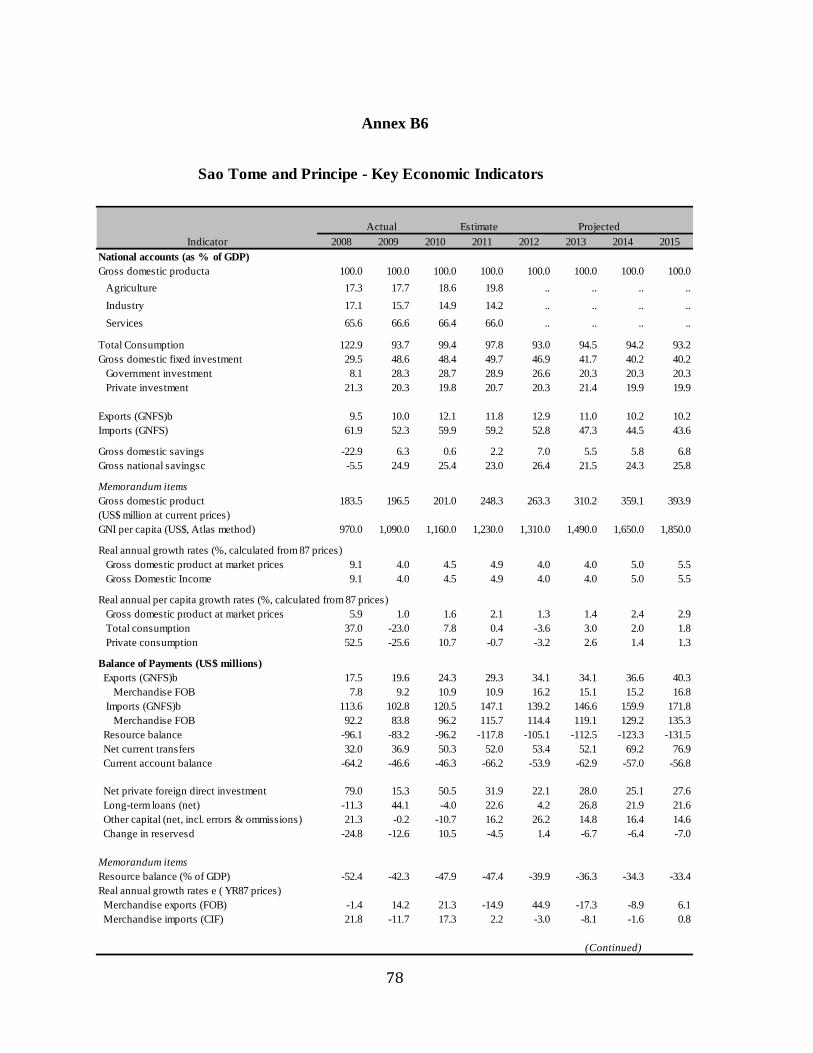
Annex B6
Sao Tome and Principe - Key Economic Indicators
Estimate
Indicator 2008 2009 2010 2011 2012 2013 2014 2015
National accounts (as % of GDP)Gross domestic producta 100.0 100.0 100.0 100.0 100.0 100.0 100.0 100.0
Agriculture 17.3 17.7 18.6 19.8 .. .. .. ..
Industry 17.1 15.7 14.9 14.2 .. .. .. ..
Services 65.6 66.6 66.4 66.0 .. .. .. ..
Total Consumption 122.9 93.7 99.4 97.8 93.0 94.5 94.2 93.2Gross domestic fixed investment 29.5 48.6 48.4 49.7 46.9 41.7 40.2 40.2 Government investment 8.1 28.3 28.7 28.9 26.6 20.3 20.3 20.3 Private investment 21.3 20.3 19.8 20.7 20.3 21.4 19.9 19.9
Exports (GNFS)b 9.5 10.0 12.1 11.8 12.9 11.0 10.2 10.2Imports (GNFS) 61.9 52.3 59.9 59.2 52.8 47.3 44.5 43.6
Gross domestic savings -22.9 6.3 0.6 2.2 7.0 5.5 5.8 6.8Gross national savingsc -5.5 24.9 25.4 23.0 26.4 21.5 24.3 25.8
Memorandum itemsGross domestic product 183.5 196.5 201.0 248.3 263.3 310.2 359.1 393.9(US$ million at current prices)GNI per capita (US$, Atlas method) 970.0 1,090.0 1,160.0 1,230.0 1,310.0 1,490.0 1,650.0 1,850.0
Real annual growth rates (%, calculated from 87 prices) Gross domestic product at market prices 9.1 4.0 4.5 4.9 4.0 4.0 5.0 5.5 Gross Domestic Income 9.1 4.0 4.5 4.9 4.0 4.0 5.0 5.5
Real annual per capita growth rates (%, calculated from 87 prices) Gross domestic product at market prices 5.9 1.0 1.6 2.1 1.3 1.4 2.4 2.9 Total consumption 37.0 -23.0 7.8 0.4 -3.6 3.0 2.0 1.8 Private consumption 52.5 -25.6 10.7 -0.7 -3.2 2.6 1.4 1.3
Balance of Payments (US$ millions) Exports (GNFS)b 17.5 19.6 24.3 29.3 34.1 34.1 36.6 40.3 Merchandise FOB 7.8 9.2 10.9 10.9 16.2 15.1 15.2 16.8 Imports (GNFS)b 113.6 102.8 120.5 147.1 139.2 146.6 159.9 171.8 Merchandise FOB 92.2 83.8 96.2 115.7 114.4 119.1 129.2 135.3 Resource balance -96.1 -83.2 -96.2 -117.8 -105.1 -112.5 -123.3 -131.5 Net current transfers 32.0 36.9 50.3 52.0 53.4 52.1 69.2 76.9 Current account balance -64.2 -46.6 -46.3 -66.2 -53.9 -62.9 -57.0 -56.8
Net private foreign direct investment 79.0 15.3 50.5 31.9 22.1 28.0 25.1 27.6 Long-term loans (net) -11.3 44.1 -4.0 22.6 4.2 26.8 21.9 21.6 Other capital (net, incl. errors & ommissions) 21.3 -0.2 -10.7 16.2 26.2 14.8 16.4 14.6 Change in reservesd -24.8 -12.6 10.5 -4.5 1.4 -6.7 -6.4 -7.0
Memorandum itemsResource balance (% of GDP) -52.4 -42.3 -47.9 -47.4 -39.9 -36.3 -34.3 -33.4Real annual growth rates e ( YR87 prices) Merchandise exports (FOB) -1.4 14.2 21.3 -14.9 44.9 -17.3 -8.9 6.1 Merchandise imports (CIF) 21.8 -11.7 17.3 2.2 -3.0 -8.1 -1.6 0.8
(Continued)
Actual Projected
78

Sao Tome and Principe - Key Economic Indicators
(Continued)
Estimate Projected
Indicator 2008 2009 2010 2011 2012 2013 2014 2015
Public finance (as % of GDP at market prices)f Current revenues incl. current grants 20.1 17.0 18.9 19.9 17.7 21.1 20.3 20.0 Current expenditures 21.1 20.3 19.8 19.4 17.4 18.2 18.1 17.9 Current account surplus (+) or deficit (-) -1.0 -3.3 -0.9 0.4 0.3 2.9 2.3 2.1 Capital expenditure incl. net lending 10.1 29.4 29.2 29.6 26.9 20.8 20.8 20.8 Foreign financing (net loans + capital grants) 7.7 25.2 25.8 26.9 26.2 18.9 17.8 18.5
Monetary indicators M2/GDP 38.8 35.5 38.0 35.7 37.4 36.6 36.3 36.7 Growth of M2 (%) 27.2 8.2 25.1 10.4 20.3 11.5 13.1 9.5
Price indices( YR87 =100) Merchandise terms of trade index 137.2 187.7 192.2 165.3 139.4 142.3 150.5 150.3 Real exchange rate index (US$/LCU)g 3.6 4.0 3.9 4.4 4.6 .. .. ..
Real interest rates Consumer price index (% change) 32.0 17.0 13.3 14.3 10.6 8.2 7.1 5.0 GDP deflator (% change) 26.6 13.6 11.7 12.1 10.3 9.8 8.4 2.6
a. GDP at market pricesb. "GNFS" denotes "goods and nonfactor services."c. Includes net unrequited transfers excluding official capital grants.d. Includes use of IMF resources.e. Based in constant local currency data from National Accounts.f. Consolidated central government.g. "LCU" denotes "local currency units." An increase in US$/LCU denotes appreciation.
February 24, 2014.
79

Annex B7
Sao Tome and Principe - Key Exposure Indicators
Actual Estimated
Indicator 2008 2009 2010 2011 2012 2013 2014 2015
Total debt outstanding and 110.1 136.0 157.1 181.9 221.6 250.8 275.8 298.7
disbursed (TDO) (US$m)a
Net disbursements (US$m)a 3.2 27.6 20.8 26.9 20.0 31.3 23.9 21.8
Total debt service (TDS) 1.9 1.6 1.6 2.4 2.4 5.3 5.5 5.5
(US$m)a
Debt and debt service indicators
(%)
TDO/XGSb 628.7 693.3 645.9 619.9 650.5 733.9 754.1 741.0
TDO/GDP 60.0 69.2 78.1 73.3 84.1 80.8 76.8 75.8
TDS/XGS 10.9 8.3 6.6 8.0 7.1 15.5 15.0 13.6
IBRD exposure indicators (%)
IBRD DS/public DS .. .. .. .. .. .. .. ..
Preferred creditor DS/public .. .. .. .. .. .. .. ..
DS (%)c
IBRD DS/XGS .. .. .. .. .. .. .. ..
IBRD TDO (US$m)d .. .. .. .. .. .. .. ..
Of which present value of .. .. .. .. .. .. .. ..
guarantees (US$m) .. .. .. .. .. .. .. ..
Share of IBRD portfolio (%) .. .. .. .. .. .. .. ..
IDA TDO (US$m)d 13.3 14.4 14.2 14.1 14.0 .. .. ..
IFC (US$m)
Loans .. .. .. .. .. .. .. ..
Equity and quasi-equity /c .. .. .. .. .. .. .. ..
MIGA
MIGA guarantees (US$m) .. .. .. .. .. .. .. ..
Soure: IMF,WB, and WB staff calculations.
a. Total Government debt.
b. "XGS" denotes exports of goods and services, including workers' remittances.
c. Preferred creditors are defined as IBRD, IDA, the regional multilateral development banks, the IMF, and the
Bank for International Settlements.
d. Includes present value of guarantees.
e. Includes equity and quasi-equity types of both loan and equity instruments.
Projected
80

Annex B8
Closed Projects 17
IBRD/IDA *Total Disbursed (Active) of w hich has been repaid 0.00Total Disbursed (Closed) 40.83 of w hich has been repaid 5.75Total Disbursed (Active + Closed) 40.83 of w hich has been repaid 5.75
Total Undisbursed (Active) Total Undisbursed (Closed) 0.00Total Undisbursed (Active + Closed) 0.00
Active Projects
Project ID Project Name Development Objectives
Implementation Progress Fiscal Year IBRD IDA GRANT Cancel. Undisb. Orig. Frm Rev'd
P111669 ST - Adaptation to Climate Change (LDC) S MS 2011 4.383 0.013 3.054 1.060 0.236
Operations Portfolio (IBRD/IDA and Grants)
As Of Date 11/21/2013
Supervision Rating
Last PSR
Original Amount in US$ Millions Disbursements a/
Difference BetweenExpected and Actual
81

Annex B8 (IFC)
Sao Tome and Principe
Committed and Disbursed Outstanding Investment Portfolio
(In US$ Millions)
Committed Disbursed Outstanding
FY Approval
Company Loan Equity
**Quasi Equity *GT/RM
Partici pant Loan Equity
**Quasi Equity *GT/RM
Partici pant
82
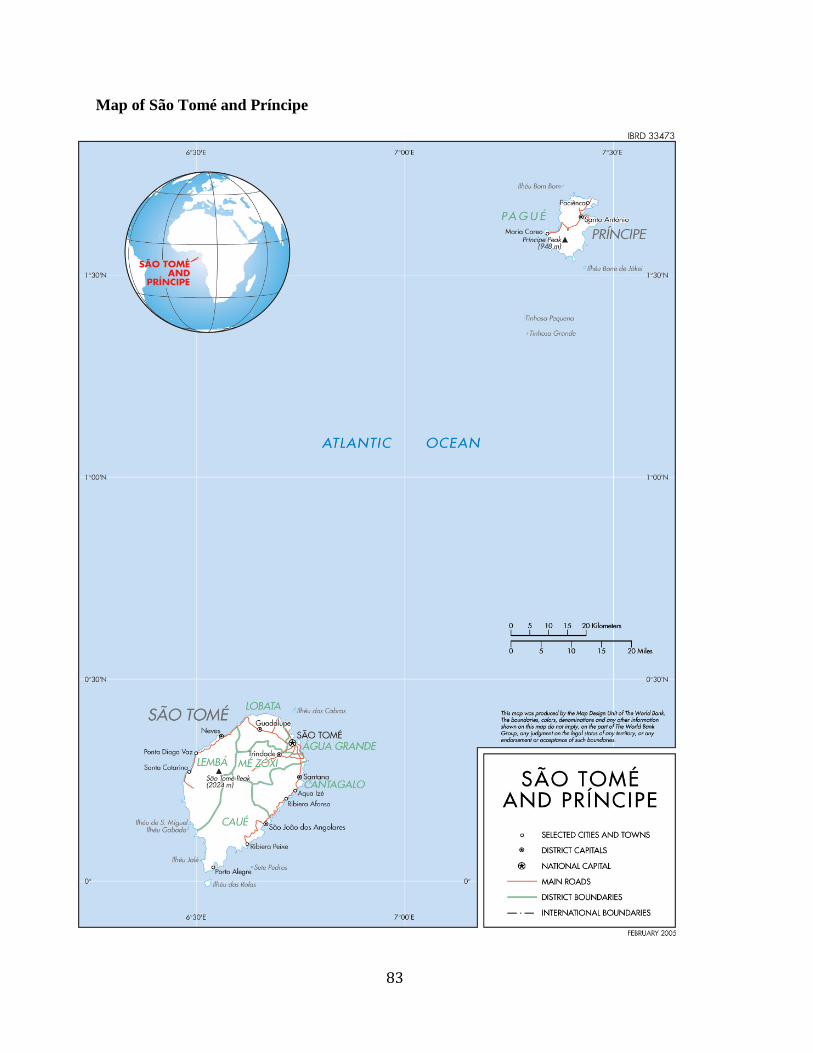
Map of São Tomé and Príncipe
83
Top Related