


Languages
Pages
Legal


FD/May 4, 2013 paraf: D1/May 4, 2013 Paraf:
PT LIPPO KARAWACI Tbk AND SUBSIDIARIES Consolidated Financial Statements As of March 31, 2013 (Unaudited) and December 31, 2012 (Audited) and For the 3 (Three) Months Ended March 31, 2013 and 2012 (Unaudited)

FD/May 4, 2013 paraf:
PT LIPPO KARAWACI Tbk AND SUBSIDIARIES Table of Contents Page
Directors’ Statement Letter Consolidated Financial Statements As of March 31, 2013 (Unaudited) and December 31, 2012 (Audited) and For the 3 (Three) Months Ended March 31, 2013 and 2012 (Unaudited)
Consolidated Statements of Financial Position 1 Consolidated Statements of Comprehensive Income 3 Consolidated Statements of Changes in Equity 4 Consolidated Statements of Cash Flows 5 Notes to the Consolidated Financial Statements 6
These consolidated financial statements are originally issued in Indonesian language
The accompanying notes form an integral part of these consolidated financial statements FD/May 7, 2013 1 Sign:
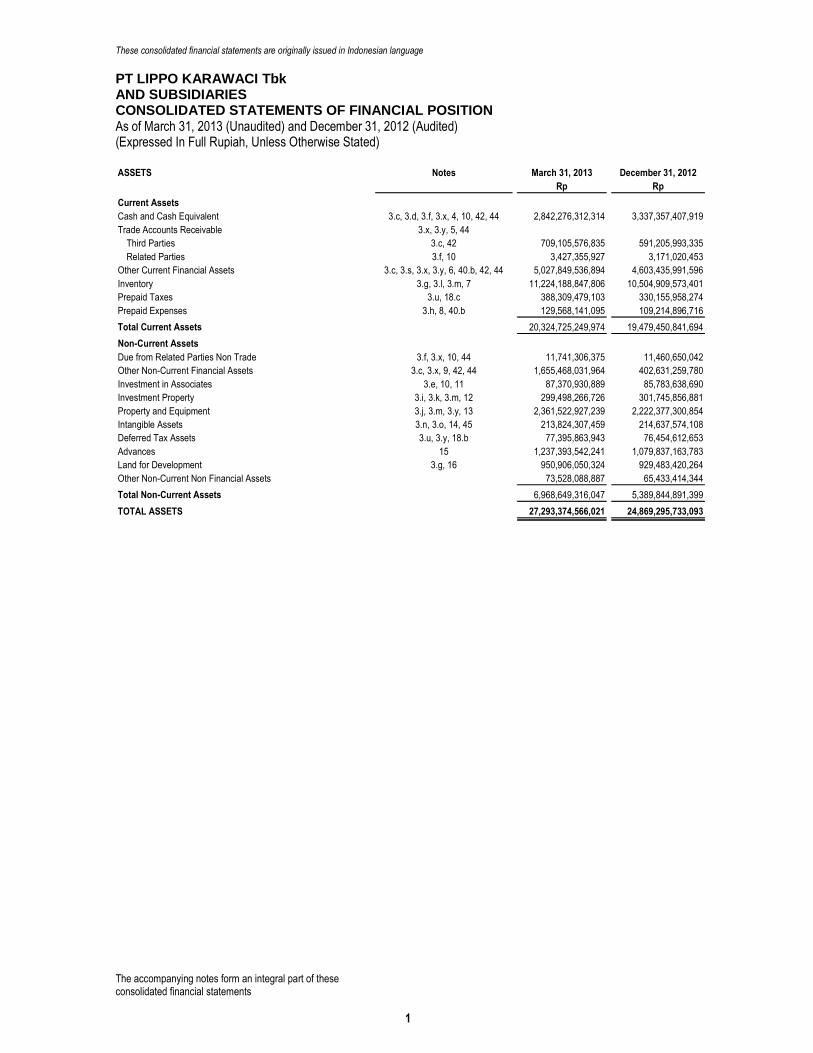
PT LIPPO KARAWACI Tbk AND SUBSIDIARIES CONSOLIDATED STATEMENTS OF FINANCIAL POSITION As of March 31, 2013 (Unaudited) and December 31, 2012 (Audited) (Expressed In Full Rupiah, Unless Otherwise Stated) ASSETS Notes March 31, 2013 December 31, 2012
Rp Rp
Current Assets
Cash and Cash Equivalent 3.c, 3.d, 3.f, 3.x, 4, 10, 42, 44 2,842,276,312,314 3,337,357,407,919
Trade Accounts Receivable 3.x, 3.y, 5, 44
Third Parties 3.c, 42 709,105,576,835 591,205,993,335
Related Parties 3.f, 10 3,427,355,927 3,171,020,453
Other Current Financial Assets 3.c, 3.s, 3.x, 3.y, 6, 40.b, 42, 44 5,027,849,536,894 4,603,435,991,596
Inventory 3.g, 3.l, 3.m, 7 11,224,188,847,806 10,504,909,573,401
Prepaid Taxes 3.u, 18.c 388,309,479,103 330,155,958,274
Prepaid Expenses 3.h, 8, 40.b 129,568,141,095 109,214,896,716
Total Current Assets 20,324,725,249,974 19,479,450,841,694
Non-Current Assets
Due from Related Parties Non Trade 3.f, 3.x, 10, 44 11,741,306,375 11,460,650,042
Other Non-Current Financial Assets 3.c, 3.x, 9, 42, 44 1,655,468,031,964 402,631,259,780
Investment in Associates 3.e, 10, 11 87,370,930,889 85,783,638,690
Investment Property 3.i, 3.k, 3.m, 12 299,498,266,726 301,745,856,881
Property and Equipment 3.j, 3.m, 3.y, 13 2,361,522,927,239 2,222,377,300,854
Intangible Assets 3.n, 3.o, 14, 45 213,824,307,459 214,637,574,108
Deferred Tax Assets 3.u, 3.y, 18.b 77,395,863,943 76,454,612,653
Advances 15 1,237,393,542,241 1,079,837,163,783
Land for Development 3.g, 16 950,906,050,324 929,483,420,264
Other Non-Current Non Financial Assets 73,528,088,887 65,433,414,344
Total Non-Current Assets 6,968,649,316,047 5,389,844,891,399
TOTAL ASSETS 27,293,374,566,021 24,869,295,733,093

These consolidated financial statements are originally issued in Indonesian language
The accompanying notes form an integral part of these consolidated financial statements FD/May 7, 2013 2 Sign:
PT LIPPO KARAWACI Tbk AND SUBSIDIARIES CONSOLIDATED STATEMENTS OF FINANCIAL POSITION (Continued) As of March 31, 2013 (Unaudited) and December 31, 2012 (Audited) (Expressed In Full Rupiah, Unless Otherwise Stated) LIABILITIES AND EQUITY Notes March 31, 2013 December 31, 2012
Rp Rp
LIABILITIES
Current Liabilities
Trade Accounts Payable 3.x, 44
Third Parties 3.c, 19, 42 309,573,737,661 575,701,267,461
Accrued Expenses 3.c, 3.l, 3.s, 3.x, 17, 40.c, 42, 44 659,477,825,910 487,335,826,278
Taxes Payable 3.u, 18.d 202,507,169,903 199,078,158,108
Short-Term Employment Benefits Liabilities 3.q, 3.y, 44 10,527,916,483 6,326,397,455
Short-Term Bank Loans 3,x, 20, 44 4,926,981,771 4,853,583,896
Current Portion of Long-Term Bank Loans 3.x, 22, 44 11,355,521,381 11,218,103,420
Other Current Financial Liabilities 3.x, 21, 42, 44 137,405,291,649 179,543,836,416
Advances from Customers 3.t, 25 1,648,235,501,394 1,850,726,035,076
Deferred Income 3.f, 3.t, 26 81,147,110,836 79,696,900,858
Deferred Gain on Sale and Leaseback Transactions 3.k, 27, 40.b 84,925,516,385 84,727,362,523
Total Current Liabilities 3,150,082,573,373 3,479,207,471,491
Non-Current Liabilities
Long-Term Bank Loans 3.x, 22, 44 51,861,473,932 54,753,114,466
Due to Related Parties Non Trade 3.f, 3.x, 10, 44 3,732,623,194 3,188,994,396
Bonds Payable 3.c, 3.p, 3.x, 23, 42, 44 7,280,488,405,426 5,943,529,636,435
Other Non-Current Financial Liabilities 3.x, 44 55,766,214,568 85,634,498,079
Long-Term Employment Benefits Liabilities 3.f, 3.q, 3.y, 10, 24 161,333,982,735 161,333,982,735
Deferred Tax Liabilities 3.u, 3.y, 18.b 6,653,250,000 6,653,250,000
Advances from Customers 3.t, 25 2,875,477,087,592 2,142,860,001,643
Deferred Income 3.f, 3.t, 26 652,910,132,656 662,901,019,769
Deferred Gain on Sale and Leaseback Transactions 3.k, 27, 40.b 839,623,853,181 859,127,373,604
Total Non-Current Liabilities 11,927,847,023,284 9,919,981,871,127
Total Liabilities 15,077,929,596,657 13,399,189,342,618
EQUITY
Equity Attributable to Owner of the Parent Company
Capital Stock
Par Value - Rp 100
Authorized Capital - 64,000,000,000 shares
Issued and Fully Paid - 23,077,689,619 shares
as of March 31, 2013 and December 31, 2012 28 2,307,768,961,900 2,307,768,961,900
Additional Paid-in Capital - Net 3.r, 29 4,063,148,621,880 4,063,148,621,880
Difference in Transactions with Non-Controlling Interest 30 (243,319,555,976) (242,888,251,427)
Treasury Stock 3.x, 28 (216,524,113,794) (216,524,113,794)
Retained Earnings 4,041,920,153,339 3,790,222,421,118
Other Comprehensive Income 32 1,351,810,712,251 954,389,097,088
Total Equity Attributable to Owner of the Parent Company 11,304,804,779,600 10,656,116,736,765
Non-Controlling Interest 3.n, 33 910,640,189,764 813,989,653,710
Total Equity 12,215,444,969,364 11,470,106,390,475
TOTAL LIABILITIES AND EQUITY 27,293,374,566,021 24,869,295,733,093

These consolidated financial statements are originally issued in Indonesian language
The accompanying notes form an integral part of these consolidated financial statements FD/May 7, 2013 3 Sign:
PT LIPPO KARAWACI Tbk AND SUBSIDIARIES CONSOLIDATED STATEMENTS OF COMPREHENSIVE INCOME For the 3 (three) Months Ended March 31, 2013 and 2012 (Unaudited) (Expressed In Full Rupiah, Unless Otherwise Stated)
Notes 2013 2012
(3 Months) (3 Months)
Rp Rp
REVENUES 3.f, 3.t, 3.y, 10, 34 1,476,867,991,405 1,171,005,316,550
COST OF SALES 3.t, 3.y, 35 (763,809,628,689) (627,189,551,615)
GROSS PROFIT 713,058,362,716 543,815,764,935
Other Income 3.t, 38 37,236,119,582 40,737,052,401
Operating Expenses 3.t, 36 (339,711,733,550) (264,487,358,718)
Other Expenses 3.t, 38 (13,466,661,928) (12,950,362,817)
PROFIT FROM OPERATIONS 397,116,086,820 307,115,095,801
Financial Charges - Net 37 (907,995,977) (8,779,998,954)
Share in the Profit of Associates 3.e, 11 1,587,292,199 1,077,050,235
PROFIT BEFORE TAX 397,795,383,042 299,412,147,082
Tax Expenses 3.t, 3.u, 18.a (49,447,114,768) (40,880,839,926)
PROFIT FOR THE PERIOD 348,348,268,274 258,531,307,156
OTHER COMPREHENSIVE INCOME
Gain from Translations Financial Statements in Foreign Currency 3.c, 32 (18,042,244,096) (161,751,652)
Gain on Changes in Fair Value of
Available-for-Sale Financial Assets 3.c, 3.x, 6, 32 415,463,859,259 369,539,789,829
TOTAL OTHER COMPREHENSIVE INCOME
FOR THE PERIOD 397,421,615,163 369,378,038,177
TOTAL COMPREHENSIVE INCOME FOR THE PERIOD 745,769,883,437 627,909,345,333
Profit for the Period Attributable to:
Owner of the Parent Company 251,697,732,221 205,220,379,099
Non-Controlling Interest 3.b 96,650,536,053 53,310,928,057
348,348,268,274 258,531,307,156
Total Comprehensive Income for the Period Attributable to:
Owner of the Parent Company 649,119,347,384 574,598,417,276
Non-Controlling Interest 3.b 96,650,536,053 53,310,928,057
745,769,883,437 627,909,345,333
EARNINGS PER SHARE
Basic, Profit for the Period Attributable to
Ordinary Share Holders of the Parent Company 3.v, 39 11.05 8.95

These consolidated financial statements are originally issued in Indonesian language
The accompanying notes form an integral part of these consolidated financial statements FD/May 7, 2013 4 paraf:
PT LIPPO KARAWACI Tbk AND SUBSIDIARIES CONSOLIDATED STATEMENTS OF CHANGES IN EQUITY For the 3 (three) Months Ended March 31, 2013 and 2012 (Unaudited) (Expressed In Full Rupiah, Unless Otherwise Stated)
Difference in Value
from Restructuring Gain (Loss)
Transactions on Changes
between Difference in Gain from in Fair Value of
Issued and Fully Entities Under Transactions with Translations Financial Available for
Paid-in Capital Premium Common Control- Non-Controlling Treasury Statements in Sale Financial Non-Controlling
Notes Capital Stock on Stock Net Total Interest Stock Appropriated Unappropriated Total Foreign Currency Assets Total Total Interest Total
Rp Rp Rp Rp Rp Rp Rp Rp Rp Rp Rp Rp Rp Rp Rp
BALANCE AS OF DECEMBER 31, 2011 2,307,768,961,900 4,043,613,274,615 19,535,347,265 4,063,148,621,880 (177,677,727,750) (61,731,458,788) 5,000,000,000 2,902,500,486,689 2,907,500,486,689 9,540,001,087 (214,851,685,152) (205,311,684,065) 8,833,697,199,866 575,320,994,588 9,409,018,194,454
Equity Changes in 2012
Share Buyback 28 -- -- -- -- -- (154,792,655,006) -- -- -- -- -- -- (154,792,655,006) -- (154,792,655,006)
Dividend and Reserved Fund 31 -- -- -- -- -- -- 1,000,000,000 (178,500,000,000) (177,500,000,000) -- -- -- (177,500,000,000) -- (177,500,000,000)
Purchase of Minority Stocks by Subsidiary -- -- -- -- (65,210,523,677) -- -- -- -- -- -- -- (65,210,523,677) (23,795,497,725) (89,006,021,402)
Dividend Paid in Subsidiary -- -- -- -- -- -- -- -- -- -- -- -- -- (8,268,034,677) (8,268,034,677)
Acquisition of Subsidiaries -- -- -- -- -- -- -- -- -- -- -- -- -- 8,107,107,015 8,107,107,015
Total Comprehensive Income for the Year -- -- -- -- -- -- -- 1,060,221,934,429 1,060,221,934,429 50,594,220,564 1,109,106,560,589 1,159,700,781,153 2,219,922,715,582 262,625,084,509 2,482,547,800,091
BALANCE AS OF DECEMBER 31, 2012 2,307,768,961,900 4,043,613,274,615 19,535,347,265 4,063,148,621,880 (242,888,251,427) (216,524,113,794) 6,000,000,000 3,784,222,421,118 3,790,222,421,118 60,134,221,651 894,254,875,437 954,389,097,088 10,656,116,736,765 813,989,653,710 11,470,106,390,475
Equity Changes in 2013
Total Comprehensive Income for the Period -- -- -- -- (431,304,549) -- -- 251,697,732,221 251,697,732,221 (18,042,244,096) 415,463,859,259 397,421,615,163 648,688,042,835 96,650,536,054 745,338,578,889
BALANCE AS OF MARCH 31, 2013 2,307,768,961,900 4,043,613,274,615 19,535,347,265 4,063,148,621,880 (243,319,555,976) (216,524,113,794) 6,000,000,000 4,035,920,153,339 4,041,920,153,339 42,091,977,555 1,309,718,734,696 1,351,810,712,251 11,304,804,779,600 910,640,189,764 12,215,444,969,364
Total Equity Attributable to Owner of Parent Company
Additional Capital - Net
Other Comprehensive IncomeRetained Earnings

These consolidated financial statements are originally issued in Indonesian language
The accompanying notes form an integral part of these consolidated financial statements
D/May 7, 2013 5 paraf:
PT LIPPO KARAWACI Tbk AND SUBSIDIARIES CONSOLIDATED STATEMENTS OF CASH FLOWS For the 3 (three) Months Ended March 31, 2013 and 2012 (Unaudited) (Expressed In Full Rupiah, Unless Otherwise Stated)
2013 2012
(3 Months) (3 Months)
Rp Rp
CASH FLOWS FROM OPERATING ACTIVITIES
Collections from Customers 1,852,530,989,450 1,456,626,892,510
Payments to Suppliers (1,982,924,303,686) (1,024,962,614,601)
Payments to Employees (173,033,638,852) (119,647,748,377)
Cash from Operations (303,426,953,088) 312,016,529,532
Interest Received (Payments) 16,875,111,338 (2,566,451,126)
Payments of Taxes (153,934,243,578) (138,160,771,311)
Net Cash Provided by (Used in) Operating Activities (440,486,085,328) 171,289,307,095
CASH FLOWS FROM INVESTING ACTIVITIES
Receipt of Dividend 49,020,009,750 103,400,249,619
Receipt of Promissory Notes -- 31,878,000,000
Proceeds from Disposal of Property and Equipment -- 5,585,150
Placement of Investments -- (12,000,000,000)
Acquisition of Property and Equipment and Investment Property (199,278,214,851) (184,138,086,948)
Placement of Restricted Funds (1,252,836,772,184) (21,850,133,945)
Net Cash Used in Investing Activities (1,403,094,977,285) (82,704,386,124)
CASH FLOW FROM FINANCING ACTIVITIES
Net Proceeds from Bond Issuance 1,291,383,534,017 --
Received (Payments) to Related Parties - Net 205,248,433 (1,026,177,670)
Proceeds from Bank Loan -- 45,000,000,000
Share Buyback -- (101,724,314,666)
Repayment of Loans (2,680,824,698) (141,872,981,039)
Net Cash Provided by (Used in) Financing Activities 1,288,907,957,752 (199,623,473,375)
NET DECREASE IN CASH AND CASH EQUIVALENT (554,673,104,861) (111,038,552,404)
Effect of Foreign Exchange on Cash and Cash Equivalent at the End of the Period 59,592,009,256 11,888,336,448
BEGINNING BALANCE OF CASH AND CASH EQUIVALENT 3,337,357,407,919 2,174,560,697,339
ENDING BALANCE OF CASH AND CASH EQUIVALENT 2,842,276,312,314 2,075,410,481,383
Cash and Cash Equivalent at the End of the Period consist of:
Cash on Hand 10,110,737,297 5,061,485,855
Cash in Bank 883,850,532,547 698,141,185,928
Time Deposits 1,948,315,042,470 1,372,207,809,600
Total 2,842,276,312,314 2,075,410,481,383

These consolidated financial statements are originally issued in Indonesian language
PT LIPPO KARAWACI Tbk AND SUBSIDIARIES NOTES TO THE CONSOLIDATED FINANCIAL STATEMENTS As of March 31, 2013 (Unaudited) and December 31, 2012 (Audited) and For the 3 (three) Months Ended March 31, 2013 and 2012 (Unaudited) (Expressed In Full Rupiah, Unless Otherwise Stated)
FD/May 7, 2013 6 paraf:
1. General
1.a. The Company’s Establishment
PT Lippo Karawaci Tbk (“the Company”) was established under the name of PT Tunggal Reksakencana on October 15, 1990 based on the Deed of Establishment No. 233, which was made in the presence of Misahardi Wilamarta, S.H., a notary in Jakarta. The deed of establishment was approved by the Minister of Justice of the Republic of Indonesia in his Decree No. C2-6974.HT.01.01.TH.91 dated November 22, 1991 and was published in the State Gazette No. 62, Supplement No. 3593 on August 4, 1992. The Company’s articles of association has been amended several times, and the latest was by the Deed of Extraordinary General Meeting of Stockholders No. 19 dated May 31, 2011, made in the presence of Unita Christina Winata, S.H., a notary in Tangerang, in relation to the increase of the Company's issued and fully paid-in capital and the changes in the Company’s scope of activities. The deed was received by the Minister of Law and Human Rights of the Republic of Indonesia in his decree No.AHU-AH.01.10-16825 dated June 1, 2011. In accordance with article 3 of the Company’s articles of association, the Company’s scope of activities include real estate, urban development, land purchasing and clearing, land cut and fill, land development and excavation; infrastructure development; planning, developing, leasing, selling and managing of buildings, houses, offices and industrial estates, hotels, hospitals, commercial centers and sports centers, supporting infrastructure, including but not limited to golf courses, club houses, restaurants, other entertainment centers, medical laboratories, medical pharmacies and related facilities, directly or by investment or capital divestment; build and operate environment infrastructure, build and manage public facilities and accommodation services and operating activities in services consisting of public transportation, security services and other supporting services, except for legal and taxation services. The Company started commercial operations in 1993. As of the reporting date, the Company's main activity is in the field of Urban Development, Large Scale Integrated Development, Retail Malls, Healthcare, Hospitality and Infrastructure, and Property and Portfolio Management. The work area of the Company and its subsidiaries, includes Sumatra, Java, Bali, Kalimantan and Sulawesi. The Company’s office located at 7 Boulevard Palem Raya # 22-23, Menara Matahari, Lippo Karawaci Central, Tangerang 15811, Banten - Indonesia. The Company is a member of the Lippo Group.
1.b. The Company’s Initial Public Offering The Company’s initial public offering of 30,800,000 shares was declared effective by the Chairman of Capital Market and Financial Institution Supervisory Agency (Bapepam-LK) (formerly Capital Market Supervisory Board) in his Decree No. S-878/PM/1996 dated June 3, 1996, and was listed in the Indonesian Stock Exchange on June 28, 1996. Subsequently, the Company offered 607,796,000 shares to its existing stockholders through Limited Public Offering I, as approved by the Decree of the Chairman of Bapepam-LK in his letter No. S-2969/PM/1997 dated December 30, 1997. These shares were listed in the Indonesian Stock Exchange on January 16, 1998. On July 30, 2004, the Company acquired and merged with several companies. As part of the merger, the Company issued 1,063,275,250 new shares which increased the Company’s total outstanding shares to 2,050,943,750 shares. The increase of authorized, issued and fully paid capital was approved by the Minister of Law and Human Rights of the Republic of Indonesia in his Decree No. C-19039.HT.01.04.Th.04 dated July 30, 2004.

These consolidated financial statements are originally issued in Indonesian language
PT LIPPO KARAWACI Tbk AND SUBSIDIARIES NOTES TO THE CONSOLIDATED FINANCIAL STATEMENTS (Continued) As of March 31, 2013 (Unaudited) and December 31, 2012 (Audited) and For the 3 (three) Months Ended March 31, 2013 and 2012 (Unaudited) (Expressed In Full Rupiah, Unless Otherwise Stated)
FD/May 7, 2013 7 paraf:
In 2004, the Company offered 881,905,813 common shares at par value of Rp 500 to the stockholders through Limited Public Offering II in connection with Preemptive Rights Issuance and issued 529,143,440 Warrants Series I as a compliment to stockholders who exercised their rights in the Limited Public Offering II. This offering was approved by the Decree of the Chairman of Bapepam-LK in his Letter No. S-3357/PM/2004 dated October 29, 2004. These shares were listed in the Indonesian Stock Exchange on January 20, 2005. On July 28, 2006, the Company exercised stock split from one to two shares. The outstanding 5,871,017,072 shares as of December 31, 2006 have been listed in the Indonesian Stock Exchange. On December 26, 2007, the Company exercised stock split from Rp 250 to Rp 100 per share. The outstanding 17,302,151,695 shares as of December 31, 2007 have been listed in the Indonesian Stock Exchange. In December 2010, the Company offered 4,325,537,924 common shares with a par value of Rp 100 to the stockholders through Limited Public Offering III. This offering has received an effective notice of registration statement through the letter of the Chairman of Bapepam-LK No. S-10674/BL/2010, dated November 29, 2010 and was approved by the stockholders through a resolution of the EGM on same date. On December 29, 2010, these shares were listed in the Indonesian Stock Exchange. Based on the Deed of Extraordinary General Meeting of Stockholders (EGMS) No. 02 dated May 3, 2011 which was made in the presence of Unita Christina Winata, SH, a notary in Jakarta, which was recently updated by the Deed of EGMS Resolution No. 13 dated March 9, 2011, made in the presence of same notary, the stockholders approved the issuance of new shares within the framework of the Non Preemptive Rights Issuance (NPRI) with a maximum of 10% of paid-in capital or 2,162,768,961 shares. The NPRI can be implemented at once and / or gradually within a period of 2 (two) years as approved by the EGMS. On June 6, 2011, the addition of 1,450,000,000 shares has been issued. The new shares were listed in the Indonesian Stock Exchange on June 8, 2011. Based on the Deed of EGMS No. 19 dated November 15, 2011 which was made in the presence of Unita Christina Winata, SH, a notary in Jakarta, the shareholders approved the repurchase (buyback) of outstanding shares. In 2011, the number of shares repurchased amounted to 96,229,500 shares, bringing the total number of ordinary shares outstanding as of the December 31, 2011 amounted to 22,981,460,119 shares. The Company has reported this buyback to Bapepam-LK in its letter No. 005/LK-COS/I/2012 dated January 13, 2012.
The repurchased of the outstanding ordinary shares made in 2012 totalling 209,875,000 shares, bringing the outstanding shares as of December 31, 2012 amounted to 22,771,585,119 shares. The Company has reported this buyback to Bapepam-LK in its letter No. 009/LK-COS/I/2013 dated January 15, 2013.

These consolidated financial statements are originally issued in Indonesian language
PT LIPPO KARAWACI Tbk AND SUBSIDIARIES NOTES TO THE CONSOLIDATED FINANCIAL STATEMENTS (Continued) As of March 31, 2013 (Unaudited) and December 31, 2012 (Audited) and For the 3 (three) Months Ended March 31, 2013 and 2012 (Unaudited) (Expressed In Full Rupiah, Unless Otherwise Stated)
FD/May 7, 2013 8 paraf:
1.c. The Company’s Structure The Company has ownership of more than 50%, either direct or indirectly, in the following subsidiaries:
Domicile Main Direct Indirect Year of
Business Ownership Ownership Start of March 31, 2013 December 31, 2012
Percentage Percentage Operation Rp Rp
Lippo Karawaci Finance B. V.*** Netherlands Investment, 100.00% -- 2006 -- 24,139,930,280
Trading and
Services
Theta Capital Pte. Ltd*** and Subsidiary Singapore Investment 100.00% -- -- 6,568,944,299,232 5,131,103,634,489
Theta Kemang Pte Ltd*** Singapore Trading -- 100.00% -- 6,546,297,896,385 5,142,769,728,169
Sigma Capital Pte Ltd*** and Subsidiary Singapore Investment 100.00% -- -- 1,198,498,126,272 1,167,460,989,035
Sigma Trillium Pte Ltd *** Singapore Trading -- 100.00% -- 1,224,949,490,502 1,676,835,835,980
Lippo Karawaci Corporation Pte Ltd**** and Subsidiary Singapore Investment, 100.00% -- -- 256,348,240,358 214,762,805,681
Trading
and Services
LK Reit Management Pte Ltd*** and Subsidiary Singapore Investment, -- 100.00% -- 256,348,248,174 214,762,813,588
Trading
and Services
Bowsprit Capital Corporation Ltd*** Singapore Investment, -- 80.00% 2006 256,348,240,358 214,762,805,681
Trading
and Services
Jesselton Investment Limited*** and Subsidiary Malaysia Investment, 100.00% -- -- 399,537,995,838 379,770,226,563
Trading
and Services
Peninsula Investment Limited*** and Subsidiary Malaysia Investment, -- 100.00% -- 399,538,005,557 379,770,236,233
Trading
and Services
LMIRT Management Ltd. Singapore Investment, -- 100.00% 2007 399,537,995,838 379,770,245,903
(formerly Lippo Mappletree Indonesia RTM Ltd)**** Trading
and Services
PT Primakreasi Propertindo and Subsidiary Tangerang Real Estate 100.00% -- -- 4,341,173,339,725 3,704,404,935,146
PT Mujur Sakti Graha and Subsidiary Tangerang Real Estate -- 99.83% -- 64,996,414,745 64,996,414,745
PT Surplus Multi Makmur and Subsidiary Jakarta Real Estate -- 90.00% -- 16,900,491,244 16,900,491,244
PT Arta Sarana Bandung Investment, -- 81.00% -- 42,047,153,885 42,047,153,885
Trading
and Services
PT PuriParagon Tangerang Development, -- 99.83% -- 583,842,942 583,842,942
Trading and
Services
PT Menara Tirta Indah (formerly PT PluitParagon Mall) Tangerang Development, -- 99.83% -- 154,461,948,671 89,320,414,276
Trading and
Services
PT Gempita Sinar Abadi (formerly PT BaliParagon Mall) Tangerang Development, -- 99.83% -- 20,124,545,500 20,124,545,500
Trading and
Services
PT Kuta BeachParagon and Subsidiary Tangerang Development, -- 99.83% -- 222,917,099,222 201,316,485,712
Trading and
Services
PT Graha Buana Utama and Subsidiary Tangerang Development, -- 99.83% -- 203,923,150,922 182,325,029,412
Trading and
Services
PT Berkat Langgeng Jaya and Subsidiary Tangerang Development, -- 99.83% -- 203,888,972,922 182,288,501,412
Trading and
Services
PT Pamor Paramita Utama Jakarta Development, -- 80.02% -- 193,936,961,667 171,947,073,287
Trading and
Services
PT Tatabangun Nusantara Tangerang Development, -- 99.83% -- 11,142,484,026 11,085,444,396
(formerly PT CibuburParagon Mall) Trading and
Services
PT Multiguna Selaras Maju Tangerang Development, -- 99.83% -- 4,820,382,886 4,677,686,000
(formerly PT BogorParagon Mall) Trading and
Services
PT Lintas Lautan Cemerlang Tangerang Development, -- 99.83% -- 12,613,465,178 8,223,476,390
(formerly PT ThamrinParagon Mall) Trading and
Services
PT Nilam Biru Bersinar Tangerang Development, -- 99.83% -- 5,000,000,000 5,000,000,000
(formerlyPT SurabayaParagon Mall) Trading and
Services
PT Safira Prima Utama Tangerang Development, -- 99.83% -- 10,000,000,000 10,000,000,000
(formerly PT SemarangParagon Mall) Trading and
Services
PT Kalimaya Pundi Bumi Tangerang Development, -- 99.83% -- 10,001,281,000 10,001,281,000
(formerly PT LampungParagon Mall) Trading and
Services
PT Gloria Mulia (formerly PT Pontianakparagon Mall) Tangerang Development, -- 99.83% -- 5,001,281,000 5,001,281,000
Trading and
Services
PT Graha Solusi Mandiri and Subsidiary Jakarta Services -- 99.83% -- 120,422,277,736 128,464,109,878
PT Wijaya Wisesa Propertindo Jakarta Development -- 99.83% -- 126,269,155 126,269,155
and Services
Subsidiary Total Assets

These consolidated financial statements are originally issued in Indonesian language
PT LIPPO KARAWACI Tbk AND SUBSIDIARIES NOTES TO THE CONSOLIDATED FINANCIAL STATEMENTS (Continued) As of March 31, 2013 (Unaudited) and December 31, 2012 (Audited) and For the 3 (three) Months Ended March 31, 2013 and 2012 (Unaudited) (Expressed In Full Rupiah, Unless Otherwise Stated)
FD/May 7, 2013 9 paraf:
Domicile Main Direct Indirect Year of
Business Ownership Ownership Start of March 31, 2013 December 31, 2012
Percentage Percentage Operation Rp Rp
PT Kharisma Ekacipta Persada Tangerang Development, -- 99.83% -- 593,000,000 593,000,000
Trading and
Services
PT Cipta Mahakarya Gemilang Tangerang Development, -- 99.83% -- 600,000,000 600,000,000
Trading and
Services
PT Mandiri Cipta Gemilang and Subsidiaries Jakarta Real Estate -- 99.83% 2003 2,367,297,532,789 2,183,814,781,088
PT Titian Semesta Raya Tangerang Development, -- 99.83% -- 2,171,113,849 2,167,709,689
(formerly PT PejatenParagon Mall) Trading and
Services
PT Adijaya Pratama Mandiri Jakarta Development, -- 99.83% -- 1,000,000,000 1,000,000,000
Trading and
Services
PT Esatama Lestari Jaya Tangerang Development, -- 100.00% -- 100,000,000 100,000,000
Trading ,
Printing and
Services
PT Gumarang Karya Sejati Tangerang Development, -- 100.00% -- 100,000,000 100,000,000
Trading ,
Printing and
Services
PT Bahtera Perkasa Makmur Tangerang Development, -- 100.00% -- 100,000,000 100,000,000
Trading ,
Printing and
Services
PT Danisa Indah Cipta Tangerang Trading, -- 100.00% -- 100,000,000 100,000,000
Industry,
Printing and
Services
PT Fajarindo Sinar Sakti Tangerang Trading, -- 100.00% -- 100,000,000 100,000,000
Industry,
Printing and
Services
PT Gading Makmur Jaya Tangerang Development, -- 100.00% -- 100,000,000 100,000,000
Trading ,
Printing and
Services
PT Bimasakti Jaya Mandiri Tangerang Development, -- 100.00% 2011 116,290,875,813 58,642,282,909
Trading ,
Printing and
Services
PT Surya Megah Lestari Tangerang Development, -- 100.00% -- 1,000,000,000 1,000,000,000
Trading ,
Printing,
Land
Transport,
Industry,
Agriculture and
Services
PT Gunung Halimun Elok and Subsidiaries Tangerang Development, -- 100.00% -- 100,000,000 100,000,000
Trading and
Services
PT Koridor Usaha Maju Tangerang Development, -- 100.00% -- 100,000,000 100,000,000
Trading,
Printing and
Services
PT Multi Panen Utama Tangerang Development, -- 100.00% -- 100,000,000 100,000,000
Trading,
Printing and
Services
PT Jaya Makmur Bersama Jakarta Development, -- 100.00% -- 4,067,376,191 4,067,376,191
Trading and
Services
PT Grand Villa Persada Tangerang Real Estate -- 99.83% -- 570,649,250 570,649,250
PT Mega Proyek Pertiwi Tangerang Real Estate -- 99.83% -- 15,069,141,657 15,069,141,657
PT Sinar Surya Timur Tangerang Development, -- 100.00% -- 600,000,000 600,000,000
Trading and
Services
PT Manunggal Utama Makmur Tangerang Development, -- 100.00% -- 597,750,000 597,750,000
Trading and
Services
PT Gempita Cipta Bersama Tangerang Development, -- 100.00% -- 593,568,750 593,568,750
Trading and
Services
PT Suryamas Khatulistiwa Tangerang Development, -- 100.00% -- 588,868,750 588,868,750
Trading and
Services
PT Lautan Sinar Abadi and Subsidiaries Tangerang Development, -- 100.00% -- 100,000,000 100,000,000
Trading and
Services
Subsidiary Total Assets
These consolidated financial statements are originally issued in Indonesian language
PT LIPPO KARAWACI Tbk AND SUBSIDIARIES NOTES TO THE CONSOLIDATED FINANCIAL STATEMENTS (Continued) As of March 31, 2013 (Unaudited) and December 31, 2012 (Audited) and For the 3 (three) Months Ended March 31, 2013 and 2012 (Unaudited) (Expressed In Full Rupiah, Unless Otherwise Stated)
FD/May 7, 2013 10 paraf:
Domicile Main Direct Indirect Year of
Business Ownership Ownership Start of March 31, 2013 December 31, 2012
Percentage Percentage Operation Rp Rp
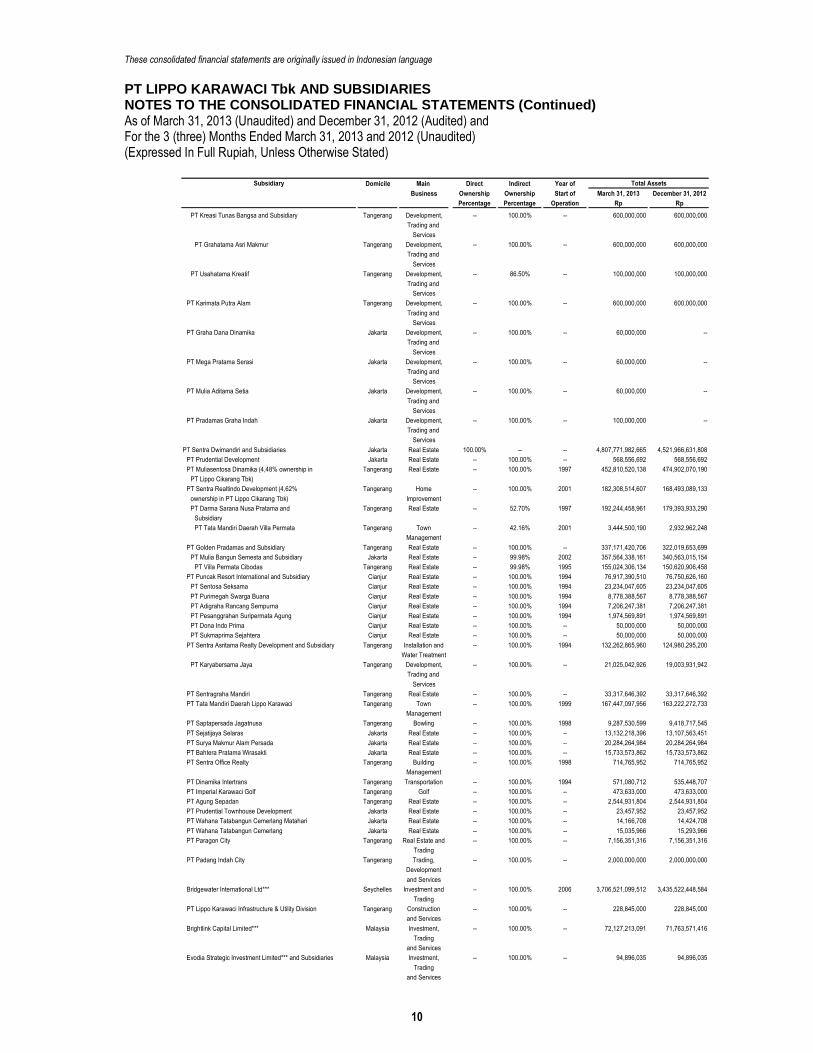
PT Kreasi Tunas Bangsa and Subsidiary Tangerang Development, -- 100.00% -- 600,000,000 600,000,000
Trading and
Services
PT Grahatama Asri Makmur Tangerang Development, -- 100.00% -- 600,000,000 600,000,000
Trading and
Services
PT Usahatama Kreatif Tangerang Development, -- 86.50% -- 100,000,000 100,000,000
Trading and
Services
PT Karimata Putra Alam Tangerang Development, -- 100.00% -- 600,000,000 600,000,000
Trading and
Services
PT Graha Dana Dinamika Jakarta Development, -- 100.00% -- 60,000,000 --
Trading and
Services
PT Mega Pratama Serasi Jakarta Development, -- 100.00% -- 60,000,000 --
Trading and
Services
PT Mulia Aditama Setia Jakarta Development, -- 100.00% -- 60,000,000 --
Trading and
Services
PT Pradamas Graha Indah Jakarta Development, -- 100.00% -- 100,000,000 --
Trading and
Services
PT Sentra Dwimandiri and Subsidiaries Jakarta Real Estate 100.00% -- -- 4,807,771,982,665 4,521,966,631,808
PT Prudential Development Jakarta Real Estate -- 100.00% -- 568,556,692 568,556,692
PT Muliasentosa Dinamika (4,48% ownership in Tangerang Real Estate -- 100.00% 1997 452,810,520,138 474,902,070,190
PT Lippo Cikarang Tbk)
PT Sentra Realtindo Development (4,62% Tangerang Home -- 100.00% 2001 182,308,514,607 168,493,089,133
ownership in PT Lippo Cikarang Tbk) Improvement
PT Darma Sarana Nusa Pratama and Tangerang Real Estate -- 52.70% 1997 192,244,458,961 179,393,933,290
Subsidiary
PT Tata Mandiri Daerah Villa Permata Tangerang Town -- 42.16% 2001 3,444,500,190 2,932,962,248
Management
PT Golden Pradamas and Subsidiary Tangerang Real Estate -- 100.00% -- 337,171,420,706 322,019,653,699
PT Mulia Bangun Semesta and Subsidiary Jakarta Real Estate -- 99.98% 2002 357,564,338,161 340,563,015,154
PT Villa Permata Cibodas Tangerang Real Estate -- 99.98% 1995 155,024,306,134 150,620,906,458
PT Puncak Resort International and Subsidiary Cianjur Real Estate -- 100.00% 1994 76,917,390,510 76,750,626,160
PT Sentosa Seksama Cianjur Real Estate -- 100.00% 1994 23,234,047,605 23,234,047,605
PT Purimegah Swarga Buana Cianjur Real Estate -- 100.00% 1994 8,778,388,567 8,778,388,567
PT Adigraha Rancang Sempurna Cianjur Real Estate -- 100.00% 1994 7,206,247,381 7,206,247,381
PT Pesanggrahan Suripermata Agung Cianjur Real Estate -- 100.00% 1994 1,974,569,891 1,974,569,891
PT Dona Indo Prima Cianjur Real Estate -- 100.00% -- 50,000,000 50,000,000
PT Sukmaprima Sejahtera Cianjur Real Estate -- 100.00% -- 50,000,000 50,000,000
PT Sentra Asritama Realty Development and Subsidiary Tangerang Installation and -- 100.00% 1994 132,262,865,960 124,980,295,200
Water Treatment
PT Karyabersama Jaya Tangerang Development, -- 100.00% -- 21,025,042,926 19,003,931,942
Trading and
Services
PT Sentragraha Mandiri Tangerang Real Estate -- 100.00% -- 33,317,646,392 33,317,646,392
PT Tata Mandiri Daerah Lippo Karawaci Tangerang Town -- 100.00% 1999 167,447,097,956 163,222,272,733
Management
PT Saptapersada Jagatnusa Tangerang Bowling -- 100.00% 1998 9,287,530,599 9,418,717,545
PT Sejatijaya Selaras Jakarta Real Estate -- 100.00% -- 13,132,218,396 13,107,563,451
PT Surya Makmur Alam Persada Jakarta Real Estate -- 100.00% -- 20,284,264,984 20,284,264,984
PT Bahtera Pratama Wirasakti Jakarta Real Estate -- 100.00% -- 15,733,573,862 15,733,573,862
PT Sentra Office Realty Tangerang Building -- 100.00% 1998 714,765,952 714,765,952
Management
PT Dinamika Intertrans Tangerang Transportation -- 100.00% 1994 571,080,712 535,448,707
PT Imperial Karawaci Golf Tangerang Golf -- 100.00% -- 473,633,000 473,633,000
PT Agung Sepadan Tangerang Real Estate -- 100.00% -- 2,544,931,804 2,544,931,804
PT Prudential Townhouse Development Jakarta Real Estate -- 100.00% -- 23,457,952 23,457,952
PT Wahana Tatabangun Cemerlang Matahari Jakarta Real Estate -- 100.00% -- 14,166,708 14,424,708
PT Wahana Tatabangun Cemerlang Jakarta Real Estate -- 100.00% -- 15,035,966 15,293,966
PT Paragon City Tangerang Real Estate and -- 100.00% -- 7,156,351,316 7,156,351,316
Trading
PT Padang Indah City Tangerang Trading, -- 100.00% -- 2,000,000,000 2,000,000,000
Development
and Services
Bridgewater International Ltd*** Seychelles Investment and -- 100.00% 2006 3,706,521,099,512 3,435,522,448,584
Trading
PT Lippo Karawaci Infrastructure & Utility Division Tangerang Construction -- 100.00% -- 228,845,000 228,845,000
and Services
Brightlink Capital Limited*** Malaysia Investment, -- 100.00% -- 72,127,213,091 71,763,571,416
Trading
and Services
Evodia Strategic Investment Limited*** and Subsidiaries Malaysia Investment, -- 100.00% -- 94,896,035 94,896,035
Trading
and Services
Subsidiary Total Assets

These consolidated financial statements are originally issued in Indonesian language
PT LIPPO KARAWACI Tbk AND SUBSIDIARIES NOTES TO THE CONSOLIDATED FINANCIAL STATEMENTS (Continued) As of March 31, 2013 (Unaudited) and December 31, 2012 (Audited) and For the 3 (three) Months Ended March 31, 2013 and 2012 (Unaudited) (Expressed In Full Rupiah, Unless Otherwise Stated)
FD/May 7, 2013 11 paraf:
Domicile Main Direct Indirect Year of
Business Ownership Ownership Start of March 31, 2013 December 31, 2012
Percentage Percentage Operation Rp Rp
Great Capital Pte Ltd*** and Subsidiary Singapore Investment, -- 100.00% -- 46,903,816 47,449,907
Trading
and Services
Key Capital Pte Ltd*** Singapore Investment, -- 100.00% -- 23,455,816 23,728,907
Trading
and Services
Globalink Investments Pte Ltd*** and Subsidiary Singapore Investment, -- 100.00% -- 46,903,816 47,449,907
Trading
and Services
Fortuna Capital Pte Ltd*** Singapore Investment, -- 100.00% -- 23,455,816 23,728,907
Trading
and Services
PT St Moritz Management Jakarta Development, -- 100.00% -- 2,245,758,415 1,540,629,016
Trading
and Services
PT Kemang Village Management (formerly PT Pesona Indah Jakarta Hotel -- 80.00% -- 20,944,687,303 19,265,156,516
Lestari)
PT Wisma Jatim Propertindo and Subsidiaries Jakarta Services 100.00% -- -- 5,180,186,995,614 4,684,268,847,508
PT Maharama Sakti Jakarta Trading -- 100.00% -- 111,240,000 111,240,000
PT KemangParagon Mall and Subsidiary Tangerang Development, -- 100.00% -- 1,745,739,935,420 1,628,485,997,429
Trading
and Services
PT Wahana Usaha Makmur and Subsidiaries Jakarta Real Estate -- 92.00% -- 1,791,163,043,797 1,622,389,802,318
PT Almaron Perkasa and Subsidiaries Jakarta Real Estate -- 92.00% 2005 2,297,013,366,643 2,244,733,704,769
PT Gelora Raya Semesta Tangerang Trading -- 92.00% -- 98,565,272,599 70,173,024,867
and
Development
PT Prima Aman Sarana Jakarta Services -- 92.00% -- 122,955,935,527 113,391,661,791
PT Kemang Multi Sarana Jakarta Real Estate and -- 92.00% -- 65,988,306,420 65,982,074,527
Urban
Development
PT Lipposindo Abadi and Subsidiary Jakarta Trading -- 100.00% -- 238,256,372,288 238,257,418,801
PT Kemuning Satiatama and Subsidiary Jakarta Trading -- 100.00% -- 233,340,556,470 233,341,516,983
(42,20% ownership in PT Lippo Cikarang Tbk)
PT Megachandra Karyalestari Jakarta Trading -- 100.00% 1992* 284,951,564 284,918,077
PT Prudential Apartment Development Jakarta Services -- 100.00% 1993* 578,044,194 578,302,194
PT Sentra Kharisma Indah Jakarta Services -- 80.00% -- 2,179,719,119 2,180,455,119
PT Carakatama Dirgantara and Subsidiary Jakarta Trading -- 100.00% -- 71,419,647,898 71,642,502,438
PT Prudential Hotel Development Tangerang Trading -- 100.00% 1994* 71,396,166,395 71,618,740,201
and Services
PT Ariasindo Sejati and Subsidiary Jakarta Trading -- 95.00% -- 209,643,123,211 210,465,190,780
and Services
PT Unitech Prima Indah and Subsidiary Jakarta Real Estate -- 94.68% 2004 192,885,673,552 192,878,159,877
PT Karya Cipta Pesona Medan Accommodation -- 100.00% -- 93,185,067,214 93,972,831,145
Services
Services
PT Metropolitan Leisure Corporation and Subsidiary Jakarta Trading -- 100.00% -- 78,840,802,937 82,355,966,437
and Services
PT Kurniasindo Sejahtera Jakarta Trading -- 100.00% -- 1,350,812,648 1,351,279,831
and Services
PT Graha Tata Cemerlang Makasar (0,34% Makassar Real Estate -- 100.00% 2002 72,741,608,666 76,259,524,463
ownership in PT Lippo Cikarang Tbk)
PT Guna Tata Carakatama Makassar Trading -- 100.00% 2002 147,400,091 147,508,091
and Services
PT Lippo Land Cahaya Indonesia Jakarta Services -- 100.00% 2003 6,143,797,953 6,139,563,019
PT Karunia Persada Raya (formerly PT Lipposindo) Jakarta Trading -- 100.00% -- 134,387,023,484 133,336,957,340
and Subsidiary
PT Pendopo Niaga Jakarta Real Estate -- 100.00% -- 248,942,410,251 133,336,957,340
PT Larasati Anugerah Jakarta Trading -- 100.00% -- 22,826,420 23,084,420
PT Bathara Brahma Sakti Tangerang Trading -- 100.00% 1992* 2,453,255,055 2,453,496,805
and Services
PT Realty Limaribu Jakarta Services -- 100.00% 1998* 356,949,954 357,178,014
PT Dwisindo Jaya Jakarta Trading -- 100.00% -- 77,933,966 78,165,768
PT Karunia Alam Damai (formerly PT Lippo Vacation) Jakarta Trading -- 100.00% -- 248,942,410,251 240,726,750,898
and Subsidiary
PT Jagatpertala Nusantara Jakarta Real Estate -- 100.00% 2004 248,942,410,251 240,726,750,898
PT Wisma Sumut Propertindo Jakarta Services -- 100.00% -- -- --
PT Mulia Mukti Persada Perkasa Jakarta Trading -- 100.00% -- 3,127,000 3,385,000
PT Kemang Village and Subsidiary Jakarta Trading -- 100.00% -- 140,107,345,339 138,541,987,393
PT Adhi Utama Dinamika Jakarta Real Estate -- 92.00% -- 72,422,130,998 72,418,405,997
PT Menara Bhumimegah and Subsidiary Jakarta Services -- 100.00% 2005 140,022,230,687 138,456,658,436
PT Jaya Usaha Prima and Subsidiary Jakarta Real Estate -- 80.00% -- 79,348,320,299 72,356,029,946
PT Persada Mandiri Abadi Jakarta Real Estate -- 80.00% 2005 79,345,349,149 77,784,100,616
PT Menara Perkasa Megah and Subsidiary Jakarta Real Estate and -- 100.00% 2005 396,683,150,600 393,886,262,687
Urban
Development
PT Pelangi Cahaya Intan Makmur and Subsidiary Sidoarjo Trading -- 85.00% -- 403,708,720,829 396,523,461,581
PT Surya Mitra Jaya and Subsidiary Sidoarjo Trading -- 85.01% 2005 404,015,457,266 399,441,490,323
and Services
Subsidiary Total Assets

These consolidated financial statements are originally issued in Indonesian language
PT LIPPO KARAWACI Tbk AND SUBSIDIARIES NOTES TO THE CONSOLIDATED FINANCIAL STATEMENTS (Continued) As of March 31, 2013 (Unaudited) and December 31, 2012 (Audited) and For the 3 (three) Months Ended March 31, 2013 and 2012 (Unaudited) (Expressed In Full Rupiah, Unless Otherwise Stated)
FD/May 7, 2013 12 paraf:
Domicile Main Direct Indirect Year of
Business Ownership Ownership Start of March 31, 2013 December 31, 2012
Percentage Percentage Operation Rp Rp
PT Citra Harapan Baru Surabaya Accommodation -- 99.99% -- 2,000,000,000 2,000,000,000
Services
PT Niaga Utama Jakarta Trading -- 100.00% -- 107,145,418 107,403,418
PT Mitra Kasih Karunia Jakarta Real Estate -- 100.00% -- 1,887,217,700 1,887,217,700
PT Kreasi Megatama Gemilang and Subsidiary Tangerang Development, -- 100.00% -- 442,444,372,610 3,571,949,585
Agribusiness,
Industry,
Agribusiness,
Transportation,
Trading and
Services
PT Lippo Malls Indonesia (formerly PT Consulting & Tangerang Services -- 100.00% -- 443,107,961,402 411,088,856,968
Management Service Division) and Subsidiary
PT Kreasi Gemilang Perkasa Tangerang Development, -- 99.83% -- 3,858,109,490 3,571,949,585
(formerly PT BatamParagon Mall) Trading and
Services
PT Kilau Intan Murni and Subsidiary Tangerang Development, -- 100.00% -- 300,042,529,732 300,042,529,732
Trading and
Services
PT Mulia Citra Abadi Jakarta Development, -- 100.00% 2012 186,406,006,422 186,406,006,422
Trading,
Printing,
Logistic
Services,
Industry,
Agriculture and
Services
PT Arwana Kreasi Gemilang Tangerang Development, -- 100.00% -- 600,000,000 600,000,000
Trading and
Services
PT Gayana Sumber Cipta Tangerang Development, -- 100.00% -- 600,000,000 600,000,000
Trading and
Services
PT Harapan Insan Mandiri Tangerang Development, -- 100.00% -- 600,000,000 600,000,000
Trading and
Services
PT Semboja Indah Cipta Tangerang Development, -- 100.00% -- 600,000,000 600,000,000
Trading and
Services
PT Putera Abadi Karya Tangerang Development, -- 100.00% -- 600,000,000 600,000,000
Trading and
Services
PT Violet Pelangi Indah Tangerang Development, -- 100.00% -- 600,000,000 600,000,000
Trading and
Services
PT Buana Mediatama Tangerang Development, -- 100.00% -- 600,000,000 600,000,000
Trading and
Services
PT Nusaindah Bukit Permai Tangerang Development, -- 100.00% -- 600,000,000 600,000,000
Trading and
Services
PT Lembayung Karya Nirwana Tangerang Development, -- 100.00% -- 600,000,000 600,000,000
Trading and
Services
PT Inspira Ide Cemerlang Tangerang Development, -- 100.00% -- 600,000,000 600,000,000
Trading and
Services
PT Irama Karya Megah Tangerang Development, -- 100.00% -- 600,000,000 600,000,000
Trading and
Services
PT Gaharu Alam Permai Tangerang Development, -- 100.00% -- 600,000,000 600,000,000
Trading and
Services
PT Saputra Karya Jakarta Real Estate and -- 100.00% -- 72,699,859,055 71,650,289,846
Urban
Development
PT Grand Provita and Subsidiary Tangerang Real Estate -- 100.00% -- 473,756,900 473,756,900
PT Grand Prima Propertindo Tangerang Real Estate -- 65.00% -- 7,948,100 7,948,100
PT Pacific Sejahtera Tangerang Real Estate -- 100.00% -- 16,667,400 17,317,400
PT Satriamandiri Idola Utama Jakarta Real Estate -- 100.00% -- 43,733,699,135 36,233,768,493
PT Mahakaya Abadi Jakarta Real Estate -- 100.00% -- 479,923,100 479,923,100
PT Persada Mandiri Dunia Niaga and Subsidiary Jakarta Real Estate -- 100.00% -- 88,311,553,716 88,314,702,476
PT Ekaputra Kencana Abadi Jakarta Real Estate -- 100.00% -- 4,950,000,000 4,950,000,000
PT Gapura Sakti Prima and Subsidiary Jakarta Real Estate -- 100.00% -- 200,575,909,084 200,575,909,084
PT Menara Megah Tunggal and Subsidiary Jakarta Real Estate -- 100.00% -- 194,259,065,395 194,259,065,395
PT Trias Mitra Investama Jakarta Real Estate -- 100.00% -- 207,246,171,955 207,246,171,955
PT Permata Agung Propertindo Jakarta Real Estate -- 100.00% -- 522,480,130 522,480,130
PT Kencana Mitra Lestari Jakarta Development, -- 100.00% -- 577,800,000 577,800,000
Transportation,
Trading
and Services
Subsidiary Total Assets
These consolidated financial statements are originally issued in Indonesian language
PT LIPPO KARAWACI Tbk AND SUBSIDIARIES NOTES TO THE CONSOLIDATED FINANCIAL STATEMENTS (Continued) As of March 31, 2013 (Unaudited) and December 31, 2012 (Audited) and For the 3 (three) Months Ended March 31, 2013 and 2012 (Unaudited) (Expressed In Full Rupiah, Unless Otherwise Stated)
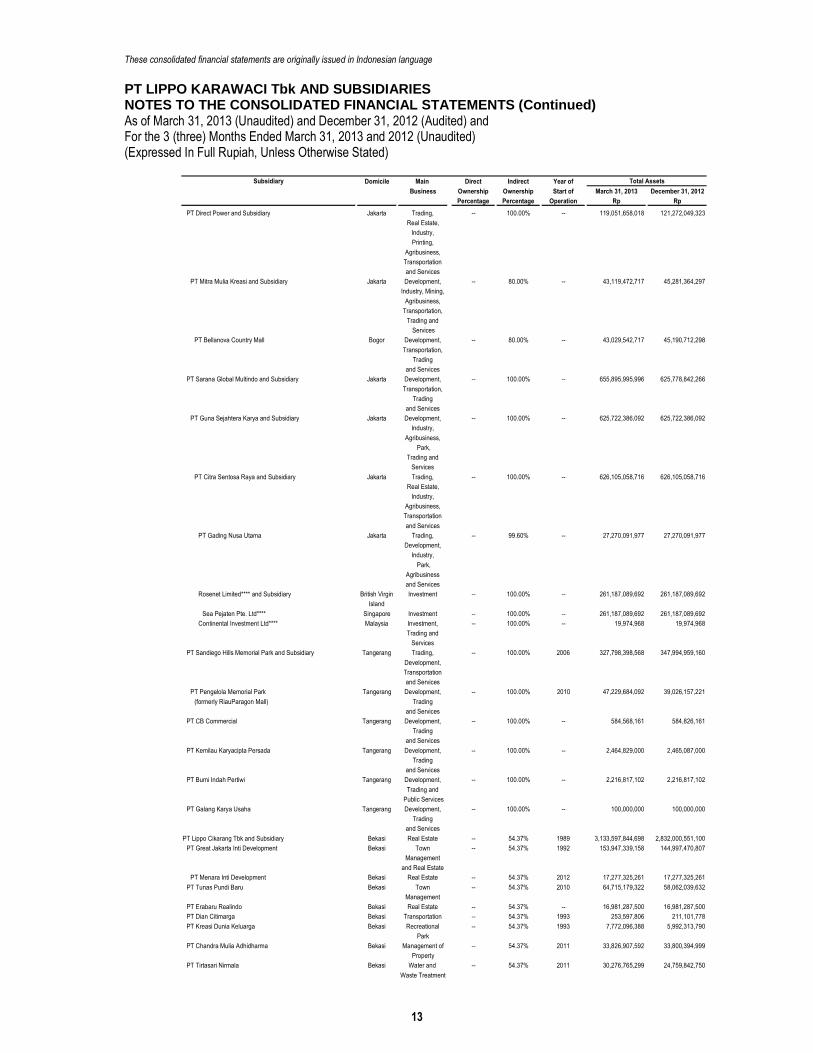
FD/May 7, 2013 13 paraf:
Domicile Main Direct Indirect Year of
Business Ownership Ownership Start of March 31, 2013 December 31, 2012
Percentage Percentage Operation Rp Rp
PT Direct Power and Subsidiary Jakarta Trading, -- 100.00% -- 119,051,658,018 121,272,049,323
Real Estate,
Industry,
Printing,
Agribusiness,
Transportation
and Services
PT Mitra Mulia Kreasi and Subsidiary Jakarta Development, -- 80.00% -- 43,119,472,717 45,281,364,297
Industry, Mining,
Agribusiness,
Transportation,
Trading and
Services
PT Bellanova Country Mall Bogor Development, -- 80.00% -- 43,029,542,717 45,190,712,298
Transportation,
Trading
and Services
PT Sarana Global Multindo and Subsidiary Jakarta Development, -- 100.00% -- 655,895,995,996 625,778,842,266
Transportation,
Trading
and Services
PT Guna Sejahtera Karya and Subsidiary Jakarta Development, -- 100.00% -- 625,722,386,092 625,722,386,092
Industry,
Agribusiness,
Park,
Trading and
Services
PT Citra Sentosa Raya and Subsidiary Jakarta Trading, -- 100.00% -- 626,105,058,716 626,105,058,716
Real Estate,
Industry,
Agribusiness,
Transportation
and Services
PT Gading Nusa Utama Jakarta Trading, -- 99.60% -- 27,270,091,977 27,270,091,977
Development,
Industry,
Park,
Agribusiness
and Services
Rosenet Limited**** and Subsidiary British Virgin Investment -- 100.00% -- 261,187,089,692 261,187,089,692
Island
Sea Pejaten Pte. Ltd**** Singapore Investment -- 100.00% -- 261,187,089,692 261,187,089,692
Continental Investment Ltd**** Malaysia Investment, -- 100.00% -- 19,974,968 19,974,968
Trading and
Services
PT Sandiego Hills Memorial Park and Subsidiary Tangerang Trading, -- 100.00% 2006 327,798,398,568 347,994,959,160
Development,
Transportation
and Services
PT Pengelola Memorial Park Tangerang Development, -- 100.00% 2010 47,229,684,092 39,026,157,221
(formerly RiauParagon Mall) Trading
and Services
PT CB Commercial Tangerang Development, -- 100.00% -- 584,568,161 584,826,161
Trading
and Services
PT Kemilau Karyacipta Persada Tangerang Development, -- 100.00% -- 2,464,829,000 2,465,087,000
Trading
and Services
PT Bumi Indah Pertiwi Tangerang Development, -- 100.00% -- 2,216,817,102 2,216,817,102
Trading and
Public Services
PT Galang Karya Usaha Tangerang Development, -- 100.00% -- 100,000,000 100,000,000
Trading
and Services
PT Lippo Cikarang Tbk and Subsidiary Bekasi Real Estate -- 54.37% 1989 3,133,597,844,698 2,832,000,551,100
PT Great Jakarta Inti Development Bekasi Town -- 54.37% 1992 153,947,339,158 144,997,470,807
Management
and Real Estate
PT Menara Inti Development Bekasi Real Estate -- 54.37% 2012 17,277,325,261 17,277,325,261
PT Tunas Pundi Baru Bekasi Town -- 54.37% 2010 64,715,179,322 58,062,039,632
Management
PT Erabaru Realindo Bekasi Real Estate -- 54.37% -- 16,981,287,500 16,981,287,500
PT Dian Citimarga Bekasi Transportation -- 54.37% 1993 253,597,806 211,101,778
PT Kreasi Dunia Keluarga Bekasi Recreational -- 54.37% 1993 7,772,096,388 5,992,313,790
Park
PT Chandra Mulia Adhidharma Bekasi Management of -- 54.37% 2011 33,826,907,592 33,800,394,999
Property
PT Tirtasari Nirmala Bekasi Water and -- 54.37% 2011 30,276,765,299 24,759,842,750
Waste Treatment
Subsidiary Total Assets
These consolidated financial statements are originally issued in Indonesian language
PT LIPPO KARAWACI Tbk AND SUBSIDIARIES NOTES TO THE CONSOLIDATED FINANCIAL STATEMENTS (Continued) As of March 31, 2013 (Unaudited) and December 31, 2012 (Audited) and For the 3 (three) Months Ended March 31, 2013 and 2012 (Unaudited) (Expressed In Full Rupiah, Unless Otherwise Stated)
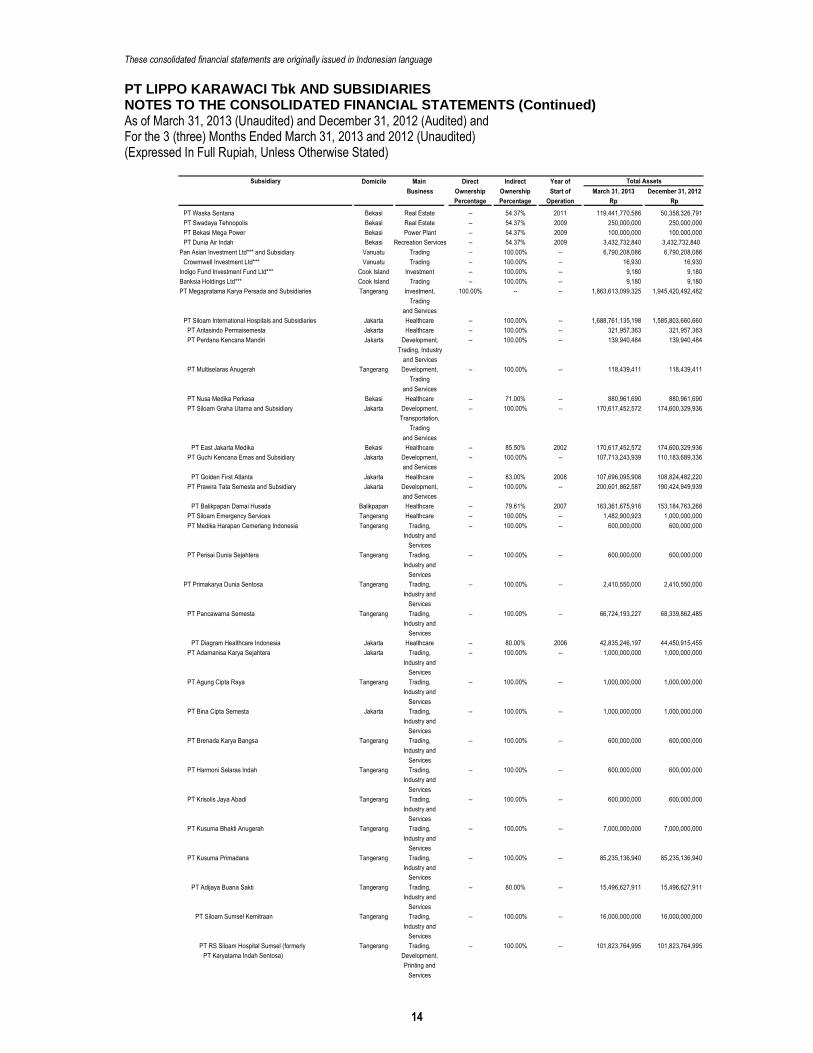
FD/May 7, 2013 14 paraf:
Domicile Main Direct Indirect Year of
Business Ownership Ownership Start of March 31, 2013 December 31, 2012
Percentage Percentage Operation Rp Rp
PT Waska Sentana Bekasi Real Estate -- 54.37% 2011 119,441,770,586 50,358,326,791
PT Swadaya Tehnopolis Bekasi Real Estate -- 54.37% 2009 250,000,000 250,000,000
PT Bekasi Mega Power Bekasi Power Plant -- 54.37% 2009 100,000,000 100,000,000
PT Dunia Air Indah Bekasi Recreation Services -- 54.37% 2009 3,432,732,840 3,432,732,840
Pan Asian Investment Ltd*** and Subsidiary Vanuatu Trading -- 100.00% -- 6,790,208,086 6,790,208,086
Crowmwell Investment Ltd*** Vanuatu Trading -- 100.00% -- 16,930 16,930
Indigo Fund Investment Fund Ltd*** Cook Island Investment -- 100.00% -- 9,180 9,180
Banksia Holdings Ltd*** Cook Island Trading -- 100.00% -- 9,180 9,180
PT Megapratama Karya Persada and Subsidiaries Tangerang Investment, 100.00% -- -- 1,863,613,099,325 1,945,420,492,482
Trading
and Services
PT Siloam International Hospitals and Subsidiaries Jakarta Healthcare -- 100.00% -- 1,688,761,135,198 1,585,803,660,660
PT Aritasindo Permaisemesta Jakarta Healthcare -- 100.00% -- 321,957,363 321,957,363
PT Perdana Kencana Mandiri Jakarta Development, -- 100.00% -- 139,940,484 139,940,484
Trading, Industry
and Services
PT Multiselaras Anugerah Tangerang Development, -- 100.00% -- 118,439,411 118,439,411
Trading
and Services
PT Nusa Medika Perkasa Bekasi Healthcare -- 71.00% -- 880,961,690 880,961,690
PT Siloam Graha Utama and Subsidiary Jakarta Development, -- 100.00% -- 170,617,452,572 174,600,329,936
Transportation,
Trading
and Services
PT East Jakarta Medika Bekasi Healthcare -- 85.50% 2002 170,617,452,572 174,600,329,936
PT Guchi Kencana Emas and Subsidiary Jakarta Development, -- 100.00% -- 107,713,243,939 110,183,689,336
and Services
PT Golden First Atlanta Jakarta Healthcare -- 83.00% 2008 107,696,095,908 108,824,482,220
PT Prawira Tata Semesta and Subsidiary Jakarta Development, -- 100.00% -- 200,601,862,587 190,424,949,939
and Services
PT Balikpapan Damai Husada Balikpapan Healthcare -- 79.61% 2007 163,361,675,916 153,184,763,268
PT Siloam Emergency Services Tangerang Healthcare -- 100.00% -- 1,482,900,923 1,000,000,000
PT Medika Harapan Cemerlang Indonesia Tangerang Trading, -- 100.00% -- 600,000,000 600,000,000
Industry and
Services
PT Perisai Dunia Sejahtera Tangerang Trading, -- 100.00% -- 600,000,000 600,000,000
Industry and
Services
PT Primakarya Dunia Sentosa Tangerang Trading, -- 100.00% -- 2,410,550,000 2,410,550,000
Industry and
Services
PT Pancawarna Semesta Tangerang Trading, -- 100.00% -- 66,724,193,227 68,339,862,485
Industry and
Services
PT Diagram Healthcare Indonesia Jakarta Healthcare -- 80.00% 2006 42,835,246,197 44,450,915,455
PT Adamanisa Karya Sejahtera Jakarta Trading, -- 100.00% -- 1,000,000,000 1,000,000,000
Industry and
Services
PT Agung Cipta Raya Tangerang Trading, -- 100.00% -- 1,000,000,000 1,000,000,000
Industry and
Services
PT Bina Cipta Semesta Jakarta Trading, -- 100.00% -- 1,000,000,000 1,000,000,000
Industry and
Services
PT Brenada Karya Bangsa Tangerang Trading, -- 100.00% -- 600,000,000 600,000,000
Industry and
Services
PT Harmoni Selaras Indah Tangerang Trading, -- 100.00% -- 600,000,000 600,000,000
Industry and
Services
PT Krisolis Jaya Abadi Tangerang Trading, -- 100.00% -- 600,000,000 600,000,000
Industry and
Services
PT Kusuma Bhakti Anugerah Tangerang Trading, -- 100.00% -- 7,000,000,000 7,000,000,000
Industry and
Services
PT Kusuma Primadana Tangerang Trading, -- 100.00% -- 85,235,136,940 85,235,136,940
Industry and
Services
PT Adijaya Buana Sakti Tangerang Trading, -- 80.00% -- 15,496,627,911 15,496,627,911
Industry and
Services
PT Siloam Sumsel Kemitraan Tangerang Trading, -- 100.00% -- 16,000,000,000 16,000,000,000
Industry and
Services
PT RS Siloam Hospital Sumsel (formerly Tangerang Trading, -- 100.00% -- 101,823,764,995 101,823,764,995
PT Karyatama Indah Sentosa) Development,
Printing and
Services
Subsidiary Total Assets

These consolidated financial statements are originally issued in Indonesian language
PT LIPPO KARAWACI Tbk AND SUBSIDIARIES NOTES TO THE CONSOLIDATED FINANCIAL STATEMENTS (Continued) As of March 31, 2013 (Unaudited) and December 31, 2012 (Audited) and For the 3 (three) Months Ended March 31, 2013 and 2012 (Unaudited) (Expressed In Full Rupiah, Unless Otherwise Stated)
FD/May 7, 2013 15 paraf:
Domicile Main Direct Indirect Year of
Business Ownership Ownership Start of March 31, 2013 December 31, 2012
Percentage Percentage Operation Rp Rp
PT Mega Buana Bhakti Tangerang Trading, -- 100.00% -- 6,000,000,000 6,000,000,000
Industry and
Services
PT Optimum Karya Persada Jakarta Trading, -- 100.00% -- 1,000,000,000 1,000,000,000
Industry and
Services
PT Rosela Indah Cipta Jakarta Trading, -- 100.00% -- 600,000,000 600,000,000
Industry and
Services
PT Sembada Karya Megah Jakarta Trading, -- 100.00% -- 600,000,000 600,000,000
Industry and
Services
PT Taruna Perkasa Megah Jakarta Trading, -- 100.00% -- 600,000,000 600,000,000
Industry and
Services
PT Tataka Bumi Karya Tangerang Trading, -- 100.00% -- 600,000,000 600,000,000
Industry and
Services
PT Tataka Karya Indah Tangerang Trading, -- 100.00% -- 600,000,000 600,000,000
Industry and
Services
PT Trijaya Makmur Bersama Tangerang Trading, -- 100.00% -- 600,000,000 600,000,000
Industry and
Services
PT Visindo Galaxi Jaya Tangerang Trading, -- 100.00% -- 5,000,000,000 5,000,000,000
Industry and
Services
PT Tirtasari Kencana Tangerang Development, -- 99.83% -- 568,796,441 568,796,441
(formerly PT MedanParagon Mall) Trading and
Services
PT Eramulia Pratamajaya and Subsidiaries Jakarta Healthcare 99.99% 0.01% -- 382,300,868,294 361,262,088,745
PT Siloam Karya Sejahtera Jakarta Trading and -- 100.00% -- 110,359,406,540 106,351,287,064
Services
PT Siloam Dinamika Perkasa Jakarta Trading, -- 100.00% -- 35,747,429,897 35,204,745,782
Development,
Transportation
and Services
PT Siloam Sarana Karya Jakarta Healthcare -- 100.00% 2005 3,239,776,633 3,239,776,633
PT Siloam Tata Prima Surabaya Development, -- 100.00% -- 3,241,796,040 4,635,197,087
Transportation,
Trading and
Services
PT Mahaduta Purnama Jakarta Development, -- 100.00% -- 7,396,814,370 7,396,814,370
Transportation,
Trading and
Services
PT Buana Mandiri Selaras Jakarta Development -- 100.00% -- 197,306,563,061 179,408,758,287
and Services
PT Serasi Adikarsa Jakarta Healthcare 0.01% 99.99% -- 19,805,000 19,805,000
PT Kalanusa Intan Cemerlang and Subsidiary Tangerang Trading, 100.00% -- 100,000,000 100,000,000
Development,
Printing and
Services
PT Garuda Asa Kencana Tangerang Development, 100.00% -- 100,000,000 100,000,000
Trading and
Services
PT Abadi Jaya Sakti and Subsidiary Tangerang Investment, 100.00% -- -- 577,031,300 577,031,300
Trading and
Services
PT Tigamitra Ekamulia and Subsidiary Jakarta General 0.01% 99.99% 1998* 865,920 984,420
PT Shimatama Graha Jakarta Restaurant, Bar, -- 100.00% 1989 5,830,543,150 5,907,311,936
Catering, Etc
PT Aryaduta International Management and Jakarta Hotel -- 100.00% 1998 10,601,262,779 11,094,632,111
Subsidiary Management
PT Aryaduta Surabaya Management Surabaya Services -- 100.00% -- 589,476,072 589,587,563
PT Aryaduta Medan Management Medan Services -- 100.00% -- 589,267,000 589,385,500
PT Aryaduta Karawaci Management Tangerang Services -- 100.00% -- 582,248,000 582,248,000
PT Aryaduta Makassar Management Makassar Services -- 100.00% -- 593,998,000 594,116,500
PT Aryaduta Residences Jakarta Services -- 100.00% -- 2,861,393,564 2,702,832,803
PT Aryaduta Hotels & Resorts Jakarta Services -- 100.00% -- 582,129,500 582,248,000
PT Zodia Karya Indah Jakarta Services -- 100.00% -- 400,000,000 --
PT Graha Jaya Pratama and Subsidiary Tangerang Real Estate 100.00% -- 1,002,208,510,035 971,388,173,838
PT Tataguna Cemerlang Jakarta Trading, -- 100.00% -- 100,000,000 100,000,000
Real Estate and
Development
PT Aresta Amanda Lestari (0,31% ownership in Jakarta Trading -- 99.99% -- 823,589,614 743,498,251
PT Gowa Makassar Tourism Development Tbk)
PT Aresta Permata Utama (3,45% ownership in Jakarta Trading -- 99.99% -- 8,961,332,100 8,080,302,415
PT Gowa Makassar Tourism Development Tbk)
Subsidiary Total Assets
These consolidated financial statements are originally issued in Indonesian language
PT LIPPO KARAWACI Tbk AND SUBSIDIARIES NOTES TO THE CONSOLIDATED FINANCIAL STATEMENTS (Continued) As of March 31, 2013 (Unaudited) and December 31, 2012 (Audited) and For the 3 (three) Months Ended March 31, 2013 and 2012 (Unaudited) (Expressed In Full Rupiah, Unless Otherwise Stated)
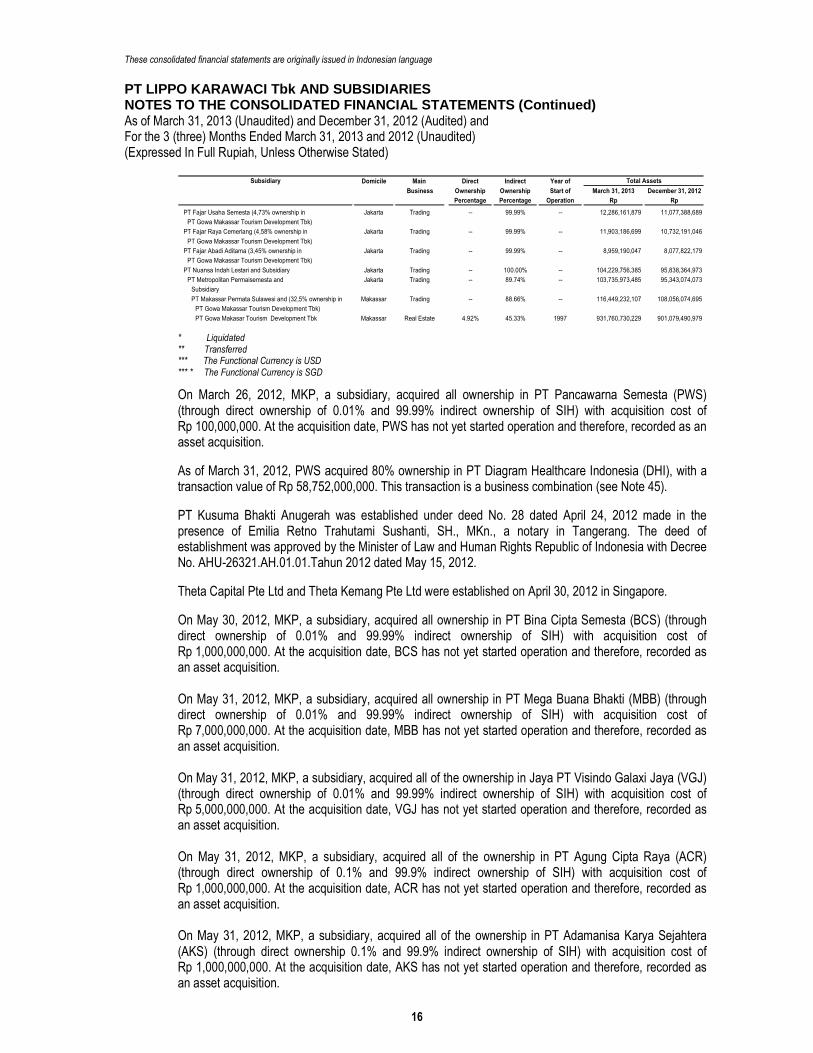
FD/May 7, 2013 16 paraf:
Domicile Main Direct Indirect Year of
Business Ownership Ownership Start of March 31, 2013 December 31, 2012
Percentage Percentage Operation Rp Rp
PT Fajar Usaha Semesta (4,73% ownership in Jakarta Trading -- 99.99% -- 12,286,161,879 11,077,388,689
PT Gowa Makassar Tourism Development Tbk)
PT Fajar Raya Cemerlang (4,58% ownership in Jakarta Trading -- 99.99% -- 11,903,186,699 10,732,191,046
PT Gowa Makassar Tourism Development Tbk)
PT Fajar Abadi Aditama (3,45% ownership in Jakarta Trading -- 99.99% -- 8,959,190,047 8,077,822,179
PT Gowa Makassar Tourism Development Tbk)
PT Nuansa Indah Lestari and Subsidiary Jakarta Trading -- 100.00% -- 104,229,756,385 95,838,364,973
PT Metropolitan Permaisemesta and Jakarta Trading -- 89.74% -- 103,735,973,485 95,343,074,073
Subsidiary
PT Makassar Permata Sulawesi and (32,5% ownership in Makassar Trading -- 88.66% -- 116,449,232,107 108,056,074,695
PT Gowa Makassar Tourism Development Tbk)
PT Gowa Makasar Tourism Development Tbk Makassar Real Estate 4.92% 45.33% 1997 931,760,730,229 901,079,490,979
Subsidiary Total Assets
* Liquidated ** Transferred *** The Functional Currency is USD *** * The Functional Currency is SGD
On March 26, 2012, MKP, a subsidiary, acquired all ownership in PT Pancawarna Semesta (PWS) (through direct ownership of 0.01% and 99.99% indirect ownership of SIH) with acquisition cost of Rp 100,000,000. At the acquisition date, PWS has not yet started operation and therefore, recorded as an asset acquisition.
As of March 31, 2012, PWS acquired 80% ownership in PT Diagram Healthcare Indonesia (DHI), with a transaction value of Rp 58,752,000,000. This transaction is a business combination (see Note 45).
PT Kusuma Bhakti Anugerah was established under deed No. 28 dated April 24, 2012 made in the presence of Emilia Retno Trahutami Sushanti, SH., MKn., a notary in Tangerang. The deed of establishment was approved by the Minister of Law and Human Rights Republic of Indonesia with Decree No. AHU-26321.AH.01.01.Tahun 2012 dated May 15, 2012.
Theta Capital Pte Ltd and Theta Kemang Pte Ltd were established on April 30, 2012 in Singapore.
On May 30, 2012, MKP, a subsidiary, acquired all ownership in PT Bina Cipta Semesta (BCS) (through direct ownership of 0.01% and 99.99% indirect ownership of SIH) with acquisition cost of Rp 1,000,000,000. At the acquisition date, BCS has not yet started operation and therefore, recorded as an asset acquisition. On May 31, 2012, MKP, a subsidiary, acquired all ownership in PT Mega Buana Bhakti (MBB) (through direct ownership of 0.01% and 99.99% indirect ownership of SIH) with acquisition cost of Rp 7,000,000,000. At the acquisition date, MBB has not yet started operation and therefore, recorded as an asset acquisition. On May 31, 2012, MKP, a subsidiary, acquired all of the ownership in Jaya PT Visindo Galaxi Jaya (VGJ) (through direct ownership of 0.01% and 99.99% indirect ownership of SIH) with acquisition cost of Rp 5,000,000,000. At the acquisition date, VGJ has not yet started operation and therefore, recorded as an asset acquisition. On May 31, 2012, MKP, a subsidiary, acquired all of the ownership in PT Agung Cipta Raya (ACR) (through direct ownership of 0.1% and 99.9% indirect ownership of SIH) with acquisition cost of Rp 1,000,000,000. At the acquisition date, ACR has not yet started operation and therefore, recorded as an asset acquisition. On May 31, 2012, MKP, a subsidiary, acquired all of the ownership in PT Adamanisa Karya Sejahtera (AKS) (through direct ownership 0.1% and 99.9% indirect ownership of SIH) with acquisition cost of Rp 1,000,000,000. At the acquisition date, AKS has not yet started operation and therefore, recorded as an asset acquisition.

These consolidated financial statements are originally issued in Indonesian language
PT LIPPO KARAWACI Tbk AND SUBSIDIARIES NOTES TO THE CONSOLIDATED FINANCIAL STATEMENTS (Continued) As of March 31, 2013 (Unaudited) and December 31, 2012 (Audited) and For the 3 (three) Months Ended March 31, 2013 and 2012 (Unaudited) (Expressed In Full Rupiah, Unless Otherwise Stated)
FD/May 7, 2013 17 paraf:
PT Krisolis Jaya Mandiri was established under deed No. 1 dated June 1, 2012 made in the presence of Sriwi Bawana Nawaksari, S.H., M.Kn., a notary in Tangerang. The deed of establishment was approved by the Minister of Law and Human Rights Republic of Indonesia with Decree No. AHU-32835.AH.01.01. Tahun 2012 dated June 15, 2012.
PT Taruna Perkasa Megah was established under deed No. 2 dated June 1, 2012 made in the presence of Sriwi Bawana Nawaksari, S.H., M.Kn., a notary in Tangerang. The deed of establishment was approved by the Minister of Law and Human Rights Republic of Indonesia with Decree No. AHU-32836.AH.01.01.Tahun 2012 dated June 15, 2012.
PT Trijaya Makmur Bersama was established under deed No. 3 dated June 1, 2012 made in the presence of Sriwi Bawana Nawaksari, S.H., M.Kn., a notary in Tangerang. The deed of establishment was approved by the Minister of Law and Human Rights Republic of Indonesia with Decree No. AHU-32448.AH.01.01.Tahun 2012 dated June 14, 2012.
On June 4, 2012, MKP, a subsidiary, acquired all ownership in PT Optimum Karya Persada (OKP) (through direct ownership of 0.1% and 99.9% indirect ownership of SIH) with acquisition cost of Rp 1,000,000,000. At the acquisition date, OKP has not yet started operation and therefore, recorded as an asset acquisition.
PT Brenada Karya Bangsa was established under deed No. 9 dated June 4, 2012 made in the presence of Sriwi Bawana Nawaksari, S.H., M.Kn., a notary in Tangerang. The deed of establishment was approved by the Minister of Law and Human Rights Republic of Indonesia with Decree No. AHU-32744.AH.01.01.Tahun 2012 dated June 15, 2012. PT Sembada Karya Megah was established under deed No. 8 dated June 4, 2012 made in the presence of Sriwi Bawana Nawaksari, S.H., M.Kn., a notary in Tangerang. The deed of establishment was approved by the Minister of Law and Human Rights Republic of Indonesia with Decree No. AHU-32890.AH.01.01.Tahun 2012 dated June 15, 2012.
PT Tataka Bumi Karya was established under deed No. 10 dated June 4, 2012 made in the presence of Sriwi Bawana Nawaksari, S.H., M.Kn., a notary in Tangerang. The deed of establishment was approved by the Minister of Law and Human Rights Republic of Indonesia with Decree No. AHU-32745.AH.01.01. Tahun 2012 dated June 15, 2012.
PT Tataka Karya Indah was established under deed No. 11 dated June 4, 2012 made in the presence of Sriwi Bawana Nawaksari, S.H., M.Kn., a notary in Tangerang. The deed of establishment was approved by the Minister of Law and Human Rights Republic of Indonesia with Decree No. AHU-32573.AH.01.01. Tahun 2012 dated June 14, 2012.
PT Rosela Indah Cipta was established under deed No. 12 dated June 4, 2012 made in the presence of Sriwi Bawana Nawaksari, S.H., M.Kn., a notary in Tangerang. The deed of establishment was approved by the Minister of Law and Human Rights Republic of Indonesia with Decree No. AHU-32746.AH.01.01. Tahun 2012 dated June 15, 2012.
PT Harmoni Selaras Indah was established under deed No. 13 dated June 4, 2012 made in the presence of Sriwi Bawana Nawaksari, S.H., M.Kn., a notary in Tangerang. The deed of establishment was approved by the Minister of Law and Human Rights Republic of Indonesia with Decree No. AHU-32893.AH.01.01.Tahun 2012 dated June 15, 2012.
On June 21, 2012, MKP, a subsidiary, acquired all of the ownership in PT Kusuma Primadana (KP) (through direct ownership of 0.01% and 99.9% indirect ownership of SIH) with acquisition cost of Rp 100,000,000. KP has a 80% stake in PT Adijaya Buana Sakti (ABS). At the acquisition date, KP has not yet started operation and therefore, recorded as an asset acquisition.
These consolidated financial statements are originally issued in Indonesian language
PT LIPPO KARAWACI Tbk AND SUBSIDIARIES NOTES TO THE CONSOLIDATED FINANCIAL STATEMENTS (Continued) As of March 31, 2013 (Unaudited) and December 31, 2012 (Audited) and For the 3 (three) Months Ended March 31, 2013 and 2012 (Unaudited) (Expressed In Full Rupiah, Unless Otherwise Stated)
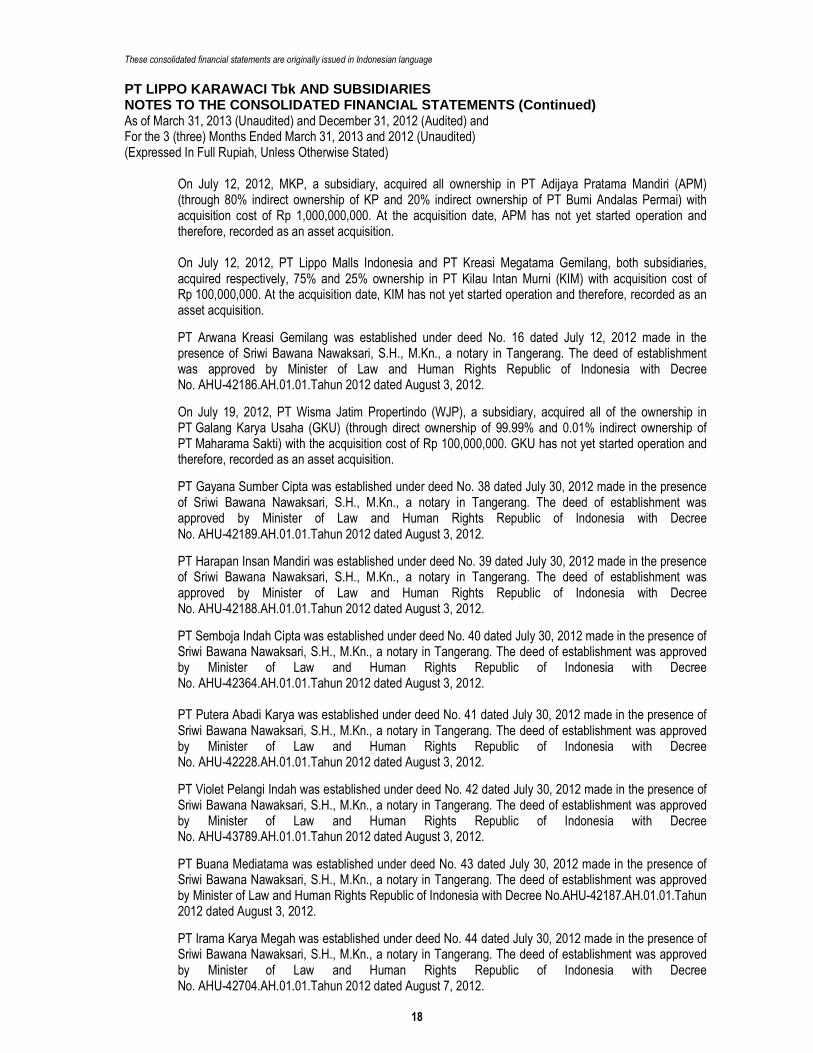
FD/May 7, 2013 18 paraf:
On July 12, 2012, MKP, a subsidiary, acquired all ownership in PT Adijaya Pratama Mandiri (APM) (through 80% indirect ownership of KP and 20% indirect ownership of PT Bumi Andalas Permai) with acquisition cost of Rp 1,000,000,000. At the acquisition date, APM has not yet started operation and therefore, recorded as an asset acquisition. On July 12, 2012, PT Lippo Malls Indonesia and PT Kreasi Megatama Gemilang, both subsidiaries, acquired respectively, 75% and 25% ownership in PT Kilau Intan Murni (KIM) with acquisition cost of Rp 100,000,000. At the acquisition date, KIM has not yet started operation and therefore, recorded as an asset acquisition.
PT Arwana Kreasi Gemilang was established under deed No. 16 dated July 12, 2012 made in the presence of Sriwi Bawana Nawaksari, S.H., M.Kn., a notary in Tangerang. The deed of establishment was approved by Minister of Law and Human Rights Republic of Indonesia with Decree No. AHU-42186.AH.01.01.Tahun 2012 dated August 3, 2012.
On July 19, 2012, PT Wisma Jatim Propertindo (WJP), a subsidiary, acquired all of the ownership in PT Galang Karya Usaha (GKU) (through direct ownership of 99.99% and 0.01% indirect ownership of PT Maharama Sakti) with the acquisition cost of Rp 100,000,000. GKU has not yet started operation and therefore, recorded as an asset acquisition.
PT Gayana Sumber Cipta was established under deed No. 38 dated July 30, 2012 made in the presence of Sriwi Bawana Nawaksari, S.H., M.Kn., a notary in Tangerang. The deed of establishment was approved by Minister of Law and Human Rights Republic of Indonesia with Decree No. AHU-42189.AH.01.01.Tahun 2012 dated August 3, 2012.
PT Harapan Insan Mandiri was established under deed No. 39 dated July 30, 2012 made in the presence of Sriwi Bawana Nawaksari, S.H., M.Kn., a notary in Tangerang. The deed of establishment was approved by Minister of Law and Human Rights Republic of Indonesia with Decree No. AHU-42188.AH.01.01.Tahun 2012 dated August 3, 2012.
PT Semboja Indah Cipta was established under deed No. 40 dated July 30, 2012 made in the presence of Sriwi Bawana Nawaksari, S.H., M.Kn., a notary in Tangerang. The deed of establishment was approved by Minister of Law and Human Rights Republic of Indonesia with Decree No. AHU-42364.AH.01.01.Tahun 2012 dated August 3, 2012. PT Putera Abadi Karya was established under deed No. 41 dated July 30, 2012 made in the presence of Sriwi Bawana Nawaksari, S.H., M.Kn., a notary in Tangerang. The deed of establishment was approved by Minister of Law and Human Rights Republic of Indonesia with Decree No. AHU-42228.AH.01.01.Tahun 2012 dated August 3, 2012.
PT Violet Pelangi Indah was established under deed No. 42 dated July 30, 2012 made in the presence of Sriwi Bawana Nawaksari, S.H., M.Kn., a notary in Tangerang. The deed of establishment was approved by Minister of Law and Human Rights Republic of Indonesia with Decree No. AHU-43789.AH.01.01.Tahun 2012 dated August 3, 2012.
PT Buana Mediatama was established under deed No. 43 dated July 30, 2012 made in the presence of Sriwi Bawana Nawaksari, S.H., M.Kn., a notary in Tangerang. The deed of establishment was approved by Minister of Law and Human Rights Republic of Indonesia with Decree No.AHU-42187.AH.01.01.Tahun 2012 dated August 3, 2012.
PT Irama Karya Megah was established under deed No. 44 dated July 30, 2012 made in the presence of Sriwi Bawana Nawaksari, S.H., M.Kn., a notary in Tangerang. The deed of establishment was approved by Minister of Law and Human Rights Republic of Indonesia with Decree No. AHU-42704.AH.01.01.Tahun 2012 dated August 7, 2012.

These consolidated financial statements are originally issued in Indonesian language
PT LIPPO KARAWACI Tbk AND SUBSIDIARIES NOTES TO THE CONSOLIDATED FINANCIAL STATEMENTS (Continued) As of March 31, 2013 (Unaudited) and December 31, 2012 (Audited) and For the 3 (three) Months Ended March 31, 2013 and 2012 (Unaudited) (Expressed In Full Rupiah, Unless Otherwise Stated)
FD/May 7, 2013 19 paraf:
PT Gaharu Alam Permai was established under deed No. 45 dated July 30, 2012 made in the presence of Sriwi Bawana Nawaksari, S.H., M.Kn., a notary in Tangerang. The deed of establishment was approved by Minister of Law and Human Rights Republic of Indonesia with Decree No. AHU-43319.AH.01.01. Tahun 2012 dated August 9, 2012.
PT Lembayung Karya Nirwana was established under deed No. 46 dated July 30, 2012 made in the presence of Sriwi Bawana Nawaksari, S.H., M.Kn., a notary in Tangerang. The deed of establishment was approved by Minister of Law and Human Rights Republic of Indonesia with Decree No. AHU-43216.AH.01.01.Tahun 2012 dated August 8, 2012.
PT Nusaindah Bukit Permai was established under deed No. 47 dated July 30, 2012 made in the presence of Sriwi Bawana Nawaksari, S.H., M.Kn., a notary in Tangerang. The deed of establishment was approved by Minister of Law and Human Rights Republic of Indonesia with Decree No. AHU-42391.AH.01.01.Tahun 2012 dated August 3, 2012.
PT Inspira Ide Cemerlang was established under deed No. 48 dated July 30, 2012 made in the presence of Sriwi Bawana Nawaksari, S.H., M.Kn., a notary in Tangerang. The deed of establishment was approved by Minister of Law and Human Rights Republic of Indonesia with Decree No. AHU-44917.AH.01.01.Tahun 2012 dated August 16, 2012.
PT Kreasi Tunas Bangsa was established under deed No. 50 dated July 30, 2012 made in the presence of Sriwi Bawana Nawaksari, S.H., M.Kn., a notary in Tangerang. The deed of establishment was approved by Minister of Law and Human Rights Republic of Indonesia with Decree No. AHU-43220.AH.01.01.Tahun 2012 dated August 8, 2012.
PT Grahatama Asri Makmur was established under deed No. 12 dated August 10, 2012 made in the presence of Sriwi Bawana Nawaksari, S.H., M.Kn., a notary in Tangerang. The deed of establishment was approved by Minister of Law and Human Rights Republic of Indonesia with Decree No. AHU-47459.AH.01.01.Tahun 2012 dated September 6, 2012.
On August 15, 2012, PT Persada Mandiri Dunia Niaga and PT Wisma Jatim Propertindo, both subsidiaries, acquired respectively, 75% and 25% ownership in PT Ekaputra Kencana Abadi (EKA) with acquisition cost of Rp 20,000,000,000. EKA is the owner of 29.97% and 0.08% share in PT Menara Megah Tunggal and PT Trias Mitra Investama, both subsidiaries, respectively. This transaction is a business combination (see Note 45).
On August 27, 2012, PT Eramulia Pratamajaya (ERA), a subsidiary, acquired the entire ownership in PT Kalanusa Intan Cemerlang (KIC) (through direct ownership of 99.99% and 0.01% indirect ownership of PT Serasi Adikarsa) with acquisition cost of Rp 100,000,000. At the acquisition date, KIC has not yet started operation and therefore, recorded as an asset acquisition.
On August 28, 2012, ERA, a subsidiary, acquired the entire ownership in PT Garuda Asa Kencana (GAK) (through direct ownership of 40% and 40% indirect ownership of PT Kalanusa Intan Cemerlang) with acquisition cost of Rp 100,000,000. At the date of acquisition, GAK has not yet started operation and therefore, recorded as an asset acquisition.
PT Karimata Putra Alam was established under deed No. 27 dated Aug 28, 2012 made in the presence of Sriwi Bawana Nawaksari, S.H., M.Kn., a notary in Tangerang. The deed of establishment was approved by Minister of Law and Human Rights Republic of Indonesia with Decree No. AHU-48813.AH.01.01. Tahun 2012 dated September 14, 2012.
On September 11, 2012, PKP, a subsidiary, acquired all ownership PT Lautan Sinar Abadi (LSA) (through direct ownership of 99.99% and 0.01% indirect ownership of PT Grand Villa Persada) with acquisition cost of Rp 100,000,000. LSA is the owner of 86.5% stake in PT Usahatama Creative. At the acquisition date, LSA has not yet started operation and therefore, recorded as an asset acquisition.
These consolidated financial statements are originally issued in Indonesian language
PT LIPPO KARAWACI Tbk AND SUBSIDIARIES NOTES TO THE CONSOLIDATED FINANCIAL STATEMENTS (Continued) As of March 31, 2013 (Unaudited) and December 31, 2012 (Audited) and For the 3 (three) Months Ended March 31, 2013 and 2012 (Unaudited) (Expressed In Full Rupiah, Unless Otherwise Stated)
FD/May 7, 2013 20 paraf:
On September 21, 2012, the entire ownership in PT Bayutama Sukses, a subsidiary, was transferred at a cost of Rp 600,000,000. Upon transfer, no gain (loss) on disposal of investments was recognized and the subsidiary transferred its major assets of Rp 600,000,000.
On September 21, 2012, PT Lippo Malls Indonesia (formerly PT Consulting & Management Services Division), a subsidiary, acquired the entire stake in PT Gunung Halimun Elok (GHE) (through 75% direct ownership and 25% indirect ownership of PT Kilau Intan Murni (KIM)) with acquisition cost of Rp 100,000,000. At the acquisition date, GHE has not yet started operation and therefore, recorded as an asset acquisition.
On October 8, 2012, PKP, a subsidiary, acquired all ownership in PT Esatama Lestari Jaya (ELJ) (through 25% direct ownership and 75% indirect ownership of MCG) with the acquisition amounted to Rp 100,000,000, each. At the acquisition date, ELJ has not yet started operation and therefore, recorded as an asset acquisition.
On October 9, 2012, GHE and the MCG, both subsidiaries acquired respectively, 75% and 25% ownership in PT Koridor Usaha Maju (KUM) with acquisition cost of Rp 75,000,000 and Rp 25,000,000, respectively. At the acquisition date, KUM has not yet started operation and therefore, recorded as an asset acquisition. On October 9, 2012, PT GHE and the MCG, both subsidiaries acquired respectively, 75% and 25% ownership in PT Multi Panen Utama (MPU) with acquisition cost of Rp 75,000,000 and Rp 25,000,000, respectively. At the acquisition date, MPU has not yet started operation and therefore, recorded as an asset acquisition. On October 17, 2012, MCG and PKP, both subsidiaries acquired respectively, 75% and 25% ownership in PT Gumarang Karya Sejati (GKS) with acquisition cost of Rp 75,000,000 and Rp 25,000,000, respectively. At the acquisition date, GKS has not yet started operation and therefore, recorded as an asset acquisition. On October 25, 2012, PKP, a subsidiary, acquired the entire ownership in PT Bahtera Perkasa Makmur (BPM) (through 25% direct ownership and 75% indirect ownership of MCG) with acquisition cost of Rp 100,000,000. At the acquisition date, the BPM has not yet started operation and therefore, recorded as an asset acquisition. On October 25, 2012, MKP, a subsidiary, acquired all ownership in PT Danisa Indah Cipta (DIC) (through 0.01% direct ownership and 99.99% indirect ownership of SIH) with acquisition cost of Rp 100,000,000 and Rp 1,000, respectively. At the acquisition date, DIC has not yet operated and recorded as an asset acquisition.
On November 8, 2012, DIC and PKP, both subsidiaries acquired respectively, 70% and 30% ownership in PT Fajarindo Sinar Sakti (FSS) with acquisition cost of Rp 70,000,000 and Rp 30,000,000, respectively. At the acquisition date, FSS has not yet started operation and therefore, recorded as an asset acquisition.
On November 16, 2012, PKP, a subsidiary, acquired the entire ownership in PT Gading Makmur Jaya (GMJ) (through 0.01% direct ownership and 99.99% indirect ownership of MCG) with acquisition cost of Rp 100,000,000. At the acquisition date, GMJ has not yet started operation and therefore, recorded as an asset acquisition.
On December 20, 2012, PT Lippo Malls Indonesia (formerly PT Consulting & Management Services Division) acquired the entire ownership in PT Mulia Citra Abadi (through 25% direct ownership and 75% indirect ownership of PT Kilau Intan Murni) with acquisition cost of Rp 300,000,000,000. This transaction is a business combination (see Note 45).

These consolidated financial statements are originally issued in Indonesian language
PT LIPPO KARAWACI Tbk AND SUBSIDIARIES NOTES TO THE CONSOLIDATED FINANCIAL STATEMENTS (Continued) As of March 31, 2013 (Unaudited) and December 31, 2012 (Audited) and For the 3 (three) Months Ended March 31, 2013 and 2012 (Unaudited) (Expressed In Full Rupiah, Unless Otherwise Stated)
FD/May 7, 2013 21 paraf:
On December 20, 2012, PT Primakreasi Propertindo acquired all ownership in PT Bimasakti Jaya Abadi (through 25% direct ownership and 75% indirect ownership of MCG), with acquisition cost of Rp 125,000,000,000. This transaction is a business combination (see Note 45).
On December 20, 2012, PT Primakreasi Propertindo acquired all ownership in PT Surya Megah Lestari (through 25% direct ownership and 75% indirect ownership of MCG), with acquisition cost of Rp 10,000,000,000. This transaction is a business combination (see Note 45).
On December 20, 2012 the entire ownership of Sea Pejaten Pte Ltd and PT Gading Nusa Utama in PT Panca Permata Pejaten has been transferred at a value Rp 731,364,917,779. Upon transfer, this subsidiary recorded Rp 341,410,567,126 gain on disposal of investments and transferred cash and bank, other assets and liabilities amounting to Rp 9,828,189,726, Rp 242,962,165,659 and Rp 44,547,239,532, respectively. On January 28, 2013, PT Primakreasi Propertindo (PKP) and PT Grand Villa Persada (GVP), both subsidiaries acquired respectively, 75% and 25% ownership in PT Graha Dana Dinamika (GDD) with acquisition cost of Rp 45,000,000 and Rp 15,000,000, respectively. At the acquisition date, GDD has not yet started operation and therefore, recorded as an asset acquisition. On January 28, 2013, PKP and GVP, both subsidiaries acquired respectively, 75% and 25% ownership in PT Mega Pratama Serasi (MPS) with acquisition cost of Rp 45,000,000 and Rp 15,000,000, respectively. At the acquisition date, MPS has not yet started operation and therefore, recorded as an asset acquisition. On January 28, 2013, PKP and GVP, both subsidiaries acquired respectively, 75% and 25% ownership in PT Mulia Aditama Setia (MAS) with acquisition cost of Rp 45,000,000 and Rp 15,000,000, respectively. At the acquisition date, MAS has not yet started operation and therefore, recorded as an asset acquisition. On February 21, 2013, PT Abadi Jaya Sakti and PT Tiga Mitra Ekamulia, both subsidiaries acquired respectively, 75% and 25% ownership in PT Zodia Karya Indah (ZKI) with acquisition cost of Rp 75,000,000 and Rp 25,000,000, respectively. At the acquisition date, ZKI has not yet started operation and therefore, recorded as an asset acquisition. PT Dasa Graha Jaya was established under deed No. 33 dated February 21, 2013 made in the presence of Sriwi Bawana Nawaksari, S.H., M.Kn., a notary in Tangerang. The deed of establishment was approved by Minister of Law and Human Rights Republic of Indonesia with Decree No. AHU-08844.AH.01.01. Tahun 2013 dated February 25, 2013. On March 6, 2013, PKP and GVP, both subsidiaries acquired respectively, 75% and 25% ownership in PT Pradamas Graha Indah (PGI) with acquisition cost of Rp 75,000,000 and Rp 25,000,000, respectively. At the acquisition date, PGI has not yet started operation and therefore, recorded as an asset acquisition.
1.d. Board of Commissioners, Directors, Audit Committee and Employees Based on the Deed of Annual General Meeting of Stockholders No. 3 dated April 5, 2012 which was made in the presence of Sriwi Bawana Nawaksari, S.H. M.Kn., a notary in Tangerang, the composition of the Board of Commissioners and Directors as of March 31, 2013 and December 31, 2012 are as follows:
Board of Commissioners: President Commissioner : Theo L. Sambuaga Vice President Commissioner : Surjadi Soedirdja* Independent Commissioner : Tanri Abeng
These consolidated financial statements are originally issued in Indonesian language
PT LIPPO KARAWACI Tbk AND SUBSIDIARIES NOTES TO THE CONSOLIDATED FINANCIAL STATEMENTS (Continued) As of March 31, 2013 (Unaudited) and December 31, 2012 (Audited) and For the 3 (three) Months Ended March 31, 2013 and 2012 (Unaudited) (Expressed In Full Rupiah, Unless Otherwise Stated)
FD/May 7, 2013 22 paraf:
Independent Commissioner : Agum Gumelar Independent Commissioner : Farid Harianto Independent Commissioner : Jonathan Limbong Parapak Commissioner : Gouw Viven (Viven G Setiabudi)
* also as Independent Commissioner
The composition of the Directors as March 31, 2013 and December 31, 2012 are as follows:
Directors: President Director : Ketut Budi Wijaya Director : Tjokro Libianto Director : Jopy Rusli Director : Elia Yudhistira Susiloputro Director : Djoko Harjono Director : Roberto Fernandez Feliciano Director : Ivan Setiawan Budiono Unaffiliated Director : Jenny Kuistono
The audit committee composition as of March 31, 2013 and December 31, 2012 are as follows:
Audit Committees: Chairman : Farid Harianto Member : Siswanto Pramono Member : Jeffrey Turangan*
* Has passed away on December 7, 2012.
The Company’s corporate secretary as of March 31, 2013 and December 31, 2012 is Jenny Kuistono.
As of March 31, 2013 and December 31, 2012, the Company and subsidiaries have 6,970 and 6,705 employees, respectively (unaudited).
2. New Financial Accounting Standards
Indonesian Financial Accounting Standards (SAK) are Statements and Interpretations issued by the Financial Accounting Standards Board of the Indonesian Institute of Accountants (DSAK-IAI) and the regulation of capital market regulator, that is the Indonesia Financial Services Authority (OJK) (or formerly called Bapepam-LK), for the entity under its supervision. The following are new SAK effective in the current period:
2.a. New Ruling of Bapepam-LK The Chairman of Bapepam-LK has issued Decree No. KEP-347/BL/2012 dated June 25, 2012, regarding Financial Statements Presentation and Disclosure of the Issuers and or Public Companies as set forth in the Regulation No. VIII.G.7 effective for financial statements on or after December 31, 2012. By this decree, the previous decrees of the Chairman of Bapepam-LK Nos. KEP 554/BL/2010 and KEP 06/PM/2000 and Circulars of Chairman of Bapepam-LK No. SE 03/BL/2011, SE-02/PM/2002 and SE-02/BL/2008 are revoked and no longer applicable since December 31, 2012.
Following the implementation of this regulation, the Company has made adjustments to accounts in the consolidated financial statements, accounts grouping in the consolidated financial statements of the same main components as well as adjustments to the disclosures and presentation of the consolidated financial statements.

These consolidated financial statements are originally issued in Indonesian language
PT LIPPO KARAWACI Tbk AND SUBSIDIARIES NOTES TO THE CONSOLIDATED FINANCIAL STATEMENTS (Continued) As of March 31, 2013 (Unaudited) and December 31, 2012 (Audited) and For the 3 (three) Months Ended March 31, 2013 and 2012 (Unaudited) (Expressed In Full Rupiah, Unless Otherwise Stated)
FD/May 7, 2013 23 paraf:
2.b. Statements and Interpretations Issued by DSAK-IAI The following are the Statement (PSAK), Interpretation (ISAK) and Statement of Revocation (PPSAK) that have been issued by DSAK-IAI applied to the financial statements which begins on or after January 1, 2012:
• PSAK No. 10 (Revised 2010) : The Effects of Changes in Foreign Exchange Rates
• PSAK No. 13 (Revised 2011) : Investment Property
• PSAK No. 16 (Revised 2011) : Property, Plant and Equipment
• PSAK No. 18 (Revised 2010) : Accounting and Reporting by Retirement Benefit Plans
• PSAK No. 24 (Revised 2010) : Employee Benefits
• PSAK No. 26 (Revised 2011) : Borrowing Costs
• PSAK No. 28 (Revised 2012) : Accounting for Losses on Insurance Contract, revision effective since December 11, 2012
• PSAK No. 30 (Revised 2011) : Leases
• PSAK No. 33 (Revised 2010) : Stripping Activities and Environmental Management in General Mining
• PSAK No. 34 (Revised 2010) : Construction Contracts
• PSAK No. 36 (Revised 2012) : Accounting for Life Insurance, revision effective since December 11, 2012
• PSAK No. 45 (Revised 2010) : Financial Reporting for Non-Profit Entity
• PSAK No. 46 (Revised 2010) : Income Taxes
• PSAK No. 50 (Revised 2010) : Financial Instruments: Presentation
• PSAK No. 53 (Revised 2010) : Share-based Payment
• PSAK No. 55 (Revised 2011) : Financial Instruments:Recognition and Measurement
• PSAK No. 56 (Revised 2010) : Earnings per Share
• PSAK No. 60 : Financial Instruments: Disclosures
• PSAK No. 61 : Accounting for Government Grants and Disclosure of Government Assistance
• PSAK No. 62 : Insurance Contract
• PSAK No. 63 : Financial Reporting in Hyperinflationary Economies
• PSAK No. 64 : Exploration and Evaluation Activities in the Mining and Mineral Resources
• ISAK No. 13 : Hedges of Net Investment in a Foreign Operation
• ISAK No. 15 : PSAK No. 24 - The Limit on a Defined Benefit Asset, Minimum Funding Requirements and their Interaction
• ISAK No. 16 : Service Concession Arrangements
• ISAK No. 18 : Government Assistance - No Specific Relation to Operating Activities
• ISAK No. 19 : Applying the Restatement Approach under PSAK No. 63: Financial Reporting in Hyperinflationary Economies
• ISAK No. 20 : Income Taxes-Change in the Tax Status of an Entity or its Stockholders
• ISAK No. 22 : Service Concession Arrangements: Disclosure
• ISAK No. 23 : Operating Leases – Incentives
• ISAK No. 24 : Evaluating the Substance of Transactions in the Legal Form of a Lease
• ISAK No. 25 : Land Rights
• ISAK No. 26 : Reassessment of Embedded Derivatives
• PPSAK No. 7 : Revocation of PSAK No. 44: Accounting for Real Estate Development Activity paragraph 47-48 and 56-61
These consolidated financial statements are originally issued in Indonesian language
PT LIPPO KARAWACI Tbk AND SUBSIDIARIES NOTES TO THE CONSOLIDATED FINANCIAL STATEMENTS (Continued) As of March 31, 2013 (Unaudited) and December 31, 2012 (Audited) and For the 3 (three) Months Ended March 31, 2013 and 2012 (Unaudited) (Expressed In Full Rupiah, Unless Otherwise Stated)
FD/May 7, 2013 24 paraf:
• PPSAK No. 8 : Revocation of PSAK No. 27: Accounting for Cooperatives
• PPSAK No. 9 : Revocation ISAK No. 5: Interpretation of Paragraph 14 on PSAK No. 50 (1998) regarding the Reporting of Fair Value Changes in Equity Investment – Available-for-Sale
• PPSAK No. 11 : Revocation of PSAK No. 39: Accounting for Joint Ventures
The changes of the above new standards which are relevant or have effect to the consolidated financial statements are as follows: PSAK No. 13 (Revised 2011): “Investment Property” The revised standard introduces a new requirement to account for properties under construction or development as investment properties. Previously, properties under construction were accounted for as property and equipment until construction or development was completed (except for those properties recognized as inventory), regardless of the intentions for future use as either own-use property or investment property.
Property under construction that is intended to be used as investment property after construction is completed should now be accounted for as investment property. The investment property under construction should be accounted for consistently with the entity’s existing accounting for other investment properties, which uses either the fair value model or the cost model. There is a requirement to re-measure property under construction at fair value each period if the fair value model is applied.
Where fair value of investment property under construction could not be reliably measured, the property is measured at cost until the earlier of the date construction is completed or the date at which fair value can be reliably measured.
PSAK No. 24 (Revised 2010): “Employee Benefits” Several notable revisions relevant to the Company are as follows: 1. Recognition of actuarial gains and losses
The revised standard introduces a new alternative method to recognize actuarial gains and losses, that is to recognize all actuarial gains and losses through other comprehensive income.
2. Disclosures items The revised standard introduces a number of disclosure requirements including disclosure of: the amounts for the current annual period and the previous four annual periods of present value of the defined benefit obligation and fair value of plan assets.
PSAK No. 60: “Financial Instruments: Disclosures” This standard requires more extensive disclosure of the entity’s financial risk management compared to PSAK No. 50 (Revised 2006), “Financial Instruments: Presentation and Disclosures”. The requirements consist of the following:
• The significance of financial instruments for an entity’s financial position and performance. These disclosures are in line with PSAK No. 50 (Revised 2010).
• Qualitative and quantitative information about exposure to risks arising from financial instruments, including specified minimum disclosures about credit risk, liquidity risk and market risk. The qualitative disclosures describe management’s objectives, policies and processes for managing those risks. The quantitative disclosures provide information about the extent to which the entity is exposed to risk, based on information provided internally to the entity’s key management personnel.

These consolidated financial statements are originally issued in Indonesian language
PT LIPPO KARAWACI Tbk AND SUBSIDIARIES NOTES TO THE CONSOLIDATED FINANCIAL STATEMENTS (Continued) As of March 31, 2013 (Unaudited) and December 31, 2012 (Audited) and For the 3 (three) Months Ended March 31, 2013 and 2012 (Unaudited) (Expressed In Full Rupiah, Unless Otherwise Stated)
FD/May 7, 2013 25 paraf:
PPSAK No. 7, “Revocation of PSAK No. 44: Accounting for Real Estate Development Activity paragraphs 47- 48 and 56-61”
This statements changes the presentation of the Consolidated Statement of Financial Position by classifying assets and liabilities into current and non-current to comply with PSAK No. 1 (Revised 2009) “Presentation of Financial Statements”.
3. Summary of Significant Accounting Policies
3.a. Compliance with Financial Accounting Standards (SAK), Measurement and Preparation of Consolidated Financial Statements The Company’s consolidated financial statements have been prepared and presented in accordance with the Indonesian Financial Accounting Standards which include the Statements and the Interpretations issued by DSAK-IAI and Regulation of Bapepam-LK No. VIII.G.7 regarding the “Guidance of Financial Statements Presentation” as set forth in Decree No. KEP-347/BL/2012 regarding the amendment to Regulation No. VIII.G.7 and other accounting policies prevailing in the Capital Market.
The consolidated financial statements have been prepared on the going concern assumption and on the accrual basis, except for the consolidated statements of cash flows which used the cash basis. The basis of measurement in the preparation of these consolidated financial statements is the historical cost principle, except for certain accounts that were measured using other basis, as described in the respective accounting policy.
The consolidated statements of cash flows are presented by classifying the activities into operating, investing and financing. The cash flows from operating activities were prepared using the direct method.
Functional currency of the Company and its subsidiaries is Rupiah, unless some subsidiaries as disclosed in Note 1.c. Transactions are recorded using the functional currency. The reporting currency used in the preparation of these consolidated financial statements is Rupiah.
3.b. Principles of Consolidation The consolidated financial statements include the accounts of the Company and its subsidiaries (including special purpose entity) either directly or indirectly controlled as presented in Note 1.c.
Control also exists when the parent entity owns half or less of the voting power of an entity when there is: a. power over more than half of the voting rights by virtue of an agreement with other investors; b. power to govern the financial and operating policies of the entity under a statute or an agreement; c. power to appoint or remove the majority of the members of the board of directors or equivalent
governing body and control of the entity is by that board or body; or d. power to cast the majority of votes in the meetings of the board of directors or equivalent governing
body and control of the entity is by that board or body. The existence and effect of potential voting rights that can be implemented or converted on the date of the reporting period should be considered when assessing whether an entity has the power to govern financial and operating policies of another entity. The entities are consolidated from the date on which effective control was transferred to the Company and are no longer consolidated when the Company ceases to have effective control. Control exists when the entity has the power to govern the financial and operating policies of the entity and get benefits from the activities of the said entity. The consolidated financial statements have been prepared on the basis of entity concept. All significant related intercompany accounts, transactions and profits among the consolidated companies have been eliminated to reflect the financial position and result of operations as a whole entity.

These consolidated financial statements are originally issued in Indonesian language
PT LIPPO KARAWACI Tbk AND SUBSIDIARIES NOTES TO THE CONSOLIDATED FINANCIAL STATEMENTS (Continued) As of March 31, 2013 (Unaudited) and December 31, 2012 (Audited) and For the 3 (three) Months Ended March 31, 2013 and 2012 (Unaudited) (Expressed In Full Rupiah, Unless Otherwise Stated)
FD/May 7, 2013 26 paraf:
The changes in the Company’s ownership interest in a subsidiary that do not result to a loss of control are accounted for as equity transactions and attributed to the owners of the parent. All major transactions and inter-company account balances (including significant unrealized gain or loss) has been eliminated. Non-controlling interest reflects equity in net earnings or losses and net assets of Subsidiaries which are not directly or indirectly attributable to parent company, and is presented under consolidated statement of comprehensive income and equity in the consolidated statement of financial position, separated from portion which are attributable to parent company.
3.c. Foreign Currency Transactions and Translation of Consolidated Financial Statements Foreign currency is a currency other than the functional currency. Transactions involving foreign currencies are recorded at the exchange rates prevailing at the time the transactions are made.
At the reporting date, monetary assets and liabilities denominated in foreign currencies were adjusted to reflect the exchange rates prevailing at the time, with the following conversion rates:
March 31, 2013 December 31, 2012 Rp Rp
1 USD 9,719 9,670 1 SGD 7,816 7,907 1 EUR 12,423 12,810 100 JPY 10,323 11,197 1 AUD 10,130 10,025
Gains and losses from foreign exchange differences arising from foreign currency transactions into Rupiah, charged to profit and loss. Whereas the non-monetary assets and liabilities denominated in foreign currencies were measured using the exchange rate on transaction date and monetary assets and liabilities denominated in foreign currencies were measured at fair value using the exchange rate on the date of fair value measurement. The financial statements of subsidiaries which presented in currency other than Rupiah were translated into Rupiah using closing rate at reporting date for assets and liabilities accounts and the average rate during the period for income and expense accounts. All differences resulting from the translations were recognized as part of other comprehensive income.
3.d. Cash Equivalent Cash equivalent consist of time deposits with maturities of not more than or equal to three (3) months from the date of placement, are not restricted and not used as collateral to any liabilities.
3.e. Investment in Associates An associate is an entity in which the investor (i.e., the Company or subsidiary, which acts as an investor) has a significant influence to participate in decision making on financial and operational policies of the investee, but does not control or jointly control those policies. Significant influence is presumed to exist if the investor owns 20% or more of the voting rights of the investee, either directly or indirectly. Investment in associates are initially recognized at cost. The carrying amount is increased or decreased by the share in the profit or loss of the investee after the date of acquisition in proportion with the percentage of ownership and reduced by dividends received (equity method).

These consolidated financial statements are originally issued in Indonesian language
PT LIPPO KARAWACI Tbk AND SUBSIDIARIES NOTES TO THE CONSOLIDATED FINANCIAL STATEMENTS (Continued) As of March 31, 2013 (Unaudited) and December 31, 2012 (Audited) and For the 3 (three) Months Ended March 31, 2013 and 2012 (Unaudited) (Expressed In Full Rupiah, Unless Otherwise Stated)
FD/May 7, 2013 27 paraf:
The carrying amount is also adjusted if there is a change in the investor's proportionate interest in the investee arising from the investee’s other comprehensive income. Those changes are recognized in other comprehensive income of the investor.
3.f. Transaction with Related Parties In a normal business transaction, the Company has transactions with related parties. Related party is the person or entity that is related to the Company (referred to as the “reporting entity”), which includes: a) A person or a close member of that person’s family is related to a reporting entity if that person:
(i) has control or joint control over the reporting entity; (ii) has significant influence over the reporting entity; or (iii) is a member of the key management personnel of the reporting entity or of a parent of the
reporting entity. b) An entity is related to the reporting entity if any of following conditions applies:
(i) The entity and the reporting entity are members of the same group (which means that each parent, subsidiary and fellow subsidiary is related to the others).
(ii) One entity is an associate or joint venture of the other entity (or an associate or joint venture of a member of a group of which the other entity is a member).
(iii) Both entities are joint ventures of the same third party. (iv) One entity is a joint venture of a third entity and the other entity is an associate of the third entity. (v) The entity is a post-employment benefit plan for the benefit of employees of either the reporting
entity or an entity related to the reporting entity. If the reporting entity in itself such a plan, the sponsoring employers are also related to the reporting entity.
(vi) The entity is controlled or jointly controlled by a person identified in (a). (vii) A person identified in (a) (i) has significant influence over the entity or is a member of the key
management personnel of the entity (or a parent of the entity).
3.g. Inventories and Land for Development Real estate inventories, which mainly consist of acquisition cost of land under development, shopping center, residential houses, shophouses, office buildings, apartments and buildings (houses) under construction, are carried at the lower of cost and net realizable value (NRV). Cost is determined by using the average method. Cost of land under development includes cost of land improvement and development, capitalized interest and other financing charges obtained to finance the acquisition and development of land until completed. The cost of residential houses and shophouses consist of actual construction cost.
Inventories of healthcare business (e.g., medicines, medical supplies and others) are carried at the lower of cost and NRV. Cost is determined by using the average method. Allowance for decline in inventory value is provided based on a review of inventory status at the end of period.
Inventories of hospitality business (e.g., food, beverages and others) are carried at the lower of cost and ret realizable value. Cost is determined by using the first-in-first-out method (FIFO). Allowance for decline in inventory value is provided based on a review of inventory status at the end of period.
Net realizable value is the estimated selling price in the ordinary course of business less the estimated costs of completion and selling costs. Allowance for inventories using determined based on a review of the condition of the inventories at the end of the period.
Land for development which are owned by the Company and subsidiaries is classified as “Land for Development”. Upon the commencement of development and construction of infrastructure, the carrying cost of land under development will be transferred to the respective real estate inventories or property and equipment accounts, whichever is appropriate.

These consolidated financial statements are originally issued in Indonesian language
PT LIPPO KARAWACI Tbk AND SUBSIDIARIES NOTES TO THE CONSOLIDATED FINANCIAL STATEMENTS (Continued) As of March 31, 2013 (Unaudited) and December 31, 2012 (Audited) and For the 3 (three) Months Ended March 31, 2013 and 2012 (Unaudited) (Expressed In Full Rupiah, Unless Otherwise Stated)
FD/May 7, 2013 28 paraf:
3.h. Prepaid Expenses Prepaid expenses are amortized over the period benefitted using straight line method.
3.i. Investment Property Investment property is owned or held under a finance lease to earn rentals or for capital appreciation or both, rather than for use in the production or supply of goods or services or for administrative purposes or sale in the ordinary course of business.
Investment property is carried at cost less its accumulated depreciation and any accumulated impairment losses. Land is not depreciated and is presented at acquisition cost. Building is depreciated using straight line method based on its estimated useful life of 20 years. The cost of repairs and maintenance is charged to the consolidated statements of comprehensive income as incurred while significant renovations and additions are capitalized.
Investment property is derecognized in, or disposed from the statement of financial position when it is permanently derecognized or retired and does not have any future economic benefit in which can be expected at its disposal. Gains or losses on derecognition or disposal of investment property is recognized in operation in the period derecognition or disposal.
Transfer to investment properties when, and only when, there is a change in use, evidenced by the end of the use by the owner, commencement of an operating lease to another party or completion of construction or development. Transfer from investment properties when, and only when, there is a change in use, evidenced by commencement of owner occupation or commencement of development for sale.
For a transfer from investment property to property that is used alone, the Company uses the cost method at the date of change in use. If the property is used by the Company to investment property, the Company recorded such property in accordance with the policy of property and equipment up to the date of change in use.
3.j. Property and Equipment Property and equipment in initial recognition is measured at cost.
Property and equipment after initial recognition is accounted using cost mode. Property and equipment is carried at cost less accumulated depreciation and accumulated impairment losses, if any.
Land is carried at cost and is not depreciated.
Depreciation is computed by using the straight line method based on the estimated useful lives of the assets as follows:
Years
Building, Infrastructure, and Renovations : 4 - 40 Parks and Interiors : 5 Golf Course and Club House : 20 Transportation Equipment and Vehicles : 4 - 8 Furniture, Fixtures and Office Equipment : 3 - 10 Tools and Medical Equipment : 3 - 10 Machinery and Project Equipment : 3 - 10 Bowling Machinery : 10 Playground Areas : 5
The cost of repairs and maintenance is charged to operation as incurred while significant renovations and additions are capitalized. When assets are retired or otherwise disposed of, the cost and the related accumulated depreciation are removed from the accounts and any resulting gains or losses are reflected in the consolidated statement of comprehensive income for the period.
These consolidated financial statements are originally issued in Indonesian language
PT LIPPO KARAWACI Tbk AND SUBSIDIARIES NOTES TO THE CONSOLIDATED FINANCIAL STATEMENTS (Continued) As of March 31, 2013 (Unaudited) and December 31, 2012 (Audited) and For the 3 (three) Months Ended March 31, 2013 and 2012 (Unaudited) (Expressed In Full Rupiah, Unless Otherwise Stated)
FD/May 7, 2013 29 paraf:
Construction in progress represents expenditures incurred directly to infrastructure development and property and equipment preparation. Expenditures include borrowing cost on loan used for developing assets during the construction period. Construction in progress is transferred to the appropriate property and equipment account when the construction is completed and ready for its intended use.
The carrying amount of property and equipment is derecognized upon disposal or when no future economic benefits are expected from its use or disposal. Any gain or loss arising on derecognition of the asset (calculated as the difference between the net disposal proceeds and the carrying amount of the asset) is credited or charged to operations in the asset is derecognized.
At the end of each financial period, residual values, useful lives and methods of depreciation are reviewed, and if appropriate, adjusted prospectively.
3.k. Leases The determination of whether an arrangement is, or contains, a lease is based on the substance of the arrangement at the inception date and whether the fulfillment of the arrangement is dependent on the use of a specific asset and the arrangement conveys a right to use the asset. Leases that transfer to the lessee substantially all of the risks and rewards incidental to ownership of the leased item are classified as finance leases. Leases which do not transfer substantially all of the risks and rewards incidental to ownership of the leased item are classified as operating leases. The Company as lessees: At the commencement of the lease term under finance lease, the Company recognized assets and liabilities in their statement of financial position at amounts equal to the fair value of the leased property or, if lower, the present value of the minimum lease payments. Each determined at the inception of the lease. The discount rate used in calculating the present value of the minimum lease payments is the rate implicit in the lease, if this is practical to determine, if not, the lessee’s incremental borrowing rate is used. Initial direct cost of the lessee are added to the amount recognized as an asset. The depreciation policy of leased asset is consistent with depreciable assets that are owned.
Under an operating lease, the Company recognizes lease payments as an expense on a straight-line basis over the lease term. The Company as lessors: The Company is required to recognize assets held under a finance lease in their statement of financial position and present them as a receivable at an amount equal to the net investment in the lease. Lease payments received are treated as repayments of principal and finance lease income. The recognition of finance lease income is based on a pattern reflecting a constant periodic rate of return on the Company‘s net investments in the finance lease. The Company is required to present assets subject to operating leases in their statement of financial position according to the nature of the asset. Initial direct costs incurred in negotiating an operating lease are added to the carrying amount of the leased asset and recognized as an expense over the lease term on the same basis as operating rental income. Contingent rents, if any, are recognized as revenue in the periods in which they are earned. Lease income from operating leases is recognized as income on a straight-line basis over the lease term. Sale and Leaseback: A sale and leaseback transaction involves the sale of an asset and leasing back the same asset. If a sale and leaseback transaction is a finance lease, any excess of sales proceeds over the carrying value is not immediately recognized as income in the financial statements of a seller (lessee) but is deferred and amortized over the lease period.

These consolidated financial statements are originally issued in Indonesian language
PT LIPPO KARAWACI Tbk AND SUBSIDIARIES NOTES TO THE CONSOLIDATED FINANCIAL STATEMENTS (Continued) As of March 31, 2013 (Unaudited) and December 31, 2012 (Audited) and For the 3 (three) Months Ended March 31, 2013 and 2012 (Unaudited) (Expressed In Full Rupiah, Unless Otherwise Stated)
FD/May 7, 2013 30 paraf:
If a sale and leaseback transaction is an operating lease, and it is clear that the transaction is established at fair value, any profit or loss is recognized immediately. If the sales price is below fair value, any profit or loss is recognized immediately except if the loss is compensated by future lease payments below market price where it is deferred and amortized in proportion to the lease payments over the period for which the asset is expected to be used. If the sales price is above fair value, the excess over fair value is deferred and amortized over the period for which the asset is expected to be used.
3.l. Borrowing Cost Interest and other financing charges incurred on loan and debt obtained to finance the acquisition and development of land and building construction are capitalized to the respective real estate inventories. Capitalization ceases upon completion of all activities related to the acquisition and development of land, or upon completion of the construction and when the assets are ready for their intended use.
3.m. Impairment of Non-Financial Assets Recoverable of assets value shall be estimated whenever events and changes of circumstances indicate that the carrying value may not be recoverable. Impairment of non-financial asset is recognized as loss for the current period.
Impairment loss been recognized in prior periods is reversed if and only if there is a change in the estimates used to determine the assets recoverable amount since the last impairment loss is recognized. Recoverable amount can be recognized only by reversing an impairment loss has been recognized.
3.n. Business Combination The Company accounts for each business combination by applying the acquisition method (includes measurement of non-controlling interest).
The consideration transferred for an acquisition is measured at the aggregate of the fair values of assets given-up, liabilities assumed and equity instruments issued by the Company. Acquisition-related costs are recognized in the profit or loss as incurred.
The Group recognizes the identifiable assets acquired and liabilities taken over at their fair value on acquisition date, except for the following:
• Deferred tax assets or liabilities that are related to assets acquired and liabilities taken over in business combination are recognized and measured in accordance with PSAK No. 46 (Revised 2010), “Income Taxes”.
• Liabilities (or assets, if any) related to employee benefit arrangement from the acquiree are recognized and measured in accordance with PSAK No. 24 (Revised 2010), “Employee Benefits”.
• Liabilities or equity instruments related to the replacement of an acquiree’s share-based payment awards are measured in accordance with PSAK No. 53 (Revised 2010), “Share-based Payment”.
• Non-current assets (or disposal groups) acquired which classified as held for sale are measured in accordance with PSAK No. 58 (Revised 2009), “Non-current Assets Held for Sale and Discontinued Operations”.
3.o. Intangible Assets Goodwill Goodwill arising in a business combination is recognized as an asset on the date that the control is acquired.
Goodwill is measured as the excess of the sum of the consideration transferred, the amount of any non-controlling interests in the acquiree, and the fair value of the acquirer’s previously held equity interest in the acquiree over the net of the acquisition date amounts of the identifiable assets acquired and the liabilities taken over.

These consolidated financial statements are originally issued in Indonesian language
PT LIPPO KARAWACI Tbk AND SUBSIDIARIES NOTES TO THE CONSOLIDATED FINANCIAL STATEMENTS (Continued) As of March 31, 2013 (Unaudited) and December 31, 2012 (Audited) and For the 3 (three) Months Ended March 31, 2013 and 2012 (Unaudited) (Expressed In Full Rupiah, Unless Otherwise Stated)
FD/May 7, 2013 31 paraf:
Goodwill is not amortized but is reviewed for impairment at least annually or more frequently when there is an indication that the goodwill may be impaired. For the purpose of impairment testing, goodwill is allocated to each of the cash-generating units expected to benefit from the synergies of the combination. If the recoverable amount of the cash-generating unit is less than its carrying amount, the impairment loss is allocated first to reduce the carrying amount of any goodwill allocated to the unit and then to the other assets of the unit prorated on the basis of the carrying amount of each asset in the unit. An impairment loss recognized for goodwill is not reversed in the subsequent period.
The negative goodwill that resulted from bargain purchases is recognized as gain in current period profit or loss. The gain is attributed to the acquirer.
If goodwill has been allocated to a cash-generating unit and certain operations on the cash-generating unit is stopped, the goodwill associated with discontinued operations are included in the carrying amount of the operation when determining the gain or loss on disposal. Goodwill removed is measured based on the relative value of discontinued operations and share of the cash-generating unit retained.
Cost of Software Software costs are initially recognized at cost or amounts attributable to these assets in the first one recognized.
Acquisition cost of accounting software is deferred and amortized using the straight line method based on the estimated of economic useful life of five (5) years.
3.p. Bond Issuance Cost Bond issued is classified into the category of financial liabilities measured at amortized cost (see Note 3.x). Therefore, bond issuance cost is deducted directly from the proceeds of the bonds. The difference between the net proceeds and the nominal value represents premium or discount which is amortized over the term of the bonds using the effective interest rate method.
3.q. Employee Benefit The Company recognizes provisions for post-employment benefits in accordance with Labor Law No. 13/2003 and PSAK No. 24 (Revised 2010) “Employee Benefits”. No funding is provided for this plan.
Short-term employee benefits Short-term employee benefits are recognized at an undiscounted amount when employees have rendered their services to the Company during the accounting period.
Post-employment Benefits Post-employment benefits are recognized at discounted amount when the employees have rendered their service to the Company during the accounting period. Liabilities and expenses are measured using actuarial techniques which include constructive obligation that arises from the Company’s common practices.
In calculating liabilities, the benefit must be discounted using the projected unit credit method. Past service cost recognized in profit or loss when the benefit become vested and recognized as expense with straight-line method for the average period of vested benefit. Accumulated unrecognized actuarial gain and loss that are more than 10% of the present value of defined benefit liabilities are amortized using the straight line method over the remaining projected average service period of employees in the programme.
3.r. Difference in Value from Restructuring Transactions between Entities Under Common Control The restructuring transactions between entities under common control, such as transfers of assets, liabilities, shares or other ownership instruments by re-organizing entities within the same group, do not represent changes of ownership in terms of economic substance, and thus, should not result in a gain or loss for the group of companies as a whole or for the individual entity in the groups.

These consolidated financial statements are originally issued in Indonesian language
PT LIPPO KARAWACI Tbk AND SUBSIDIARIES NOTES TO THE CONSOLIDATED FINANCIAL STATEMENTS (Continued) As of March 31, 2013 (Unaudited) and December 31, 2012 (Audited) and For the 3 (three) Months Ended March 31, 2013 and 2012 (Unaudited) (Expressed In Full Rupiah, Unless Otherwise Stated)
FD/May 7, 2013 32 paraf:
Since restructuring transactions with entities under common control do not result in changes in term of economic substance of ownership in transferred assets, liabilities or other ownership instruments, the transferred assets or liabilities (in legal form) should be recorded at book value in a manner similar to business combination transactions using the pooling of interest method.
The difference between transfer price and book value does not represent goodwill. Such difference is recorded in the account “Difference in Value from Restructuring Transactions between Entities under Common Control” and is presented as a component of equity.
3.s. Derivative Financial Instruments In implementing risk management to the volatility of foreign currency, the Company has entered into several derivative agreements with third parties.
Derivative Instruments are recognized based on its fair value and classified as financial asset and/or financial liabilities. Changes in the fair value are recognized as gain or loss in the current period.
3.t. Revenue and Expense Recognition The Company and subsidiaries recognize revenues from the sale of real estate using the full accrual method. Revenues of real estate sales is fully recognized if the following conditions for each type of sale are met:
For the sale of parcel of vacant land, the criteria that should be met are as follows: a. The payments received from the buyer have reached 20% of the agreed selling price and the
amount is non-refundable; b. The collectibility of the selling price can be reasonably assured; c. The receivables from the sale is not subject to future subordination against other loans which will be
obtained by the buyer; d. The process of land development has been completed thus the seller is not obliged to develop the
sold lots such as the obligation to construct lot of land and or obligation to develop main infrastructure promised by the seller, in accordance with the sales and purchase agreement or any regulation requirements; and
e. The sale consists only of the vacant land, without any obligation on the part of the seller to construct a building on the land sold.
For the sale of residential houses, shophouses and other similar types of buildings, including parcel of land, the criteria that should be met are as follows: a. The sale is consummated; b. The collectibility of the selling price can reasonably assured; c. The receivables from the sale is not subject to future subordination against other loans which will be
obtained by the buyer; and d. The seller has transferred to the buyer the usual risks and rewards of ownership through a
transaction which represents a sale in substance and the seller does not have substantial continuing involvement with such property.
If a real estate sale fails to meet all the criteria of full accrual method, revenue recognition is deferred and the transaction is recognized using the deposit method until all of the conditions of full accrual method are fulfilled.
The revenue from shopping centers and apartments are recognized based on the percentage of completion method, if all of the following criteria are met: a. The construction process has already beyond preliminary stage, that is, the building foundation has
been completed and all of the requirements to start the construction have been fulfilled; b. Total payments received from the buyer is at least 20% of the contract sales price and that such
amount is not refundable; and

These consolidated financial statements are originally issued in Indonesian language
PT LIPPO KARAWACI Tbk AND SUBSIDIARIES NOTES TO THE CONSOLIDATED FINANCIAL STATEMENTS (Continued) As of March 31, 2013 (Unaudited) and December 31, 2012 (Audited) and For the 3 (three) Months Ended March 31, 2013 and 2012 (Unaudited) (Expressed In Full Rupiah, Unless Otherwise Stated)
FD/May 7, 2013 33 paraf:
c. The amount of revenue and cost of the unit property can reasonably be estimated.
The method used to determine the level of development activity completion is based on a percentage of actual activities accomplished to total development activities that need to be accomplished. Cost of land lots sold is determined based on the estimated acquisition cost of the land plus other estimated expenditures for its improvements and developments. The cost of residential houses and shophouses sold is determined based on actual cost incurred and estimated cost to complete the work. The estimated cost to complete is included in the “Accrued Expenses” account which is presented in the consolidated statements of financial position. The difference between the estimated cost and the actual cost of construction or development is charged to “Cost of Sales” in the current period.
Revenues from medical services are recognized when medical services are rendered or when medical supplies are delivered to patients.
Rental revenue and other services are recognized based on their respective rental periods and when the services are rendered to the customers. Rental and membership paid in advances are presented as deferred income and recognized as revenue over the period benefit.
Expenses are recognized when incurred.
3.u. Income Tax Final Income Tax Final income tax expense is recognized proportionately with the accounting income recognized during the period. The difference between the final income tax paid and the final tax expense in the profit or loss for the period is recognized as prepaid tax or tax payable. If the income is already subjected to final income tax, the differences between the consolidated financial statements carrying value of existing assets and liabilities and their tax bases are not recognized as deferred tax assets or liabilities.
Non-Final Income Tax Current income tax is calculated from taxable income, the earnings that have been adjusted to the appropriate tax rules.
Amendments to taxation liabilities are recorded when an assessment is received or, if appealed against, when the results of the appeal are determined.
Current tax assets dan current tax liabilites are offset if, and only if, the entity: 1) has a legally enforceable right to set off the recognised amount; and 2) intents to settle in net basis, or realises and settles the asset and liability simultaneously.
All temporary differences between the tax bases of assets and liabilities and their carrying value for financial reporting purposes are recognized as deferred tax using balance sheet liability method. Currently or substantially enacted tax rates are used to determine deferred income tax.
Deferred tax assets dan deferred tax liabilites are offset if, and only if, the entity: 1) has a legally enforceable right to set off current tax asset against current tax liability; and 2) the deferred tax asset and the deferred tax liability relate to income taxes levied by the same tax
authority on the same taxable entity.
3.v. Earnings per Share Basic earnings per share (EPS) is calculated by dividing profit attributable to ordinary shares holder of the parent entity by the weighted average number of common stocks in the one (1) reporting period. Diluted EPS accounted for other securities potentially have dilutive effect to ordinary shares which are outstanding during the reporting period.

These consolidated financial statements are originally issued in Indonesian language
PT LIPPO KARAWACI Tbk AND SUBSIDIARIES NOTES TO THE CONSOLIDATED FINANCIAL STATEMENTS (Continued) As of March 31, 2013 (Unaudited) and December 31, 2012 (Audited) and For the 3 (three) Months Ended March 31, 2013 and 2012 (Unaudited) (Expressed In Full Rupiah, Unless Otherwise Stated)
FD/May 7, 2013 34 paraf:
3.w. Segment Information Segment information of the Company and subsidiaries are presented based on operating segment.
Operating segment is a component of an entity that engages in business activities whose operating results are regularly reviewed by the management and for which discrete financial information is available.
The Company organized its business into six (6) operating segments: (i) Urban development, which comprises, among others, activities in real estate, urban development,
land acquisition and clearing, land development and excavation and infrastructure development. (ii) Large scale integrated development, which comprises, among others, activities in real estate in
large scale integrated development project and its infrastructure development. (iii) Retail malls, which comprises among others, activities in real estate in development and
management of shopping center. (iv) Healthcare, which comprises activities in health services. (v) Hospitality and infrastructure, which comprise, among others, activities in hotels, restaurants, town
management and water and sewage treatment, recreation center, transportation and maintenance services.
(vi) Property and portfolio management, which comprises, among others, activities in management services.
The above operating segments are strategic business units that offer different products and services. Products and services are managed separately because each business requires market strategies and different resources. The accounting policies for operating segments are the same as described in this summary of significant accounting policies.
3.x. Financial Instruments
Financial Assets Financial assets are classified into four (4) categories, as follows (i) financial assets measured at fair value through profit or loss (FVTPL), (ii) loans and receivables, (iii) held-to-maturity financial assets (HTM financial assets) and (iv) available-for-sale financial assets (AFS financial assets). The classification depends on the purpose for which the financial assets were acquired. The management determines the classification of its financial assets at initial recognition.
(i) Financial assets measured at FVTPL Financial assets measured at FVTPL are financial assets which are held for trading. Financial asset is classified as held for trading if it is acquired principally for the purpose of selling or repurchasing it in the near term and for which there is evidence of recent actual pattern of short-term profit taking. Derivatives are also categorized as held for trading unless they are designated and effective as hedging instruments.
At the time of initial recognition, financial assets at fair value through profit or loss are recognized at fair value plus transaction costs and subsequently measured at fair value.
(ii) Loans and receivables Loans and receivables are non-derivative financial assets with fixed or determinable payments that are not quoted in an active market. Loans and receivables are initially recognized at fair value plus transaction costs and are subsequently measured at amortized cost using the effective interest rate method.
(iii) HTM financial assets HTM financial assets are non-derivative financial assets with fixed or determinable payments and fixed maturities that management has the positive intention and ability to hold to maturity, other than: a. Those that are designated as financial assets measured at FVTPL upon initial recognition;

These consolidated financial statements are originally issued in Indonesian language
PT LIPPO KARAWACI Tbk AND SUBSIDIARIES NOTES TO THE CONSOLIDATED FINANCIAL STATEMENTS (Continued) As of March 31, 2013 (Unaudited) and December 31, 2012 (Audited) and For the 3 (three) Months Ended March 31, 2013 and 2012 (Unaudited) (Expressed In Full Rupiah, Unless Otherwise Stated)
FD/May 7, 2013 35 paraf:
b. Those that are designated as AFS financial assets; and c. Those that meet the definition of loans and receivables.
These are initially recognized at fair value including transaction costs and are subsequently measured at amortized cost, using the effective interest rate method.
(iv) AFS financial assets AFS financial assets are non-derivative financial assets that are intended to be held for an indefinite period of time, which might be sold in response to needs for liquidity or changes in interest rates, exchange rates or that are not classified as loans and receivables, HTM financial assets or financial assets measured at FVTPL.
AFS financial assets are initially recognized at fair value, plus transaction cost, and are measured subsequently at fair value with gains and losses being recognized in the consolidated statements of changes in equity, except for impairment losses and foreign exchange gains and losses, until the financial assets is derecognized. If AFS financial assets are determined to be impaired, the cumulative gain or loss previously recognized as other comprehensive income will be recognized as gain in the current period. Interest income is calculated using the effective interest method and foreign exchange gains or losses on monetary assets classified as AFS financial assets is recognized as gain or loss in the current period.
Impairment of Financial Assets Financial assets, other than measured at FVTPL, are assessed for indicators of impairment at each reporting date. Financial assets are impaired where there is objective evidence that, as a result of one or more events that occurred after the initial recognition of the financial asset, the estimated future cash flows of the investment have been impacted.
For listed and unlisted equity investments classified as AFS financial assets, a significant or prolonged decline in the fair value of the security below its cost is considered to be an objective evidence of impairment.
For all other financial assets, objective evidence of impairment could include:
• significant financial difficulty of the issuer or counterparty; or
• default or delinquency in interest or principal payments; or
• it becoming probable that the borrower will enter bankruptcy or financial reorganization.
For certain categories of financial asset, such as receivables, the impairment value of assets are assessed individually. Objective evidence of impairment for a portfolio of receivables could include the Company’s past experience of collecting payments, an increase in the number of delayed payments in the portfolio past the average credit period, as well as observable changes in national or local economic conditions that correlate with default on receivables.
For financial assets carried at amortized cost, the amount of the impairment is the difference between the asset’s carrying amount and the present value of estimated future cash flows, discounted at the financial asset’s original effective interest rate.
The carrying amount of the financial asset is reduced by the impairment loss directly for all financial assets with the exception of receivables, where the carrying amount is reduced through the use of an allowance account. When a receivable is considered uncollectible, it is written-off against the allowance account. Subsequent recoveries of amounts previously written-off are credited against the allowance account. Changes in the carrying amount of the allowance account are recognized as gain or loss in the current period.
These consolidated financial statements are originally issued in Indonesian language
PT LIPPO KARAWACI Tbk AND SUBSIDIARIES NOTES TO THE CONSOLIDATED FINANCIAL STATEMENTS (Continued) As of March 31, 2013 (Unaudited) and December 31, 2012 (Audited) and For the 3 (three) Months Ended March 31, 2013 and 2012 (Unaudited) (Expressed In Full Rupiah, Unless Otherwise Stated)
FD/May 7, 2013 36 paraf:
When an AFS financial asset is considered to be impaired, cumulative gains or losses previously recognized in equity are reclassified to the consolidated statements of comprehensive income.
With the exception of AFS equity instruments, if, in a subsequent period, the amount of the impairment loss decreases and the decrease can be related objectively to an event occurring after the impairment was recognized, the previously recognized impairment loss is reversed as profit to the extent that the carrying amount of the investment on the date the impairment is reversed does not exceed what the amortized cost would have been had the impairment not been recognized.
In respect of AFS equity securities, impairment losses previously recognized as loss are not reversed through profit for the period. Any increase in fair value subsequent to an impairment loss is recognized directly to other comprehensive income.
Derecognition of Financial Assets The Company derecognizes a financial asset only when the contractual rights to the cash flows from the asset expire, or when it transfers the financial asset and substantially all the risks and rewards of ownership of the asset to another entity. If the Company neither transfers nor retains substantially all the risks and rewards of ownership and continues to control the transferred asset, the Company recognizes its retained interest in the asset and an associated liability for amounts it may have to pay. If the Company retains substantially all the risks and rewards of ownership of a transferred financial asset, the Company continues to recognize the financial asset and also recognizes a collateralized borrowing for the proceeds received.
Financial Liabilities Financial liabilities are classified into the category of (i) financial liabilities measured at FVTPL and (ii) financial liabilities measured at amortized cost. (i) Financial liabilities measured at FVTPL
Financial liabilities measured at FVTPL are financial liabilities which are held for trading. A financial liability is classified as held for trading if it is acquired principally for the purpose of selling or repurchasing it in the near term and for which there is evidence of a recent actual pattern of short term profit taking. Derivatives are also categorized as held for trading unless they are designated and effective as hedging instruments.
(ii) Financial liabilities measured at amortized cost Financial liabilities that are not classified as financial liabilities at FVTPL are categorized and measured at amortized cost using effective interest rate method.
Derecognition of Financial Liabilities The Company derecognizes financial liabilities when, and only when, the Company’s obligations are discharged, cancelled or expired. Equity Instruments Equity instrument is any contract that evidences a residual interest in the assets of an entity after deducting all of its liabilities. The equity instruments issued by the Company are recognized at net proceeds after deducting the cost of its issuance.
Reacquisition of the Company's own equity instruments are recognized as treasury stock at cost and deducted from capital stock.

These consolidated financial statements are originally issued in Indonesian language
PT LIPPO KARAWACI Tbk AND SUBSIDIARIES NOTES TO THE CONSOLIDATED FINANCIAL STATEMENTS (Continued) As of March 31, 2013 (Unaudited) and December 31, 2012 (Audited) and For the 3 (three) Months Ended March 31, 2013 and 2012 (Unaudited) (Expressed In Full Rupiah, Unless Otherwise Stated)
FD/May 7, 2013 37 paraf:
Offsetting of Financial Instruments Financial assets and liabilities are offset and the net amount is reported in the consolidated statements of financial position when there is a legally enforceable right to offset the recognised amounts and there is an intention to settle on a net basis, or realise the asset and settle the liability simultaneously.
Fair Value The fair value of financial assets and financial liabilities must be estimated for recognition and measurement or for disclosure purposes.
PSAK No. 60, ”Financial Instruments: Disclosures” requires disclosure of fair value measurements by level of the following fair value measurement hierarchy: (i) quoted prices (unadjusted) in active markets for identical assets or liabilities (level 1) (ii) inputs other than quoted prices included within level 1 that are observable for the asset or liability,
either directly (as prices) or indirectly (derived from prices) (level 2), and (iii) inputs for the asset or liability that are not based on observable market data (unobservable inputs)
(level 3).
The fair value of financial instruments traded in active markets is based on quoted market prices at the reporting date. The quoted market price used for financial assets held by the Group is the current bid price, while financial liabilities use ask price. These instruments are included in level 1.
The fair value of financial instruments that are not traded in an active market is determined using valuation techniques. These valuation techniques maximize the use of observable market data where it is available and rely as minimum as possible on estimates. If all significant inputs required to fair value an instrument are observable, the instrument is included in level 2.
If one or more of the significant inputs is not based on observable market data, the instrument is included in level 3. This is the case for unlisted equity securities.
3.y. Assumptions and Sources of Estimation Uncertainty The preparation of financial statements in accordance with the Indonesian Financial Accounting Standards requires the management to make assumptions and estimates that could affect the carrying amounts of certain assets and liabilities at end of reporting period.
In the preparation of these consolidated financial statements, accounting assumptions have been made in the process of applying accounting policies that may affect the carrying amounts of assets and liabilties in financial statements. In addition, there are accounting assumptions about the sources of estimation uncertainty at end of reporting period that could materially affect the carrying amounts of assets and liabilities in the subsequent reporting period. The management periodically reviews them to ensure that the assumptions and estimates have been made based on all relevant information available on the date in which the consolidated financial statements have been prepared. Because there is inherent uncertainty in making estimates, the value of assets and liabilities to be reported in the future might differ from those estimates. At the reporting date, the management has made significant assumptions and estimates which have the most significant impact to the carrying amount recognized in the consolidated financial statements, as follows: Allowance for Doubtful Accounts In general, the management analyzes the adequacy of the allowance for doubtful accounts based on several data, which include analyzing historical bad debts, the concentration of each customer's accounts receivable, credit worthiness and changes in a given period of repayment. The analysis is carried out

These consolidated financial statements are originally issued in Indonesian language
PT LIPPO KARAWACI Tbk AND SUBSIDIARIES NOTES TO THE CONSOLIDATED FINANCIAL STATEMENTS (Continued) As of March 31, 2013 (Unaudited) and December 31, 2012 (Audited) and For the 3 (three) Months Ended March 31, 2013 and 2012 (Unaudited) (Expressed In Full Rupiah, Unless Otherwise Stated)
FD/May 7, 2013 38 paraf:
individually on a significant amount of accounts receivable, while the insignificant group of accounts receivable is carried on the collective basis. At the reporting date, the carrying amount of accounts receivable has been reflected at fair value and the carrying value may change materially in the subsequent reporting period, but the change, however, will not be attributable to the assumptions and estimates made as of this reporting date. Deferred Tax Assets Estimation Management considerations are needed to determine the amount of deferred tax recognized in the profit or loss and the amount recorded as deferred tax assets. Recognition is performed only if it is probable that the asset will be recovered in the form of economic benefits to be received in future periods, in which the temporary differences and tax losses can still be used. Management also considers the future estimated taxable income and strategic tax planning in order to evaluate its deferred tax assets in accordance with applicable tax laws and its updates. As a result, related to its inherent nature, it is likely that the calculation of deferred taxes is related to a complex pattern where assessment requires a judgment and is not expected to provide an accurate calculation. Useful Lives of Property and Equipment Estimation The Company makes a periodic review of the useful lives of property and equipment based on several factors such as physical and technical conditions and development of medical equipment technology in the future. The results of future operations will be materially influenced by the change in estimate as caused by changes in the factors mentioned above. Changes in estimated useful life of property and equipment, if any, are prospectively treated in accordance with PSAK No. 25 (Revised 2010), “Accounting Policies, Changes in Accounting Estimates and Errors”. Post-employment Benefits The present value of post-employment benefits liability depends on several factors that are determined by actuarial basis based on several assumptions. Assumptions used to determine the cost (income) include the discount rate. Changes in these assumptions will affect the carrying amount of post-employment benefits.
The Company determines the appropriate discount rate at the end of the reporting period by the interest rate used to determine the present value of future cash outflows expected to settle an estimated liability. In determining the appropriate level of interest rates, the Company considers the interest rate of government bonds denominated in Rupiah that has a similar period to the corresponding period of liability.
Other key assumption is partly determined by current market conditions, during the period in which the post-employment benefits liability is resolved. Changes in the employee benefits assumption will impact on recognition of actuarial gains or losses at the end of the reporting period.
Revenue Recognition - Percentage of Completion Method Revenue from the sale of shopping centers and apartment units are recognized using the percentage of completion method. By this method, revenue is recognized proportionately with the amount of load that generates revenue. As a consequence, the sales proceeds that can not be recognized as revenue are recognized as a liability until the sale have met the criteria for revenue recognition.
To determine the percentage of completion of the development activities of shopping centers and apartment units, the management uses physical progress approach that is determined based on the survey report for each project or the part of project (e.g., for each tower of apartment). The management conducted a review of the determination of the estimated percentage of completion and it realized that a negligence in determining the percentage of completion at the reporting date can result in revenue recognition errors for the subsequent reporting period, in which the material error correction will be carried out retrospectively.

These consolidated financial statements are originally issued in Indonesian language
PT LIPPO KARAWACI Tbk AND SUBSIDIARIES NOTES TO THE CONSOLIDATED FINANCIAL STATEMENTS (Continued) As of March 31, 2013 (Unaudited) and December 31, 2012 (Audited) and For the 3 (three) Months Ended March 31, 2013 and 2012 (Unaudited) (Expressed In Full Rupiah, Unless Otherwise Stated)
FD/May 7, 2013 39 paraf:
Fair Value of Financial Instruments If the fair value of financial assets and liabilities recorded in the statement of financial position is not available in active market, it is determined using valuation techniques including the use of mathematical model. Input for this model derived from observable market data throughout the available data. When observable market data is not available, management judgment is required to determine the fair value. The considerations include liquidity and input models such as volatility for long-term derivative transactions and discount rates, prepayments, and default rate assumptions.
4. Cash and Cash Equivalent
March 31, 2013 December 31, 2012
Rp Rp
Cash on Hand
(including 2013: USD 3,250, SGD 500, EUR 4,800, JPY 113,800,
AUD 6,376; 2012: USD 3,250, SGD 500, EUR 4,800,
JPY 113,800, AUD 6,376) 10,110,737,297 9,307,779,111
Bank
Third Parties
Rupiah
PT Bank CIMB Niaga Tbk 145,228,217,764 129,707,798,230
PT Bank Negara Indonesia (Persero) Tbk 88,328,847,173 80,223,863,725
PT Bank Central Asia Tbk 31,404,921,813 40,050,618,165
PT Bank Mega Tbk 28,603,016,879 11,194,542,012
PT Bank Mandiri (Persero) Tbk 15,911,734,249 34,886,669,598
PT Bank Rakyat Indonesia (Persero) Tbk 18,016,656,521 12,333,502,387
PT Bank Permata Tbk 16,164,899,959 18,791,733,654
PT Bank Pan Indonesia Tbk 15,166,995,723 18,319,316,504
PT Bank Danamon Indonesia Tbk 10,207,984,727 9,848,253,087
PT Bank Internasional Indonesia Tbk 3,024,137,108 3,115,268,104
PT Bank Tabungan Negara (Persero) Tbk 1,827,427,453 1,199,769,407
PT Bank OCBC NISP Tbk 1,949,340,658 4,548,033,988
Others (each below Rp 1 billion) 2,248,791,421 8,638,664,103
Foreign Currencies
PT Bank CIMB Niaga Tbk
USD 14,539,449,330 27,145,353,240
SGD 192,804,632,586 295,514,138,459
DBS Bank, Singapore
USD 300,738,710 299,218,810
SGD 60,038,091,492 50,263,035,739
Credit Suisse, Singapore
USD 57,602,900,115 18,127,072,560
SGD 2,703,043,676 2,692,942,339
PT Bank OCBC NISP Tbk
USD 5,486,506,804 2,353,813,380
SGD 33,866,540,519 75,788,595
EUR 77,311,500 49,213,168
OCBC Bank, Singapore - SGD 23,216,337,356 28,267,161,278
PT Bank Mega Tbk
USD 978,670,505 381,365,460
SGD 3,135,661,119 3,482,361,405
Deutchbank, Singapore
USD 29,610,586 8,677,055,390
EUR -- 15,295,140
Others (each below Rp 1 billion) 1,504,076,481 783,712,505

These consolidated financial statements are originally issued in Indonesian language
PT LIPPO KARAWACI Tbk AND SUBSIDIARIES NOTES TO THE CONSOLIDATED FINANCIAL STATEMENTS (Continued) As of March 31, 2013 (Unaudited) and December 31, 2012 (Audited) and For the 3 (three) Months Ended March 31, 2013 and 2012 (Unaudited) (Expressed In Full Rupiah, Unless Otherwise Stated)
FD/May 7, 2013 40 paraf:
March 31, 2013 December 31, 2012
Rp Rp
Related Party
Rupiah
PT Bank Nationalnobu 109,483,990,320 98,581,620,560
883,850,532,547 909,567,180,992
Time Deposits
Third Parties
Rupiah
PT Bank CIMB Niaga Tbk 511,099,156,825 518,524,424,084
PT Bank Negara Indonesia (Persero) Tbk 95,718,442,022 127,292,560,884
PT Bank Mega Tbk 82,133,851,545 188,912,845,253
PT Bank Mandiri (Persero) Tbk 62,687,849,499 120,459,344,960
PT Bank Rakyat Indonesia (Persero) Tbk 47,500,000,000 25,292,443,862
PT Bank Permata Tbk 29,284,426,000 47,832,276,000
PT Bank Central Asia Tbk 10,936,580,000 --
PT Bank ICBC Indonesia 10,000,000,000 40,915,867,706
PT Bank Internasional Indonesia Tbk 9,062,019,985 8,900,000,000
PT Bank Danamon Indonesia Tbk 9,015,661,327 16,202,900,000
PT Bank Mayapada International Tbk 5,289,606,244 5,289,606,244
Others (each below Rp 1 billion) 383,500,000 5,580,079,999
Foreign Currencies
PT Bank CIMB Niaga Tbk - USD 393,727,764,767 324,053,264,767
PT Bank OCBC NISP Tbk
USD 274,712,219,169 467,216,209,399
SGD 78,220,655,443 --
PT Bank ICBC Indonesia - USD 147,024,931,943 293,807,631,270
PT Bank Permata Tbk
USD 73,151,947,150 --
SGD 39,080,000,000 --
BNP Paribas, Singapore - SGD 45,750,849,233 204,393,392,370
OCBC Bank, Singapore - SGD 23,535,581,318 23,809,601,018
1,948,315,042,470 2,418,482,447,816
Total Cash and Cash Equivalent 2,842,276,312,314 3,337,357,407,919
Interest rates and maturity period of the time deposits are as follows:
March 31, 2013 December 31, 2012
Interest Rate
Rupiah 3.00% - 6.50% 3.00% - 6.50%
Foreign Currencies 0.50% - 3.00% 0.50% - 3.00%
Maturity Period 0 - 3 Months 0 - 3 Months
5. Trade Accounts Receivable
March 31, 2013 December 31, 2012
Rp Rp
Third Parties
Urban Development:
Land Lots 53,990,183,898 47,118,798,821
Memorial Park 27,272,076,329 26,217,649,551
Residential Houses and Shophouses 20,690,064,802 19,077,568,342
Asset Enhancements 6,085,839,123 9,636,491,706
Subtotal 108,038,164,152 102,050,508,420

These consolidated financial statements are originally issued in Indonesian language
PT LIPPO KARAWACI Tbk AND SUBSIDIARIES NOTES TO THE CONSOLIDATED FINANCIAL STATEMENTS (Continued) As of March 31, 2013 (Unaudited) and December 31, 2012 (Audited) and For the 3 (three) Months Ended March 31, 2013 and 2012 (Unaudited) (Expressed In Full Rupiah, Unless Otherwise Stated)
FD/May 7, 2013 41 paraf:
March 31, 2013 December 31, 2012
Rp Rp
Large Scale Integrated Development:
Apartments 52,826,061,181 47,602,891,467
Asset Enhancements 12,113,970,699 11,785,585,241
Subtotal 64,940,031,880 59,388,476,708
Retail Malls:
Shopping Centers 22,694,495,347 22,622,841,440
Asset Enhancements 53,834,036,028 42,368,048,834
Subtotal 76,528,531,375 64,990,890,274
Healthcare:
Inpatient and Outpatient 257,431,261,534 208,658,013,118
Hospitality and Infrastructure:
Town Management and Water Treatment 107,407,117,638 102,204,239,435
Hotels and Restaurants 23,918,215,394 19,629,084,137
Recreations and Sports 225,736,501 109,368,310
Others 1,171,684,096 2,396,541,858
Subtotal 132,722,753,629 124,339,233,740
Property and Portfolio Management:
Management Fee 115,656,261,136 78,242,646,521
Total Trade Accounts Receivable from Third Parties 755,317,003,706 637,669,768,781
Less : Allowance for Impairment in Value (46,211,426,871) (46,463,775,446)
Trade Accounts Receivable from Third Parties - Net 709,105,576,835 591,205,993,335
Related Parties
Healthcare:
Inpatient and Outpatient 3,427,355,927 3,171,020,453
Total Trade Accounts Receivable - Net 712,532,932,762 594,377,013,788
The movements in allowance for impairment are as follows: March 31, 2013 December 31, 2012
Rp Rp
Third Parties
Beginning Balances 46,463,775,446 44,731,336,807
Addition (Reversal) (252,348,575) 1,732,438,639
Ending Balance 46,211,426,871 46,463,775,446
Additional (reversal) of allowance for impairment of accounts receivable is based on the review of the status of debtors at the end of the period.
Trade accounts receivable of PT Golden First Atlanta and PT Lippo Cikarang Tbk, subsidiaries, are pledged as collateral for the loans obtained from PT Bank Central Asia Tbk and PT Bank ICBC (see Notes 20 and 22).
Management believes that the allowance for impairment is adequate to cover the possibility of uncollectible trade accounts receivable.
Trade accounts receivable denominated in Rupiah currency and foreign currencies. Trade accounts receivable in foreign currencies are presented in Note 42.

These consolidated financial statements are originally issued in Indonesian language
PT LIPPO KARAWACI Tbk AND SUBSIDIARIES NOTES TO THE CONSOLIDATED FINANCIAL STATEMENTS (Continued) As of March 31, 2013 (Unaudited) and December 31, 2012 (Audited) and For the 3 (three) Months Ended March 31, 2013 and 2012 (Unaudited) (Expressed In Full Rupiah, Unless Otherwise Stated)
FD/May 7, 2013 42 paraf:
6. Other Current Financial Assets
March 31, 2013 December 31, 2012
Rp Rp
Third Parties
Available-for-Sale Financial Assets 4,544,475,705,305 4,158,569,472,925
Other Accounts Receivable 300,903,229,042 287,579,069,808
Call Spread Option (See Note 40.c) 126,780,732,531 101,878,348,847
Dividend 55,689,870,016 55,409,100,016
Total Other Current Financial Assets 5,027,849,536,894 4,603,435,991,596
Available-for-Sale Financial Assets March 31, 2013 December 31, 2012
Rp Rp
Acquisition Cost
Lippo Malls Indonesia Retail Trust (LMIRT)
(2013: 664,546,104 units; 2012: 661,994,507 units) 2,223,695,079,161 2,239,947,255,131
First REIT (2013: 191,352,932 units; 2012: 190,148,936 units) 1,019,547,551,916 1,021,397,175,693
Foreign Exchange Translation (6,536,348,552) 4,919,478,581
Accumulated Unrealized Gain (Loss):
Charged to Consolidated Statements of Comprehensive Income (1,949,311,917) (1,949,311,917)
Charged to Other Comprehensive Income 1,309,718,734,697 894,254,875,437
1,307,769,422,780 892,305,563,520
Total Available-for-Sale Financial Assets 4,544,475,705,305 4,158,569,472,925
Available-for-Sale Financial Assets is an investment in REIT’s units which are listed on the Singapore Stock Exchange (SGX). The quoted market price of REIT units as of March 31, 2013 and December 31, 2012 are SGD 1.250 and SGD 1.060, respectively, for First REIT units and SGD 0.515 and SGD 0.490, respectively, for LMIR Trust units.
Other Accounts Receivable March 31, 2013 December 31, 2012
Rp Rp
PT Bayutama Sukses 70,190,133,700 70,390,133,700
PT Bina Bangun Bersama 43,049,399,218 35,594,938,918
PT Palembangparagon Mall 25,163,567,059 25,163,567,059
PT Amanda Cipta Utama 14,789,445,540 14,789,445,540
Tenant Association for Apartments, Condominium and Shopping Centers 2,122,579,847 2,122,579,847
Others 151,941,397,640 145,871,698,706
Subtotal 307,256,523,004 293,932,363,770
Less: Allowance for Impairment (6,353,293,962) (6,353,293,962)
Total Other Accounts Receivable - Net 300,903,229,042 287,579,069,808
Receivables from PT Bayutama Sukses arisen from the sale of land and building of Siloam Hospitals Makassar (see Note 40.b).
Receivables from PT Bina Bangun Bersama represents loan for capital expenditures.
Receivables from PT Amanda Cipta Utama, are receivables incurred from the sale of shopping center (Mall Binjai) to PT Amanda Cipta Utama, a subsidiary of Lippo Malls Indonesia Retail Trust (LMIRT).
The Company and subsidiaries’ management believes that allowance for impairment is adequate to cover the possibility of uncollectible other accounts receivable.

These consolidated financial statements are originally issued in Indonesian language
PT LIPPO KARAWACI Tbk AND SUBSIDIARIES NOTES TO THE CONSOLIDATED FINANCIAL STATEMENTS (Continued) As of March 31, 2013 (Unaudited) and December 31, 2012 (Audited) and For the 3 (three) Months Ended March 31, 2013 and 2012 (Unaudited) (Expressed In Full Rupiah, Unless Otherwise Stated)
FD/May 7, 2013 43 paraf:
Dividend Receivable This account represents dividend receivable of Bridgewater International Ltd., Bowsprit Capital Corporation Ltd. and LMIRT Management Ltd, all subsidiaries, from their investments in REIT.
7. Inventory
March 31, 2013 December 31, 2012
Rp Rp
Urban Development:
Land under Development 4,595,570,713,624 4,441,343,827,753
Residential Houses and Shophouses 1,551,397,539,844 1,321,841,687,126
Apartments 87,614,757,782 145,422,589,589
Others 11,428,827,027 7,793,803,941
Subtotal 6,246,011,838,277 5,916,401,908,409
Large Scale Integrated Development:
Apartments 1,105,576,027,917 1,014,367,240,165
Land under Development 1,065,879,713,733 956,703,559,877
Shopping Centers 1,660,126,984,322 1,490,437,382,066
Subtotal 3,831,582,725,972 3,461,508,182,108
Retail Malls:
Shopping Centers 884,467,069,096 866,024,872,411
Land under Development 180,786,564,345 180,405,712,678
Subtotal 1,065,253,633,441 1,046,430,585,089
Healthcare:
Medical and Non Medical Supplies 76,361,142,954 75,351,731,878
Hospitality and Infrastructure:
Hotels and Restaurants 4,225,868,558 4,465,066,863
Recreation and Sports 640,439,667 357,549,757
Others 152,704,620 434,054,980
Less: Allowance for Decline in Inventory Value (39,505,683) (39,505,683)
Subtotal 4,979,507,162 5,217,165,917
Total Inventory - Net 11,224,188,847,806 10,504,909,573,401
In 2012, property and equipment amounting to Rp 285,353,263,373 was reclassified to inventory (see Note 13).
Interests and other borrowing costs from bonds (see Note 23), loans obtained from PT Bank ICBC Indonesia and PT Bank Negara Indonesia (Persero) Tbk (see Note 20) have been capitalized into land under development for the 3 (three) months ended March 31, 2013 and for the year ended December 31, 2012 amounting to Rp 121,000,863,576 and Rp 373,269,545,889, respectively.
As of March 31, 2013, land under development consisted of land covering a net area of approximately 33 hectares in Kelapa Dua and Bencongan Village, 8 hectares in Jalan Lingkar Luar Barat - Puri Kembangan, 10 hectares in Mampang Prapatan District, 20 hectares in West Panunggangan Village, 26 hectares in Binong Village, 2 hectares in Kelapa Indah Village, 10 hectares in Bonang Village, 20 hectares in Sukanagalih Village, 98 hectares in Margakaya Village, Telukjambe, Karawang, 120 hectares in Cibatu Village, 35 hectares in Serang Village, 32 hectares in Sukaresmi Village, 46 hectares in Cicau Village, 3 hectares in Kuta, Bali, 49 hectares in Jaya Mukti Village, 25 hectares in Tanjung Merdeka Village, 23 hectares in Macini Sombala Village, 14 hectares in Tamanyeleng Village, 32 hectares in Barombong Village and 14 hectares in Mariso District.

These consolidated financial statements are originally issued in Indonesian language
PT LIPPO KARAWACI Tbk AND SUBSIDIARIES NOTES TO THE CONSOLIDATED FINANCIAL STATEMENTS (Continued) As of March 31, 2013 (Unaudited) and December 31, 2012 (Audited) and For the 3 (three) Months Ended March 31, 2013 and 2012 (Unaudited) (Expressed In Full Rupiah, Unless Otherwise Stated)
FD/May 7, 2013 44 paraf:
Medical supplies and consumables of PT Golden First Atlanta, a subsidiary, are pledged as collateral for the loan obtained from PT Bank Central Asia Tbk (see Notes 20 and 22).
Land under development owned by PT Lippo Cikarang Tbk, a subsidiary, with a total area of 22.1 hectares and 12.7 hectares are pledged as collateral for the loans obtained from PT Bank ICBC Indonesia and PT Bank Negara Indonesia (Persero) Tbk (see Note 20).
The Company and subsidiaries’ management is in the opinion that there is no impairment in the carrying value of inventories as of March 31, 2013.
The Company’s and subsidiaries’ inventories have been insured against all risks, based on a certain insurance policy package to PT Lippo General Insurance Tbk, related party and PT Asuransi Bintang Tbk, third party with the insured amount of Rp 6,186 billion as of March 31, 2013 and December 31, 2012, respectively. The Company and subsidiaries’ management believe that the insured amount is adequate to cover any possible losses.
8. Prepaid Expenses
March 31, 2013 December 31, 2012
Rp Rp
Rental 93,115,847,990 92,532,188,011
Others 36,452,293,105 16,682,708,705
Total Prepaid Expenses 129,568,141,095 109,214,896,716
Prepaid expenses mainly represent rental of hospital and hotel properties leased from First REIT (see Note 40.b).
9. Other Non-Current Financial Assets
March 31, 2013 December 31, 2012
Rp Rp
Restricted Funds 1,597,139,008,953 344,302,236,769
Other Investments 58,329,023,011 58,329,023,011
Total Other Non-Current Financial Assets 1,655,468,031,964 402,631,259,780
Restricted Funds Restricted fund represents the Company’s and subsidiaries’ time deposits placement in relation to mortgages agreements (KPR and KPA) entered by the Company and subsidiaries with their respective banks. These deposits earn an equal interest to the Rupiah’s denominated time deposits owned by the Company and subsidiaries (see Note 4).
On March 31, 2013, restricted funds, including cash and cash equivalent amounting to Rp 1,205,702,536,300 reserved for the redemption of the whole outstanding bond of Sigma Capital Pte. Ltd, a subsidiary, on April 30, 2013.

These consolidated financial statements are originally issued in Indonesian language
PT LIPPO KARAWACI Tbk AND SUBSIDIARIES NOTES TO THE CONSOLIDATED FINANCIAL STATEMENTS (Continued) As of March 31, 2013 (Unaudited) and December 31, 2012 (Audited) and For the 3 (three) Months Ended March 31, 2013 and 2012 (Unaudited) (Expressed In Full Rupiah, Unless Otherwise Stated)
FD/May 7, 2013 45 paraf:
Other Investments Domicile March 31, 2013 December 31, 2012
Rp Rp
PT Supermal Karawaci Tangerang 57,372,704,000 57,372,704,000
PT East Jakarta Industrial Park Jakarta 766,935,000 766,935,000
PT Spinindo Mitradaya Jakarta 160,000,000 160,000,000
Others -- 29,384,011 29,384,011
Total Other Invesments 58,329,023,011 58,329,023,011
This account represents investment in shares of the stake below 20% in some companies which do not have quoted market prices.
10. Transactions and Balances with Related Parties
The details of the account balances with related parties are as follows:
March 31, December 31, March 31, December 31,
2013 2012 2013 2012
Rp Rp % %
Cash and Cash Equivalent
Bank
PT Bank Nationalnobu 109,483,990,320 98,581,620,560 0.40 0.40
Percentage to Total
Assets/Liabilities
Investments in Associates
PT Surya Citra Investama 62,584,037,469 62,584,037,469 0.23 0.25
PT Hyundai Inti Development 15,991,892,737 14,404,600,538 0.06 0.06
PT Medika Sehat Lestari 4,999,994,000 4,999,994,000 0.02 0.02
PT Tritunggal Sentra Utama 2,368,153,241 2,368,153,241 0.01 0.01
PT Lippo Indorent 1,026,853,442 1,026,853,442 0.00 0.00
Others (below Rp 1 billion each) 400,000,000 400,000,000 0.00 0.00
Total Investments in Associates 87,370,930,889 85,783,638,690 0.32 0.34
Due from Related Parties Non Trade
PT Bumi Lemahabang Permai 9,919,451,291 9,919,451,291 0.04 0.04
PT Duta Mas Kharisma Indah 4,891,935,451 4,891,935,451 0.02 0.02
Direksi dan Manajemen Kunci 4,155,406,765 4,251,241,489 0.02 0.02
Others (below Rp 1 billion each) 4,779,213,206 4,402,722,149 0.02 0.02
Total 23,746,006,713 23,465,350,380 0.09 0.09
Less : Allowance for Impairment (12,004,700,338) (12,004,700,338) (0.04) (0.05)
Due from Related Parties Non Trade - Net 11,741,306,375 11,460,650,042 0.04 0.05
Due to Related Parties Non Trade
PT Tirta Graha Sentana 2,215,692,479 2,215,692,479 0.01 0.02
Lain-lain (masing-masing di bawah Rp 1 miliar)Others (below Rp 1 billion each) 1,516,930,715 973,301,917 0.01 0.01
Total Due to Related Parties Non Trade 3,732,623,194 3,188,994,396 0.02 0.02
Deferred Income
PT Matahari Putra Prima Tbk 573,277,755,573 576,888,263,544 3.80 4.31
Long-Term Post-Employment Benefits Liability
Directors and Key Management 8,604,807,526 8,604,807,526 0.06 0.06

These consolidated financial statements are originally issued in Indonesian language
PT LIPPO KARAWACI Tbk AND SUBSIDIARIES NOTES TO THE CONSOLIDATED FINANCIAL STATEMENTS (Continued) As of March 31, 2013 (Unaudited) and December 31, 2012 (Audited) and For the 3 (three) Months Ended March 31, 2013 and 2012 (Unaudited) (Expressed In Full Rupiah, Unless Otherwise Stated)
FD/May 7, 2013 46 paraf:
2013 2012 2013 2012
(3 Months) (3 Months) (3 Months) (3 Months)
Rp Rp % %Revenues
PT Matahari Putra Prima Tbk 3,610,507,977 3,905,887,403 0.24 0.33
Short-Term Post-Employment Benefits Liability
Directors and Key Management 18,539,610,000 5,022,940,524 1.26 0.43
Percentage to Total
Net Sales/ Operating Expense
Nature of transactions with related parties is as follows:
Related Parties Relationship with the Company Transactions
PT Matahari Putra Prima Tbk Under Common Control Deferred income and net sales PT Bumi Lemahabang Permai Under Common Control Non-interest bearing intercompany charges,
advances in connection with the cancellation of land PT Surya Cipta Investama Associate Investment in shares of stock PT Lippo Indorent Associate Investment in shares of stock PT Hyundai Inti Development Associate Investment in shares of stock PT Tritunggal Sentra Utama Associate Investment in shares of stock PT Bank Nationalnobu Under Common Control Placement of cash and cash equivalent PT Medika Sehat Lestari Associate Investment in shares of stock PT Duta Mas Kharisma Indah Under Common Control Non-interest bearing intercompany charges PT Tirta Graha Sentana Under Common Control Non-interest bearing intercompany charges
Receivable from PT Bumi Lemahabang Permai (BLP) represents receivable of PT Lippo Cikarang Tbk (LC), a subsidiary, which is mainly consist of non-interest bearing intercompany accounts from operational cost which are unsecured and has no fixed repayment period.
11. Invesments in Associates
Domicile Percentage Acquisition Accumulated Accumulated Carrying Value
of Cost Share in Profit Dividend
Ownership (Loss) Received
of Associates
% Rp Rp Rp Rp
PT Surya Cipta Investama Bekasi 49.81 32,964,983,496 29,619,053,973 -- 62,584,037,469
PT Hyundai Inti Development Bekasi 45.00 6,155,423,370 91,421,343,229 (81,584,873,862) 15,991,892,737
Others (each below Rp 5 billion) 25,143,494,000 (16,348,493,317) -- 8,795,000,683
Total 64,263,900,866 104,691,903,885 (81,584,873,862) 87,370,930,889
March 31, 2013
Domicile Percentage Acquisition Accumulated Accumulated Carrying Value
of Cost Share in Profit Dividend
Ownership (Loss) Received
of Associates
% Rp Rp Rp Rp
PT Surya Cipta Investama Bekasi 49.81 32,964,983,496 29,619,053,973 -- 62,584,037,469
PT Hyundai Inti Development Bekasi 45.00 6,155,423,370 89,834,051,030 (81,584,873,862) 14,404,600,538
Others (each below Rp 5 billion) 25,143,494,000 (16,348,493,317) -- 8,795,000,683
Total 64,263,900,866 103,104,611,686 (81,584,873,862) 85,783,638,690
December 31, 2012
There was no fair value information available based on quoted market prices of the investment in associates.
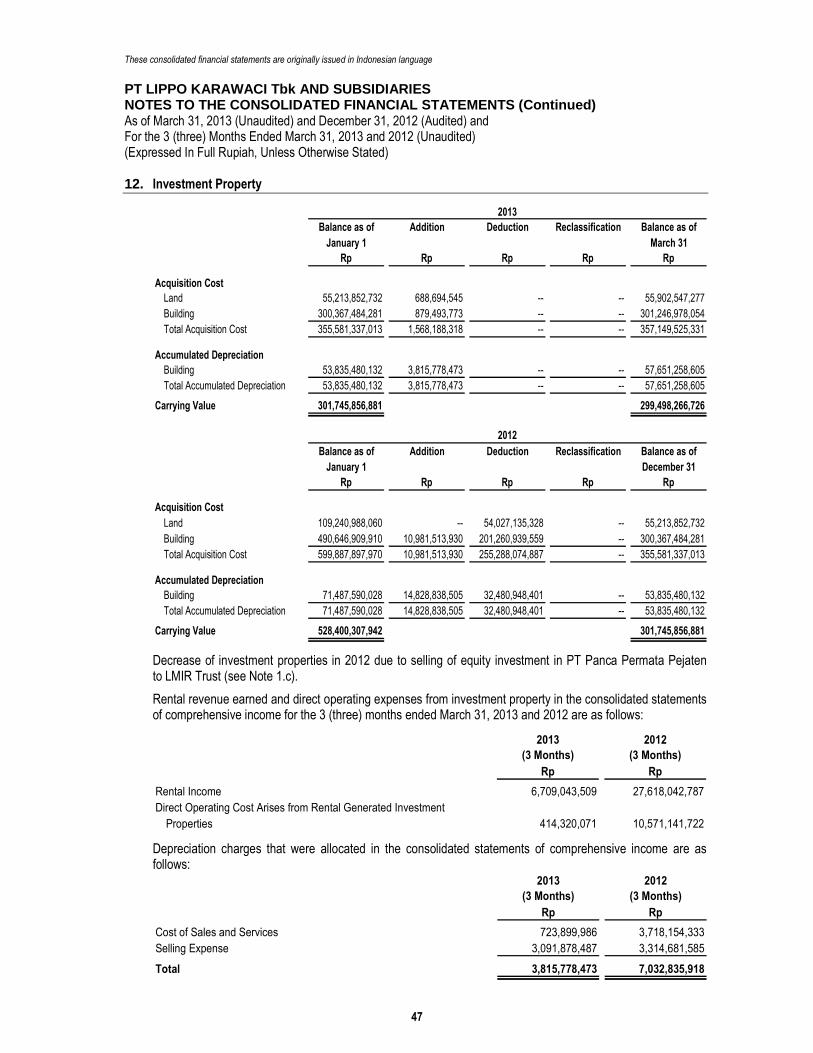
These consolidated financial statements are originally issued in Indonesian language
PT LIPPO KARAWACI Tbk AND SUBSIDIARIES NOTES TO THE CONSOLIDATED FINANCIAL STATEMENTS (Continued) As of March 31, 2013 (Unaudited) and December 31, 2012 (Audited) and For the 3 (three) Months Ended March 31, 2013 and 2012 (Unaudited) (Expressed In Full Rupiah, Unless Otherwise Stated)
FD/May 7, 2013 47 paraf:
12. Investment Property
Balance as of Addition Deduction Reclassification Balance as of
January 1 March 31
Rp Rp Rp Rp Rp
Acquisition Cost
Land 55,213,852,732 688,694,545 -- -- 55,902,547,277
Building 300,367,484,281 879,493,773 -- -- 301,246,978,054
Total Acquisition Cost 355,581,337,013 1,568,188,318 -- -- 357,149,525,331
Accumulated Depreciation
Building 53,835,480,132 3,815,778,473 -- -- 57,651,258,605
Total Accumulated Depreciation 53,835,480,132 3,815,778,473 -- -- 57,651,258,605
Carrying Value 301,745,856,881 299,498,266,726
2013
Balance as of Addition Deduction Reclassification Balance as of
January 1 December 31
Rp Rp Rp Rp Rp
Acquisition Cost
Land 109,240,988,060 -- 54,027,135,328 -- 55,213,852,732
Building 490,646,909,910 10,981,513,930 201,260,939,559 -- 300,367,484,281
Total Acquisition Cost 599,887,897,970 10,981,513,930 255,288,074,887 -- 355,581,337,013
Accumulated Depreciation
Building 71,487,590,028 14,828,838,505 32,480,948,401 -- 53,835,480,132
Total Accumulated Depreciation 71,487,590,028 14,828,838,505 32,480,948,401 -- 53,835,480,132
Carrying Value 528,400,307,942 301,745,856,881
2012
Decrease of investment properties in 2012 due to selling of equity investment in PT Panca Permata Pejaten to LMIR Trust (see Note 1.c).
Rental revenue earned and direct operating expenses from investment property in the consolidated statements of comprehensive income for the 3 (three) months ended March 31, 2013 and 2012 are as follows:
2013 2012
(3 Months) (3 Months)
Rp Rp
Rental Income 6,709,043,509 27,618,042,787
Direct Operating Cost Arises from Rental Generated Investment
Properties 414,320,071 10,571,141,722
Depreciation charges that were allocated in the consolidated statements of comprehensive income are as follows:
2013 2012
(3 Months) (3 Months)
Rp Rp
Cost of Sales and Services 723,899,986 3,718,154,333
Selling Expense 3,091,878,487 3,314,681,585
Total 3,815,778,473 7,032,835,918

These consolidated financial statements are originally issued in Indonesian language
PT LIPPO KARAWACI Tbk AND SUBSIDIARIES NOTES TO THE CONSOLIDATED FINANCIAL STATEMENTS (Continued) As of March 31, 2013 (Unaudited) and December 31, 2012 (Audited) and For the 3 (three) Months Ended March 31, 2013 and 2012 (Unaudited) (Expressed In Full Rupiah, Unless Otherwise Stated)
FD/May 7, 2013 48 paraf:
The Company’s investment property has been insured against fire damage and other risks to PT Lippo General Insurance Tbk, related party, with an insured amount of Rp 614.8 billion and USD 2,000,000 as of March 31, 2013 and December 31, 2012, respectively. The Company and subsidiaries’ management is in the opinion that the insured amount is adequate to cover any possible losses.
Based on the valuation report of Kantor Jasa Penilai Publik Willson and Rekan (Knight Frank) dated June 15, 2012, an independent appraiser, the fair value of all inventories (Note 7), investment property, and property and equipment (Notes 12 and 13) as of December 31, 2011, except for the assets resulting from acquisition 2012, amounted to Rp 36,384,700,139,268. The appraiser is a member of MAPPI and has appropriate qualifications and experience in the property valuation. The valuation is conducted using the market data approach and in accordance with the Indonesian Valuation Standard 2007 and the code of ethics of Indonesian valuation.
The approach used by the appraiser are: 1. For land appraisal, using the market value approach, and 2. For the building, using the cost approach.
Management believes that the fair value as of March 31, 2013 was not impaired as compared to 2012.
The Company’s and subsidiaries’ management is in the opinion that there is no impairment in the carrying value of investment property as of March 31, 2013.
13. Property and Equipment
Balance as of Addition Deduction Reclassification Balance as of
January 1 March 31
Rp Rp Rp Rp Rp
Acquisition Cost
Direct Ownership
Land 335,485,657,403 15,940,118,310 -- -- 351,425,775,713
Building, Infrastructure and Renovations 711,798,619,937 3,838,110,162 -- -- 715,636,730,099
Parks and Interiors 26,866,902,888 1,489,858,975 -- -- 28,356,761,863
Golf Course and Club House 171,293,891,590 -- -- -- 171,293,891,590
Transportation Equipment and Vehicles 36,818,875,481 578,570,000 -- -- 37,397,445,481
Furniture, Fixtures and Office Equipment 426,756,519,156 93,940,912,945 -- -- 520,697,432,101
Tools and Medical Equipment 905,566,792,488 72,715,653,188 -- 52,896,458,012 1,031,178,903,688
Machinery and Project Equipment 215,011,736,822 -- -- (48,929,450,792) 166,082,286,030
Bowling Machinery 14,397,991,861 -- -- -- 14,397,991,861
Playground Areas 5,738,703,291 -- -- (2,602,957,199) 3,135,746,092
2,849,735,690,917 188,503,223,580 -- 1,364,050,021 3,039,602,964,518
Construction in Progress 540,733,313,222 9,206,802,953 -- -- 549,940,116,175
Total Acquisition Cost 3,390,469,004,139 197,710,026,533 -- 1,364,050,021 3,589,543,080,693
2013
Accumulated Depreciation
Direct Ownership
Building, Infrastructure and Renovations 182,835,145,207 8,796,817,726 -- -- 191,631,962,933
Parks and Interiors 19,635,460,003 362,426,150 -- -- 19,997,886,153
Golf Course and Club House 133,640,168,275 2,477,542,744 -- -- 136,117,711,019
Transportation Equipment and Vehicles 24,622,368,327 691,986,465 -- -- 25,314,354,792
Furniture, Fixtures and Office Equipment 314,587,140,579 38,477,631,035 -- -- 353,064,771,614
Tools and Medical Equipment 340,739,110,941 8,547,352,480 -- 24,043,696,147 373,330,159,568
Machinery and Project Equipment 134,559,541,893 -- -- (23,475,066,251) 111,084,475,642
Bowling Machinery 14,337,021,968 6,063,673 -- -- 14,343,085,641
Playground Areas 3,135,746,092 -- -- -- 3,135,746,092
Total Accumulated Depreciation 1,168,091,703,285 59,359,820,273 -- 568,629,896 1,228,020,153,454
Carrying Value 2,222,377,300,854 2,361,522,927,239

These consolidated financial statements are originally issued in Indonesian language
PT LIPPO KARAWACI Tbk AND SUBSIDIARIES NOTES TO THE CONSOLIDATED FINANCIAL STATEMENTS (Continued) As of March 31, 2013 (Unaudited) and December 31, 2012 (Audited) and For the 3 (three) Months Ended March 31, 2013 and 2012 (Unaudited) (Expressed In Full Rupiah, Unless Otherwise Stated)
FD/May 7, 2013 49 paraf:
Balance as of Addition Deduction Reclassification Balance as of
January 1 December 31
Rp Rp Rp Rp Rp
2012
Acquisition Cost
Direct Ownership
Land 303,476,462,831 32,009,194,572 -- -- 335,485,657,403
Building, Infrastructure and Renovations 639,722,467,352 13,394,850,797 116,409,170,833 175,090,472,621 711,798,619,937
Parks and Interiors 20,850,624,055 6,016,278,833 -- -- 26,866,902,888
Golf Course and Club House 169,084,438,910 2,209,452,680 -- -- 171,293,891,590
Transportation Equipment and Vehicles 30,384,351,083 6,434,524,398 -- -- 36,818,875,481
Furniture, Fixtures and Office Equipment 423,032,955,603 17,023,960,979 13,300,397,426 -- 426,756,519,156
Tools and Medical Equipment 524,877,127,570 381,899,939,504 1,210,274,586 -- 905,566,792,488
Machinery and Project Equipment 155,551,054,736 60,511,312,302 1,050,630,216 -- 215,011,736,822
Bowling Machinery 14,397,991,861 -- -- -- 14,397,991,861
Playground Areas 3,135,746,092 2,602,957,199 -- -- 5,738,703,291
2,284,513,220,093 522,102,471,264 131,970,473,061 175,090,472,621 2,849,735,690,917
Construction in Progress 239,102,987,052 762,074,062,164 -- (460,443,735,994) 540,733,313,222
Total Acquisition Cost 2,523,616,207,145 1,284,176,533,428 131,970,473,061 (285,353,263,373) 3,390,469,004,139
Accumulated Depreciation
Direct Ownership
Building, Infrastructure and Renovations 151,771,574,603 31,063,570,604 -- -- 182,835,145,207
Parks and Interiors 18,299,327,948 1,336,132,055 -- -- 19,635,460,003
Golf Course and Club House 123,826,915,440 9,813,252,835 -- -- 133,640,168,275
Transportation Equipment and Vehicles 22,347,773,749 2,274,594,578 -- -- 24,622,368,327
Furniture, Fixtures and Office Equipment 301,884,200,445 25,909,707,147 13,206,767,013 -- 314,587,140,579
Tools and Medical Equipment 235,936,433,368 106,093,635,684 1,290,958,111 -- 340,739,110,941
Machinery and Project Equipment 95,984,965,261 39,400,398,543 825,821,911 -- 134,559,541,893
Bowling Machinery 14,304,450,908 32,571,060 -- -- 14,337,021,968
Playground Areas 3,135,746,092 -- -- -- 3,135,746,092
Total Accumulated Depreciation 967,491,387,814 215,923,862,506 15,323,547,035 -- 1,168,091,703,285
Carrying Value 1,556,124,819,331 2,222,377,300,854
In 2012, the Company reclassified property and equipment to inventory amounting to Rp 285,353,263,373 (see Note 7).
In 2012, the additions to property and equipment above include assets acquired by non-cash transaction by way of realization of advances amounting to Rp 8,271,743,937.
In 2012, the addition of property and equipment includes assets from the acquired Company (see Note 1.c) with the acquisition cost amounting to Rp 335,173,270,871 and accumulated depreciation amounting to Rp 21,476,460,307.
Construction in progress includes hospitals and mall buildings. As of March 31, 2013, Construction in progress has reached 30% - 95% and estimated the completion within April 2013 until September 2013. Management believes there is no other matter which will hinder the completion.
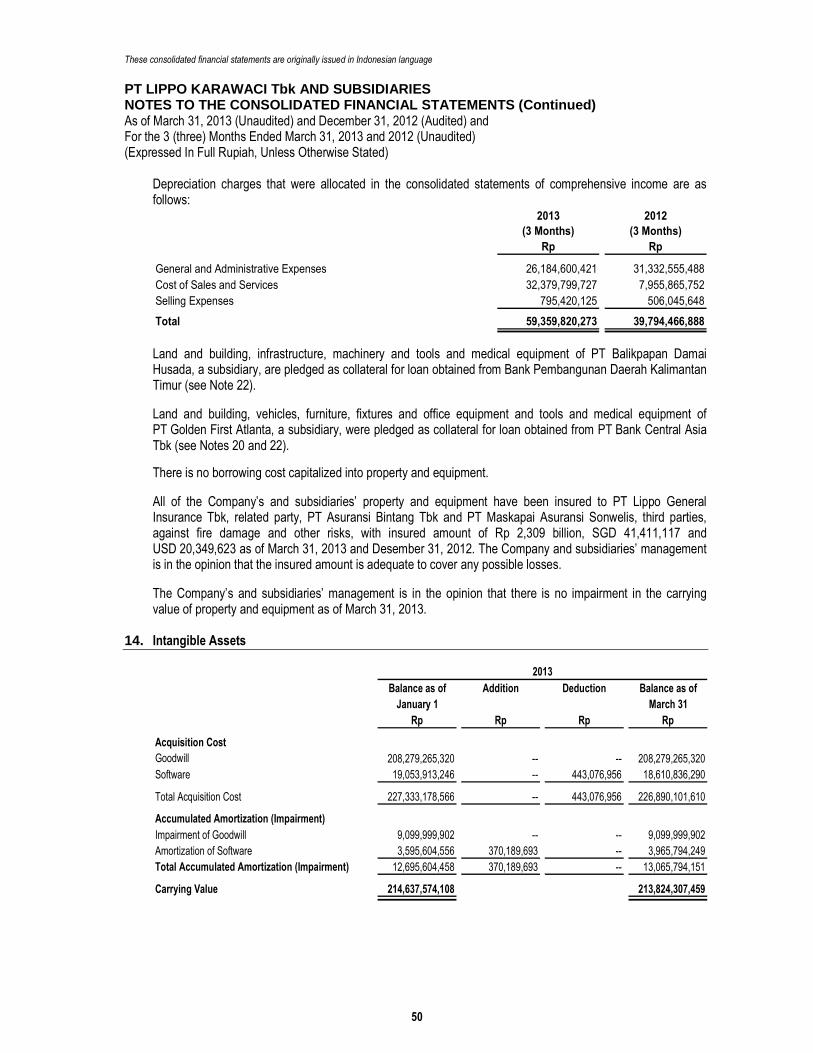
These consolidated financial statements are originally issued in Indonesian language
PT LIPPO KARAWACI Tbk AND SUBSIDIARIES NOTES TO THE CONSOLIDATED FINANCIAL STATEMENTS (Continued) As of March 31, 2013 (Unaudited) and December 31, 2012 (Audited) and For the 3 (three) Months Ended March 31, 2013 and 2012 (Unaudited) (Expressed In Full Rupiah, Unless Otherwise Stated)
FD/May 7, 2013 50 paraf:
Depreciation charges that were allocated in the consolidated statements of comprehensive income are as follows:
2013 2012
(3 Months) (3 Months)
Rp Rp
General and Administrative Expenses 26,184,600,421 31,332,555,488
Cost of Sales and Services 32,379,799,727 7,955,865,752
Selling Expenses 795,420,125 506,045,648
Total 59,359,820,273 39,794,466,888
Land and building, infrastructure, machinery and tools and medical equipment of PT Balikpapan Damai Husada, a subsidiary, are pledged as collateral for loan obtained from Bank Pembangunan Daerah Kalimantan Timur (see Note 22).
Land and building, vehicles, furniture, fixtures and office equipment and tools and medical equipment of PT Golden First Atlanta, a subsidiary, were pledged as collateral for loan obtained from PT Bank Central Asia Tbk (see Notes 20 and 22).
There is no borrowing cost capitalized into property and equipment.
All of the Company’s and subsidiaries’ property and equipment have been insured to PT Lippo General Insurance Tbk, related party, PT Asuransi Bintang Tbk and PT Maskapai Asuransi Sonwelis, third parties, against fire damage and other risks, with insured amount of Rp 2,309 billion, SGD 41,411,117 and USD 20,349,623 as of March 31, 2013 and Desember 31, 2012. The Company and subsidiaries’ management is in the opinion that the insured amount is adequate to cover any possible losses.
The Company’s and subsidiaries’ management is in the opinion that there is no impairment in the carrying value of property and equipment as of March 31, 2013.
14. Intangible Assets
Balance as of Addition Deduction Balance as of
January 1 March 31
Rp Rp Rp Rp
Acquisition Cost
Goodwill 208,279,265,320 -- -- 208,279,265,320
Software 19,053,913,246 -- 443,076,956 18,610,836,290
Total Acquisition Cost 227,333,178,566 -- 443,076,956 226,890,101,610
Accumulated Amortization (Impairment)
Impairment of Goodwill 9,099,999,902 -- -- 9,099,999,902
Amortization of Software 3,595,604,556 370,189,693 -- 3,965,794,249
Total Accumulated Amortization (Impairment) 12,695,604,458 370,189,693 -- 13,065,794,151
Carrying Value 214,637,574,108 213,824,307,459
2013

These consolidated financial statements are originally issued in Indonesian language
PT LIPPO KARAWACI Tbk AND SUBSIDIARIES NOTES TO THE CONSOLIDATED FINANCIAL STATEMENTS (Continued) As of March 31, 2013 (Unaudited) and December 31, 2012 (Audited) and For the 3 (three) Months Ended March 31, 2013 and 2012 (Unaudited) (Expressed In Full Rupiah, Unless Otherwise Stated)
FD/May 7, 2013 51 paraf:
Balance as of Addition Deduction Balance as of
January 1 December 31
Rp Rp Rp Rp
Acquisition Cost
Goodwill 209,541,539,862 59,737,725,458 61,000,000,000 208,279,265,320
Software 12,046,610,389 7,007,302,857 -- 19,053,913,246
Total Acquisition Cost 221,588,150,251 66,745,028,315 -- 227,333,178,566
Accumulated Amortization (Impairment)
Impairment of Goodwill 9,099,999,902 -- -- 9,099,999,902
Amortization of Software 2,211,654,497 1,383,950,059 -- 3,595,604,556
Total Accumulated Amortization (Impairment) 11,311,654,399 1,383,950,059 -- 12,695,604,458
Carrying Value 210,276,495,852 214,637,574,108
2012
The details of goodwill are as follows:
Acquirer Entity Share Acquisition in Year of
Acquisition March 31, 2013 December 31, 2012
Rp Rp
PT Lippo Malls Indonesia PT Mulia Citra Abadi 2012 20,247,679,428 20,247,679,428
PT Persada Mandiri Dunia Niaga PT Ekaputra Kencana Abadi 2012 15,050,000,000 15,050,000,000
PT Primakreasi Propertindo PT Bimasakti Jaya Abadi 2012 9,509,000,000 9,509,000,000
PT Pancawarna Semesta PT Diagram Healthcare Indonesia 2012 9,251,046,030 9,251,046,030
PT Primakreasi Propertindo PT Surya Megah Lestari 2012 5,680,000,000 5,680,000,000
PT Prawira Tata Semesta PT Balikpapan Damai Husada 2011 27,480,578,103 27,480,578,103
PT Siloam International Hospitals PT Prawira Tata Semesta 2011 14,146,465,217 14,146,465,217
PT Siloam International Hospitals PT Guchi Kencana Emas 2011 3,540,326,235 3,540,326,235
PT Berkat Langgeng Jaya PT Pamor Paramita Utama 2008 9,770,787,707 9,770,787,707
PT Wahana Usaha Makmur PT Adhi Utama Dinamika 2008 8,774,146,934 8,774,146,934
PT Prima Kreasi Propertindo PT Graha Solusi Mandiri 2007 9,560,604,416 9,560,604,416
PT Graha Jaya Pratama PT Nuansa Indah Lestari 2004 38,110,462,048 38,110,462,048
PT Graha Jaya Pratama PT Fajar Usaha Semesta 2004 8,186,375,658 8,186,375,658
PT Graha Jaya Pratama PT Fajar Raya Cemerlang 2004 7,929,625,658 7,929,625,658
PT Graha Jaya Pratama PT Aresta Permata Utama 2004 5,971,083,992 5,971,083,992
PT Graha Jaya Pratama PT Fajar Abadi Aditama 2004 5,971,083,992 5,971,083,992
Total 199,179,265,418 199,179,265,418
Net Value
The management believes that the impairment that occurred for the 3 (three) months ended March 31, 2013 and for the year ended December 31, 2012 have been assessed adequately.
Decrease in goodwill is due to the obligation of the PT Metropolis Propertindo Utama (MPU) to pay compensation to the Company since the respective Net Profit After Tax (NPAT) of PT Guchi Kencana Emas and PT Prawira Tata Semesta as set forth in the purchase agreement of both companies was not achieved.
Based on Agreement dated November 2, 2010, between PT Siloam International Hospitals (SIH) and MPU on the acquisition of PT Prawira Tata Semesta (PTS), MPU guaranteed that Net Profit After Tax (NPAT) of PT Balikpapan Damai Husada (BDH), a subsidiary of PTS, would amount to Rp 17,000,000,000 in 2011, and if the said NPAT does not materialize, which this is the case, MPU will provide compensation amounting to Rp 41,000,000,000 to SIH. This compensation was fully paid on May 30, 2012 and recorded as a reduction of goodwill.

These consolidated financial statements are originally issued in Indonesian language
PT LIPPO KARAWACI Tbk AND SUBSIDIARIES NOTES TO THE CONSOLIDATED FINANCIAL STATEMENTS (Continued) As of March 31, 2013 (Unaudited) and December 31, 2012 (Audited) and For the 3 (three) Months Ended March 31, 2013 and 2012 (Unaudited) (Expressed In Full Rupiah, Unless Otherwise Stated)
FD/May 7, 2013 52 paraf:
Based on Agreement dated October 26, 2010, between PT Siloam International Hospitals (SIH), a subsidiary, and MPU on the acquisition of PT Guchi Kencana Emas (GKE), MPU guaranteed that Net Profit After Tax (NPAT) of PT Golden First Atlanta (GFA), a subsidiary of GKE, would amount to Rp 6,400,000,000 in 2011, and if the said NPAT does not materialize, which is the case, MPU will provide compensation amounting to Rp 20,000,000,000 to SIH. This compensation was fully paid on May 30, 2012 and recorded as a reduction of goodwill.
15. Advances
March 31, 2013 December 31, 2013
Rp Rp
Advances for Investments:
PT Anugerah Bahagia Abadi 502,400,000,000 502,400,000,000
Advances for Construction 185,642,736,824 32,311,222,654
Advances for Land Acquisition 322,113,335,845 342,033,328,425
Advances for Acquisition of Property and Equipment 77,967,796,510 141,743,826,536
Others 149,269,673,062 61,348,786,168
Total Advances 1,237,393,542,241 1,079,837,163,783
On December 2, 2010, based on Sale and Purchase of Shares Agreements, PT Satria Mandiri Idola Utama, subsidiary, purchased the shares of PT Anugerah Bahagia Abadi of Rp 549,686,500,000. Up to March 31, 2013, the advanced payment amounted to Rp 502,400,000,000.
16. Land for Development
Area Value Area Value
sqm Rp sqm Rp
The Company 1,001,010 203,350,714,722 1,001,010 203,350,714,722
Subsidiaries:
PT Lippo Cikarang Tbk 2,301,460 289,190,434,469 2,297,717 285,398,871,143
PT Gowa Makassar Tourism Development Tbk 2,119,315 246,812,776,564 2,119,315 229,202,303,471
PT Muliasentosa Dinamika 803,413 112,455,747,318 803,413 112,455,747,318
PT Erabaru Realindo 692,082 16,961,287,500 692,082 16,961,287,500
PT Sentragraha Mandiri 239,759 33,313,592,430 239,759 33,313,592,430
PT Sejatijaya Selaras 84,162 12,838,533,436 84,162 12,817,939,795
PT Bahtera Pratama Wirasakti 83,405 15,699,340,352 83,405 15,699,340,352
PT Surya Makmur Alam Persada 71,303 20,283,623,533 71,303 20,283,623,533
Total Land for Development 7,395,909 950,906,050,324 7,392,166 929,483,420,264
March 31, 2013 December 31, 2012
Land for development of the Company and subsidiaries are located at Curug Wetan Village, Curug Kulon, Sukabakti in Curug District; Serdang Wetan Village, Rancagong in Legok District; Ciakar Village, Serdang Kulon, Cukang Galih, Tangerang Regency, Banten; Cipambuan Village in Citeureup District, Bogor Regency, West Java; Sukaresmi, Cibatu, Cicau, Sukamukti, Sirnajati, Jayamukti in Lemahabang District, South Cikarang; Tanjung Merdeka Village, Barombong, Maccini Sombala, Tamanyeleng, Mariso, Benteng Somba Opu in Makassar, South Sulawesi.
Site development permits of each land have been obtained from their respective local governors.
Land for development of PT Erabaru Realindo, a subsidiary, with an area of 65.6 hectares is pledged by PT Lippo Cikarang Tbk, a subsidiary, as collateral for loan obtained from PT Bank Negara Indonesia Tbk (Persero) (see Note 20).

These consolidated financial statements are originally issued in Indonesian language
PT LIPPO KARAWACI Tbk AND SUBSIDIARIES NOTES TO THE CONSOLIDATED FINANCIAL STATEMENTS (Continued) As of March 31, 2013 (Unaudited) and December 31, 2012 (Audited) and For the 3 (three) Months Ended March 31, 2013 and 2012 (Unaudited) (Expressed In Full Rupiah, Unless Otherwise Stated)
FD/May 7, 2013 53 paraf:
17. Accrued Expenses
March 31, 2013 December 31, 2012
Rp Rp
Estimated Cost for Construction 276,665,161,522 273,238,175,833
Interest 194,309,056,062 55,525,085,171
Endowment Care Fund 44,696,987,047 42,696,987,047
Hedging Premium 22,224,932,510 9,016,108,427
Transfer of Ownership Tax 15,462,134,419 15,233,896,173
Professional Fees 10,424,753,386 10,093,610,971
Electricity, Water and Telephone 9,000,237,990 9,227,267,696
Others 86,694,562,974 72,304,694,960
Total Accrued Expenses 659,477,825,910 487,335,826,278
18. Taxation
a. Income Tax Benefit (Expense) 2013 2012
(3 Months) (3 Months)
Rp Rp
Current (50,388,366,058) (42,220,260,071)
Deferred 941,251,290 1,339,420,144
Total Income Tax Expense (49,447,114,768) (40,880,839,927)s
The reconciliation between profit before tax expense as presented in the consolidated statements of comprehensive income, and the Company’s estimated tax loss is as follows:
2013 2012
(3 Months) (3 Months)
Rp Rp
Profit before Tax as Presented
in the Consolidated Statements of Comprehensive Income 397,795,383,042 299,412,147,082
Deduct: Income of Subsidiaries 415,366,972,023 285,929,927,649
The Company’s Commercial Income (Loss) - Net (17,571,588,981) 13,482,219,433
Temporary Differences
Depreciation of Direct Ownership of Property and Equipment (1,475,507,890) (1,475,507,890)
Deferred Gain on Sale and Leaseback Transactions (6,394,856,211) (1,825,861,686)
Subtotal (7,870,364,101) (3,301,369,576)
Permanent Differences
Donation and Representation 185,737,616 189,041,394
Interest Income Subjected to Final Tax (5,804,444,635) (17,376,169,937)
Income Subject to Final Tax - Net (6,871,443,176) (25,375,428,123)
Subtotal (12,490,150,195) (42,562,556,666)
Estimated Tax Loss (37,932,103,277) (32,381,706,809)

These consolidated financial statements are originally issued in Indonesian language
PT LIPPO KARAWACI Tbk AND SUBSIDIARIES NOTES TO THE CONSOLIDATED FINANCIAL STATEMENTS (Continued) As of March 31, 2013 (Unaudited) and December 31, 2012 (Audited) and For the 3 (three) Months Ended March 31, 2013 and 2012 (Unaudited) (Expressed In Full Rupiah, Unless Otherwise Stated)
FD/May 7, 2013 54 paraf:
Calculation of estimated current tax and tax payable is as follows: 2013 2012
(3 Months) (3 Months)
Rp Rp
The Company
Estimated Tax Loss (37,932,103,277) (32,381,706,809)
Subsidiaries
Estimated Tax Profit 17,021,693,886 1,046,091,060
Current Tax 4,255,423,471 14,146,682,280
Tax Credit -- (1,472,628,214)
Income Tax Payable Article 29 Consolidated 4,255,423,471 12,674,054,066
Final Tax Expense
The Company 13,096,127 27,027,486,731
Subsidiaries 46,119,846,459 27,027,486,731
Consolidated Final Tax Expense 46,132,942,586 54,054,973,462
Consolidated Income Tax Expense 50,388,366,057 66,729,027,528
Consolidated Tax Payable Article 29
Estimated Consolidated Income Tax Article 29 4,255,423,471 13,631,158,966
Prior Year Income Tax Article 29 43,510,831,604 96,629,845,755
Total Consolidated Income Tax Payable Article 29 47,766,255,075 110,261,004,721
The reconciliation between tax expense and the multiplication of the consolidated profit before income tax with the prevailing tax rate is as follows:
2013 2012
(3 Months) (3 Months)
Rp Rp
Income before Income Tax Expense According to the
Consolidated Statements of Comprehensive Income 397,795,383,042 299,412,147,082
Deduct:
Income of Subsidiaries 415,366,972,023 285,929,927,649
The Company's Commercial Income (Loss) (17,571,588,981) 13,482,219,433
Income Tax Expense at Effective Tax Rate 25% 4,392,897,244 3,622,627,275
Income Subject to Final Tax - Net 1,717,860,794 9,717,712,181
Interest Income 1,451,111,159 7,284,649,873
Donation and Representation (46,434,404) (42,645,907)
Tax Loss (9,483,025,819) 18,299,859,693
Expense of Income Subjected to Final Tax -- (13,726,149,839)
Income Tax Expense of the Company (1,967,591,026) 25,156,053,276
Final Tax Expense of the Company (13,096,127) (27,027,486,731)
Total Income Tax Expense of the Company (1,980,687,153) (1,871,433,455)
Income Tax Expense of the Subsidiaries
Deferred Tax of the Subsidiaries 2,908,842,315 2,164,762,539
Current Tax of the Subsidiaries (4,255,423,471) (14,146,682,280)
Final Tax Expense of the Subsidiaries (46,119,846,459) (27,027,486,731)
Total Income Tax Expense of the Subsidiaries (47,466,427,615) (39,009,406,472)
Total Income Tax Expense (49,447,114,768) (40,880,839,927)

These consolidated financial statements are originally issued in Indonesian language
PT LIPPO KARAWACI Tbk AND SUBSIDIARIES NOTES TO THE CONSOLIDATED FINANCIAL STATEMENTS (Continued) As of March 31, 2013 (Unaudited) and December 31, 2012 (Audited) and For the 3 (three) Months Ended March 31, 2013 and 2012 (Unaudited) (Expressed In Full Rupiah, Unless Otherwise Stated)
FD/May 7, 2013 55 paraf:
b. Deferred Tax Asset – Net Details of the Company’s and subsidiaries’ deferred tax assets and liabilities are as follows:
January 1, Credited (Charged) to March 31,
2013 Statements of 2013
Comprehensive Income
Rp Rp Rp
The Company
Amortization of Deferred Income from Sale
and Lease Back Transactions and Lease Back Transactions 16,327,339,687 (1,598,714,053) 14,728,625,634
Estimated Liabilities on Employee Benefits 8,136,790,871 -- 8,136,790,871
Allowance for Impairment in Value 2,965,626,608 -- 2,965,626,608
Depreciation (9,342,288,848) (368,876,973) (9,711,165,821)
18,087,468,318 (1,967,591,026) 16,119,877,292
Subsidiaries 58,367,244,335 2,908,842,315 61,276,086,650
Deferred Tax Assets 76,454,712,653 941,251,289 77,395,963,942
January 1, Credited (Charged) to December 31,
2012 Statements of 2012
Comprehensive Income
Rp Rp Rp
The Company
Amortization of Deferred Income from Sale
and Lease Back Transactions and Lease Back Transactions 18,153,201,373 (1,825,861,686) 16,327,339,687
Estimated Liabilities on Employee Benefits 6,886,898,085 1,249,892,786 8,136,790,871
Allowance for Impairment in Value 2,965,626,608 -- 2,965,626,608
Depreciation (8,432,141,835) (910,147,013) (9,342,288,848)
19,573,584,231 (1,486,115,913) 18,087,468,318
Subsidiaries 57,907,408,068 459,836,267 58,367,244,335
Deferred Tax Assets 77,480,992,299 (1,026,279,646) 76,454,712,653
c. Prepaid Taxes March 31, 2013 December 31, 2012
Rp Rp
Income Taxes
Article 4 (2) 271,761,746,138 235,817,814,312
Article 22 598,933,729 587,969,915
Article 25/29 16,016,458,646 6,960,555,520
Value Added Tax 99,932,340,590 86,789,618,527
Total Prepaid Taxes 388,309,479,103 330,155,958,274
d. Taxes Payable March 31, 2013 December 31, 2012
Rp Rp
Income Tax
Final 55,110,296,333 86,883,944,714
Article 23 5,132,003,462 --
Article 25/29 47,766,255,075 43,750,185,451
Article 21 42,459,311,095 16,835,483,173
Article 26 77,850,908 335,505,100
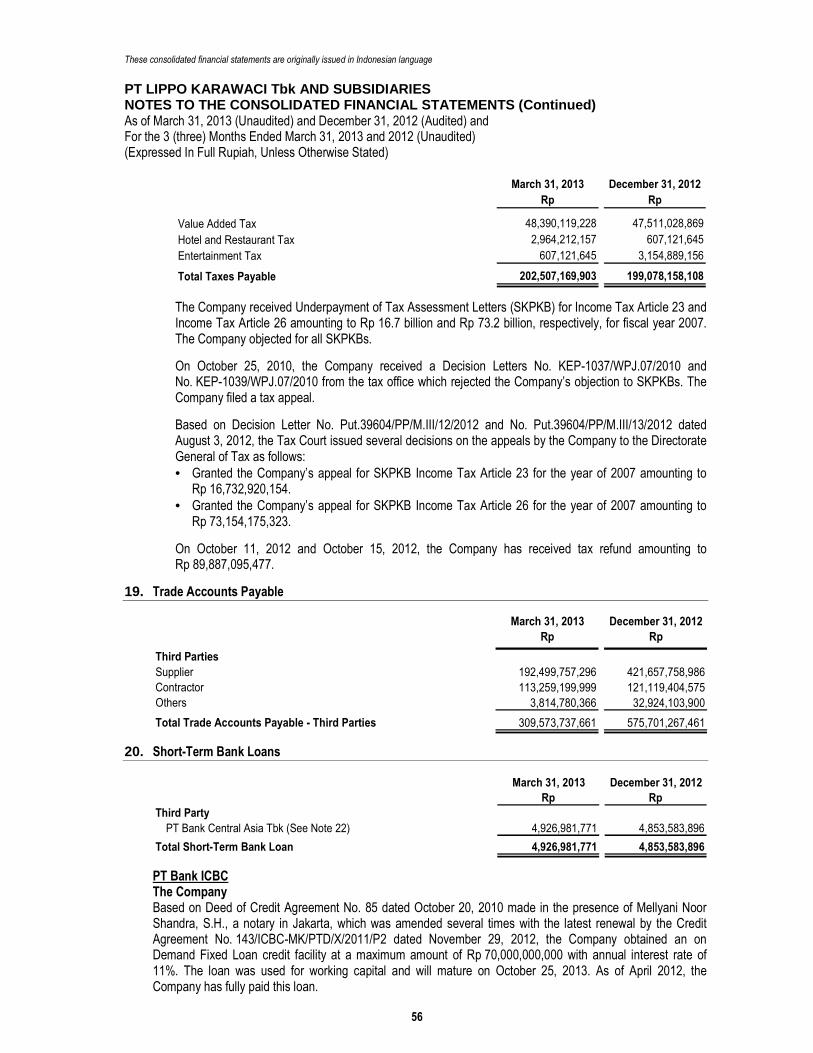
These consolidated financial statements are originally issued in Indonesian language
PT LIPPO KARAWACI Tbk AND SUBSIDIARIES NOTES TO THE CONSOLIDATED FINANCIAL STATEMENTS (Continued) As of March 31, 2013 (Unaudited) and December 31, 2012 (Audited) and For the 3 (three) Months Ended March 31, 2013 and 2012 (Unaudited) (Expressed In Full Rupiah, Unless Otherwise Stated)
FD/May 7, 2013 56 paraf:
March 31, 2013 December 31, 2012
Rp Rp
Value Added Tax 48,390,119,228 47,511,028,869
Hotel and Restaurant Tax 2,964,212,157 607,121,645
Entertainment Tax 607,121,645 3,154,889,156
Total Taxes Payable 202,507,169,903 199,078,158,108
The Company received Underpayment of Tax Assessment Letters (SKPKB) for Income Tax Article 23 and Income Tax Article 26 amounting to Rp 16.7 billion and Rp 73.2 billion, respectively, for fiscal year 2007. The Company objected for all SKPKBs.
On October 25, 2010, the Company received a Decision Letters No. KEP-1037/WPJ.07/2010 and No. KEP-1039/WPJ.07/2010 from the tax office which rejected the Company’s objection to SKPKBs. The Company filed a tax appeal.
Based on Decision Letter No. Put.39604/PP/M.III/12/2012 and No. Put.39604/PP/M.III/13/2012 dated August 3, 2012, the Tax Court issued several decisions on the appeals by the Company to the Directorate General of Tax as follows:
• Granted the Company’s appeal for SKPKB Income Tax Article 23 for the year of 2007 amounting to Rp 16,732,920,154.
• Granted the Company’s appeal for SKPKB Income Tax Article 26 for the year of 2007 amounting to Rp 73,154,175,323.
On October 11, 2012 and October 15, 2012, the Company has received tax refund amounting to Rp 89,887,095,477.
19. Trade Accounts Payable
March 31, 2013 December 31, 2012
Rp Rp
Third Parties
Supplier 192,499,757,296 421,657,758,986
Contractor 113,259,199,999 121,119,404,575
Others 3,814,780,366 32,924,103,900
Total Trade Accounts Payable - Third Parties 309,573,737,661 575,701,267,461
20. Short-Term Bank Loans
March 31, 2013 December 31, 2012
Rp Rp
Third Party
PT Bank Central Asia Tbk (See Note 22) 4,926,981,771 4,853,583,896
Total Short-Term Bank Loan 4,926,981,771 4,853,583,896
PT Bank ICBC The Company Based on Deed of Credit Agreement No. 85 dated October 20, 2010 made in the presence of Mellyani Noor Shandra, S.H., a notary in Jakarta, which was amended several times with the latest renewal by the Credit Agreement No. 143/ICBC-MK/PTD/X/2011/P2 dated November 29, 2012, the Company obtained an on Demand Fixed Loan credit facility at a maximum amount of Rp 70,000,000,000 with annual interest rate of 11%. The loan was used for working capital and will mature on October 25, 2013. As of April 2012, the Company has fully paid this loan.
These consolidated financial statements are originally issued in Indonesian language
PT LIPPO KARAWACI Tbk AND SUBSIDIARIES NOTES TO THE CONSOLIDATED FINANCIAL STATEMENTS (Continued) As of March 31, 2013 (Unaudited) and December 31, 2012 (Audited) and For the 3 (three) Months Ended March 31, 2013 and 2012 (Unaudited) (Expressed In Full Rupiah, Unless Otherwise Stated)
FD/May 7, 2013 57 paraf:
This facility is secured by collaterals as follows: � One (1) parcel of land with an area of 94,500 sqm, as a part of HGB No. 56/Sukaresmi which is registered
under the name of PT Waska Sentana. � One (1) parcel of land with an area of 2,500 sqm with HGB No. 2012/Sukaresmi which is registered under
the name of PT Waska Sentana.
Interests and other borrowing costs capitalized into inventories for the 3 (three) months ended March 31, 2013 and for the year ended December 31, 2012 amounted to nil and nil, respectively (see Note 7).
PT Lippo Cikarang Tbk (LC), a subsidiary Based on Deeds of Credit Agreement No. 86, dated October 20, 2010, made in the presence of Mellyani Noor Shandra, S.H., a notary in Jakarta, which was amended several times with the latest renewal by Credit Agreements Nos. 144/ICBC-MK/PTD1/X/2011/P2 and 145/ICBC-MK/PTD/2011 (no longer extended) dated November 30, 2012, LC obtained an on Demand Fixed Loan credit facility at a maximum amount of Rp 30,000,000,000 with annual interest rate of 11%. The loan was used for working capital and will mature on October 25, 2013. As of April 2012, LC, a subsidiary, has fully paid this loan. This facility is secured by collaterals as follows: � One (1) parcel of land with an area of 38,901 sqm with HGB No. 178/Sukaresmi which is registered under
the name of PT Waska Sentana. � One (1) parcel of land with an area of 85,180 sqm, as a part of HGB No. 56/Sukaresmi which is registered
under the name of PT Waska Sentana.
PT Bank Negara Indonesia (Persero) Tbk The Company
• Based on Deed of Credit Agreement No. 34 dated October 30, 2006, which was made in the presence of H. Zamri, S.H., a notary in Jakarta and which was renewed by Deed of Credit Agreement No. 46 dated March 29, 2007 of the same notary, the Company obtained a Working Capital Credit facility at a maximum amount of Rp 250,000,000,000 which bears an annual interest rate of 11%. This loan was used to finance property and other businesses, except for land acquisitions. This loan matured on October 29, 2007. Furthermore, based on Deed of Credit Agreement No. 44 dated March 29, 2007 made in the presence of H. Zamri, S.H., a notary in Jakarta, the Company obtained additional Working Capital Credit facility at a maximum of Rp 20,000,000,000 resulting to a total Working Capital Credit facility of Rp 270,000,000,000. This loan bears an annual interest rate of 11% and matured on October 29, 2007. The facility has been extended several times to the latest extension through changes in the Credit Agreements Nos. (7) 34 and (6) 44 dated December 19, 2012 and will mature on June 12, 2013. This loan bears an annual interest rate of 10%.
• Based on Deed of Credit Agreement No. 45 dated March 29, 2007 which was made in the presence of H. Zamri, S.H., a notary in Jakarta, the Company obtained a term loan credit facility at a maximum of Rp 270,000,000,000. This loan bears an annual interest rate of 12%. The loan was used to finance the Company’s projects in urban development, large scale integrated development, retail malls, healthcare and hospitality and infrastructure, except for land acquisition and matured on March 29, 2011.
These loans have been fully paid by the Company on March 10, 2011. As of March 31, 2013, the Company did not renew this loan facility.
Interests and other borrowing costs capitalized into inventories for the 3 (three) months ended March 31, 2013 and for the year ended December 31, 2012 amounted to nil and Rp 3,321,992,009, respectively (see Note 7).
PT Lippo Cikarang Tbk (LC), a subsidiary
• Based on Deed of Credit Agreement No. 32 dated March 29, 2011 which was made in the presence of Wenda Taurusita Amidjaja, S.H., a notary in Jakarta, then changed by the Approval PK No. (1) 32 dated May 25, 2012, LC obtained a working capital credit facility at a maximum amount of Rp 50,000,000,000

These consolidated financial statements are originally issued in Indonesian language
PT LIPPO KARAWACI Tbk AND SUBSIDIARIES NOTES TO THE CONSOLIDATED FINANCIAL STATEMENTS (Continued) As of March 31, 2013 (Unaudited) and December 31, 2012 (Audited) and For the 3 (three) Months Ended March 31, 2013 and 2012 (Unaudited) (Expressed In Full Rupiah, Unless Otherwise Stated)
FD/May 7, 2013 58 paraf:
with an annual interest rate of 11%. This loan was used to finance the property and other business, except for land acquisition. Based on credit extention agreement No. (1) 32 dated May 25, 2012, this loan has been extended to March 28, 2013. This loan had been fully paid on April 20, 2012. As of March 31, 2013. the Company did not renew this loan facility.
• Based on Deed of Credit Agreement No. 33 dated March 29, 2011 which was made in the presence of Wenda Taurusita Amidjaja, S.H., a notary in Jakarta, LC obtained a working capital credit facility at a maximum amount of Rp 432,782,000,000 with an annual interest rate of 11%. This loan was used to refinance the Company’s loan and will mature on March 28, 2016. As of March 31, 2013, LC has not used and extended this facility.
Both facilities are secured by collaterals as follows: � Ten (10) parcels of land with an area of 655,945 sqm, consist of HGB Nos. 37, 38, 39, 40, 2002,
2003, 2004, 2005, 2006, and 5981 which are registered under the name of PT Erabaru Realindo, a subsidiary.
� One (1) parcel of land with an area of 127,404 sqm, consist of HGB No. 8302 which is registered under the name of LC.
� Property trade accounts receivable (excluding accounts receivable from land sold) amounted to Rp 62.5 billion.
21. Other Current Financial Liabilities
March 31, 2013 December 31, 2012
Rp Rp
Third Parties
Unidentified Payments 68,806,729,917 89,907,922,121
Other Payable 68,598,561,732 89,635,914,295
Total Other Current Financial Liabilities 137,405,291,649 179,543,836,416
Unidentified payments represent receipt of collection not yet identifiable by the Company.
22. Long-Term Bank Loans
March 31, 2013 December 31, 2012
Rp Rp
Third Parties
Bank Pembangunan Daerah Kalimantan Timur 38,902,509,103 40,035,765,926
PT Bank Central Asia Tbk 24,314,486,210 25,935,451,960
63,216,995,313 65,971,217,886
Current Portion 11,355,521,381 11,218,103,420
Non-Current Portion 51,861,473,932 54,753,114,466
Bank Pembangunan Daerah Kalimantan Timur Based on Deed of Credit Agreement No. 005/870/9200/KI.59/BPDKP/2008 dated February 25, 2008, PT Balikpapan Damai Husada (BDH), a subsidiary, obtained an investment credit facility (Non-PRK) at a maximum amount of Rp 50,000,000,000 with an annual interest rate of 11.5%. This loan was used to increase the investment fund for financing the development of hospitals and paying its loan obtained from PT Bank Mandiri Tbk. This loan will mature on February 25, 2019.
This facility is secured by collaterals as follows: � One (1) parcel of land with an area of 12,562 sqm including healthcare building and hospital with an area
8,024 sqm with HGB No. 2069 located at Jl. MT. Haryono RT. 35, Balikpapan which is registered under the name of PT Putra Adi Perkasa.
These consolidated financial statements are originally issued in Indonesian language
PT LIPPO KARAWACI Tbk AND SUBSIDIARIES NOTES TO THE CONSOLIDATED FINANCIAL STATEMENTS (Continued) As of March 31, 2013 (Unaudited) and December 31, 2012 (Audited) and For the 3 (three) Months Ended March 31, 2013 and 2012 (Unaudited) (Expressed In Full Rupiah, Unless Otherwise Stated)
FD/May 7, 2013 59 paraf:
� Supporting infrastructure, tools and machinery and medical equipment with the estimated value of Rp 8,665,020,000.
There is no restrictive financial ratio which should be maintained by BDH.
PT Bank Central Asia Tbk Based on Deed of Credit Agreement No. 1 dated April 1, 2003 made in the presence of Yandes Effriady, S.H., a notary in Jambi, and the letter No. 0242/JAM/2010 dated February 3, 2010, as amended by Credit Agreement No. 54 dated July 19, 2010 in the presence of Hasan S. H., a notary in Jambi and the latest by Credit Agreement No. 0036/ADD/119/II/12 dated February 2, 2012, PT Golden First Atlanta (GFA), a subsidiary, obtained several credit facilities as follows: � Local Credit Facility (Current Account) at a maximum amount of Rp 5,000,000,000. � Investment Credit Facility at a maximum amount of Rp 32,419,314,946.
Both facilities bear an annual interest rate of 11% and will mature on February 5, 2013 and December 20, 2016, respectively.
Both facilities are secured by collaterals as follows: � Three (3) parcels of land with an area of 7,132 sqm and building with HGB Nos. 840, 841 and 842/Paal
Merah which are registered under the name of GFA, a subsidiary. � Medical equipment, furniture fixtures and office equipment, trade accounts receivable and inventory of
medicine and consumable goods, and machinery and medical equipments.
Based on the loan agreement, GFA has to maintain maximum debt to equity ratio of 3.2 times.
23. Bonds Payable
March 31, 2013 December 31, 2012
Rp Rp
Nominal (2013: USD 772,535,000; 2012: USD 642,535,000) 7,508,267,665,000 6,213,313,450,000
Premium 107,892,003,955 56,504,998,004
Bond Issuance Cost - Net (335,671,263,529) (326,288,811,569)
Total 7,280,488,405,426 5,943,529,636,435
Premium (net of discount) 125,681,248,498 70,049,479,998
Less: Accumulated Amortization (17,789,244,543) (13,544,481,994)
Unamortized Premium 107,892,003,955 56,504,998,004
Bond Issuance Costs 385,116,415,843 363,491,007,676
Less: Accumulated Amortization (49,445,152,314) (37,202,196,107)
Unamortized Bond Issuance Cost 335,671,263,529 326,288,811,569
The Company initiated several fund raising by issuing bonds to support the business of the Company and subsidiaries.
On March 9, 2006, Lippo Karawaci Finance B.V., a subsidiary, issued unsecured bonds with nominal value of USD 250,000,000 and annual fixed interest rate of 8.875% in Singapore Stock Exchange. The bonds have 5 years maturity period and became due on March 9, 2011. Payments of interest is conducted every 6 months. On May 11, 2010, part of bonds amounting to USD 183,754,000 was exchanged with bonds issued by Sigma Capital Pte. Ltd., a subsidiary. These bonds have been fully paid by the Company on March 9, 2011.

These consolidated financial statements are originally issued in Indonesian language
PT LIPPO KARAWACI Tbk AND SUBSIDIARIES NOTES TO THE CONSOLIDATED FINANCIAL STATEMENTS (Continued) As of March 31, 2013 (Unaudited) and December 31, 2012 (Audited) and For the 3 (three) Months Ended March 31, 2013 and 2012 (Unaudited) (Expressed In Full Rupiah, Unless Otherwise Stated)
FD/May 7, 2013 60 paraf:
In relation to exchange offer of bonds, on May 11, 2010, Sigma Capital Pte. Ltd. (SC), a subsidiary, issued unsecured bonds with a nominal value of USD 270,608,000, and subsequently, on February 17, 2011, SC issued unsecured bond with a nominal value of USD 125,000,000, both bonds bear an annual fixed interest rate of 9% and are listed on Singapore Stock Exchange and will due on April 30, 2015. Payment of interest will be conducted every 6 months. As of March 31, 2013 and December 31, 2012, accrued interest expense amounted to USD 4,083,593 and USD 1,417,606 (equivalent to Rp 39,688,440,367 and Rp 13,708,254,081), respectively.
On May 16, 2012, Theta Capital Pte. Ltd. (TC), a subsidiary, issued unsecured bonds with nominal value of USD 150,000,000 and subsequently, on October 22, 2012, TC issued unsecured bond with a nominal value of USD 100,000,000 both bonds bear an annual fixed interest rate of 7% and are listed on Singapore Stock Exchange. The bond have 7 years maturity period and will due on May 16, 2019. Payment of interest is conducted every 6 months. As of March 31, 2013 and December 31, 2012, accrued interest expense amounted to USD 3,908,333 and USD 2,605,555 (equivalent to Rp 37,985,088,427 and Rp 25,323,389,045) and USD 1,355,945 and USD 903,963 (equivalent to Rp 13,111,988,150 and Rp 8,741,322,210), respectively.
In relation to exchange offer program of bonds, on November 14, 2012, Theta Capital Pte. Ltd., a subsidiary, issued unsecured bonds with nominal value of USD 273,306,000 in exchange with bond of Sigma Capital Pte. Ltd. for a nominal value of USD 253,713,000 and paid USD 22,666,000. This bonds bears an annual fixed interest rate of 6.125% and are listed on Singapore Stock Exchange and will due on November 14, 2020. Payment of interest is conducted every 6 months. As of March 31, 2013 and December 31, 2012, accrued interest expense amounted to USD 6,370,497 and USD 2,064,480 (equivalent to Rp 61,914,860,343 and Rp 19,963,520,730), respectively.
On January 14, 2013, Theta Capital Pte. Ltd (TC), a subsidiary, issued unsecured bonds with nominal value of USD 130,000,000. This bonds bears an annual fixed interest rate of 6,125% and is listed on Singapore Stock Exchange. The bond have 8 years maturity period and will due on November 14, 2020. Payment of interest is conducted every 6 months. As of March 31, 2013 accrued interest expense amounted to USD 3,008,055 (equivalent to Rp 29,235,286,545), respectively.
Interest expense and other borrowing cost capitalized into inventories for the 3 (three) months ended March 31, 2013 and for the year ended December 31, 2012 amounted to Rp 121,000,863,576 and Rp 369,947,553,880, respectively (see Note 7).
These bonds have been rated BB- by Standard & Poor's and Fitch and B1 by Moody's. The Company has to comply with certain restrictions under bond covenants as stipulated in the Offering Circular.
The Company entered into Non-Deliverable USD Call Spread Option facility agreements with certain third parties to hedge foreign exchange fluctuation risk on these foreign currency denominated bonds (see Note 40.c).
24. Long-Term Post-Employment Benefits Liability
Post-Employment Benefit – No Funding Defined Benefit Plan The Company and subsidiaries appointed independent actuaries to determine and recognize post-employment liability in accordance with the existing manpower regulations. Post-employment benefits liability as of December 31, 2012 was calculated by PT Mega Jasa Aktuaria and PT Dayamandiri Dharmakonsilindo with reports, respectively dated February 1, 2013. The management believes that the estimate of post-employment benefits is sufficient to cover such liabilities.
These consolidated financial statements are originally issued in Indonesian language
PT LIPPO KARAWACI Tbk AND SUBSIDIARIES NOTES TO THE CONSOLIDATED FINANCIAL STATEMENTS (Continued) As of March 31, 2013 (Unaudited) and December 31, 2012 (Audited) and For the 3 (three) Months Ended March 31, 2013 and 2012 (Unaudited) (Expressed In Full Rupiah, Unless Otherwise Stated)
FD/May 7, 2013 61 paraf:
Post-employment benefits recognized in the consolidated statements of financial position are as follows:
December 31, 2012
Rp
Present Value of Defined Benefit Obigation 201,016,264,584
Unrecognized Actuarial Loss (38,149,032,370)
Total 161,333,982,735
The details of post-employment benefits expense recognized in the consolidated statements of comprehensive income are as follows:
December 31, 2012
Rp
Current Service Cost 30,229,708,612
Interest Expense 10,034,995,031
Past Service Cost (Non-Vested) 1,616,075,060
Recognized Actuarial Loss (1,371,572,550)
Adjustment 234,529,015
Total 40,743,735,168
Post-employment benefits expense is recorded as part of the cost of salaries and employee benefits (see Note 36).
Reconciliation of changes in liabilities recognized in the consolidated statements of financial position is as follow:
December 31, 2012
Rp
Balance on January 1 143,171,484,230Payment of Employees' Benefits in the Current Year (9,353,997,281)Adjustment 803,012,572Company’s Contribution (14,030,251,954)Expense During the Year 40,743,735,168
Balance 161,333,982,735
Reconciliation of changes in present value of defined benefit obligation is as follows: December 31, 2012
Rp
Present Value of Defined Benefit Obigation in January 1 148,435,574,952
Past Service Cost (Non-Vested) (13,409,610,768)
Current Service Cost 30,229,708,612
Interest Expense 10,034,995,031
Benefits Payment (9,353,997,281)
Unrecognized Actuarial Loss 35,079,594,038
Present Value of Defined Benefit Obligation 201,016,264,584

These consolidated financial statements are originally issued in Indonesian language
PT LIPPO KARAWACI Tbk AND SUBSIDIARIES NOTES TO THE CONSOLIDATED FINANCIAL STATEMENTS (Continued) As of March 31, 2013 (Unaudited) and December 31, 2012 (Audited) and For the 3 (three) Months Ended March 31, 2013 and 2012 (Unaudited) (Expressed In Full Rupiah, Unless Otherwise Stated)
FD/May 7, 2013 62 paraf:
Present value of defined benefit obligation, related current service cost and past service cost has been calculated by independent actuaries using the following assumptions:
December 31, 2012
Interest Rates 8%
Salary Increase Projection Rates 8%
Mortality Rates Indonesia – II
Permanent Disability Rates 10% x TMI – II
Resignation Rates 1% for age 18 – 44,
0% for age 45 – 54
25. Advances from Customers
March 31, 2013 December 31, 2012
Rp Rp
Third Parties
Apartment 1,882,487,640,264 1,574,320,252,270
Residential Houses and Shophouses 1,604,629,197,349 1,422,626,683,122
Land Lots 843,745,293,236 801,004,988,760
Shopping Centers 192,850,458,137 195,634,112,567
Total Advances from Customers 4,523,712,588,986 3,993,586,036,719
Current Portion 1,648,235,501,394 1,850,726,035,076
Non-Current Portion 2,875,477,087,592 2,142,860,001,643
Details of the percentage of advances from customer to sales price are as follows:
March 31, 2013 December 31, 2012
Rp Rp
100% 2,917,381,842,098 3,018,924,963,244
50% - 99% 288,907,866,303 612,732,634,474
20% - 49% 307,953,033,955 218,273,422,038
Under 20% 1,009,469,846,630 143,655,016,963
Total 4,523,712,588,986 3,993,586,036,719
26. Deferred Income
March 31, 2013 December 31, 2012
Rp Rp
Related Party
Rent (see Notes 10 dan 40.b) 573,277,755,573 576,888,263,544
Third Parties
Rent 147,196,658,294 148,589,134,911
Others 13,582,829,625 17,120,522,172
Subtotal 160,779,487,919 165,709,657,083
Total Deferred Income 734,057,243,492 742,597,920,627
Current Portion 81,147,110,836 79,696,900,858
Non-Current Portion 652,910,132,656 662,901,019,769
These consolidated financial statements are originally issued in Indonesian language
PT LIPPO KARAWACI Tbk AND SUBSIDIARIES NOTES TO THE CONSOLIDATED FINANCIAL STATEMENTS (Continued) As of March 31, 2013 (Unaudited) and December 31, 2012 (Audited) and For the 3 (three) Months Ended March 31, 2013 and 2012 (Unaudited) (Expressed In Full Rupiah, Unless Otherwise Stated)
FD/May 7, 2013 63 paraf:
27. Deferred Gain on Sale and Leaseback Transaction
March 31, 2013 December 31, 2012
Rp Rp
Acquisition Cost 590,890,086,932 590,890,086,932
Accumulated Depreciation 127,538,766,701 127,538,766,701
Carrying Value 463,351,320,231 463,351,320,231
Proceeds 1,714,252,775,595 1,714,252,775,595
Less: Gain Credited to the Consolidated
Laba Rugi Komprehensif Konsolidasian 14,666,752,836 14,666,752,836
Deferred Gain on Sale and Leaseback Transaction 1,236,234,702,528 1,236,234,702,528
Foreign Exchange Translation 32,228,667,247 28,513,578,716
Accumulated Amortization (343,914,000,209) (320,893,545,117)
Deferred Gain on Sale and Leaseback - Net 924,549,369,566 943,854,736,127
Current Portion 84,925,516,385 84,727,362,523
Non-Current Portion 839,623,853,181 859,127,373,604
Deferred gain on sale and leaseback transactions is amortized over 15 years of lease period using the straight line method (see Note 40.b).
28. Capital Stock
The Company stockholders’ composition as of March 31, 2013 and December 31, 2012 is as follows:
Total Percentage Issued
Shares Ownership and Fully Paid
% Rp
Pacific Asia Holdings Ltd 4,126,619,908 18.12 412,661,990,800
Others (less than 5% each) 18,644,965,211 81.88 1,864,496,521,100
Sub Total 22,771,585,119 100.00 2,277,158,511,900
Treasury Stocks 306,104,500 30,610,450,000
Total 23,077,689,619 2,307,768,961,900
March 31, 2013
Stockholders
Pacific Asia Holdings Ltd 4,126,619,908 18.12 412,661,990,800
Others (less than 5% each) 18,644,965,211 81.88 1,864,496,521,100
Sub Total 22,771,585,119 100.00 2,277,158,511,900
Treasury Stocks 306,104,500 30,610,450,000
Total 23,077,689,619 2,307,768,961,900
December 31, 2012
For 3 (three) months ended March 31, 2013 and year ended December 31, 2012, the acqusition cost of treasury stocks amounted to nil and Rp 154,792,655,006, respectively.

These consolidated financial statements are originally issued in Indonesian language
PT LIPPO KARAWACI Tbk AND SUBSIDIARIES NOTES TO THE CONSOLIDATED FINANCIAL STATEMENTS (Continued) As of March 31, 2013 (Unaudited) and December 31, 2012 (Audited) and For the 3 (three) Months Ended March 31, 2013 and 2012 (Unaudited) (Expressed In Full Rupiah, Unless Otherwise Stated)
FD/May 7, 2013 64 paraf:
The following is the reconciliation of the number of outstanding shares at the beginning and end of period:
March 31, 2013 December 31, 2012
(shares) (shares)
Outstanding shares on January 1 22,771,585,119 22,981,460,119
Treasury Stocks -- (209,875,000)
Outstanding shares 22,771,585,119 22,771,585,119
On June 6, 2011, the Company issued new 1,450,000,000 shares through issuance of non-preemptive rights capital stock (see Note 1.b).
From November 17, 2011 to December 21, 2011, the Company has repurchased (buyback) 96,229,500 shares at the prices ranged between Rp 620 – Rp 660 per share for the total consideration of Rp 61,731,458,788 and has reported to Bapepam-LK in its letter No. 005/LK-COS/I/2012 dated January 13, 2012.
The buyback of the outstanding shares was approved by the Deed of Extraordinary General Meeting of Stockholders dated November 15, 2011, as covered by deed No. 19 made in the presence of Unita Christina Winata, S.H., a notary in Jakarta.
From January 1, 2012 to December 31, 2012, the Company has repurchased (buyback) 209,875,000 shares at the prices ranged between Rp 670 – Rp 840 per share for the total consideration of Rp 154,844,896,875 (include taxes) and has reported to Bapepam-LK in its letter No. 009/LK-COS/I/2013 dated January 15, 2013.
29. Additional Paid in Capital - Net
Rp Rp
Premium - Net 4,043,613,274,615 4,043,613,274,615
Difference in Value from Restructuring Transaction
between Entities Under Common Control - Net 19,535,347,265 19,535,347,265
Total 4,063,148,621,880 4,063,148,621,880
Premium-Net
Rp Rp
Rights Issue I
Premium on Stock 87,283,750,000 87,283,750,000
Stock Issuance Cost (11,844,180,664) (11,844,180,664)
Subtotal 75,439,569,336 75,439,569,336
Rights Issue II
Premium on Stock 485,048,197,150 485,048,197,150
Stock Issuance Cost (7,442,812,013) (7,442,812,013)
Subtotal 477,605,385,137 477,605,385,137
Premium on Exercising Warrant Series I 659,475,970,000 659,475,970,000
Excess of Market Value Over Par Value of Stock Issued
in Business Combination Exercised under Purchase Method 91,701,282,075 91,701,282,075

These consolidated financial statements are originally issued in Indonesian language
PT LIPPO KARAWACI Tbk AND SUBSIDIARIES NOTES TO THE CONSOLIDATED FINANCIAL STATEMENTS (Continued) As of March 31, 2013 (Unaudited) and December 31, 2012 (Audited) and For the 3 (three) Months Ended March 31, 2013 and 2012 (Unaudited) (Expressed In Full Rupiah, Unless Otherwise Stated)
FD/May 7, 2013 65 paraf:
Rp Rp
Rights Issue III
Premium on Stock 1,946,492,065,800 1,946,492,065,800
Stock Issuance Cost (18,495,197,733) (18,495,197,733)
Subtotal 1,927,996,868,067 1,927,996,868,067
Issuance of Capital Stock - Non-Preemptive Rights Issuance
Premium on Stock 812,000,000,000 812,000,000,000
Stock Issuance Cost (605,800,000) (605,800,000)
Subtotal 811,394,200,000 811,394,200,000
Net 4,043,613,274,615 4,043,613,274,615
On June 6, 2011, the Company issued new 1,450,000,000 shares through issuance of non-preemptive rights capital stock (see Note 1.b).
The excess of market value over the par value of stock issued during the business combination exercised under purchase method represents the difference between the highest share price reached during the 90 day period prior to the announcement of the business combination and par value of the Company’s issued shares.
Premium on exercising Warrant Series I represents the difference between warrant execution price and par value.
Difference in Value from Restructuring Transactions between Entities Under Common Control – Net
Rp
Transaction Before Business Combination
Net Asset Value of PT Saptapersada Jagatnusa 322,884,648
Acquisition Cost (5,000,000,000)
Difference in Value (4,677,115,352)
Transaction from Business Combination
Net Asset Value of Siloam 275,837,221,176
Acquisition Cost (85,173,967,500)
Difference in Value 190,663,253,676
Realization (84,027,724,260)
Net 106,635,529,416
Net Asset Value of Lippo Land 69,227,950,557
Acquisition Cost (265,747,071,500)
Difference in Value (196,519,120,943)
Net Asset Value of Aryaduta 199,314,766,000
Acquisition Cost (39,637,690,500)
Difference in Value 159,677,075,500
Realization (45,581,021,356)
Net 114,096,054,144
Total 19,535,347,265
Difference in value from the restructuring transaction of PT Saptapersada Jagatnusa (SPJN), was incurred during the Company’s acquisition of SPJN in 2001.
Difference in value from restructuring transactions between entities under common control from business combination amounting to Rp 190,663,253,676, (Rp 196,519,120,943) and Rp 159,677,075,500, respectively, were incurred from the merger of ex-Siloam (including ex-Sumber Waluyo), ex-Lippo Land, and ex-Aryaduta in 2004. The difference was determined from the difference in net asset value of ex-Siloam (including ex-Sumber Waluyo), ex-Lippo Land, and ex-Aryaduta and the nominal value of new shares issued by the Company.

These consolidated financial statements are originally issued in Indonesian language
PT LIPPO KARAWACI Tbk AND SUBSIDIARIES NOTES TO THE CONSOLIDATED FINANCIAL STATEMENTS (Continued) As of March 31, 2013 (Unaudited) and December 31, 2012 (Audited) and For the 3 (three) Months Ended March 31, 2013 and 2012 (Unaudited) (Expressed In Full Rupiah, Unless Otherwise Stated)
FD/May 7, 2013 66 paraf:
30. Difference in Transactions with Non-Controlling Interest
In 2012, LK Reit Management Pte Ltd (LK Reit), a subsidiary, acquired shares of Bowsprit Capital Corporation Ltd. from Battery Road Limited and Golden Decade International Limited, both third parties and therefore, LK Reit ownership increased from 80% to 100%. The excess of acquisition cost over the subsidiaries’ net assets amounted to Rp 45,889,312,357 was recorded as changes in non-controlling interest transaction.
In 2012, PT Wisma Jatim Propertindo (WJP), a subsidiary, acquired shares of PT Gapura Sakti Prima (GSP) from Mr Abdul Wahid, a third party, and thus the ownership in GSP increased from 78.60% to 100%. The excess of acquisition cost over the subsidiaries’ net assets amounted to Rp 7,525,000,000 was recorded as changes in non-controlling interest transaction. In 2011, Peninsula Investment Limited (Peninsula), a subsidiary, acquired shares of LMIRT Management Ltd (formerly Lippo Mappletree Indonesia RTM Ltd.) from Mappletree LM Pte. Ltd., a third party, and thus the ownership of Peninsula to LMIR TM increased from 60% to 100%. The excess of acquisition cost over the subsidiaries’ net assets amounted to Rp 177,677,727,750 was recorded as changes in non-controlling interest transaction.
The following is the calculation of the difference in transactions with non-controlling interest transactions:
March 31, 2013 December 31, 2012
Rp Rp
Acquisition Cost 296,163,642,857 296,163,642,857
Net Asset Value of Acquired (74,380,954,358) (74,380,954,358)
Difference from Foreign Currency Translations 21,536,867,477 21,105,562,928
Total 243,319,555,976 242,888,251,427
31. Cash Dividend and Reserved Fund
Based on Deed of Annual General Meeting of Stockholders No. 2 dated April 5, 2012 which was made in the presence of Sriwi Bawana Nawaksari, S.H. M.Kn., a notary in Tangerang, the Company’s stockholders approved the payment of dividend amounting to Rp 177,5 billion and increased the reserved fund amounting to Rp 1 billion from retained earnings of 2011.
32. Other Comprehensive Income
March 31, 2013 December 31, 2012
Rp Rp
Gain on Changes in Fair Value of Available-for-Sale Financial Assets 1,309,718,734,696 894,254,875,437
Gain from Translations Financial Statements in Foreign Currency 42,091,977,555 60,134,221,651
Total 1,351,810,712,251 954,389,097,088
Gain (Loss) on Changes in Fair Value of Available-for-Sale Financial Assets
March 31, 2013 December 31, 2012
Rp Rp
Investment in FREIT (see Note 6)
Bridgewater International Ltd 637,237,713,756 447,188,306,071Bowsprit Capital Corporation Ltd 100,331,047,716 64,467,009,632PT Menara Tirta Indah 120,887,492,720 57,694,769,690

These consolidated financial statements are originally issued in Indonesian language
PT LIPPO KARAWACI Tbk AND SUBSIDIARIES NOTES TO THE CONSOLIDATED FINANCIAL STATEMENTS (Continued) As of March 31, 2013 (Unaudited) and December 31, 2012 (Audited) and For the 3 (three) Months Ended March 31, 2013 and 2012 (Unaudited) (Expressed In Full Rupiah, Unless Otherwise Stated)
FD/May 7, 2013 67 paraf:
March 31, 2013 December 31, 2012
Rp Rp
Investment in LMIRT (see Note 6)
Bridgewater International Ltd 362,441,481,542 249,830,662,375LMIRT Management Ltd 88,820,998,962 75,074,127,669
Gain on Changes in Fair Value of
Available-for-Sale Financial Assets 1,309,718,734,696 894,254,875,437
33. Non- Controlling Interest
Details of non-controlling interests in the equity and share of results of consolidated subsidiaries are as follows:
March 31, 2013 December 31, 2012
Rp Rp
PT Lippo Cikarang Tbk 620,641,262,948 560,550,472,618
PT Gowa Makassar Tourism Development Tbk 129,120,249,175 116,392,851,679
PT Darma Sarana Nusa Pratama 76,443,269,646 58,955,610,504
PT Wahana Usaha Makmur 42,235,996,214 37,027,712,625
PT Pelangi Cahaya Intan Makmur 19,116,077,752 17,840,270,249
PT Siloam International Hospitals 10,776,489,071 11,461,117,213
PT Surplus Multi Makmur 4,161,673,443 4,161,673,443
PT Mitra Mulia Kreasi 5,664,251,656 5,445,102,970
Others (each below Rp 1 Billion) 2,480,919,859 2,154,842,410
Total Non-Controlling Interest 910,640,189,764 813,989,653,710
34. Revenues
Management fees revenue represents revenue of shopping centers from management services and as manager of REIT. Revenue from asset enhancement represents revenue from rental of the Company’s assets. For each period, there are no sales to customers with sales amount above 10% of net revenues.
2013 2012
(3 Months) (3 Months)
Rp Rp
Urban Development:
Land Lots 228,201,983,802 201,478,934,596
Residential Houses and Shophouses 107,660,712,062 106,457,080,930
Memorial Park 32,635,222,315 28,595,715,191
Asset Enhancements 14,355,460,453 7,625,702,140
Subtotal 382,853,378,632 344,157,432,857
Large Scale Integrated Development:
Apartments 228,709,063,474 196,443,696,985
Asset Enhancements 8,581,843,507 6,813,258,415
Subtotal 237,290,906,981 203,256,955,400
Retail Malls:
Asset Enhancements 58,141,874,571 33,929,322,616
Shopping Centres 1,517,710,051 7,015,642,996
Subtotal 59,659,584,622 40,944,965,612
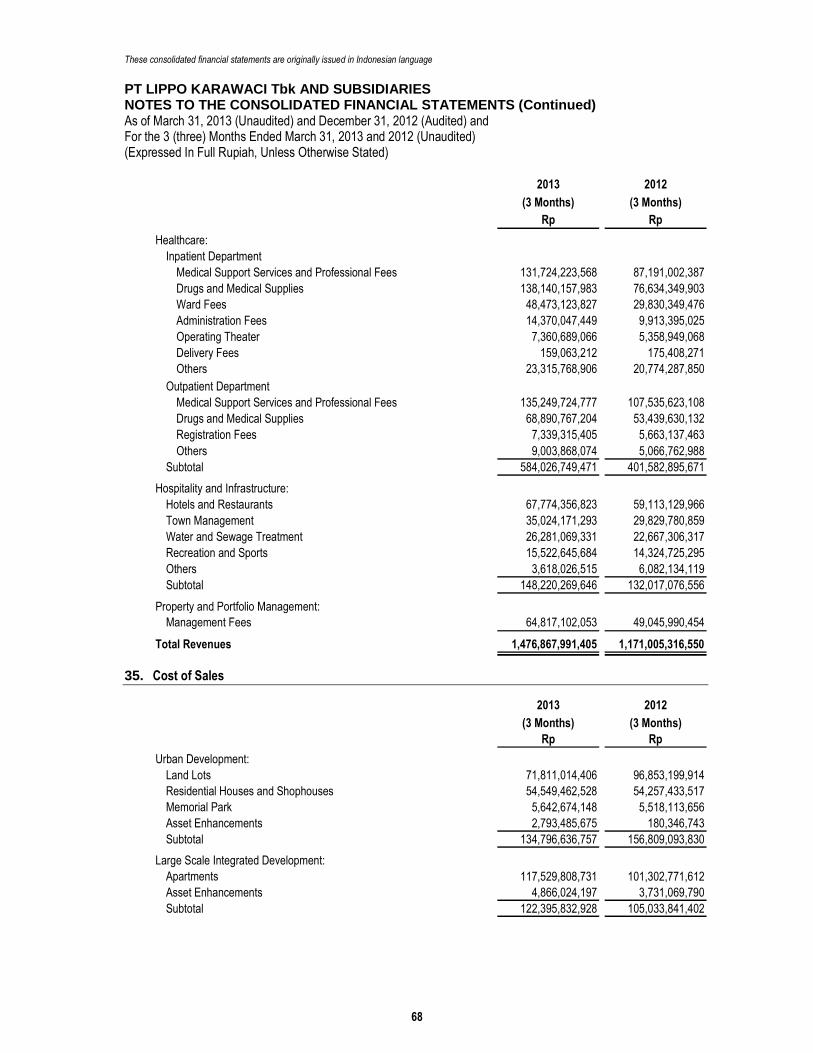
These consolidated financial statements are originally issued in Indonesian language
PT LIPPO KARAWACI Tbk AND SUBSIDIARIES NOTES TO THE CONSOLIDATED FINANCIAL STATEMENTS (Continued) As of March 31, 2013 (Unaudited) and December 31, 2012 (Audited) and For the 3 (three) Months Ended March 31, 2013 and 2012 (Unaudited) (Expressed In Full Rupiah, Unless Otherwise Stated)
FD/May 7, 2013 68 paraf:
2013 2012
(3 Months) (3 Months)
Rp Rp
Healthcare:
Inpatient Department
Medical Support Services and Professional Fees 131,724,223,568 87,191,002,387
Drugs and Medical Supplies 138,140,157,983 76,634,349,903
Ward Fees 48,473,123,827 29,830,349,476
Administration Fees 14,370,047,449 9,913,395,025
Operating Theater 7,360,689,066 5,358,949,068
Delivery Fees 159,063,212 175,408,271
Others 23,315,768,906 20,774,287,850
Outpatient Department
Medical Support Services and Professional Fees 135,249,724,777 107,535,623,108
Drugs and Medical Supplies 68,890,767,204 53,439,630,132
Registration Fees 7,339,315,405 5,663,137,463
Others 9,003,868,074 5,066,762,988
Subtotal 584,026,749,471 401,582,895,671
Hospitality and Infrastructure:
Hotels and Restaurants 67,774,356,823 59,113,129,966
Town Management 35,024,171,293 29,829,780,859
Water and Sewage Treatment 26,281,069,331 22,667,306,317
Recreation and Sports 15,522,645,684 14,324,725,295
Others 3,618,026,515 6,082,134,119
Subtotal 148,220,269,646 132,017,076,556
Property and Portfolio Management:
Management Fees 64,817,102,053 49,045,990,454
Total Revenues 1,476,867,991,405 1,171,005,316,550
35. Cost of Sales
2013 2012
(3 Months) (3 Months)
Rp Rp
Urban Development:
Land Lots 71,811,014,406 96,853,199,914
Residential Houses and Shophouses 54,549,462,528 54,257,433,517
Memorial Park 5,642,674,148 5,518,113,656
Asset Enhancements 2,793,485,675 180,346,743
Subtotal 134,796,636,757 156,809,093,830
Large Scale Integrated Development:
Apartments 117,529,808,731 101,302,771,612
Asset Enhancements 4,866,024,197 3,731,069,790
Subtotal 122,395,832,928 105,033,841,402

These consolidated financial statements are originally issued in Indonesian language
PT LIPPO KARAWACI Tbk AND SUBSIDIARIES NOTES TO THE CONSOLIDATED FINANCIAL STATEMENTS (Continued) As of March 31, 2013 (Unaudited) and December 31, 2012 (Audited) and For the 3 (three) Months Ended March 31, 2013 and 2012 (Unaudited) (Expressed In Full Rupiah, Unless Otherwise Stated)
FD/May 7, 2013 69 paraf:
2013 2012
(3 Months) (3 Months)
Rp Rp
Retail Malls:
Asset Enhancements -- 8,916,617,738
Shopping Centres 573,146,179 2,334,334,480
Subtotal 573,146,179 11,250,952,218
Healthcare:
Inpatient Department
Salaries and Employee Benefits 118,400,379,977 79,839,116,525
Drugs and Medical Supplies 83,165,281,379 63,001,749,572
Clinical Supplies 19,272,451,770 8,329,063,756
Depreciation 21,234,508,651 4,992,277,435
Food and Beverages 9,602,151,284 4,501,710,502
Repair and Maintenance 1,259,770,028 1,567,833,990
Others 13,479,247,653 5,646,507,484
Outpatient Department
Salaries and Employee Benefits 77,545,665,372 61,196,712,223
Drugs and Medical Supplies 55,145,000,286 35,306,385,039
Clinical Supplies 6,089,883,547 6,494,558,766
Depreciation 11,145,291,076 2,963,588,317
Repair and Maintenance 799,353,512 1,203,264,132
Others 5,244,894,559 4,919,645,587
Subtotal 422,383,879,094 279,962,413,328
Hospitality and Infrastructure:
Hotels and Restaurants 22,978,402,725 18,495,454,396
Town Management 23,980,414,349 17,321,927,311
Water and Sewage Treatment 8,787,736,555 7,297,965,279
Recreation and Sports 4,579,452,883 4,262,174,165
Others 3,267,315,469 5,074,040,918
Subtotal 63,593,321,981 52,451,562,069
Property and Portfolio Management:
Management Fees 20,066,811,750 21,681,688,768
Total Cost of Sales 763,809,628,689 627,189,551,615
There are no purchases above 10% of net revenues for both periods.
36. Operating Expenses
2013 2012
(3 Months) (3 Months)
Rp Rp
Selling Expenses
Marketing and Advertising 27,011,326,240 23,075,993,061
Management Fees 7,410,483,143 11,009,657,229
Salaries and Employee Benefits 12,582,034,760 10,712,872,843
Repairs and Maintenance 4,561,357,965 5,924,625,734
Depreciation (see Notes 12 and 13) 3,887,298,612 3,820,727,233
Transportation and Accommodation 2,070,925,184 1,800,829,317

These consolidated financial statements are originally issued in Indonesian language
PT LIPPO KARAWACI Tbk AND SUBSIDIARIES NOTES TO THE CONSOLIDATED FINANCIAL STATEMENTS (Continued) As of March 31, 2013 (Unaudited) and December 31, 2012 (Audited) and For the 3 (three) Months Ended March 31, 2013 and 2012 (Unaudited) (Expressed In Full Rupiah, Unless Otherwise Stated)
FD/May 7, 2013 70 paraf:
2013 2012
(3 Months) (3 Months)
Rp Rp
Office Supplies 1,443,111,742 1,608,263,680
Rent 4,605,638,026 1,553,307,120
Electricity and Water 852,652,886 1,159,538,540
Communication 352,150,263 460,281,899
Others 882,743,355 1,085,474,910
Subtotal 65,659,722,176 62,211,571,566
General and Administrative Expenses
Salaries and Employee Benefits 119,960,751,547 76,524,283,877
Depreciation (see Note 13) 26,184,600,421 31,332,555,488
Rent 37,165,155,830 23,485,923,107
Water and Electricity 26,321,819,654 20,041,479,824
Professional Fees 11,292,573,161 14,016,558,229
Transportation and Accommodation 13,373,708,800 9,541,932,949
Repairs and Maintenance 9,957,710,120 7,050,874,329
Office Supplies 6,756,227,220 4,995,514,546
Training and Seminar 3,048,899,304 3,013,224,104
Communication 3,907,474,584 2,851,291,178
Insurance 2,172,973,177 1,509,532,521
Membership and Subscription Fees 1,646,797,519 1,147,290,998
Others 12,263,320,037 6,765,326,002
Subtotal 274,052,011,374 202,275,787,152
Total Operating Expenses 339,711,733,550 264,487,358,718
37. Financial Income (Expense) - Net
2013 2012
(3 Months) (3 Months)
Rp Rp
Interest Income 36,691,323,616 21,732,827,957
Interest Expense (37,599,319,593) (30,512,826,911)
Total Financial Expense - Net (907,995,977) (8,779,998,954)
Interest income represents interest income from bank accounts, time deposits and restricted funds (see Notes 4 and 9), while interest expense represents interest on loans (see Notes 20, 22 and 23).
38. Other Income (Expenses) - Net
2013 2012
(3 Months) (3 Months)
Other Income
Dividend Income 34,094,851,030 19,881,370,776
Gain on Foreign Exchange 2,931,091,886 17,721,093,653
Others 210,176,666 3,134,587,972
Total Other Income 37,236,119,582 40,737,052,401

These consolidated financial statements are originally issued in Indonesian language
PT LIPPO KARAWACI Tbk AND SUBSIDIARIES NOTES TO THE CONSOLIDATED FINANCIAL STATEMENTS (Continued) As of March 31, 2013 (Unaudited) and December 31, 2012 (Audited) and For the 3 (three) Months Ended March 31, 2013 and 2012 (Unaudited) (Expressed In Full Rupiah, Unless Otherwise Stated)
FD/May 7, 2013 71 paraf:
2013 2012
(3 Months) (3 Months)
Other Expense
Amortization Expense 7,467,521,896 12,134,682,775
Others 5,999,140,032 815,680,042
Total Other Expense 13,466,661,928 12,950,362,817
Dividend Income Dividend income represents dividend from LMIR Trust and First REIT by Bridgewater International Ltd., Bowsprit Capital Corporation Ltd., LMIRT Management Ltd. (formerly Lippo Mappletree Indonesia RTM Ltd.) and PT Menara Tirta Indah, all subsidiaries.
Amortization Expense Amortization Expense represents amortization of bonds issuance cost in Sigma Capital Pte Ltd and Theta Capital Pte Ltd, both subsidiaries.
39. Basic Earnings Per Share
The calculation of basic earnings per share is as follows:
2013 2012
(3 Months) (3 Months)
Profit for the Period Attributable to Owners
of the Parent Company (Rupiah) 251,697,732,221 205,220,379,099
Weighted Average Number of Common Stocks (Share) 22,771,585,119 22,924,876,786
Basic Earnings per Share (Rupiah) 11.05 8.95
40. Commitments
a. Operational and Management Agreement
� On September 17, 1993, ex-Aryaduta entered into an agreement with the Regional Government of Riau (“Riau Government”) in connection with the operation of Aryaduta Hotel Pekanbaru (AHP). According to the agreement, the Company agreed to plan, develop and operate AHP while the Riau Government agreed to provide Right to Use No. 466 with a land area of 21,360 sqm at Jl. Diponegoro, Simpang Empat, Pekanbaru. The Government receive a royalty fee and a share in the hotel’s profits as compensation. This agreement is valid for 25 years commencing from the date of the grand opening of the hotel and can be extended for another 10 years. In an amendment to the agreement with the Regional Government dated July 7, 1997, the Regional Government of Riau granted a land right in the name of ex-Aryaduta which will be returned to Regional Government of Riau at the end of the agreement. The grand opening was conducted at January 1, 2001.
Royalty fee expenses charged to operations amounted to Rp 55,555,500 for the 3 (three) months ended March 31, 2013 and 2012.
� On August 20, 2004, the Company entered into an agreement with PT Untaian Rejeki Abadi (URA) whereby the Company will provide technical and marketing services to URA’s business property with an area of 10,568 sqm up to May 27, 2034, which can be extended. URA shall pay a certain amount as specified in the agreement.
� On April 9, 2006, PT Lippo Malls Indonesia (formerly PT Consulting & Management Service Division (LMI), a subsidiary, entered into shopping centers management agreement with their main stockholders to manage, to sell and maintain the shopping centers’ facilities. LMI shall receive

These consolidated financial statements are originally issued in Indonesian language
PT LIPPO KARAWACI Tbk AND SUBSIDIARIES NOTES TO THE CONSOLIDATED FINANCIAL STATEMENTS (Continued) As of March 31, 2013 (Unaudited) and December 31, 2012 (Audited) and For the 3 (three) Months Ended March 31, 2013 and 2012 (Unaudited) (Expressed In Full Rupiah, Unless Otherwise Stated)
FD/May 7, 2013 72 paraf:
certain management service fee as stipulated in the agreement. Total management fee earned for the 3 (three) months ended March 31, 2013 and 2012 amounted to Rp 25.7 billion and Rp 21.3 billion, respectively.
� Lippo-Malls Indonesia Retail Trust Management Ltd. (LMIR TM), a subsidiary, entered into an agreement with HSBC Institutional Trust Services (Singapore) Limited, as a trustee of Lippo-Malls Indonesia Retail Trust (LMIR Trust) effective from the listing date of LMIR Trust (November 14, 2007). Based on the agreement, LMIR TM will provide management services to LMIR Trust, among others, investment strategic and investment as well as divestment recommendations. For such services, LMIR TM shall receive certain compensation as stated in the agreement.
� The Company and subsidiaries entered into several agreements with contractors for the development of their projects. As of March 31, 2013 and December 31, 2012 total outstanding commitment amounted to Rp 1,920 billion and Rp 1,631 billion, respectively. Several of unrealized significant contracts as of as of March 31, 2013 are as follows:
Subsidiaries Contractor Contract Unrealized
Value Contract
Value
(Rp billion) (Rp billion)
PT Lippo Cikarang Tbk Trilogi Suryawisesa 972 184
PT Mandiri Cipta Gemilang PT Pembangunan Perumahan (Persero) Tbk 393 114
PT Mandiri Cipta Gemilang PT Hutama Karya (Persero) 440 108
PT Lippo Cikarang Tbk Lampiri - Tsw Jo 172 100
PT Almaron Perkasa PT Pembangunan Perumahan (Persero) Tbk 176 38
PT Lippo Cikarang Tbk Utama Tiga Dihardja 66 28
PT Lippo Cikarang Tbk Karta Santosa Unggul 57 21
PT Gowa Makassar Tourism Development Tbk PT Santata Graha Manunggal 36 21
PT Mulia Sentosa Dinamika PT Djasa Ubersakti 92 18
PT Lippo Cikarang Tbk PT Adimitra Wilangtama 27 14
PT Lippo Cikarang Tbk Adi Mitra Wilangtama 27 14
PT Gowa Makassar Tourism Development Tbk CV Afit Lintas Jaya 21 13
PT Gowa Makassar Tourism Development Tbk PT Dika Muncul Jaya 16 12
PT Lippo Cikarang Tbk Pancawira Bangun Pratama 22 11
PT Lippo Cikarang Tbk PT Asia Luhur Budi 46 9
PT Mandiri Cipta Gemilang Rekagunatek Persada 15 9
PT Mandiri Cipta Gemilang PT Pangkal Multi Karya 36 8
PT Lippo Cikarang Tbk Yesaya Ekasarana 37 7
b. Rental Agreements � Based on Deed of Lease Agreement No. 6 dated November 12, 2008 which was made made in the
presence of Julijanti Sundjaja, S.H., a notary in Tangerang, PT Mandiri Cipta Gemilang (MCG), subsidiary, entered into a lease agreement with PT Matahari Putra Prima Tbk (MPPA) for a period of 20 years starting from the opening date of St. Moritz with a total rental income of Rp 324,259,600,000.
Based on the amendment of the lease agreement on December 2010, due to the delay of the handover of the store until June 2013, the MPPA will receive compensation for the additional lease period of 5 years and promotion allowance for the opening of the store amounting to Rp 9,700,000,000. Up to March 31, 2013, the store has not opened yet.
� Based on lease agreement No. 001/LA-LK/PTLK-PTKG/BD-106/II-05 dated March 4, 2005 which was amended on October 21, 2005, the Company leases a plot of land with an area of 3,848.57 sqm to PT Shell Indonesia (SI) (formerly PT Kridapetra Graha). The lease period is for 10 years commenced from the lease agreement date. The total value of lease amounted to Rp 16,560,000,000.

These consolidated financial statements are originally issued in Indonesian language
PT LIPPO KARAWACI Tbk AND SUBSIDIARIES NOTES TO THE CONSOLIDATED FINANCIAL STATEMENTS (Continued) As of March 31, 2013 (Unaudited) and December 31, 2012 (Audited) and For the 3 (three) Months Ended March 31, 2013 and 2012 (Unaudited) (Expressed In Full Rupiah, Unless Otherwise Stated)
FD/May 7, 2013 73 paraf:
� Based on Deeds of Sale and Purchase Agreements Nos. 233, 234, 235, 236, 237, 238, 239, 240, 241, 242, 243, 244, 245, 246, 247, 248, 249, 250, 251, 252, 253 and 254 dated December 11, 2006, all of which were made in the presence of Unita Christina, S.H., a notary in Tangerang, Deeds of Sale and Purchase Agreements Nos. 135, 136, 137, 138, 139, 140, 141, 142 and 143 dated December 11, 2006, all of which were made in the presence of Rusdi Muljono,S.H., a notary in Surabaya; and Deed of Sale and Purchase Agreement No. 41 dated December 11, 2006, which was made in the presence of Wenda Taurusita Amidjaja, S.H., a notary in Jakarta, the Company and PT Prudential Hotel Development, a subsidiary, transferred the land and building of their 3 hospitals and 1 hotel to PT Karya Sentra Sejahtera (KSS), PT Graha Indah Pratama (GIP), PT Tata Prima Indah (TPI) and PT Sentra Dinamika Perkasa (SDP) which are owned 100% directly by Lovage International Pte. Ltd., Henley Investments Pte. Ltd., Primerich Investment Pte. Ltd. and Got Pte. Ltd., whereas those Companies were owned by First Real Estate Investment Trust (First REIT). Based on rental agreement of Allen & Gledhill Advocates & Solicitors dated October 23, 2006, the Company entered into rental and management agreement of certain assets which have been transferred aforesaid, with KSS, GIP, TPI and SDP for 15 years. According to the agreement, the Company shall pay certain amount as stipulated in the agreement.
Sale and lease-back transaction above meets the classification of operating lease and the transaction price is above its fair value, then the difference is recognized as deferred gain (see Note 27).
Rental expense for the 3 (three) months ended March 31, 2013 and 2012 amounted to Rp 39,421,235,711 and Rp 39,878,252,176, respectively.
� On December 31, 2010, based on Deed of Sale and Purchase Agreement No 146/2010, PT East Jakarta Medika (EJM), subsidiary, sold the land and building of Siloam Cikarang Hospital (the Property) to PT Graha Pilar Sejahtera (GPS), a wholly owned subsidiary of First Real Estate Investment Trust (First REIT) at the selling price of SGD 33,333,333 and leasedback the Property.
Based on the rental agreement of Allen & Gledhill Advocates & Solicitors dated November 8, 2010, the Company entered into a lease agreement with GPS for 15 years. The Company shall pay certain amount as stipulated in the agreement.
Sale and lease-back transaction above meets the classification of operating lease and the transaction price is above its fair value, then the difference is recognized as deferred gain (see Note 27).
For the 3 (three) months ended March 31, 2013 and 2012, rental expense for sale and lease-back transaction amounted to Rp 5,987,324,247 and Rp 6,866,449,816, respectively.
� Based on the rental agreement of Allen & Gledhill Advocates & Solicitors dated November 8, 2010, the Company entered into a lease agreement with PT Primatama Cemerlang (PC), the owner of land and building of “Mochtar Riady Comprehensive Cancer Centre” for 15 years. The Company shall pay certain amount as stipulated in the agreement.
For the 3 (three) months ended March 31, 2013 and 2012, rental expense amounting to Rp 32,142,886,719 and Rp 31,696,028,435, respectively.
� Based on the rental agreement of Allen & Gledhill Advocates & Solicitors dated September 21, 2012, the Company entered into a lease agreement with PT Menara Abadi Megah (MAM), the owner of land and building of “Hotel Aryaduta dan Rumah Sakit Siloam Manado” for 15 years. The Company shall pay certain amount as stipulated in the agreement.
For the 3 (three) months ended March 31, 2013 and 2012, rental expense for sale and lease-back transaction amounted to Rp 14,586,376,813 and nil.

These consolidated financial statements are originally issued in Indonesian language
PT LIPPO KARAWACI Tbk AND SUBSIDIARIES NOTES TO THE CONSOLIDATED FINANCIAL STATEMENTS (Continued) As of March 31, 2013 (Unaudited) and December 31, 2012 (Audited) and For the 3 (three) Months Ended March 31, 2013 and 2012 (Unaudited) (Expressed In Full Rupiah, Unless Otherwise Stated)
FD/May 7, 2013 74 paraf:
� Based on the Deed of Sale and Purchase No. 091/2012, dated November 30, 2012, made before Maria Josefina Grace Kawi Tandiari S. H., a Notary in Makassar, PT Siloam Karya Sejahtera (SKS), a subsidiary, sold the land and buildings Siloam Hospitals Makassar (property) to PT Bayutama Sukses (BS), where BS is a subsidiary owned 100% by First Real Estate Investment Trust (First REIT). The selling price of the property amounted to Rp 467,287,558,000 and the property is leased back.
Based on the rental agreement of Allen & Gledhill Advocates & Solicitors dated September 21, 2012, the Company entered into a lease agreement for 15 years. The Company shall pay certain amount as stipulated in the agreement.
The sale and lease-back meets the classification of an operating lease and the transaction price in the fair value so that profits are recognized as deferred income (see Note 27).
For the 3 (three) months ended March 31, 2013 and 2012, rental expense for sale and lease-back transaction amounted to Rp 9,984,722,223 and nil.
c. Hedging Facility Agreements � On July 5 and September 2, 2010, the Company entered into Non-Deliverable USD Call Spread
Option facilities with Morgan Stanley & Co amounting to USD 50,000,000 with spread between Rp 8,500; Rp 9,000 and Rp 12,000 and USD 4,600,000 with spread between Rp 8,000; Rp 9,000 and Rp 11,500 with an annual premium rate of 1.78% and 2%, respectively, from notional amount. On January 30, 2013, the Company terminate (unwind) this facility.
� On April 5, 2011, the Company entered into Non-Deliverable USD Call Spread Option facility with Morgan Stanley & Co amounting to USD 40,000,000 for spread between Rp 8,500; Rp 9,200 and Rp 11,500 with an annual premium rate of 1.95% from notional amount. On January 30, 2013, the Company terminate (unwind) this facility.
� On May 29, 2012, the Company entered into Non-Deliverable USD Call Spread Option facility with Morgan Stanley & Co, amounting to USD 50,000,000 for spread between Rp 9,500 and Rp 11,500 with an annual premium rate of 1.26% from notional amount. Premium will be paid every May 16 and November 16. This facility will due on May 16, 2019. As of March 31, 2013, the fair value of this facility amounted to USD -310,099.16 (equivalent to Rp -3,013,853,736).
� On May 29, 2012, the Company entered into Non-Deliverable USD Call Spread Option facility with Deutsche Bank, Singapore branch, amounting to USD 50,000,000 for spread between Rp 9,500 and Rp 11,500 with an annual premium rate of 1.26% from notional amount. Premium will be paid every May 16 and November 16. This facility will due on May 16, 2019. As of March 31, 2013, the fair value of this facility amounted to USD -193,491.87 (equivalent to Rp -1,880,547,520).
� On June 5, 2012, the Company entered into Non-Deliverable USD Call Spread Option facility with J.P Morgan (S.E.A) Limited, Singapore branch, amounting to USD 25,000,000 for spread between Rp 9,500 and Rp 11,500 with an annual premium rate of 1.18% from notional amount. Premium will be paid every May 16 and November 16. This facility will due on May 16, 2019. As of March 31, 2013, the fair value of this facility amounted to USD 275,174.16 (equivalent to Rp 2,674,417,693).
� On June 26, 2012, the Company entered into Non-Deliverable USD Call Spread Option facility with Nomura International plc, United Kingdom branch, amounting to USD 25,000,000 for spread between Rp 9,500 and Rp 11,500 with an annual premium rate of 1.125% from notional amount. Premium will be paid every May 16 and November 16. This facility will due on May 16, 2019. As of March 31, 2013, the fair value of this facility amounted to USD 241,657.00 (equivalent to Rp 2,348,664,383).

These consolidated financial statements are originally issued in Indonesian language
PT LIPPO KARAWACI Tbk AND SUBSIDIARIES NOTES TO THE CONSOLIDATED FINANCIAL STATEMENTS (Continued) As of March 31, 2013 (Unaudited) and December 31, 2012 (Audited) and For the 3 (three) Months Ended March 31, 2013 and 2012 (Unaudited) (Expressed In Full Rupiah, Unless Otherwise Stated)
FD/May 7, 2013 75 paraf:
� On October 29, 2012, the Company entered into Non-Deliverable USD Call Spread Option facility with BNP Paribas, Singapore branch, amounting to USD 115,000,000 for spread between Rp 9,500 and Rp 11,500 with an annual premium rate of 0.69% from notional amount. Premium will be paid every May 16 and November 16. This facility will due on November 16, 2020. As of March 31, 2013, the fair value of this facility amounted to USD 2,068,896.84 (equivalent to Rp 20,107,608,388).
� On October 29, 2012, the Company entered into Non-Deliverable USD Call Spread Option facility with J.P Morgan (S.E.A) Limited, Singapore branch, amounting to USD 140,000,000 for spread between Rp 9,500 and Rp 11,500 with an annual premium rate of 0.69% from notional amount. Premium will be paid every May 14 and November 14. This facility will due on November 14, 2020. As of March 31, 2013, the fair value of this facility amounted to USD 3,151,875.00 (equivalent to Rp 30,633,073,125).
� On November 8, 2012, the Company entered into Non-Deliverable USD Call Spread Option facility with Morgan Stanley & Co, England branch, amounting to USD 21,000,000 for spread between Rp 9,500 and Rp 11,500 with an annual premium rate of 0.685% from notional amount. Premium will be paid every May 14 and November 14. This facility will due on November 14, 2020. As of March 31, 2013, the fair value of this facility amounted to USD 367,382.52 (equivalent to Rp 3,570,590,712).
• On January 15, 2013, the Company entered into Non-Deliverable USD Call Spread Option facility with Morgan Stanley & Co, England branch, amounting to USD 97,000,000 for spread between Rp 9,500 and Rp 11,500 with an annual premium rate of 0.525% from notional amount. Premium will be paid every May 14 and November 14. This facility will due on November 14, 2020. As of March 31, 2013, the fair value of this facility amounted to USD 3,998,809.99 (equivalent to Rp 38,864,434,293).
• On January 25, 2013, the Company entered into Non-Deliverable USD Call Spread Option facility with Nomura International plc, England branch, amounting to USD 50,000,000 for spread between Rp 9,500 and Rp 11,500 with an annual premium rate of 1.440% from notional amount. Premium will be paid every May 16 and November 16. This facility will due on May 16, 2019. As of March 31, 2013, the fair value of this facility amounted to USD 4,124,334.00 (equivalent to Rp 40,084,402,146).
• On January 28, 2013, the Company entered into Non-Deliverable USD Call Spread Option facility with Deutsche Bank, Singapore branch, amounting to USD 25,000,000 for spread between Rp 9,500 and Rp 11,500 with an annual premium rate of 1.450% from notional amount. Premium will be paid every May 16 and November 16. This facility will due on May 16, 2019. As of March 31, 2013, the fair value of this facility amounted to USD -306,158.34 (equivalent to Rp -2,975,552,906).
• On January 28, 2013, the Company entered into Non-Deliverable USD Call Spread Option facility with JP Morgan, Singapore branch, amounting to USD 25,000,000 for spread between Rp 9,500 and Rp 11,500 with an annual premium rate of 1.429% from notional amount. Premium will be paid every May 16 and November 16. This facility will due on May 16, 2019. As of March 31, 2013, the fair value of this facility amounted to USD -89,946.00 (equivalent to Rp -874,185,174).
• On January 29, 2013, the Company entered into Non-Deliverable USD Call Spread Option facility with BNP Paribas, amounting to USD 30,000,000 for spread between Rp 9,500 and Rp 11,500 with an annual premium rate of 1.075% from notional amount. Premium will be paid every May 14 and November 14. This facility will due on May 14, 2020. As of March 31, 2013, the fair value of this facility amounted to USD -283,806.86 (equivalent to Rp -2,758,318,873).
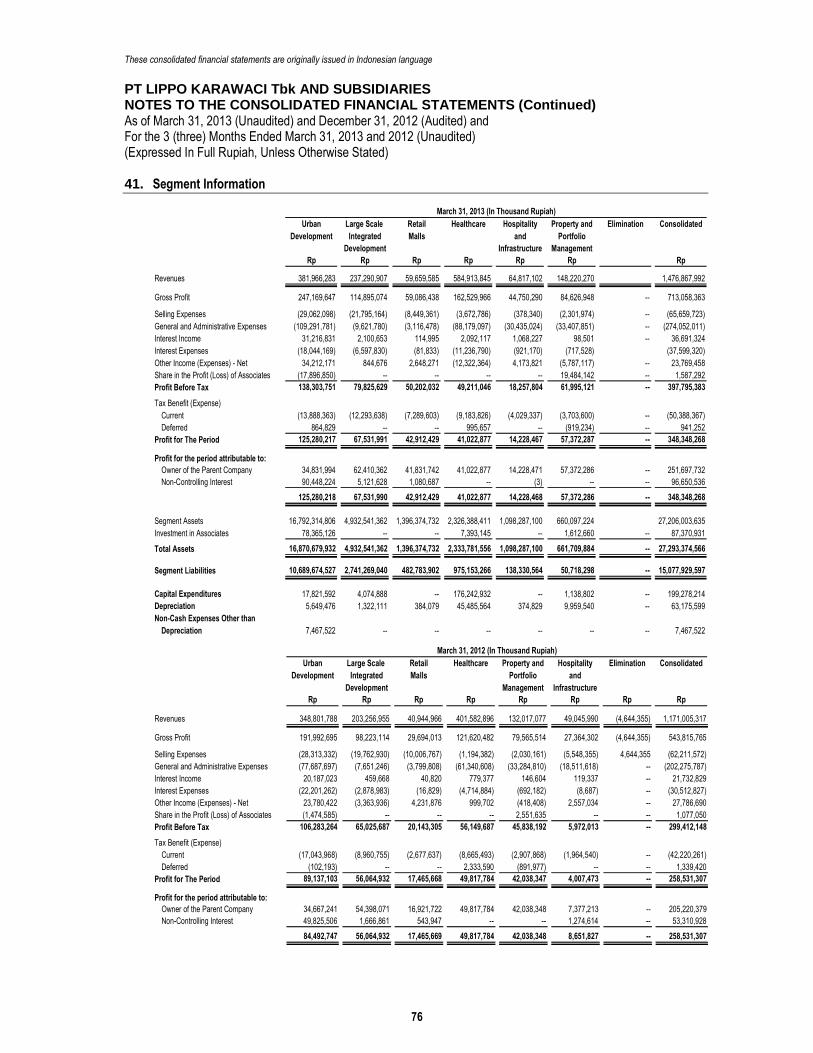
These consolidated financial statements are originally issued in Indonesian language
PT LIPPO KARAWACI Tbk AND SUBSIDIARIES NOTES TO THE CONSOLIDATED FINANCIAL STATEMENTS (Continued) As of March 31, 2013 (Unaudited) and December 31, 2012 (Audited) and For the 3 (three) Months Ended March 31, 2013 and 2012 (Unaudited) (Expressed In Full Rupiah, Unless Otherwise Stated)
FD/May 7, 2013 76 paraf:
41. Segment Information
Urban Large Scale Retail Healthcare Hospitality Property and Elimination Consolidated
Development Integrated Malls and Portfolio
Development Infrastructure Management
Rp Rp Rp Rp Rp Rp Rp
Revenues 381,966,283 237,290,907 59,659,585 584,913,845 64,817,102 148,220,270 1,476,867,992
Gross Profit 247,169,647 114,895,074 59,086,438 162,529,966 44,750,290 84,626,948 -- 713,058,363
Selling Expenses (29,062,098) (21,795,164) (8,449,361) (3,672,786) (378,340) (2,301,974) -- (65,659,723)
General and Administrative Expenses (109,291,781) (9,621,780) (3,116,478) (88,179,097) (30,435,024) (33,407,851) -- (274,052,011)
Interest Income 31,216,831 2,100,653 114,995 2,092,117 1,068,227 98,501 -- 36,691,324
Interest Expenses (18,044,169) (6,597,830) (81,833) (11,236,790) (921,170) (717,528) (37,599,320)
Other Income (Expenses) - Net 34,212,171 844,676 2,648,271 (12,322,364) 4,173,821 (5,787,117) -- 23,769,458
Share in the Profit (Loss) of Associates (17,896,850) -- -- -- -- 19,484,142 -- 1,587,292
Profit Before Tax 138,303,751 79,825,629 50,202,032 49,211,046 18,257,804 61,995,121 -- 397,795,383
Tax Benefit (Expense)
Current (13,888,363) (12,293,638) (7,289,603) (9,183,826) (4,029,337) (3,703,600) -- (50,388,367)
Deferred 864,829 -- -- 995,657 -- (919,234) -- 941,252
Profit for The Period 125,280,217 67,531,991 42,912,429 41,022,877 14,228,467 57,372,287 -- 348,348,268
Profit for the period attributable to:
Owner of the Parent Company 34,831,994 62,410,362 41,831,742 41,022,877 14,228,471 57,372,286 -- 251,697,732
Non-Controlling Interest 90,448,224 5,121,628 1,080,687 -- (3) -- -- 96,650,536
125,280,218 67,531,990 42,912,429 41,022,877 14,228,468 57,372,286 -- 348,348,268
Segment Assets 16,792,314,806 4,932,541,362 1,396,374,732 2,326,388,411 1,098,287,100 660,097,224 27,206,003,635
Investment in Associates 78,365,126 -- -- 7,393,145 -- 1,612,660 -- 87,370,931
Total Assets 16,870,679,932 4,932,541,362 1,396,374,732 2,333,781,556 1,098,287,100 661,709,884 -- 27,293,374,566
Segment Liabilities 10,689,674,527 2,741,269,040 482,783,902 975,153,266 138,330,564 50,718,298 -- 15,077,929,597
Capital Expenditures 17,821,592 4,074,888 -- 176,242,932 -- 1,138,802 -- 199,278,214
Depreciation 5,649,476 1,322,111 384,079 45,485,564 374,829 9,959,540 -- 63,175,599
Non-Cash Expenses Other than
Depreciation 7,467,522 -- -- -- -- -- -- 7,467,522
March 31, 2013 (In Thousand Rupiah)
Urban Large Scale Retail Healthcare Property and Hospitality Elimination Consolidated
Development Integrated Malls Portfolio and
Development Management Infrastructure
Rp Rp Rp Rp Rp Rp Rp Rp
March 31, 2012 (In Thousand Rupiah)
Revenues 348,801,788 203,256,955 40,944,966 401,582,896 132,017,077 49,045,990 (4,644,355) 1,171,005,317
Gross Profit 191,992,695 98,223,114 29,694,013 121,620,482 79,565,514 27,364,302 (4,644,355) 543,815,765
Selling Expenses (28,313,332) (19,762,930) (10,006,767) (1,194,382) (2,030,161) (5,548,355) 4,644,355 (62,211,572)
General and Administrative Expenses (77,687,697) (7,651,246) (3,799,808) (61,340,608) (33,284,810) (18,511,618) -- (202,275,787)
Interest Income 20,187,023 459,668 40,820 779,377 146,604 119,337 -- 21,732,829
Interest Expenses (22,201,262) (2,878,983) (16,829) (4,714,884) (692,182) (8,687) -- (30,512,827)
Other Income (Expenses) - Net 23,780,422 (3,363,936) 4,231,876 999,702 (418,408) 2,557,034 -- 27,786,690
Share in the Profit (Loss) of Associates (1,474,585) -- -- -- 2,551,635 -- -- 1,077,050
Profit Before Tax 106,283,264 65,025,687 20,143,305 56,149,687 45,838,192 5,972,013 -- 299,412,148
Tax Benefit (Expense)
Current (17,043,968) (8,960,755) (2,677,637) (8,665,493) (2,907,868) (1,964,540) -- (42,220,261)
Deferred (102,193) -- -- 2,333,590 (891,977) -- -- 1,339,420
Profit for The Period 89,137,103 56,064,932 17,465,668 49,817,784 42,038,347 4,007,473 -- 258,531,307
Profit for the period attributable to:
Owner of the Parent Company 34,667,241 54,398,071 16,921,722 49,817,784 42,038,348 7,377,213 -- 205,220,379
Non-Controlling Interest 49,825,506 1,666,861 543,947 -- -- 1,274,614 -- 53,310,928
84,492,747 56,064,932 17,465,669 49,817,784 42,038,348 8,651,827 -- 258,531,307

These consolidated financial statements are originally issued in Indonesian language
PT LIPPO KARAWACI Tbk AND SUBSIDIARIES NOTES TO THE CONSOLIDATED FINANCIAL STATEMENTS (Continued) As of March 31, 2013 (Unaudited) and December 31, 2012 (Audited) and For the 3 (three) Months Ended March 31, 2013 and 2012 (Unaudited) (Expressed In Full Rupiah, Unless Otherwise Stated)
FD/May 7, 2013 77 paraf:
Urban Large Scale Retail Healthcare Property and Hospitality Elimination Consolidated
Development Integrated Malls Portfolio and
Development Management Infrastructure
Rp Rp Rp Rp Rp Rp Rp Rp
March 31, 2012 (In Thousand Rupiah)
Segment Assets 11,838,381,670 2,915,162,309 1,610,309,297 1,586,321,329 613,538,871 378,959,285 -- 18,942,672,761
Investment in Associates 57,702,249 -- -- 7,393,145 2,980 -- -- 65,098,374
Total Assets 11,896,083,919 2,915,162,309 1,610,309,297 1,593,714,474 613,541,851 378,959,285 -- 19,007,771,135
Segment Liabilities 6,172,307,777 2,070,076,705 206,363,842 472,455,056 24,714,888 128,844,162 -- 9,074,762,430
Capital Expenditures 62,067,189 36,231,163 4,381,403 70,120,401 11,337,931 -- -- 184,138,087
Depreciation 5,350,617 1,298,367 3,527,654 23,636,644 12,676,603 337,718 -- 46,827,303
Non-Cash Expenses Other than
Depreciation 10,522,072 1,548,379 64,232 -- -- -- -- 12,134,683
42. Monetary Asset and Liabilities Denominated in Foreign Currencies
Equivalent in
USD JPY SGD EUR AUD Rupiah
Assets
Cash and Cash Equivalent 99,658,794 113,800 64,309,593 27,595 6,376 1,471,657,050,452
Trade Accounts Receivable 3,446,652 -- 3,071,553 -- -- 57,505,761,152
Other Current Financial Assets 49,950 -- 4,943,353 -- -- 39,123,494,862
Total Assets 103,155,395 113,800 72,324,499 27,595 6,376 1,568,286,306,466
Liabilities
Trade Accounts Payable -- -- 340,888 -- -- 2,664,433,821
Accrued Expenses 6,021,111 -- 727,139 -- -- 64,202,610,235
Bonds Payable 772,535,000 -- -- -- -- 7,508,267,665,000
Total Liabilities 778,556,111 -- 1,068,026 -- -- 7,575,134,709,056
Net Assets (Liabilities) (675,400,716) 113,800 71,256,473 27,595 6,376 (6,006,848,402,590)
March 31, 2013
Foreign Currencies
Equivalent in
USD JPY SGD EUR AUD Rupiah
Assets
Cash and Cash Equivalent 5,977,148 113,800 7,306,380 9,836 6,376 438,301,058,054
Trade Accounts Receivable 3,091,364 -- 8,546,257 -- -- 97,468,745,402
Other Current Financial Assets -- -- 7,007,601 -- -- 55,409,100,000
Total Assets 9,068,512 113,800 22,860,238 9,836 6,376 591,178,903,456
Liabilities
Trade Accounts Payable -- -- 340,888 -- -- 2,695,401,416
Accrued Expenses 5,741,994 -- 1,878,791 -- -- 70,380,688,375
Bonds Payable 642,535,000 -- -- -- -- 6,213,313,450,000
Total Liabilities 648,276,994 -- 2,219,679 -- -- 6,286,389,539,791
Net Assets (Liabilities) (639,208,482) 113,800 20,640,559 9,836 6,376 (5,695,210,636,335)
December 31, 2012
Foreign Currencies
In relation with liability balances denominated in foreign currencies, the Company has entered into several contracts derivatives with other parties to manage the risk of foreign currency exchange rates (see Note 40.c).
43. Contingencies
• Based on the Legal Case Register No. 79/PDTG/2005/PN.TNG dated April 12, 2005, Silvia Sunardi sued the Company (ex Lippo Land). Based on the case, it was stated that the compensation was demanded due to the allegation that kiosks at Depok Town Square was sold to the abovementioned party at the point where the land status was still under dispute (court case). In 2005, the legal case Register was rejected by Tangerang District Court’s. Upon the judgments to the aforementioned case, the plaintiffs are pursuing remedy either by cessation through Supreme Court of the Republic of Indonesia or by appeal through Banten High Court. According to the Company’s legal counsel, the event will not influence nor threat the ownership status of the land on which Depok Town Square is built.

These consolidated financial statements are originally issued in Indonesian language
PT LIPPO KARAWACI Tbk AND SUBSIDIARIES NOTES TO THE CONSOLIDATED FINANCIAL STATEMENTS (Continued) As of March 31, 2013 (Unaudited) and December 31, 2012 (Audited) and For the 3 (three) Months Ended March 31, 2013 and 2012 (Unaudited) (Expressed In Full Rupiah, Unless Otherwise Stated)
FD/May 7, 2013 78 paraf:
• On March 27, 2009, dr Doro Soendoro, dr Liem Kian Hong and dr Hardi Susanto as the plaintiffs filed a lawsuit to the Company as defendant regarding the termination of plaintiff’s work contract. All claims were declined through decision of District Court Jakarta Barat No. 147/Pdt.G/2009/PN.JKT.BAR dated July 23, 2009 and was upheld on June 29, 2010, through the decision of the High Court of Jakarta No. 626/PDT/2009/PT.DKI.
On September 24, 2010, the plaintiffs filed an appeal against the decision to the Supreme Court. Up to reporting date, this case is still in process.
• On July 9, 2009, Alfonsus Budi Susanto, SE, MA, the plaintiff, filed a lawsuit to the Company as first defendant and four other defendants in connection with malpractice suffered by plaintiff. All claims were declined through decision of District Court Jakarta Utara No. 237/Pdt.G/2009/PN.Jkt.Ut dated March 11, 2010 and was upheld on May 18, 2011, through the decision of the High Court of Jakarta No. 548/PDT/2010/PT.DKI.
On February 23, 2012, the plaintiffs filed an appeal against the decision to the Supreme Court. Up to reporting date, this case is still in process.
• On October 1, 2012, Wahju Indrawan, the plaintiff, filed a lawsuit No 71/Pdt.G/2012/PN.JBI to SIH, a subsidiary, as first defendant and two other defendants in connection with malpractice suffered by plaintiff’s spouse. Up to the reporting date, the case is in the process of court.
• Based on the Legal Case Register Nos. 126 and 219, PT Gowa Makassar Tourism Development Tbk (GMTD), a subsidiary, is a Defendant on a land area of 67,613 sqm located in Tanjung Merdeka. Up to the reporting date, the case is in the process of appeal and judicial review in the Supreme Court of the Republic of Indonesia.
• Based on the Legal Case Register Nos. 234 and 104, GMTD, a subsidiary, is a Appellant on a land area of 44,258 sqm located in Maccini Sombala. Up to the reporting date, the case is in the process of appeal and judicial review in the Supreme Court of the Republic of Indonesia.
• Based on the Legal Case Register Nos. 129 and 167, GMTD, a subsidiary, is a Second Defendant on a land area of 14,335 sqm located in Tanjung Merdeka. Up to the reporting date, the case is in the process of appeal and judicial review in the Supreme Court of the Republic of Indonesia.
• Based on the Legal Case Register Nos. 215 and 243, GMTD, a subsidiary, is a First Defendant on a land area of 510,610 sqm located in Tanjung Merdeka and area of 81,200 sqm located in Maccini Sombala. Up to the reporting date, the case is in the process of court.
• Based on the Legal Case Register Nos. 51, 64 and 245, GMTD, a subsidiary, is a Appellant on a land area on a land area of 50,134 sqm located in Tanjung Merdeka. Up to the reporting date, the case is in the process of court.
• Based on the Legal Case Register No. 219, GMTD, a subsidiary, is a Second Defendant on a land area of 600 sqm located in Maccini Sombala. Up to the reporting date, the case is in the process of court.
44. Financial Instruments and Financial Risks Management
The main financial risks faced by the Company and Subsidiaries are credit risk, foreign exchange rate risk, interest rate risk, liquidity risk and price risk. Attention of managing these risks has significantly increased in light of the considerable change and volatility in Indonesian and international markets.
(i) Credit Risk Credit risk is the risk that the Company and subsidiaries will incur a loss arising from their customers, clients or counterparties that fail to discharge their contractual obligations. The Company and

These consolidated financial statements are originally issued in Indonesian language
PT LIPPO KARAWACI Tbk AND SUBSIDIARIES NOTES TO THE CONSOLIDATED FINANCIAL STATEMENTS (Continued) As of March 31, 2013 (Unaudited) and December 31, 2012 (Audited) and For the 3 (three) Months Ended March 31, 2013 and 2012 (Unaudited) (Expressed In Full Rupiah, Unless Otherwise Stated)
FD/May 7, 2013 79 paraf:
Subsidiaries’ financial instruments that potentially contain credit risk are cash and cash equivalent, trade accounts receivable, other accounts receivable and investments. The maximum total credit risks exposure is equal to the amount of the respective accounts.
The Company and Subsidiaries manage and control this credit risk by setting limits on the amount of risk they are willing to accept for respective customers and being more selective in choosing banks and financial institutions that they deal with, which includes choosing only the reputable and creditworthy banks and financial institutions.
The following table analyzes the financial assets based on maturity:
Not Yet Total
Due 0 - 90 Days 91 - 180 Days > 181 Days Total
Rp Rp Rp Rp Rp Rp
Financial Assets
Fair value through profit or loss Derivative 126,780,732,531 -- -- -- -- 126,780,732,531
Loans and Receivables
Cash and Cash Equivalent 2,842,276,312,314 -- -- -- -- 2,842,276,312,314
Trade Accounts Receivable 337,367,395,092 205,522,530,809 62,448,332,574 107,194,674,287 375,165,537,670 712,532,932,762
Other Current Financial Assets 356,593,099,058 -- -- -- -- 356,593,099,058
Due from Related Parties Non-trade 11,741,306,375 -- -- -- -- 11,741,306,375
Other Non-Current Financial Assets 1,597,139,008,953 -- -- -- -- 1,597,139,008,953
Available-for-Sale
Available-for-Sale Financial Assets 4,602,804,728,316 -- -- -- -- 4,602,804,728,316
Total Financial Assets 9,874,702,582,639 205,522,530,809 62,448,332,574 107,194,674,287 375,165,537,670 10,249,868,120,309
March 31, 2013
Overdue
Not Yet Total
Due 0 - 90 Days 91 - 180 Days > 181 Days Total
Rp Rp Rp Rp Rp Rp
Financial Assets
Fair value through profit or loss Derivative 101,878,348,847 -- -- -- -- 101,878,348,847
Loans and Receivables
Cash and Cash Equivalent 3,337,357,407,919 -- -- -- -- 3,337,357,407,919
Trade Accounts Receivable 274,382,513,505 180,003,365,507 64,597,353,595 75,393,781,181 319,994,500,283 594,377,013,788
Other Current Financial Assets 342,988,169,824 -- -- -- 342,988,169,824
Due from Related Parties Non-trade 11,460,650,042 -- -- -- -- 11,460,650,042
Other Non-Current Financial Assets 344,302,236,769 -- -- -- -- 344,302,236,769
Available-for-Sale
Available-for-Sale Financial Assets 4,216,898,495,936 -- -- -- -- 4,216,898,495,936
Total Financial Assets 8,629,267,822,842 180,003,365,507 64,597,353,595 75,393,781,181 319,994,500,283 8,949,262,323,125
December 31, 2012
Overdue
(ii) Foreign Exchange Rate Risk Foreign exchange rate risk is the risk that the fair value of future cash flow of a financial instrument will fluctuate because of changes in the foreign exchange rates. The Company and subsidiaries’ financial instrument that potentially contain foreign exchange rate risk are cash and cash equivalent, investments and loans.
To manage foreign exchange rate risk, the Company has entered into several derivative agreements with certain third parties.
The following tables show total financial assets and liabilities in foreign currencies as of March 31, 2013 and December 31, 2012:
Equivalent in
USD JPY SGD EUR AUD Rupiah
Assets
Cash and Cash Equivalent 99,658,794 113,800 64,309,593 27,595 6,376 1,471,657,050,452
Trade Accounts Receivable 3,446,652 - 3,071,553 - - 57,505,761,152
Other Current Financial Assets 13,094,577 - 591,056,543 - - 4,747,058,706,051
Total Assets 116,200,023 113,800 658,437,690 27,595 6,376 6,276,221,517,655
March 31, 2013
Foreign Currencies

These consolidated financial statements are originally issued in Indonesian language
PT LIPPO KARAWACI Tbk AND SUBSIDIARIES NOTES TO THE CONSOLIDATED FINANCIAL STATEMENTS (Continued) As of March 31, 2013 (Unaudited) and December 31, 2012 (Audited) and For the 3 (three) Months Ended March 31, 2013 and 2012 (Unaudited) (Expressed In Full Rupiah, Unless Otherwise Stated)
FD/May 7, 2013 80 paraf:
Equivalent in
USD JPY SGD EUR AUD Rupiah
March 31, 2013
Foreign Currencies
Liabilities
Trade Accounts Payable -- -- 340,888 -- -- 2,664,433,821
Accrued Expenses 6,021,111 -- 727,139 -- -- 64,202,610,235
Bonds Payable 772,535,000 -- -- -- -- 7,508,267,665,000
Total Liabilities 778,556,111 -- 1,068,026 -- -- 7,575,134,709,056
Net Assets (Liabilities) (662,356,088) 113,800 657,369,664 27,595 6,376 (1,298,913,191,400)
Equivalent in
USD JPY SGD EUR AUD Rupiah
Assets
Cash and Cash Equivalent 5,977,148 113,800 7,306,380 9,836 6,376 438,301,058,054
Trade Accounts Receivable 3,091,364 -- 8,546,257 97,468,745,402
Other Current Financial Assets 10,535,507 -- 532,942,782 -- -- 4,315,856,921,772
Total Assets 19,604,019 113,800 548,795,419 9,836 6,376 4,851,626,725,228
Liabilities
Trade Accounts Payable -- -- 340,888 -- -- 2,695,401,416
Accrued Expenses 5,741,994 -- 1,878,791 -- -- 70,380,688,375
Bonds Payable 642,535,000 -- -- -- -- 6,213,313,450,000
Total Liabilities 648,276,994 -- 2,219,679 -- -- 6,286,389,539,791
Net Assets (Liabilities) (628,672,975) 113,800 546,575,740 9,836 6,376 (1,434,762,814,563)
December 31, 2012
Foreign Currencies
Sensitivity analysis A hypothetical 10% decrease in the exchange rate of the Rupiah against the USD currency would decrease profit before tax by Rp 105,236,696,752 (2012: Rp 43,008,246,876).
A hypothetical 10% decrease in the exchange rate of the Rupiah against the SGD currency would increase profit before tax by Rp 78,803,089,849 (2012: Rp 14,114,166,621).
The analysis above is based on assumption that Rupiah weakened or strengthened against all of the currencies in the same direction and magnitude, but it may not be necessarily true in reality.
(iii) Interest Rate Risk Interest rate risk is the risk that fair value of future cash flow of a financial instrument will fluctuate because of changes in market interest rate. The Company and Subsidiaries are exposed to interest rate risk because they have loans with floating interest rates.
The Company and Subsidiaries manage this interest rate risk through an appropriate combination of loans in fixed and floating interest rate and monitoring interest rate movement effect to minimize negative effect to the Company. As of March 31, 2013, more than 95% of the Company’s loans are with fixed interest rate.
Sensitivity analysis A hypothetical 1% increase in the interest rate of the debt would cut profit before tax by Rp 632,169,953 (2012: Rp 765,185,891).
The analysis above is based on assumption that interest rate increased or decreased against all of the bank loans in the same direction and magnitude, but it may not be necessarily true in reality.
(iv) Liquidity Risk Liquidity risk is a risk when the cash flow position of the Company indicates that the short-tem revenue is not enough to cover the short-term expenditure.
The Company and Subsidiaries manage this liquidity risk by maintaining an adequate level of cash and cash equivalent to cover Company’s commitment in normal operation and regularly evaluates the projected and actual cash flow, as well as maturity date schedule of their financial assets and liabilities.

These consolidated financial statements are originally issued in Indonesian language
PT LIPPO KARAWACI Tbk AND SUBSIDIARIES NOTES TO THE CONSOLIDATED FINANCIAL STATEMENTS (Continued) As of March 31, 2013 (Unaudited) and December 31, 2012 (Audited) and For the 3 (three) Months Ended March 31, 2013 and 2012 (Unaudited) (Expressed In Full Rupiah, Unless Otherwise Stated)
FD/May 7, 2013 81 paraf:
The following table analyzes the breakdown of financial liabilities based on maturity:
Maturity not Total
Less Than 1 Year 1 - 5 Years More than 5 Years Determined
Rp Rp Rp Rp Rp
Measured at amortized cost
Trade Accounts Payable - Third Parties 309,573,737,661 -- -- -- 309,573,737,661
Accrued Expenses 659,477,825,910 -- -- -- 659,477,825,910
Short-Term Post-Employment Benefits Liability 6,326,397,455 -- -- -- 6,326,397,455
Other Current Financial Liabilities -- -- -- 137,405,291,649 137,405,291,649
Short-Term Bank Loan 4,926,981,771 -- -- -- 4,926,981,771
Long-Term Bank Loan 11,355,521,381 51,861,473,932 -- -- 63,216,995,313
Due to Related Parties Non-trade -- -- -- 3,732,623,194 3,732,623,194
Bonds Payable -- 1,152,698,405,237 6,127,790,000,189 -- 7,280,488,405,426
Other Long-Term Financial Liabilities -- -- -- 55,766,214,568 55,766,214,568
Total 991,660,464,178 1,204,559,879,169 6,127,790,000,189 196,904,129,411 8,520,914,472,947
March 31, 2013
Will Due On
Maturity not Total
Less Than 1 Year 1 - 5 Years More than 5 Years Determined
Rp Rp Rp Rp Rp
Measured at amortized cost
Trade Accounts Payable - Third Parties 575,701,267,461 -- -- -- 575,701,267,461
Accrued Expenses 487,335,826,278 -- -- -- 487,335,826,278
Short-Term Post-Employment Benefits Liability 6,326,397,455 -- -- -- 6,326,397,455
Other Current Financial Liabilities -- -- -- 179,543,836,416 179,543,836,416
Short-Term Bank Loan 4,853,583,896 -- -- -- 4,853,583,896
Long-Term Bank Loan 11,218,103,420 54,753,114,466 -- -- 65,971,217,886
Due to Related Parties Non-trade -- -- -- 3,188,994,396 3,188,994,396
Bonds Payable -- 1,141,954,363,699 4,801,575,272,736 -- 5,943,529,636,435
Other Long-Term Financial Liabilities -- -- -- 85,634,498,079 85,634,498,079
Total 1,085,435,178,510 1,196,707,478,165 4,801,575,272,736 268,367,328,891 7,352,085,258,302
December 31, 2012
Will Due On
(v) Price Risk Price risk is a risk of fluctuation in the value of financial instruments as a result of changes in market price. The Company and Subsidiaries are exposed to price risk because they own an investment classified as AFS financial assets.
The Company and Subsidiaries manage this risk by regularly evaluating the financial performance and market price of their investment and continuously monitor the global market developments.
Sensitivity analysis A hypothetical 1% decrease in the AFS price in the market would cut Unrealized Gain (Loss) on Changes in Fair Value of Available-for-Sale Financial Assets (Equity section) by Rp 45,444,757,053 (2012: Rp 28,027,946,550).
Fair Value Estimation The schedule below presents the carrying amount of the respective categories of financial assets and liabilities as of March 31, 2013 and December 31, 2012:
Carrying Value Fair Value Carrying Value Fair Value
Rp Rp Rp Rp
Financial Assets
Fair value through profit or loss 126,780,732,531 126,780,732,531 101,878,348,847 101,878,348,847
Loans and Receivable
Cash and Cash Equivalent 2,842,276,312,314 2,842,276,312,314 3,337,357,407,919 3,337,357,407,919
Trade Accounts Receivable 712,532,932,762 712,532,932,762 594,377,013,788 594,377,013,788
Other Current Financial Assets 356,593,099,058 356,593,099,058 342,988,169,824 342,988,169,824
Due from Related Parties Non-trade 11,741,306,375 11,741,306,375 11,460,650,042 11,460,650,042
Other Non-Current Financial Assets 1,597,139,008,953 1,597,139,008,953 344,302,236,769 344,302,236,769
Available-for-Sale
Available-for-Sale Financial Assets 4,602,804,728,316 4,602,804,728,316 4,216,898,495,936 4,216,898,495,936
Total Financial Assets 10,249,868,120,309 10,249,868,120,309 8,949,262,323,125 8,949,262,323,125
March 31, 2013 December 31, 2012

These consolidated financial statements are originally issued in Indonesian language
PT LIPPO KARAWACI Tbk AND SUBSIDIARIES NOTES TO THE CONSOLIDATED FINANCIAL STATEMENTS (Continued) As of March 31, 2013 (Unaudited) and December 31, 2012 (Audited) and For the 3 (three) Months Ended March 31, 2013 and 2012 (Unaudited) (Expressed In Full Rupiah, Unless Otherwise Stated)
FD/May 7, 2013 82 paraf:
Carrying Value Fair Value Carrying Value Fair Value
Rp Rp Rp Rp
March 31, 2013 December 31, 2012
Financial Liabilities
Measured at amortized cost
Trade Accounts Payable - Third Parties 309,573,737,661 309,573,737,661 575,701,267,461 575,701,267,461
Accrued Expenses 659,477,825,910 659,477,825,910 487,335,826,278 487,335,826,278
Other Current Financial Liabilities 137,405,291,649 137,405,291,649 179,543,836,416 179,543,836,416
Short-Term Post-Employment Benefits Liability 6,326,397,455 6,326,397,455 6,326,397,455 6,326,397,455
Short-Term Bank Loan 4,926,981,771 4,926,981,771 4,853,583,896 4,853,583,896
Due to Related Parties Non-trade 3,732,623,194 3,732,623,194 3,188,994,396 3,188,994,396
Long-Term Bank Loan 63,216,995,313 63,216,995,313 65,971,217,886 65,971,217,886
Bonds Payable 7,280,488,405,426 7,697,113,799,504 5,943,529,636,435 6,469,503,625,028
Other Long-Term Financial Assets 55,766,214,568 51,250,168,121 85,634,498,079 81,118,451,632
Total Financial Liabilities 8,520,914,472,947 7,873,543,200,448 7,352,085,258,302 7,873,543,200,448
As of March 31, 2013 and December 31, 2012, management estimates that the carrying value of short-term financial assets and liabilities and those which maturity not determined have reflect their fair value.
The fair value of derivative instruments and other long-term liabilities are estimated using valuation techniques with unobservable input portion (level 2). The fair value of investments available for sale and bonds payable was quoted in an active market (level 1). The following are fair value hierarchy for financial assets at year end were recorded using their fair value.
March 31, 2013 Level 1 Level 2 Level 3
Rp Rp Rp Rp
Financial Assets Measured at fair value
through profit or loss
Derivative 126,780,732,531 -- 126,780,732,531 --
Available-for-Sale
Other Current Financial Assets 4,544,475,705,305 4,544,475,705,305 -- --
Other Non-Current Financial Assets 58,329,023,011 -- -- 58,329,023,011
December 31, 2012 Level 1 Level 2 Level 3
Rp Rp Rp Rp
Financial Assets Measured at fair value
through profit or loss
Derivative 101,878,348,847 -- 101,878,348,847 --
Available-for-Sale
Other Current Financial Assets 4,158,569,472,925 4,158,569,472,925 -- --
Other Non-Current Financial Assets 58,329,023,011 -- -- 58,329,023,011
45. Business Combination
PT Mulia Citra Abadi (MCA) On December 20, 2012, the Company acquired the entire shares of MCA indirectly 75% through PT Lippo Malls Indonesia (formerly PT Counsulting & Management Services Division) and 25% through PT Kilau Intan Murni from the third party, in line with the strategic business expansion which support the Company’s business activities.
The following table summarises the identifiable assets acquired and the liabilities taken over at the acquisition date of MCA:
Rp
Cash and Cash Equivalent 9,000,000
Property and Equipment 279,686,000,000
Due to Related Parties Non-trade (185,805,000,000)
Total Net Assets 93,890,000,000
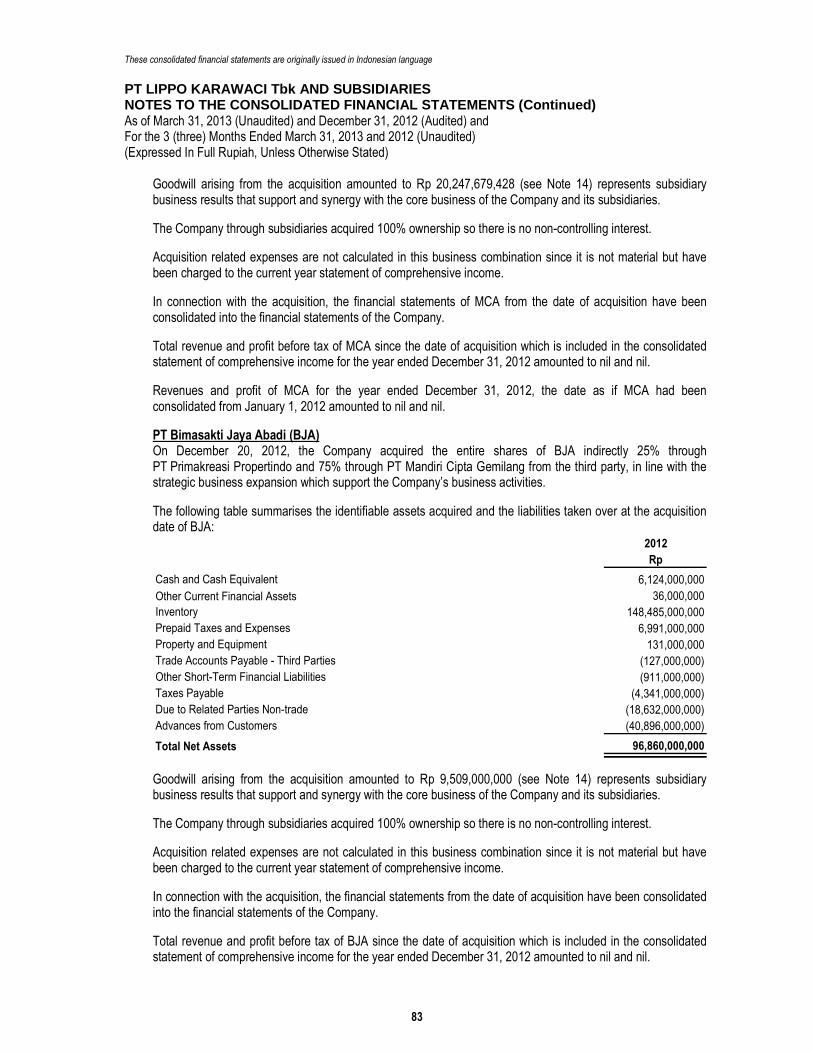
These consolidated financial statements are originally issued in Indonesian language
PT LIPPO KARAWACI Tbk AND SUBSIDIARIES NOTES TO THE CONSOLIDATED FINANCIAL STATEMENTS (Continued) As of March 31, 2013 (Unaudited) and December 31, 2012 (Audited) and For the 3 (three) Months Ended March 31, 2013 and 2012 (Unaudited) (Expressed In Full Rupiah, Unless Otherwise Stated)
FD/May 7, 2013 83 paraf:
Goodwill arising from the acquisition amounted to Rp 20,247,679,428 (see Note 14) represents subsidiary business results that support and synergy with the core business of the Company and its subsidiaries.
The Company through subsidiaries acquired 100% ownership so there is no non-controlling interest.
Acquisition related expenses are not calculated in this business combination since it is not material but have been charged to the current year statement of comprehensive income.
In connection with the acquisition, the financial statements of MCA from the date of acquisition have been consolidated into the financial statements of the Company.
Total revenue and profit before tax of MCA since the date of acquisition which is included in the consolidated statement of comprehensive income for the year ended December 31, 2012 amounted to nil and nil.
Revenues and profit of MCA for the year ended December 31, 2012, the date as if MCA had been consolidated from January 1, 2012 amounted to nil and nil.
PT Bimasakti Jaya Abadi (BJA) On December 20, 2012, the Company acquired the entire shares of BJA indirectly 25% through PT Primakreasi Propertindo and 75% through PT Mandiri Cipta Gemilang from the third party, in line with the strategic business expansion which support the Company’s business activities.
The following table summarises the identifiable assets acquired and the liabilities taken over at the acquisition date of BJA:
2012
Rp
Cash and Cash Equivalent 6,124,000,000
Other Current Financial Assets 36,000,000
Inventory 148,485,000,000
Prepaid Taxes and Expenses 6,991,000,000
Property and Equipment 131,000,000
Trade Accounts Payable - Third Parties (127,000,000)
Other Short-Term Financial Liabilities (911,000,000)
Taxes Payable (4,341,000,000)
Due to Related Parties Non-trade (18,632,000,000)
Advances from Customers (40,896,000,000)
Total Net Assets 96,860,000,000
Goodwill arising from the acquisition amounted to Rp 9,509,000,000 (see Note 14) represents subsidiary business results that support and synergy with the core business of the Company and its subsidiaries.
The Company through subsidiaries acquired 100% ownership so there is no non-controlling interest.
Acquisition related expenses are not calculated in this business combination since it is not material but have been charged to the current year statement of comprehensive income.
In connection with the acquisition, the financial statements from the date of acquisition have been consolidated into the financial statements of the Company.
Total revenue and profit before tax of BJA since the date of acquisition which is included in the consolidated statement of comprehensive income for the year ended December 31, 2012 amounted to nil and nil.

These consolidated financial statements are originally issued in Indonesian language
PT LIPPO KARAWACI Tbk AND SUBSIDIARIES NOTES TO THE CONSOLIDATED FINANCIAL STATEMENTS (Continued) As of March 31, 2013 (Unaudited) and December 31, 2012 (Audited) and For the 3 (three) Months Ended March 31, 2013 and 2012 (Unaudited) (Expressed In Full Rupiah, Unless Otherwise Stated)
FD/May 7, 2013 84 paraf:
Revenues and profit of BJA for the year ended December 31, 2012, the date as if BJA had been consolidated from January 1, 2012 amounted to nil and nil. PT Surya Megah Lestari (SML) On December 20, 2012, the Company acquired the entire shares of SML indirectly 25% through PT Primakreasi Propertindo and 75% through PT Mandiri Cipta Gemilang from the third party, in line with the strategic business expansion which support the Company’s business activities.
The following table summarises the identifiable assets acquired and the liabilities taken over at the acquisition date of SML:
Rp
Cash and Cash Equivalent 2,000,000
Property and Equipment 4,318,000,000
Due to Related Parties Non-trade (3,000,000,000)
Total Net Assets 1,320,000,000
Goodwill arising from the acquisition amounted to Rp 5,680,000,000 (see Note 14) represents subsidiary business results that support and synergy with the core business of the Company and its subsidiaries.
The Company through subsidiaries acquired 100% ownership so there is no non-controlling interest.
Acquisition related expenses are not calculated in this business combination since it is not material but have been charged to the current year statement of comprehensive income.
In connection with the acquisition, the financial statements from the date of acquisition have been consolidated into the financial statements of the Company.
Total revenue and profit before tax of SML since the date of acquisition which is included in the consolidated statement of comprehensive income for the year ended December 31, 2012 amounted to nil and nil.
Revenues and profit of SML for the year ended December 31, 2012, the date as if SML had been consolidated from January 1, 2012 amounted to nil and nil.
PT Ekaputra Kencana Abadi (EKA) On August 15, 2012, the Company acquired the entire shares of EKA, indirectly 75% through PT Persada Mandiri Dunia Niaga and 25% through PT Wisma Jatim Propertindo from the third party, in line with the strategic business expansion which support the Company’s business activities.
The following table summarises the identifiable assets acquired and the liabilities taken over at the acquisition date of EKA:
Rp
Due from Related Parties Non-trade 349,000,000
Other Non-Current Financial Assets 2,016,000,000
Total Net Assets 2,365,000,000
Goodwill arising from the acquisition amounted to Rp 15,050,000,000 (see Note 14) represents subsidiary business results that support and synergy with the core business of the Company and its subsidiaries.
The Company through subsidiaries acquired 100% ownership so there is no non-controlling interest.
Acquisition related expenses are not calculated in this business combination since it is not material but have been charged to the current year statement of comprehensive income.
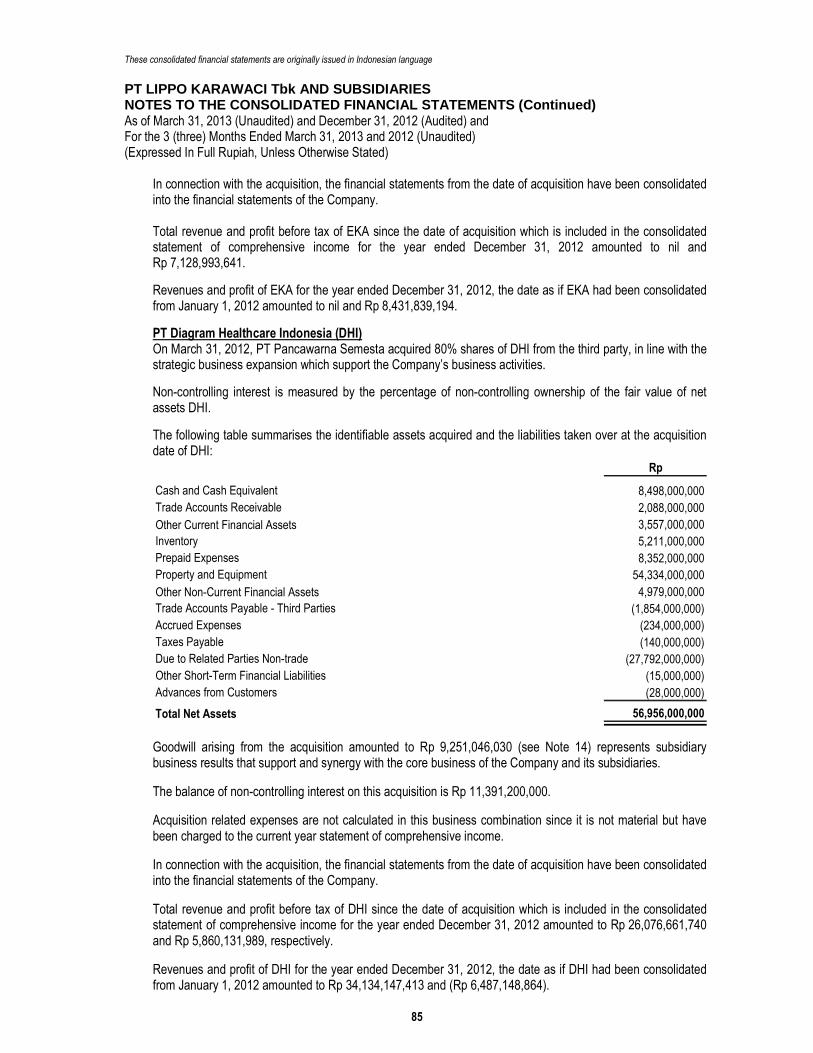
These consolidated financial statements are originally issued in Indonesian language
PT LIPPO KARAWACI Tbk AND SUBSIDIARIES NOTES TO THE CONSOLIDATED FINANCIAL STATEMENTS (Continued) As of March 31, 2013 (Unaudited) and December 31, 2012 (Audited) and For the 3 (three) Months Ended March 31, 2013 and 2012 (Unaudited) (Expressed In Full Rupiah, Unless Otherwise Stated)
FD/May 7, 2013 85 paraf:
In connection with the acquisition, the financial statements from the date of acquisition have been consolidated into the financial statements of the Company. Total revenue and profit before tax of EKA since the date of acquisition which is included in the consolidated statement of comprehensive income for the year ended December 31, 2012 amounted to nil and Rp 7,128,993,641.
Revenues and profit of EKA for the year ended December 31, 2012, the date as if EKA had been consolidated from January 1, 2012 amounted to nil and Rp 8,431,839,194.
PT Diagram Healthcare Indonesia (DHI) On March 31, 2012, PT Pancawarna Semesta acquired 80% shares of DHI from the third party, in line with the strategic business expansion which support the Company’s business activities.
Non-controlling interest is measured by the percentage of non-controlling ownership of the fair value of net assets DHI.
The following table summarises the identifiable assets acquired and the liabilities taken over at the acquisition date of DHI:
Rp
Cash and Cash Equivalent 8,498,000,000
Trade Accounts Receivable 2,088,000,000
Other Current Financial Assets 3,557,000,000
Inventory 5,211,000,000
Prepaid Expenses 8,352,000,000
Property and Equipment 54,334,000,000
Other Non-Current Financial Assets 4,979,000,000
Trade Accounts Payable - Third Parties (1,854,000,000)
Accrued Expenses (234,000,000)
Taxes Payable (140,000,000)
Due to Related Parties Non-trade (27,792,000,000)
Other Short-Term Financial Liabilities (15,000,000)
Advances from Customers (28,000,000)
Total Net Assets 56,956,000,000
Goodwill arising from the acquisition amounted to Rp 9,251,046,030 (see Note 14) represents subsidiary business results that support and synergy with the core business of the Company and its subsidiaries.
The balance of non-controlling interest on this acquisition is Rp 11,391,200,000.
Acquisition related expenses are not calculated in this business combination since it is not material but have been charged to the current year statement of comprehensive income.
In connection with the acquisition, the financial statements from the date of acquisition have been consolidated into the financial statements of the Company.
Total revenue and profit before tax of DHI since the date of acquisition which is included in the consolidated statement of comprehensive income for the year ended December 31, 2012 amounted to Rp 26,076,661,740 and Rp 5,860,131,989, respectively.
Revenues and profit of DHI for the year ended December 31, 2012, the date as if DHI had been consolidated from January 1, 2012 amounted to Rp 34,134,147,413 and (Rp 6,487,148,864).

These consolidated financial statements are originally issued in Indonesian language
PT LIPPO KARAWACI Tbk AND SUBSIDIARIES NOTES TO THE CONSOLIDATED FINANCIAL STATEMENTS (Continued) As of March 31, 2013 (Unaudited) and December 31, 2012 (Audited) and For the 3 (three) Months Ended March 31, 2013 and 2012 (Unaudited) (Expressed In Full Rupiah, Unless Otherwise Stated)
FD/May 7, 2013 86 paraf:
46. Capital Management
March 31, 2013 December 31, 2012
Rp Rp
Net Liabilities:
Total Liabilities 15,077,929,596,657 13,399,189,342,618
Less: Cash and Cash Equivalent (2,842,276,312,314) (3,337,357,407,919)
Net Liabilities 12,235,653,284,343 10,061,831,934,699
Total Equity 12,215,444,969,364 11,470,106,390,475
Less: Other Components of Equity (2,038,666,693,304) (1,545,025,846,636)
Adjusted Equity 10,176,778,276,060 9,925,080,543,839
Net Liability Ratio to Adjusted Equity 1.20 1.01
The objective of capital management is to safeguard the Company’s ability as a going concern, maximize the returns to stockholders and benefits for other stockholders and to maintain an optimal capital structure to reduce the cost of capital.
The Company regularly reviews and manages the capital structure to ensure that the return to stockholders is optimal, by considering the capital needs in the future and the Company's capital efficiency, profitability in the current period and the future, projected operating cash flows, projected capital expenditures and projected opportunities of strategic investment.
47. Latest Development in Financial Accounting Standards
The following are the PSAK, ISAK and PPSAK that have been issued by DSAK-IAI, but not yet effective, to be implemented for the period of financial statements which begins on or after January 1, 2013:
• PSAK No. 38 (Revised 2011): “Business Combination for Entities Under Common Control”
• ISAK No. 21 *): “Real Estate Construction Contracts”
• PPSAK No. 7 *): “Revocation of PSAK No. 44: Accounting for Real Estate Development Activity paragraphs 1-46, 49-55 and 62-64”
• PPSAK No. 10: “Revocation of PSAK No. 51: Accounting for Quasi-Reorganization”
*)Postponed until a date determined later, according to the announcement letter of DSAK-IAI No. 0643/DSAK/IAI/IX/2012 dated September 21, 2012.
The Company’s management has not yet determined the adoption effects of the abovementioned PSAK, ISAK and PPSAKs to the consolidated financial statements.
48. Responsibility and Issuance of the Consolidated Financial Statements
The management of the Company is responsible for the preparation and presentation of the consolidated financial statements. The consolidated financial statements were authorized for issuance by Directors on April 23, 2013.
Top Related