


Languages
Pages
Legal


PStress R©
Pulley Stress Analysis Software
Users Manual*
Issued: October 7, 2014
*For PStress V3.5
CONVEYOR DYNAMICS, INC.
1111 West Holly St.
Bellingham, WA, 98225 (USA)
Phone: +1 (360) 671-2200

Contents
Contents i
Symbols ii
1 Introduction 1
1.1 What is Pstress? . . . . . . . . . . . . . . . . . . . . . . . . . . . . . . . . 1
1.2 Getting Started in PStress . . . . . . . . . . . . . . . . . . . . . . . . . . . 1
2 Defining a Pulley in PStress 4
2.1 Pulley Shape . . . . . . . . . . . . . . . . . . . . . . . . . . . . . . . . . . 4
2.2 Material Properties . . . . . . . . . . . . . . . . . . . . . . . . . . . . . . . 5
2.3 Locking Devices . . . . . . . . . . . . . . . . . . . . . . . . . . . . . . . . . 5
2.4 Shaft Geometry . . . . . . . . . . . . . . . . . . . . . . . . . . . . . . . . . 6
3 Interpreting PStress Results 7
3.1 PStress Reports . . . . . . . . . . . . . . . . . . . . . . . . . . . . . . . . . 7
3.2 Fatigue Analysis using a Goodman Diagram . . . . . . . . . . . . . . . . . 9
i

Symbols
σr Stress in Radial Direction (MPa)
σθ Stress in Tangential Direction (MPa)
σz Stress in Axial Direction (MPa)
τ Shear Stress (MPa)
Su Ultimate Tensile Strength (MPa)
Sy Yield Strength (MPa)
Se Endurance Limit Strength (MPa)
ii

Chapter 1
Introduction
1.1 What is Pstress?
PStress is a proprietary program developed at CDI. The first version was created in 1984.
This version used a closed-form analytical method to solve for the stresses in a pulley.
The program was based on the work of H. Lange (1963) and W. Schmoltzi (1974). In
1993 CDI expanded the number of shapes PStress could model by added a relatively
small number of finite elements to the pulley simulation. This allowed us to preserve the
speed of the close-form analytical analysis, while adding the ability to model complex
geometries. Xiangjun Qiu and Vinit Sethi published CDI’s new simulation method (and
comparisons between our method and full ANSYS simulations) in a paper titled A New
Pulley Stress Analysis Method Based on Modified Transfer Matrix. This paper appeared
in Bulk Solids Handling volume 13, issue 4.
PStress is a powerful tool that allows engineers to quickly predict the triaxial stress field
in a pulley. Unlike a general purpose FEA program, different engineers using PStress
will always get the same answer when simulating the same pulley geometry with the
same appied loads. Meshing and boundary conditions are predetermined and most of
the solution is analytical so computation times are typically less than one second. This
allows designers to rapidly review the effect of a design change on the stress distribution
in the pulley and quickly converge on an optimum pulley design.
1.2 Getting Started in PStress
The section contains instructions for verrifying that your copy of PStress is installed
correctly by modelling a simple pulley. We begin by opening PStress and entering the
1

Chapter 1. Introduction 2
dimensions of the pulley and shaft, as well as the forces on the pulley. Open PStress
and enter the pulley properties exactly as they are shown in Figure 1.1.
Note: The PStress input screen supports three languages– English, Spanish, and
Portuguese. To change the default input screen language, select “Preferences” from
the “Edit” menu. This will open the preferences dialog box which allows the user
to set a default language.
Figure 1.1: PStress Input Screen
After entering all the data shown in the Figure 1.1 save the file by selecting ”Save as”
from the “File” menu. Once the file is saved click the “Simulate Pulley” button on
the tool bar just below the file menu. This will run the PStress pulley solver. The
solution will converge in less than a second. If everything is OK PStress will switch
to the “Summarize Results” tab and the screen shown in Figure 1.2 will appear. If
so, congratulations, your PStress installation was successful. Resave the file. This will
tranfer the reports found in the Summarize Results and Full Results tabs to MS Word
or MS Wordpad compatible reports in the same folder as the PStress input file.

Chapter 1. Introduction 3
Figure 1.2: PStress Results Summary Screen
This concludes our brief overview of the PStress software. A deeper review of the input
data required by and the output data produced by this software appears in successive
chapters.

Chapter 2
Defining a Pulley in PStress
2.1 Pulley Shape
PStress is designed to compute the stresses in CEMA “Engineered Class” pulleys with
T-Section end disks like the one shown in Figure 2.1
Dist. Weld to Disk
Figure 2.1: PStress Pulley Schematic
4
Chapter 2. Defining a Pulley in PStress 5
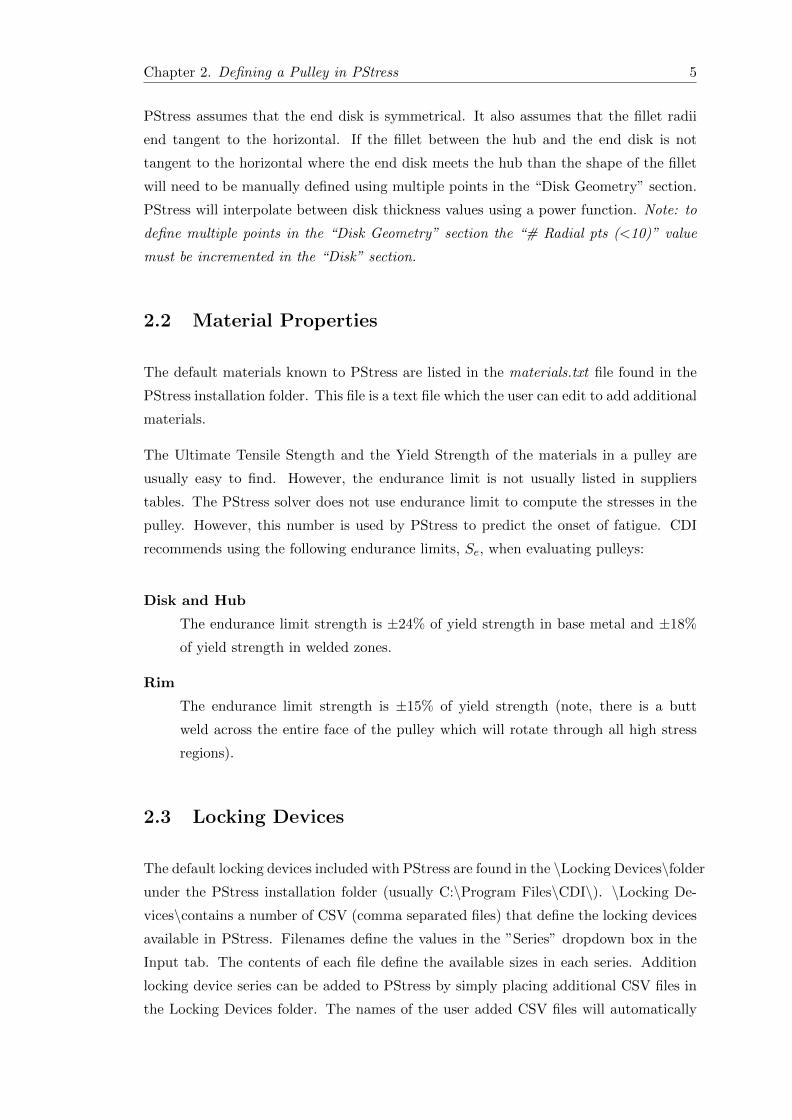
PStress assumes that the end disk is symmetrical. It also assumes that the fillet radii
end tangent to the horizontal. If the fillet between the hub and the end disk is not
tangent to the horizontal where the end disk meets the hub than the shape of the fillet
will need to be manually defined using multiple points in the “Disk Geometry” section.
PStress will interpolate between disk thickness values using a power function. Note: to
define multiple points in the “Disk Geometry” section the “# Radial pts (<10)” value
must be incremented in the “Disk” section.
2.2 Material Properties
The default materials known to PStress are listed in the materials.txt file found in the
PStress installation folder. This file is a text file which the user can edit to add additional
materials.
The Ultimate Tensile Stength and the Yield Strength of the materials in a pulley are
usually easy to find. However, the endurance limit is not usually listed in suppliers
tables. The PStress solver does not use endurance limit to compute the stresses in the
pulley. However, this number is used by PStress to predict the onset of fatigue. CDI
recommends using the following endurance limits, Se, when evaluating pulleys:
Disk and Hub
The endurance limit strength is ±24% of yield strength in base metal and ±18%
of yield strength in welded zones.
Rim
The endurance limit strength is ±15% of yield strength (note, there is a butt
weld across the entire face of the pulley which will rotate through all high stress
regions).
2.3 Locking Devices
The default locking devices included with PStress are found in the \Locking Devices\folder
under the PStress installation folder (usually C:\Program Files\CDI\). \Locking De-
vices\contains a number of CSV (comma separated files) that define the locking devices
available in PStress. Filenames define the values in the ”Series” dropdown box in the
Input tab. The contents of each file define the available sizes in each series. Addition
locking device series can be added to PStress by simply placing additional CSV files in
the Locking Devices folder. The names of the user added CSV files will automatically
Chapter 2. Defining a Pulley in PStress 6
appear in the Series dropped control after PStress is restarted. The contents of the
additional CSV file must be formatted identically to the contents of the existing CSV
file. These file can be editted in a text editor like Notepad, or with MS Excel.
2.4 Shaft Geometry
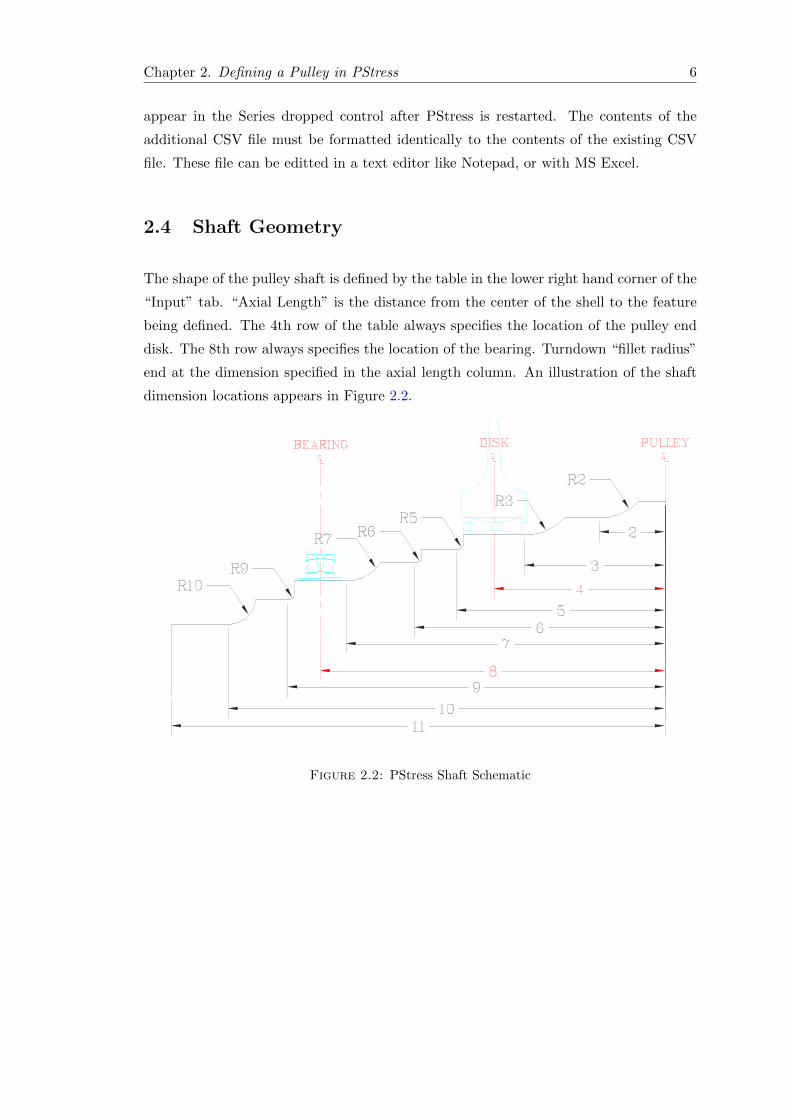
The shape of the pulley shaft is defined by the table in the lower right hand corner of the
“Input” tab. “Axial Length” is the distance from the center of the shell to the feature
being defined. The 4th row of the table always specifies the location of the pulley end
disk. The 8th row always specifies the location of the bearing. Turndown “fillet radius”
end at the dimension specified in the axial length column. An illustration of the shaft
dimension locations appears in Figure 2.2.
Figure 2.2: PStress Shaft Schematic
Chapter 3
Interpreting PStress Results
3.1 PStress Reports
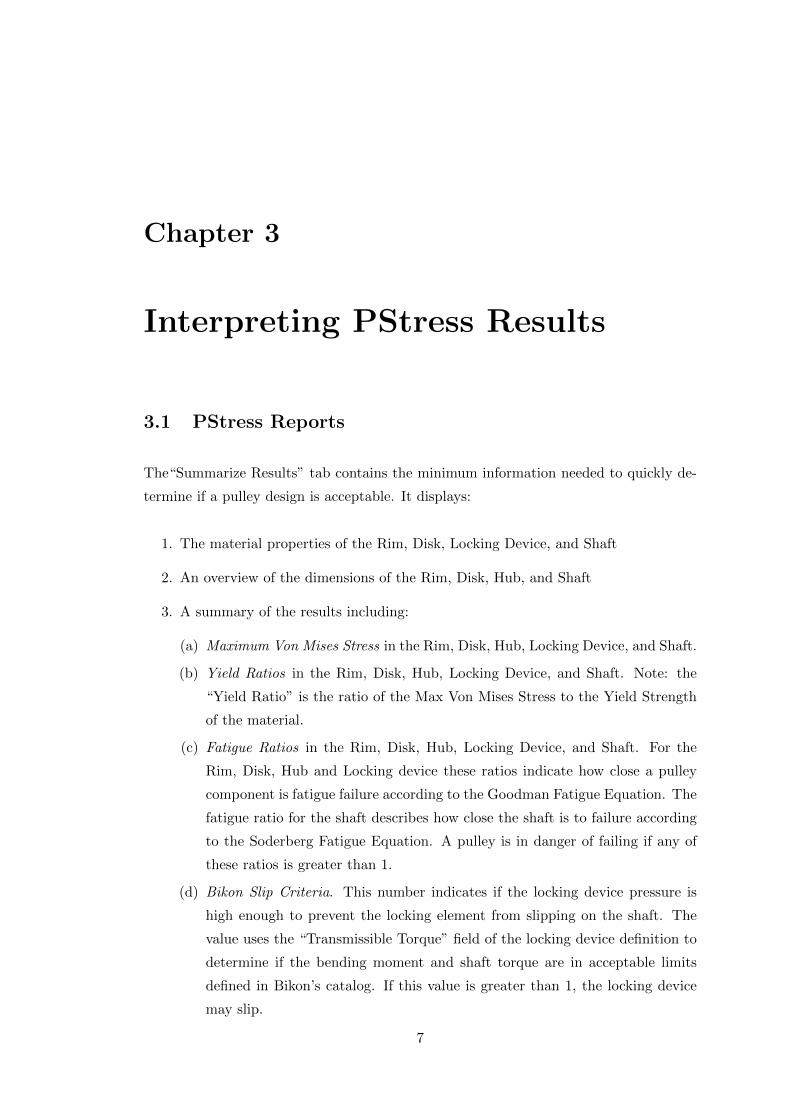
The“Summarize Results” tab contains the minimum information needed to quickly de-
termine if a pulley design is acceptable. It displays:
1. The material properties of the Rim, Disk, Locking Device, and Shaft
2. An overview of the dimensions of the Rim, Disk, Hub, and Shaft
3. A summary of the results including:
(a) Maximum Von Mises Stress in the Rim, Disk, Hub, Locking Device, and Shaft.
(b) Yield Ratios in the Rim, Disk, Hub, Locking Device, and Shaft. Note: the
“Yield Ratio” is the ratio of the Max Von Mises Stress to the Yield Strength
of the material.
(c) Fatigue Ratios in the Rim, Disk, Hub, Locking Device, and Shaft. For the
Rim, Disk, Hub and Locking device these ratios indicate how close a pulley
component is fatigue failure according to the Goodman Fatigue Equation. The
fatigue ratio for the shaft describes how close the shaft is to failure according
to the Soderberg Fatigue Equation. A pulley is in danger of failing if any of
these ratios is greater than 1.
(d) Bikon Slip Criteria. This number indicates if the locking device pressure is
high enough to prevent the locking element from slipping on the shaft. The
value uses the “Transmissible Torque” field of the locking device definition to
determine if the bending moment and shaft torque are in acceptable limits
defined in Bikon’s catalog. If this value is greater than 1, the locking device
may slip.
7
Chapter 3. Interpreting PStress Results 8
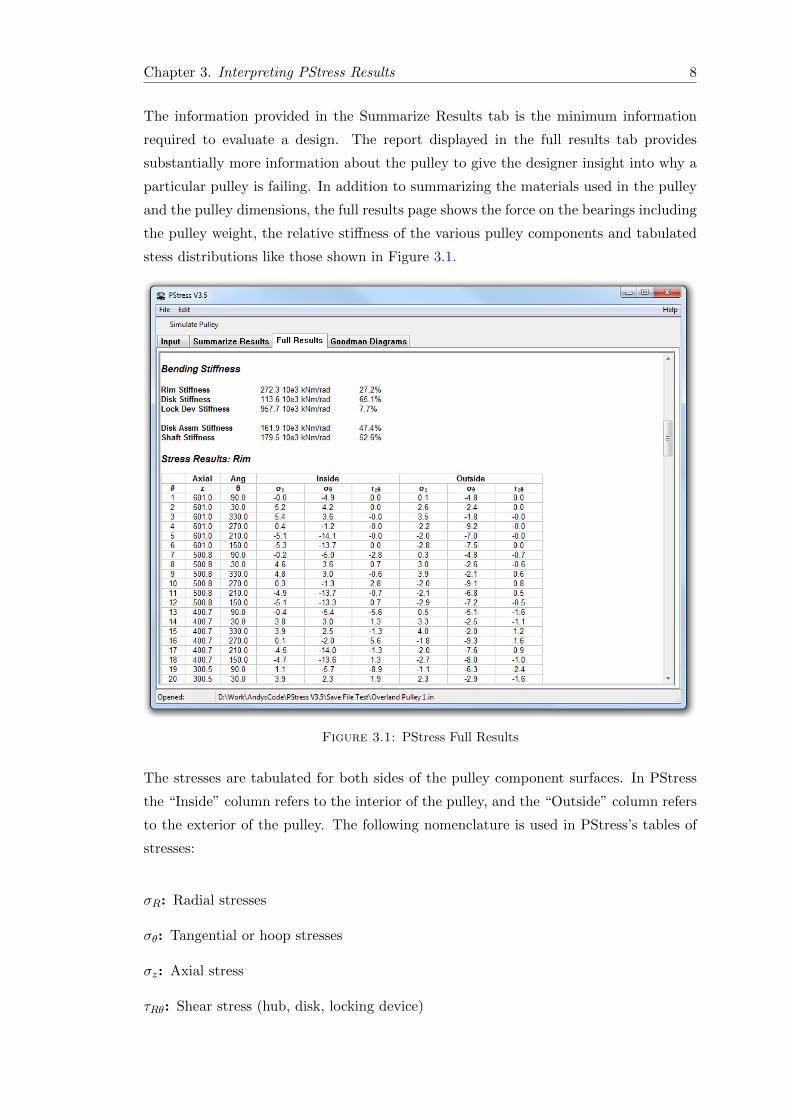
The information provided in the Summarize Results tab is the minimum information
required to evaluate a design. The report displayed in the full results tab provides
substantially more information about the pulley to give the designer insight into why a
particular pulley is failing. In addition to summarizing the materials used in the pulley
and the pulley dimensions, the full results page shows the force on the bearings including
the pulley weight, the relative stiffness of the various pulley components and tabulated
stess distributions like those shown in Figure 3.1.
Figure 3.1: PStress Full Results
The stresses are tabulated for both sides of the pulley component surfaces. In PStress
the “Inside” column refers to the interior of the pulley, and the “Outside” column refers
to the exterior of the pulley. The following nomenclature is used in PStress’s tables of
stresses:
σR: Radial stresses
σθ: Tangential or hoop stresses
σz: Axial stress
τRθ: Shear stress (hub, disk, locking device)

Chapter 3. Interpreting PStress Results 9
τZθ Shear stress (rim)
In addition to the table of stresses, the reports also contain tabulated displacement
tables for the rim, disk and shaft.
3.2 Fatigue Analysis using a Goodman Diagram
As the pulley rotates, the rim and the disk are subject to fluactuating stresses which
can cause high-cycle fatigue failure in these parts. The Goodman diagram is used to
determine is the various parts of the pulley will fatigue to failure. This diagram is
shown in Figure 3.2. PStress will generate Goodman Diagrams for the rim, disk, hub,
and locking device in the “Goodman Diagrams” tab of PStress. To use the Goodman
diagram we define the following parameters:
σmin = minimum stress
σmax = maximum stress
σa = stress amplitude = (σmax − σmin)/2
σm = stress mean = (σmax + σmin)/2
The Goodman Diagram shows all the strengths and limiting values of the stress com-
ponents for a particular mean stress. Failure is defined by the heavy outline. Goodman
Diagrams generated by PStress can be copied to the clickboard by right-clicking them.
After copying them to the clickboard, these diagrams can be pasted into MS Word or a
similar program.
The endurance limit strength, Se, is the point at which fatigue failure will not occur
regardless of the number of cycles of loading applied to the part. The value of Se is a
function of material properties (discussed in the previous chapter), the manufacturing
processes, the operating environment, and the design of the part.
In addition to the fatigue stress checks, CDI recommends adopting the following maxi-
mum stress limits:
Disk and Hub
The maximum combined stress should not exceed 70% of yield.
Rim
The maximum combined stress should not exceed 50% of yield.

Chapter 3. Interpreting PStress Results 10
Su
Mean stress
Str
ess
Sym
Se
Se
Sy
Su
min
0
Min
. str
ess
Max. stre
ssmax
r
a
a
45°
Figure 3.2: Goodman Diagram
Top Related