


Languages
Pages
Legal

ISJ-RE-16-05163.R2 1
Abstract— A plethora of decarbonisation pathways have been
suggested over the last few years and it has been generally
accepted that substantial progress towards more sustainable
transport requires a significant contribution from the freight
sector. Deep decarbonisation of road freight by conventional
means is difficult, so alternatives need to be investigated. One of
the most potentially beneficial approaches is electrification which
is the subject of the paper. The challenges of conventional electric
freight vehicles for long-haul operations are discussed and then
innovative power delivery systems that could alleviate the
problems are reviewed. A logistics concept to provide a framework
for the electrification of most road freight transport operations is
considered and based on that, simulation tools and methods are
presented to set the performance requirements for a practical
system. Finally, four case studies are developed for assessing the
feasibility of electrification of various road freight operations.
Overall, it is shown that electrification of road freight is a viable
route for more sustainable transportation.
Index Terms—charge-on-the-move, dynamic charging, electric
good vehicles, freight logistics, freight simulation
NOMENCLATURE
CoM Charge-on-the-move
CSC City Suburban Cycle
RDC Regional Distribution Centre
DECC Department of Energy and Climate Change
DfT Department for Transport
EFV Electric Freight Vehicle
ERCV Electric Refuse Collection Vehicle
EV Electric Vehicle
HGV10 Heavy Good Vehicle 10 tonnes
HGV38 Heavy Good Vehicle 38 tonnes
HWFET Highway Fuel Economy Test
ICE Internal Combustion Engine
IPT Inductive Power Transfer
MECR (Ψ) Mean Effective Charging Ratio
LDC Local Distribution Centre
LGV Light Good Vehicles 3.5 tonnes
Pr Principal section of road
SOC State of Charge of vehicle’s battery
Tr Trunk section of road
UCC Urban Consolidation Centre
UDDS Urban Dynamometer Driving Schedule
Manuscript received:
D. Nicolaides is with the Department of Engineering, University of
Cambridge UK (e-mail: [email protected])
I. INTRODUCTION
he prospect of irreversible climate change has raised the
obligation for governments to embark on substantial
programmes of decarbonisation. Many possible pathways have
been suggested over the last few years. It has been generally
accepted that decarbonisation of the transport sector is a
necessary step towards mitigating the effect of climate change.
The transport sector in the UK accounts for over a quarter of
national CO2 emissions [1], 91.6% of which are due to road
transport [2]. According to [2], 17% of road transport emissions
emanate from light duty freight vehicles and 22% are from
heavy good vehicles; the remainder are due to cars, passenger
service vehicles, etc. Because the road freight sector is thought
to be more difficult to decarbonise than personal transport, most
decarbonisation strategies project that the proportion of total
greenhouse gas emissions due to road freight will rise
significantly in future. To this end, substantial progress towards
more sustainable transport requires a significant contribution
from the freight sector.
Decarbonisation strategies for the road freight sector can
include a wide range of measures including improvements to
aerodynamics and rolling resistance of lorries, lighter weight
vehicles, improvements to propulsion efficiency, alternative
fuels, higher capacity vehicles and operational factors such as
reduced empty running, improved vehicle routing, etc. [3], [4].
Hydrogen is a possible alternative energy vector but the
technology has been shown to be inappropriate for freight
transportation. Widespread deployment of the required
infrastructure and hydrogen storage are major barriers [5], [6].
Furthermore, the overall efficiency of a hydrogen generation
and distribution system (production to wheels) is only 19-23%
[7]. This poor overall efficiency is substantially lower than
those of modern diesel engines, which are typically 40-45%.
Diesel engines therefore use about half as much energy overall
as Hydrogen-powered electric vehicles [7], [8].
Another alternative to fossil fuels is biofuels. These require
only limited investment in infrastructure and the performance
of a vehicle powered by biofuels is similar to the performance
of a conventional vehicle [6]. However, there is not sufficient
biomass globally to replace more than 20% of the total vehicle
fuel consumption, and even this would be at the expense of land
for food crops being used for fuel [6]. The EU aims to have
10% of the transport fuel come from renewable sources such as
biofuels by 2020, with a corresponding reduction of the
D. Cebon is with the Department of Engineering, University of Cambridge
UK (e-mail: [email protected])
J. Miles is with the Department of Engineering, University of Cambridge UK (e-mail: [email protected])
Prospects for Electrification of Road Freight
Doros Nicolaides, Member, IEEE, David Cebon, and John Miles
T

ISJ-RE-16-05163.R2 2
greenhouse gas intensity of the EU fuel mix of 6% [9]. There
are no EU targets for higher levels of biofuel after 2020.
Natural gas can also be used for road freight vehicles. The
technology has the potential for reducing CO2 emissions by 10-
15%. This is possibly a worthwhile interim measure, but it can
never achieve the deep levels of decarbonisation needed in the
long term. Again, there is insufficient biomethane for
significant decarbonisation of freight transport on a national
scale.
Hybrid drive trains are one possibility for making a
significant difference. Odhams et al [3] showed that
regenerative braking technologies could be capable of reducing
fuel consumption of urban delivery vehicles by 25-30%.
Midgley et al [10], [11], [12] developed a hydraulic hybrid
urban semitrailer to explore this option and demonstrated 9-
18% reduction in fuel consumption depending on the drive
cycle. Another vehicle concept suitable for urban freight
deliveries was explored and then built as part of a European
project [13].
Deep decarbonisation of road freight is challenging. One of
the most potentially beneficial approaches is electrification,
which is the subject of this paper. The necessary infrastructure
for delivering electricity is sufficiently mature, although a
significant upgrade would be required to accommodate the
additional power demand of electrifying transport. Improved
charging infrastructure would be needed, and this would be
particularly challenging for long-haul freight. The adoption of
electric freight transportation offers opportunities for zero
emissions at the point of use, which is particularly attractive for
urban areas. Yet there are still substantial CO2 emissions at the
point of generation –the power plants. Consequently, shifting
towards electric freight vehicles (EFVs) will only deliver
significant CO2 reductions if the electricity supply network is
decarbonised. For the UK, around 400g of CO2 is emitted for
every kWh of electricity generated [14]. According to national
objectives this value has to be as low as 90-130gCO2/kWh by
2030 considering various possible decarbonisation scenarios
and different emission rates through days and seasons. Even
lower values are projected by 2040 around 30-50gCO2 per kWh
[14]. If electrification is to be an effective measure for
decarbonising road freight, almost complete decarbonisation of
the electricity grid is a pre-requisite. This will have to be
achieved in the face of significantly increased electricity
demand for running transport systems, in addition to the
conventional uses of electricity for light, heat and power.
Although the decarbonisation of transport sector is a long-
term objective, electrification of freight transportation is also an
interesting option for some nearer-term solutions. EFVs offer
zero tailpipe emissions, eliminating the release of noxious
pollutants. This feature coupled with low operating noise and
straightforward implementation of regenerative braking make
electric freight vehicles attractive for urban operations,
particularly in cases where the required operating range is short
and predictable. Examples are deliveries to city centre stores
1 Battery recharging times can be over 8 hours whereas filling a liquid fuel
tank requires only a few minutes. Though it might be argued that a number of
from urban consolidation centres (UCCs), e.g. the ‘Regent
Street UCC’ operation in London [15].
Aspirations for electric urban deliveries are shared by some
established freight companies and European funded projects. In
particular, ‘UPS’ (package delivery company and provider of
supply chain management solutions) has been investigating the
adoption of alternative fuel engine vehicles for their operations.
EFVs have been identified as an alternative that could
significantly contribute towards the company’s environmental
objective to “deliver more while using less” [16]. The European
‘ENCLOSE’ project also aims to improve urban freight
efficiency and advocates about the use of EFVs instead of
conventional vehicles [17].
This paper aims to address the question of whether deep
decarbonisation of the GB national road freight system by
electrification is feasible. The analysis is focused on the case of
GB which has been eager to adopt measures to reduce
substantially its CO2 emissions by 2050. Nevertheless, the
methodology presented in the paper could be considered as a
comprehensive framework to assess the prospects for
electrification of road freight in other similar countries as well.
Alternative national traffic statistics, road length data, drive
cycle profiles, etc. could be processed by similar simulation
tools and methods to those presented in the paper.
A. Challenges
Widespread penetration of EFVs is dependent on
overcoming significant barriers. The largest of these are the
high cost, mainly due to the batteries; the limited range; the long
battery recharging times1 [18], [19], and the lack of public
charging infrastructure [20]. Indeed, Lithium-Ion batteries, the
most attractive technology for electric vehicle (EV) propulsion
[21], have energy densities around 0.1kWh/kg, which is a an
order of magnitude lower than for gasoline at 12kWh/Kg [22].
This, coupled with the high power and energy demands of
freight vehicles means that battery-power alone is not a
practical proposition for long-haul freight transport. The only
way to overcome this barrier would be to provide electricity to
the vehicles while they are in motion.
B. Power delivery/charging
This section discusses the state of the art of power
delivery/charging of electric vehicles (EVs), with the aim of
identifying ways of overcoming the challenges and enabling the
shift towards electric freight transportation. It reviews some
current research into technical aspects of power delivery but it
also highlights the lack of holistic research into the
characteristics of charging systems.
Power charging systems for electric vehicles (EVs) have
been under development for decades. Conductive systems are
well established and have high efficiency and reliability. More
recently, there has been considerable interest from academia
and industry into non-conductive (wireless) chargers suitable
for EVs [23]. The ability to avoid plug-in cables and to use
simple systems that are unaffected by weather conditions is
fast recharging technologies have been proposed recently [53], there is no scientific consensus regarding battery degradation and reduction of life span.

ISJ-RE-16-05163.R2 3
likely to be attractive to drivers.
The Inductive Power Transfer (IPT) technique is one of the
most promising technologies for future power delivery. It has
been used in numerous non-EV applications for over 25 years.
These include entertainment systems of airplanes [24] where
power is distributed wirelessly to video entertainment units set
in the back of each passenger seat for convenience and
maintenance reasons; harsh environments like underwater and
mining applications [25], [26]; applications in factories such as
cable-free power supplies for moving parts on machines [27];
clean rooms like semiconductors fabrication rooms [28];
lighting applications [29]; amusement parks; and others.
IPT involves contactless energy transfer between two LC
circuits which are in proximity to each other. For example, in
common transformers, energy is transferred between the
primary and secondary coils through a magnetic field. Energy
transfer efficiencies up to 98% can be achieved when there is
strong magnetic coupling between the coils. In applications
where a magnetic core cannot be used or the distance between
the two circuits is large (tens of mm), high efficiency can be
obtained by tuning both circuits to a single resonant frequency.
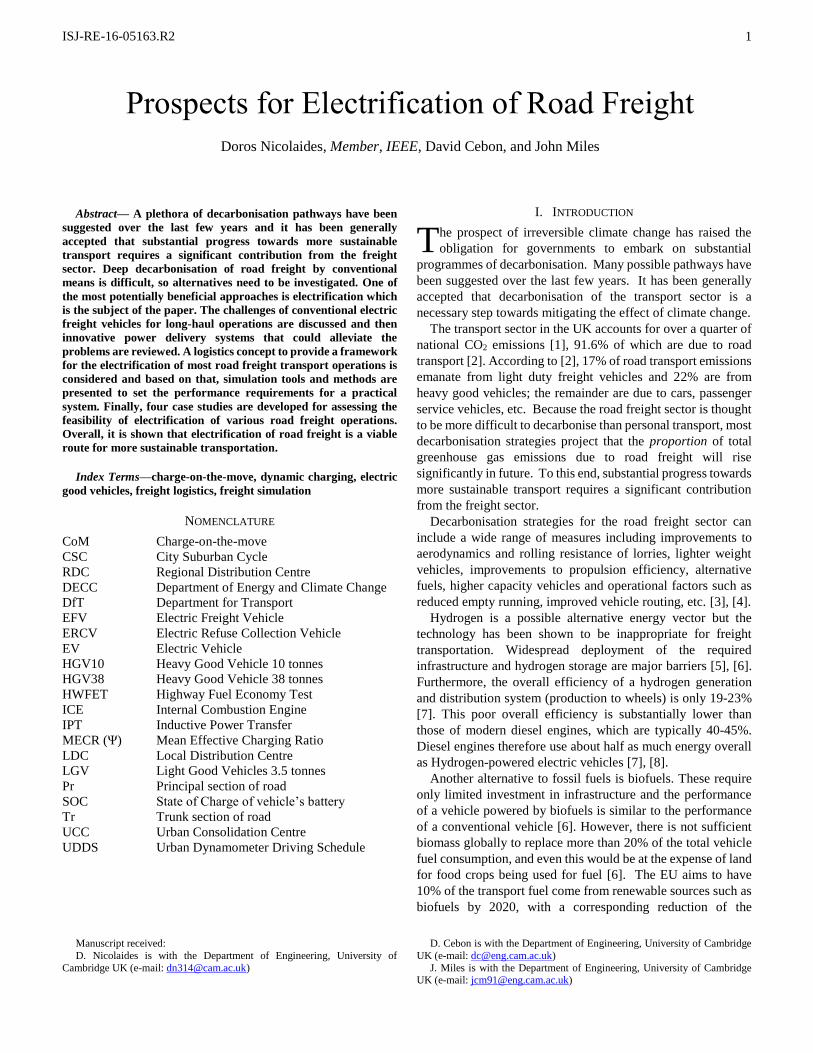
A typical IPT system for EV power delivery applications is
shown conceptually in Fig. 1. It comprises two major sub-
systems: the road charging unit (primary circuit) and the vehicle
charging unit (pick-up or secondary circuit). The primary
circuit is supplied with AC power at a suitable operating
frequency. The transmitting coil is energised and the resulting
magnetic flux is captured by the vehicle charging unit, inducing
an AC voltage which can be rectified to produce a stable DC
power source for the electric motor, the batteries and other loads
on board. Compensation is required on both sides of the system
to minimise the reactive impedance of the system and maximise
the power transfer delivery.
Fig. 1. Typical IPT system for EFVs power delivery
Development of IPT devices would enable ‘charge-on-the-
move’ (CoM) also known as ‘dynamic charging’ to be
implemented. In such a system, the road infrastructure would
transfer energy wirelessly to road vehicles whilst they are on
move. This technology offers the opportunities for substantially
reducing the installed battery capacity of EVs, eliminating
‘range anxiety’, reducing the cost and mass which are some of
the major barriers for widespread use of EVs.
Previous theoretical work on the subject revealed that CoM
technology is technically and economically feasible for
passenger cars [30], [31]. The total cost of installing CoM
infrastructure on the GB’s motorway and Rural ‘A’ road
network was estimated to be £3m and £2.6m per mile of road
respectively; a cost that is similar to that required for
electrifying one mile of train track at £2-4m. Such a charging
infrastructure would enable the electrification of up to 86% of
passenger car-miles, excluding those travelled on urban roads,
for less than £80b which is similar to the cost of building the
HS2 rail link between London and Birmingham [30]. The social
and environmental aspects of CoM in the GB have been
assessed using sustainability principles [32]. Overall, it was
concluded that CoM could play a significant role as part of the
CO2 mitigation efforts in the future without undermining social
integrity, environmental stability, or economic prosperity.
Only limited number of experimental CoM systems have
been tested in practice and the performance of such a system
cannot been specified accurately at the moment. However, the
IPT technology for the automotive industry has been under
development for some years. High efficiencies for static
charging applications around 95% can be achieved in power
delivery of tenths kW across hundreds of millimetres of air gap
with some misalignments [33], [34], [35]. Moreover, ongoing
research aims to maintain similar levels of efficiency for
dynamic charging applications [36], [37]. This coupled with
likely widespread penetration of lane keeping assistance driving
aids for eliminating misalignment issues, the efficiency of
potential CoM systems is expected to reach up to 90%.
A comprehensive study of battery degradation and life in
relation to CoM, has not been found in the literature.
Nevertheless, it has been reported frequent, small charging
boosts (as may be provided by a CoM infrastructure) would
increase the life of Lithium-Ion batteries when compared with
deep charging and discharging cycles [38].
The ‘charge-on-the-stop’ concept involves installation of IPT
devices at pre-determined locations along a well pre-defined
route, for charging commercial EVs during their journeys. Such
an approach could be used for buses that charge at stops or at
terminals; urban freight vehicles that charge at depots and
delivery points; or even refuse collection vehicles which could
charge at stopping points along their routes. One such example
is the Milton Keynes bus project [39], in which electric buses
receive a 10min booster charge at wireless charging points
locate at either end of a 25km route between the Milton Keynes
suburbs of Wolverton and Bletchley. The line carries an
estimated 800,000 passengers a year.
Overhead catenary systems provide an alternative
technology for charging EFVs on the move. Similar technology
has been use for years for powering trams, trains, and trolley
buses, but has recently been applied to electric road freight
vehicles. Siemens has been developing a catenary system for
electric lorries since 2011 as part of the ENUBA research
project [40]. The diesel-electric hybrid trucks collect electrical
energy from overhead wires, using a sophisticated pantograph
system that can connect and disconnect autonomously as the
vehicle enters and exits electrified sections of road (Fig. 2). The
energy supply consists of a two-wire overhead system,
operating at around 650VDC, with current ratings that match
the characteristics of the 260kW electric motors on the vehicles.

ISJ-RE-16-05163.R2 4
Fig. 2. Siemens overhead catenary system, from [40]
Either of these ‘electrified highway’ systems could
potentially provide power to future long haul highway vehicles.
II. LOGISTICS CONCEPT AND OPPORTUNITIES
It is very unlikely that existing long-haul road freight
vehicles could be converted to battery-powered electric freight
operation, because of their high power consumption, long
distances travelled, large amounts of energy required and the
relatively low energy-density of existing and foreseeable future
battery technologies. It would be impractical (and too
expensive) to carry sufficient batteries. However, with
utilisation of CoM technologies, electrified long-haul freight
may be possible. This would necessitate some changes to the
logistics network to enable appropriate electrification strategies
to be used in the various types of operation. This section defines
a modified structure of logistics network that would facilitate
such a change. Fig. 3 presents a concept for overall road freight
operations in GB that could potentially be used in conjunction
with current and likely future electrification technologies to
provide a framework for the electrification of most road freight
transportation operations.
In this model, road freight transportation is divided into four
main categories: ‘long-haul trunking’, ‘urban delivery’, ‘home
delivery’, and other ‘auxiliary services’. Different vehicles and
charging infrastructures would be needed for each of these
operations.
(i) ‘Long-haul trunking’ is responsible for the
transportation of goods between national and regional
distribution centres (RDCs) and local distribution centres
(LDCs) or Urban Consolidation Centres (UCCs), on the edges
of cities using the national trunking network. Most journeys are
travelled on motorways and principal roads by heavy good
vehicles of 35-44 tonnes gross mass. In an electrified freight
system, these trunk routes would have CoM infrastructure.
These vehicles would therefore only need modest battery
capacity to handle short off-network operations, in and out of
depots.
(ii) ‘Urban delivery’ refers to deliveries within city
boundaries and the supply of goods from LDCs (which could
be located at supermarkets) to inner-city convenience stores, or
from UCCs to individual shops. Heavy good vehicles up to 10
tonnes would be mainly exploited for this type of services. The
journeys would be fairly short and predictable, and mostly take
place on major urban roads. Such operations could be operated
by battery-powered EVs that charge their batteries while
loading at depots and could potentially top-up at wireless
charging points while unloading – e.g. at convenience stores.
(iii) Transportation of goods from LDCs to consumers
would be performed by ‘home delivery’ operations, using light
good vehicles, often under 3.5 tonnes. These could be battery
EVs that are routed for multi-drop operations within their
available electric range.
(iv) ‘Auxiliary services’ includes other operations within
the area of municipalities, such as refuse collection functions,
buses, etc. Such vehicles could use ‘charge-on-the-stop’
technologies, with contactless ‘top-up’ charging points
distributed at key locations along their routes. This would
significantly reduce the necessary battery capacity.
Fig. 3: Logistics concept for electrified road freight. Not to scale.
It is unlikely that all freight operations could utilize this
system. There are some other types of operation such as
deliveries of large in-divisible loads or transport of fuels and
hazardous liquids where this approach would not be viable.
However, these operations could use ‘plug-in hybrid’
propulsion systems. This would enable them to use the CoM
infrastructure for fully-electric, long-haul operations, but with
an internal combustion engine (ICE) to charge the batteries and
provide an extended range when operating off the CoM
network. These operations off the network could likely be done
at relatively low speeds and would therefore require less power
than high-speed long haul trunking. Consequently, the ICE
could be significantly smaller than the large diesel engines in
existing heavy vehicles and the CO2 emissions of these residual
hybrid operations would be much lower. These vehicles are not
considered further in this paper.
Our selection of the particular electrification system for each
of the logistics operations is based on using the smallest
possible battery pack in each case. This would reduce the
weight, cost, embodied energy and rolling resistance of the
vehicle and allow more mass and volume for the payload.
Where charging can be performed practically during the
journey, to enable use of a smaller battery (e.g. charging while
loading or unloading), this is the chosen option.

ISJ-RE-16-05163.R2 5
III. MODELLING
Based on the logistics concept described above, system
performance requirements can be defined and the various
aspects of the freight system can be simulated to assess their
feasibility for electrical operations. This is the approach taken
in this paper.
A simulation is firstly performed to estimate the average
power requirements of EFVs. Then, the derived figures are
combined with GB road traffic data to get an estimate of the
anticipated power demands on various roads around the
country. Finally, a charging simulation tool is presented to
illustrate how the provision of dynamic charging could be used
by long-haul freight vehicles to investigate important
parameters such as mileage range and state of charge (SOC) of
the vehicle’s battery.
A. System characterisation
The ‘Advanced Vehicle Simulator’ (Advisor) was used to
estimate the power requirements of EFVs travelling on
specified driving cycles. Advisor is an open source software
tool that was developed at the National Renewable Energy
Laboratory for the US Department of Energy in 1994 [41]. The
latest version of the software was released in 2003. Its accuracy
has been validated by several authors and international labs
[42], [43].
A substantial list of standard vehicle models is available,
including light and heavy-duty vehicles with conventional,
hybrid-electric, and full-electric powertrain configurations. In
order to model the performance, fuel economy, and emissions
of a particular vehicle, the user specifies components such as
motors, batteries, vehicle mass, additional electric loads etc.
The simulations are executed over selected driving cycles,
containing speed and elevation profiles versus time (or
distance). The Advisor database has been supplemented by
driving cycles for urban, rural, and motorway roads appropriate
for freight vehicles as described by [44]. The driving cycles are
differentiated by vehicle type: light good vehicles (up to
3,500kg) and heavy good vehicles (over 7,500kg) as illustrated
in Fig. 4 and Fig. 5 respectively.
The simulation produces a variety of output quantities. For
EFVs these include the target and actual speeds of the vehicle
through the driving cycle, the power required from the electric
motor, and the battery SOC versus time/distance.
Three different categories of EFVs are considered in this
paper, based on the logistics concept described above. These
are: (a) light good vehicles up to 3.5 tonnes (LGV); (b) heavy
good vehicles up to 10 tonnes (HGV10); and (c) heavy good
vehicles up to 38 tonnes (HGV38). Standard vehicles provided
by Advisor were adjusted appropriately and values were
determined for the power rating of electric motors, the
capacities of the on-board batteries, constant electrical loads
(e.g. for refrigeration), and the overall masses of the vehicles.
The final values are summarised in TABLE 1.
Advisor was used to determine the average power
requirements for each category of EFV. The ‘LDV_PVU 3.5t
vans motorway’, ‘LDV_PVU 3.5t vans rural’, and ‘LDC_PVU
3.5t vans urban’ drive cycles, as shown in Fig. 4, were used for
LGVs travelling on motorways, rural, and urban roads
respectively. Similarly, the ‘Highway Fuel Economy Test
(HWFET)’, ‘EPA Urban Dynamometer Driving Schedule
(UDDS)’, and ‘City Suburban Cycle (CSC)’, as shown in Fig.
5, were used for both HVG10 and HGV38 vehicles. The results
are presented in TABLE 2 for three different road types. For
example, an electric LGV demands an average power of 40kW,
18kW, and 11kW on motorways, rural, and urban roads.
TABLE 1
COMPONENTS OF SIMULATED EFVS
Advisor’s vehicle model Motor
(kW)
Battery
(kWh)
Load
(kW)
Mass
(kg)
LGV Full size cargo van 75 27 2 3,500
HGV10 Ralphs Grocery 1998 75 42 4 10,000
HGV38 Kenworth T800 Trailer 277 85 4 38,000
(a)
(b)
(c)
Fig. 4. Driving cycles for light good vehicles used in this study - Speed (mph)
vs Distance (miles). (a) LDV_PVU 3.5t Vans Urban (b) LDV_PVU 3.5t Vans
Rural (c) LDV_PVU 3.5t Vans Motorway
(a)
(b)
(c)
Fig. 5. Driving cycles for heavy good vehicles used in this study – Speed
(mph) vs Distance (miles). (a) City Suburban Cycle (CSC) (b) EPA Urban
Dynamometer Driving Schedule (UDDS) (c) Highway Fuel Economy Test
(HWFET)

ISJ-RE-16-05163.R2 6
TABLE 2
AVERAGE POWER REQUIREMENTS – KW PER MILE OF ROAD
Motorway (kW) Rural ‘A’ (kW) Urban (kW)
LGV 40 18 11
HGV10 61 38 25
HGV38 123 100 74
These average power requirements were combined with the
numbers of EFVs on various roads, in order to estimate the total
power needed from the power infrastructure. Average annual
daily traffic flow by road class was obtained from Department
for Transport (DfT) statistics for various types of vehicles. The
base data [45] provides the number of vehicles per day that will
drive on a specific stretch of road on an average day of the year.
Various road freight vehicle classes merged together into three
main categories. Category 1 contains vehicles up to and
including 3.5 tonnes. Category 2 contains vehicles from 3.5-19
tonnes. Category 3 contains vehicles in the 19-44 tonnes range.
The three categories were selected appropriately to match both
the vehicles considered in the logistics concept (Fig. 3) and the
three modelled EFVs (LGV, HGV10, and HGV38).
The number of vehicles per mile of road for each category
was estimated for each region of GB by dividing the average
daily traffic by 24 (hours of the day) and the appropriate speed
limits for each section of road. Practical speed limits in GB for
LGV up to 3.5 tonnes are (i) 70mph travelling on motorways
(ii) 50mph on rural ‘A’ roads and (iii) 30mph on urban roads.
For HGV over 7.5 tonnes the assumed speed limits are (i)
56mph travelling on motorways (ii) 50mph on rural roads, and
(iii) 30mph for urban roads. TABLE 3, TABLE 4, and TABLE
5 present the average number of vehicles per mile of road in GB
for the three categories of freight vehicles. The derived figures,
which include 30% safety margin, present data for all major
roads in GB classified into trunk (Tr) and principal (Pr)
sections2. TABLE 3
CATEGORY 1 VEHICLES PER MILE OF ROAD IN GB BY REGION IN
2013 (AVERAGE NUMBER THROUGH A DAY)
Motorway Rural ‘A’ Urban ‘A’
Tr Pr Tr Pr Tr Pr
England North East 6 6 3 1 14 4
North West 8 4 2 1 6 4 Yorkshire-Humber 8 6 4 1 10 4
East Midlands 10 0 4 1 9 4 West Midlands 8 8 3 1 11 4
East of England 10 0 5 2 8 4
London 11 0 0 4 0 6 South East 10 6 5 2 8 4
South West 7 0 3 1 8 4
Wales 7 0 2 1 7 4 Scotland 5 0 1 0 8 3
TABLE 4
CATEGORY 2 VEHICLES PER MILE OF ROAD IN GB BY REGION IN
2013 (AVERAGE NUMBER THROUGH A DAY)
Motorway Rural ‘A’ Urban ‘A’ Tr Pr Tr Pr Tr Pr
England North East 1 1 1 0 2 0
North West 2 1 0 0 1 0 Yorkshire-Humber 2 1 1 0 2 0
East Midlands 2 0 1 0 1 0
2 A trunk road in GB is a major road (motorway) between places of traffic
importance. The entire trunk road network (Primary Route Network) has the aim to provide easily identifiable routes to access the whole of the country [54].
West Midlands 2 1 1 0 2 0
East of England 2 0 1 0 1 0 London 2 0 0 1 0 1
South East 2 1 1 0 1 0
South West 2 0 1 0 1 0 Wales 1 0 0 0 1 0
Scotland 1 0 0 0 2 0
TABLE 5
CATEGORY 3 VEHICLES PER MILE OF ROAD IN GB BY REGION IN
2013 (AVERAGE NUMBER THROUGH A DAY)
Motorway Rural ‘A’ Urban ‘A’
Tr Pr Tr Pr Tr Pr
England North East 4 1 2 0 4 0 North West 7 1 1 0 1 0
Yorkshire-Humber 8 1 3 0 5 0
East Midlands 11 0 4 0 3 0 West Midlands 8 2 2 0 4 1
East of England 8 0 3 0 4 0
London 8 0 0 1 0 1 South East 6 1 2 0 2 0
South West 5 0 1 0 2 0
Wales 4 0 0 0 1 0 Scotland 3 0 1 0 2 0
The average number of vehicles per mile of road across a day
were shaped with daily traffic distribution data obtained from
DfT [46]. The derived daily profiles were combined with the
power requirements listed in TABLE 2 to calculate the power
demand per mile of road across GB throughout a typical day.
The methodology assumes 100% adoption of EFVs for sizing
the infrastructure, based on current traffic conditions.
Although Category 1 (LGVs) and Category 2 (HGV10)
vehicles are not supplied in-motion but on-the-stop according
to the logistics concept in section II, we can still estimate the
additional power demand based on the number of vehicles per
mile of road. We assume that the number of LGVs/HGV10 on
the roads of GB, given by Table 3/4, is the same, with
LGVs/HGV10 performing urban/home delivery operations.
The required energy to be supplied to the vehicles (i)
continuously from a CoM infrastructure or (ii) at intervals from
charge-on-the-stop top-up points, must be the same. The power
demand is calculated in hourly steps. Hence, the average power
within a 1-hour time slot is the same for both situations.
Although the actual power demand varies within the 1-hour
time slot, our study does not investigate smaller time resolution.
As an illustration, the average density of LGVs per mile of
motorway in London is presented with the dashed line in Fig.
6; whereas the average power required to propel this number of
vehicles during each hour of the day is presented with the solid
line. During the peak hours of the day, the average power
demand by LGVs is around 920kW per mile of motorway. The
average power required per mile of motorway in London for
HGV10 and HGV38 during the peak hours is 260kW and
1,790kW respectively. The average power required to electrify
the road freight transportation for each type of major road and
different regions of GB can be calculated. The peak power
demands are summarised in TABLE 6. Notice that a total
The remaining sections of major roads in GB (A-Roads) are classified as
Principal roads.

ISJ-RE-16-05163.R2 7
additional power demand of 9.4GW during the peak hours
would be introduced to the electricity grid. The magnitude of
the load exceeds substantially the capacity margin of the
electricity supply network in GB at peak hours, which is around
5GW [47].
Nevertheless, various authorities have already embarked on
plans to upgrade the electricity supply network around the
country, because the power demand is estimated to increase
significantly in future due to the shifting to EVs and electric
heating. To this end, the anticipated installed generating
capacity in GB is estimated to be around 100-130GW by 2050
which is approximately double the current installed capacity
[48]; giving a significant capacity margin for the electrification
of road freight. Furthermore, the Electricity Networks Strategy
Group has defined pathways to reinforce the transmission
network of GB [49] and finally, various distribution companies
have already embarked on upgrade projects to deal with the
increased future demand [50], [51].
Fig. 6. Power required and density of LGV on a typical motorway in London
by hour of day
TABLE 6
PEAK POWER DEMAND IN GW OF ELECTRIFIED ROAD FREIGHT
TRANSPORTATION
Motorway Rural ‘A’ Urban ‘A’ Total England 4.8 2.8 0.6 8.2
Wales 0.1 0.2 0.04 0.3
Scotland 0.4 0.4 0.08 0.9 Total 5.3 3.4 0.7 9.4
B. Charging Simulation tool
A simulation tool was developed on top of the ‘Advisor’
software tool to investigate the application of dynamic charging
and the effects of system design variables on important
performance parameters, such as the mileage range and the
SOC.
The input interface to the tool is shown in Fig. 7. The inputs
are:
(i) The type of EFV and its driving cycle;
(ii) The specification of the EFV’s batteries: cell capacity,
number of cells in parallel, number of modules in
series, initial SOC;
(iii) The specifications of the dynamic charging system:
distance between consecutive chargers, the charging
segment length, and the nominal power rating of the
charger.
Fig. 7. Charging simulation tool input interface
The example in Fig. 7 shows the input data for investigating
the journey of a HGV38 vehicle travelling on motorway, 45%
of which is ‘online’ (4.5m segment/ 10m apart) at 350kW
nominal power transfer rate.
The charging model assumes instantaneous operation of
chargers when a vehicle is located within the charging segment
length boundaries and 100% energy transfer efficiency -
without considering any misalignments between the vehicle and
the charging device. In practice some inefficiency (typically
90%) is expected, as explained in the introduction for real CoM
systems. Any tolerance on fore-aft misalignment is assumed to
be included in the segment.
Fig. 8 shows the results of a simulation based on the input
data in Fig. 7. The four graphs show: (a) the requested (target)
speed of the vehicle during the run; (b) the power required from
the electric motor to track the drive cycle; (c) the energy
requested (used), the energy received, and the energy consumed
throughout the whole journey; and (d) the SOC of the vehicle
with and without the use of the CoM system. At the bottom of
the figure additional outputs of the run are listed: (i) the battery
capacity of the vehicle under investigation, (ii) the final SOC
without any charging facilities, (iii) the final SOC with CoM
infrastructure, (iv) the total energy requested (used by the
electric motor) in the simulation run, (v) the energy received
from the CoM system, (vi) the energy consumed during the
whole journey, (vii) the equivalent fuel economy of the vehicle
under investigation, (viii) the average consumption of the
vehicle, and finally (ix) the ‘Mean Effective Charging Rate’
(MECR), denoted Ψ, which is the energy delivered by the
charging system per metre along the road.
The speed, power, and energy are calculated by the ‘Advisor’
simulation according to the parameters of the vehicle and
driving cycle under investigation. The energy received from the
charging system and the consequent SOC of the vehicle are
determined by the charging simulation and depend on the user’s
input specification for the charging system. The longer the
charging segments and the power rating, the larger the amount
of energy transferred; whereas the greater the distance between
two segments, the lower SOC at the end of the journey.
It can be seen from the third graph of Fig. 8 that the energy
‘requested’ (used) by the electric motor is relatively constant
during the journey, whereas the energy received, and as a result,
the energy consumed (which is plotted with negative values
when the energy received is greater than the energy requested),
fluctuate between zero and a relatively constant value. This is

ISJ-RE-16-05163.R2 8
due to the fact that charging devices are installed periodically
along the road and energy is transferred only when the vehicle
is located over the charging device. The upper value of
transferred energy is influenced by the power rating of the
charging device and the speed of the vehicle; since the longer
the charging coil spends within the effective boundaries of the
charging system, the higher the received energy.
Finally, the fourth graph in Fig. 8 shows that HGV38 would
have 33% SOC on battery power alone after 16 miles on this
driving cycle, whereas with a dynamic charging system capable
of delivering 𝛹 = 9.3 𝑘𝐽/𝑚, it could run indefinitely.
(a)
(b)
(c)
(d)
Battery
Capacity (kWh)
86 Energy Requested
(kWh)
58 Equivalent fuel
economy (mpg)
8.2
Final SOC (%) 33 Energy Received
(kWh)
66 Aver. consum.
(kWh/mile)
3.7
Final SOC with
CoM (%)
110 Energy Consumed
(kWh)
-9 Ψ (kJ/m): 9.3 9.3
Fig. 8. Output of a simulation for HGV38 travelling on the HWFET drive cycle,
shown in Fig. 5c. (a) Requested speed of vehicle (b) Requested power from
electric motor (c) Energy plots (d) State of charge history
IV. CASE STUDIES
This section develops four case studies for assessing the
feasibility of electrification of road freight.
A. Long haul
The first case study is concerned with ‘long-haul freight
transport’ which enables the transportation of goods between
distribution centres located on or near to trunk routes.
Articulated heavy vehicles in the range 33-44 tonnes are mainly
used for this type of deliveries in Europe and our analysis
assumes the HGV38 articulated vehicle described in TABLE 1.
In the simulation, each vehicle is assumed to have a 277kW
electric motor, 85kWh battery capacity, 4kW constant
consumption for on-board loads, and 38 tonnes overall mass.
In the logistics model shown in Fig. 3, long-haul journeys are
assumed to occur predominantly on trunk routes, with just a few
miles of local roads between highway exits and the delivery
points (distribution centres). To this end, the investigation for
3 The average speed of the vehicle following the HFET drive cycle, shown
in Fig. 5c is 34 mph. The power required then is calculated as 𝑃 =9.3𝑘𝐽 𝑋 34𝑚𝑝ℎ = 140𝑘𝑊
long-haul deliveries is divided in two parts: (i) the trunk roads
themselves, where a CoM system must be provided to enable
steady-state operation, with the on-board batteries running at a
constant (or increasing) state of charge; (ii) the journey from the
end of each trunk road to nearby delivery points / distribution
centres and back to the motorway, using battery power.
1) Driving on Trunk Roads
The charging simulation tool was used to determine the
MECR level Ψ needed to balance out the energy consumed by
the vehicle on a motorway, using the Highway Fuel Economy
Test (HFET) drive cycle, shown in Fig. 5c. Fig. 9 shows the
SOC of the HG38 vehicle model, for various MECR values Ψ.
For 𝛹 = 0 , no energy is transferred to the vehicle and it can be
seen that the SOC is depleted rapidly after approximately
22miles (35km) journey on a motorway. When 𝛹 = 8.2𝑘𝐽/𝑚
the energy received from the dynamic charging system largely
balances the energy consumed by the vehicle and the SOC
remains around 100% throughout the whole trip. For 𝛹 =9.3𝑘𝐽/𝑚, the vehicle receives more energy, on average, than it
uses in motorway driving and the final SOC for these conditions
is around 10% more than the initial SOC.
Fig. 9. Long-haul SOC of HGV38 for various levels of MECR
Both overhead catenary systems and IPT devices could be
exploited to deliver 9.3kJ/m or alternatively 140kW3.
Many of the practical challenges of overhead catenary
systems are well understood, but there are still some technical
and operational issues that would need to be resolved:
(i) The catenary system would not be suitable for cars – so
the infrastructure and operating costs would have to be borne
by the freight industry alone;
(ii) High voltage wires carried above the roadway might
pose a significant threat to safety, in the event of a collision
between a vehicle and a roadside support pole.
(iii) Maintenance of exposed wiring located above the
carriageway would be challenging.
IPTs would eliminate all the above-mentioned issues but they
have their own drawbacks when compared with overhead
catenary systems:
(i) No IPT device with a power transfer rating over 50kW
is commercially available. This is significantly lower than the
required power transfer rating for the road freight transport
application. Even with 100% coverage of the road surface, a
power of 140kW is needed, which is approximately three times

ISJ-RE-16-05163.R2 9
higher than any existing device. However, it would be possible
to have multiple pick-up devices underneath each truck, each of
which could receive power from a single transmitter. So if 3 or
4 receivers could be fitted under each tractor unit, the
transmitters would each need to deliver 46kW or 35kW
respectively, which is reasonable, and thought to be achievable.
(ii) Installation of the charging devices would require
digging-up much of the existing motorway network – at least in
the ‘slow lane’, where HGVs mostly travel.
(iii) The installation would have to be durable, long lasting
and not cause excessive surface roughness. This would not be
straightforward for asphalt pavements, which are prone to crack
around devices mounted in the surface.
(iv) There may be human health issues associated with the
high magnetic fields generated by the charging system.
Research is needed to ensure that the human exposure is
maintained within acceptable, safe limits.
(v) Ideally, heavy good vehicles, light good vehicles, and
passenger cars would be able to use the same IPT infrastructure.
This would improve the prospect of a privately financed system
for distributing the large amounts of energy involved. The
business case for this needs clarification.
2) Driving on Local Roads
This section considers the energy used by the heavy goods
vehicle driving on the local roads at the ends of each motorway
segment. The driving cycle is assumed to be a combination of
two consecutive UDDS driving profile shown in Fig. 5b. The
long-haul vehicle (HGV38) is assumed to exit the motorway
with 100% SOC, travel up to 5.5 miles to the delivery point
under battery power and return to the motorway. As shown in
Fig. 10, this can be achieved with a safety margin of 36% SOC.
Once the vehicle re-enters the motorway, the CoM
infrastructure will recharge the on-board battery during the
subsequent highway driving. Optionally, the vehicle could be
partially re-charged during the delivery process, using fixed IPT
devices located appropriately at each loading bay in the
destination centre.
Battery
Capacity (kWh) 86
Energy Requested
(kWh) 55
Equivalent fuel
economy (mpg) 5.8
Final SOC (%) 36 Energy Received
(kWh) 0
Aver. consum.
(kWh/mile) 4.9
Fig. 10. Output of a simulation for HGV38 travelling on local roads for long-
haul operations (a) Requested speed of vehicle (b) State of charge history
This case study has shown that shifting towards
electrification of long-haul deliveries is not an unreasonable
proposal, provided the logistics infrastructure could be changed
to the configuration shown in Fig. 3. This kind of operation
could be undertaken by purely electric HGVs with 85kWh of
on-board batteries – which is a practical size.
Using the ‘Advisor’ model the fuel economy of a 38 tonnes
diesel-powered lorry was calculated to be 6.5 miles per US
gallon when travelling the overall long-haul delivery trip
(including driving both on trunk and local roads). About
10.2kgCO2 are produced from burning a gallon of diesel fuel
[52]. As a result, a conventional 38 tonne vehicle emits around
1.6kgCO2/mile. The HGV38 model consumes an average of
4kWh/mile on the same combined drive cycle on trunk and
local roads for the long-haul delivery trip. Using the carbon
intensity of the UK electricity supply network in 2016 of
approximately 400gCO2/kWh [14], this corresponds to
approximately 1.6kgCO2/mile – similar to that of the diesel
vehicle. However, using DECC’s projected CO2 intensity of 90-
130gCO2/kWh [14] for the significantly decarbonised UK
electricity grid in 2030, the CO2 emissions of the 38 tonnes
vehicle would be only 360-520gCO2/mile. This corresponds to
a very significant reduction of 68-78%. Using DECC’s
projected CO2 intensity of 30-50gCO2/kWh in 2040, reduction
of 88-93% CO2 emissions is feasible. This highlights the fact
that variations of CO2 intensity of the grid with time are a
second order effect compared to the average. TABLE 7 shows
an overview of the Long Haul delivery case study.
TABLE 7
LONG HAUL CASE STUDY OVERVIEW
Solution
Driving on trunk network: CoM at 9.3kJ/m MECR
Possible power delivery systems: Both Overhead Catenary Systems and IPT
Driving on local roads: Energy provided by the 85kWh on-board battery
gCO2/mile
Diesel 2016 EFV 2030 EFV 2040
Min Max Min Max
1600 360 520 120 200
CO2 reduction based on 2016 levels (%)
EFV 2030 EFV 2040
Min Max Ave Min Max Ave 68 78 73 88 93 91
B. Urban delivery
Under the logistics scenarios shown in Fig. 3, urban delivery
vehicles would transport goods between LDCs and UCCs, on
the edge of cities to convenience stores and urban shops.
HGV10 is assumed to be the backbone of such urban deliveries.
A typical journey is assumed to have two delivery points on an
18 mile round-trip, driven on major regional and urban roads.
The assumed driving cycle is illustrated in Fig. 11a. It consists
of a combination of a rural driving cycle (CSC in Fig. 5a),
followed by an urban driving cycle (UDDS in Fig. 5b) and then
a repeat of the rural driving cycle. The vehicle is assumed to
have the components shown in TABLE 1, with a 75kW electric
motor, 42kWh battery, 4kW constant on-board load (e.g.
refrigerator), and 10 tonnes overall mass.
The results of the simulation are illustrated in Fig. 11. It is
apparent that this urban delivery journey could be undertaken
by an entirely electric 10 tonnes heavy good vehicle equipped
with a 42kWh battery. The vehicle would commence its journey
with 100% SOC and return to the starting point after the 18 mile
round trip with 24% SOC.
Another option is that the vehicles could be charged en-route,
in order to maintain continuous operation. Taking advantage of
the fact that such urban deliveries could probably take place on

ISJ-RE-16-05163.R2 10
pre-determined routes with known delivery points, a ‘charge-
on-the-stop’ approach could be used, whereby the EFVs would
charge statically at the delivery points.
The MECR level Ψ needed to balance out the energy
consumed by the vehicle is 𝛹 = 4.3𝑘𝐽/𝑚. Over the 18 mile
journey, this would correspond to an accumulated energy of
about 125MJ (35kWh). Assuming that a static charging station
is located at the main distribution centre and at the two delivery
points, the three charging stations would each need to deliver
around 12kWh of energy to the vehicle’s battery in order to
maintain 100% SOC. This could be achieved using 50kW
chargers, running for 15min on average while the vehicle is
stopped during each loading and unloading process. This
appears to be reasonably practical and would allow consecutive
urban deliveries.
Battery
Capacity (kWh) 42
Energy Requested
(kWh) 35
Equivalent fuel
economy (mpg) 16.5
Final SOC (%) 24 Energy Received
(kWh) 0
Aver. consumption
(kWh/mile) 1.7
Fig. 11. Results of Urban delivery journey for HGV10 (a) Requested speed of
vehicle (b) State of charge history
The average CO2 emissions of a conventional ten tonnes
diesel vehicle is around 680gCO2/mile based on the computed
equivalent fuel economy of 16.5mpg. The average energy of
HGV10 is 1.7kWh/mile on this drive cycle (Fig. 11a).
Assuming 400gCO2/kWh for the electricity grid (2016 levels)
[14], this corresponds to 680g CO2/mile – again, similar to the
conventional diesel. Assuming a decarbonized grid with 90-
130gCO2/kWh (2030 levels) [14], the impact would be 153-
221gCO2/mile (not too different to a good mid-size car in
2016). Again this corresponds to at about 68-78% reduction of
CO2 emissions in comparison with urban operations by
conventional vehicles. Similarly, reduction of 88-93% CO2
emissions by 2040 is feasible. TABLE 8 shows an overview of
the Urban Delivery case study. The CO2 reduction data follows
the same pattern as the previous case study (lower part of
TABLE 7). TABLE 8
URBAN DELIVERY CASE STUDY OVERVIEW
Solution
Charge-on-the-stop at delivery points 15 minutes charging boost at 50kW power transfer
gCO2/mile
Diesel 2016 EFV 2030 EFV 2040
Min Max Min Max
680 153 221 51 85
C. Home delivery
The prospects for electrification of home delivery are
discussed in this part of the paper. Under the assumed logistics
system in Fig. 3, home delivery operations would transport
goods from LDCs and city-edge supermarkets to consumers.
Light good vehicles up to 3.5 tonnes are mostly used for this
task today. The electric versions of today’s delivery vans
(‘LGV’) are assumed to be equipped with a 75kW electric
motor, 27kWh battery, and a 2kW refrigerator, as stated in
TABLE 1. A typical home delivery journey might have 10
delivery points on urban roads, as it is shown in Fig. 12a. The
assumed driving profile is a combination of a rural driving cycle
(Fig. 4b) followed by ten consecutive urban delivery cycles
(Fig. 4a), completed with another rural driving cycle.
The results of the simulation are illustrated in Fig. 12. The
vehicle leaves the depot with 100% SOC and returns back with
a safety margin of 26% SOC after consuming 20kWh of energy.
This means that an hour charging boost, using a 20kW charging
station (or 30mins at 40kW) during the loading process at the
LDC would be sufficient to fully charge the battery before each
delivery trip.
Battery
Capacity (kWh) 27
Energy Requested
(kWh) 20
Equivalent fuel
economy (mpg) 43
Final SOC (%) 26 Energy Received
(kWh) 0
Aver. consumption
(kWh/mile) 0.6
Fig. 12. Results of Home delivery journey for LGV (a) Requested speed of
vehicle (b) State of charge history
Using the calculated average energy consumption of
0.6kWh/mile (Fig. 12), and the same assumptions as before for
the carbon content of the electricity grid, this would correspond
to 240gCO2/mile in 2016 and 54-78gCO2/mile in 2030 and 18-
30gCO2/mile in 2040, based on [14]. Again this corresponds to
a reduction of at 68-78% by 2030 and 88-93% by 2040
compared to today’s conventional diesel van which was
calculated to emit 240gCO2/mile for the same drive cycle. The
CO2 reduction data follows the same pattern as the previous
case studies. TABLE 9 shows an overview of the Home
Delivery case study. The CO2 reduction data follows the same
pattern as the previous case studies.
TABLE 9
HOME DELIVERY CASE STUDY OVERVIEW
Solution
Charge-on-the-stop at LDC
30 minutes charging boost at 40kW power transfer
gCO2/mile
Diesel 2016 EFV 2030 EFV 2040
Min Max Min Max 240 54 78 18 30
D. Refuse collection
For the final case study, we explore the possibility of shifting
to electric refuse collection vehicles (ERCVs). Refuse
collection vehicles need power for the bin-lifters, refuse
compaction, for lighting indicators, and various other systems
on board. Furthermore, an ERCV with an overall mass around
27 tonnes (8 tonnes unladed mass plus 19 tonnes carrying

ISJ-RE-16-05163.R2 11
capacity) has to undertake many rapid accelerations and
decelerations using energy from the battery on board, but,
ideally, also benefitting from regenerative braking technology.
A typical refuse collection driving profile is illustrated in Fig.
13a. The driving profile is based on the ‘William H. Martin
Refuse Hauler Drive Cycle’ provided by ‘Advisor’ but the cycle
was modified to increase the number of stops to approximately
62 within 6.5 miles in a 1.7 hours shift. The drive cycle includes
driving from the depot to the collection area and back to the
origin. The vehicle under investigation is equipped with a
147kW electric motor, a 32kWh battery and it has 27 tonnes
overall mass, which is the fully-loaded mass to provide a worst
case scenario. Furthermore, the vehicle has 2kW constant load
for on-board equipment including load for the bin lifting and
compaction system.
The results of the simulation are illustrated in Fig. 13. The
vehicle leaves the depot with 100% SOC and returns back with
a safety margin of 20% SOC after consuming 25kWh of energy.
This means that a 30min charging boost, using a 50kW charging
station during the un-loading process would be sufficient to
fully charge the battery before each refuse collection trip.
However, effective functionality of the charging stations might
be compromised by the harsh environment of the refuse
collection sites. To this end, wireless IPT charging devices
could be distributed at key locations along the route. In
particular, 10 ‘top-up’ charging points at 50kW each would be
sufficient to maintain continuous operation of ERCVs provided
the vehicle is stationary for about 3min for charging during bin
lifting or compaction procedures.
Battery
Capacity (kWh) 32
Energy Requested
(kWh) 25
Equivalent fuel
economy (mpg) 6.2
Final SOC (%) 20 Energy Received
(kWh) 0
Aver. consumption
(kWh/mile) 4.0
Fig. 13. Results of Refuse Collection trip (a) Requested speed of vehicle (b)
State of charge history
The average CO2 emissions of a conventional 27 tonnes
diesel vehicle is around 1.65kgCO2/mile based on the computed
equivalent fuel economy of 6.2mpg. The average energy of
ERCV is 4.0kWh/mile on this drive cycle (Fig. 13a). Assuming
400gCO2/kWh for the electricity grid (2016 levels), this
corresponds to 1.6kgCO2/mile – again, similar to the
conventional diesel. Assuming a decarbonized grid with 90-
130gCO2/kWh in 2030 levels), the impact would be 360-
520gCO2/mile. Again this corresponds to 69-75% reduction of
CO2 emissions in comparison with refuse collection functions
by conventional vehicles. Similarly, reduction of 88-93% CO2
emissions is feasible using the DECC’s projected figures for
2040 levels. TABLE 10 shows an overview of the Home
Delivery case study. The CO2 reduction data follows the same
pattern as the previous case studies.
TABLE 10
REFUSE COLLECTION CASE STUDY OVERVIEW
Solution
A) Charge-on-the-stop at depot 30 minutes charging boost at 50kW power transfer
B) 10 ‘top-up’ charging points along the route 3 minutes charging boost at 50kW power transfer
gCO2/mile
Diesel 2016 EFV 2030 EFV 2040
Min Max Min Max 1600 360 520 120 200
V. CONCLUSIONS
(i) It has been shown in the paper that deep decarbonisation
of the national road freight system by electrification is feasible.
It would require installation of a backbone charge-on-the-move
network on the nation’s motorways. This could be achieved
with either overhead cables or Inductive Power Transfer.
(ii) A logistics concept was proposed that, in conjunction
with current and likely future electrification technologies, could
provide a framework for the electrification of most road freight
operations. The proposed logistics concept is divided into four
‘operations’ which are the ‘long-haul trunking’, ‘urban
delivery’, ‘home delivery’, and other ‘auxiliary services’ such
as refuse collection functions within the area of municipalities.
Different vehicles and charging mechanisms were suggested for
each of these operations.
(iii) Three vehicle models were developed using an
advanced vehicle simulator including electric Light Good
Vehicles (LGVs), electric Heavy Good Vehicles up to 10
tonnes (HGV10), and electric Heavy Good Vehicles up to 38
tonnes gross mass (HGV38). The power requirement of each
vehicle model was calculated over appropriate driving cycles.
The outcomes were then combined with GB traffic data in order
to set the baseline of the required power demand across GB. It
was shown that an additional electrical load of 9.4GW would
be added on the power demand during the peak hours of
commuting due to the electrification of road freight
transportation.
(iv) A charging simulation tool was developed to investigate
the application of dynamic charging. The tool shows how
various CoM layouts affect the SOC and the mileage range of
the vehicle under investigation. The performance of the
charging system was quantified by the ‘Mean Effective
Charging Rate’.
(v) Four case studies were developed for assessing the
feasibility of electrification of road freight. It was shown that
the shifting towards electric freight vehicles appears to be
technically and financially feasible since large and expensive
on-board batteries are not required. Significant reduction of
73% CO2 emissions in average when compared with
conventional freight vehicles could be achieved by 2030 for all
case studies examined. Even higher reduction of 91% CO2
emissions by 2040 is feasible provided the current projections
for decarbonisation of the electricity grid are achieved.
REFERENCES
[1] DECC, “UK Greenhouse Gas Emissions,” Department of Energy & Climate Change, 2013.

ISJ-RE-16-05163.R2 12
[2] DfT, “Carbon Pathways analysis: Informing Development of a Carbon
Reduction Strategy for the Transport Sector,” Department for Transport, 2008.
[3] A. M. C. Odhams, R. L. Roebuck, Y. J. Lee, S. W. Hunt, and D. Cebon,
“Factors influencing the energy consumption of road freight transport,” Proc. Inst. Mech. Eng. Part C J. Mech. Eng. Sci., vol. 224, no. 9, pp. 1995–
2010, Sep. 2010.
[4] P. Greening, M. Piecyk, A. Palmer, and A. McKinnon, “An assessment of the potential for demand-side fuel savings in the Heavy Goods Vehicle
(HGV) sector,” Centre for Sustainable Road Freight Technical Report,
2015. [5] D. W. Keith and A. E. Farrell, “Rethinking Hydrogen Cars,” Science.,
vol. 301, no. 5631, pp. 315–316, 2003.
[6] M. Ball and M. Wietschel, “The future of hydrogen - opportunities and challenges,” Int. J. Hydrogen Energy, vol. 34, no. 2, pp. 615–627, 2009.
[7] U. Bossel, “Does a Hydrogen Economy Make Sense?,” Proc. IEEE, vol.
94, no. 10, pp. 1826–1837, Oct. 2006. [8] O. Sandru, “Why Hydrogen Cars are Less Efficient than Electrics,” The
Green Optimistic, 2015. [Online]. Available:
http://www.greenoptimistic.com/hydrogen-cars-efficiency/#.V_-e7eArJpg.
[9] European Union, “Directive 2009/28/EC of the European Parliamanet and
of the Council,” 2009. [10] W. J. Midgley and D. Cebon, “Evaluation of a fuel-efficient urban
delivery vehicle,” Proc. Inst. Mech. Eng. Part D J. Automob. Eng., Feb.
2017. [11] W. J. Midgley and D. Cebon, “Comparison of regenerative braking
technologies for heavy goods vehicles in urban environments,” Proc. Inst. Mech. Eng. Part D J. Automob. Eng., vol. 226, no. 7, pp. 957–970, Mar.
2012.
[12] W. Midgley, H. Cathcart, and D. Cebon, “Modelling of hydraulic regenerative braking systems for heavy vehicles,” Proc. Inst. Mech. Eng.
Part D J. Automob. Eng., vol. 227, no. 7, pp. 1072–1084, Jan. 2013.
[13] M. Bruning and W. Schonewolf, “Freight transport system for urban shipment and delivery,” in 2011 IEEE Forum on Integrated and
Sustainable Transportation Systems, 2011, pp. 136–140.
[14] DECC, “Updated energy and emissions projections,” Department of Energy & Climate Change, 2015.
[15] ARUP, “Regent Street delivery and servicing reduction scheme,” 2015.
[Online]. Available:
http://www.arup.com/projects/regent_street_delivery_and_servicing_red
uction_scheme.
[16] UPS, “Sustainability Report,” 2015. [17] AustriaTech, “Electric Fleets in Urban Logistics,” 2014.
[18] S. Beggs, S. Cardell, and J. Hausman, “Assessing the potential demand
for electric cars,” J. Econom., vol. 17, no. 1, pp. 1–19, Sep. 1981. [19] J. Reed, “Buyers loath to pay more for electric cars,” Financial Times,
2010. [Online]. Available: http://www.ft.com/cms/s/0/acc0a646-c405-
11df-b827-00144feab49a.html#axzz4GmVVbS5T. [20] H. Sylvia, H. Omar, C. Thierry, and V. M. Joeri, “Social acceptance of
wireless battery charging systems: Belgium case study,” in 2014 IEEE
International Electric Vehicle Conference (IEVC), 2014, pp. 1–6. [21] S. J. Gerssen-Gondelach and A. P. C. Faaij, “Performance of batteries for
electric vehicles on short and longer term,” J. Power Sources, vol. 212,
pp. 111–129, Aug. 2012. [22] V. Etacheri, R. Marom, R. Elazari, G. Salitra, and D. Aurbach,
“Challenges in the development of advanced Li-ion batteries: a review,”
Energy Environ. Sci., vol. 4, no. 9, p. 3243, Aug. 2011.
[23] T. M. Fisher, K. B. Farley, Y. Gao, H. Bai, and Z. T. H. Tse, “Electric
vehicle wireless charging technology: a state-of-the-art review of
magnetic coupling systems,” Wirel. Power Transf., pp. 1–10, Sep. 2014. [24] A. W. Kelley and W. R. Owens, “Connectorless power supply for an
aircraft-passenger entertainment system,” IEEE Trans. Power Electron.,
vol. 4, no. 3, pp. 348–354, Jul. 1989. [25] B. J. Heeres, D. W. Novotny, D. M. Divan, and R. D. Lorenz, “Contactless
underwater power delivery,” in Proceedings of 1994 Power Electronics
Specialist Conference - PESC’94, 1994, pp. 418–423. [26] Jia Junlin, Liu Weigang, and Wang Haiqun, “Contactless power delivery
system for the underground flat transit of mining,” vol. 1. pp. 282–284
vol.1, 2003. [27] B. Maisuria, “Inductive power transfer platform with smart pickup,” New
Zealand, 2011.
[28] J. M. Barnard, J. A. Ferreira, and J. D. van Wyk, “Sliding transformers for linear contactless power delivery,” IEEE Trans. Ind. Electron., vol. 44,
no. 6, pp. 774–779, 1997.
[29] J. Boys and A. Green, “Intelligent road-studs-lighting the paths of the
future,” in IPENZ Annual Conference: Engineering, providing the foundations for society, 1996.
[30] D. Nicolaides and J. Miles, “Wireless Electric Charge-On-The-Move: An
Economic Appraisal of the Potential for the UK Transport Application,” in International Conference on Transportation and Civil Engineering,
2015, pp. 53–59.
[31] D. Nicolaides, R. McMahon, D. Cebon, and J. Miles, “A national power infrastructure for Charge-on-the-Move,” in IEEE PELS Workshop on
Emerging Technologies: Wireless Power, 2016, pp. 180–185.
[32] D. Nicolaides and J. Miles, “Wireless Electric Charge-on-the-move: A sustainability appraisal of the potential for the UK transport application,”
J. Multidiscip. Eng. Sci. Technol., vol. 2, no. 8, pp. 2238–2246, 2015.
[33] M. Budhia, J. T. Boys, G. A. Covic, and C.-Y. Huang, “Development of a Single-Sided Flux Magnetic Coupler for Electric Vehicle IPT Charging
Systems,” IEEE Trans. Ind. Electron., vol. 60, no. 1, pp. 318–328, Jan.
2013. [34] H. H. Wu, A. Gilchrist, K. D. Sealy, and D. Bronson, “A High Efficiency
5 kW Inductive Charger for EVs Using Dual Side Control,” IEEE Trans.
Ind. Informatics, vol. 8, no. 3, pp. 585–595, Aug. 2012. [35] P. Ning, J. M. Miller, O. C. Onar, and C. P. White, “A compact wireless
charging system for electric vehicles,” in 2013 IEEE Energy Conversion
Congress and Exposition, 2013, pp. 3629–3634. [36] D. Naberezhnykh, N. Reed, F. Ognissanto, T. Theodoropoulos, and H.
Bludszuweit, “Operational requirements for dynamic wireless power
transfer systems for electric vehicles,” in 2014 IEEE International Electric Vehicle Conference (IEVC), 2014, pp. 1–8.
[37] X. Zhang, Z. Yuan, Q. Yang, Y. Li, J. Zhu, and Y. Li, “Coil Design and Efficiency Analysis for Dynamic Wireless Charging System for Electric
Vehicles,” IEEE Trans. Magn., vol. 52, no. 7, pp. 1–4, Jul. 2016.
[38] N. Omar, M. A. Monem, Y. Firouz, J. Salminen, J. Smekens, O. Hegazy, H. Gaulous, G. Mulder, P. Van den Bossche, T. Coosemans, and J. Van
Mierlo, “Lithium iron phosphate based battery – Assessment of the aging
parameters and development of cycle life model,” Appl. Energy, vol. 113, pp. 1575–1585, Jan. 2014.
[39] Milton Keynes Council, “Electric Bus,” 2012. [Online]. Available:
https://www.milton-keynes.gov.uk/streets-transport-and-parking/bus-travel/bus-projects/electric-bus.
[40] H. G. Grunjes and M. Birkner, “Electro mobility for heavy duty vehicles
(HDV): The Siemens eHighway System,” in 12th International
Symposium on Heavy Vehicle Transportation Technology, 2012.
[41] A. Brooker, K. Haraldsson, T. Hendricks, V. Johnson, K. Kenneth, B.
Kramer, T. Markel, M. O’Keefe, S. Sprik, K. Wipke, and M. Zolot, “ADVISOR Advanced Vehicle Simulator,” NREL, 2013. [Online].
Available: http://adv-vehicle-sim.sourceforge.net/.
[42] R. D. Senger, “Validation of ADVISOR as a Simulation Tool for a Series Hybrid Electric Vehicle Using the Virginia Tech FutureCar Lumina,”
Virginia Tech, 1997.
[43] K. B. Wipke, M. R. Cuddy, and S. D. Burch, “ADVISOR 2.1: a user-friendly advanced powertrain simulation using a combined
backward/forward approach,” IEEE Trans. Veh. Technol., vol. 48, no. 6,
pp. 1751–1761, 1999. [44] T. Barlow, S. Latham, I. McCrae, and P. Boulter, “A reference book of
driving cycles for use in the measurement of road vehicle emissions,”
2009. [45] Department for Transport, “Traffic counts,” 2014. [Online]. Available:
http://www.dft.gov.uk/traffic-counts/index.php.
[46] Department for Transport, “Average annual daily flow and temporal
traffic distributions,” 2015.
[47] Royal Academy of Engineering, “GB electricity capacity margin,” 2013.
[48] G. Ault, D. Frame, N. Hughes, and N. Strachan, “Electricity Network Scenarios for Great Britain in 2050,” 2008.
[49] ENSG, “Our Electricity Transmission Network: A vision for 2020,” 2012.
[50] UK Power Networks, “Business plan (2015 to 2023),” 2012. [51] Northwest Electricity, “Strategic Direction Statement,” 2013.
[52] EIA, “How much carbon dioxide is produced by burning gasoline and
diesel fuel?,” 2016. [Online]. Available: http://www.eia.gov/tools/faqs/faq.cfm?id=307&t=11.
[53] C. Botsford and A. Szczepanek, “Fast Charging vs. Slow charging: Pros
and cons for the New Age of Electric Vehicles,” in International Battery, Hybrid and Fuel Cell Electric Vehicle Symposium, 2009.
[54] Department for Transport, “Guidance on Road Classification and the
Primary Route network,” 2012.
Top Related