


Languages
Pages
Legal


Project 2第四組 TitanicMachine Learning from Disaster
楊恆軒陳道明杜彥陵徐嘉澤12.05.2019 Intelligent Integration of Enterprise

OUTLINE
Introduction
Methodology
Random Forest: Feature Selection
Neural Network with Keras
Result & Conclusion
2

Introduction 1

Competition on Kaggle
4
LOREM IPSUM
Titanic: Machine Learning from DisasterThis is the legendary Titanic ML competition –
the best, first challenge for you to dive into ML competitions and familiarize yourself with how the Kaggle platform works.
On April 15, 1912, during her maiden voyage, the widely considered “unsinkable” RMS Titanic sank after colliding with an iceberg.
Unfortunately, there weren’t enough lifeboats for everyone onboard, resulting in the death of 1502 out of 2224 passengers and crew.
While there was some element of luck involved in surviving, it seemssome groups of people were more likely to survive than others.
In this challenge, we ask you to build a predictive model that answers the question: “what sorts of people were more likely to survive?”using passenger data (ie name, age, gender, socio-economic class, etc). "Untergang der Titanic", as conceived by Willy Stöwer, 1912

The datasetKaggle提供的資料集
5
Train.csv Test.csv
› 891筆乘客資料
› 包含每位乘客的生死結果
› 本次project僅使用train.csv進行驗證
› 418筆乘客資料
› 僅提供乘客的資訊,無生死結果
› Kaggle比賽上傳使用
891筆 418筆
Model score is the percentage of passengers correctly predict,that is known as accuracy.

VariablesTrain.csv的變數
6
欄位變數 定義 值或特性
PassengerId 乘客ID編號train.csv有891位test.csv有418位共1,309位乘客
Survived 是否生還 0 (no) / 1 (yes)Pclass 船艙等級 1 (1st) / 2 (2nd) / 3 (3rd)Name 姓名 包含其稱謂Sex 性別 male / femaleAge 年齡 浮點數SibSp 在船上的兄弟姊妹和配偶人數 整數Parch 在船上家族的父母及小孩人數 整數Ticket 船票編號 文字Fare 船票價格 浮點數Cabin 船艙號碼 文字
Embarked 登船口岸C (Cherbourg) /Q (Queenstown) /S (Southampton)

5W1H
7
WHO: Jack & Rose WHAT
WHY WHERE: somewhere in the sea
WHEN: 1912/04/15 HOW

Method 2

Random Forest
9
LOREM IPSUM
隨機森林:多個決策樹的分類器
Bagging:「每次抽取n個樣本,
抽後放回,總共抽m次。」
每次用n個樣本建構best gain決策樹,
再對m棵決策樹進行多數決投票。
多產生幾棵樹,降低整個森林的variance,能有較高的穩定性和準確性,
避免overfitting發生。 https://www.youtube.com/watch?v=goPiwckWE9M
本次project所使用的演算法 (1/2)

Package usedRandom Forest 所使用的 python 套件
10
Numpy高階維度陣列與矩陣運算
Pandas數據分析的data frame架構
Matplotlib使用其Seaborn進階圖表繪製功能
Scikit-learn提供許多機器學習的基本演算法

Neural Network
11
LOREM IPSUM
https://databricks.com/glossary/neural-network
本次project所使用的演算法 (2/2)
類神經網路:輸入-隱藏-輸出
我們選擇多層感知器(MLP)作為訓練的架構
執行的環境為:Tensorflow 1.x on Colab

Random Forest: Feature Selection 3

Variable overview
13
大部分的男性都死亡(僅18.9%存活);女性則有將近四分之三(74.2%)生還。
Sex Survived
0 female 0.742
1 male 0.189
‘Sex’ vs. ‘Survived’
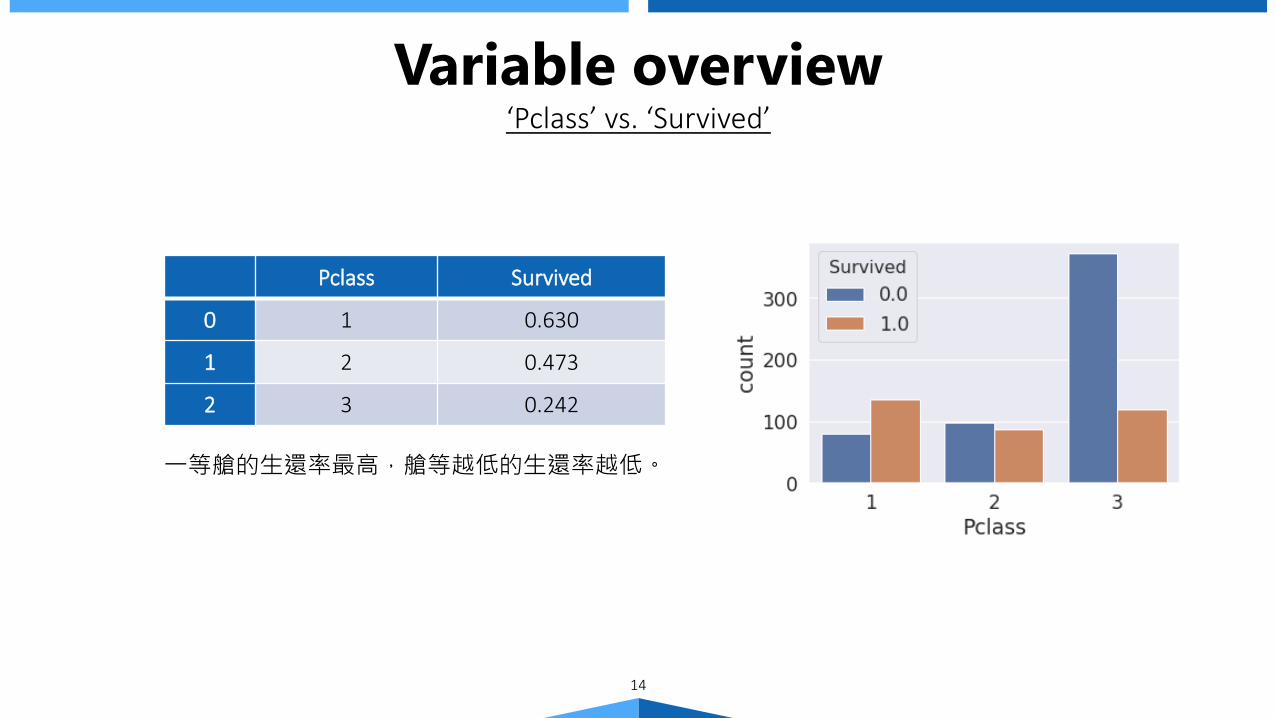
Pclass Survived
0 1 0.630
1 2 0.473
2 3 0.242
Variable overview
14
一等艙的生還率最高,艙等越低的生還率越低。
‘Pclass’ vs. ‘Survived’

RF訓練未使用到的data作為衡量模型的資料(OOB)
Data Preprocessing資料前處理
15
將male轉為 0將 female轉為 1
預測是否生還(Y)用其他欄位當作X
‘Sex’ encoding
0 ; 1
‘train.csv’ define ‘Y’
Survivedtrain / test

Base Model
16
OOBAccuracy
0.73176
Random ForestX[ sex_code, Pclass, … ], Y
random_state = 2n_estimators = 250
min_samples_split = 20oob_score = True
原始模型的表現

票價資料前處理
17
處理方法
票價數據特色
票價和艙等都是屬於彰顯乘客社會地位的一個特徵,我們主觀可以判斷買票價格較高的乘客,由於沈船資訊早就被接收到,故他們的生存機率也較高。
票價分布非常廣及傾斜 票價數據中有遺失值

18
票價分布非常廣及傾斜 票價數據中有遺失值
› 解決傾斜的問題
› 取log後之作圖可更加美觀
› 取票價中位數置換遺失值
票價資料前處理
19
票價資料前處理取log

20
票價資料前處理置換遺失值
票價資料前處理
21
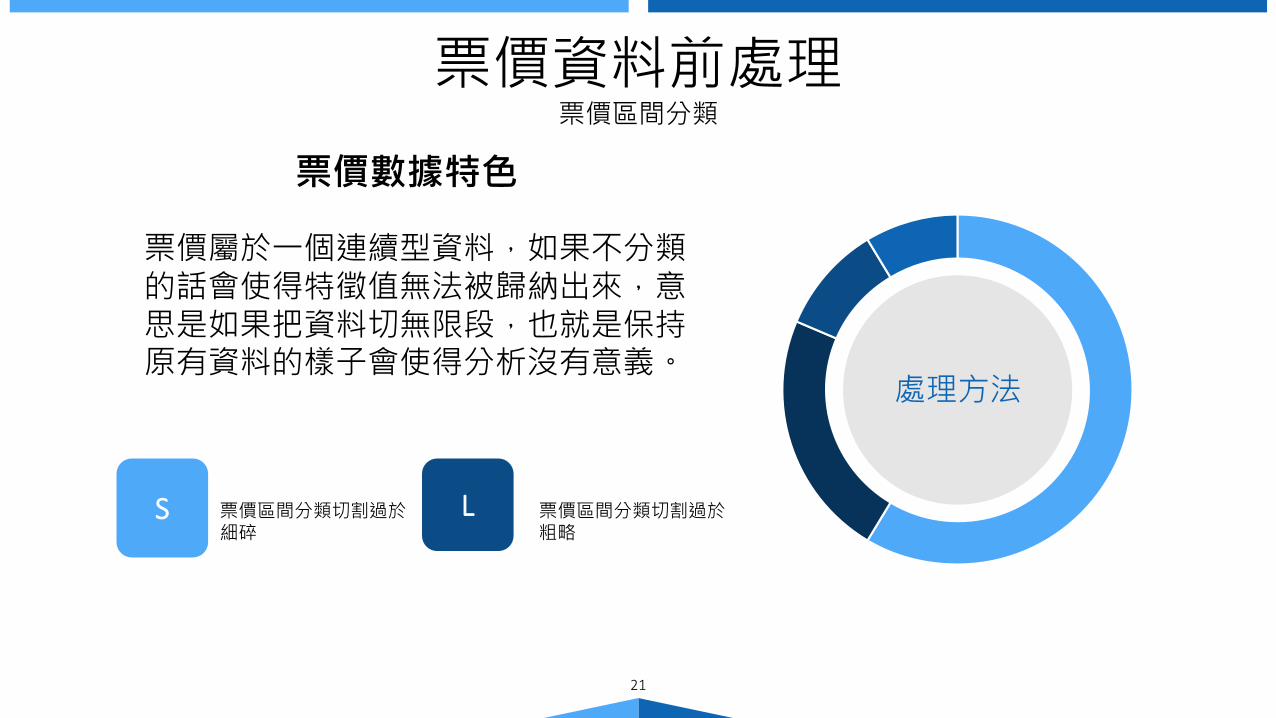
處理方法
票價數據特色
票價屬於一個連續型資料,如果不分類的話會使得特徵值無法被歸納出來,意思是如果把資料切無限段,也就是保持原有資料的樣子會使得分析沒有意義。
S L票價區間分類切割過於細碎
票價區間分類切割過於粗略
票價區間分類

22
太多
太少
一點點票價的不同,都影響了生存率的高低,如此一來很明顯地會overfitting,並且,切分區間趨近於無限大時,就回到了原本的數值特徵
區間內的資料太多一起平均,這樣沒有辦法看出差異性,使得特徵失真
FareSplit
票價資料前處理票價區間分類
區間切分數

23
票價資料前處理尋找最佳區間分類
24
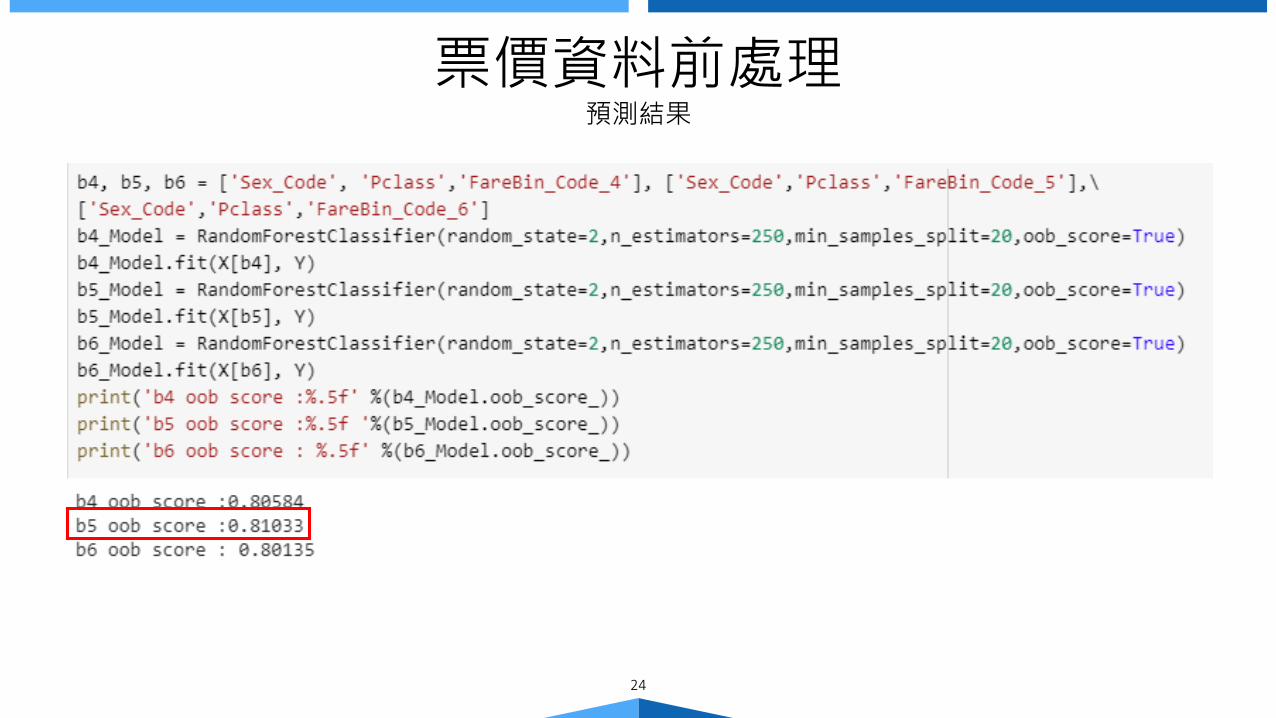
票價資料前處理預測結果

Fare Model
25
OOBAccuracy
0.81033
Random ForestX[ FareBin_Code_5, … ], Y
random_state = 2n_estimators = 250
min_samples_split = 20oob_score = True
票價模型的表現

連結前處理
26
連結特色
再發生意外時,家人朋友常常互相幫助,雖然資料上的兄弟姊妹數(SibSp)和父母小孩數(Parch)它們與一個人是否存活沒有直接關係,但是通過和票根(Ticket)比對,可以發現他是否獨自在這艘船上,而這對於他的生存機率也有很大的
影響。 處理方法
父母小孩數資訊
票根資訊
兄弟姊妹數資訊

27
連結前處理票根的特徵(Ticket)
建立一個新的特徵家庭人數特徵(Family_size)

28
連結前處理建立持有相同票根的DataFrame,並顯示姓名、票價、艙位、家庭人數

29
連結前處理依照觀察來創建一個新的特徵(Connected_Survival)
Connect Model
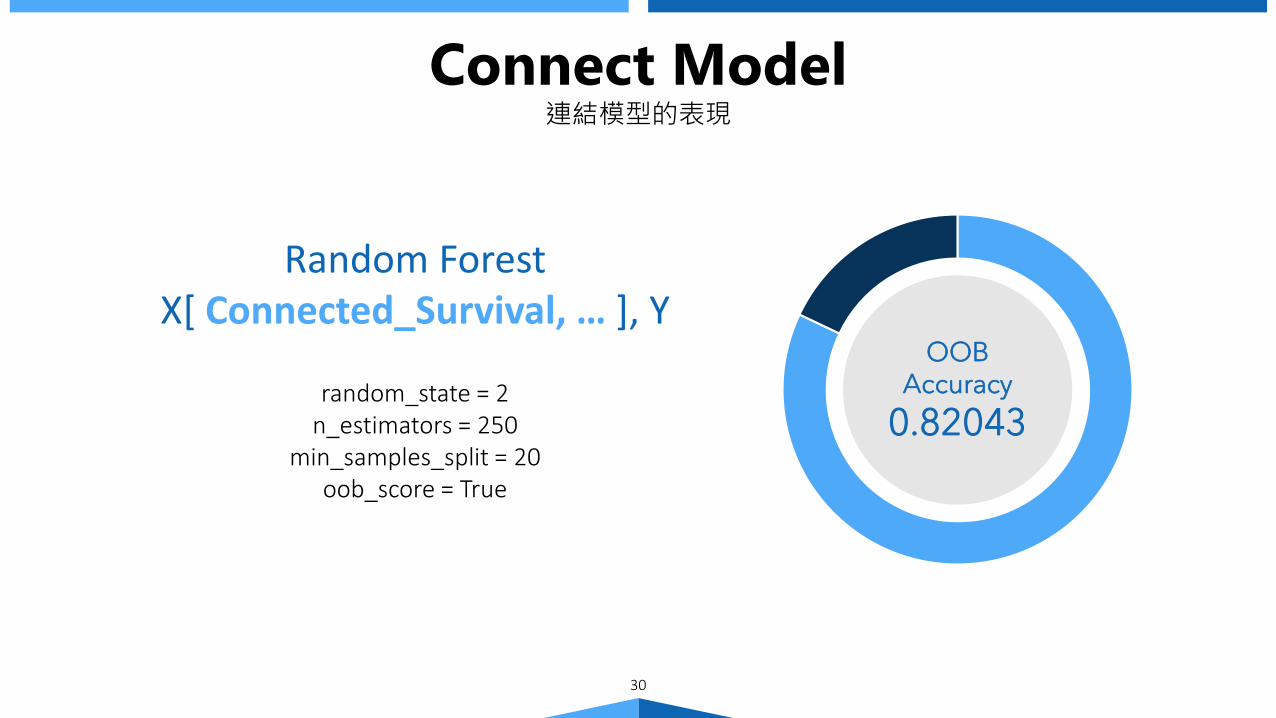
30
OOBAccuracy
0.82043
Random ForestX[ Connected_Survival, … ], Y
random_state = 2n_estimators = 250
min_samples_split = 20oob_score = True
連結模型的表現

年齡資料分析
31
處理方法
年齡數據特色
由於年齡的缺失值較多,又因為準確率受性別及艙等的影響,所以若年齡缺失值在兩大特徵中的分布不一,可能會影響到後續的預測,故分別與艙等及性別做分析。
年齡與艙等交叉分析 年齡與性別交叉分析

32
年齡資料分析年齡與艙等之交叉分析 年齡與性別之交叉分析
年齡缺失值大部分在3等艙 年齡缺失值性別比 男:女=21.9%:16.7%

33
年齡資料分析1、2艙之中,年齡對存活與否的影響
大約<16歲的部分生存率較高大約>16歲的部分對年齡來說不是一個顯著的特徵大約70~80歲的部分不列入採計
將資料分為<16歲及>16歲的2元特徵<16歲為1;>16歲為0
34
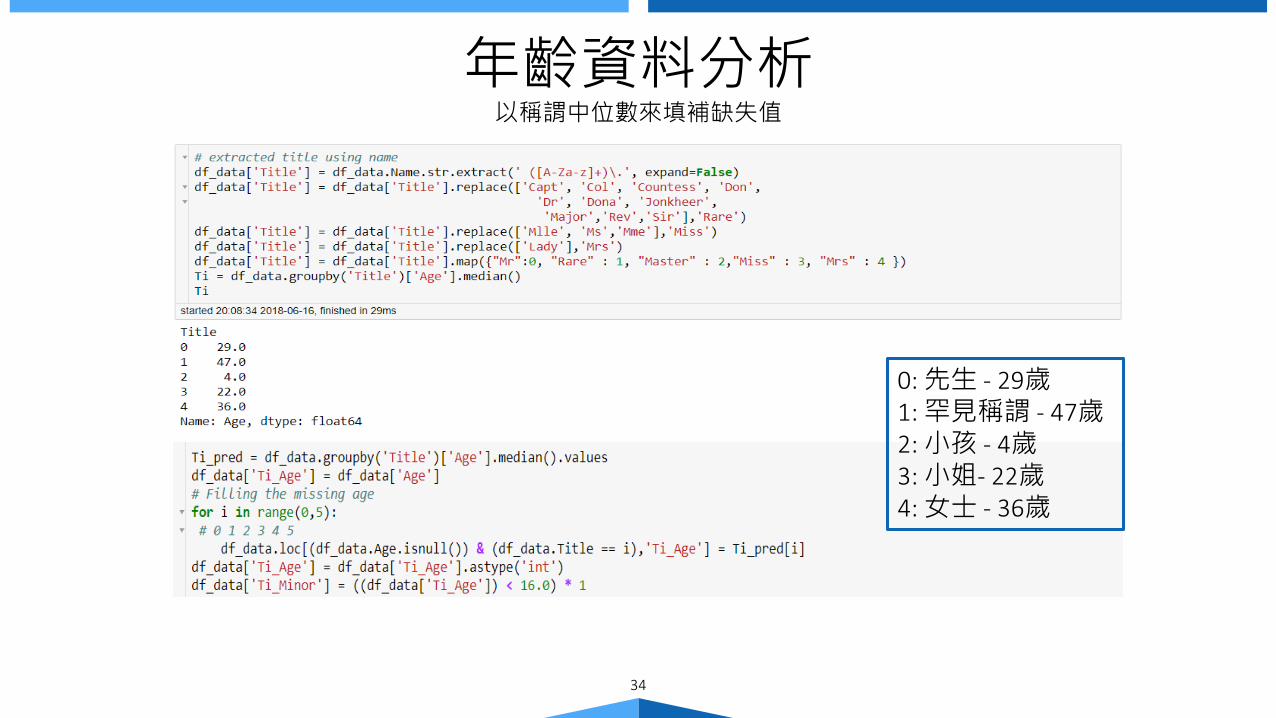
年齡資料分析以稱謂中位數來填補缺失值
0: 先生 - 29歲1: 罕見稱謂 - 47歲2: 小孩 - 4歲3: 小姐- 22歲4: 女士 - 36歲

Age Model
35
OOBAccuracy
0.84175
Random ForestX[ Ti_Minor, … ], Y
random_state = 2n_estimators = 250
min_samples_split = 20oob_score = True
年齡模型的表現

RF Performance
36
0.73176
0.810330.82043
0.84175
0.66
0.68
0.7
0.72
0.74
0.76
0.78
0.8
0.82
0.84
0.86
Base Fare Connect Age
準確率
加入特徵
以 accuracy作為指標
依序考量了票價、連結、年齡,經過處理後的特徵值,皆使model的準確率提高。
我們也曾考慮,將家庭人數(family_size)當作一個特徵,但實際測試後模型表現並未顯著提升。
由Random Forest,我們找出了五個有效Features:Sex_Code, Pclass, FareBin_Code_5,
Connected_Survival, Ti_Minor
隨機森林的模型表現

Neural Networkwith Keras 4

Neural Network Model類神經網路的架構
38
Layer Output Activation Function
Dense_1 9 ReLU
Dense_2 9 ReLU
Dense_3 5 ReLU
Dense_4 1 Sigmoid
Optimizeradam
Loss functionbinary_crossentropy
Metricsaccuracy
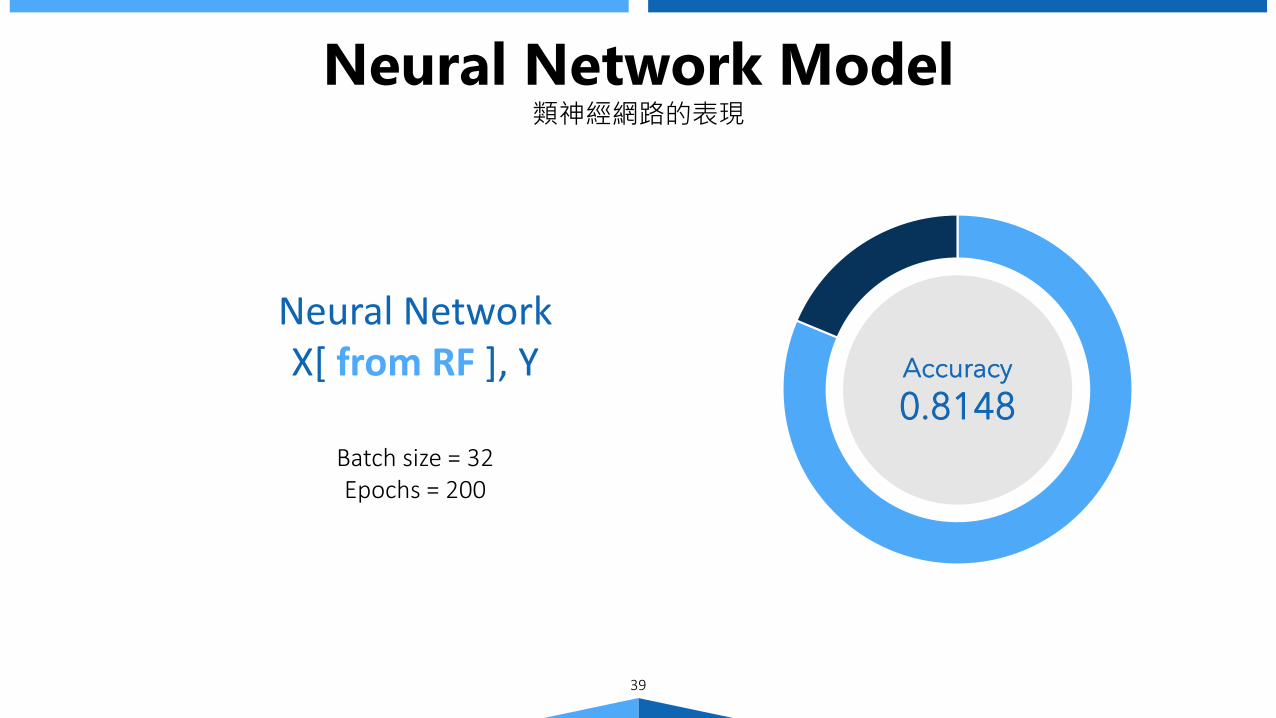
Neural Network Model
39
Accuracy
0.8148
Neural NetworkX[ from RF ], Y
Batch size = 32Epochs = 200
類神經網路的表現

Result &Conclusion 5

41
Random Forest Neural Network
› Machine Learning 方法
› 特徵值、結果易解釋
› 在Titanic資料集表現良好
› Deep Learning 方法
› 無法得知運算及決策過程
› 未發揮其大資料集分析優勢
84.18 % 81.48 %
Titanic 的資料集,較適合使用 RF 作為分析工具。
ComparisonRandom Forest vs. Neural Network

Future Works
42
Hyperparameter tuning
Other algorithm (e.g. XGBoost)
Other application

References
Titanic: Machine Learning from Disaster ∣ Kagglehttps://www.kaggle.com/c/titanic
[機器學習專案] Kaggle競賽-鐵達尼號生存預測(Top 3%) https://medium.com/@yulongtsai/https-medium-com-yulongtsai-titanic-top3-8e64741cc11f
Neural Network with Keras for Kaggle's Titanic Datasethttps://github.com/liyenhsu/Neural-Network-with-Keras-for-Kaggle-Titanic-Dataset/blob/master/titanic.ipynb
43
THANK YOU