


Languages
Pages
Legal


Productivity Management-Highlighting the Key Principles
Carolinas Rehabilitation Network SummitNovember 6, 2014
2
A little productivity humor for your day…
3
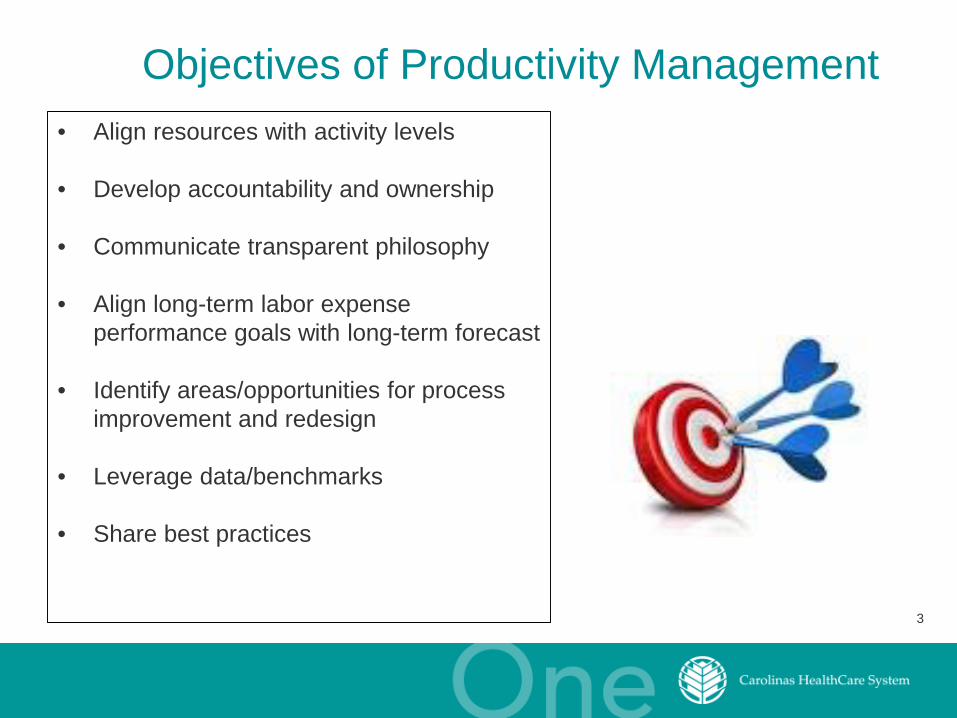
Objectives of Productivity Management • Align resources with activity levels
• Develop accountability and ownership
• Communicate transparent philosophy
• Align long-term labor expense performance goals with long-term forecast
• Identify areas/opportunities for process improvement and redesign
• Leverage data/benchmarks
• Share best practices
4
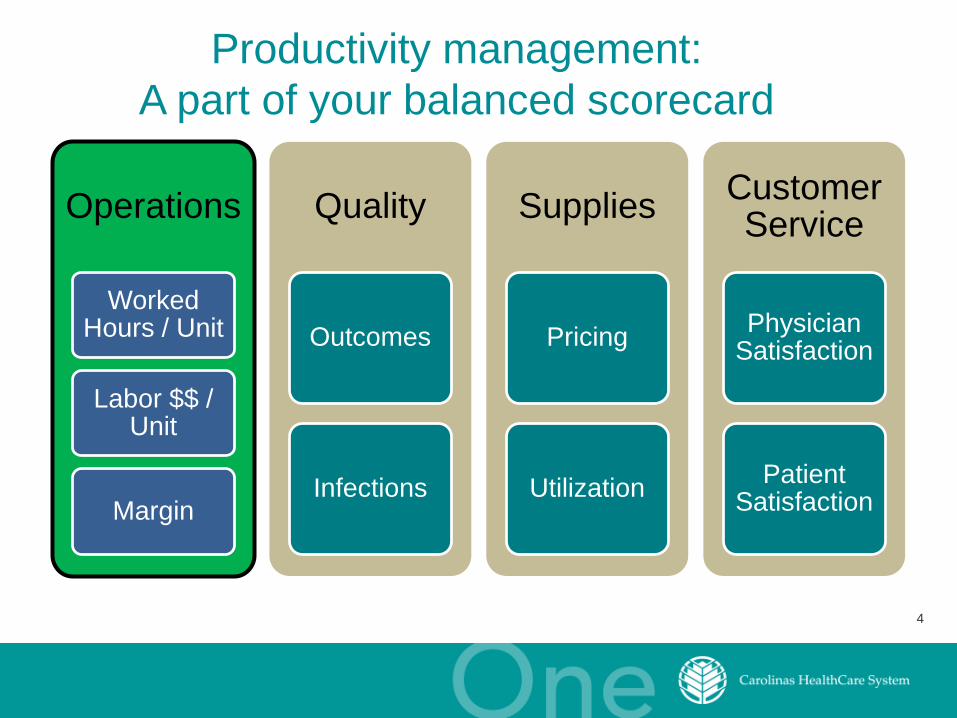
Productivity management: A part of your balanced scorecard
Operations
Worked Hours / Unit
Labor $$ / Unit
Margin
Quality
Outcomes
Infections
Supplies
Pricing
Utilization
Customer Service
Physician Satisfaction
Patient Satisfaction
5
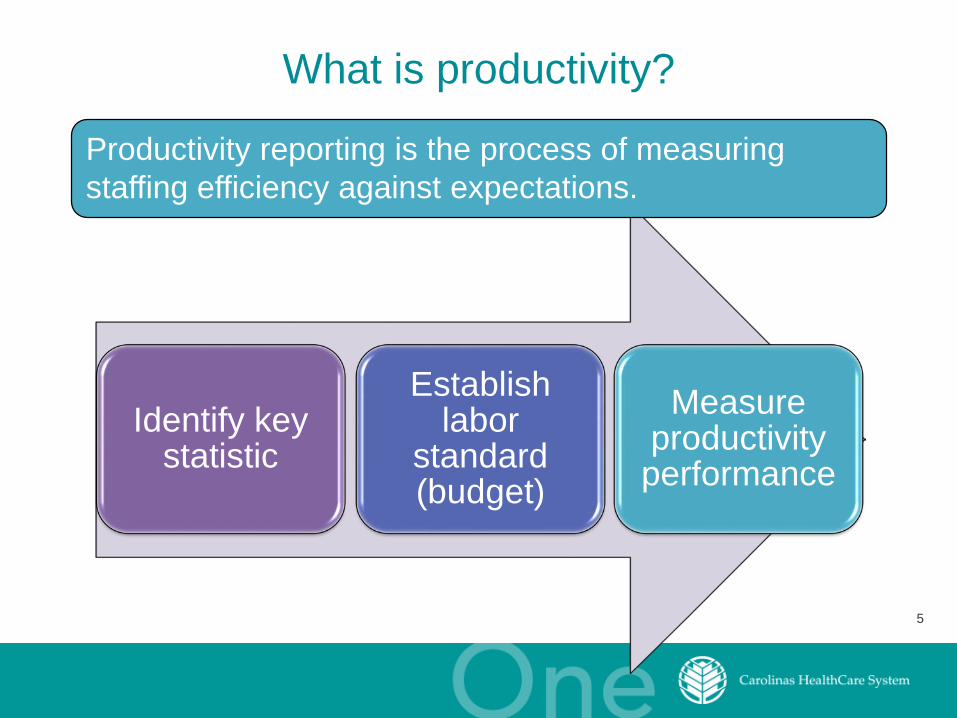
What is productivity?
Identify key statistic
Establish labor
standard (budget)
Measure productivity performance
Productivity reporting is the process of measuring staffing efficiency against expectations.

6
Concepts of productivity
• Productivity
– A ratio of output to input, compared to expectation
– A concept you use everyday
• Examples
– Favorable productivity: Planned to mow the yard in one hour, but
did it in 45 minutes
– Unfavorable productivity: Planned to conduct 100 diagnostic tests
in 160 staff-hours, but used 185 staff-hours
7
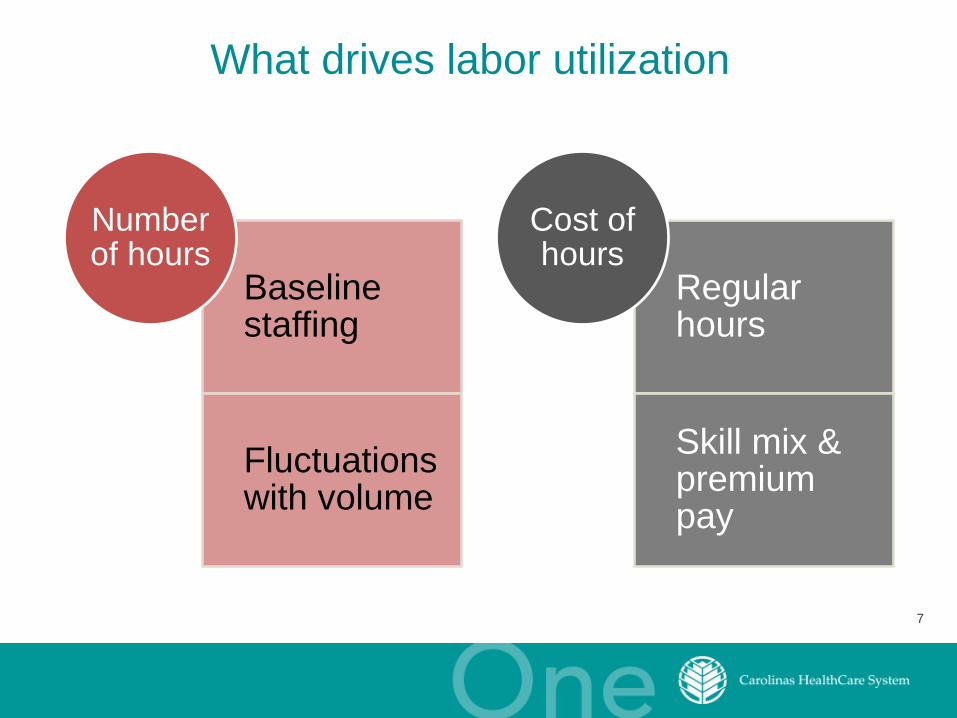
What drives labor utilization
Baseline staffing
Fluctuations with volume
Number of hours
Regular hours
Skill mix & premium pay
Cost of hours
8
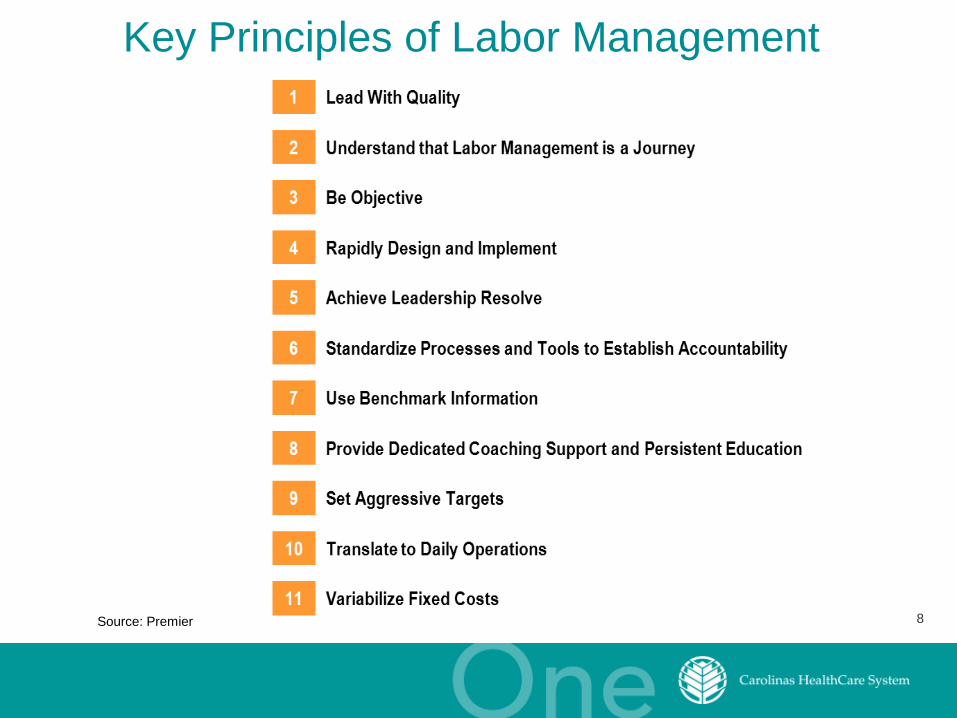
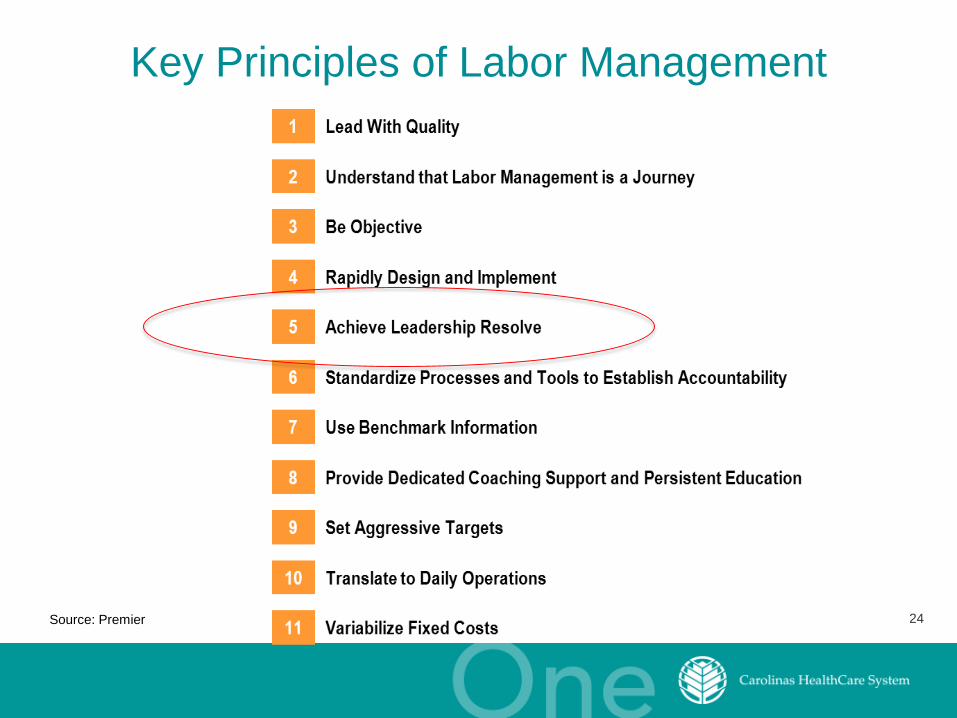
Key Principles of Labor Management
Source: Premier

9
Key Principles of Labor Management
Source: Premier

10
A Fundamental Shift in Approach1
Productivity targets set with considerable departmental input
Isolated, episodic cost-cutting campaigns
Limited external benchmarking when setting targets
Goals calibrated to average performance
Responsibility for proving benchmark relevance falls to finance
High-performing units required to maintain performance
Traditional Approach Productivity targets more
prescriptive, leadership-driven
Permanent focus on transformational cost reduction
Goals based on external data comparisons
Targets moving toward top quartile performance
Burden on unit to demonstrate that goals require adjustment
Strong units expected to continue to improve performance
Emerging Approach
1- The Advisory Board Company

11
Managing Change
Cris
is-D
riven
Cha
nge
Feel-Good Change
Ove
rrea
ctio
n an
d ba
d de
cisi
on
Changes with little or no real impact
Vision of the future integrated with current
reality through collaboration and self-
determination1
1- E.C. Murphy, LLC

12
Paradigm Shift
The one caterpillar says to the other caterpillar:“You’ll never get me up in one of those butterfly things…”

13
Key Principles of Labor Management
Source: Premier

14
Benchmarking and Productivity: Two Separate, Distinct processes
Source: Premier

15
• Peer Groups• Key Indicators• Comparative Database
Comparing the level of efficiency to peers with “like” operations
Organization Info• Volumes• Expenses• Worked Hours
ComparativeMappings
At What Level Should the Organization Perform?Top Quartile Performance• More aggressive target• Comparison to the top 25th
percentile performance of the Peer Group
Median Performance• Least aggressive target• Comparison to the 50th percentile
(median) performance of the Peer Group
Top Third Performance• Moderate target• Comparison to the 33rd
percentile performance of the Peer Group
Benchmarking 101
Source: Premier15
16
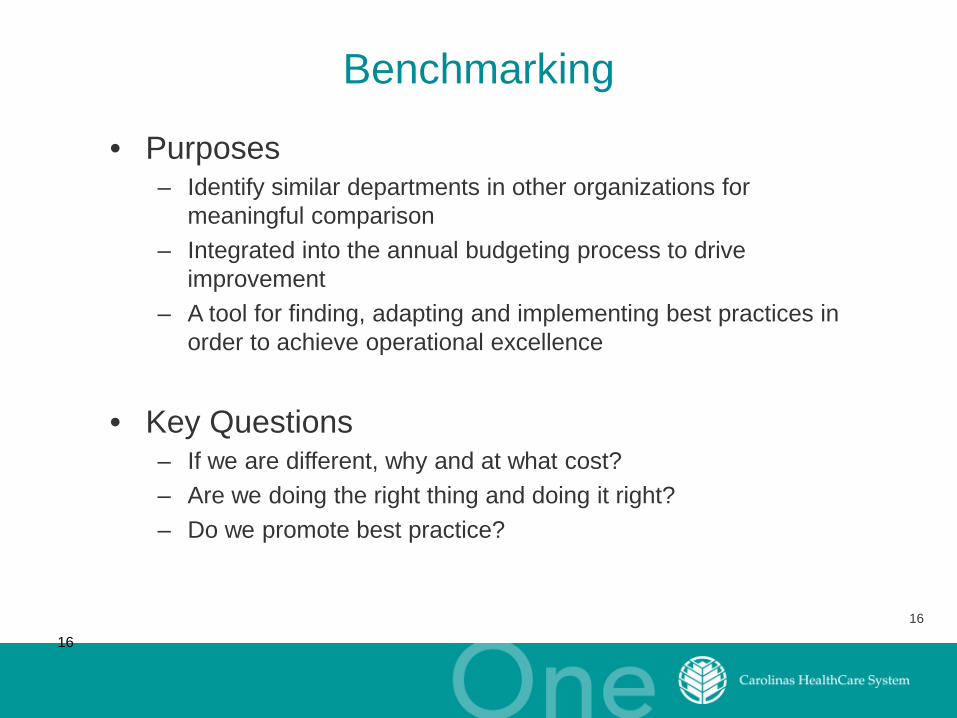
Benchmarking
• Purposes– Identify similar departments in other organizations for
meaningful comparison – Integrated into the annual budgeting process to drive
improvement– A tool for finding, adapting and implementing best practices in
order to achieve operational excellence
• Key Questions – If we are different, why and at what cost? – Are we doing the right thing and doing it right?– Do we promote best practice?
16
17
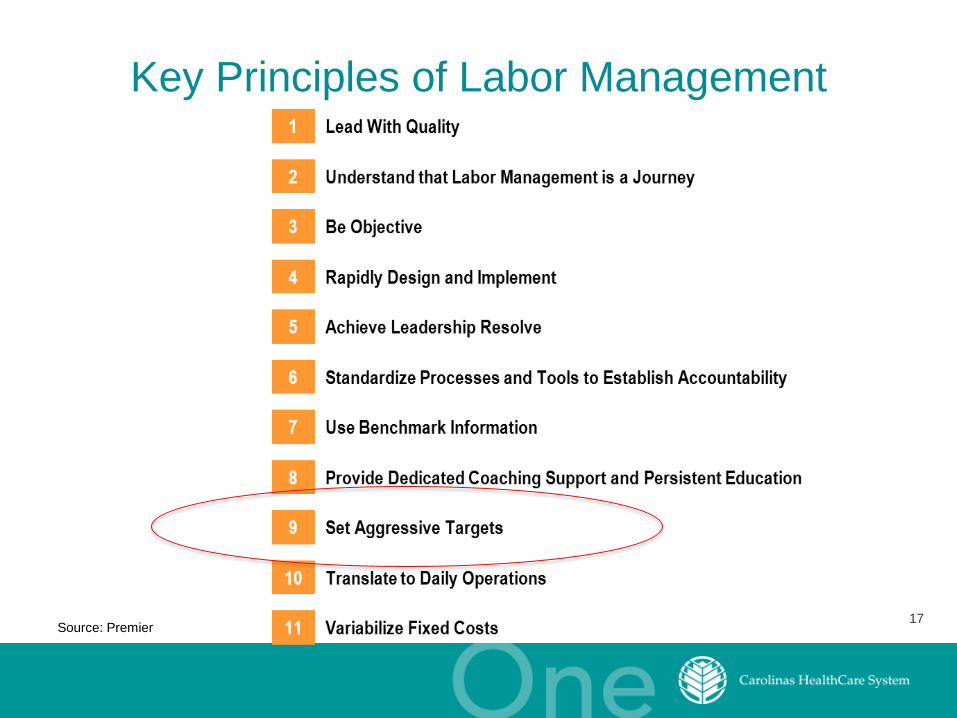
Key Principles of Labor Management
Source: Premier
18
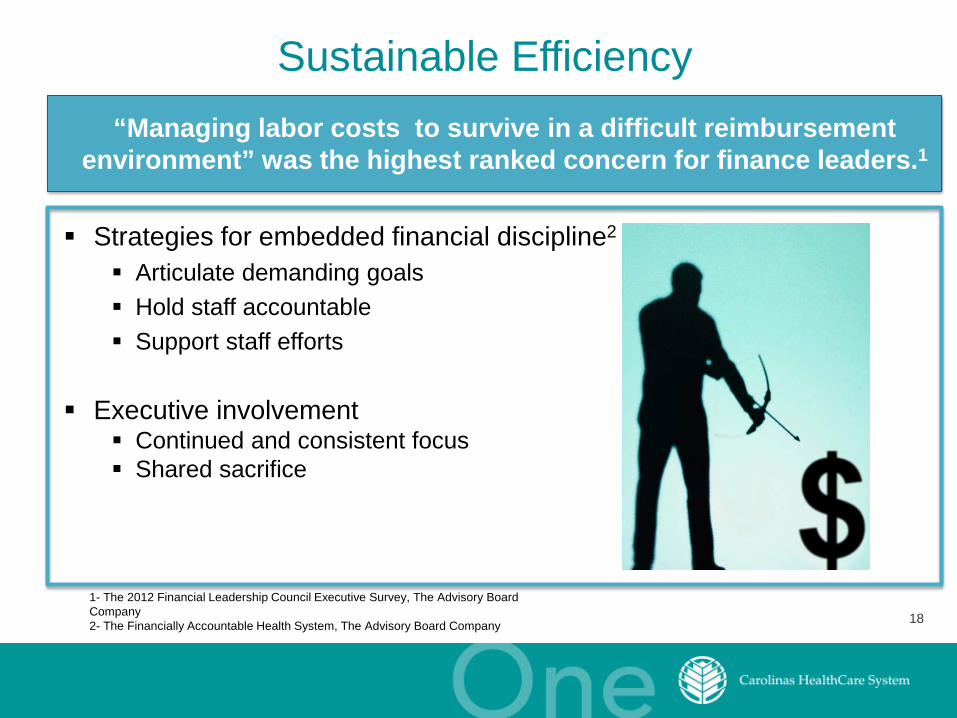
Sustainable Efficiency“Managing labor costs to survive in a difficult reimbursement
environment” was the highest ranked concern for finance leaders.1
Strategies for embedded financial discipline2
Articulate demanding goals Hold staff accountable Support staff efforts
Executive involvement Continued and consistent focus Shared sacrifice
1- The 2012 Financial Leadership Council Executive Survey, The Advisory Board Company2- The Financially Accountable Health System, The Advisory Board Company
19
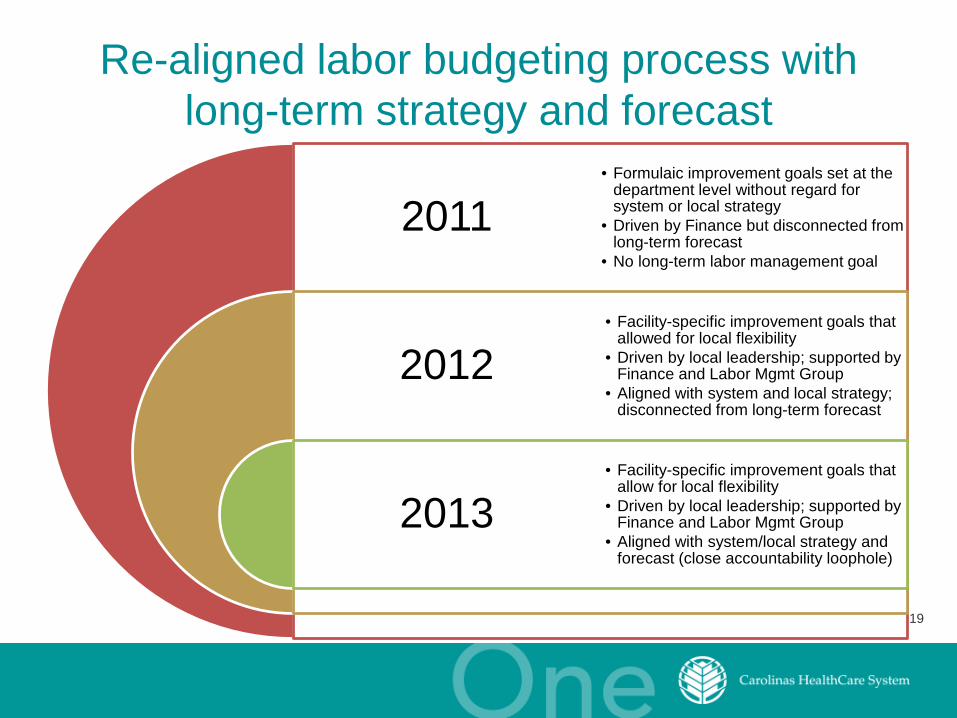
Re-aligned labor budgeting process with long-term strategy and forecast
2011
2012
2013
• Formulaic improvement goals set at the department level without regard for system or local strategy
• Driven by Finance but disconnected from long-term forecast
• No long-term labor management goal
• Facility-specific improvement goals that allowed for local flexibility
• Driven by local leadership; supported by Finance and Labor Mgmt Group
• Aligned with system and local strategy; disconnected from long-term forecast
• Facility-specific improvement goals that allow for local flexibility
• Driven by local leadership; supported by Finance and Labor Mgmt Group
• Aligned with system/local strategy and forecast (close accountability loophole)

20
Know the goal your shooting towards
21
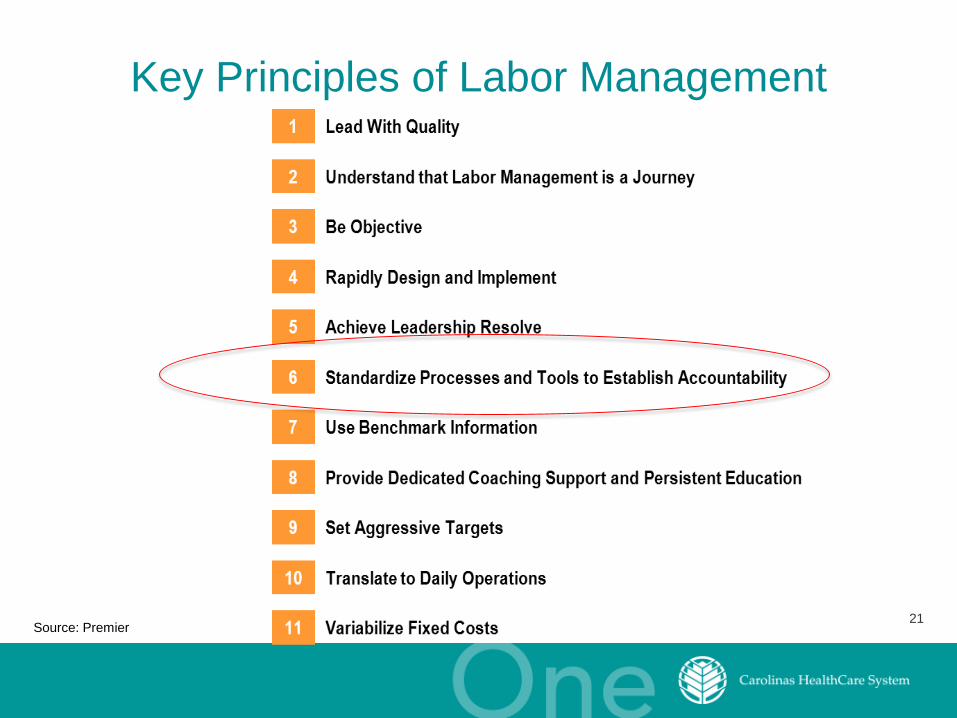
Key Principles of Labor Management
Source: Premier
22
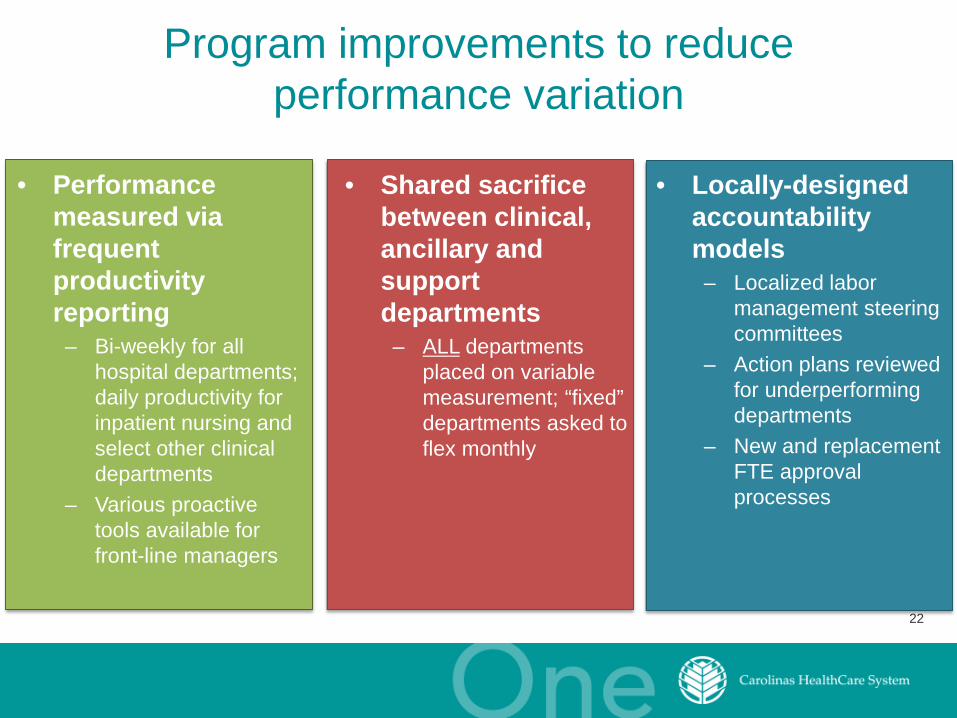
Program improvements to reduce performance variation
• Performance measured via frequent productivity reporting
– Bi-weekly for all hospital departments; daily productivity for inpatient nursing and select other clinical departments
– Various proactive tools available for front-line managers
• Shared sacrifice between clinical, ancillary and support departments
– ALL departments placed on variable measurement; “fixed” departments asked to flex monthly
• Locally-designed accountability models
– Localized labor management steering committees
– Action plans reviewed for underperforming departments
– New and replacement FTE approval processes

23
Established processes reduces variation
24
Key Principles of Labor Management
Source: Premier
25
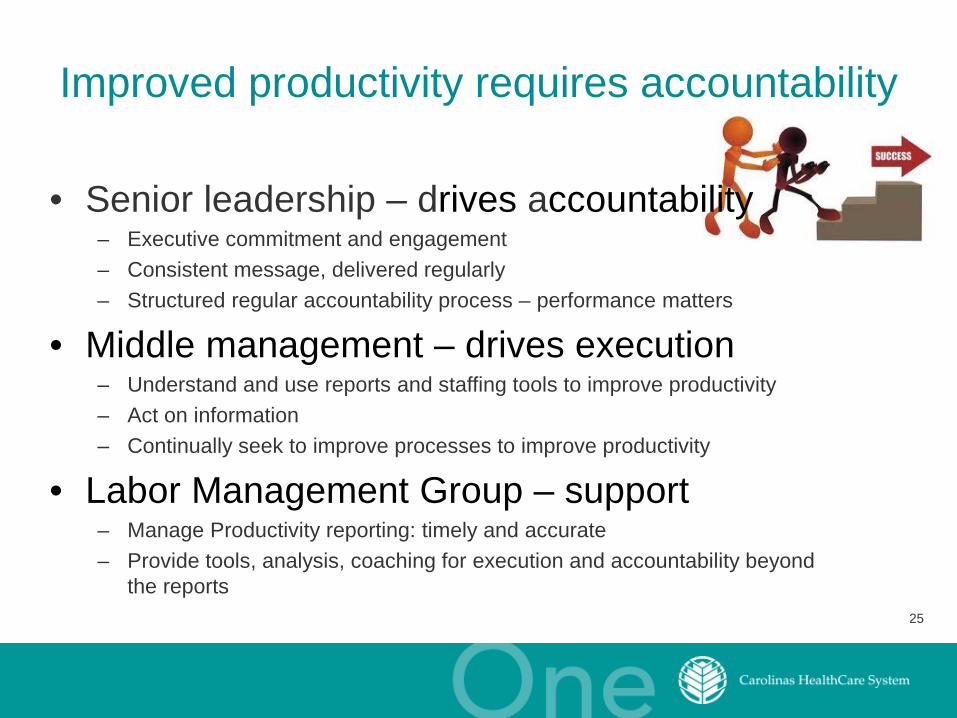
Improved productivity requires accountability
• Senior leadership – drives accountability– Executive commitment and engagement– Consistent message, delivered regularly– Structured regular accountability process – performance matters
• Middle management – drives execution– Understand and use reports and staffing tools to improve productivity– Act on information– Continually seek to improve processes to improve productivity
• Labor Management Group – support– Manage Productivity reporting: timely and accurate– Provide tools, analysis, coaching for execution and accountability beyond
the reports

26
Key Principles of Labor Management
Source: Premier
27
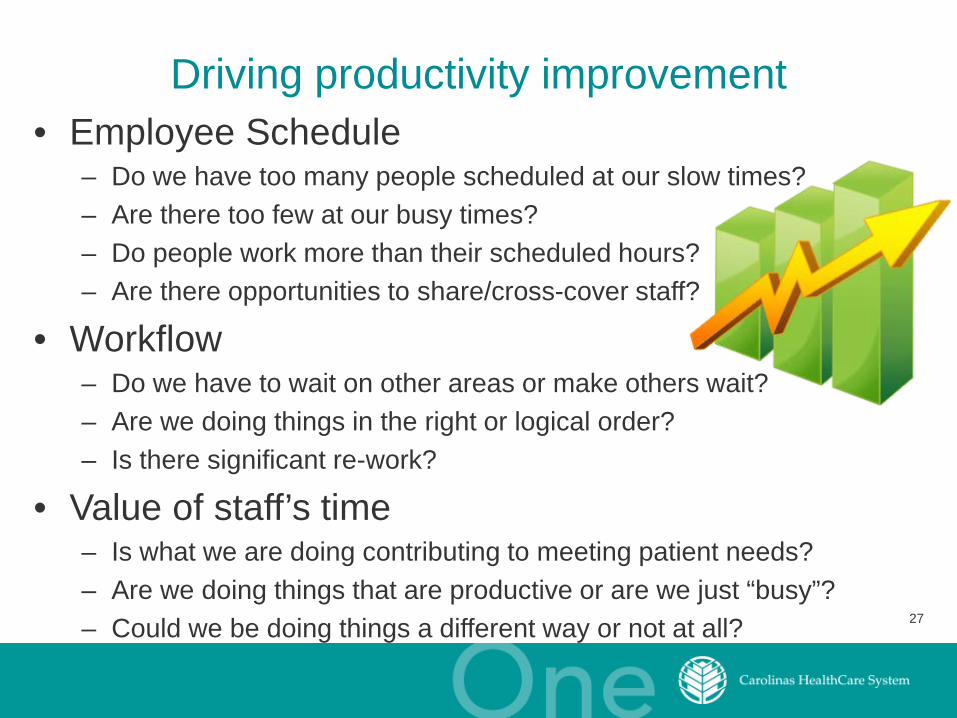
• Employee Schedule– Do we have too many people scheduled at our slow times?– Are there too few at our busy times?– Do people work more than their scheduled hours?– Are there opportunities to share/cross-cover staff?
• Workflow– Do we have to wait on other areas or make others wait?– Are we doing things in the right or logical order?– Is there significant re-work?
• Value of staff’s time– Is what we are doing contributing to meeting patient needs?– Are we doing things that are productive or are we just “busy”?– Could we be doing things a different way or not at all?
Driving productivity improvement

28
Building a daily rhythm
• Utilize daily tools– Daily Productivity Report
• Take the pulse of your department’s volume frequently during the day
• Understand your upstream volume drivers and try to anticipate the ebb and flow of your department’s volume
• Have a well documented plan for flexing to volume and execute that plan when volume dictates
• Educate all teammates of the goal and the plan to achieve success• Monitor consistently to drive change and improve productivity
Our productivity reports are reflections of the decisions that we made.

29
Building a daily rhythm: Daily Tools
Nursing Unit/Department NameCost Center
Target Worked Hours per Unit
Pay Period Ending (mm/dd/yy)
Date Midnight Census
Actual Worked Hours
Target Worked Hours
Variance Actual vs. Target
Actual WHpU
WHpU w/o EDU, Orient, and
SittersEducation Orientation Light Duty Sitters Contract
Hours
Sunday, October 20, 2013 0 0.00 0.00 0.00 Monday, October 21, 2013 0 0.00 0.00 0.00
Tuesday, October 22, 2013 0 0.00 0.00 0.00 Wednesday, October 23, 2013 0 0.00 0.00 0.00
Thursday, October 24, 2013 0 0.00 0.00 0.00 Friday, October 25, 2013 0 0.00 0.00 0.00
Saturday, October 26, 2013 0 0.00 0.00 0.00 Sunday, October 27, 2013 0 0.00 0.00 0.00 Monday, October 28, 2013 0 0.00 0.00 0.00
Tuesday, October 29, 2013 0 0.00 0.00 0.00 Wednesday, October 30, 2013 0 0.00 0.00 0.00
Thursday, October 31, 2013 0 0.00 0.00 0.00 Friday, November 01, 2013 0 0.00 0.00 0.00
Saturday, November 02, 2013 0 0.00 0.00 0.00 Pay Period Total 0 0.00 0.00 0.00 0.00 0.00 0.00 0.00 0.00 0.00
11.39 11.390.00 #DIV/0!
#DIV/0!#DIV/0!#DIV/0!
CMC-NE CVPCPlease fill in the yellow shaded
cells
517400
11.3900
Exclude: any hours charged to other cost centers 11/02/13
Worked Hours Utilized For
Comments / Other Justification for Variance to Target Worked Hours Performance SummaryTarget Worked Hours per UnitActual Worked Hours per Unit
Target Worked FTEActual Worked FTE
FTE Variance (Actual vs. Target)

30
Using the right tools to get the right results
https://www.youtube.com/watch?v=v0pSUOLc81w

31
Greater improvement will require increased education and accountability
Aggressive Targets
Knowledge/ Education Accountability
MEANINGFUL TRANSFORMATION
32
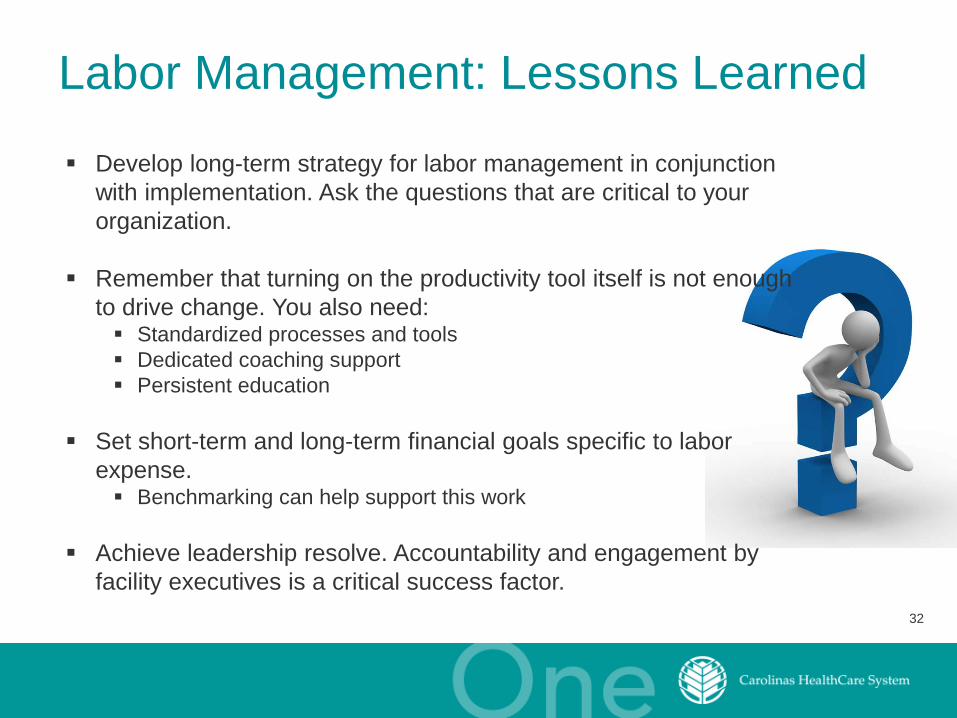
Labor Management: Lessons Learned
Develop long-term strategy for labor management in conjunction with implementation. Ask the questions that are critical to your organization.
Remember that turning on the productivity tool itself is not enough to drive change. You also need: Standardized processes and tools Dedicated coaching support Persistent education
Set short-term and long-term financial goals specific to labor expense. Benchmarking can help support this work
Achieve leadership resolve. Accountability and engagement by facility executives is a critical success factor.
Top Related