


Languages
Pages
Legal

a
Factors leading to Agricultural Production Aggregation and Facilitation of the Linkage of
Farmers to Remunerative Markets
Steve Wiggins, Julia Compton
April 2016
This report has been produced by Overseas Development Institute for Evidence on Demand with the assistance of the UK Department for International Development (DFID) contracted through the Climate, Environment, Infrastructure and Livelihoods Professional Evidence and Applied Knowledge Services (CEIL PEAKS) programme, jointly managed by DAI (which incorporates HTSPE Limited) and IMC Worldwide Limited. The views expressed in the report are entirely those of the author and do not necessarily represent DFID’s own views or policies, or those of Evidence on Demand. Comments and discussion on items related to content and opinion should be addressed to the author, via [email protected] Your feedback helps us ensure the quality and usefulness of all knowledge products. Please email [email protected] and let us know whether or not you have found this material useful; in what ways it has helped build your knowledge base and informed your work; or how it could be improved. DOI: http://dx.doi.org/10.12774/eod_hd.april2016.wigginsetal
First published April 2016 © CROWN COPYRIGHT
Contents Report Summary ........................................................................................................ iii
SECTION 1 ............................................................................................. 1
Background ................................................................................................................ 1
1.1 Questions addressed ............................................................................ 1
1.2 Framework: aggregation as part of marketing ...................................... 1
1.2.1 Functions of agricultural marketing and forms of aggregation .... 1
1.2.2 Changes in agricultural and food supply chains in the developing world .......................................................................................... 3
SECTION 2 ............................................................................................. 5
Method ....................................................................................................................... 5
2.1 Literature search ................................................................................... 5
2.2 Limitations of the evidence ................................................................... 6
2.3 Evidence gaps ...................................................................................... 7
SECTION 3 ............................................................................................. 9
Findings ...................................................................................................................... 9
3.1 Producer organisations (POs) and cooperatives .................................. 9
3.1.1 Prevalence of POs ..................................................................... 9
3.1.2 Potential benefits from POs ..................................................... 10
3.1.3 Potential benefits to smallholders from membership of POs .... 10
3.1.4 Lessons from external support to POs ..................................... 13
3.2 Contract farming ................................................................................. 14
3.2.1 Prevalence of contracting ......................................................... 18
3.2.2 Farmer participation ................................................................. 18
3.2.3 Benefits to contracted farmers ................................................. 18
3.2.4 Assessing contracting .............................................................. 21
SECTION 4 ........................................................................................... 25
Discussion and conclusions ..................................................................................... 25
4.1 Replies to the original questions ......................................................... 25
4.1.1 Who benefits in rural communities? ......................................... 25
4.2 Principles of successful enhanced aggregation .................................. 27
4.2.1 Final reflection: respect informality ........................................... 28
References ............................................................................................................... 29
i
List of Boxes Box 1 Functions of marketing ......................................................................................................... 1 Box 2 Summary of literature searches ........................................................................................... 5 Box 3 Deep procurement. When is a contract not a contract? ................................................. 14 Box 4 Public contracting by marketing boards in Africa ............................................................. 16 List of Tables Table 1 Forms of aggregation for farm produce .......................................................................... iii Table 2 Forms of aggregation for farm produce ........................................................................... 2 Table 3 Evidence on gains from membership of Producer Organisations ................................. 12 Table 4 Outcomes for contracted farmers .................................................................................. 20 List of Annexes Annex A Lessons from USAID projects supporting aggregation from small farmers ................ 35 Annex B What could possibly go wrong? Problems in collective marketing ............................. 36 Annex C Summary of main references consulted ....................................................................... 37
ii
Report Summary
Objectives, background and framing This short report addresses two questions asked in a Helpdesk request of February 2016, as follows:
What business models, contractual arrangements or other forms of support lead to production aggregation, and facilitate the linking of farmers to remunerative markets in developing countries? This might include cooperatives, contract farming or other forms of support to agribusinesses; and, What evidence is there that these business models and arrangements deliver a) improved access to markets? and b) higher incomes?
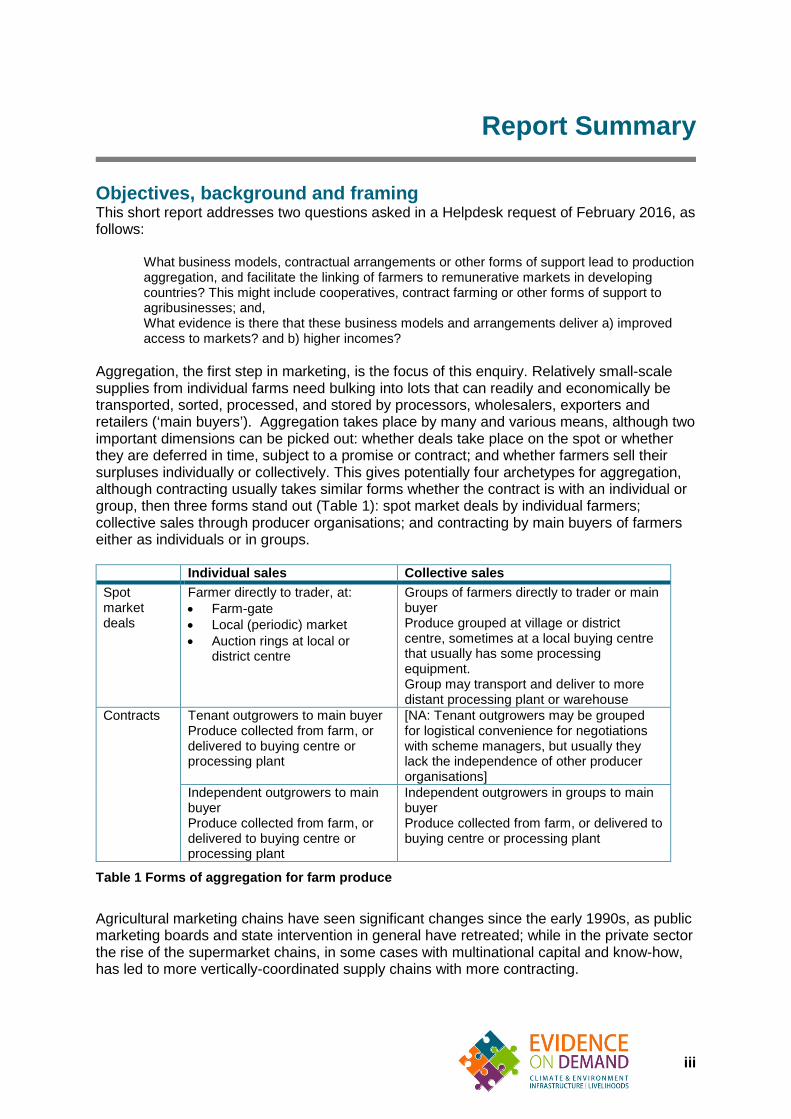
Aggregation, the first step in marketing, is the focus of this enquiry. Relatively small-scale supplies from individual farms need bulking into lots that can readily and economically be transported, sorted, processed, and stored by processors, wholesalers, exporters and retailers (‘main buyers’). Aggregation takes place by many and various means, although two important dimensions can be picked out: whether deals take place on the spot or whether they are deferred in time, subject to a promise or contract; and whether farmers sell their surpluses individually or collectively. This gives potentially four archetypes for aggregation, although contracting usually takes similar forms whether the contract is with an individual or group, then three forms stand out (Table 1): spot market deals by individual farmers; collective sales through producer organisations; and contracting by main buyers of farmers either as individuals or in groups.
Individual sales Collective sales Spot market deals
Farmer directly to trader, at: • Farm-gate • Local (periodic) market • Auction rings at local or
district centre
Groups of farmers directly to trader or main buyer Produce grouped at village or district centre, sometimes at a local buying centre that usually has some processing equipment. Group may transport and deliver to more distant processing plant or warehouse
Contracts Tenant outgrowers to main buyer Produce collected from farm, or delivered to buying centre or processing plant
[NA: Tenant outgrowers may be grouped for logistical convenience for negotiations with scheme managers, but usually they lack the independence of other producer organisations]
Independent outgrowers to main buyer Produce collected from farm, or delivered to buying centre or processing plant
Independent outgrowers in groups to main buyer Produce collected from farm, or delivered to buying centre or processing plant
Table 1 Forms of aggregation for farm produce
Agricultural marketing chains have seen significant changes since the early 1990s, as public marketing boards and state intervention in general have retreated; while in the private sector the rise of the supermarket chains, in some cases with multinational capital and know-how, has led to more vertically-coordinated supply chains with more contracting.
iii
This report focuses on collective marketing and contracting, because potentially these promise to aggregate produce more effectively, efficiently and with greater returns to farmers than individual spot deals. That is why when policy-makers seek to improve aggregation they usually look to establish, or support, some form of collective marketing or contracting. Method This report has been largely compiled by reviewing recent literature. We long-listed a total of over 150 references, of which 53 were particularly pertinent to this enquiry. Several limitations and omissions can be seen in the evidence reviewed. Studies do not consistently assess the same indicators, impeding comparisons across studies. Quantitative studies struggle to make valid comparisons between farmers using one means of aggregation and those using another. Studies often focus on average effects, with less attention to the variation seen in outcomes for different farmers. The effects measured are often only on farmers aggregating produce, with less consideration of the wider effects within the rural economy: impacts on farm labourers, for example, are rarely investigated. Differential effects within farm households are also often omitted. Cost effectiveness of schemes is not often investigated that also means that assessing the institutional sustainability of the scheme is difficult. A major limitation stems from choice and design of research, where imitation trumps novelty, so that some issues are studied repeatedly, while others that might be thought equally important, are ignored. Studies are more likely to observe success than failure, if only because failures are often dropped long before researchers can observe them. Publication bias means that significant findings get published while equally valid insignificant findings are less commonly published, or cited for that matter. Findings Producer Organisations (PO) and cooperatives can take many forms, but those studied are characterised by ownership and control by producers, function as rural businesses with commercial aims, and engage in collective marketing. As many as 20% of farms in the world belong to a PO, although the degree to which they market produce varies greatly by country and commodity. For example, in fruits and vegetables, POs had a 70% market share in Belgium but only 18% in the USA. For smallholders, POs can potentially: • Reach new markets, as pooling produce creates bulk supply attractive to buyers; • Improve the price received for produce (or reduce costs of farm inputs), through
economies of scale, better market information and negotiation with buyers, and sometimes through collective storage;
• Offer members access to finance, inputs and technical assistance to improve production;
• Add value to the product, for example through processing and packaging; • Coordinate production of a new, specialised commodity that requires specialised
knowledge and inputs; and, • Act as a political voice for farmers, advocating for more favourable policies. Do these benefits materialise in practice? Potentially, yes: member farmers can gain access to markets with higher prices, raise output and quality, and increase their incomes.
iv
However, the many failed POs should not be ignored. Business management can be challenging at the best of times, let alone in collective enterprises. In some cases, efficiency has trumped equity, as successful POs have focussed on business, ejecting members who do not perform. In other cases, POs under social pressures find it difficult to insist on member compliance, or to manage the PO’s resources efficiently.
Contract farming involves an agreement between a processor, wholesaler, retailer or exporter and the grower, a deal that at a minimum entails a promise by the contracting firm to buy produce from the farmer after some future harvest1 usually at a stated, fixed price, or else with an agreed formula for determining the price. Contracts may be written as formal documents, but many are oral agreements. Contracts quite often involve further linked transactions. Growers may be supplied with seed, fertiliser and other inputs needed to grow the crop by the contracting firm, given on credit with the cost — sometimes with interest — to be deducted from payment for produce. Farmers may also receive technical assistance on how best to grow the crop, although for the firm contracting, extension visits also allow the firm to check that farmers are complying with their side of the bargain. While in most cases contracts are between a firm and a farmer who has rights to land, sometimes the land is owned by the contracting firm so that the right to farm the land becomes another element in the firm’s offer.
The prevalence of contracting varies greatly by crop and context, although it is rare for more than 20% of farmers, or produce marketed, to be covered by a contract. While main buyers may prefer to contract with large farms, or the better-off smallholders, in some cases they have to work with a wider spectrum of smallholders if they are to get the supplies they seek.
Contracted farmers potentially benefit from contracts in several ways: obtaining access to markets that they otherwise could not reach where prices are higher; more stable and predictable prices for outputs; and access to inputs on credit and know-how to enable them to produce more, and to more exacting standards. All of these should then result in better returns to farming and probably higher household incomes. More often than not, studies report that farmers have higher farm incomes from contracting than their counterparts without contracts; even if disappointments have also been documented. Most recent studies focus on economic outcomes at the level of farm and firm. An older tradition takes a wider, political economy view of contracting, often arriving at more critical judgments. The key concern was that contracting firms would exploit farmers, both by paying low prices, and by paying farmers the equivalent of wages below the going rate for employed workers. Recent studies that test such propositions, however, could not be found. Reviews of contracting often try to identify the conditions that will most likely deliver benefits to farmers — and contracting firms. Points that stand out comprise: 1. The scheme has to generate acceptable returns to growers and contracting firms, so
it helps, when the contracting firm has access to a market paying premium price; 2. Agronomy matters: farmers have to able to grow the crop successfully, often to
demanding standards. It may take some trial and error before growers can take full advantage of their contracts. Provision of technical assistance can thus pay off handsomely. That implies, however, that the contracting firm has a long-run commitment to making the scheme work; which is more likely when the firm has
1 All mentions of crops apply equally to livestock, whose production may also be contracted, especially for dairy, pork and chicken.
v
invested in processing plants, cold stores and the like, specifically for the crop in question;
3. Allowing growers to depend too heavily on the scheme, or to take on heavy debt, invites too much risk. Scheme managers and farmers need to consider what happens when crops fail; and,
4. Trust and confidence on both sides of the contract needs fostering. Beyond these points, others present themselves as dilemmas or discussion points. Moral hazards exist: when spot market prices diverge significantly from contracted prices, either farmers will be tempted to sell on the side, or the company will be tempted to buy on the open market and refuse supplies from contracted growers. These risks mount when the economic environment is changeable, including when new competitors enter the market. If contracting is to survive, then there has to be some flexibility in the scheme. It helps if a supply chain ‘champion’ — usually the contracting firm — is capable and determined to make changes as necessary. Contracting may be easier for all parties when a third party, typically a government agency or a non-governmental organisation, helps facilitate and monitor deals. Additional public roles include registering and upholding land rights, providing model contracts, and possibly some regulation of contracts. In some cases, public agencies themselves may contract with smallholders. With limited resources for such intermediation, third parties face the dilemma of doing all they can to ensure that a few favoured schemes work, versus covering more schemes with more limited services. Few studies look at the terms of contracts in any detail. An exception, from Ethiopia, found that farmers valued the contract scheme for access to inputs and know-how: they were much less interested in fixed prices, since risks in the market were not so important for them. Discussion In answer to the two original questions, first, many different arrangements can be seen for aggregation, but most, other than individual spot market deals, are either collective sales through producer organisations or forms of contracting or a combination of the two. Second, although evidence is limited and imperfect, smallholders can indeed benefit from aggregation through collectives and contracting, getting better prices and access to premium markets. Many aggregation schemes also involve transactions and services other than output marketing alone; so that farmers may benefit from access to inputs on credit and from technical assistance that allow them to grow new, higher-value crops, or crops of a higher standard, or to deploy more productive technology. The gains from these changes may outweigh any consideration of prices or market access. Gains from enhanced forms of aggregation may not be equally shared. Some farmers with limited means may be excluded from producer organisations and contracting: both contracting firms and those leading associations will, all other things being equal, prefer to work with the better endowed smallholders. Spillovers may arise from these arrangements, whereby non-participating farmers might gain from learning new techniques from their participating neighbours or even be able to sell their produce under the same arrangement. Effects on farm workers are not that clear. Contracting can involve labour-intensive crops such as horticulture and thereby generate jobs. But some of the few studies report low wages and hardship for labour working on contracted smallholdings; although in other cases, labour clearly gains.
vi
Effects within households are similarly rarely studied. The concern is that men dominate in producer organisations and undertake contracts, then appropriate the gains without sharing this fairly with women and children. So much depends on circumstances for outcomes, but principles of successful aggregation are repeatedly identified, as follows: 1. Do not complicate matters unless the gains clearly and decisively outweigh the
additional transactions costs. Cooperation whether it be among a group of farmers or between a main buyer and contracted farmers is costly. Even if these costs are largely intangible — the time taken to reach agreements, the ongoing monitoring to ensure compliance, and the repeated demands for patience and goodwill that build trust — they can be onerous. Only if the gains clearly outweigh the bother, should such schemes be established.
2. Make sure the business case for the scheme is sound. That may seem so obvious as to be not worth saying, but some widely-held beliefs, such as that informal traders always exploit farmers, or that since processing adds value, processors must pay more than traders in fresh produce, have sunk more than one venture.
3. See the system as a whole, rather than obsess over components. Looking at the whole of the value chain to identify bottlenecks makes sense.
4. Rural systems are almost always heavily embedded in their natural and social local contexts. That means that archetypal schemes can rarely be applied without some adaptation to local circumstances: blueprints rarely work. That then implies the next four principles.
5. Work with substance, rather than form. That usually means working with individuals and groups, taking their interests and motivations seriously, then designing structures and systems that are likely to enhance motivation within the local circumstances.
6. Gradual, often marginal changes, implemented step by step are more likely to succeed than quantum leaps.
7. Be prepared for modest, but rewarding, rates of progress, and occasional reverses. Monitor outcomes, learn through trials, and when there is error, correct it. It is usually only by luck that things work first time. Many development programmes that have transformed people’s lives went through several revisions before they reached a working model.
8. As important as any of these principles, recognise that economic and business conditions change. Markets grow, they may integrate, new competitors enter, new policies and regulations appear — and so on; so that the volume, price and standards for farm produce are moving targets. Good schemes adapt to change.
A final reflection concerns informality and the dangers of being overly impressed by novel, sophisticated interventions. Despite the changing nature of some agricultural marketing in the developing world, informal channels still handle the bulk of produce in most low-income countries. As markets grow and differentiate, with varying demands from intermediaries and end consumers, so some informal channels thrive. Hence while more formal and sophisticated forms of marketing should be promoted where they deliver benefits, such interventions may not always be appropriate and may confer undue attention on smallholders with advantages, to the detriment of many more with lesser endowments. Informal marketing benefits from public goods, such as roads and power; and from standards such as weights and measures. So too do more sophisticated forms of marketing. Hence those seeking to help farmers market their produce should not neglect such public investments that can complement more ambitious measures.
vii
SECTION 1 Background
1.1 Questions addressed This short report addresses the questions asked in a Helpdesk request of February 2016, as follows:
What business models, contractual arrangements or other forms of support lead to production aggregation, and facilitate the linking of farmers to remunerative markets in developing countries? This might include cooperatives, contract farming or other forms of support to agribusinesses. What evidence is there that these business models and arrangements deliver a) improved access to markets? and b) higher incomes?
1.2 Framework: aggregation as part of marketing
1.2.1 Functions of agricultural marketing and forms of aggregation The questions set concern the marketing of farm output, whereby produce moves from producers to consumers most of whom live at some distance from the farm and hence are not likely to buy directly from the producer. Marketing changes produce by location, quality, time and form and in the process generates information useful to producers, consumers and those in the chain itself (Box 1). Box 1 Functions of marketing
Marketing chains fulfil a set of functions: • Transport. Produce is moved from producer to consumer; • Sorting and grading. Produce of different qualities is sorted into more uniform lots
that facilitate storage and processing, and can be directed to different markets according to the characteristics demanded in them;
• Storage. Harvests and livestock seasonality concentrate production in particular seasons, while consumer demand for food is much more even through time, hence produce has to be stored to match supply to demand. Storage is also needed to guard against shortfalls in production since agricultural production cannot be guaranteed against bad weather and attacks of pests and disease;
• Processing. Much of the food consumers buy has been processed: milled, fermented, slaughtered, chilled, pasteurised, brewed, distilled, baked, etc., so marketing usually changes the form of produce; and,
Information. Marketing chains generate information on quantities, prices and qualities. Aggregation, one of the first steps in marketing, is the focus of this enquiry. Relatively small-scale supplies from individual farms are bulked into lots that can readily and economically be transported, sorted, processed, and stored. Subsequently these will be broken down into
1
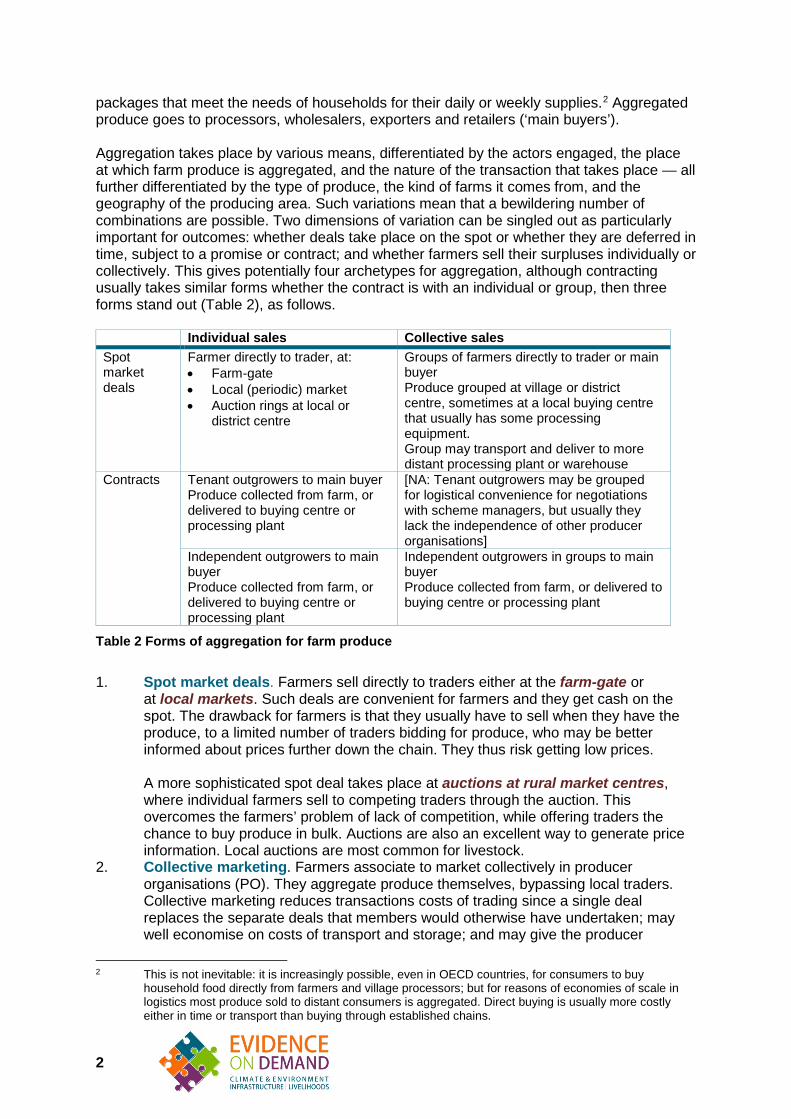
packages that meet the needs of households for their daily or weekly supplies.2 Aggregated produce goes to processors, wholesalers, exporters and retailers (‘main buyers’). Aggregation takes place by various means, differentiated by the actors engaged, the place at which farm produce is aggregated, and the nature of the transaction that takes place — all further differentiated by the type of produce, the kind of farms it comes from, and the geography of the producing area. Such variations mean that a bewildering number of combinations are possible. Two dimensions of variation can be singled out as particularly important for outcomes: whether deals take place on the spot or whether they are deferred in time, subject to a promise or contract; and whether farmers sell their surpluses individually or collectively. This gives potentially four archetypes for aggregation, although contracting usually takes similar forms whether the contract is with an individual or group, then three forms stand out (Table 2), as follows. Individual sales Collective sales Spot market deals
Farmer directly to trader, at: • Farm-gate • Local (periodic) market • Auction rings at local or
district centre
Groups of farmers directly to trader or main buyer Produce grouped at village or district centre, sometimes at a local buying centre that usually has some processing equipment. Group may transport and deliver to more distant processing plant or warehouse
Contracts Tenant outgrowers to main buyer Produce collected from farm, or delivered to buying centre or processing plant
[NA: Tenant outgrowers may be grouped for logistical convenience for negotiations with scheme managers, but usually they lack the independence of other producer organisations]
Independent outgrowers to main buyer Produce collected from farm, or delivered to buying centre or processing plant
Independent outgrowers in groups to main buyer Produce collected from farm, or delivered to buying centre or processing plant
Table 2 Forms of aggregation for farm produce
1. Spot market deals. Farmers sell directly to traders either at the farm-gate or
at local markets. Such deals are convenient for farmers and they get cash on the spot. The drawback for farmers is that they usually have to sell when they have the produce, to a limited number of traders bidding for produce, who may be better informed about prices further down the chain. They thus risk getting low prices. A more sophisticated spot deal takes place at auctions at rural market centres, where individual farmers sell to competing traders through the auction. This overcomes the farmers’ problem of lack of competition, while offering traders the chance to buy produce in bulk. Auctions are also an excellent way to generate price information. Local auctions are most common for livestock.
2. Collective marketing. Farmers associate to market collectively in producer organisations (PO). They aggregate produce themselves, bypassing local traders. Collective marketing reduces transactions costs of trading since a single deal replaces the separate deals that members would otherwise have undertaken; may well economise on costs of transport and storage; and may give the producer
2 This is not inevitable: it is increasingly possible, even in OECD countries, for consumers to buy household food directly from farmers and village processors; but for reasons of economies of scale in logistics most produce sold to distant consumers is aggregated. Direct buying is usually more costly either in time or transport than buying through established chains.
2
organisation bargaining power when selling to large-scale traders or main buyers. The transaction undertaken may be a spot deal or else may be contracted.
3. Contracted sales. Individual farmers, or groups of farmers, contract directly with a main buyer. The agreement is, at a minimum, a promise to trade produce at some future date; but may additionally state the volume, standard, and price — or a formula to derive a price. Contracts may also include interlinked transactions whereby the buyer provides farm inputs on credit and technical assistance. In some contract schemes the contracted growers may be tenants on land that the main buyer has the right to use. Public marketing boards and other such enterprises may also contract farmers in as much as they promise to buy any surplus at a guaranteed price, and often also provide inputs and technical assistance (Box 1). These arrangements not often referred to as contracting, since this terms tends to be reserved for private sector arrangements; but nevertheless they are a form of contracting. Both producer organisations and main buyers may set up buying centres close to clusters of growers where produce may conveniently be aggregated. They tend to be established when aggregated produce needs prompt processing, such as milk that needs to be chilled on delivery.
This report focuses on the two latter archetypes: collective sales though producer organisations and contracting, because potentially these promise to aggregate produce more effectively, efficiently and with greater returns to farmers. That is why when policy-makers seek to improve aggregation they usually look to establish, or support, some form of collective marketing or contracting.3
1.2.2 Changes in agricultural and food supply chains in the developing world Marketing chains — often referred to as ‘supply chains’ or ‘value chains’ — are changing in developing countries. As incomes rise, consumers typically spend more of their food budgets on higher value foods, and increasingly look for the quality of their food rather than just the price. Convenience also comes to be valued, with middle-income consumers prepared to pay more for foods in forms that save time in preparation. Much change has taken place in food chains in the developing world since the end of the 1980s, as Vorley & Proctor (2008) note:
Agrifood markets are in an unprecedented state of flux, and are generating intense policy debate worldwide. Market liberalization, foreign direct investment, a reduced role for the state and a shift towards market-driven policy, changes in consumer preferences and purchasing power, urbanization and the modernization of food processing and retailing are primary drivers. [Vorley & Proctor 2008]
In more detail, the following key changes can be identified (adapted from Reardon et al. 2009): • The retreat of the state as public marketing boards have either been privatised,
closed down or reduced the range of their functions. Food supply chains have thus become very largely the domain of private enterprise;
3 Exceptions exist. When public marketing boards have been closed, privatised or reformed, aggregation through contracting by the board may cease to be replaced by spot market deals.
3
• The rising share of the food retail markets served by supermarkets, initially in middle income countries, but by now taking place in almost all countries. Supermarkets have tended to start by selling groceries and processed foods (‘dry goods’), but subsequently add fresh food (‘wet goods’). These stores potentially have the advantages of operating at scale, with low unit costs for logistics, and of being able to standardise foods on sale in ways that small stores find difficult. The share of the market served by these large retail chains varies considerably across countries. It may also vary by social class: in some cases it seems that low income consumers use more informal supply chains that apparently can deliver food at costs lower than the chains — as seen, for example, for food sales in low-income neighbourhoods of Bogotá (Guarín 2013) or in fresh vegetables to Ho Chi Minh city, Vietnam (Cadilhon et al. 2006);
• In some countries the combination of less state and more supermarkets has seen the entry into domestic food chains of multinational supermarket groups bringing capital and know-how, but competing against existing domestic enterprises; and,
• A reduction in the number of links in the food supply chains, as more vertically-integrated relations replace long chains of intermediaries engaged in spot market deals.
These changes, seen across the developing world albeit in varying degrees, prompt two key questions, as follows: • Are the emerging food supply chains more effective and efficient than the chains they
displace? If costs in marketing can be reduced, then farmers potentially can get a better price for their produce; and,
• How much can smallholders participate in the emerging chains? Can they meet the demanding standards of supermarkets for food of even, high quality; can they deliver on time and in sufficient quantity; and, increasingly, can they provide certification of their production methods can their food be traced back to its origin?
In this study we are not looking at all the changes in the marketing chain, but just what is known about change at the aggregation stage. The upgrading of marketing chains commonly involves moves from individual spot sales to forms of collective marketing and contracting, and hence to the questions set about these forms and how effective they are in improving market access and raising farmers’ incomes.
4
SECTION 2 Method
2.1 Literature search This report has been largely compiled by reviewing recent literature, drawing on the sources listed in (Box 2). We longlisted a total of over 150 references, which were filed in a bibliographic software programme. Of these, 53 were particularly pertinent to this enquiry: summaries of these can be found in (Annex C). We also took selective notes from additional references that provided useful information but were not relevant enough for a full summary, usually because their focus was on something else. These are listed in the bibliography at the end. Box 2 Summary of literature searches
Sites of DFID R4D, 3iE, and ATAI Google Scholar searches, for literature published from 2000 onwards, for terms similar to Smallholder farms and: • Aggregation • Producer organisations (cooperatives, associations) • Contracts • Buying centres • Value chains and procurement Searches of evaluations of USAID and Millennium Development Corporation (impact evaluations only) and OECD-DeREC Snowball sampling of bibliographic references within the above. Four references provided by DFID for this study
The types of evidence used in this review can be categorised as follows: Primary studies: • Quantitative economic analysis based on household surveys: (OBS)4 This is the
source of most of the numbers presented. Typically these studies used regression analysis to determine the reasons for differences in outcome variables seen between a treatment and control groups. None of these studies were able to randomise the marketing treatment, so selection bias was controlled or mitigated by use of instrumental variables or, more commonly, by Propensity Score Matching (PSM).
4 Codes are based on DFID’s classification of the strength of evidence (DFID 2014): EXP and QEX -Primary Experimental and Quasi-experimental studies; OBS- Primary Observational; SR- Secondary Systematic Review and OR-Secondary Other Review. Most studies found fell into the category OBS (primary, observational) or OR – Other review.
5
• Qualitative, descriptive work (OBS) These studies normally rely on interviews with key informants and expert discussions.
• Evaluations of aid projects supporting agricultural aggregation. (OBS) Only a few of these were found, typically based on reports of project monitoring systems, supported by interviews and sometimes surveys, but with few non-participants involved. Very few present data on costs and value for money.. the results are often not very rigorous.
• Experimental and quasi-experimental evidence (EXP and QEX). Few studies seen: the exceptions being Ashraf et al. 2009 and Abebe et al. 2013.
Secondary studies: Ordinary literature reviews (OR) contained much interesting analysis, but some lacked rigorous examination of the underlying primary evidence. The two systematic reviews (SR) located contained little specific evidence on aggregation.
2.2 Limitations of the evidence Some of the limitations of the material examined were as follows. As can be seen from the summary of references consulted at (Annex C), there is no consistency in the indicators collected across different studies, which makes comparisons difficult. Many miss out significant indicators: for example they present income data, but without information on volumes and prices that help explain the incomes. The numbers presented that are derived from the quantitative studies, while statistically significant, have shortcomings. On their internal validity, despite using measures such as PSM to overcome selection bias, the direction of causality is not always evident, because most studies are cross-sectional data which provides only a snapshot at a single point in time. PSM, moreover, does not always account for unobservable factors, such as skills or attitude to risk, although some studies (Ito et al. 2012) do try to assess these. Regarding external validity, the results are only valid for the specific group at the specific time period studied; but how likely they are to apply outside the study population is seldom discussed. Quantitative analyses typically focus on average effects, and do not explore the variations seen across heterogeneous treatment groups. Moreover, the majority of studies drew data from household surveys, focusing on the ‘member farmer’ without looking at intra-household effects. Since many gendered impacts occur within the household, this meant that gender was understudied. The strong focus on the treatment group in the quantitative studies meant that wider effects of changes in marketing were left unexamined. For example, while households benefiting from membership of producer organisations or from contracts often employed more labour, little evidence of the effect on labourers was reported. This is a pity, since farm labourers often come from the lowest-income households. Quantitative studies tended to report outcomes, but had less to say about processes by which those outcomes had occurred. Many said little about context, for example how much of the marketing channel for a particular commodity was represented by the producer organisation or contracting entity under study. Explanatory details are often missed out: for example, producer organisations are often compared without consideration of the key structural and institutional details which affect success and failure. Qualitative studies, on the other hand, are quite good at telling complex stories of success and failure and suggesting the factors that lead to success, but rarely provide quantitative testing of the causal paths they illuminate.
6
Other gaps in the studies included: lack of attention to effects on labour and impact on labourers; lack of cost data and value-for-money analysis — in the rare cases where cost-effectiveness data was available, this was normally for a whole value chain rather than isolating the contribution of a specific strategy for aggregation; and, mainly for producer organisations, information on sustainability despite the establishment and operation of some organisations depending on external support. Perhaps the single most important limitation concerns the way that research is chosen and designed, and subsequent biases in publication. Studies tend to imitate one another, by questions addressed and methods used. Novelty in either dimension is not common. Hence some issues are studied repeatedly, while others that might be thought equally important, are ignored. Moreover, studies are more likely to observe success than failure, since failed schemes and innovations usually collapse and are abandoned before researchers come to study them: Barrett et al. 2012 notes this for contract farming schemes. When it comes time to publish results, researchers, peer reviewers and journal editors tend to prefer significant results to insignificant: even though they know that scientifically the latter are equally valid (Bellemare 2015).
2.3 Evidence gaps Given the limitations noted, plenty of gaps can be found in the evidence, including the following: Comparisons of different marketing channels for the same produce in similar circumstances. Despite there often being more than one channel for any particular product from any particular district, studies that compare the channels are few and far between. Effects of marketing arrangements focus first and foremost on the producers using the channel in question. Much less is reported about effects on labour hired by the farmers. Effects on neighbouring farmers who have not been directly engaged in the new marketing arrangement are rarely studied. Positive spillovers may arise when the new arrangements bring new technology that can be imitated by neighbours of the participating farmers; negative ones might apply when produce in the new channel displaces the produce from other growers using previous channels, or when successful marketing of food leads to higher local food prices that harm households that are net buyers of food. Similarly, geographical effects such as possible economies of agglomeration are hardly ever studied, despite the tendency for supply chains to develop in clusters (Porter 1998, De Janvry and Sadoulet 2004). Little is recorded on gender and other intra-household effects. For example, information on incomes is often only collected at household level. How income is distributed within the household and who benefits from it is not often studied, even if in some studies there are indications that since new marketing arrangements often involve males first and foremost, and they then receive payments, they may reinforce inequalities within the household. Sustainability: most studies reviewed are ‘snapshots’ that do not record change over time, although we know that the outcomes of aggregation interventions evolve as institutions develop and as market conditions change. Sustainability is a particular concern where aggregation interventions are heavily supported by external finance and technical expertise. The World Bank, in a meta-review of its projects supporting input and output marketing,
7
judged their performance overall to be on a par with other projects in the Bank’s agricultural portfolio, but judged the sustainability record to be weak, with just over half of all evaluated projects being judged as likely to be sustained, and only about a third of those in the poorest ‘agriculture-based economies’ (IEG 2011. Value for money (VfM): many aggregation interventions in low and middle income countries are subsidised by the government, or by external aid, or both. However, nearly all studies read lacked an assessment of the extent of such support, let alone an analysis of value for money. Value chain assistance can potentially be very costly: for example, an estimated cost of US$3,660 per smallholder household in a dairy value chain project in Zambia (Swanson 2009). Donors often underwrite investments in new marketing arrangements — in Honduras, one scheme saw 84% of the costs of farmer associations costs covered (Hellin et al. 2009). Producer organisations are often not aware of the full cost, threatening realistic planning and sustainability. A 2012 audit review of USAID support to cooperatives (OIG 2012) concluded that …
‘We found that financial and economic data to evaluate and compare cooperative and private sector business opportunities available to small farmers were not readily available. According to USAID, obtaining reliable data on production costs, opportunity costs, side selling, and other aspects of small farmers’ experience in cooperatives would take an inordinate amount of time.’
… so that OIG recommended
‘ …improvements in financial and economic reporting and evaluation of USAID agricultural cooperative programs to assess the benefits of the cooperative business model for small farmers.’
This deficiency exists despite there being plenty of guidance on how the cost-effectiveness of these interventions might be assessed (Kidoido & Child 2014, Ton et al. 2011, and Mellor 2009).
8
SECTION 3 Findings
3.1 Producer organisations (POs) and cooperatives The term Producer Organisation (PO)5 is used for a variety of organisational types, which can vary from informal farmer groups based on local social ties to large formal cooperatives. It also covers ‘apex organisations’ of POs, such as the Oromia Coffee Farmers’ Union in Ethiopia with 75,000 members (Develtere et al., 2008) or the Kenya Tea Development Agency comprised of 54 tea companies with 550,000 small tea farmers as individual shareholders (IFC, 2014). According to (Penrose-Buckley, 2007), a Producer Organisation should be:6 • a rural business: POs can engage in social activities and pursue social objectives but
these should not drive business decisions; • owned and controlled by producers; and • engaged in collective marketing. There is no generally-recognised typology of POs. In fact, POs often do not fall into a clear type. They can differ in many key aspects, for example in their levels of formalisation; degree of ownership and control by the members; management structures; allocation of benefits; legal ability to sell members’ production and collect the takings; and degree of openness in their activities (Chaddad and Cook, 2004, Mangnus and de Steenhuijsen Piters, 2010). They can additionally be described in terms of the types of commodities they handle and the activities they undertake, for example input and output marketing, technical assistance and credit. The vast majority of papers reviewed are vague about the characteristics of the PO being studied, while a few employ a crude typology such as ‘equity POs vs efficiency POs’ or ‘marketing POs vs livelihoods POs’. This makes it difficult to interpret differences in PO performance and is an evidence gap that we have highlighted.
3.1.1 Prevalence of POs The World Bank (2007) has estimated that 20% of all farms in the world participate in a PO. However, the degree to which POs have a share of the market varies greatly by country and commodity. For example, in fruits and vegetables, POs had a 70% market share in Belgium but only 18% in the USA (Van Bekkum and Dijk, 1997) cited in (Roy and Thorat, 2008). POs also dominate the dairy sector in many OECD countries for example 83% of dairy market share in the USA in the 1990s (ibid.). POs are also common in many processed tropical export crops such as coffee and cocoa. In countries as diverse as China, Ethiopia and Peru, POs have struggled to overcome a historical legacy of state controlled ‘cooperatives’ in the 1960s–1990s which alienated many
5 According to (Bijman, 2016), a shift away from the term ‘cooperative’ to the term ‘producer organisation’ reflects the increased emphasis being laid on the business and marketing roles of cooperatives, as well as the wish to get rid of negative ‘baggage’ around the term cooperative in some countries where cooperatives were widely seen as an exploitative instrument of the state.
6 Penrose-Buckley 2007 points out that these are more correctly seen as ‘goals’ as not all POs attain them
9
farmers, and to become more locally-owned and profitable (Vorley et al., 2012) (Ma and Abdulai, 2016). In the last ten years, there has been a renewed wave of external support to POs with more focus on commercial objectives. For example, the governments of both China and India have supported the emergence of professional POs since the early 2000s. A 2009 survey of ‘Farmer Professional Cooperatives’ in China (Jia and Huang, 2011) showed that, despite initial concerns by farmers due to bad experiences with previous state-sponsored cooperatives, they had rapidly become established, especially in livestock and horticulture, and that over a third were marketing via ‘modern supply chains’ (large processors and retailers) rather than to wholesale markets. In India, ‘Producer Companies’ have also been encouraged by the state with supportive legislation, but have been slower to establish, initially concentrating on production and farming inputs, although some have started to organise links to large retailers. Some POs dominate the market in particular areas, for example Mother Dairy has a 60% market share for fruits and vegetables in the Delhi area (Trebbin, 2014). The prevalence of POs is also increasing across Africa, although statistics are hard to come by (Develtere et al., 2008).
3.1.2 Potential benefits from POs Buyers and processors are looking for producers who can reliably deliver sufficient quantities of produce at the right time and at the quality required, all for a reasonable price. Large-scale farmers may fit the bill, but often the majority of production is from small farms. In this case, POs can offer a central point of contact which reduces transaction costs for buyers. POs may also undertake important intermediary activities such as transport, storage, quality control and processing. From the smallholder farmer’s point of view, POs can potentially: • Reach new markets, as pooling produce from different farms gives a larger quantity
more reliably, which may be attractive to buyers; • Improve the price received for produce (or reduce costs of farm inputs), through
economies of scale, better market information and negotiation with buyers, and sometimes through collective storage;
• Offer their members access to finance, inputs and technical assistance to improve production;
• Offer opportunities for adding value to the product, for example through processing; • Coordinate the production of a new, specialised commodity that requires specialised
knowledge and inputs; and, • Act as a political voice for farmers, advocating for more favourable policies.
3.1.3 Potential benefits to smallholders from membership of POs Do these benefits materialise in practice? Potentially, yes. A number of studies have estimated the gains for smallholders from PO membership, using propensity score matching or other statistical techniques to control for selection bias (Table 3). Significant gains from membership have been noted with respect to: • access to markets, including speciality and export markets; • quality of produce – in particular for a few highly specialised POs; • prices for farm outputs, with mean increases of 7–25%, more claimed in some cases; • farm income; and, • others, including access to inputs, market information, technical advice and support
for production, and certification for high-value markets. There are also cases of POs
10
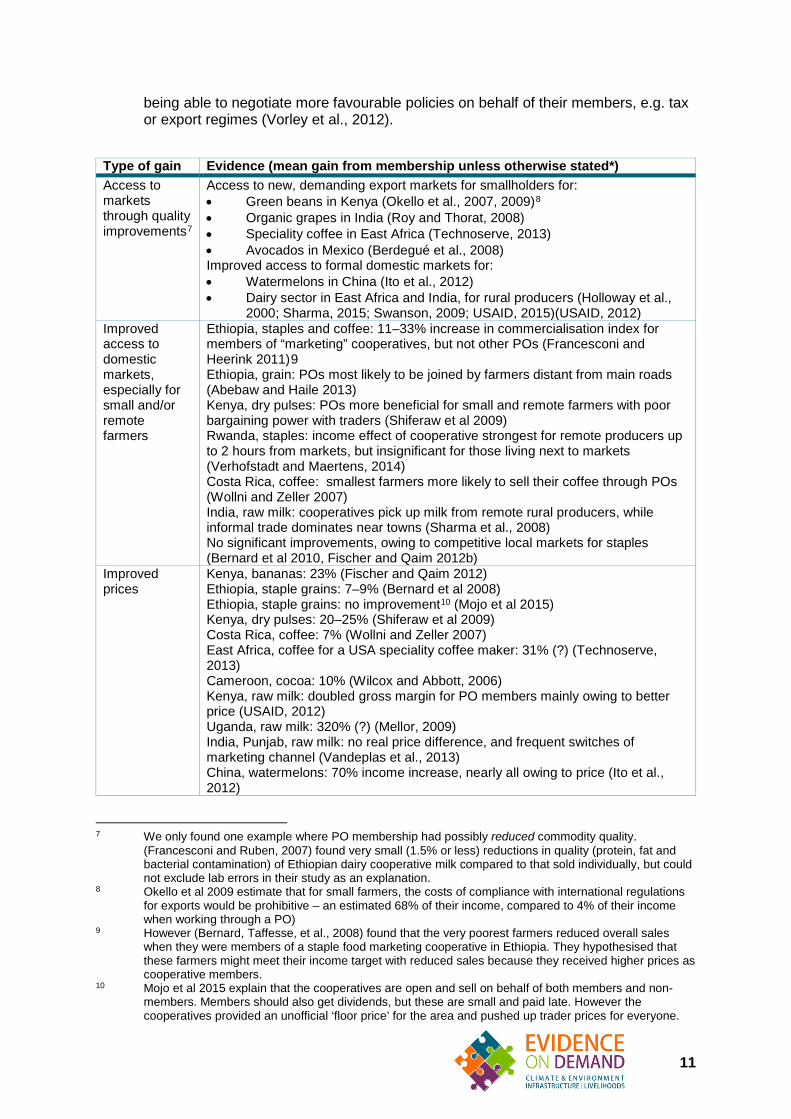
being able to negotiate more favourable policies on behalf of their members, e.g. tax or export regimes (Vorley et al., 2012).
Type of gain Evidence (mean gain from membership unless otherwise stated*) Access to markets through quality improvements7
Access to new, demanding export markets for smallholders for: • Green beans in Kenya (Okello et al., 2007, 2009)8 • Organic grapes in India (Roy and Thorat, 2008) • Speciality coffee in East Africa (Technoserve, 2013) • Avocados in Mexico (Berdegué et al., 2008) Improved access to formal domestic markets for: • Watermelons in China (Ito et al., 2012) • Dairy sector in East Africa and India, for rural producers (Holloway et al.,
2000; Sharma, 2015; Swanson, 2009; USAID, 2015)(USAID, 2012) Improved access to domestic markets, especially for small and/or remote farmers
Ethiopia, staples and coffee: 11–33% increase in commercialisation index for members of “marketing” cooperatives, but not other POs (Francesconi and Heerink 2011)9 Ethiopia, grain: POs most likely to be joined by farmers distant from main roads (Abebaw and Haile 2013) Kenya, dry pulses: POs more beneficial for small and remote farmers with poor bargaining power with traders (Shiferaw et al 2009) Rwanda, staples: income effect of cooperative strongest for remote producers up to 2 hours from markets, but insignificant for those living next to markets (Verhofstadt and Maertens, 2014) Costa Rica, coffee: smallest farmers more likely to sell their coffee through POs (Wollni and Zeller 2007) India, raw milk: cooperatives pick up milk from remote rural producers, while informal trade dominates near towns (Sharma et al., 2008) No significant improvements, owing to competitive local markets for staples (Bernard et al 2010, Fischer and Qaim 2012b)
Improved prices
Kenya, bananas: 23% (Fischer and Qaim 2012) Ethiopia, staple grains: 7–9% (Bernard et al 2008) Ethiopia, staple grains: no improvement10 (Mojo et al 2015) Kenya, dry pulses: 20–25% (Shiferaw et al 2009) Costa Rica, coffee: 7% (Wollni and Zeller 2007) East Africa, coffee for a USA speciality coffee maker: 31% (?) (Technoserve, 2013) Cameroon, cocoa: 10% (Wilcox and Abbott, 2006) Kenya, raw milk: doubled gross margin for PO members mainly owing to better price (USAID, 2012) Uganda, raw milk: 320% (?) (Mellor, 2009) India, Punjab, raw milk: no real price difference, and frequent switches of marketing channel (Vandeplas et al., 2013) China, watermelons: 70% income increase, nearly all owing to price (Ito et al., 2012)
7 We only found one example where PO membership had possibly reduced commodity quality. (Francesconi and Ruben, 2007) found very small (1.5% or less) reductions in quality (protein, fat and bacterial contamination) of Ethiopian dairy cooperative milk compared to that sold individually, but could not exclude lab errors in their study as an explanation.
8 Okello et al 2009 estimate that for small farmers, the costs of compliance with international regulations for exports would be prohibitive – an estimated 68% of their income, compared to 4% of their income when working through a PO)
9 However (Bernard, Taffesse, et al., 2008) found that the very poorest farmers reduced overall sales when they were members of a staple food marketing cooperative in Ethiopia. They hypothesised that these farmers might meet their income target with reduced sales because they received higher prices as cooperative members.
10 Mojo et al 2015 explain that the cooperatives are open and sell on behalf of both members and non-members. Members should also get dividends, but these are small and paid late. However the cooperatives provided an unofficial ‘floor price’ for the area and pushed up trader prices for everyone.
11
Type of gain Evidence (mean gain from membership unless otherwise stated*) Cameroon, Ethiopia: spillover effects of increased prices in area from increased competition for traders and spread of market information from POs to neighbours Mojo et al 2015 and Bernard 2010 in Ethiopia; Wilcox and Abbott (2006) in Cameroon
More household income from selling through PO compared to individually
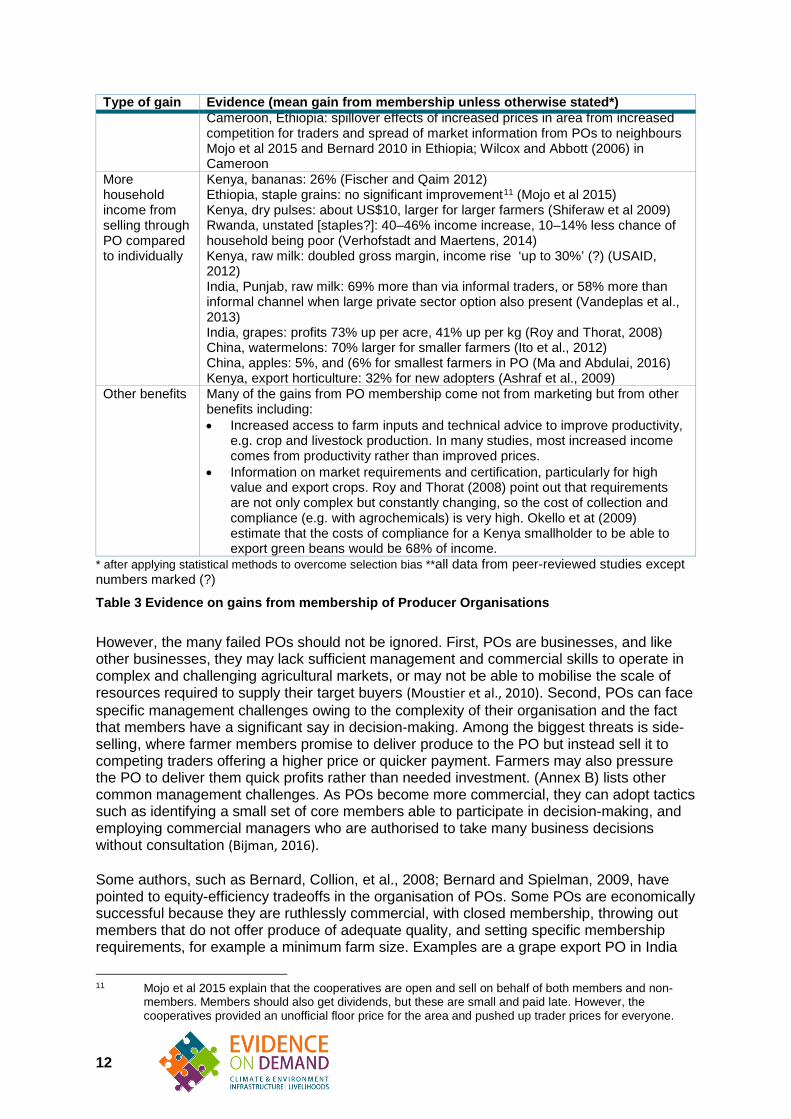
Kenya, bananas: 26% (Fischer and Qaim 2012) Ethiopia, staple grains: no significant improvement11 (Mojo et al 2015) Kenya, dry pulses: about US$10, larger for larger farmers (Shiferaw et al 2009) Rwanda, unstated [staples?]: 40–46% income increase, 10–14% less chance of household being poor (Verhofstadt and Maertens, 2014) Kenya, raw milk: doubled gross margin, income rise ‘up to 30%’ (?) (USAID, 2012) India, Punjab, raw milk: 69% more than via informal traders, or 58% more than informal channel when large private sector option also present (Vandeplas et al., 2013) India, grapes: profits 73% up per acre, 41% up per kg (Roy and Thorat, 2008) China, watermelons: 70% larger for smaller farmers (Ito et al., 2012) China, apples: 5%, and (6% for smallest farmers in PO (Ma and Abdulai, 2016) Kenya, export horticulture: 32% for new adopters (Ashraf et al., 2009)
Other benefits Many of the gains from PO membership come not from marketing but from other benefits including: • Increased access to farm inputs and technical advice to improve productivity,
e.g. crop and livestock production. In many studies, most increased income comes from productivity rather than improved prices.
• Information on market requirements and certification, particularly for high value and export crops. Roy and Thorat (2008) point out that requirements are not only complex but constantly changing, so the cost of collection and compliance (e.g. with agrochemicals) is very high. Okello et at (2009) estimate that the costs of compliance for a Kenya smallholder to be able to export green beans would be 68% of income.
* after applying statistical methods to overcome selection bias **all data from peer-reviewed studies except numbers marked (?)
Table 3 Evidence on gains from membership of Producer Organisations
However, the many failed POs should not be ignored. First, POs are businesses, and like other businesses, they may lack sufficient management and commercial skills to operate in complex and challenging agricultural markets, or may not be able to mobilise the scale of resources required to supply their target buyers (Moustier et al., 2010). Second, POs can face specific management challenges owing to the complexity of their organisation and the fact that members have a significant say in decision-making. Among the biggest threats is side-selling, where farmer members promise to deliver produce to the PO but instead sell it to competing traders offering a higher price or quicker payment. Farmers may also pressure the PO to deliver them quick profits rather than needed investment. (Annex B) lists other common management challenges. As POs become more commercial, they can adopt tactics such as identifying a small set of core members able to participate in decision-making, and employing commercial managers who are authorised to take many business decisions without consultation (Bijman, 2016). Some authors, such as Bernard, Collion, et al., 2008; Bernard and Spielman, 2009, have pointed to equity-efficiency tradeoffs in the organisation of POs. Some POs are economically successful because they are ruthlessly commercial, with closed membership, throwing out members that do not offer produce of adequate quality, and setting specific membership requirements, for example a minimum farm size. Examples are a grape export PO in India
11 Mojo et al 2015 explain that the cooperatives are open and sell on behalf of both members and non-members. Members should also get dividends, but these are small and paid late. However, the cooperatives provided an unofficial floor price for the area and pushed up trader prices for everyone.
12
(Roy and Thorat, 2008) and a watermelon PO in China (Ito et al., 2012). Other POs, especially those in rural areas of low-income countries, may have more open membership and focus more on equity goals. In traditional rural societies, POs, even if they have been set up as commercial organisations, may find it difficult to overcome social pressure and insist on member compliance (Berdegue, 2002), or to allocate PO resources in the most economically efficient way (Bernard, Collion, et al., 2008).
3.1.4 Lessons from external support to POs Many POs have been set up with a large dose of external support. For example in Ethiopia, national survey data in 2006 indicated that 63% of farmer cooperatives were created by the Government, 11% by a donor or NGO, and only 26% by members (Bernard et al 2010). Public-private partnerships and the support of knowledgeable partners (often NGOs) have been crucial in the development of sophisticated systems of certification, training and input supply to POs serving demanding export markets, for example in green beans in Kenya. External agencies may also be able to use their national clout to support producers in overcoming policy and regulatory constraints, for example, in opening up exports of rice from Laos (USAID, 2015). On the other hand, ample evidence shows that poorly-managed external support can undermine ownership, profitability and sustainability of POs (Francesconi and Wouterse, 2015; Hellin et al., 2009; USAID, 2015; Vorley et al., 2012). The mere availability of aid funds may cause POs to spring up that are not genuinely member-led (Francesconi and Wouterse, 2015). Partners loading too many activities on POs, even worthwhile activities such as literacy training and HIV awareness, can add a management burden, and in some cases can result in them losing sight of their core business and then starting to lose members (Bernard et al., 2010). Although there are some examples where POs started with external support have become independently successful, for example NorminVeggies in the Philippines (Sharma et al., 2013a), there are many examples where externally-encouraged POs struggle to manage on their own. Planning for sustainability is made more difficult because POs usually have no idea of the true cost of external technical support (Hellin et al., 2009). There are many sources of good advice for external partners who are considering support to POs (e.g. Kelly, 2012; Mangnus and de Steenhuijsen Piters, 2010; Penrose-Buckley, 2007; Technoserve, 2013; USAID, 2015). Among the most important pieces of advice are: • It is important to look at the whole value chain and the commercial and other
motivations of the actors in it, rather than starting from the perspective that POs are a ‘good thing’ that need support;
• For a new PO, carefully assess the economic case and alternatives. High-value commodities that require specialist organisation, and those that require processing, are more likely to be cost-beneficial. Historically, POs have been less successful in staple food crops, as there are usually many alternative buyers and little differentiation of the product is possible. They may help farmers in a situation where bargaining power is weak, for example where producers are remote and isolated (Verhofstadt and Maertens, 2014). However, a rigorous analysis should be conducted of risks and alternatives, as markets can change quickly. For example, farmers’ bargaining power and selling options may increase after the introduction of cell phones which improve price information, or when there is an influx of traders into an area following increases in production;
• One size does not fit all, and formalisation is not always necessary. Allow organisations to grow according to their context. For example, informal groups set up to coordinate sales may in some cases be the most appropriate solution (Hellin et al., 2009; Mangnus and de Steenhuijsen Piters, 2010);
13
• Risk analysis and mitigation is crucial. Agricultural markets are risky: for example, within-day price fluctuations in the international coffee market can be up to 6%, with annual fluctuations of 150% (Technoserve, 2013). Markets which depend on regulatory decisions are even more risky, as shown by a successful Kenyan horticultural project which collapsed overnight when its main buyer failed to meet new EU regulations for importing produce (Ashraf et al., 2009); and,
• A time-bound exit strategy should be built in for external support, and clearly communicated to the PO, including transparency about costs that will need to be borne by the PO when operating independently.
3.2 Contract farming Contract farming involves a contract between a processor, wholesaler, retailer or exporter and the grower, a deal that at a minimum entails a promise by the contracting firm to buy produce from the farmer after some future harvest12 usually at a stated, fixed price, or else with an agreed formula for determining the price. Contracts may be written as formal documents, but many are oral agreements. Some may entail understandings that are tantamount to contracts, see (Box 3). Contracts quite often involve further linked transactions. Growers may be supplied with seed, fertiliser and other inputs needed to grow the crop by the contracting firm, given on credit with the cost — sometimes with interest — to be deducted from payment for produce. Farmers may also receive technical assistance on how best to grow the crop, although for the firm contracting, extension visits also allow the firm to check that farmers are complying with their side of the bargain. While in most cases contracts are between a firm and a farmer who has rights to land, sometimes the land is owned by the contracting firm so that the right to farm the land becomes another element in the firm’s offer. Box 3 Deep procurement. When is a contract not a contract?
Large wholesalers or retailers can increasingly be seen to procure supplies directly from small-scale farmers in what has been called a ‘deep procurement’ model of aggregation. Farmers are provided with market information including the volumes, qualities and prices demanded. Collection may be through ‘spot collection platforms, arrangements for farmers to deliver directly, or aggregation points where smaller producers can assemble their produce before grading and shipping.’ The buyer may also arrange for technical training for farmers on market requirements, with some schemes having their own training force. (Karamchandani et al., 2009) Written contracts, however, are not offered, and prices paid are allowed to move in accordance with spot market rates. Examples include: • Nestle’s buying system for milk in Pakistan. ‘Although Nestlé recognizes smaller
farmers involve a higher cost to serve, in many ways it prefers to deal with this group because smallholders “sell everything they can afford to sell” and have less bargaining power. They are thus less likely to defect from the Nestlé system.’
• ‘ITC’s [an Indian food conglomerate] now famous e-Choupal initiative, which relies on village-based kiosks, the Internet, and its own collection points to bypass local
12 All mentions of crops in this section apply equally to livestock, whose production may also be contracted, especially for dairy, pork and chicken.
14
mandis for crops such as soy and wheat, which delivers procurement cost savings to ITC of about 1.5% per transaction, spread over millions of transactions.’
• ‘In Honduras, Hortifruti [a large horticultural retailer] builds around “lead farmers” ... through which it identifies and builds the capacity of those farmers best able to meet its quality requirements consistently. Having demonstrated such capacity, lead farmers receive larger and larger orders for product or new products and are encouraged to work with neighbouring farmers to meet this demand. The lead farmer thus serves as a node in providing technology, technical assistance, and market access.’
• Large food retailers in India, such as Reliance, Birla, ShopRite, and the Future Group — are already managing their own supply chains in new retail operations for fresh fruits and vegetables.
These arrangements cut out intermediaries in the supply chain and hence potentially offer better prices to growers and reduced costs of procurement for buyers. While these may not involve a contract, they differ little from oral contracting with a price established by formula. The buyer is promising to procure from the farmer and hence a contract is in effect in operation. That such arrangements involve additional transactions, such as offering technical assistance; and furthermore involve timely payment to reduce temptations to farmers to sell on the side, confirms that ‘deep procurement’ is a form of contracting.
Several typologies of contracting have been developed (see, for example, Bijman 2008, Oya 2012, Prowse 2012, Smalley 2013, Technoserve & IFAD 2011) involving the following distinctions: • The contracting firm. Does the firm have a nucleus estate that supplies some of the
produce demanded? Does it own the land that contracted farmers use? • The land rights of contracted farmers. Do farmers have rights over the land on
which they grow crops on contract? Does the contract scheme involve the resettlement of smallholders on new land?
• The competitive environment. Does the contracting firm have monopsony or oligopsony power when buying the crop — as often applies when produce has to be processed and the firm operates the only plant in the area; or are there many potential buyers of produce?
• The contract. How many linked transactions are involved? What are the terms and conditions? In particular, are quality standards absolute so that sub-standard produce will be rejected, or are they flexible with either bonus payments for higher quality or price penalties for lower quality? Is the price fixed in advance, or does it vary by a formula linked to a reference market price? Is the contract verbal or oral? How clear are the terms and conditions to contracted farmers? Etc.
• The crop. Contracting is typically more prevalent for some crops than others, generally being more common for crops that are high value, technically demanding to grow, perishable and otherwise requiring prompt processing, and subject to quite strict standards, sometimes with certification as well — as opposed to more standard commodities.
Contracts are an alternative to deals in spot markets. They exist to coordinate production and processing, to reduce risks to both parties, and to overcome market failures, as follows. Large, lumpy investments, such as a processing plant, may not be undertaken unless
15
production can be coordinated to ensure supply of produce and if the risk that supplies may not be enough, or of the right quantity is too high. Contracts help processors deal with both problems. Farmers, for their part, may be reluctant to devote land and labour to a new crop, without a guaranteed market that a contract can provide. When input and credit markets are absent or imperfect, then contracts can provide farmers with the means to produce that would not otherwise be available. Contracts are often about much more than aggregation of produce for sale, but when limited to simple agreements to buy produce at an agreed price, or formula, with no additional strings, then contracts may lead to higher prices since there are fewer intermediaries between the farmer and the buyer. They may lead to more stable prices for farmers who may value lower risks in the market. Contracting is not that novel in the developing world, but schemes may be increasing in number and size. One reason is the rise of supermarkets with their demands for assured quality and timely supplies. Another is the loss of publicly-provided inputs, technical assistance and credit as marketing boards were closed or cut back during the 1980s and 1990s — a form of public contracting (Box 4) — has encouraged some private contracting to replace this: ‘some’ because the marketing boards dealt not only in the kind of crops ideally suited to private contracting, but to more standardised commodities such as cereals as well. A third reason is that some donors, non-governmental organisations and governments have also encouraged contracting to link smallholders to higher value markets, both domestically and internationally (Bijman 2008). Box 4 Public contracting by marketing boards in Africa
From the 1920s onwards, marketing boards were established in many parts of Africa to organise supply chains, above all those that shipped exports to Europe and those that supplied staple food to major cities and mining camps. Usually endowed with statutory monopoly power, they collected surplus production, transported and stored it, graded it and ensured quality. Typically they were run in the interests of the consuming cities, mining camps and metropolitan countries, rather than those of the farmers; settler farmers excepted. Independent governments from the late 1950s onwards continued to operate the boards, often with amplified objectives, both explicit and implicit. Boards would offer an outlet for any and all surplus of the product they governed, stimulate production, stabilise prices, organise imports and exports, maintain stores and reserves, ensure urban populations were fed with staples at reasonable prices. In the interests of regional equity, the boards would pay the same price across the country; and, in the interests of simplicity, pay the same price throughout the year. In some cases, the boards became a way that the government could raise revenue, by taking a large margin between price received and price paid for produce. More commonly, however, the boards operated at high and increasing costs as they struggled to meet their varying objectives, running deeper into debt that had to be covered by the central bank. As produce aggregators marketing boards were a form of contract farming, since there was a promise to buy any surplus output, usually at a stated price. Often there were also interlinked contracts, since boards provided inputs and technical assistance as well to farmers.
16
By the late 1970s many of the boards had unsustainable losses. Under structural adjustment most were either closed down, privatised or continued as state enterprises but with much reduced remits, trimmed of their monopoly powers and expected to operate commercially. In the latter cases, two examples serve to illustrate what became of their functions, and in particular that of produce aggregation. The Ghana Cocoa Board (Cocobod) was originally formed in 1947. It collected and marketed the crop, provided growers with seedlings and other inputs, and conducted research. In the 1960s and 1970s governments treated Cocobod as a cash cow, squeezing the farm price to extract revenue. By the late 1970s the sector was in disarray: discouraged by very low prices, farmers ceased to do more than harvest their overgrown and neglected groves so that yields, and total production, fell. Those farmers who could smuggle their crop to neighbouring Togo and the Côte d'Ivoire did so. In 1984 reform began. The board cut back on provision of inputs and ceased to buy produce directly. It was expected to operate commercially and efficiently, without the implicit obligation to raise revenue. It still held a monopoly to export cocoa, but now bought cocoa through licensed private buyers. Buying prices, however, were set by a public committee: the licensed buyers competed for business by prompt payment, offers of credit and input supply. Thanks to these measures, plus a heavy devaluation of the cedi, prices rose and farmers returned to their groves, rehabilitated them, raised their yields and the cocoa industry recovered. The Kenya Tea Development Agency (formerly Authority) (KTDA) was created in 1964 to organise tea growing by smallholders. Initially it just provided technical assistance, seedlings and technical assistance to farmers, then delivered leaf to private factories. By the early 1970s, however, it began to operate factories and to market processed tea. It became a highly proficient, vertically-integrated operation that oversaw a major expansion of smallholder tea cultivation while Kenyan tea achieved premium prices in international tea auctions. In 2000 it was privatised. Control of KTDA rested with the tea factories, which in turn had been privatised by giving shares to the smallholder suppliers. KTDA had formally become a producer organisation with more than half a million members. In practice, it continues to operate an integrated chain in which the growers in effect have contracts to supply the factories they nominally own. Marketing boards are less common as aggregators today than in their heyday 40 or more years ago. Those that persist, however, continue in effect to contract their growers. In the case of KTDA the contract is well defined and highly interlinked with other services. For Cocobod, the contract is at arms’ length, through the buying companies, with fewer linked deals; but for all that, substantively it is a form of contracting. Sources: Barrett & Mutambatsere 2008, Ochieng 2007, Kolavalli & Vigneri 2011
So what is known about the outcomes of contract farming in developing countries?
17
3.2.1 Prevalence of contracting A first question concerns how widespread contracting is, which crops tend to be the subject of contracts and which farmers tend to participate in contract schemes. Given the several and considerable apparent advantages of contracts, it is not as prevalent as might be imagined. Even in OECD countries where the demand for high standards in food might be thought to make contracting particularly attractive, one estimate has less than 15% of produce by value traded under contracts (Rehber 2007, cited in Prowse 2012). But prevalence varies considerably by enterprise across the world. Contracting is often highly prevalent for some produce, but not for others. For example, in the 1990s, 15–20% of farmers in Kenya were under contract 250,000 farmers in all, with an estimated 45–50% of the value of marketed crops grown under contract. Of those, however, no fewer than 150,00013 were growing tea for the Kenya Tea Development Authority (KTDA) and another 65,000 produced sugar for the mills of Western and Nyanza Provinces. Most of the remaining contracted farmers were growing tobacco and horticultural crops. These crops share characteristics of being high value, in some cases needing prompt processing in large-scale plants, and most needing to be produced with good quality. This does not mean that contracting only ever applies to higher-value produce. On the contrary, Prowse (2012) was surprised to find that so many of the documented cases he reviewed were of more mundane, standard agricultural commodities including onions, potatoes, rice and soy beans.
3.2.2 Farmer participation Evidence on which farmers are contracted is mixed. Contracting firms may prefer to deal with relatively large farmers, since that reduces their administrative costs. For example, in the late 1990s in the Punjab of India, the multinational companies contracted farmers with an average of 24 hectares, a local company had contracts with farmers who operated an average 8 hectares; and in both cases, the contracted area averaged some 5 hectares (Singh 2002). These may not have been very large farms, but they were well above the average for India, as well as for the Punjab where the average holding in 2005/06 was around 4 hectares. On the other hand, large numbers of smallholders are engaged in contracting. Partly this is because some firms may prefer smaller operators, since they may have fewer options when selling produce than larger growers and hence may be more likely to fulfil their contracts. A more important reason, however, may be sheer necessity. A prime decision for the contracting firm is location: where can the produce be grown, and at low cost? The answer is often in areas with good soils, reliable rain and irrigation. Such areas are often densely settled so that the typical farms are small. Hence the firm ends up recruiting smallholders since they are the ones settled on the most favoured locations (Barrett et al. 2012). That said, farms marginal owing to their limited land, labour and capital, or owing to their remote location are unlikely to be included: most simply cannot fulfil the demands of the contract.
3.2.3 Benefits to contracted farmers Contacted farmers potentially benefit from contracts in several ways: obtaining access to markets that they otherwise could not reach where prices are higher; more stable and predictable prices for outputs; and access to inputs on credit and know-how to enable them to produce more, and to more exacting standards. All of these should then result in better
13 More recently this number has expanded to 550,000 smallholders delivering tea to KTDA.
18
returns to farming and probably higher household incomes. Are these benefits realised, and if so, to what degree? More often than not, studies report that farmers have higher farm incomes from contracting than their counterparts without contracts, see examples in (Table 4). In those studies where the question was asked (for example, Singh 2001), farmers usually state that they are content with the scheme and want to continue in it. Reviewing 44 studies, Prowse (2012) found that 35 reported generally positive results, while only 9 recorded largely negative outcomes. The strength of effects was small in one case, the US$45 a year earned by Madagascan green bean growers; but in other cases the gains were significant to smallholders on low incomes, even if not so great that they would transform households living standards. Study Location, Date,
Crop/Enterprise Findings
Effects mainly positive Bellemare 2012 Madagascar
2008, barley, cotton, rice, maize and green beans
Participation in contract farming increases household income by 10%; household income per capita by 14%; household income per adult equivalent by 16%; household income net of contract farming revenue by 9%. It decreases the duration of the hungry season experienced by the household by about two months; and increases the likelihood that a household receives a loan from a bank or a microfinance institution by about 31%. Decreases vulnerability and indirectly increases welfare by decreasing the volatility of total household income, income per capita, and income per adult equivalent by about 15%; but has no such impact on household income net of contract farming revenue.
Cai et al. 2008 Cambodia, Kampong Speu 2005, premium rice for export
Compared to never-contracted farmers, contracted farmers get higher yields, better rice prices but spend more on their operations. For all the sample farmers on average, joining the contract raised their average profit by nearly US$250.
Grosh 1994 Kenya, early 1990s, tobacco, green beans, and maize
Contracted growers typically use more inputs, grow more, have higher incomes
Minten et al. 2011
Madagascar 2005, green beans for export
Farmers typically get US$45 from their contracts, around half their annual income. They like contracts because gives regular income and cuts down the lean season of hardship. Most are quite loyal, have been with company for average of 8 years, and say they would still contract even if prices were lower.
Singh 2002 India, Punjab, late 1990s, vegetables
Vegetable growing is profitable. Despite various problems and conflicts between companies and growers, 62% of HLL, 80% of Nijjer, and 68% and 73% of Pepsi (potato and chili respectively) farmers wanted to continue contracting.
Warning & Key 2002
Senegal, groundnut basin, 1992/94
Contracted growers profited from their access to seed, fertiliser and chemicals on credit to realise much higher yields — 1.3 t/ha compared to 0.8 t/ha — and had farm incomes of US$680 on average more than non-participants.
Effects mixed or negative Freguin-Gresh et al. 2012
South Africa, Mopani District, Limpopo 2011
Less than 2% of farmers in district had contracts. Those that did were privileged, coming either from those who had large-scale farms before 1992 who benefitted from co-ops
19
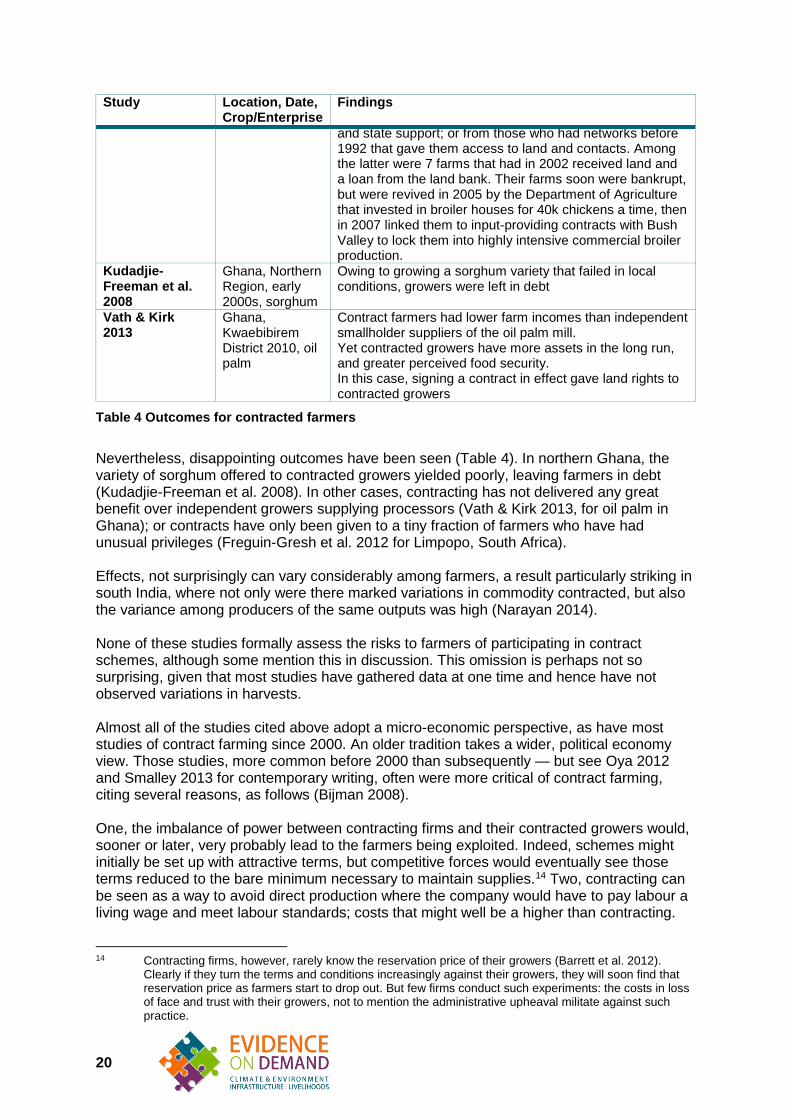
Study Location, Date, Crop/Enterprise
Findings
and state support; or from those who had networks before 1992 that gave them access to land and contacts. Among the latter were 7 farms that had in 2002 received land and a loan from the land bank. Their farms soon were bankrupt, but were revived in 2005 by the Department of Agriculture that invested in broiler houses for 40k chickens a time, then in 2007 linked them to input-providing contracts with Bush Valley to lock them into highly intensive commercial broiler production.
Kudadjie-Freeman et al. 2008
Ghana, Northern Region, early 2000s, sorghum
Owing to growing a sorghum variety that failed in local conditions, growers were left in debt
Vath & Kirk 2013
Ghana, Kwaebibirem District 2010, oil palm
Contract farmers had lower farm incomes than independent smallholder suppliers of the oil palm mill. Yet contracted growers have more assets in the long run, and greater perceived food security. In this case, signing a contract in effect gave land rights to contracted growers
Table 4 Outcomes for contracted farmers
Nevertheless, disappointing outcomes have been seen (Table 4). In northern Ghana, the variety of sorghum offered to contracted growers yielded poorly, leaving farmers in debt (Kudadjie-Freeman et al. 2008). In other cases, contracting has not delivered any great benefit over independent growers supplying processors (Vath & Kirk 2013, for oil palm in Ghana); or contracts have only been given to a tiny fraction of farmers who have had unusual privileges (Freguin-Gresh et al. 2012 for Limpopo, South Africa). Effects, not surprisingly can vary considerably among farmers, a result particularly striking in south India, where not only were there marked variations in commodity contracted, but also the variance among producers of the same outputs was high (Narayan 2014). None of these studies formally assess the risks to farmers of participating in contract schemes, although some mention this in discussion. This omission is perhaps not so surprising, given that most studies have gathered data at one time and hence have not observed variations in harvests. Almost all of the studies cited above adopt a micro-economic perspective, as have most studies of contract farming since 2000. An older tradition takes a wider, political economy view. Those studies, more common before 2000 than subsequently — but see Oya 2012 and Smalley 2013 for contemporary writing, often were more critical of contract farming, citing several reasons, as follows (Bijman 2008). One, the imbalance of power between contracting firms and their contracted growers would, sooner or later, very probably lead to the farmers being exploited. Indeed, schemes might initially be set up with attractive terms, but competitive forces would eventually see those terms reduced to the bare minimum necessary to maintain supplies.14 Two, contracting can be seen as a way to avoid direct production where the company would have to pay labour a living wage and meet labour standards; costs that might well be a higher than contracting.
14 Contracting firms, however, rarely know the reservation price of their growers (Barrett et al. 2012). Clearly if they turn the terms and conditions increasingly against their growers, they will soon find that reservation price as farmers start to drop out. But few firms conduct such experiments: the costs in loss of face and trust with their growers, not to mention the administrative upheaval militate against such practice.
20
Contracted farmers, prepared to work for low implicit wages, in effect subsidise the company. Three, looking beyond the contracted farm household, such studies argue that contracting may marginalise those who cannot enter the schemes, while labour hired on contracted farms may be paid less than minimum wages. Four, within the affected households there is concern that contracts are signed with men who then get the benefits, while much of the work is carried out by women and girls. (Oya 2012, Smalley 2013). Not much has been published since 2000 that would confirm these fears. Absence of evidence, of course, is not evidence of absence. Decisions on what to research and how are inevitably biased, so it may be that negative effects, especially those that apply to non-contracted persons, are simply no longer being investigated. On the other hand, in some political economy writing theoretical propositions do rather seem to be accepted on their logic, rather than on evidence of their realisation. Singh (2002) reports higher farm incomes to contract growers in the Punjab, and more work for local labour, but repeatedly insists that ‘agribusiness normalization’ will lead to worse outcomes:
‘The above analysis of case studies in the Indian Punjab reveals that though contracting has initially led to higher incomes for the farmers and more employment for labour, it is not smooth sailing for firms and is unlikely to be sustained due to lack of trust between firms and farmers and the tendencies toward agribusiness normalization and monopolization by firms.’ [Singh 2002]
But no evidence is presented to confirm that gloomy prognosis.15
3.2.4 Assessing contracting What may be concluded from this short review? The first point is that the variety of contracts, crops and enterprises, growers and contracting firms, and local circumstances is huge; while the number of studies is not only small, but also limited by almost all being cross-sectional snapshots in time, rather than longitudinal studies that might reveal more of the dynamics and trajectories of contracting. Hence definitive evidence is lacking. That rather unhelpful point notwithstanding, it is clear that contracting can benefit farmers in the ways that might be expected — even if it is equally clear that not every contract scheme will work or deliver those benefits. Most reviews make these points, then move on to try to identify the conditions that will most likely deliver benefits to farmers — and contracting firms. Technoserve & IFAD (2011), for example, conclude:
‘Although there is no single model approach that will guarantee success, all successful programmes are founded on good economic principles, transparency and a mutual, sustained commitment by all stakeholders to share equitably the market‘s risks and rewards.’ [Technoserve & IFAD 2011]
From this and other reviews, the following points stand out. 1. The scheme has to generate acceptable returns to growers and contracting firms. It
helps, then, when the contracting firm has access to a market that pays premium prices. The scheme may also be the best, or only way, to ensure that standards are met and certification obtained when smallholders grow crops for demanding markets.
2. Agronomy matters as well: it is one thing to state standards, another for farmers to grow the crop successfully in their fields. It may take some trial and error before
15 A brief search of the literature to see if Singh or others have followed up on the fate of the vegetable growers since their observations in the late 1990s drew a blank.
21
growers can take full advantage of their contracts. This is why, in some accounts, provision of technical assistance pays off handsomely. That implies, however, that the contracting firm has a long-run commitment to making the scheme work. In this there can be a world of difference between companies that have invested in processing plant and in relations with their customers in distant places, on the one hand; and, on the other hand, traders with minimal investments looking for short-term gains (Runsten & Key 2008 emphasise this point for fruit and vegetable contracting in Mexico).
3. Growers may be well advised to avoid depending heavily mono-cropping, and on credit to gain access to inputs. Some thought needs to be given to what happens when harvests fail, as they will usually do in rain-fed agriculture from time to time. Will the company forgive debts? Might crop insurance, perhaps indexed to weather, be needed?
4. Look to build trust and confidence on both sides of the contract. An obvious point, although challenging in practice owing to the first of the discussion points below.
Beyond these points, others present themselves as dilemmas or discussion points, as follows. Competition, monopsony and changing business conditions. Contracts are all too often violated: farmers sell on the side to other buyers to avoid deductions from contracting firms to cover costs of inputs; companies refuse produce or buy elsewhere when the market price falls significantly below the contracted price. It does not matter that a contract may be written: the costs of enforcing the contract usually exceed whatever compensation might be legally awarded. Where the contracting firm has a monopsony on the crop in question, often because they have the only processing plant within reasonable reach of the farmers, as typically applies for sugar mills, side-selling may be avoided. But monopsony power may then be used against the growers, since they can do little if the company lowers the price, or imposes strict and demanding quality standards, or even deliberately and unfairly downgrades produce to impose price penalties. Moral hazards on either side of the deal may be mitigated as trust develops, and as third parties act as referees, see below. But more challenging for all concerned are changes in the economic environment. Contracts are often broken when the market price diverges considerably from the contracted price: in such cases, one party will have a strong incentive not to comply with the contract. In other cases, it may not just be the price: new competitors may enter the market and eat away at the advantage of the contracting firm — as happened to Ghana’s pineapple exports in the early 2000s when Costa Rican exports to Europe captured the market, pushing Ghana’s pineapples aside. It took several years for Ghana exporters to recover and when they did, most were producing from large estates, not sourcing from smallholders (Whitfield 2010). If contracting is to survive, then there has to be some flexibility in the scheme. It helps if a supply chain ‘champion’ — usually the main buyer that has set up the contracting — is capable and determined to make changes as necessary, rather than just ditch the scheme when the environment changes.16
16 This presents a paradox: a contracting scheme in a (highly) competitive market will not generate more than normal profit for the participants, so that whoever has taken the initiative to create the scheme may simply lack resources to adapt to changed circumstances. It seems, then, that some element of supernormal profit, a rent, can thus help sustain schemes.
22
Role of third parties. Contracting may be easier for all parties when a third party, typically a government agency or a non-governmental organisation, helps facilitate and monitor deals (Smalley 2013, Vermeulen & Cotula 2010). When non-governmental organisations help facilitate contracts, providing both sides with information and reassurance, this probably benefits the firm more than the grower; whereas when they work with farmers on production, this unambiguously benefits the grower (Barrett et al. 2012). Some development partners have also actively intervened to support aggregation through commercial agents as part of a wider value chain. They normally employ specialist intermediaries, either non-governmental organisations or commercial companies experienced in linking smallholder farmers to markets. Examples include: • Fintrac is a US-based consultancy. They use donor funds to co-invest in new market
linkages along the whole value chain to produce a demonstration effect that aims to crowd in new investment. As part of this, they make links with large-scale traders and processors who are willing to invest, support capacity development and co-invest in post-harvest technologies. Examples include smallholder flower growing for an exporter in Tanzania, smallholders supplying a large chilli processor in Kenya and fresh produce for a supermarket chain in Honduras (Fintrac, 2014).
• Land O’Lakes — itself a USA dairy farmers’ cooperative — links smallholder dairy farmers in East Africa to large milk buyers (Swanson, 2009; USAID, 2012, 2015).
There is evidence from some countries that making such ‘third-party facilitated’ linkages can lead to sustainable and beneficial changes in value chains (Shanoyan et al., 2014) although more evidence is needed. Working with top-level buyers (also called ‘lead firms’ or ‘chain governors’) provides another route to improving practice at the intermediary levels of the chain and ultimately benefiting both smallholders and others in the value chain. What may government do? Help secure land rights, some regulation, and model contracts are suggested by Vermeulen & Cotula (2010).
‘This may involve providing strong safeguards and remedies for local people, for example with regard to security of local land rights; increasing the set of choices open to agribusiness and smallholders; providing more detailed regulation for available arrangements, and flexible model contracts where relevant, particularly for the more complex ones such as joint ventures and management contracts; and providing support (or at least establishing a framework for others to provide support) to smallholders in their dealings with agribusiness.‘ [Vermeulen & Cotula 2010]17
The public sector can also potentially be an important buyer, providing an assured and stable market. It can also help drive up quality and social standards in value chains. Examples include: • The city of Belo Horizonte, Brazil and several European cities have organised regular
procurement from smallholder farmers, via commercial aggregators or producer organisations or both (Zeeuw and Drechsel, 2015); and,
• The World Food Programme is also making use of its purchasing power to support buying from local smallholders under their Purchase for Progress scheme (Mitchell and Leturque, 2011).
17 This is good advice, but it does assume that government is prepared to do this, and is not in cahoots with agribusiness interests.
23
Large private sector buyers may also have an interest in improving practice in value chains as part of a commitment to social responsibility or in response to public pressure. Oxfam and other NGOs have worked with Unilever, Walmart and other international buyers to promote inclusion of smallholders and ‘best practices’ in their supply chains (Vorley and Thorpe, 2014). Resources for such intermediation are limited, so that third parties face the dilemma of doing all they can to make sure that some schemes work, but thereby only attending a small number of schemes; or, alternatively, covering more schemes with more limited services. Appropriate contracts. Hardly any studies look at the terms of contracts in any detail. A fascinating exception comes from Ethiopia (Abebe et al. 2013) where farmers, in an area where some were contracted to grow seed potato, were engaged in discrete choice experiments to discover what form of contract they favoured. The findings were revealing. What farmers really valued from the contracts was access to seed, inputs and technical assistance from the buyer, on credit, to overcome their liquidity constraints and to get the know-how. They were, however, unperturbed about contracts that specified prices that varied according to the quality of the potato delivered. That was partly because they feared a fixed price would be set to the buyer’s advantage, but more because they felt they could meet the quality norms and hence get premium payments, and in any case, if they could not, they could always sell sub-standard potato locally. Since contracting was new to the area, farmers wanted written rather than oral contracts. These findings were widely shared across the farmers studied: personal differences were not so important. The findings went against the received wisdom that farmers were averse to risks when selling their crop: no, in this case, this did not worry them. The lesson that comes from this study is that contracting firms and those working to facilitate deals need to understand what farmers prefer, rather than just assuming that they are risk averse and might thus prefer the simplicity and assurance of a fixed price deal.
24
SECTION 4 Discussion and conclusions
4.1 Replies to the original questions Two questions were set for this study. The first was:
What business models, contractual arrangements or other forms of support lead to production aggregation, and facilitate the linking of farmers to remunerative markets in developing countries? This might include cooperatives, contract farming or other forms of support to agribusinesses.
A plethora of arrangements for aggregation beyond spot market deals can be seen: not surprising given the great diversity of crops, actors and circumstances under which farm produce is aggregated. Most forms of aggregation, other than individual spot market deals, are either collective sales through producer organisations or forms of contracting or a combination of the two. While it is easy to create schemes with typologies of sub-variants and to add intriguing names for them — ‘deep procurement’ for example — this can mask the more important common elements that apply to collective marketing and contracting. The second question was:
What evidence is there that these business models and arrangements deliver a) improved access to markets and b) higher incomes?
Evidence is limited and imperfect. Smallholders can indeed benefit from aggregation through collectives and contracting. They can get better prices, either from gaining access to markets where premium prices are paid, or through economies in the supply chain, or from having more bargaining power with buyers. Under contracts, they may gain from more predictable prices; although that can be a double-edged sword in that few farmers want a guaranteed, contracted price if, when the time comes, that is less than the spot market price. Many aggregation schemes involve transactions and services other than output marketing alone; so that farmers may benefit from access to inputs on credit and from technical assistance that allow them to grow new, higher-value crops, or crops of a higher standard, or to deploy more productive technology. The gains from these changes may outweigh any consideration of prices or market access. Contrary evidence can also be found. Given the immense variation in the arrangements recorded, the farmers affected, and the circumstances this was always to be expected. The question is not whether marketing through farmer organisations or agricultural contracts deliver benefits, but under what conditions this happens. We will return to this issue below, but before that variations in who benefits needs to be considered.
4.1.1 Who benefits in rural communities? Not all farmers engaged in enhanced aggregation benefit equally: indeed, some do not get to participate in such schemes at all. Smallholders with limited means will benefit less from
25
better deals in marketing than those who can respond to the incentives of higher prices, more predictable prices, access to new markets, and to additional means of production. Kubzansky et al. (2011) describe the market-led enterprises they identify, which include all forms of aggregation, as ‘aiming at the $2 a day segment’, as opposed to smallholders on lower incomes. Producer organisations can be more attractive to the ‘middle class’ of smallholder farmers, rather than the poorest who cannot always afford fees or gain entry, and who cannot afford to wait for delayed payments by POs (see, for example, Bernard et al. 2010 on Ethiopia). They may not either attract the wealthiest farmers, who may find it easier to make direct links with buyers.18 That said, the benefits of selling through a PO can be greater for the smallest farmers, although these were also the most likely to be excluded from the enterprise (Ito et al. 2012, Ma and Abdulai 2016). Less studied are the effects on others in the rural communities where new forms of aggregation have been introduced. Spillover effects can confer benefits to non-participating farmers, by boosting prices in competition with traders. Information, both technical and about markets provided to participants may be passed to non-members. Indeed, in some cases non-members can benefit directly: contracted farmers may sell their non-contracted members produce for them — a headache for the supply chain champion when the scheme involves certification (Wiggins & Keats 2013 on the case of export vegetables from Kenya); while some cooperatives allow non-members to sell through the cooperative, buy inputs or access training (Bernard et al. 2010, Mojo et al. 2013, Wilcox and Abbott 2006, Shiferaw et al. 2009). Effects on farm workers are not that clear either. Although contracting often involves labour-intensive crops such as horticulture and thereby generates jobs, almost no information exists on their wages or the consequences for their welfare. Some of the few studies report low wages and hardship for labour working on contracted smallholdings, as seen on those growing vegetables for export in Kenya (Wilshaw 2013). On the other hand, the welfare of labourers on small estates growing tomatoes for export in Senegal was improved by these jobs (Maertens & Swinnen 2009). Effects within households are rarely studied. Ample evidence, however, indicates that increased household income is not sufficient for improved wellbeing of all household members, and in particular that the distribution and control of income by women and men can have differential effects on household investments and welfare outcomes, for example nutrition (Meinzen-Dick et al. 2012). Sales to aggregating entities (POs and formal buyers) are often dominated by men. An overview of the African literature on this subject (Njuki et al. 2011) found that ‘linking farmers to markets seems to trigger a production increase and an increase in the marketed quantities. The downside to this is that men seem to get interested and women seem to lose control of commodities with good market value.’ Moreover, formalization of marketing channels can lead to take-over by men of traditional female responsibilities for marketing, for example in milk. Aid projects often push for the inclusion of women in schemes, including as leaders, and this can lead to positive outcomes in the short term (Fischer and Qaim 2012, Technoserve 2013, USAID 2015). However, we could not find any evidence on long term changes and sustainability of this approach. There is potentially a tension between calls for ‘local ownership’ and the fact that many POs and programmes reproduce existing social inequalities (Vorley et al. 2012). For example, Barham and Chitemi (2009) found in Tanzania that all-female POs and POs with female leaders were less likely to improve their market
18 However, this is not always the case. Wollni and Fischer (2012) found for Costa Rica coffee cooperatives that the opposite was true: small and large farmers tend to sell the highest proportion through the cooperative, with most side-selling taking place in the middle group.
26
situation, partly because women had less spare time to search for new market opportunities, and because they had less access to economic and political networks than men.
4.2 Principles of successful enhanced aggregation The following principles — in part derived from USAID’s (2015 useful advice, reproduced in full at Annex A — apply to setting up and operating collective marketing and contracting: First and foremost, follow what should be a golden rule: do not complicate matters unless the gains clearly and decisively outweigh the additional transactions costs. Cooperation whether it be among a group of farmers or between a main buyer and contracted farmers is costly. Even if these costs are largely intangible — the time taken to reach agreements, the ongoing monitoring to ensure compliance, and the repeated demands for patience and goodwill that build trust — they can be onerous. Only if the gains clearly outweigh the bother, should such schemes be established. (Curtis 1991, Johnston & Clarke 1982, Williamson 1996) This is why even in OECD countries the majority of produce aggregation takes place in spot market deals between individual farmers and main buyers or their intermediaries. This is why, in developing countries, so much marketing is informal, a point we will return to at the end. Second, and following closely from the first point, make sure there is a business case for the scheme being promoted. That may seem so obvious as to be not worth saying, but some widely-held beliefs, such as that informal traders always exploit farmers, can obscure whether the proposed collective will really obtain higher prices for members. Another odd and unhelpful idea is that since processing adds value, then processors must pay a better price than traders who deal in fresh produce.19 Third, see the system as a whole, rather than obsess over components. Here we have tried to limit the discussion to changes in forms of aggregation. But as documented, policies and programmes rarely affect only the way in which produce is aggregated. Contemporary analysis thus tends to emphasise the need to examine the whole of the value chain20 to identify bottlenecks that can be alleviated (Campbell 2010, Fintrac 2014, Haggblade et al. 2012, Hellin et al. 2005, Nakuni & Paniagua 2013, and Technoserve 2013).
Programs with a comprehensive approach that included all aspects and market channels of a value chain [formal and informal] yielded the strongest results. Where this was not done the programs were less effective. The marketing part of the value chains for many of the ...
19 Most fresh fruit and vegetables sell for much more in the market than canned or frozen versions. So why are these items ever canned or frozen? Seasonality explains most of this. Fresh peas at harvest time may be well paid but only until the market is glutted with peas. Excess peas are worth next to nothing, but canned or frozen to be sold later in the year, they have value. In Africa, canneries have more than once been set up to provide an outlet for otherwise unsaleable vegetables. Farmers, however, have expected to be paid the price for fresh produce, rather than the discounted price for canned produce. To make matters worse, the farmers have often been encouraged to intensify their production by spending much more on seed, fertiliser, chemicals and even irrigation: investments that might have paid off, had the price of produce been high. In retrospect, such schemes were always going to struggle to create margins for both farmers and processors. The lesson has usually been learned the hard way.
20 Haggblade et al. 2012 argue that value chain studies can be readily carried out without advanced formal education and hence represent a way that farmers and those who work with them in the field can gain insights that may help reduce the asymmetries of knowledge and power when they interact with corporations:
‘The business school graduates who drive corporate strategy at large agribusiness firms conduct proprietary market assessments that form the basis for internal strategic plans. Serving as a counterweight, value chain assessments provide open-source, countervailing analytical and diagnostic power on behalf of the least powerful members of global value chains, the rural poor.’
27
selected crops was weak or not assessed in a systemic way. More robust results could have been achieved with a value chain approach to markets and marketing. Similarly, the near-complete focus on formal market channels ... limited the potential for expanded results. (USAID 2012, p. 18)
Fourth, rural systems are almost always heavily embedded in their natural and social local contexts. That means that archetypal schemes can rarely be applied without some adaptation to local circumstances: blueprints rarely work. That then implies the next four principles. Fifth, work with substance, rather than form. That usually means working with individuals and groups, taking their interests and motivations seriously, then designing structures and systems that are likely to enhance motivation within the local circumstances. Fifth, gradual, often marginal changes, implemented step by step are more likely to succeed than quantum leaps. Sixth, be prepared for modest, but rewarding, rates of progress, and occasional reverses. Monitor outcomes, learn through trials, and when there is error, correct it. It is usually only by luck that things work first time. Many development programmes that have transformed people’s lives went through several revisions before they reached a working model. This advice is in line with both longstanding wisdom about rural development (see for example Korten 1980 in a much-cited review of Asian grass-roots development); and more recent insights that have created a stir, such as the ‘doing development differently’ initiative (http://doingdevelopmentdifferently.com/; and see Andrews et al. 2012 on ‘Problem-Driven Iterative Adaptation’). Seventh, and perhaps as important as any of these principles, recognise that economic and business conditions change. Markets grow, they may integrate, new competitors enter, new policies and regulations appear — and so on; so that the volume, price and standards for farm produce are moving targets. Good schemes adapt to change. Indeed, some reports indicate that forms of contracting, such as price formulas rather than fixed prices that allow flexible responses, have more chance of working and being sustained than more rigid schemes.
4.2.1 Final reflection: respect informality A final reflection concerns informality and the dangers of being overly impressed by novel, sophisticated interventions. Despite the changing nature of some agricultural marketing in the developing world, informal channels still handle the bulk of produce in most low-income countries; for example, over 80% of milk in India and East Africa. Indeed, it may be that no more than 2–10% of smallholders market through formal channels (Vorley et al. 2012). As markets grow and differentiate, with varying demands from intermediaries and end consumers, so some informal channels thrive. Hence much as more formal and sophisticated forms of marketing should be promoted where they deliver benefits, such interventions may not always be appropriate and may confer undue attention on smallholders with advantages, to the detriment of many more with lesser endowments. Informal marketing benefits from public goods, such as roads and power; and from standards such as weights and measures. So too do more sophisticated forms of marketing. Hence those seeking to help farmers market their produce should not neglect such public investments that can complement more ambitious measures.
28
References
Abebe, Gumataw K., Jos Bijman, Ron Kemp, Onno Omta, and Admasu Tsegaye. "Contract
farming configuration: Smallholders’ preferences for contract design attributes." Food Policy 40 (2013): 14-24.
Andrews, Matt, Lant Pritchett, and Michael Woolcock. 2012. “Escaping Capability Traps through Problem-Driven Iterative Adaptation (PDIA).” CGD Working Paper 299. Washington, D.C.: Center for Global Development. http://www.cgdev.org/content/publications/detail/1426292
Ashraf N, Giné X and Karlan D (2009) Finding Missing Markets (and a Disturbing Epilogue): Evidence from an Export Crop Adoption and Marketing Intervention in Kenya. American Journal of Agricultural Economics 91(4): 973–990.
Barrett, Christopher B. & Emelly Mutambatsere, 2008, ‘Marketing boards’, in Lawrence E. Blume and Steven N. Durlauf, editors, The New Palgrave Dictionary of Economics, 2nd Edition, London: Palgrave Macmillan
Barrett, Christopher B., Maren E. Bachke, Marc F. Bellemare, Hope C. Michelson, Sudha Narayanan, Thomas F. Walker 2012, ‘Smallholder Participation in Contract Farming: Comparative Evidence from Five Countries,’ World Development, 40 (4), 715–730 10.1016/j.worlddev.2011.09.006.
Bellemare, Marc F. "As you sow, so shall you reap: The welfare impacts of contract farming." World Development 40, no. 7 (2012): 1418-1434.
Bellemare, Marc F. 2015, Contract Farming: What’s In It for Smallholder Farmers in Developing Countries? Choices, 30 (3), 1–4
Berdegue J (2002) Learning to beat Cochrane’s treadmill. Public policy, markets and social learning in Chile’s small-scale agriculture. In C. Leeuwis & R. Pyburn (Eds.), Wheelbarrows full of frogs: Social learning in rural resource management: 333–348.
Bernard T and Spielman DJ (2009) Reaching the rural poor through rural producer organizations? A study of agricultural marketing cooperatives in Ethiopia. Food Policy 34(1): 60–69.
Bernard T, Collion M-H, De Janvry A, et al. (2008) Do village organizations make a difference in African rural development? A study for Senegal and Burkina Faso. World Development 36(11): 2188–2204.
Bernard T, Spielman DJ, Seyoum Taffesse A, et al. (2010) Cooperatives for staple crop marketing: Evidence from Ethiopia. IFPRI. Available from: http://www.ifpri.org/sites/default/files/publications/rr164.pdf.
Bernard T, Taffesse AS and Gabre ‐Madhin E (2008) Impact o smallholders’ commercialization behaviour: evidence from Ethiopia. Agricultural Economics 39(2): 147–161.
Bijman, Jos 2008, Contract farming in developing countries: an overview, Working Paper, Wageningen, NL: Wageningen University
Cadilhon, Jean ‐Joseph, Paule Moustier, Nigel D. Poole, Phan Thi Giac Tam, and Andrew P. Fearne. "Traditional vs. modern food systems? Insights from vegetable supply chains to Ho Chi Minh City (Vietnam)." Development Policy Review 24, no. 1 (2006): 31-49.
Cai, Junning, Luyna Ung, Sununtar Setboonsarng, and PingSun Leung 2008, ‘Rice Contract Farming in Cambodia: Empowering Farmers to Move Beyond the Contract Toward Independence’, ADBI Discussion Paper 109, Tokyo: Asian Development Bank Institute —http://www.adbi.org/discussionpaper/2008/06/05/2582.rice.contract.farming.cambodia
Campbell, Ruth 2010, ‘Implementation best practices for value chain development projects’, MicroREPORT #167, September 2010, Washington DC: USAID
29

Curtis, D., 1991, Beyond government: organisations for common benefit, Macmillan, London & Basingstoke
De Janvry A and Sadoulet E (2004) Toward a territorial approach to rural development: International experiences and implications for Mexico’s Microregions Strategy. Photocopy, University of California at Berkeley, Berkeley, CA. Available from: https://www.researchgate.net/profile/Elisabeth_Sadoulet/publication/5021692_Toward_a_territorial_approach_to_rural_development/links/54aeab3c0cf2b48e8ed45953.pdf.
DFID (2014) How to Note: Assessing the Strength of Evidence. Available from: https://www.gov.uk/government/publications/how-to-note-assessing-the-strength-of-evidence (accessed 10 June 2013).
Fintrac (2014) The Market Systems Approach in the Agricultural Sector. Fintrac Topic Papers, Volume 2 June 2014. Available from: http://www.seepnetwork.org/the-market-systems-approach-in-the-agricultural-sector--sustainable-service-delivery-for-smallholder-farmers-resources-1322.php (accessed 19 March 2016).
Fischer E and Qaim M (2012) Gender, agricultural commercialization, and collective action in Kenya. Food Security 4(3): 441–453.
Francesconi GN and Ruben R (2007) Impacts of Collective Action on Smallholders’ Commercialisation: Evidence from Dairy in Ethiopia. In: 103rd Seminar, April 23-25 2007, Barcelona, Spain, European Association of Agricultural Economists. Available from: http://ageconsearch.umn.edu/handle/9418.
Francesconi GN and Wouterse F (2015) Promoting the role of farmer ‐based organiza for value chain integration: the tension between a program’s targeting and an organization’s investment strategy. Agricultural Economics 46(4): 527–536.
Freguin-Gresh, Sandrine, Marijke d'Haese, and Ward Anseeuw. "Demythifying contract farming: Evidence from rural South Africa." Agrekon 51.3 (2012): 24–51
Grosh, Barbara, 1994, 'Contract farming in Africa: an application of the New Institutional Economics', Journal of African Economies, 3 (2) 231–61
Guarín, Alejandro. "The value of domestic supply chains: producers, wholesalers, and urban consumers in Colombia." Development Policy Review 31, no. 5 (2013): 511-530.
Haggblade, Steven, Veronique Theriault, John Staatz, Nango Dembele & Boubacar Diallo 2012, ‘A Conceptual Framework for Promoting Inclusive Agricultural Value Chains’, September 2012, prepared for the International Fund for Agricultural Development (IFAD), Improving the Inclusiveness of Agricultural Value Chains in West Africa, Department of Agricultural, Food and Resource Economics, Michigan State University, East Lansing, MI
Hellin J, Lundy M and Meijer M (2009) Farmer organization, collective action and market access in Meso-America. Food Policy, Collective Action for Smallholder Market Access 34(1): 16–22.
Hellin, Jon, Alison Griffith & Mile Albu 2005, Mapping the market: market-literacy for agricultural research and policy to tackle rural poverty in Africa, Paper to DFID Crop Post Harvest Workshop Beyond Agriculture: Making Markets work for the Poor, London 28 Feb–1 March 2005
Holloway G, Nicholson C, Delgado C, et al. (2000) Agroindustrialization through institutional innovation Transaction costs, cooperatives and milk ‐market developme east ‐African highlands. Agricultural economics –288.
IEG (2011) Growth and Productivity in Agriculture and Agribusiness: Evaluative Lessons from World Bank Group Experience. World Bank Independent Evaluation Group. Available from: http://siteresources.worldbank.org/EXTGPAA/Resources/Agribusiness_eval.pdf.
Ito J, Bao Z and Su Q (2012) Distributional effects of agricultural cooperatives in China: Exclusion of smallholders and potential gains on participation. Food Policy 37(6): 700–709.
Johnston, Bruce F. & William C. Clark, 1982, Redesigning rural development: a strategic perspective, Johns Hopkins University Press, Baltimore & London, Chapter 5
30
Karamchandani A, Kubzansky M and Frandano P (2009) Emerging markets, emerging models: Market-based solutions to the challenges of global poverty. Monitor Group, March.
Kolavalli, Shashi & Marta Vigneri, 2011, ‘Cocoa in Ghana: Shaping the Success of an Economy’, in Punam Chuhan-Pole & Manka Angwafo, Eds, Yes Africa can. Success stories from a dynamic continent, Washington DC, World Bank
Korten, D C, 1980, ‘Community organisation and rural development: a learning process approach’, Public Administration Review, Sept/Oct 1980
Kubzansky M, Cooper A and Barbary V (2011) Promise and Progress: Market-based solutions to poverty in Africa. Monitor. Available from: http://web.mit.edu/idi/idi/Africa-%20PromiseAndProgress-MIM.pdf.
Kudadjie-Freeman, Comfort, Paul Richards & Paul C. Struik 2008, ‘Unlocking the Potential of Contract Farming: Lessons from Ghana’, Gatekeeper Series 139, International Institute for Environment and Development, London
Ma W and Abdulai A (2016) Does cooperative membership improve household welfare? Evidence from apple farmers in China. Food Policy 58: 94–102.
Maertens, Miet & Johan F.M. Swinnen, 2009, Trade, Standards, and Poverty: Evidence from Senegal, World Development, 37 (1), 161–178
Meinzen-Dick R, Behrman J, Menon P, et al. (2012) Gender: A key dimension linking agricultural programs to improved nutrition and health. Reshaping agriculture for nutrition and health: 135–144.
Mellor JW (2009) New Challenges and Opportunities in Low and Middle-Income Countries: Measurements for Tracking Indicators of Cooperative Success (METRICS). United States Overseas Cooperative Development Council and United States Agency for International Development. Available from: https://www.nreca.coop/wp-content/uploads/2013/07/metrics-3.pdf.
Minot, Nicholas 2011, ‘Contract farming in Africa: Opportunities and Challenges ‘ Presented at the AAMP Policy Seminar “Successful Smallholder Commercialization” 22 April 2011 Lemigo Hotel, Kigali, Rwanda
Minten, Bart, Lalaina Randrianarison & Johan F.M. Swinnen. 2011, ‘Global Retail Chains and Poor Farmers: Evidence from Madagascar’, World Development, 37 (11), 1728–41
Mitchell J and Leturque H (2011) WFP 2008–2013 Purchase for Progress (P4P) Initiative: A Strategic Evaluation (mid-term). Rome, Italy, World Food Programme.
Moustier P, Loc NTT, Son HT, et al. (2007) Promotion of public-private dialogue to maintain poor-friendly fruit and vegetable street vending in Hanoi. In: II International Symposium on Improving the Performance of Supply Chains in the Transitional Economies 794, pp. 239–246.
Nankhuni F and Paniagua G (2013) Meta-Evaluation Of Private Sector Interventions in Agribusiness: Finding Out What Worked in Access to Finance and Farmer/Business Training. International Finance Corporation. Available from: http://www.ifc.org/wps/wcm/connect/1b6d2580413424efabc0bbdf0d0e71af/CDI_Agribusiness_Meta_Evaluation.pdf?MOD=AJPERES.
Narayanan, Sudha 2014, ‘Profits from participation in high value agriculture: Evidence of heterogeneous benefits in contract farming schemes in Southern India’, Food Policy, 44, 142–157
Njuki J, Kaaria S, Chamunorwa A, et al. (2011) Linking Smallholder Farmers to Markets, Gender and Intra-Household Dynamics: Does the Choice of Commodity Matter? The European Journal of Development Research 23(3): 426–443.
Ochieng, Cosmas Milton Obote. "Development through positive deviance and its implications for economic policy making and public administration in Africa: The case of Kenyan agricultural development, 1930–2005." World Development 35, no. 3 (2007): 454-479.
31

OIG (2012) Review of USAID Cooperative Development Programs. Office of Inspector General (OIG), USAID. Available from: https://oig.usaid.gov/sites/default/files/audit-reports/9-000-12-001-s.pdf.
Okello J, Narrod C and Roy D (2009) Smallholder Compliance with International Food Safety Standards is Not a Fantasy: Evidence from African Green Bean Producers. Standard Bearers: Horticultural Exports and Private standards in Africa. Available from: http://r4d.dfid.gov.uk/PDF/Outputs/EcoDev/60506-fp15.pdf.
Okello JJ, Narrod C and Roy D (2007) Food safety requirements in African green bean exports and their impact on small farmers. Intl Food Policy Res Inst. Available from: http://core.ac.uk/download/pdf/6337666.pdf.
Oya, Carlos 2012, ‘Contract farming in Sub-Saharan Africa: a survey of approaches, debates and issues’, Journal of Agrarian Change, 12 (1), January 2012, 1–33
Porter ME (1998) Cluster and the new economics of competition. Available from: http://www.rimisp.org/wp-content/uploads/2012/07/31_rimisp_Cardumen.pdf.
Porter, Gina & Kevin Phillips-Howard, 1997, ‘Comparing contracts: an evaluation of contract farming schemes in Africa’, World Development 25 (2) 227–38
Prowse, Martin 2012, ‘Contract Farming in Developing Countries - A Review’, A Savoir 12, Paris: Agence Française de Développement
Roesel K and Grace D (2014) Food Safety and Informal Markets: Animal Products in Sub-Saharan Africa. Routledge. Available from: http://www.rr-africa.oie.int/docspdf/en/2015/Food_Safety_and_Informal_Markets.pdf.
Roy D and Thorat A (2008) Success in High Value Horticultural Export Markets for the Small Farmers: The Case of Mahagrapes in India. World Development, Special Section (pp. 2045-2102). The Volatility of Overseas Aid 36(10): 1874–1890.
Saenger C, Torero M and Qaim M (2013) Impact of Third-Party Enforcement of Contracts in Agricultural Markets–A Field Experiment in Vietnam. GlobalFood Discussion Papers. Available from: http://www.econstor.eu/bitstream/10419/90613/1/GlobalFood_DP18.pdf.
Shanoyan A, Brent Ross R, Gow HR, et al. (2014) Long-term sustainability of third-party facilitated market linkages: Evidence from the USDA marketing assistance program in the Armenian dairy industry. Food Policy 46: 157–164.
Sharma VP (2015) Determinants of Small Milk Producers’ Participation in Organized Dairy Value Chains: Evidence from India. Agricultural Economics Research Review 28(2): 247–261.
Sharma VP, Kumar K and Singh RV (2008) Determinants, Costs, and Benefits of Small Farmer inclusion in Restructured Agrifood Chains: A Case Study of Dairy Industry in India. Micro study report (Module 3) of Component 1. Available from: http://www.ifama.org/files/conf/2009/Symposium/1209_paper.pdf.
Singh, Sukhpal. "Contracting out solutions: Political economy of contract farming in the Indian Punjab." World Development 30, no. 9 (2002): 1621-1638.
Smalley, Rebecca 2013, Plantations, Contract Farming and Commercial Farming Areas in Africa: A Comparative Review, Working Paper 055, Brighton, UK: Future Agricultures Consortium
Swanson R (2009) Final Evaluation of Land O’Lakes Zambia Title II Development Assistance Program (March 1 2004 – September 30 2009) Dairy Development FFP DAP for Vulnerable Populations in Zambia (TA No. FFP-A-00-04-00001-00). USAID Food for Peace. Available from: http://www.fsnnetwork.org/sites/default/files/final_evalution_of_zambia_title_ii.pdf.
Swinnen, Johann F. M. & Anneleen Vandeplas 2007, Contracting, Competition and Rent Distribution. Theory and empirical evidence from developing and transition countries, Paper prepared for presentation at the I Mediterranean Conference of Agro-Food Social Scientists. 103rd EAAE Seminar ‘Adding Value to the Agro-Food Supply Chain in the Future Euromediterranean Space’. Barcelona, Spain, April 23rd - 25th 2007
32
Technoserve & IFAD 2011, Outgrower schemes. Enhancing profitability, Technical Brief, September 2011, Rome
Technoserve (2013) Lessons Learned: The Coffee Initiative 2008 to 2011. Available from: http://www.technoserve.org/files/downloads/coffee-initiative-lessons-learned.pdf.
Ton G (2008) Challenges for smallholder market access: a review of literature on institutional arrangements in collective marketing. Stewart Postharvest Review 4(5): 1–6.
Ton G (2010) Resolving the Challenges Of Collective Marketing: incentive structures that reduce the tensions between members and their group. ESFIM Policy Brief 4.
Ton G, Vellema S and De Ruyter De Wildt M (2011) Development impacts of value chain interventions: how to collect credible evidence and draw valid conclusions in impact evaluations? Journal on chain and network science 11(1): 69–84.
Ton, Giel, Wytse Vellema, Marijke D’Haese, Sam Desiere, and others 2015, Systematic Review of the Effectiveness of Contract Farming for Income and Food Security of Smallholder Farmers in Low- and Middle Income Countries, Protocol, for 3ie Systematic Review – SR6.1088, Wageningen & Gent
USAID (2012) Multi-Stakeholder Evaluation of Agriculture and Livestock Value Chain Activities In Kenya. Development & Training Services, Inc. (dTS) for USAID. Available from: http://pdf.usaid.gov/pdf_docs/pdacu017.pdf.
USAID (2015) Scaling Impact: Improving smallholder farmers’ beneficial access to output markets. Available from: http://www.value-chains.org/dyn/bds/docs/933/Scaling_Impact_Output_Markets_Report(2).pdf (accessed 19 March 2016).
Vandeplas A, Minten B and Swinnen J (2013) Multinationals vs. cooperatives: The income and efficiency effects of supply chain governance in India. Journal of Agricultural Economics 64(1): 217–244.
Väth, Susanne Johanna, and Michael Kirk. "Do Land Ownership and Contract Farming Matter? Evidence from a large-scale investment in Ghana." (2013). Paper presented at the 4th International Conference of the African Association of Agricultural Economists, September 22–25 2013, Hammamet, Tunisia
Verhofstadt E and Maertens M (2014) Can Agricultural Cooperatives Reduce Poverty? Heterogeneous Impact of Cooperative Membership on Farmers’ Welfare in Rwanda. Applied Economic Perspectives and Policy: ppu021.
Vorley B, del Pozo-Vergnes E and Barnett A (2012) What organisations for what farmers? Matches and mismatches between individual and collective agency. In: Small producer agency in the globalised market: Making choices in a changing world, IIED/HIVOS, pp. 36–47. Available from: http://www.bibalex.org/Search4Dev/files/436824/467323.pdf.
Vorley, Bill & Felicity Proctor 2008, Inclusive Business in Agrifood Markets: Evidence and Action. A report based on proceedings of an international conference held in Beijing, March 5–6 2008, Regoverning Markets. Small-scale producers in modern agrifood markets
Vorley, Bill, Ethel del Pozo-Vergnes & Anna Barnett 2012, Small producer agency in the globalised market: Making choices in a changing world, IIED, London; HIVOS, The Hague
Warning, M., Key, N. (2002). The social performance and distributional consequences of contract farming: an equilibrium analysis of the Arachide de Bouche program in Senegal. World Development (Oxford). 30: 255-263.
Wilcox MD and Abbott PC (2006) Can Cocoa Farmer Organizations Countervail Buyer Market Power? In: American Agricultural Economics Association Annual Meeting. Available from: http://ageconsearch.umn.edu/bitstream/21261/1/sp06wi02.pdf.
Wiggins, Steve & Sharada Keats, 2013. Leaping and Learning: Linking smallholders to markets in Africa. London: Agriculture for Impact, Imperial College and Overseas Development Institute
Williamson, Oliver, 1996, ‘Economics and organization: a primer’, California Management Review, 38 (2), 131–146
33
Xhoxhi, Orjon, Søren Marcus Pedersen, Kim Martin Lind, and Attila Yazar. "The Determinants of Intermediaries’ Power over Farmers’ Margin-Related Activities: Evidence from Adana, Turkey." World Development 64 (2014): 815-827
Zeeuw H de and Drechsel P (2015) Cities and Agriculture: Developing Resilient Urban Food Systems. Routledge.
34
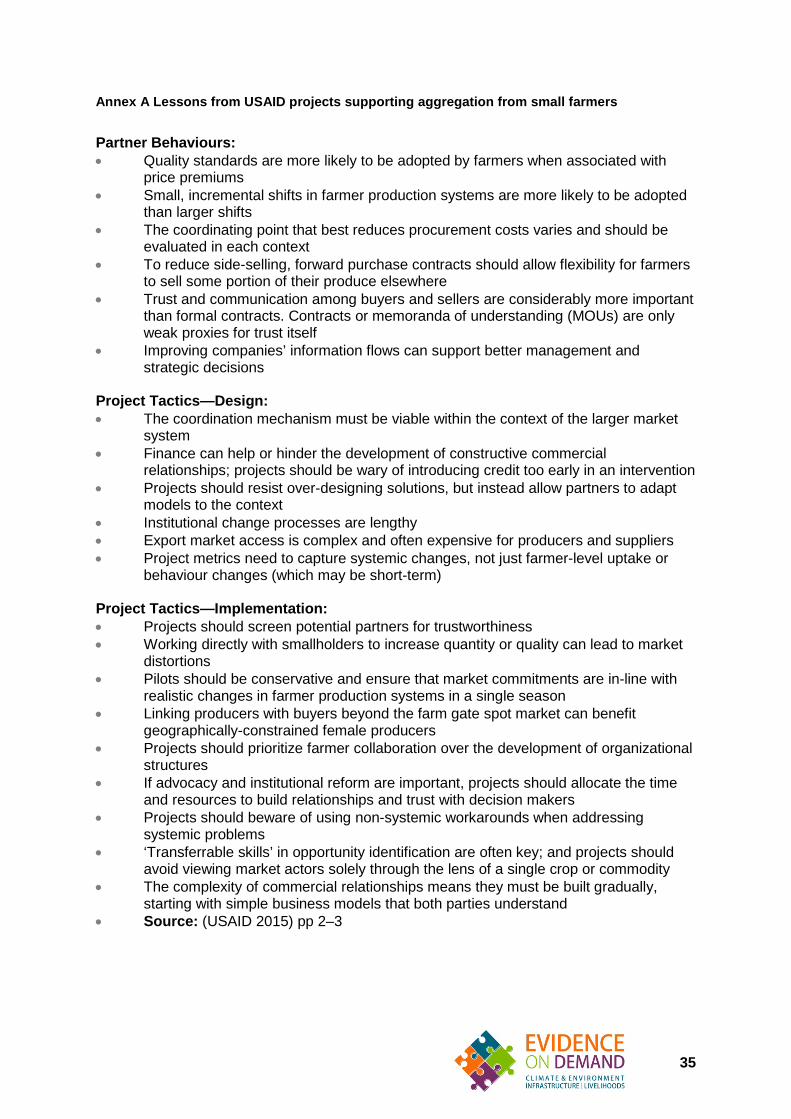
Annex A Lessons from USAID projects supporting aggregation from small farmers
Partner Behaviours: • Quality standards are more likely to be adopted by farmers when associated with
price premiums • Small, incremental shifts in farmer production systems are more likely to be adopted
than larger shifts • The coordinating point that best reduces procurement costs varies and should be
evaluated in each context • To reduce side-selling, forward purchase contracts should allow flexibility for farmers
to sell some portion of their produce elsewhere • Trust and communication among buyers and sellers are considerably more important
than formal contracts. Contracts or memoranda of understanding (MOUs) are only weak proxies for trust itself
• Improving companies’ information flows can support better management and strategic decisions
Project Tactics—Design: • The coordination mechanism must be viable within the context of the larger market
system • Finance can help or hinder the development of constructive commercial
relationships; projects should be wary of introducing credit too early in an intervention • Projects should resist over-designing solutions, but instead allow partners to adapt
models to the context • Institutional change processes are lengthy • Export market access is complex and often expensive for producers and suppliers • Project metrics need to capture systemic changes, not just farmer-level uptake or
behaviour changes (which may be short-term) Project Tactics—Implementation: • Projects should screen potential partners for trustworthiness • Working directly with smallholders to increase quantity or quality can lead to market
distortions • Pilots should be conservative and ensure that market commitments are in-line with
realistic changes in farmer production systems in a single season • Linking producers with buyers beyond the farm gate spot market can benefit
geographically-constrained female producers • Projects should prioritize farmer collaboration over the development of organizational
structures • If advocacy and institutional reform are important, projects should allocate the time
and resources to build relationships and trust with decision makers • Projects should beware of using non-systemic workarounds when addressing
systemic problems • ‘Transferrable skills’ in opportunity identification are often key; and projects should
avoid viewing market actors solely through the lens of a single crop or commodity • The complexity of commercial relationships means they must be built gradually,
starting with simple business models that both parties understand • Source: (USAID 2015) pp 2–3
35
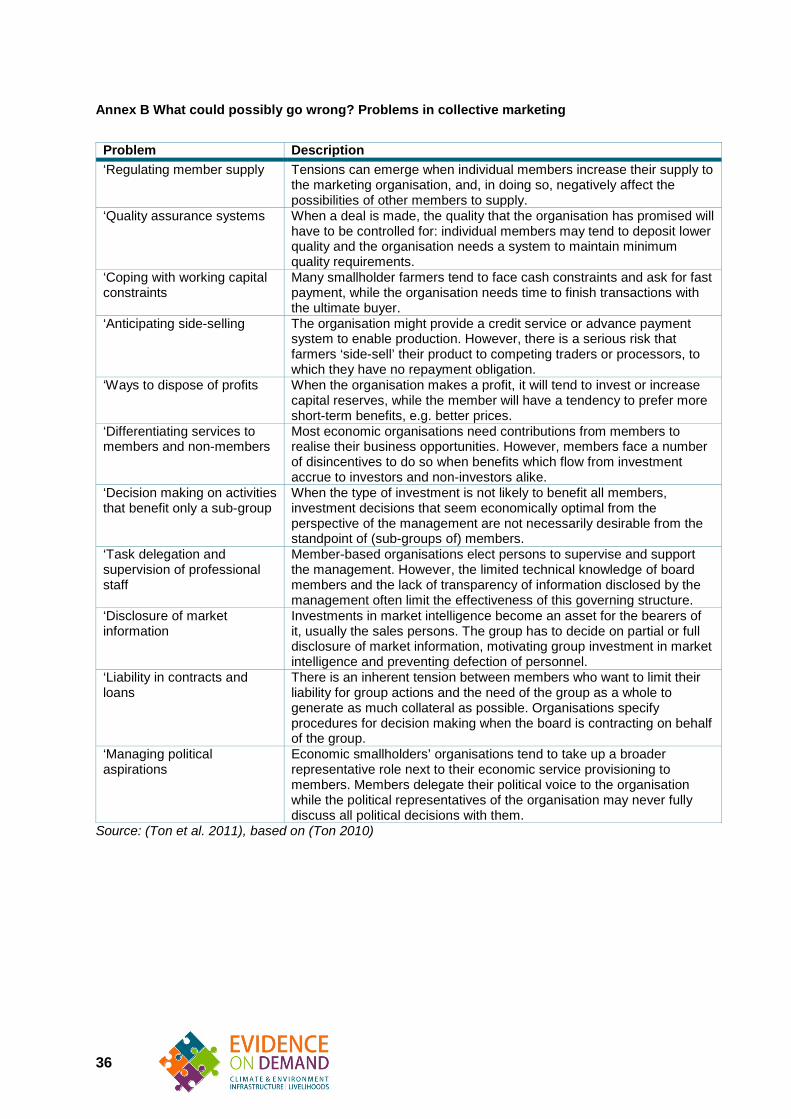
Annex B What could possibly go wrong? Problems in collective marketing
Problem Description ‘Regulating member supply Tensions can emerge when individual members increase their supply to
the marketing organisation, and, in doing so, negatively affect the possibilities of other members to supply.
‘Quality assurance systems When a deal is made, the quality that the organisation has promised will have to be controlled for: individual members may tend to deposit lower quality and the organisation needs a system to maintain minimum quality requirements.
‘Coping with working capital constraints
Many smallholder farmers tend to face cash constraints and ask for fast payment, while the organisation needs time to finish transactions with the ultimate buyer.
‘Anticipating side-selling The organisation might provide a credit service or advance payment system to enable production. However, there is a serious risk that farmers ‘side-sell’ their product to competing traders or processors, to which they have no repayment obligation.
‘Ways to dispose of profits When the organisation makes a profit, it will tend to invest or increase capital reserves, while the member will have a tendency to prefer more short-term benefits, e.g. better prices.
‘Differentiating services to members and non-members
Most economic organisations need contributions from members to realise their business opportunities. However, members face a number of disincentives to do so when benefits which flow from investment accrue to investors and non-investors alike.
‘Decision making on activities that benefit only a sub-group
When the type of investment is not likely to benefit all members, investment decisions that seem economically optimal from the perspective of the management are not necessarily desirable from the standpoint of (sub-groups of) members.
‘Task delegation and supervision of professional staff
Member-based organisations elect persons to supervise and support the management. However, the limited technical knowledge of board members and the lack of transparency of information disclosed by the management often limit the effectiveness of this governing structure.
‘Disclosure of market information
Investments in market intelligence become an asset for the bearers of it, usually the sales persons. The group has to decide on partial or full disclosure of market information, motivating group investment in market intelligence and preventing defection of personnel.
‘Liability in contracts and loans
There is an inherent tension between members who want to limit their liability for group actions and the need of the group as a whole to generate as much collateral as possible. Organisations specify procedures for decision making when the board is contracting on behalf of the group.
‘Managing political aspirations
Economic smallholders’ organisations tend to take up a broader representative role next to their economic service provisioning to members. Members delegate their political voice to the organisation while the political representatives of the organisation may never fully discuss all political decisions with them.
Source: (Ton et al. 2011), based on (Ton 2010)
36
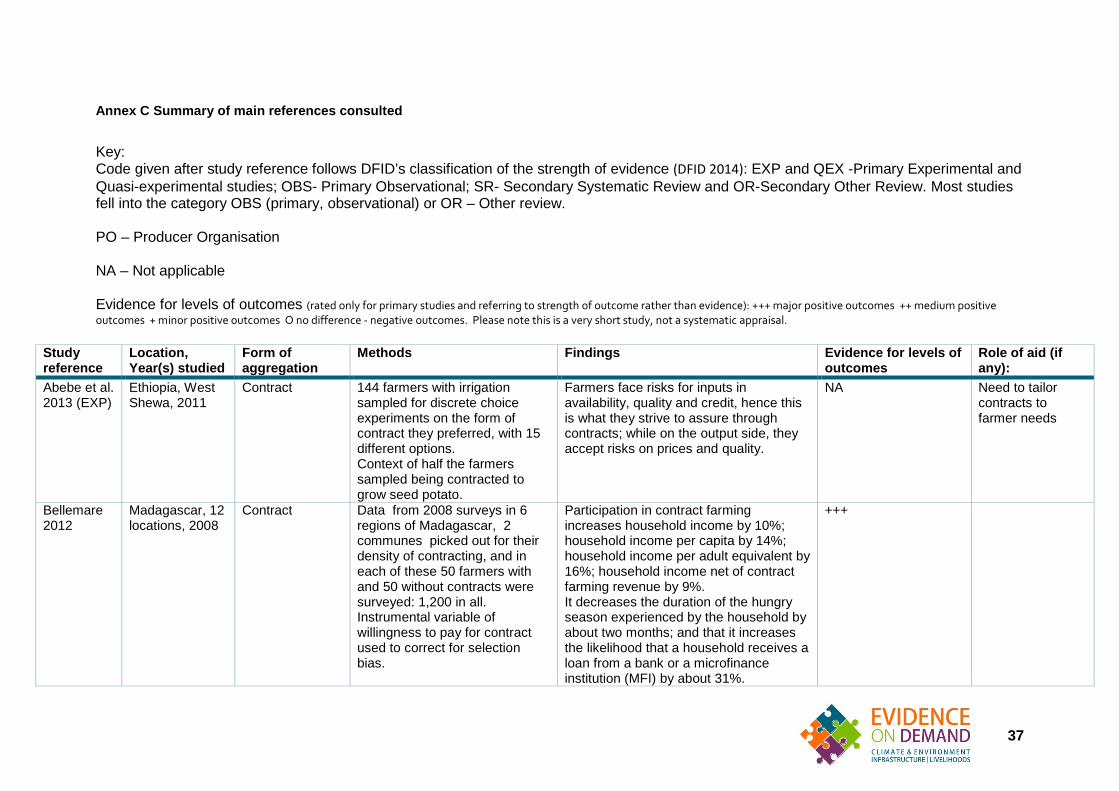
Annex C Summary of main references consulted
Key: Code given after study reference follows DFID’s classification of the strength of evidence (DFID 2014): EXP and QEX -Primary Experimental and Quasi-experimental studies; OBS- Primary Observational; SR- Secondary Systematic Review and OR-Secondary Other Review. Most studies fell into the category OBS (primary, observational) or OR – Other review. PO – Producer Organisation NA – Not applicable Evidence for levels of outcomes (rated only for primary studies and referring to strength of outcome rather than evidence): +++ major positive outcomes ++ medium positive outcomes + minor positive outcomes O no difference - negative outcomes. Please note this is a very short study, not a systematic appraisal.
Study reference
Location, Year(s) studied
Form of aggregation
Methods Findings Evidence for levels of outcomes
Role of aid (if any):
Abebe et al. 2013 (EXP)
Ethiopia, West Shewa, 2011
Contract 144 farmers with irrigation sampled for discrete choice experiments on the form of contract they preferred, with 15 different options. Context of half the farmers sampled being contracted to grow seed potato.
Farmers face risks for inputs in availability, quality and credit, hence this is what they strive to assure through contracts; while on the output side, they accept risks on prices and quality.
NA Need to tailor contracts to farmer needs
Bellemare 2012
Madagascar, 12 locations, 2008
Contract Data from 2008 surveys in 6 regions of Madagascar, 2 communes picked out for their density of contracting, and in each of these 50 farmers with and 50 without contracts were surveyed: 1,200 in all. Instrumental variable of willingness to pay for contract used to correct for selection bias.
Participation in contract farming increases household income by 10%; household income per capita by 14%; household income per adult equivalent by 16%; household income net of contract farming revenue by 9%. It decreases the duration of the hungry season experienced by the household by about two months; and that it increases the likelihood that a household receives a loan from a bank or a microfinance institution (MFI) by about 31%.
+++
37
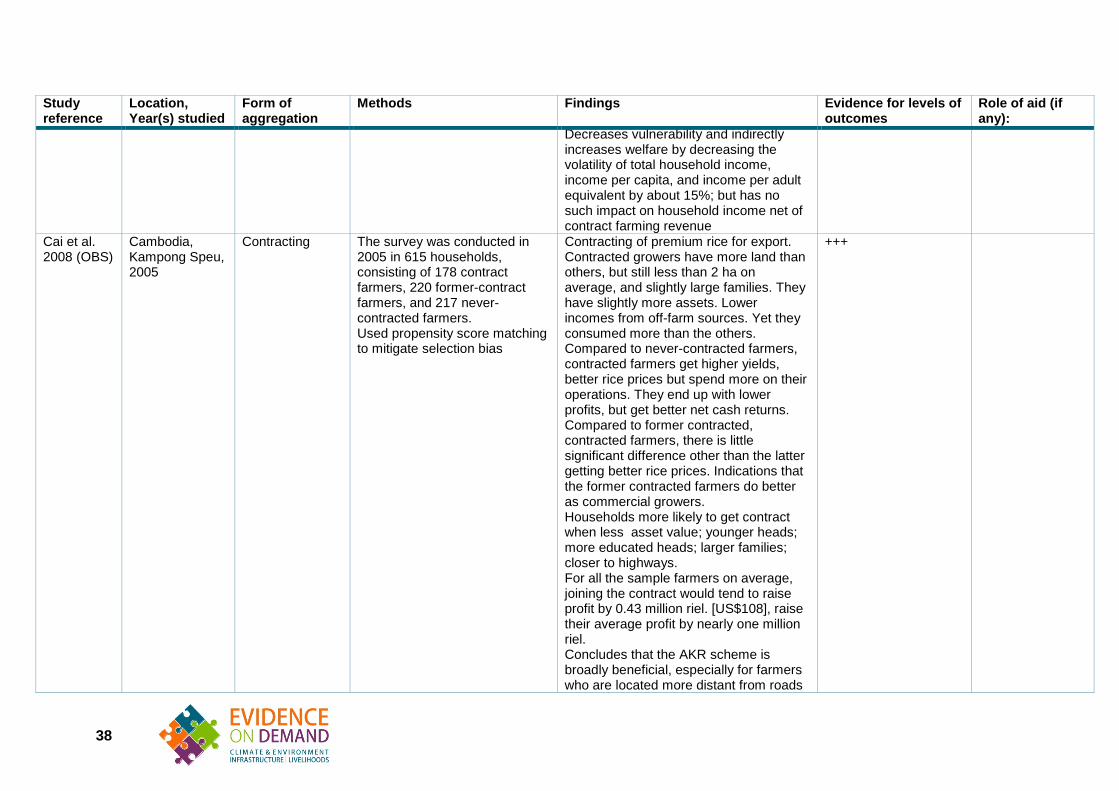
Study reference
Location, Year(s) studied
Form of aggregation
Methods Findings Evidence for levels of outcomes
Role of aid (if any):
Decreases vulnerability and indirectly increases welfare by decreasing the volatility of total household income, income per capita, and income per adult equivalent by about 15%; but has no such impact on household income net of contract farming revenue
Cai et al. 2008 (OBS)
Cambodia, Kampong Speu, 2005
Contracting The survey was conducted in 2005 in 615 households, consisting of 178 contract farmers, 220 former-contract farmers, and 217 never-contracted farmers. Used propensity score matching to mitigate selection bias
Contracting of premium rice for export. Contracted growers have more land than others, but still less than 2 ha on average, and slightly large families. They have slightly more assets. Lower incomes from off-farm sources. Yet they consumed more than the others. Compared to never-contracted farmers, contracted farmers get higher yields, better rice prices but spend more on their operations. They end up with lower profits, but get better net cash returns. Compared to former contracted, contracted farmers, there is little significant difference other than the latter getting better rice prices. Indications that the former contracted farmers do better as commercial growers. Households more likely to get contract when less asset value; younger heads; more educated heads; larger families; closer to highways. For all the sample farmers on average, joining the contract would tend to raise profit by 0.43 million riel. [US$108], raise their average profit by nearly one million riel. Concludes that the AKR scheme is broadly beneficial, especially for farmers who are located more distant from roads
+++
38
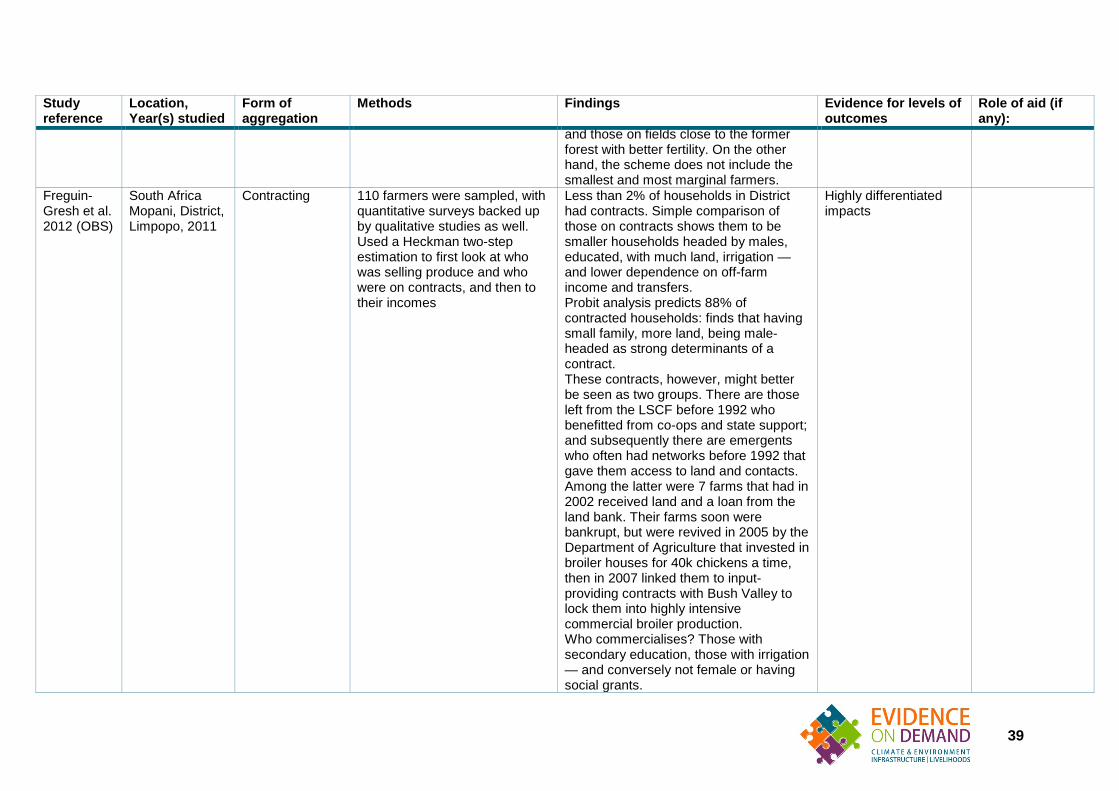
Study reference
Location, Year(s) studied
Form of aggregation
Methods Findings Evidence for levels of outcomes
Role of aid (if any):
and those on fields close to the former forest with better fertility. On the other hand, the scheme does not include the smallest and most marginal farmers.
Freguin-Gresh et al. 2012 (OBS)
South Africa Mopani, District, Limpopo, 2011
Contracting 110 farmers were sampled, with quantitative surveys backed up by qualitative studies as well. Used a Heckman two-step estimation to first look at who was selling produce and who were on contracts, and then to their incomes
Less than 2% of households in District had contracts. Simple comparison of those on contracts shows them to be smaller households headed by males, educated, with much land, irrigation — and lower dependence on off-farm income and transfers. Probit analysis predicts 88% of contracted households: finds that having small family, more land, being male-headed as strong determinants of a contract. These contracts, however, might better be seen as two groups. There are those left from the LSCF before 1992 who benefitted from co-ops and state support; and subsequently there are emergents who often had networks before 1992 that gave them access to land and contacts. Among the latter were 7 farms that had in 2002 received land and a loan from the land bank. Their farms soon were bankrupt, but were revived in 2005 by the Department of Agriculture that invested in broiler houses for 40k chickens a time, then in 2007 linked them to input-providing contracts with Bush Valley to lock them into highly intensive commercial broiler production. Who commercialises? Those with secondary education, those with irrigation — and conversely not female or having social grants.
Highly differentiated impacts
39
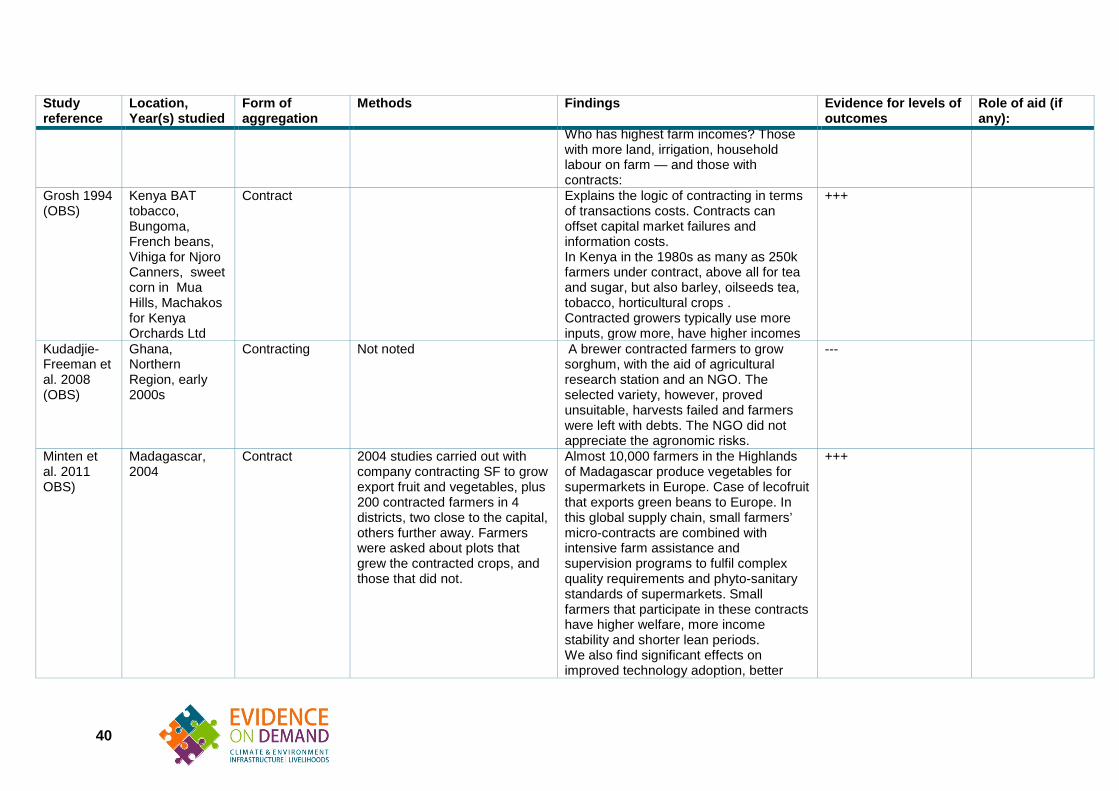
Study reference
Location, Year(s) studied
Form of aggregation
Methods Findings Evidence for levels of outcomes
Role of aid (if any):
Who has highest farm incomes? Those with more land, irrigation, household labour on farm — and those with contracts:
Grosh 1994 (OBS)
Kenya BAT tobacco, Bungoma, French beans, Vihiga for Njoro Canners, sweet corn in Mua Hills, Machakos for Kenya Orchards Ltd
Contract Explains the logic of contracting in terms of transactions costs. Contracts can offset capital market failures and information costs. In Kenya in the 1980s as many as 250k farmers under contract, above all for tea and sugar, but also barley, oilseeds tea, tobacco, horticultural crops . Contracted growers typically use more inputs, grow more, have higher incomes
+++
Kudadjie-Freeman et al. 2008 (OBS)
Ghana, Northern Region, early 2000s
Contracting Not noted A brewer contracted farmers to grow sorghum, with the aid of agricultural research station and an NGO. The selected variety, however, proved unsuitable, harvests failed and farmers were left with debts. The NGO did not appreciate the agronomic risks.
---
Minten et al. 2011 OBS)
Madagascar, 2004
Contract 2004 studies carried out with company contracting SF to grow export fruit and vegetables, plus 200 contracted farmers in 4 districts, two close to the capital, others further away. Farmers were asked about plots that grew the contracted crops, and those that did not.
Almost 10,000 farmers in the Highlands of Madagascar produce vegetables for supermarkets in Europe. Case of lecofruit that exports green beans to Europe. In this global supply chain, small farmers’ micro-contracts are combined with intensive farm assistance and supervision programs to fulfil complex quality requirements and phyto-sanitary standards of supermarkets. Small farmers that participate in these contracts have higher welfare, more income stability and shorter lean periods. We also find significant effects on improved technology adoption, better
+++
40
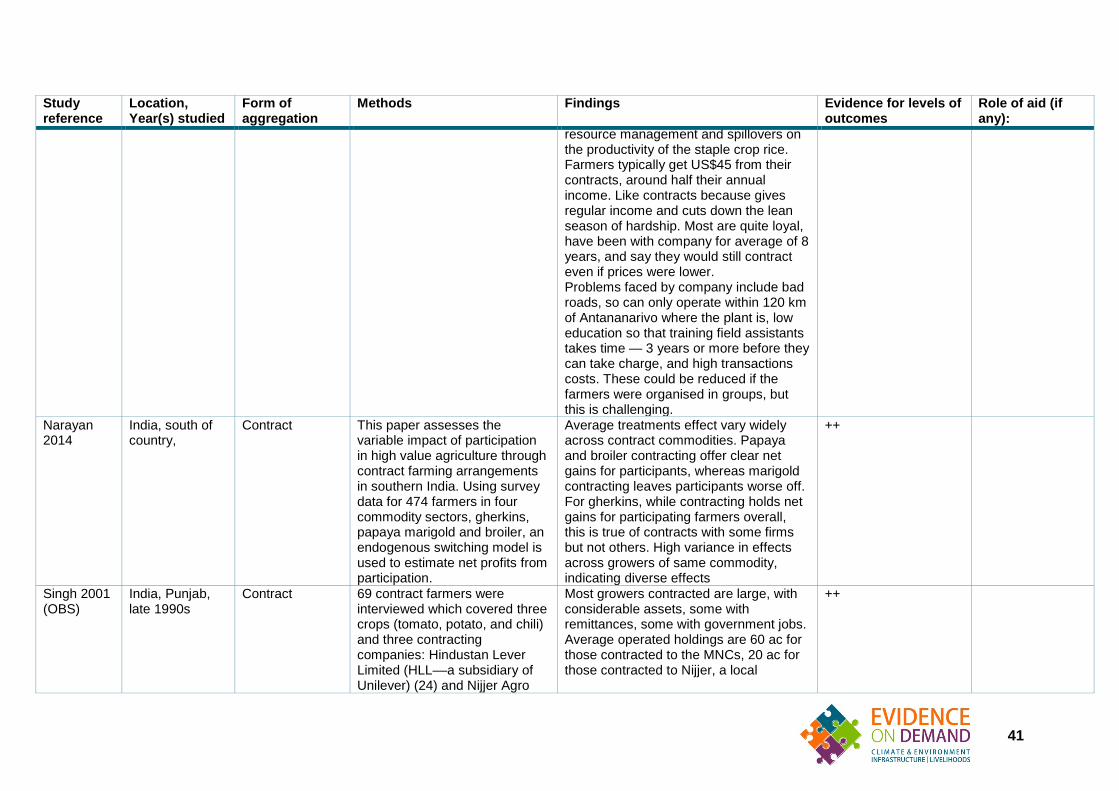
Study reference
Location, Year(s) studied
Form of aggregation
Methods Findings Evidence for levels of outcomes
Role of aid (if any):
resource management and spillovers on the productivity of the staple crop rice. Farmers typically get US$45 from their contracts, around half their annual income. Like contracts because gives regular income and cuts down the lean season of hardship. Most are quite loyal, have been with company for average of 8 years, and say they would still contract even if prices were lower. Problems faced by company include bad roads, so can only operate within 120 km of Antananarivo where the plant is, low education so that training field assistants takes time — 3 years or more before they can take charge, and high transactions costs. These could be reduced if the farmers were organised in groups, but this is challenging.
Narayan 2014
India, south of country,
Contract This paper assesses the variable impact of participation in high value agriculture through contract farming arrangements in southern India. Using survey data for 474 farmers in four commodity sectors, gherkins, papaya marigold and broiler, an endogenous switching model is used to estimate net profits from participation.
Average treatments effect vary widely across contract commodities. Papaya and broiler contracting offer clear net gains for participants, whereas marigold contracting leaves participants worse off. For gherkins, while contracting holds net gains for participating farmers overall, this is true of contracts with some firms but not others. High variance in effects across growers of same commodity, indicating diverse effects
++
Singh 2001 (OBS)
India, Punjab, late 1990s
Contract 69 contract farmers were interviewed which covered three crops (tomato, potato, and chili) and three contracting companies: Hindustan Lever Limited (HLL––a subsidiary of Unilever) (24) and Nijjer Agro
Most growers contracted are large, with considerable assets, some with remittances, some with government jobs. Average operated holdings are 60 ac for those contracted to the MNCs, 20 ac for those contracted to Nijjer, a local
++
41
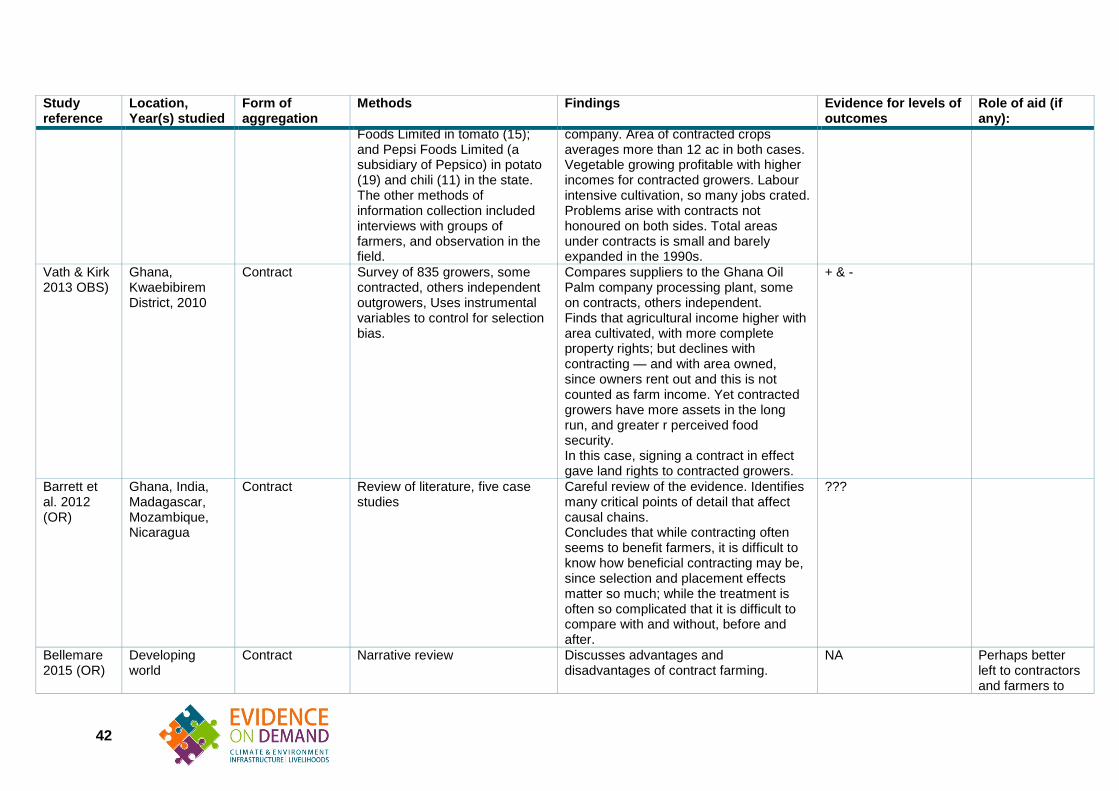
Study reference
Location, Year(s) studied
Form of aggregation
Methods Findings Evidence for levels of outcomes
Role of aid (if any):
Foods Limited in tomato (15); and Pepsi Foods Limited (a subsidiary of Pepsico) in potato (19) and chili (11) in the state. The other methods of information collection included interviews with groups of farmers, and observation in the field.
company. Area of contracted crops averages more than 12 ac in both cases. Vegetable growing profitable with higher incomes for contracted growers. Labour intensive cultivation, so many jobs crated. Problems arise with contracts not honoured on both sides. Total areas under contracts is small and barely expanded in the 1990s.
Vath & Kirk 2013 OBS)
Ghana, Kwaebibirem District, 2010
Contract Survey of 835 growers, some contracted, others independent outgrowers, Uses instrumental variables to control for selection bias.
Compares suppliers to the Ghana Oil Palm company processing plant, some on contracts, others independent. Finds that agricultural income higher with area cultivated, with more complete property rights; but declines with contracting — and with area owned, since owners rent out and this is not counted as farm income. Yet contracted growers have more assets in the long run, and greater r perceived food security. In this case, signing a contract in effect gave land rights to contracted growers.
+ & -
Barrett et al. 2012 (OR)
Ghana, India, Madagascar, Mozambique, Nicaragua
Contract Review of literature, five case studies
Careful review of the evidence. Identifies many critical points of detail that affect causal chains. Concludes that while contracting often seems to benefit farmers, it is difficult to know how beneficial contracting may be, since selection and placement effects matter so much; while the treatment is often so complicated that it is difficult to compare with and without, before and after.
???
Bellemare 2015 (OR)
Developing world
Contract Narrative review Discusses advantages and disadvantages of contract farming.
NA Perhaps better left to contractors and farmers to
42
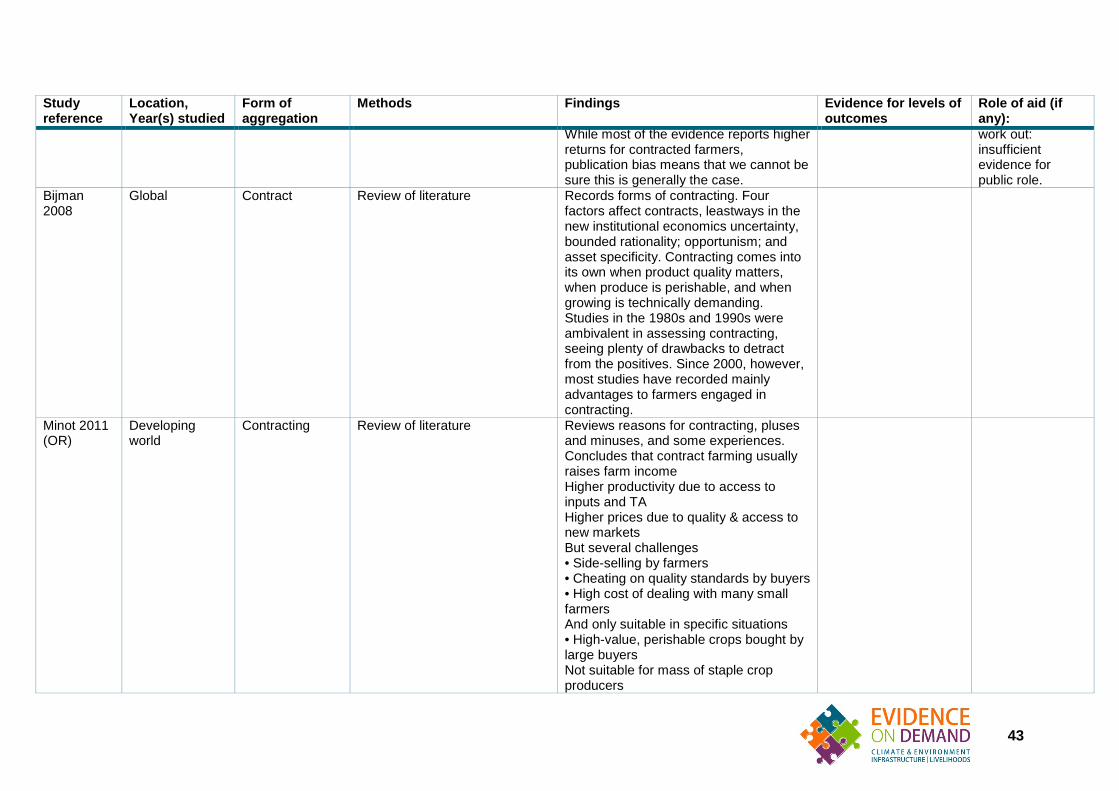
Study reference
Location, Year(s) studied
Form of aggregation
Methods Findings Evidence for levels of outcomes
Role of aid (if any):
While most of the evidence reports higher returns for contracted farmers, publication bias means that we cannot be sure this is generally the case.
work out: insufficient evidence for public role.
Bijman 2008
Global Contract Review of literature Records forms of contracting. Four factors affect contracts, leastways in the new institutional economics uncertainty, bounded rationality; opportunism; and asset specificity. Contracting comes into its own when product quality matters, when produce is perishable, and when growing is technically demanding. Studies in the 1980s and 1990s were ambivalent in assessing contracting, seeing plenty of drawbacks to detract from the positives. Since 2000, however, most studies have recorded mainly advantages to farmers engaged in contracting.
Minot 2011 (OR)
Developing world
Contracting Review of literature Reviews reasons for contracting, pluses and minuses, and some experiences. Concludes that contract farming usually raises farm income Higher productivity due to access to inputs and TA Higher prices due to quality & access to new markets But several challenges • Side-selling by farmers • Cheating on quality standards by buyers • High cost of dealing with many small farmers And only suitable in specific situations • High-value, perishable crops bought by large buyers Not suitable for mass of staple crop producers
43
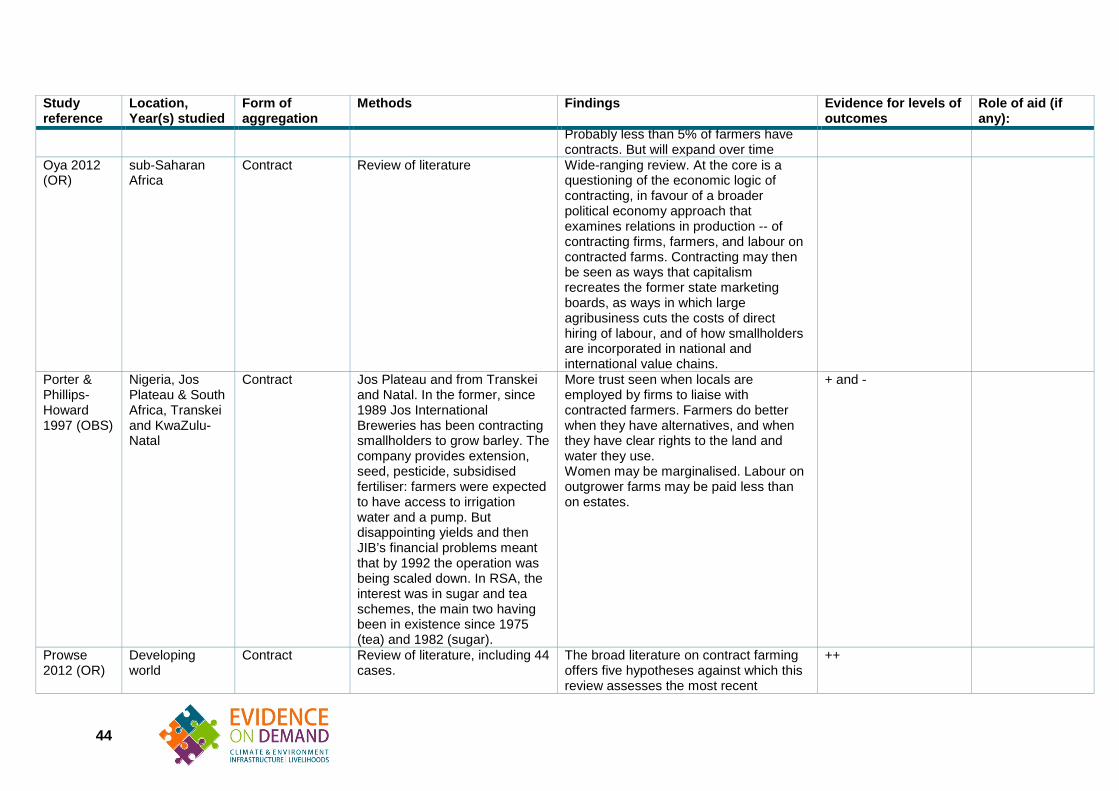
Study reference
Location, Year(s) studied
Form of aggregation
Methods Findings Evidence for levels of outcomes
Role of aid (if any):
Probably less than 5% of farmers have contracts. But will expand over time
Oya 2012 (OR)
sub-Saharan Africa
Contract Review of literature Wide-ranging review. At the core is a questioning of the economic logic of contracting, in favour of a broader political economy approach that examines relations in production -- of contracting firms, farmers, and labour on contracted farms. Contracting may then be seen as ways that capitalism recreates the former state marketing boards, as ways in which large agribusiness cuts the costs of direct hiring of labour, and of how smallholders are incorporated in national and international value chains.
Porter & Phillips-Howard 1997 (OBS)
Nigeria, Jos Plateau & South Africa, Transkei and KwaZulu-Natal
Contract Jos Plateau and from Transkei and Natal. In the former, since 1989 Jos International Breweries has been contracting smallholders to grow barley. The company provides extension, seed, pesticide, subsidised fertiliser: farmers were expected to have access to irrigation water and a pump. But disappointing yields and then JIB’s financial problems meant that by 1992 the operation was being scaled down. In RSA, the interest was in sugar and tea schemes, the main two having been in existence since 1975 (tea) and 1982 (sugar).
More trust seen when locals are employed by firms to liaise with contracted farmers. Farmers do better when they have alternatives, and when they have clear rights to the land and water they use. Women may be marginalised. Labour on outgrower farms may be paid less than on estates.
+ and -
Prowse 2012 (OR)
Developing world
Contract Review of literature, including 44 cases.
The broad literature on contract farming offers five hypotheses against which this review assesses the most recent
++
44
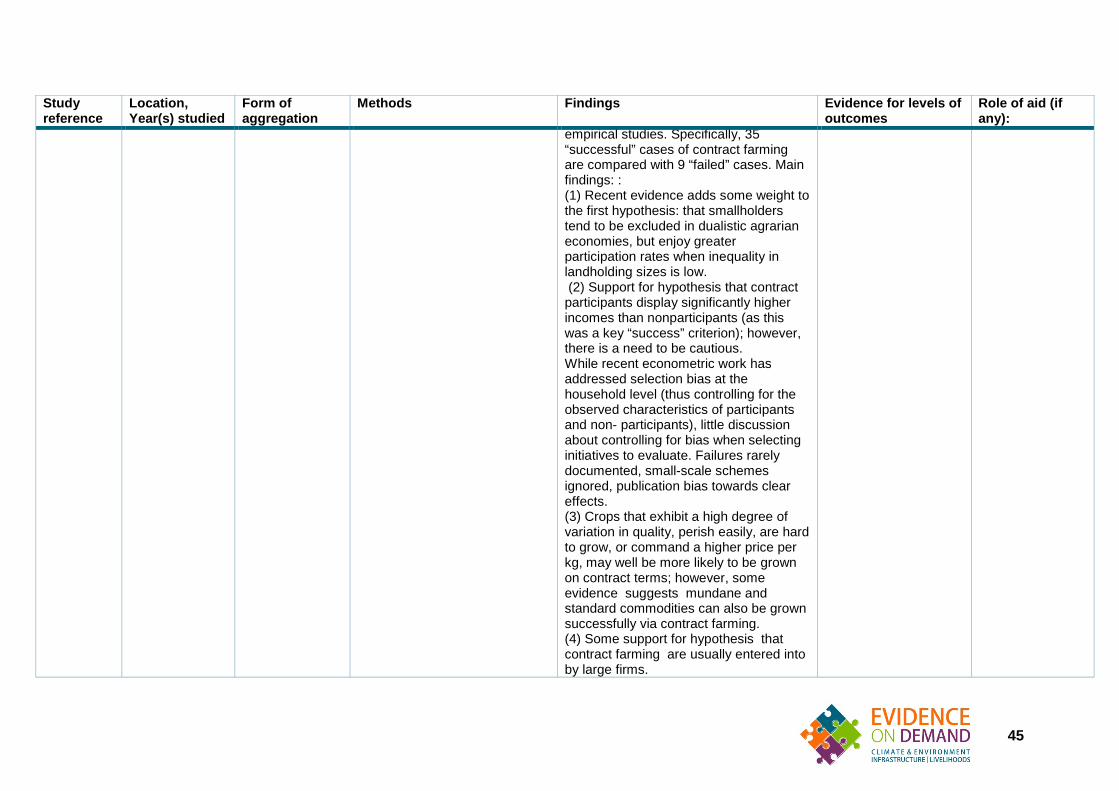
Study reference
Location, Year(s) studied
Form of aggregation
Methods Findings Evidence for levels of outcomes
Role of aid (if any):
empirical studies. Specifically, 35 “successful” cases of contract farming are compared with 9 “failed” cases. Main findings: : (1) Recent evidence adds some weight to the first hypothesis: that smallholders tend to be excluded in dualistic agrarian economies, but enjoy greater participation rates when inequality in landholding sizes is low. (2) Support for hypothesis that contract participants display significantly higher incomes than nonparticipants (as this was a key “success” criterion); however, there is a need to be cautious. While recent econometric work has addressed selection bias at the household level (thus controlling for the observed characteristics of participants and non- participants), little discussion about controlling for bias when selecting initiatives to evaluate. Failures rarely documented, small-scale schemes ignored, publication bias towards clear effects. (3) Crops that exhibit a high degree of variation in quality, perish easily, are hard to grow, or command a higher price per kg, may well be more likely to be grown on contract terms; however, some evidence suggests mundane and standard commodities can also be grown successfully via contract farming. (4) Some support for hypothesis that contract farming are usually entered into by large firms.
45

Study reference
Location, Year(s) studied
Form of aggregation
Methods Findings Evidence for levels of outcomes
Role of aid (if any):
(5) Some support for hypothesis that contract-farming most likely to supply markets in developed countries, and supermarkets within urban centres in developing and emerging economies. Review concludes that having third parties to deals can improve information, trust and compliance.
Swinnen & Vandeplas 2007 (OR)
Developing world and Eastern Europe
Contracting Review of literature Competition among buyers generally helps farmers get a better price for their produce. But it does make contracting with credit and inputs difficult, since farmers can sell on the side and renege on their obligations. Paper considers ways to combat this: trust and reputation; group liability.
Technoserve & IFAD 2011 (OR)
Developing world
Contract Review of literature This review found no universal answers, but success associated with: • having direct access to a viable market (local, regional, global) for the end product; • maintaining a clear, transparent pricing mechanism, a price that is attractive to farmers, or both; • avoiding mono-cropping systems (especially low-value, high-volume annuals); • avoiding overreliance on credit to purchase inputs; • leveraging a competitive advantage in production, product attributes (e.g. brand, certifications) and/or proximity to the end market; • building/sustaining credibility of the buyer and trust among farmers via regular direct interaction between the buyer and the farmers.
46

Study reference
Location, Year(s) studied
Form of aggregation
Methods Findings Evidence for levels of outcomes
Role of aid (if any):
Ton et al. 2015 (SR)
Global Contract Systematic review of literature Protocol for review that sets out the expected causal paths to reviewed.
Warning & Key 2002 (OBS)
Senegal, groundnut basin, 1992/94
Contract farming of sweet groundnuts Private firm provides seeds, fertiliser, agro-chemicals on credit and buys groundnuts 32,000 contracted farmers
Data from a 1992–94 survey of credit that covered Passy, part of the ARB, including 26 households. In addition to typical information, village heads and leaders were asked about individuals in terms of their reputation for honesty, work habits, borrowing habits — here termed ‘social collateral’.
Smallholders who participated in the programme were no different from their neighbours except that they tended to have more ‘social collateral’ e.g. honesty. With similar resources, they profited from their access to seed, fertiliser and chemicals on credit to realise much higher yields — 1.3 t/ha compared to 0.8 t/ha — and had farm incomes of US$680 on average more than non-participants. Since they did not invest in new assets, or skills to participate, they seemed not to be at a disadvantage in negotiation with the contractor.
+++
Abebaw and Haile 2013 [OBS]
Ethiopia, 7 regions, 2009
Farmer-managed cooperatives. In the survey these were 87% agricultural cooperatives with input and output marketing, the rest were credit/saving, consumer and 'other' cooperatives.
Regression analysis of cross-sectional survey data with Propensity Score Matching. HH survey: purposive selection of 8 districts, then random selection of 32 kebeles and 35 HH from each. Total after cleaning - 965 HH. 19% HH were coop members. Bias checks carried out.
Cooperative members were significantly more likely to be distant from main roads, male, wealthier, literate and possess an ox, a radio, and more land than non-members. After factoring in PSM, cooperative membership improved mean fertiliser adoption rate by 9-10%, with greater effects in illiterate households and households located farther from all-weather roads. Positive effect of agric. coops on pesticide adoption; none on improved seeds.
Access to markets/increased sales + (for those distant from markets) Improved quality Improved prices Improved incomes Other: Input adoption (fertiliser) + Adoption by more remote or illiterate farmers +
Bernard et al. 2008 (P;OBS)
Ethiopia, four regions, 2005
Farmer in four regions producing staple grains, in cooperatives
HH survey using PSM matching kebeles and HH. Initial universe 7,186 households randomly drawn from 293 kebeles; final sample
On average, cooperative members get 7-9% higher prices for their cereal products. However, average amount of sales by cooperative members no higher than others. Results are highly
Access to markets / increased sales +++ (larger farmers) - (smaller farmers) Improved quality
47
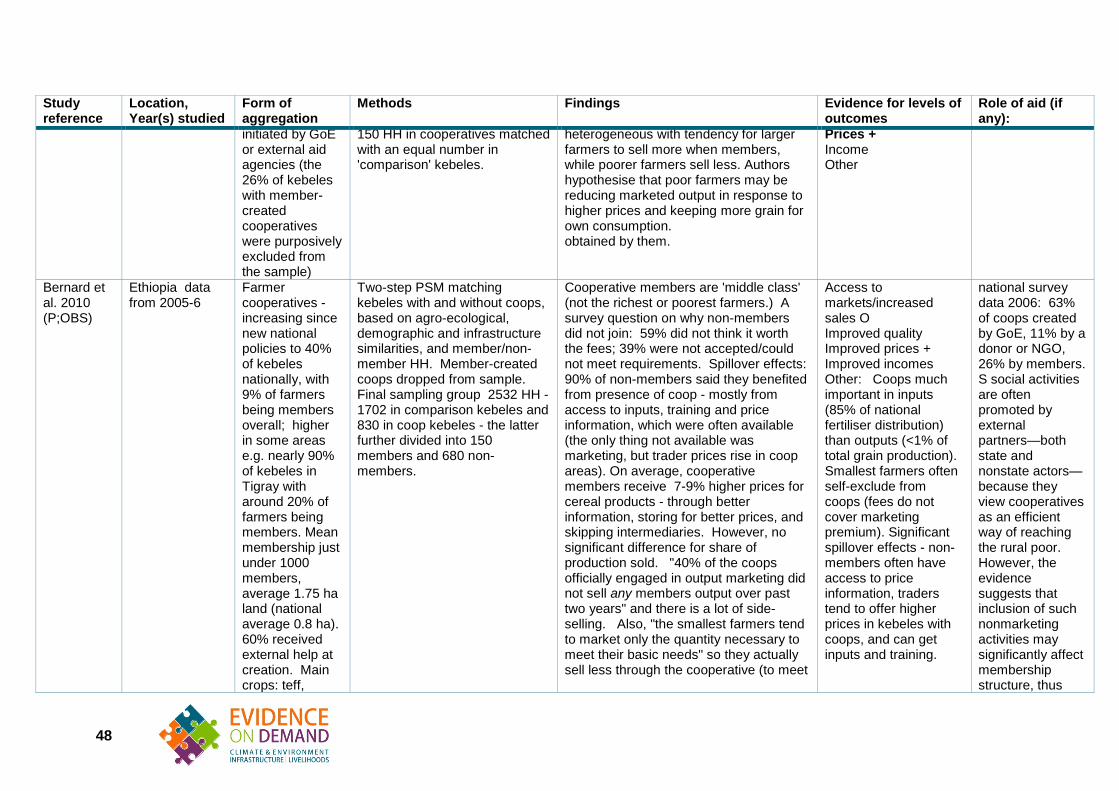
Study reference
Location, Year(s) studied
Form of aggregation
Methods Findings Evidence for levels of outcomes
Role of aid (if any):
initiated by GoE or external aid agencies (the 26% of kebeles with member-created cooperatives were purposively excluded from the sample)
150 HH in cooperatives matched with an equal number in 'comparison' kebeles.
heterogeneous with tendency for larger farmers to sell more when members, while poorer farmers sell less. Authors hypothesise that poor farmers may be reducing marketed output in response to higher prices and keeping more grain for own consumption. obtained by them.
Prices + Income Other
Bernard et al. 2010 (P;OBS)
Ethiopia data from 2005-6
Farmer cooperatives - increasing since new national policies to 40% of kebeles nationally, with 9% of farmers being members overall; higher in some areas e.g. nearly 90% of kebeles in Tigray with around 20% of farmers being members. Mean membership just under 1000 members, average 1.75 ha land (national average 0.8 ha). 60% received external help at creation. Main crops: teff,
Two-step PSM matching kebeles with and without coops, based on agro-ecological, demographic and infrastructure similarities, and member/non-member HH. Member-created coops dropped from sample. Final sampling group 2532 HH - 1702 in comparison kebeles and 830 in coop kebeles - the latter further divided into 150 members and 680 non-members.
Cooperative members are 'middle class' (not the richest or poorest farmers.) A survey question on why non-members did not join: 59% did not think it worth the fees; 39% were not accepted/could not meet requirements. Spillover effects: 90% of non-members said they benefited from presence of coop - mostly from access to inputs, training and price information, which were often available (the only thing not available was marketing, but trader prices rise in coop areas). On average, cooperative members receive 7-9% higher prices for cereal products - through better information, storing for better prices, and skipping intermediaries. However, no significant difference for share of production sold. "40% of the coops officially engaged in output marketing did not sell any members output over past two years" and there is a lot of side-selling. Also, "the smallest farmers tend to market only the quantity necessary to meet their basic needs" so they actually sell less through the cooperative (to meet
Access to markets/increased sales O Improved quality Improved prices + Improved incomes Other: Coops much important in inputs (85% of national fertiliser distribution) than outputs (<1% of total grain production). Smallest farmers often self-exclude from coops (fees do not cover marketing premium). Significant spillover effects - non-members often have access to price information, traders tend to offer higher prices in kebeles with coops, and can get inputs and training.
national survey data 2006: 63% of coops created by GoE, 11% by a donor or NGO, 26% by members. S social activities are often promoted by external partners—both state and nonstate actors—because they view cooperatives as an efficient way of reaching the rural poor. However, the evidence suggests that inclusion of such nonmarketing activities may significantly affect membership structure, thus
48

Study reference
Location, Year(s) studied
Form of aggregation
Methods Findings Evidence for levels of outcomes
Role of aid (if any):
sorghum, maize, barley.
their target income) as a result of higher prices.
reducing the cooperative’s capacity to provide marketing services to its members." They can do irreparable harm to the organization’s future capacity to serve its members by imposing their own agenda. This issue is particularly important with respect to the imposition of nonmarketing activities..."
Fischer and Qaim 2012 [OBS]
Kenya, 4 banana growing districts in Central Highlands, 2009
240 banana farmer groups supported by Africa Harvest and Technoserve. Access to tissue culture (TC) planting material and other inputs and marketing. Cooperatives established as "due to remoteness, perishability,
Regression analysis of cross-sectional survey data with Propensity Score Matching. HH survey: purposive selection of 4 districts, then random selection of 17 farmer groups and 12 members within each (total 201 members), plus 137 non-members in same area and 106 control HH in locations without group activity. Total after cleaning - 444 HH. Bias checks carried out.
Cooperative members on average were wealthier in land and assets, older and better educated. 40% women. After factoring in PSM, members had expanded their plantations 'significantly' more than non-members, used more hired labour, fertiliser and pesticides(although 'input use is still far below recommended levels'), and had much higher adoption of TC banana (72% vs 14-20%). [No evidence of improved yields - too early, and drought.] Marketing through the group increased average prices by 23% per kg and members had 26% higher annual income on average than non-members.
Access to markets/increased sales O Quality standards Prices ++ Incomes ++ (mainly resulting from expanded production) Other: adoption of improved planting material and inputs +++
Several thousand growers in highlands organised into farmer groups by INGOs who also provided training and access to technology (TC) through linkages to labs and subsidies,
49
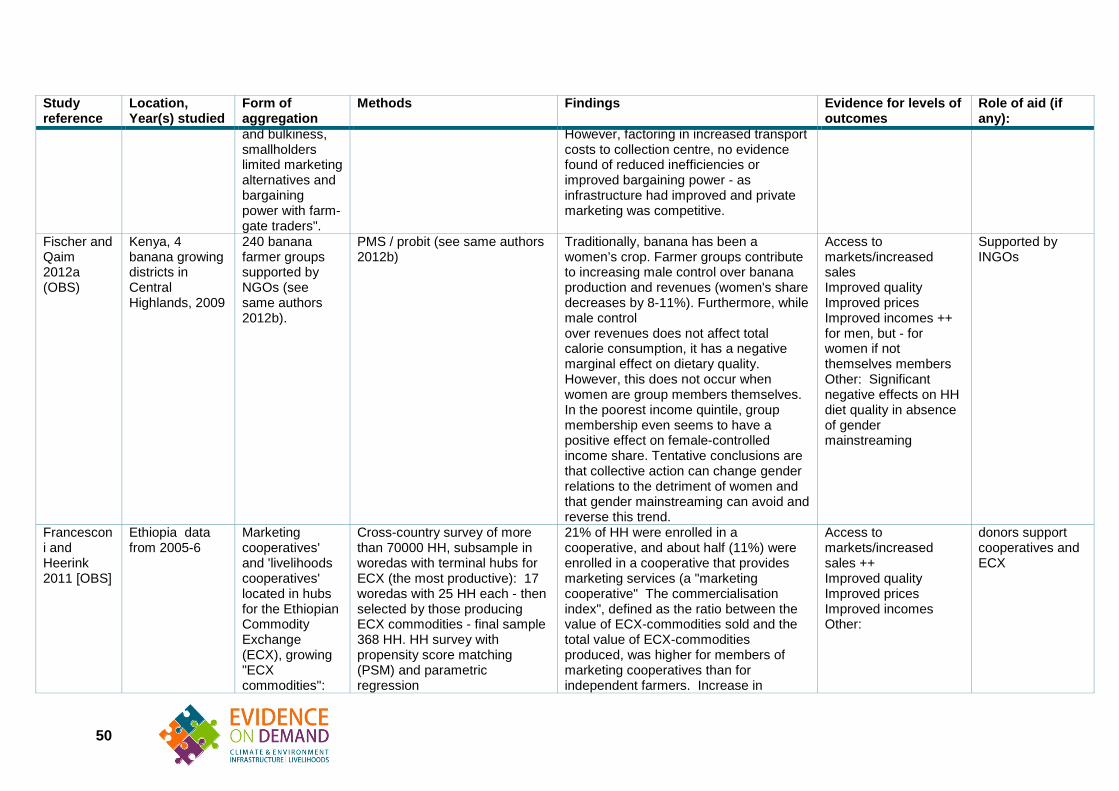
Study reference
Location, Year(s) studied
Form of aggregation
Methods Findings Evidence for levels of outcomes
Role of aid (if any):
and bulkiness, smallholders limited marketing alternatives and bargaining power with farm-gate traders".
However, factoring in increased transport costs to collection centre, no evidence found of reduced inefficiencies or improved bargaining power - as infrastructure had improved and private marketing was competitive.
Fischer and Qaim 2012a (OBS)
Kenya, 4 banana growing districts in Central Highlands, 2009
240 banana farmer groups supported by NGOs (see same authors 2012b).
PMS / probit (see same authors 2012b)
Traditionally, banana has been a women’s crop. Farmer groups contribute to increasing male control over banana production and revenues (women's share decreases by 8-11%). Furthermore, while male control over revenues does not affect total calorie consumption, it has a negative marginal effect on dietary quality. However, this does not occur when women are group members themselves. In the poorest income quintile, group membership even seems to have a positive effect on female-controlled income share. Tentative conclusions are that collective action can change gender relations to the detriment of women and that gender mainstreaming can avoid and reverse this trend.
Access to markets/increased sales Improved quality Improved prices Improved incomes ++ for men, but - for women if not themselves members Other: Significant negative effects on HH diet quality in absence of gender mainstreaming
Supported by INGOs
Francesconi and Heerink 2011 [OBS]
Ethiopia data from 2005-6
Marketing cooperatives' and 'livelihoods cooperatives' located in hubs for the Ethiopian Commodity Exchange (ECX), growing "ECX commodities":
Cross-country survey of more than 70000 HH, subsample in woredas with terminal hubs for ECX (the most productive): 17 woredas with 25 HH each - then selected by those producing ECX commodities - final sample 368 HH. HH survey with propensity score matching (PSM) and parametric regression
21% of HH were enrolled in a cooperative, and about half (11%) were enrolled in a cooperative that provides marketing services (a "marketing cooperative" The commercialisation index", defined as the ratio between the value of ECX-commodities sold and the total value of ECX-commodities produced, was higher for members of marketing cooperatives than for independent farmers. Increase in
Access to markets/increased sales ++ Improved quality Improved prices Improved incomes Other:
donors support cooperatives and ECX
50
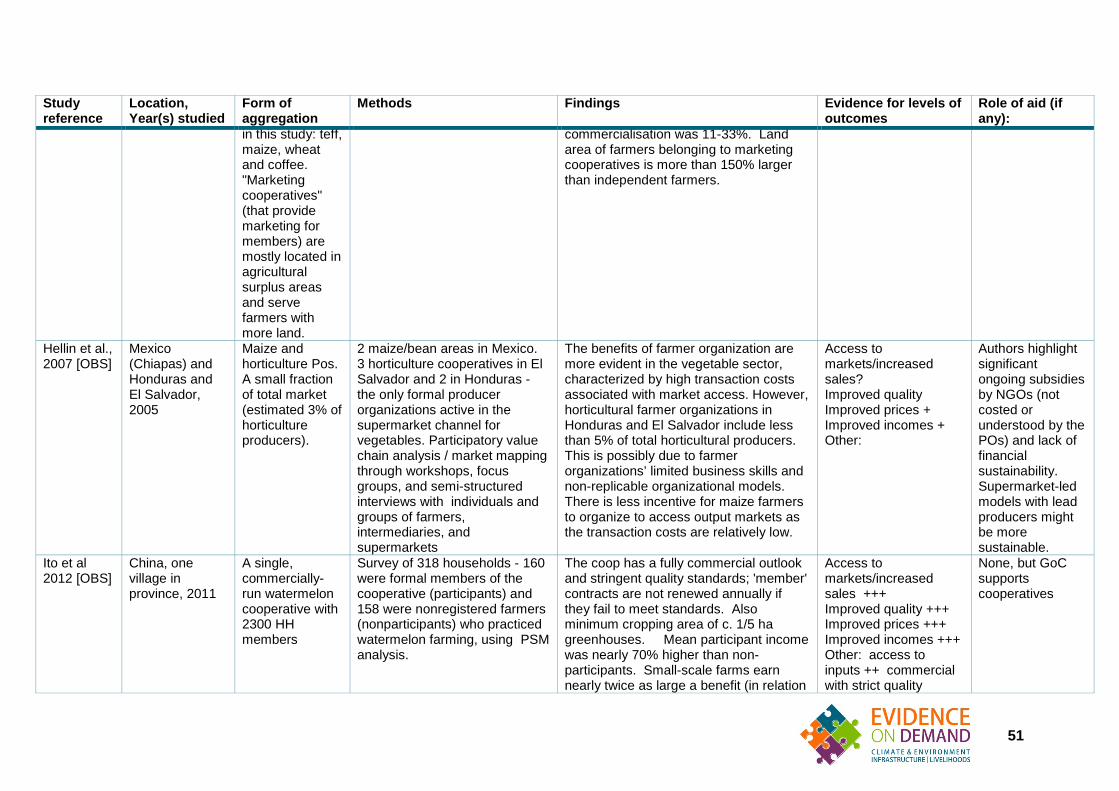
Study reference
Location, Year(s) studied
Form of aggregation
Methods Findings Evidence for levels of outcomes
Role of aid (if any):
in this study: teff, maize, wheat and coffee. "Marketing cooperatives" (that provide marketing for members) are mostly located in agricultural surplus areas and serve farmers with more land.
commercialisation was 11-33%. Land area of farmers belonging to marketing cooperatives is more than 150% larger than independent farmers.
Hellin et al., 2007 [OBS]
Mexico (Chiapas) and Honduras and El Salvador, 2005
Maize and horticulture Pos. A small fraction of total market (estimated 3% of horticulture producers).
2 maize/bean areas in Mexico. 3 horticulture cooperatives in El Salvador and 2 in Honduras - the only formal producer organizations active in the supermarket channel for vegetables. Participatory value chain analysis / market mapping through workshops, focus groups, and semi-structured interviews with individuals and groups of farmers, intermediaries, and supermarkets
The benefits of farmer organization are more evident in the vegetable sector, characterized by high transaction costs associated with market access. However, horticultural farmer organizations in Honduras and El Salvador include less than 5% of total horticultural producers. This is possibly due to farmer organizations’ limited business skills and non-replicable organizational models. There is less incentive for maize farmers to organize to access output markets as the transaction costs are relatively low.
Access to markets/increased sales? Improved quality Improved prices + Improved incomes + Other:
Authors highlight significant ongoing subsidies by NGOs (not costed or understood by the POs) and lack of financial sustainability. Supermarket-led models with lead producers might be more sustainable.
Ito et al 2012 [OBS]
China, one village in province, 2011
A single, commercially-run watermelon cooperative with 2300 HH members
Survey of 318 households - 160 were formal members of the cooperative (participants) and 158 were nonregistered farmers (nonparticipants) who practiced watermelon farming, using PSM analysis.
The coop has a fully commercial outlook and stringent quality standards; 'member' contracts are not renewed annually if they fail to meet standards. Also minimum cropping area of c. 1/5 ha greenhouses. Mean participant income was nearly 70% higher than non-participants. Small-scale farms earn nearly twice as large a benefit (in relation
Access to markets/increased sales +++ Improved quality +++ Improved prices +++ Improved incomes +++ Other: access to inputs ++ commercial with strict quality
None, but GoC supports cooperatives
51
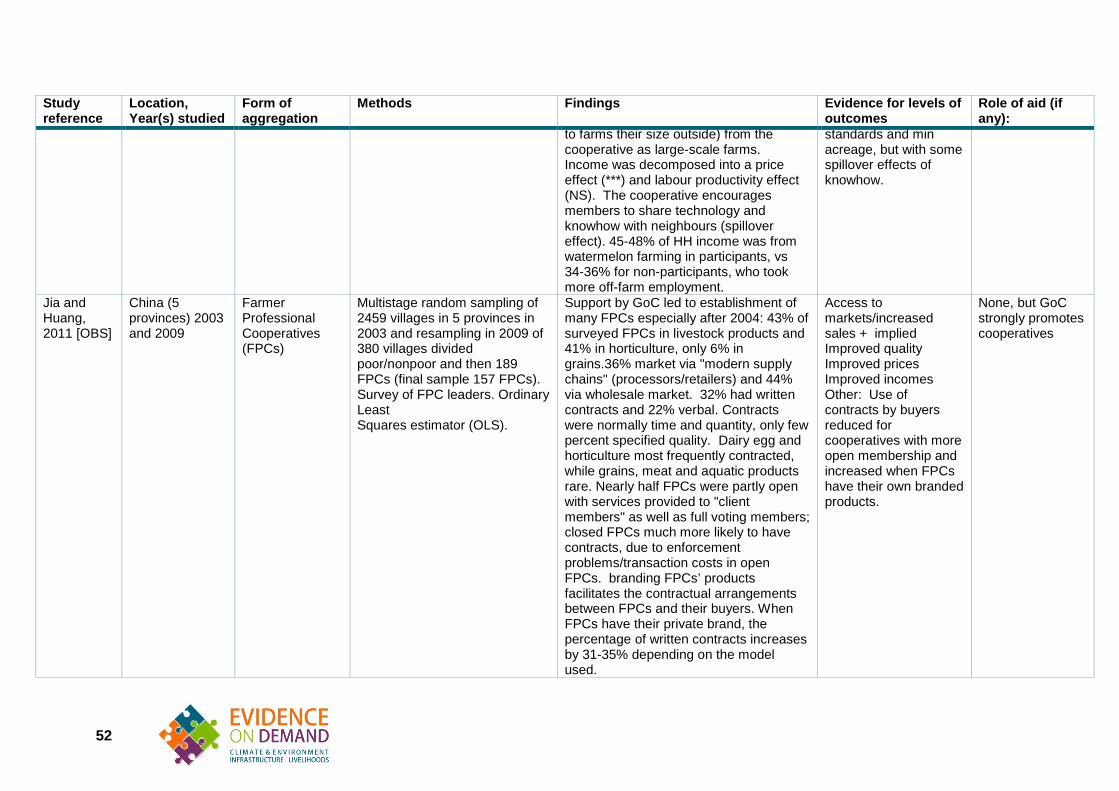
Study reference
Location, Year(s) studied
Form of aggregation
Methods Findings Evidence for levels of outcomes
Role of aid (if any):
to farms their size outside) from the cooperative as large-scale farms. Income was decomposed into a price effect (***) and labour productivity effect (NS). The cooperative encourages members to share technology and knowhow with neighbours (spillover effect). 45-48% of HH income was from watermelon farming in participants, vs 34-36% for non-participants, who took more off-farm employment.
standards and min acreage, but with some spillover effects of knowhow.
Jia and Huang, 2011 [OBS]
China (5 provinces) 2003 and 2009
Farmer Professional Cooperatives (FPCs)
Multistage random sampling of 2459 villages in 5 provinces in 2003 and resampling in 2009 of 380 villages divided poor/nonpoor and then 189 FPCs (final sample 157 FPCs). Survey of FPC leaders. Ordinary Least Squares estimator (OLS).
Support by GoC led to establishment of many FPCs especially after 2004: 43% of surveyed FPCs in livestock products and 41% in horticulture, only 6% in grains.36% market via "modern supply chains" (processors/retailers) and 44% via wholesale market. 32% had written contracts and 22% verbal. Contracts were normally time and quantity, only few percent specified quality. Dairy egg and horticulture most frequently contracted, while grains, meat and aquatic products rare. Nearly half FPCs were partly open with services provided to "client members" as well as full voting members; closed FPCs much more likely to have contracts, due to enforcement problems/transaction costs in open FPCs. branding FPCs’ products facilitates the contractual arrangements between FPCs and their buyers. When FPCs have their private brand, the percentage of written contracts increases by 31-35% depending on the model used.
Access to markets/increased sales + implied Improved quality Improved prices Improved incomes Other: Use of contracts by buyers reduced for cooperatives with more open membership and increased when FPCs have their own branded products.
None, but GoC strongly promotes cooperatives
52

Study reference
Location, Year(s) studied
Form of aggregation
Methods Findings Evidence for levels of outcomes
Role of aid (if any):
Ma and Abdulai, 2016 OBS
Apple farmers in Gansu, Shaanxi and Shandong provinces of China, 2014
Farmer cooperatives - increasing since Law of Farmers’ Professional Cooperatives in 2007. "Despite the efforts made by the government, the Ministry of Agriculture in China reported that only 25.2% of farm households were involved in agricultural cooperatives in the country in 2013"
Multistage sampling with purposive selection of apple-growing provinces and districts and random selection of 6 cooperatives, 3 villages /cooperative and 25-30 farmers per village. Final sample 481 farmer members/non. Endogenous switching regression approach' (Lokshin and Sajaia, 2004) to account for selection bias and analyse both the determinants of cooperative membership and the impact of membership.
Cooperative membership significantly increases mean apple yields by 5%, mean net returns by 6% and mean income by 5%. Productivity and income gains of cooperative membership were higher for small-scale farmers, compared to medium and large-scale farmers (but not by much, 6% as opposed to 4-5%). Cooperative members were more likely to be larger farmers and have access to a computer. Yields / ha generally larger for small farmers.
Access to markets/increased sales Improved quality Improved prices Improved incomes + Other: Improved yields +
None, but GoC supports cooperatives
Mojo et al. 2015 [OBS]
Ethiopia, two coffee growing districts in Oromia
Coffee cooperatives in two districts of a coffee growing region of Ethiopia
Four cooperatives randomly selected within the two districts, random selection of HH from villages with these cooperatives, members and nonmembers Final sample 305 HH, 46% of whom were members. HH survey with qual perception data (e.g. income change on scale 1-5 ) transformed to binary outcomes (increased/not). PSM and bias checks. Plus 1 focus group discussion per cooperative.
Coope members own more land (1.6 ha on average compared to 1.1 ha) and are generally more established (married, older) than non-members. Cooperative membership has no significant impact on members’ economic performance including perceived, actual income and household asset accumulation. Reasons include that cooperatives are open and buy from members and non-members at same price. Benefit to members should be dividends, but these are low. Cooperatives buy late in season due to credit problems, and management is variable.
Access to markets/increased sales Improved quality Improved prices + spillover effects from increased competition with traders, not direct benefits Improved incomes O Other: Coops provide services to members and non-members, so many spillover effects. The income dividend which members should
One of the coops was established with NGO help.
53
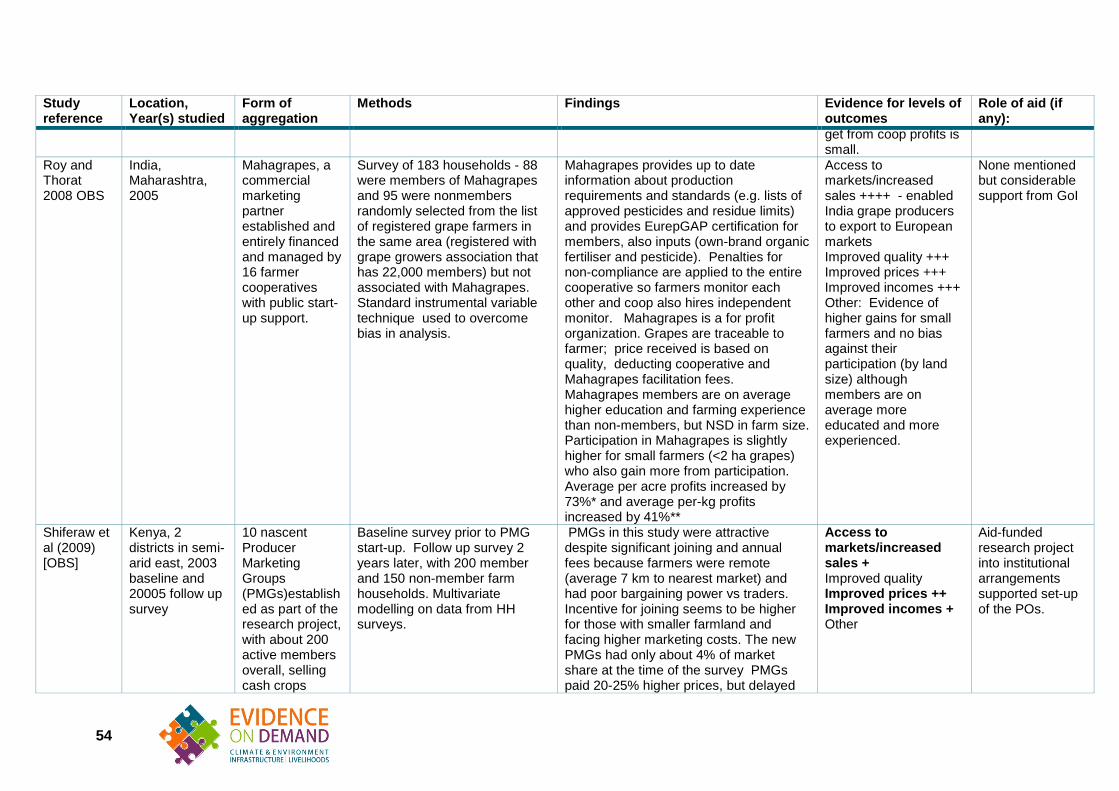
Study reference
Location, Year(s) studied
Form of aggregation
Methods Findings Evidence for levels of outcomes
Role of aid (if any):
get from coop profits is small.
Roy and Thorat 2008 OBS
India, Maharashtra, 2005
Mahagrapes, a commercial marketing partner established and entirely financed and managed by 16 farmer cooperatives with public start-up support.
Survey of 183 households - 88 were members of Mahagrapes and 95 were nonmembers randomly selected from the list of registered grape farmers in the same area (registered with grape growers association that has 22,000 members) but not associated with Mahagrapes. Standard instrumental variable technique used to overcome bias in analysis.
Mahagrapes provides up to date information about production requirements and standards (e.g. lists of approved pesticides and residue limits) and provides EurepGAP certification for members, also inputs (own-brand organic fertiliser and pesticide). Penalties for non-compliance are applied to the entire cooperative so farmers monitor each other and coop also hires independent monitor. Mahagrapes is a for profit organization. Grapes are traceable to farmer; price received is based on quality, deducting cooperative and Mahagrapes facilitation fees. Mahagrapes members are on average higher education and farming experience than non-members, but NSD in farm size. Participation in Mahagrapes is slightly higher for small farmers (<2 ha grapes) who also gain more from participation. Average per acre profits increased by 73%* and average per-kg profits increased by 41%**
Access to markets/increased sales ++++ - enabled India grape producers to export to European markets Improved quality +++ Improved prices +++ Improved incomes +++ Other: Evidence of higher gains for small farmers and no bias against their participation (by land size) although members are on average more educated and more experienced.
None mentioned but considerable support from GoI
Shiferaw et al (2009) [OBS]
Kenya, 2 districts in semi-arid east, 2003 baseline and 20005 follow up survey
10 nascent Producer Marketing Groups (PMGs)established as part of the research project, with about 200 active members overall, selling cash crops
Baseline survey prior to PMG start-up. Follow up survey 2 years later, with 200 member and 150 non-member farm households. Multivariate modelling on data from HH surveys.
PMGs in this study were attractive despite significant joining and annual fees because farmers were remote (average 7 km to nearest market) and had poor bargaining power vs traders. Incentive for joining seems to be higher for those with smaller farmland and facing higher marketing costs. The new PMGs had only about 4% of market share at the time of the survey PMGs paid 20-25% higher prices, but delayed
Access to markets/increased sales + Improved quality Improved prices ++ Improved incomes + Other
Aid-funded research project into institutional arrangements supported set-up of the POs.
54

Study reference
Location, Year(s) studied
Form of aggregation
Methods Findings Evidence for levels of outcomes
Role of aid (if any):
(mainly pulses, also cotton and vegetables).
payment about three weeks. They also facilitated adoption of new varieties. Average estimated net income gain of Ksh 678 per household from PMGs [no information on average farm income found but this is around $10 at 2005 exchange rate] , but much higher for farmers with a larger marketed surplus, from Ksh 152 for the bottom third to Ksh 1133 for the upper third of farm size classes. PMGs varied significantly in management and in benefits for their members.
Swanson 2009 (OBS)
Zambia, 2008 Linking smallholders to commercial dairies
Baseline survey 2004 and follow up survey 2008 (pre-post after 3-4 years of operation), project monitoring data, interviews and field visits. No with-without control groups.
Evaluation finds that "LOL has successfully linked Zambia’s smallholder dairy farmers and established milk bulking centres with the formal sector through selected national private sector processors. LOL has also helped to expand national markets...Parmalat, Zambia’s largest processor currently receives about 8% of its milk from smallholder dairy farmers, up from essentially zero only five years ago." Incomes and food security indicators are all over target. 2,732 smallholder HH received training and >1000 a heifer. Project monitoring data shows income and food security indicators are over target.
Access to markets/increased sales Improved quality Improved prices Improved incomes Other:
Program financed by USAID and implemented by Land O'Lakes. $10 million project gives an investment cost/household of $3,660 and negative net benefits per household of about -$120/person or -$1,077/household. Evaluation's view is that given continuing expansion , the project will reach a positive net gain within two years. (Have not located further evaluation)
55
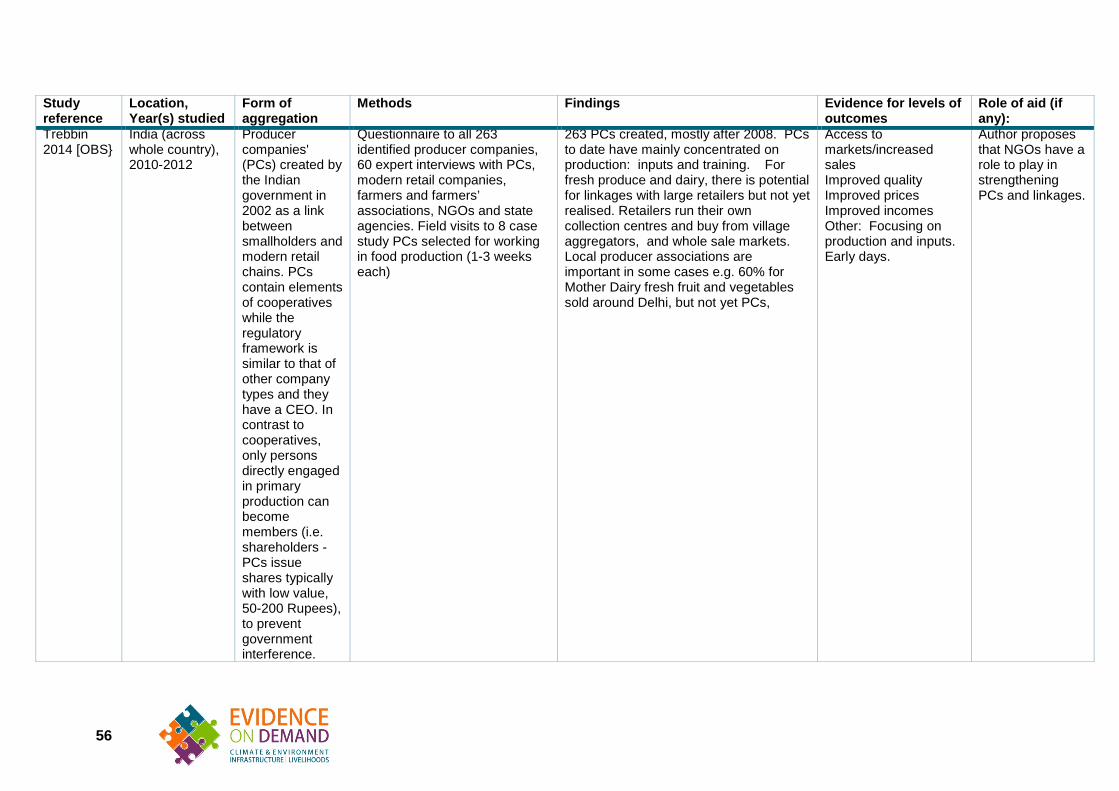
Study reference
Location, Year(s) studied
Form of aggregation
Methods Findings Evidence for levels of outcomes
Role of aid (if any):
Trebbin 2014 [OBS}
India (across whole country), 2010-2012
Producer companies' (PCs) created by the Indian government in 2002 as a link between smallholders and modern retail chains. PCs contain elements of cooperatives while the regulatory framework is similar to that of other company types and they have a CEO. In contrast to cooperatives, only persons directly engaged in primary production can become members (i.e. shareholders - PCs issue shares typically with low value, 50-200 Rupees), to prevent government interference.
Questionnaire to all 263 identified producer companies, 60 expert interviews with PCs, modern retail companies, farmers and farmers’ associations, NGOs and state agencies. Field visits to 8 case study PCs selected for working in food production (1-3 weeks each)
263 PCs created, mostly after 2008. PCs to date have mainly concentrated on production: inputs and training. For fresh produce and dairy, there is potential for linkages with large retailers but not yet realised. Retailers run their own collection centres and buy from village aggregators, and whole sale markets. Local producer associations are important in some cases e.g. 60% for Mother Dairy fresh fruit and vegetables sold around Delhi, but not yet PCs,
Access to markets/increased sales Improved quality Improved prices Improved incomes Other: Focusing on production and inputs. Early days.
Author proposes that NGOs have a role to play in strengthening PCs and linkages.
56
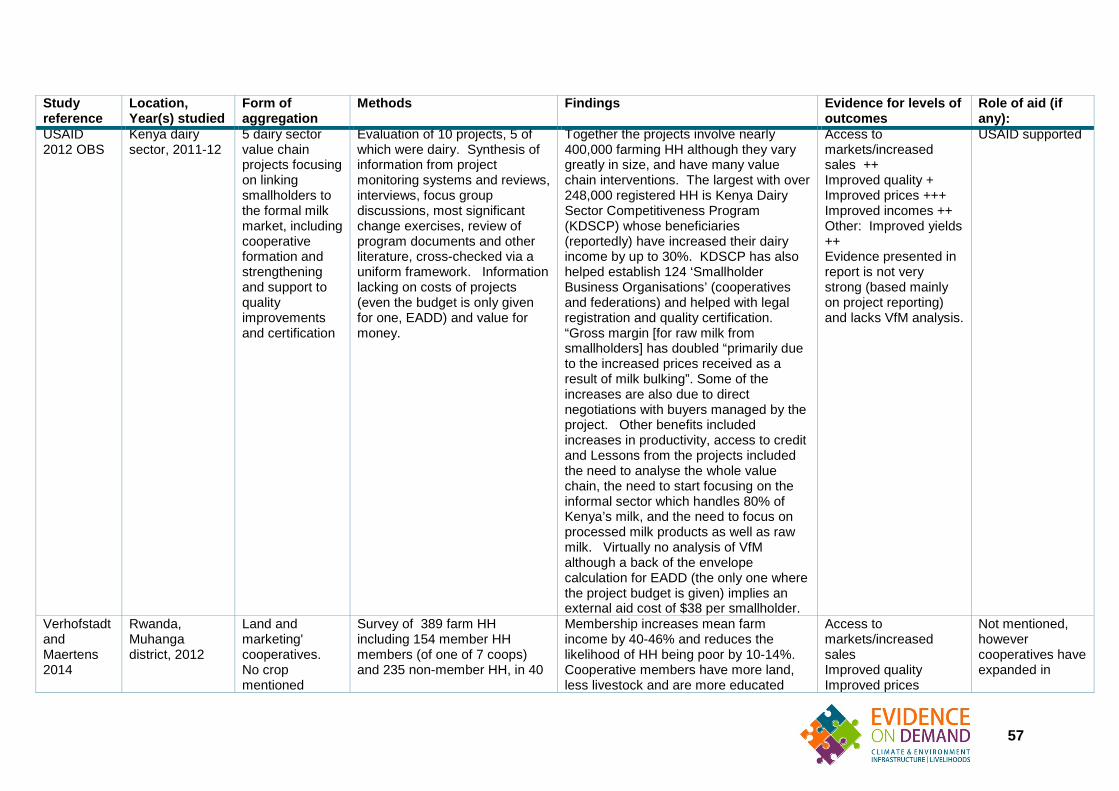
Study reference
Location, Year(s) studied
Form of aggregation
Methods Findings Evidence for levels of outcomes
Role of aid (if any):
USAID 2012 OBS
Kenya dairy sector, 2011-12
5 dairy sector value chain projects focusing on linking smallholders to the formal milk market, including cooperative formation and strengthening and support to quality improvements and certification
Evaluation of 10 projects, 5 of which were dairy. Synthesis of information from project monitoring systems and reviews, interviews, focus group discussions, most significant change exercises, review of program documents and other literature, cross-checked via a uniform framework. Information lacking on costs of projects (even the budget is only given for one, EADD) and value for money.
Together the projects involve nearly 400,000 farming HH although they vary greatly in size, and have many value chain interventions. The largest with over 248,000 registered HH is Kenya Dairy Sector Competitiveness Program (KDSCP) whose beneficiaries (reportedly) have increased their dairy income by up to 30%. KDSCP has also helped establish 124 ‘Smallholder Business Organisations’ (cooperatives and federations) and helped with legal registration and quality certification. “Gross margin [for raw milk from smallholders] has doubled “primarily due to the increased prices received as a result of milk bulking”. Some of the increases are also due to direct negotiations with buyers managed by the project. Other benefits included increases in productivity, access to credit and Lessons from the projects included the need to analyse the whole value chain, the need to start focusing on the informal sector which handles 80% of Kenya’s milk, and the need to focus on processed milk products as well as raw milk. Virtually no analysis of VfM although a back of the envelope calculation for EADD (the only one where the project budget is given) implies an external aid cost of $38 per smallholder.
Access to markets/increased sales ++ Improved quality + Improved prices +++ Improved incomes ++ Other: Improved yields ++ Evidence presented in report is not very strong (based mainly on project reporting) and lacks VfM analysis.
USAID supported
Verhofstadt and Maertens 2014
Rwanda, Muhanga district, 2012
Land and marketing' cooperatives. No crop mentioned
Survey of 389 farm HH including 154 member HH members (of one of 7 coops) and 235 non-member HH, in 40
Membership increases mean farm income by 40-46% and reduces the likelihood of HH being poor by 10-14%. Cooperative members have more land, less livestock and are more educated
Access to markets/increased sales Improved quality Improved prices
Not mentioned, however cooperatives have expanded in
57
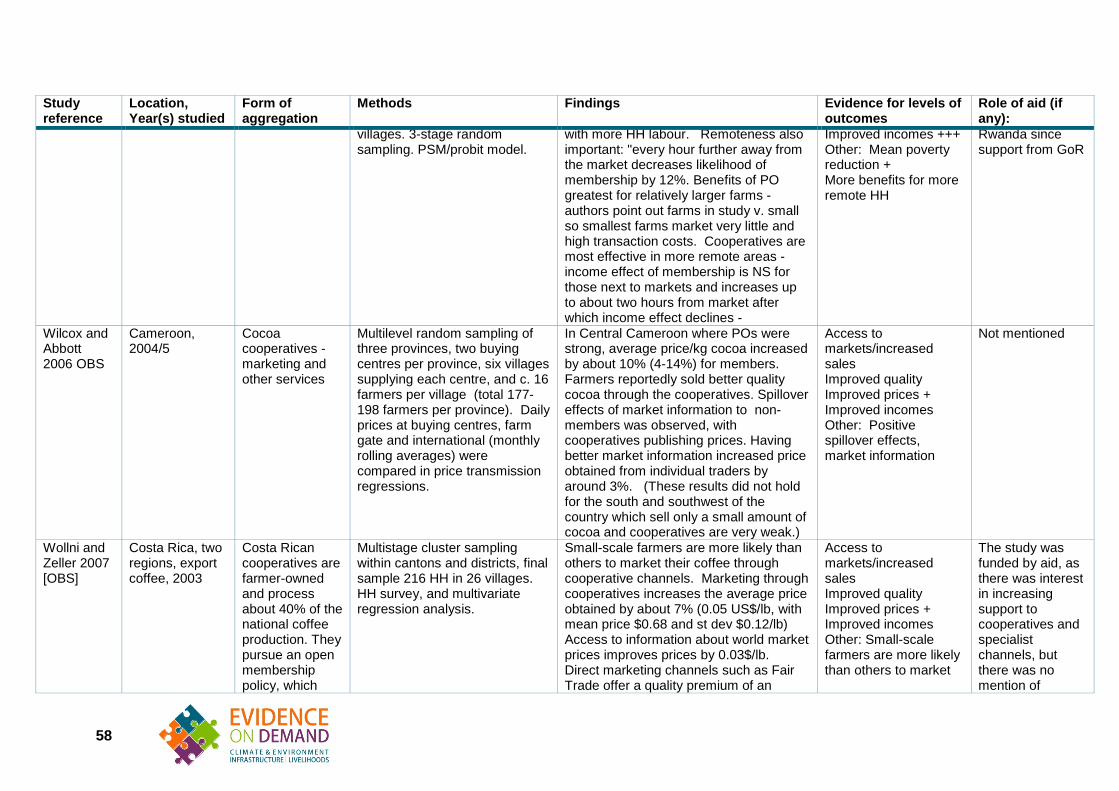
Study reference
Location, Year(s) studied
Form of aggregation
Methods Findings Evidence for levels of outcomes
Role of aid (if any):
villages. 3-stage random sampling. PSM/probit model.
with more HH labour. Remoteness also important: "every hour further away from the market decreases likelihood of membership by 12%. Benefits of PO greatest for relatively larger farms - authors point out farms in study v. small so smallest farms market very little and high transaction costs. Cooperatives are most effective in more remote areas - income effect of membership is NS for those next to markets and increases up to about two hours from market after which income effect declines -
Improved incomes +++ Other: Mean poverty reduction + More benefits for more remote HH
Rwanda since support from GoR
Wilcox and Abbott 2006 OBS
Cameroon, 2004/5
Cocoa cooperatives - marketing and other services
Multilevel random sampling of three provinces, two buying centres per province, six villages supplying each centre, and c. 16 farmers per village (total 177-198 farmers per province). Daily prices at buying centres, farm gate and international (monthly rolling averages) were compared in price transmission regressions.
In Central Cameroon where POs were strong, average price/kg cocoa increased by about 10% (4-14%) for members. Farmers reportedly sold better quality cocoa through the cooperatives. Spillover effects of market information to non-members was observed, with cooperatives publishing prices. Having better market information increased price obtained from individual traders by around 3%. (These results did not hold for the south and southwest of the country which sell only a small amount of cocoa and cooperatives are very weak.)
Access to markets/increased sales Improved quality Improved prices + Improved incomes Other: Positive spillover effects, market information
Not mentioned
Wollni and Zeller 2007 [OBS]
Costa Rica, two regions, export coffee, 2003
Costa Rican cooperatives are farmer-owned and process about 40% of the national coffee production. They pursue an open membership policy, which
Multistage cluster sampling within cantons and districts, final sample 216 HH in 26 villages. HH survey, and multivariate regression analysis.
Small-scale farmers are more likely than others to market their coffee through cooperative channels. Marketing through cooperatives increases the average price obtained by about 7% (0.05 US$/lb, with mean price $0.68 and st dev $0.12/lb) Access to information about world market prices improves prices by 0.03$/lb. Direct marketing channels such as Fair Trade offer a quality premium of an
Access to markets/increased sales Improved quality Improved prices + Improved incomes Other: Small-scale farmers are more likely than others to market
The study was funded by aid, as there was interest in increasing support to cooperatives and specialist channels, but there was no mention of
58
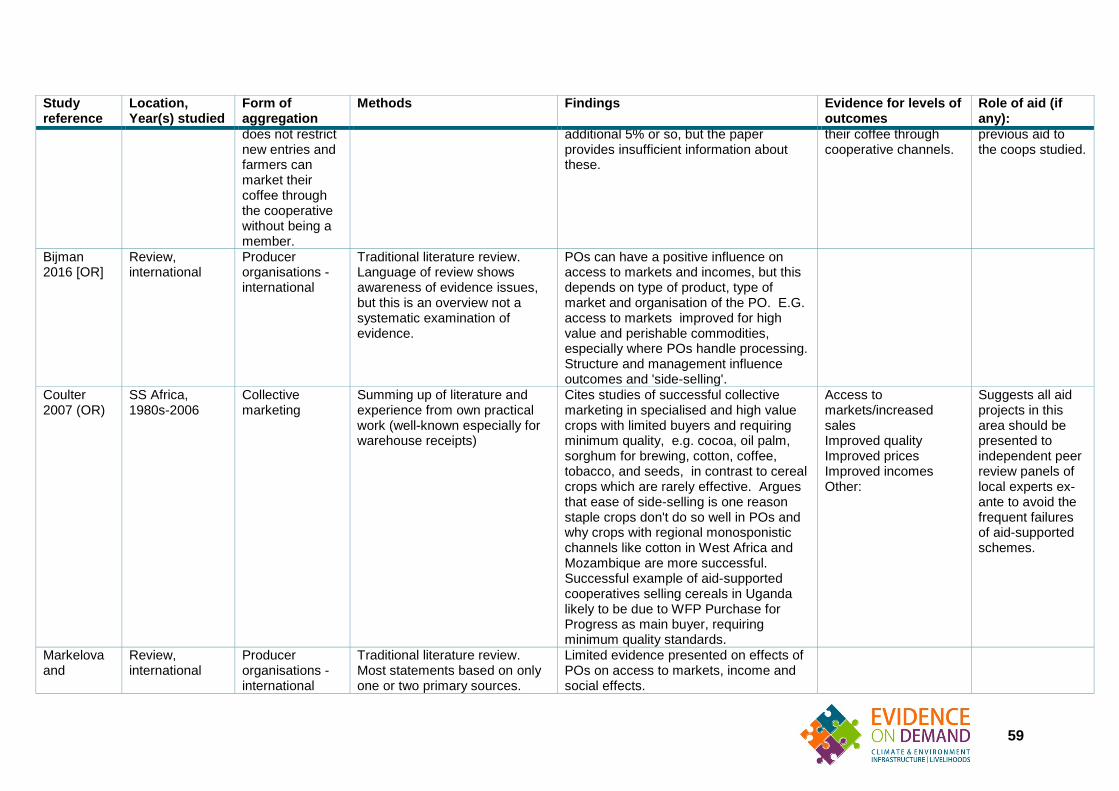
Study reference
Location, Year(s) studied
Form of aggregation
Methods Findings Evidence for levels of outcomes
Role of aid (if any):
does not restrict new entries and farmers can market their coffee through the cooperative without being a member.
additional 5% or so, but the paper provides insufficient information about these.
their coffee through cooperative channels.
previous aid to the coops studied.
Bijman 2016 [OR]
Review, international
Producer organisations - international
Traditional literature review. Language of review shows awareness of evidence issues, but this is an overview not a systematic examination of evidence.
POs can have a positive influence on access to markets and incomes, but this depends on type of product, type of market and organisation of the PO. E.G. access to markets improved for high value and perishable commodities, especially where POs handle processing. Structure and management influence outcomes and 'side-selling'.
Coulter 2007 (OR)
SS Africa, 1980s-2006
Collective marketing
Summing up of literature and experience from own practical work (well-known especially for warehouse receipts)
Cites studies of successful collective marketing in specialised and high value crops with limited buyers and requiring minimum quality, e.g. cocoa, oil palm, sorghum for brewing, cotton, coffee, tobacco, and seeds, in contrast to cereal crops which are rarely effective. Argues that ease of side-selling is one reason staple crops don't do so well in POs and why crops with regional monosponistic channels like cotton in West Africa and Mozambique are more successful. Successful example of aid-supported cooperatives selling cereals in Uganda likely to be due to WFP Purchase for Progress as main buyer, requiring minimum quality standards.
Access to markets/increased sales Improved quality Improved prices Improved incomes Other:
Suggests all aid projects in this area should be presented to independent peer review panels of local experts ex-ante to avoid the frequent failures of aid-supported schemes.
Markelova and
Review, international
Producer organisations - international
Traditional literature review. Most statements based on only one or two primary sources.
Limited evidence presented on effects of POs on access to markets, income and social effects.
59
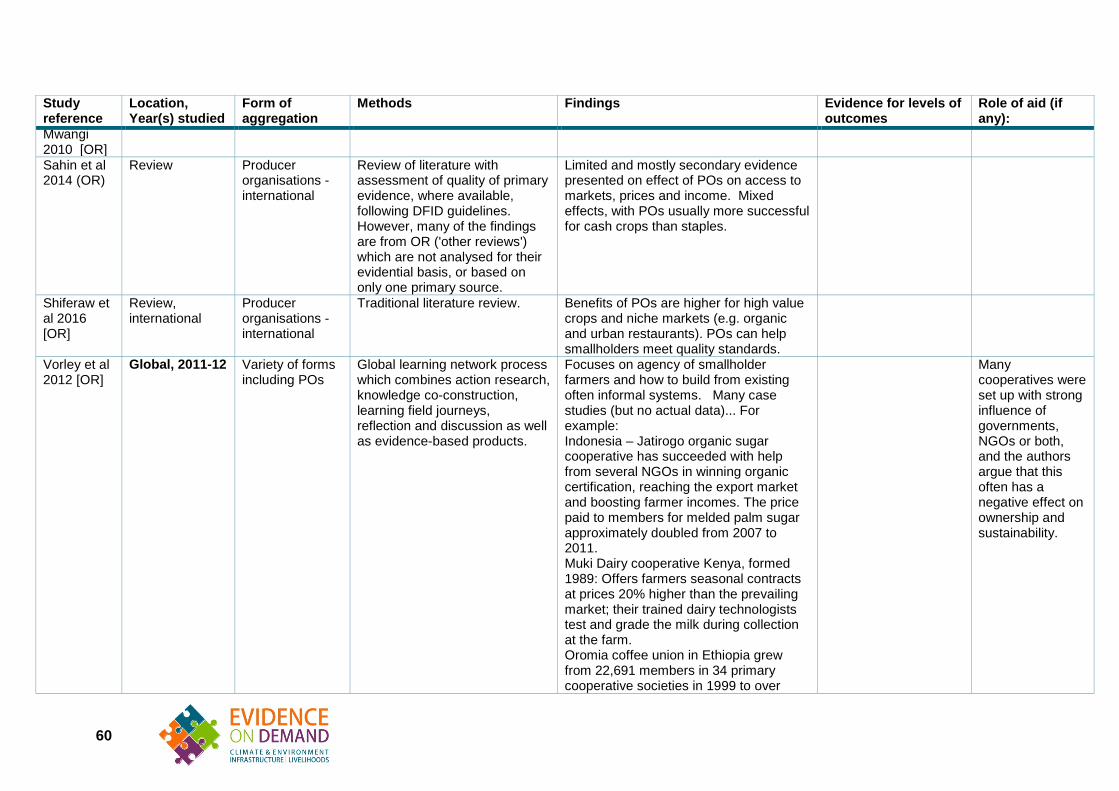
Study reference
Location, Year(s) studied
Form of aggregation
Methods Findings Evidence for levels of outcomes
Role of aid (if any):
Mwangi 2010 [OR] Sahin et al 2014 (OR)
Review Producer organisations - international
Review of literature with assessment of quality of primary evidence, where available, following DFID guidelines. However, many of the findings are from OR ('other reviews') which are not analysed for their evidential basis, or based on only one primary source.
Limited and mostly secondary evidence presented on effect of POs on access to markets, prices and income. Mixed effects, with POs usually more successful for cash crops than staples.
Shiferaw et al 2016 [OR]
Review, international
Producer organisations - international
Traditional literature review. Benefits of POs are higher for high value crops and niche markets (e.g. organic and urban restaurants). POs can help smallholders meet quality standards.
Vorley et al 2012 [OR]
Global, 2011-12 Variety of forms including POs
Global learning network process which combines action research, knowledge co-construction, learning field journeys, reflection and discussion as well as evidence-based products.
Focuses on agency of smallholder farmers and how to build from existing often informal systems. Many case studies (but no actual data)... For example: Indonesia – Jatirogo organic sugar cooperative has succeeded with help from several NGOs in winning organic certification, reaching the export market and boosting farmer incomes. The price paid to members for melded palm sugar approximately doubled from 2007 to 2011. Muki Dairy cooperative Kenya, formed 1989: Offers farmers seasonal contracts at prices 20% higher than the prevailing market; their trained dairy technologists test and grade the milk during collection at the farm. Oromia coffee union in Ethiopia grew from 22,691 members in 34 primary cooperative societies in 1999 to over
Many cooperatives were set up with strong influence of governments, NGOs or both, and the authors argue that this often has a negative effect on ownership and sustainability.
60
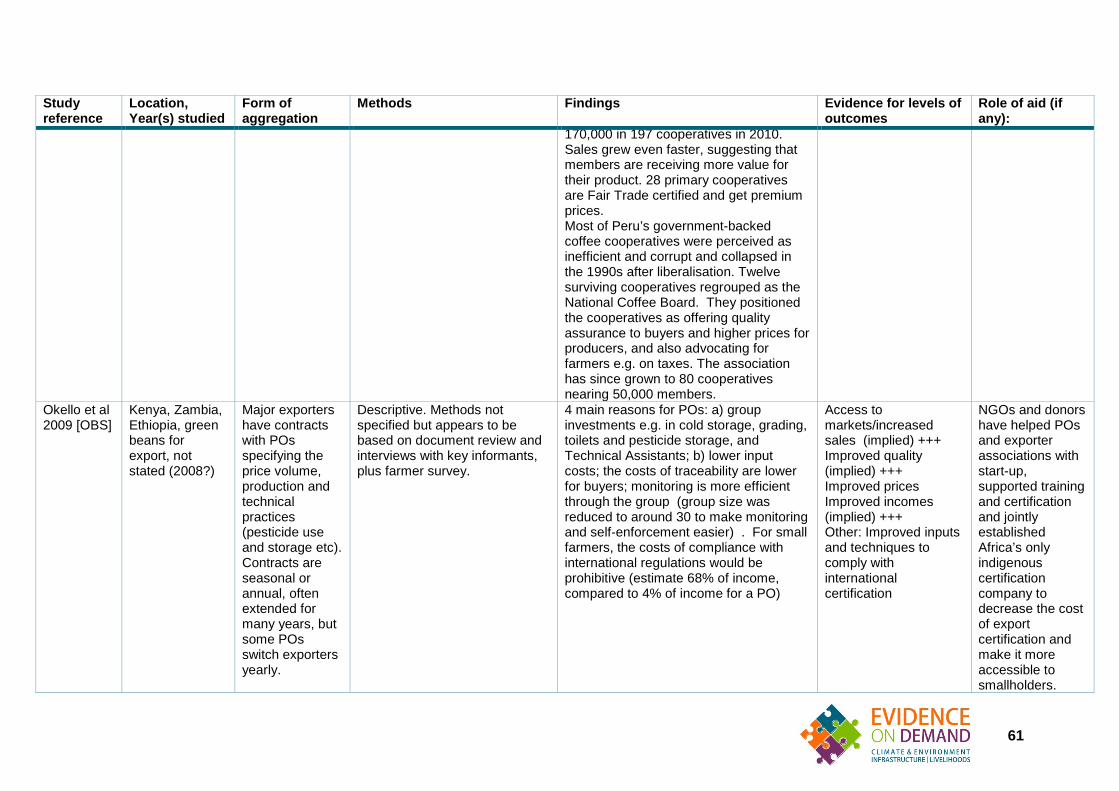
Study reference
Location, Year(s) studied
Form of aggregation
Methods Findings Evidence for levels of outcomes
Role of aid (if any):
170,000 in 197 cooperatives in 2010. Sales grew even faster, suggesting that members are receiving more value for their product. 28 primary cooperatives are Fair Trade certified and get premium prices. Most of Peru’s government-backed coffee cooperatives were perceived as inefficient and corrupt and collapsed in the 1990s after liberalisation. Twelve surviving cooperatives regrouped as the National Coffee Board. They positioned the cooperatives as offering quality assurance to buyers and higher prices for producers, and also advocating for farmers e.g. on taxes. The association has since grown to 80 cooperatives nearing 50,000 members.
Okello et al 2009 [OBS]
Kenya, Zambia, Ethiopia, green beans for export, not stated (2008?)
Major exporters have contracts with POs specifying the price volume, production and technical practices (pesticide use and storage etc). Contracts are seasonal or annual, often extended for many years, but some POs switch exporters yearly.
Descriptive. Methods not specified but appears to be based on document review and interviews with key informants, plus farmer survey.
4 main reasons for POs: a) group investments e.g. in cold storage, grading, toilets and pesticide storage, and Technical Assistants; b) lower input costs; the costs of traceability are lower for buyers; monitoring is more efficient through the group (group size was reduced to around 30 to make monitoring and self-enforcement easier) . For small farmers, the costs of compliance with international regulations would be prohibitive (estimate 68% of income, compared to 4% of income for a PO)
Access to markets/increased sales (implied) +++ Improved quality (implied) +++ Improved prices Improved incomes (implied) +++ Other: Improved inputs and techniques to comply with international certification
NGOs and donors have helped POs and exporter associations with start-up, supported training and certification and jointly established Africa’s only indigenous certification company to decrease the cost of export certification and make it more accessible to smallholders.
61
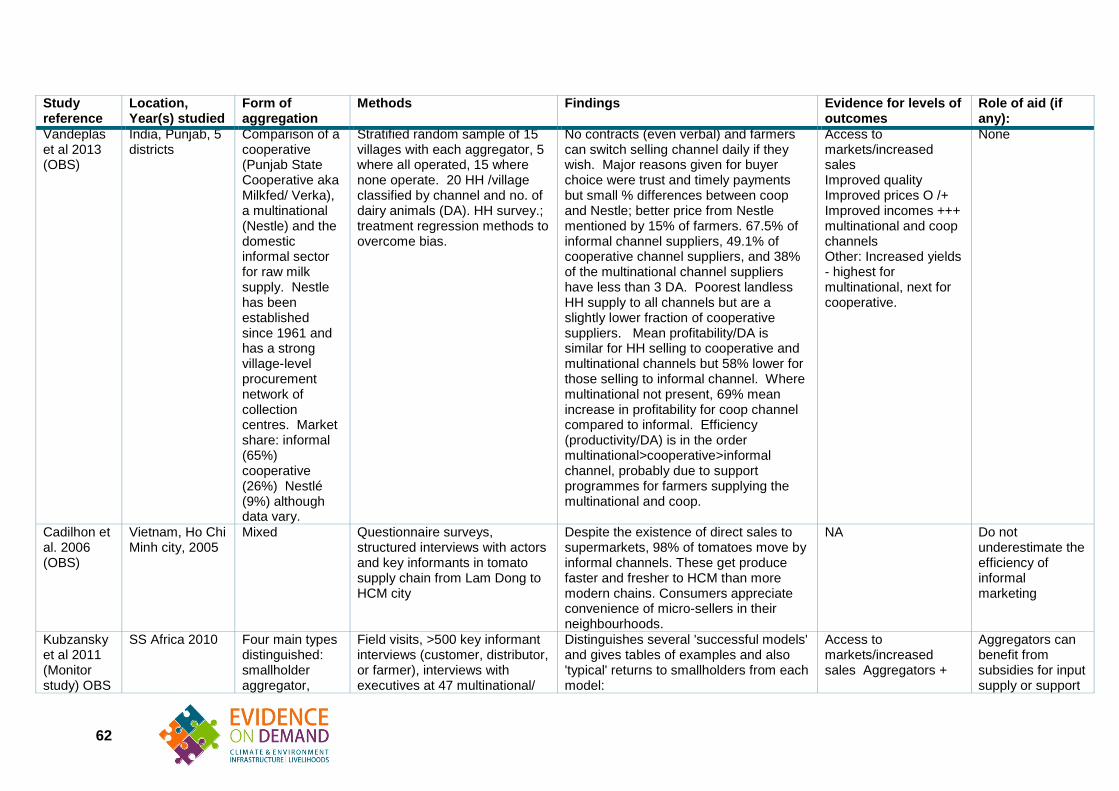
Study reference
Location, Year(s) studied
Form of aggregation
Methods Findings Evidence for levels of outcomes
Role of aid (if any):
Vandeplas et al 2013 (OBS)
India, Punjab, 5 districts
Comparison of a cooperative (Punjab State Cooperative aka Milkfed/ Verka), a multinational (Nestle) and the domestic informal sector for raw milk supply. Nestle has been established since 1961 and has a strong village-level procurement network of collection centres. Market share: informal (65%) cooperative (26%) Nestlé (9%) although data vary.
Stratified random sample of 15 villages with each aggregator, 5 where all operated, 15 where none operate. 20 HH /village classified by channel and no. of dairy animals (DA). HH survey.; treatment regression methods to overcome bias.
No contracts (even verbal) and farmers can switch selling channel daily if they wish. Major reasons given for buyer choice were trust and timely payments but small % differences between coop and Nestle; better price from Nestle mentioned by 15% of farmers. 67.5% of informal channel suppliers, 49.1% of cooperative channel suppliers, and 38% of the multinational channel suppliers have less than 3 DA. Poorest landless HH supply to all channels but are a slightly lower fraction of cooperative suppliers. Mean profitability/DA is similar for HH selling to cooperative and multinational channels but 58% lower for those selling to informal channel. Where multinational not present, 69% mean increase in profitability for coop channel compared to informal. Efficiency (productivity/DA) is in the order multinational>cooperative>informal channel, probably due to support programmes for farmers supplying the multinational and coop.
Access to markets/increased sales Improved quality Improved prices O /+ Improved incomes +++ multinational and coop channels Other: Increased yields - highest for multinational, next for cooperative.
None
Cadilhon et al. 2006 (OBS)
Vietnam, Ho Chi Minh city, 2005
Mixed Questionnaire surveys, structured interviews with actors and key informants in tomato supply chain from Lam Dong to HCM city
Despite the existence of direct sales to supermarkets, 98% of tomatoes move by informal channels. These get produce faster and fresher to HCM than more modern chains. Consumers appreciate convenience of micro-sellers in their neighbourhoods.
NA Do not underestimate the efficiency of informal marketing
Kubzansky et al 2011 (Monitor study) OBS
SS Africa 2010 Four main types distinguished: smallholder aggregator,
Field visits, >500 key informant interviews (customer, distributor, or farmer), interviews with executives at 47 multinational/
Distinguishes several 'successful models' and gives tables of examples and also 'typical' returns to smallholders from each model:
Access to markets/increased sales Aggregators +
Aggregators can benefit from subsidies for input supply or support
62
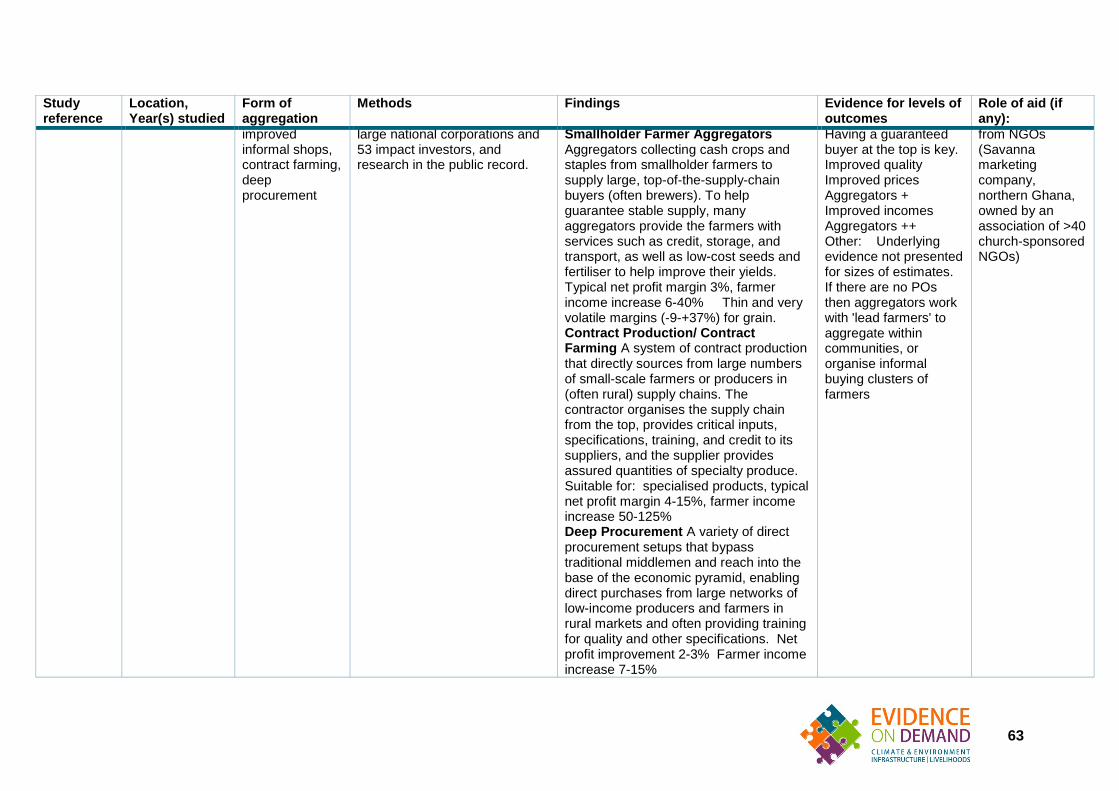
Study reference
Location, Year(s) studied
Form of aggregation
Methods Findings Evidence for levels of outcomes
Role of aid (if any):
improved informal shops, contract farming, deep procurement
large national corporations and 53 impact investors, and research in the public record.
Smallholder Farmer Aggregators Aggregators collecting cash crops and staples from smallholder farmers to supply large, top-of-the-supply-chain buyers (often brewers). To help guarantee stable supply, many aggregators provide the farmers with services such as credit, storage, and transport, as well as low-cost seeds and fertiliser to help improve their yields. Typical net profit margin 3%, farmer income increase 6-40% Thin and very volatile margins (-9-+37%) for grain. Contract Production/ Contract Farming A system of contract production that directly sources from large numbers of small-scale farmers or producers in (often rural) supply chains. The contractor organises the supply chain from the top, provides critical inputs, specifications, training, and credit to its suppliers, and the supplier provides assured quantities of specialty produce. Suitable for: specialised products, typical net profit margin 4-15%, farmer income increase 50-125% Deep Procurement A variety of direct procurement setups that bypass traditional middlemen and reach into the base of the economic pyramid, enabling direct purchases from large networks of low-income producers and farmers in rural markets and often providing training for quality and other specifications. Net profit improvement 2-3% Farmer income increase 7-15%
Having a guaranteed buyer at the top is key. Improved quality Improved prices Aggregators + Improved incomes Aggregators ++ Other: Underlying evidence not presented for sizes of estimates. If there are no POs then aggregators work with 'lead farmers' to aggregate within communities, or organise informal buying clusters of farmers
from NGOs (Savanna marketing company, northern Ghana, owned by an association of >40 church-sponsored NGOs)
63

Study reference
Location, Year(s) studied
Form of aggregation
Methods Findings Evidence for levels of outcomes
Role of aid (if any):
Also cites: agrodealers who sell inputs and buy outputs, and parastatals like Kenya tea or Ghana cocoa which can work well but are out of scope of study
Xhoxhi et al. 2014 (OBS)
Turkey, Adana, 2013
Data collected in Adana and Mersin with farmers who produced corn, citrus, wheat, sunflower, and watermelon, March to June 2012. Semi-structured interviews were carried out with 13 key informants of distribution channels (e.g., farmers, local buyers, exporters, etc.) Stratified random sample of 92 farmers in 4 districts around Adana. Analysed by regression.
Paper explored perceived power of farmers and intermediaries in marketing chains. For farmers, their power depended on farm size matters most of all, followed by need for money and perceived dependence of intermediary
NA
Smalley 2013(OR)
Africa Mixed Review of literature Records successes and drawbacks seen with contracting. Contract farming is not that it is an inherently pro-poor farming model — which is certainly not supported by the literature — or that it is inherently harmful to the rural poor, but that the outcomes of contract farming schemes are highly variable and depend on key determining factors not always fully explored in research. Key factors that affect outcomes include terms of contracts or employment; behaviour of employers; nature of crop; legal and institutional conditions; and local circumstances.
USAID 2015 (OR)
Various LICs and MICs
Various including POs and linking smallholders to large
10 aid projects selected for detailed study (due to better data) from a shortlist of 50 project cases through a call for
Many positive income and poverty effects recorded, but not possible to separate effect of marketing channel from other value chain support. Main lessons for marketing summarised in our Annex XX
Access to markets/increased sales Improved quality Improved prices
Projects supported by USAID and other donors. All 10 projects had
64

Study reference
Location, Year(s) studied
Form of aggregation
Methods Findings Evidence for levels of outcomes
Role of aid (if any):
wholesalers and mills (sometimes through contracts sometimes not)
submissions and snowball sampling.
(more detailed discussion available in this paper).
Improved incomes Other:
closed although three had follow-on phases approved at time of study.
65
Top Related