


Languages
Pages
Legal

© Copyr i gh t 2014 O SIs o f t , LLC .
Presented by
Product Quality Giveaway
Reduction Program
Supported by PI System
Zsolt Nagy
Senior Engineer - MOL
© Copyr i gh t 2014 O SIs o f t , LLC .
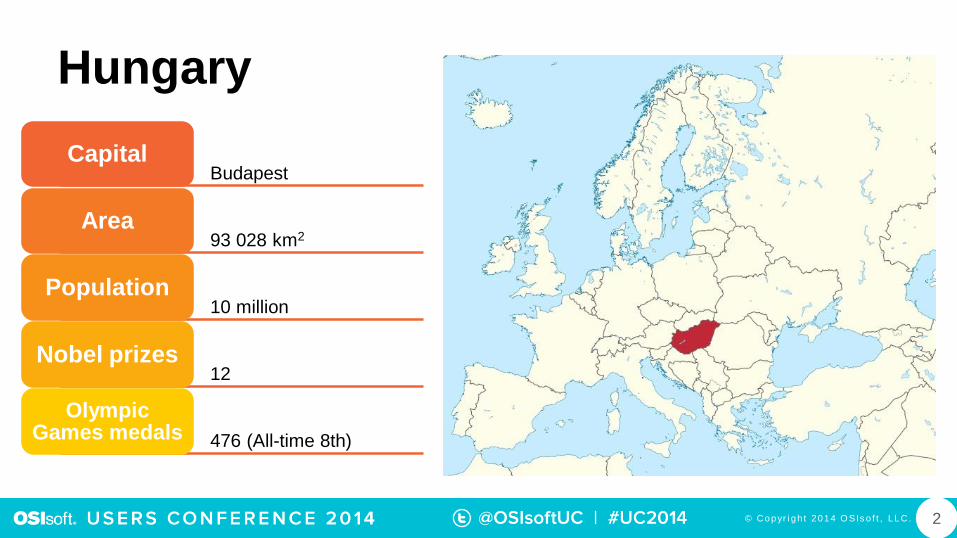
Hungary
BudapestCapital
93 028 km2Area
10 millionPopulation
12Nobel prizes
476 (All-time 8th)
Olympic Games medals
2
© Copyr i gh t 2014 O SIs o f t , LLC . 3

© Copyr i gh t 2014 O SIs o f t , LLC .
PI System Portfolio in MOL
PI ClientsPublish data via
PI ProcessBook
PI DataLink
PI Coresight
PI WebParts
PI SDKDeveloped
applications to support refinery
functions
PI AssetFrameworkCollect data from the
field and create unified asset
hierarchy
PI Notifications
Alerting platform based upon the PI
AF architecture
PI ACEWrite complex
equations, which are reusable for similar
data sets
4

© Copyr i gh t 2014 O SIs o f t , LLC .
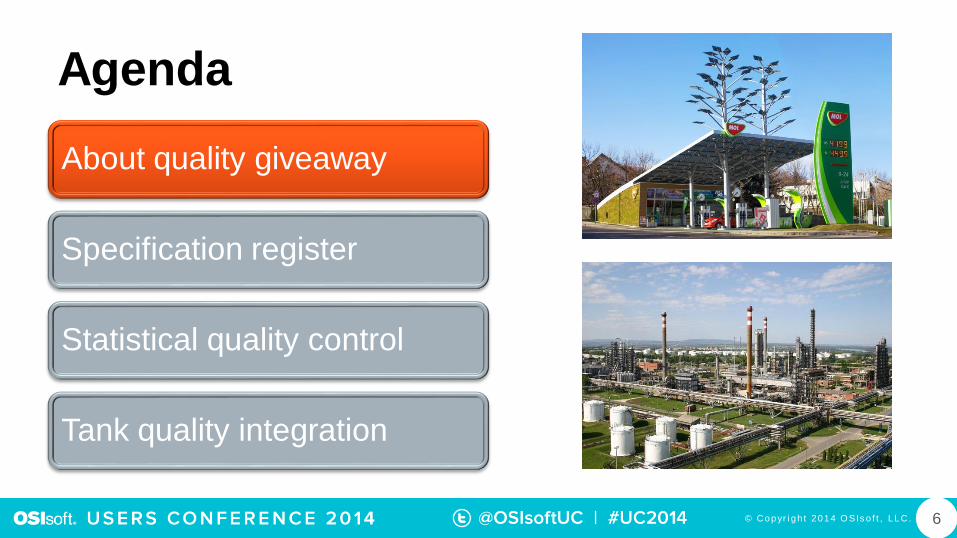
Agenda
About quality giveaway
Specification register
Statistical quality control
Tank quality integration
5
© Copyr i gh t 2014 O SIs o f t , LLC .
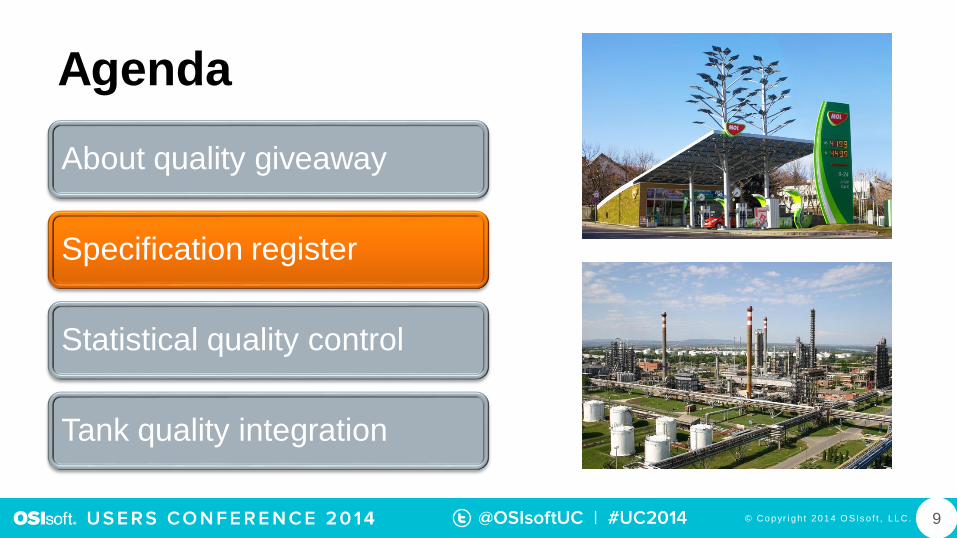
Agenda
About quality giveaway
Specification register
Statistical quality control
Tank quality integration
6
© Copyr i gh t 2014 O SIs o f t , LLC .
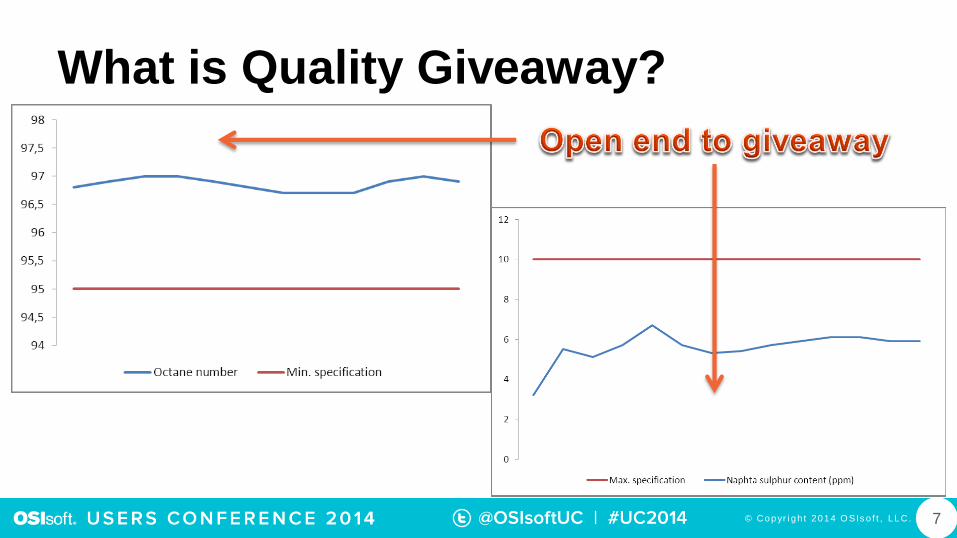
What is Quality Giveaway?
7
© Copyr i gh t 2014 O SIs o f t , LLC .
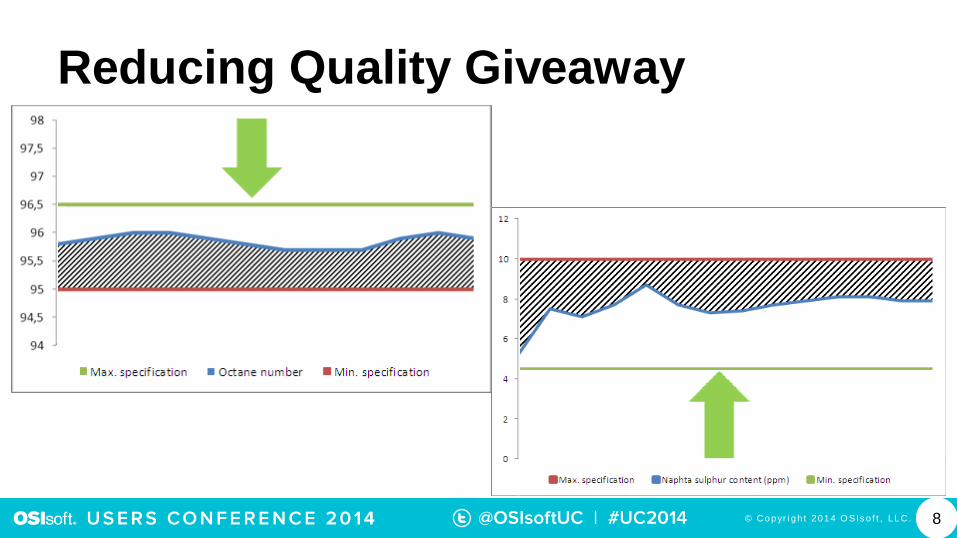
Reducing Quality Giveaway
8
© Copyr i gh t 2014 O SIs o f t , LLC .
Agenda
About quality giveaway
Specification register
Statistical quality control
Tank quality integration
9
© Copyr i gh t 2014 O SIs o f t , LLC .
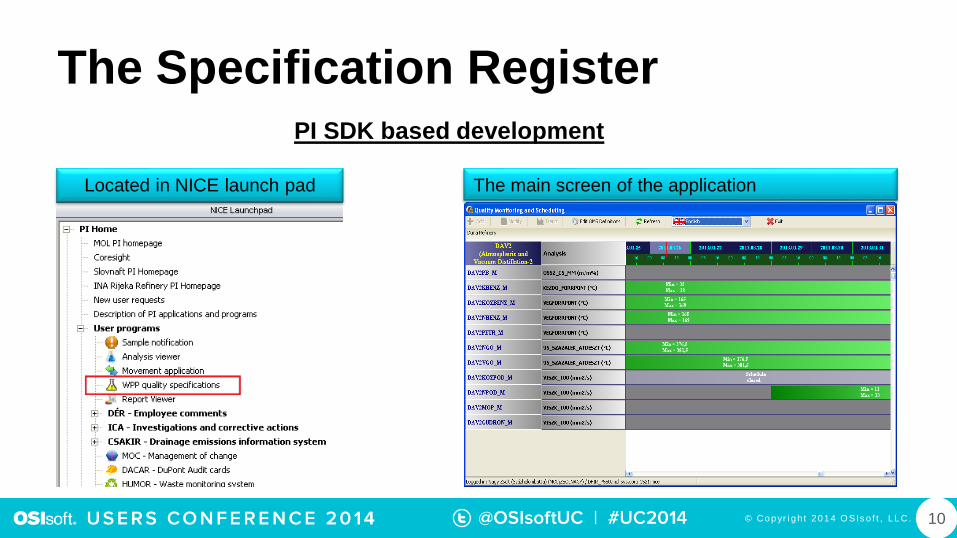
The Specification Register
Located in NICE launch pad The main screen of the application
10
PI SDK based development
© Copyr i gh t 2014 O SIs o f t , LLC .
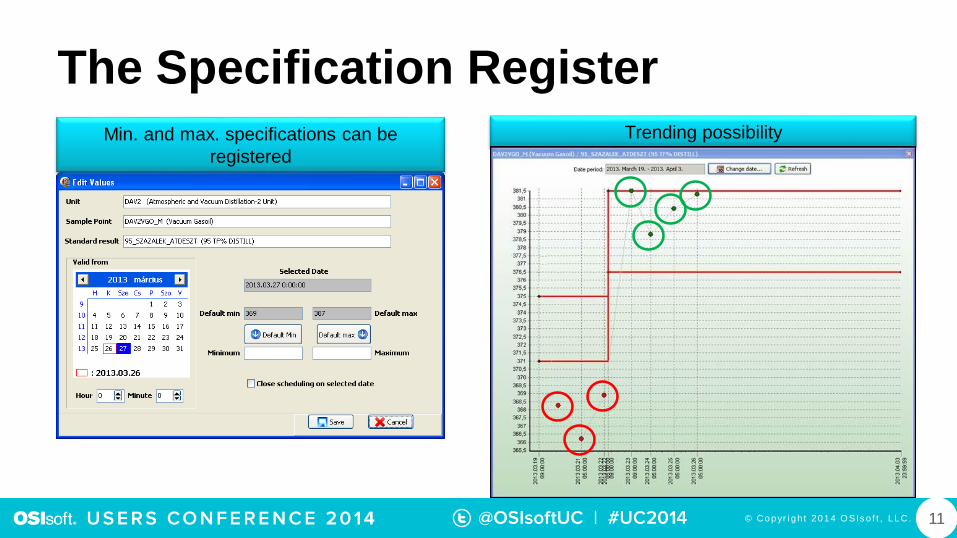
The Specification Register
Min. and max. specifications can be
registered
Trending possibility
11

© Copyr i gh t 2014 O SIs o f t , LLC .
Records minimum and maximum specifications to the PI System to make these data more accessible for …
The Specification Register
• PI DataLink
• PI ProcessBook
• PI Coresight
… PI Clients for easier expert examinations
• Advanced process controls (APC)
• KPI system (SEMAFOR)
• Opralog (E-logbook)
… other systems
12
© Copyr i gh t 2014 O SIs o f t , LLC .
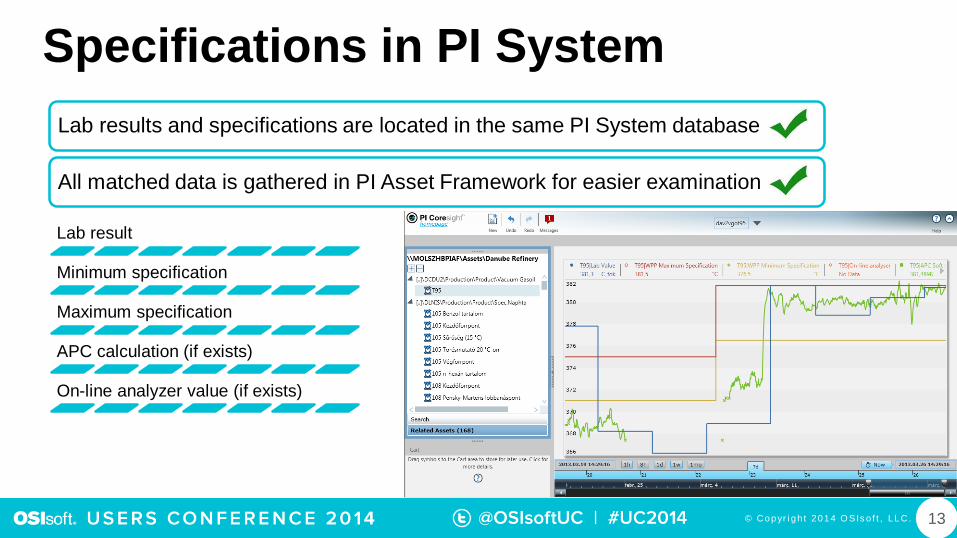
Lab results and specifications are located in the same PI System database
All matched data is gathered in PI Asset Framework for easier examination
Specifications in PI System
Lab result
Minimum specification
Maximum specification
APC calculation (if exists)
On-line analyzer value (if exists)
13

© Copyr i gh t 2014 O SIs o f t , LLC .
Agenda
About quality giveaway
Specification register
Statistical quality control
Tank quality integration
14
© Copyr i gh t 2014 O SIs o f t , LLC .
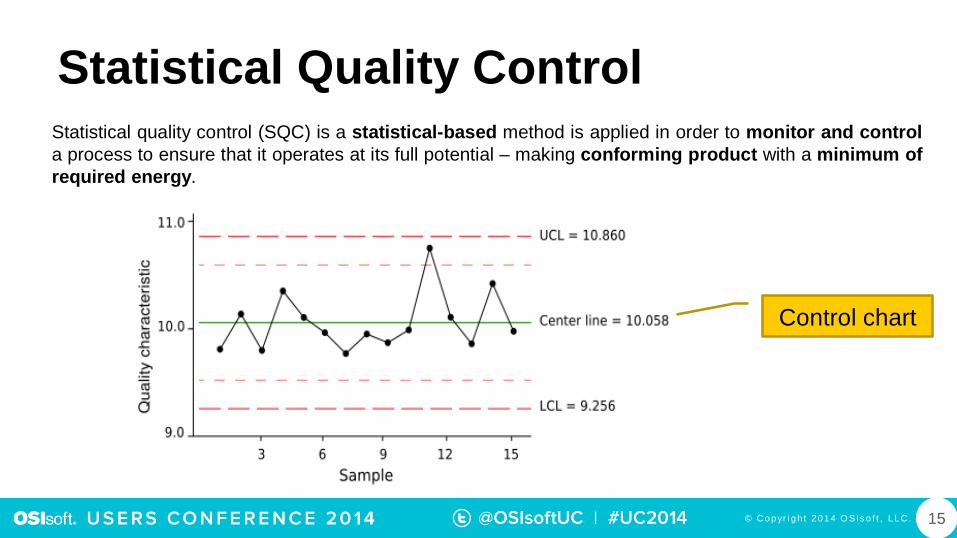
Statistical Quality Control
Control chart
Statistical quality control (SQC) is a statistical-based method is applied in order to monitor and control
a process to ensure that it operates at its full potential – making conforming product with a minimum of
required energy.
15
© Copyr i gh t 2014 O SIs o f t , LLC .
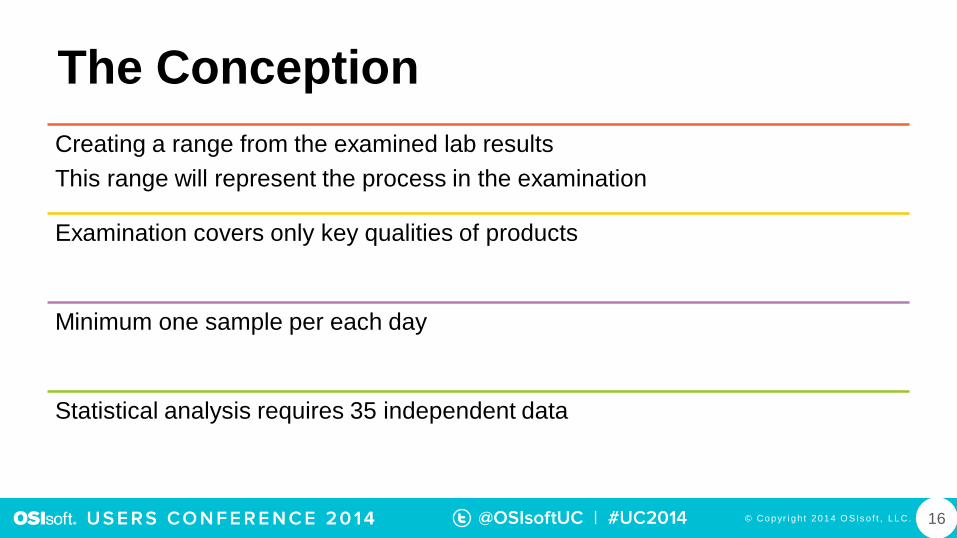
The Conception
Creating a range from the examined lab results
This range will represent the process in the examination
Examination covers only key qualities of products
Minimum one sample per each day
Statistical analysis requires 35 independent data
16

© Copyr i gh t 2014 O SIs o f t , LLC .
Basics of the Examination
Characterizing 5 specifics of the process
Fits in the range
Keeps hard limit
Keeps soft limit
Efficiency
Being controlled
17
© Copyr i gh t 2014 O SIs o f t , LLC .
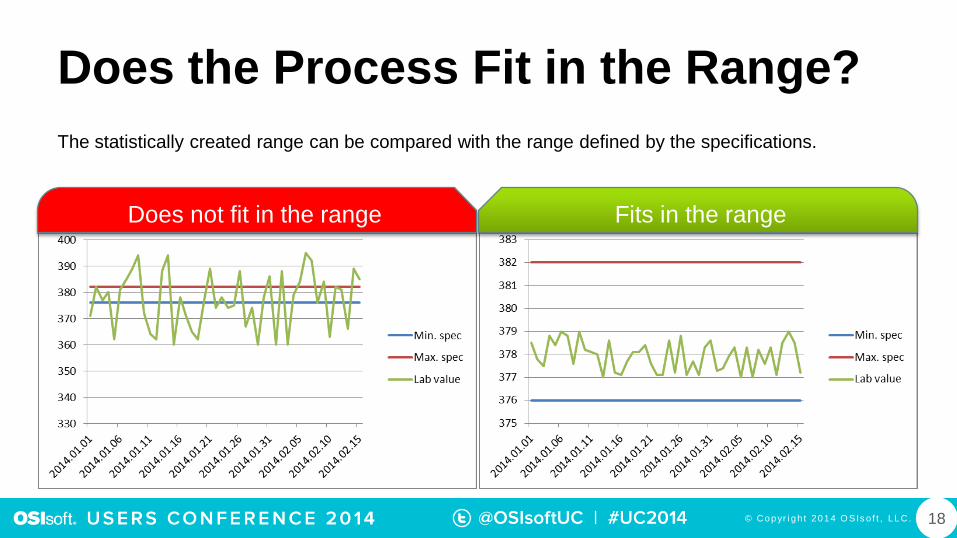
Does the Process Fit in the Range?
The statistically created range can be compared with the range defined by the specifications.
Does not fit in the range Fits in the range
18

© Copyr i gh t 2014 O SIs o f t , LLC .
Does the Process Fit in the Range?
The statistically created range can be compared with the range defined by the specifications.
Does not fit in the range Fits in the range
19

© Copyr i gh t 2014 O SIs o f t , LLC .
Does the Process Keep Hard Limit?
Lab values are stepping over the hard limit.
Does not keep hard limit Keeps hard limit
20
© Copyr i gh t 2014 O SIs o f t , LLC .
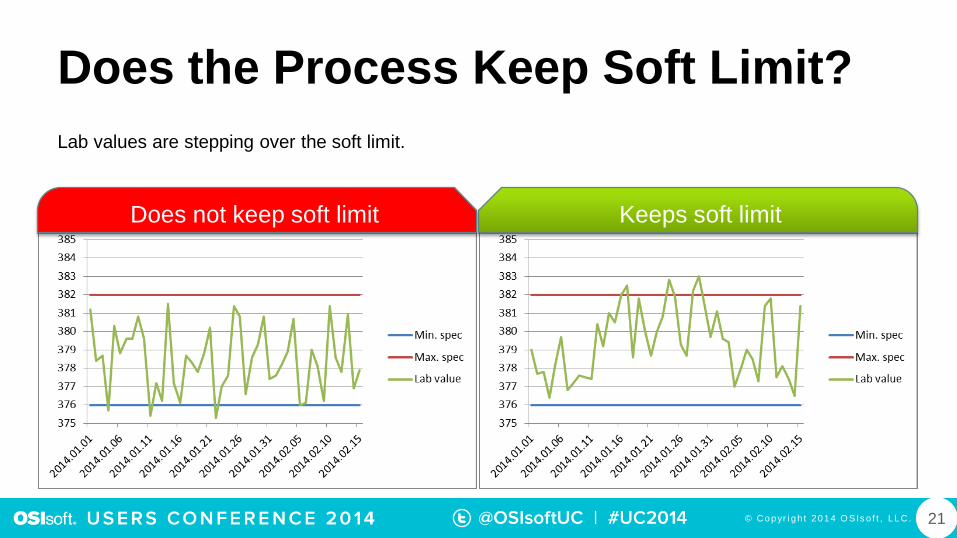
Does the Process Keep Soft Limit?
Lab values are stepping over the soft limit.
Does not keep soft limit Keeps soft limit
21
© Copyr i gh t 2014 O SIs o f t , LLC .
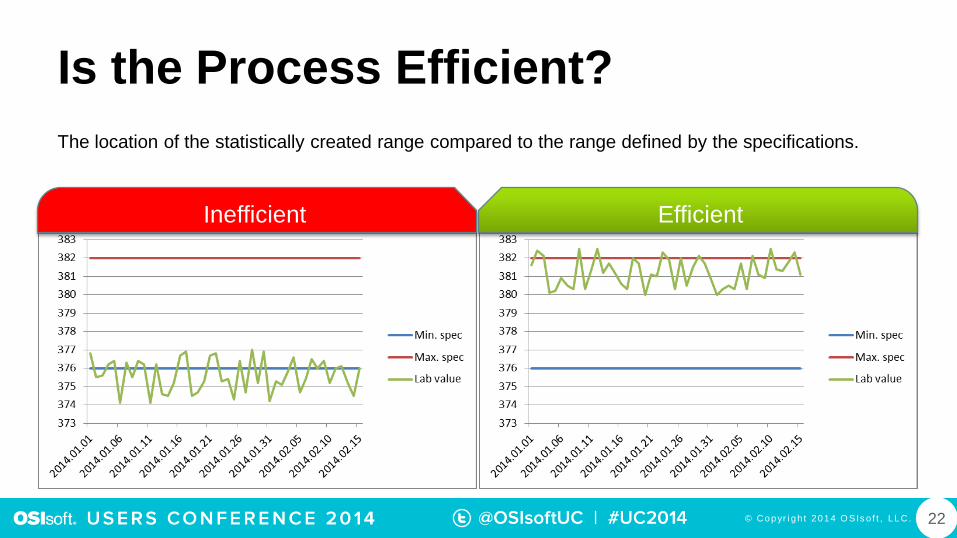
Is the Process Efficient?
The location of the statistically created range compared to the range defined by the specifications.
Inefficient Efficient
22
© Copyr i gh t 2014 O SIs o f t , LLC .
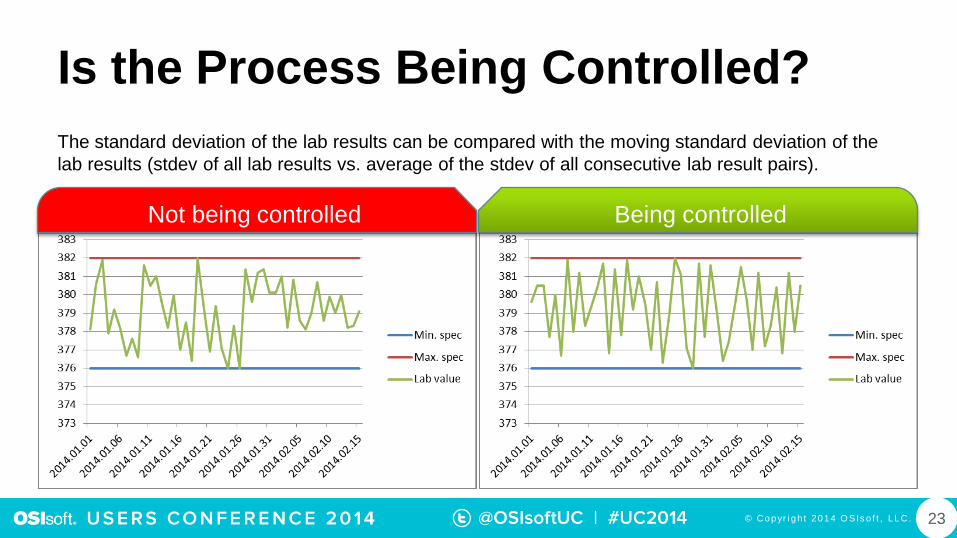
Is the Process Being Controlled?
The standard deviation of the lab results can be compared with the moving standard deviation of the
lab results (stdev of all lab results vs. average of the stdev of all consecutive lab result pairs).
Not being controlled Being controlled
23
© Copyr i gh t 2014 O SIs o f t , LLC .
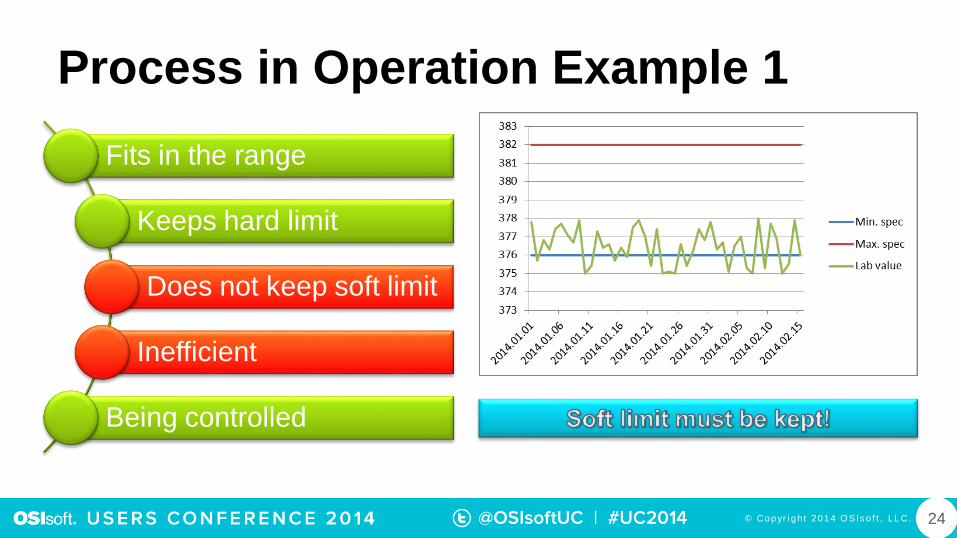
Process in Operation Example 1
Fits in the range
Keeps hard limit
Does not keep soft limit
Inefficient
Being controlled
24

© Copyr i gh t 2014 O SIs o f t , LLC .
Process in Operation Example 2
Fits in the range
Keeps hard limit
Keeps soft limit
Inefficient
Not being controlled
25
© Copyr i gh t 2014 O SIs o f t , LLC .
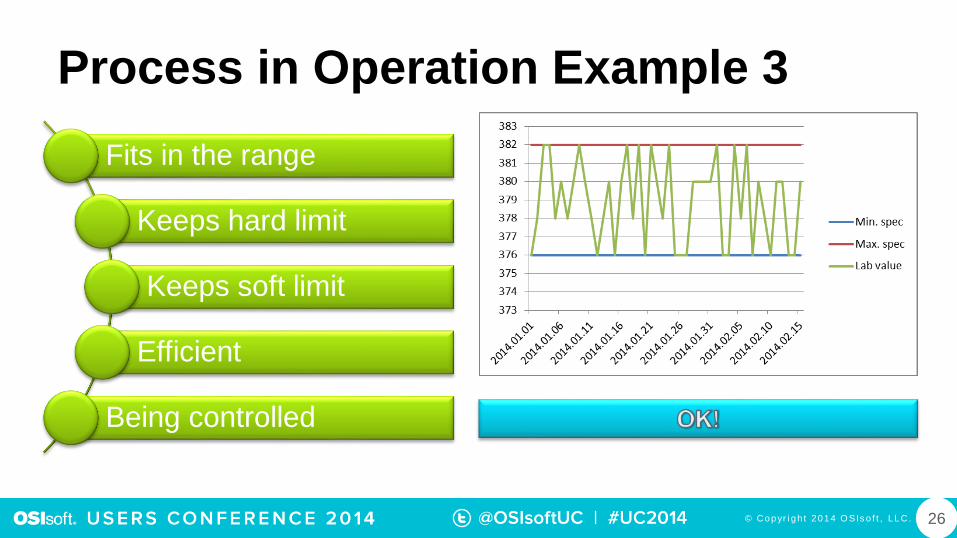
Process in Operation Example 3
Fits in the range
Keeps hard limit
Keeps soft limit
Efficient
Being controlled
26

© Copyr i gh t 2014 O SIs o f t , LLC .
Agenda
About quality giveaway
Specification register
Statistical quality control
Tank quality integration
27

© Copyr i gh t 2014 O SIs o f t , LLC .
ProblemInappropriate place of sampling (POS) for qualification
Temporary violation of limits in in-line analyzer can be allowed
Product quality in tank is important, it is more robust to loads
28
© Copyr i gh t 2014 O SIs o f t , LLC .
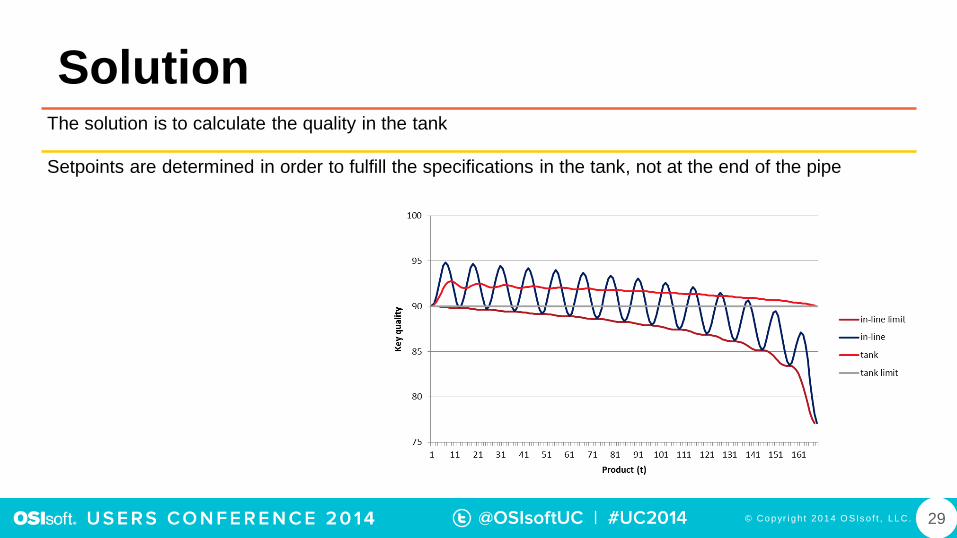
SolutionThe solution is to calculate the quality in the tank
Setpoints are determined in order to fulfill the specifications in the tank, not at the end of the pipe
29
© Copyr i gh t 2014 O SIs o f t , LLC .
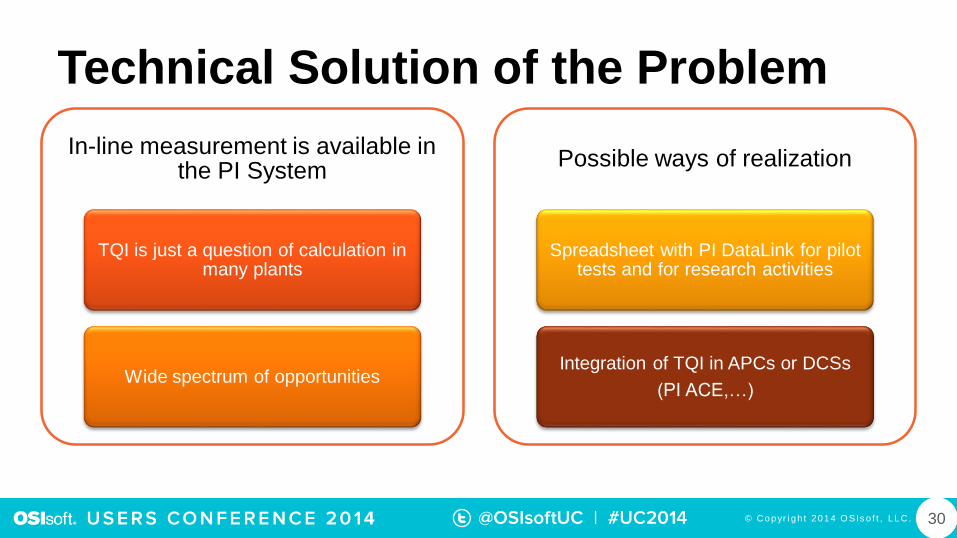
Technical Solution of the Problem
In-line measurement is available in the PI System
TQI is just a question of calculation in many plants
Wide spectrum of opportunities
Possible ways of realization
Spreadsheet with PI DataLink for pilot tests and for research activities
Integration of TQI in APCs or DCSs
(PI ACE,…)
30
© Copyr i gh t 2014 O SIs o f t , LLC .
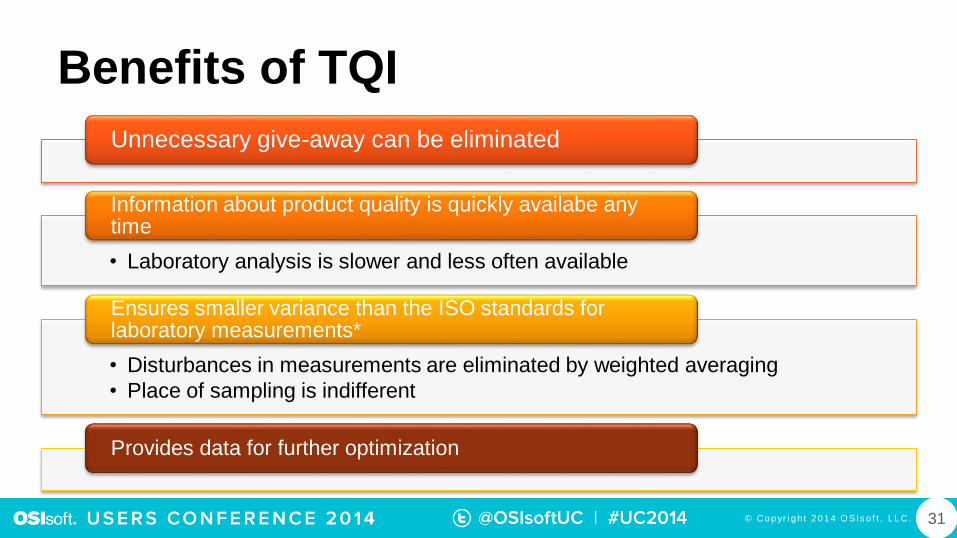
Benefits of TQI
Unnecessary give-away can be eliminated
• Laboratory analysis is slower and less often available
Information about product quality is quickly availabe any time
• Disturbances in measurements are eliminated by weighted averaging
• Place of sampling is indifferent
Ensures smaller variance than the ISO standards for laboratory measurements*
Provides data for further optimization
31
© Copyr i gh t 2014 O SIs o f t , LLC .
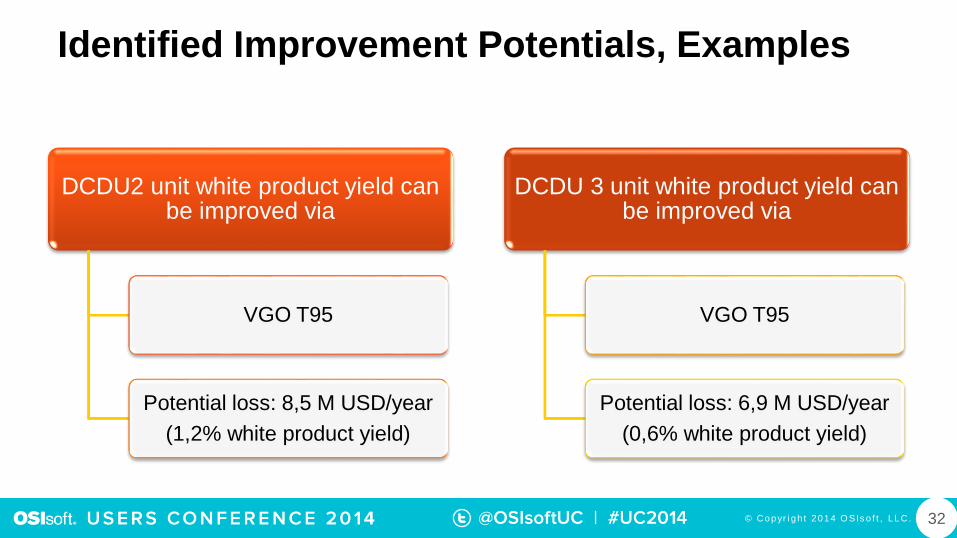
Identified Improvement Potentials, Examples
DCDU2 unit white product yield can be improved via
VGO T95
Potential loss: 8,5 M USD/year
(1,2% white product yield)
DCDU 3 unit white product yield can be improved via
VGO T95
Potential loss: 6,9 M USD/year
(0,6% white product yield)
32

© Copyr i gh t 2014 O SIs o f t , LLC .
Future Plans
33
Specification register
Roll-out to other sites
SQC
Project initiation in
2015
TQI
Project initiation in
2015

© Copyr i gh t 2014 O SIs o f t , LLC .
Zsolt Nagy
H-2443
Százhalombatta
P.O.Box. 1.
34

© Copyr i gh t 2014 O SIs o f t , LLC .
Brought to you by
Top Related