


Languages
Pages
Legal

Process Improvementsfor Software Quality and Reliability
Victor R. Basili
Institute for Advanced Computer StudiesDepartment of Computer Science
University of Marylandand
Fraunhofer Center - Maryland
OUTLINE
The Software Business
Measurement:The Goal Question Metric Paradigm
Process Improvement:The Quality Improvement Paradigm
Evolutionary Learning:The Experience Factory
An Example Experience Factory
THE SOFTWARE BUSINESSBusiness Requirements
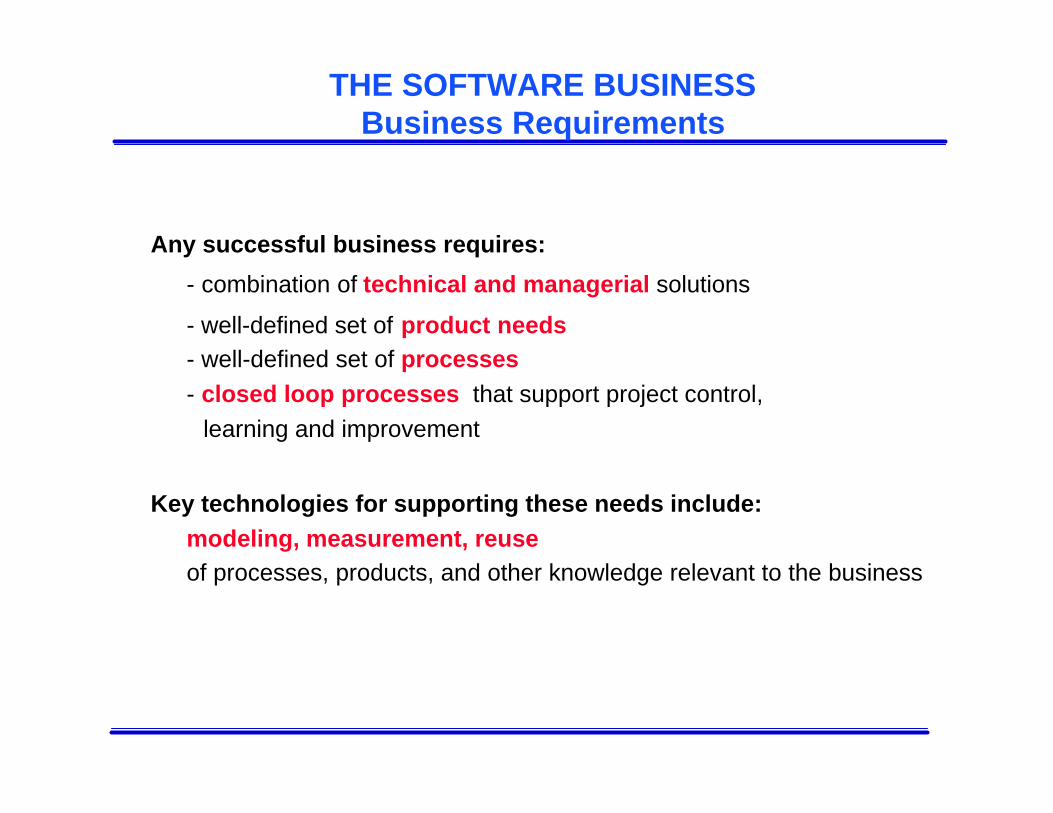
Any successful business requires:
- combination of technical and managerial solutions
- well-defined set of product needs- well-defined set of processes- closed loop processes that support project control,
learning and improvement
Key technologies for supporting these needs include:modeling, measurement, reuseof processes, products, and other knowledge relevant to the business

THE SOFTWARE BUSINESS Implications for the Software Business
Understand the process and product
Define process and product qualities
Evaluate successes and failures
Feedback information for project control
Learn from our experiences
Package successful experiences and core competencies
Use those experiences and core competencies
THE SOFTWARE BUSINESSThe Nature of Software
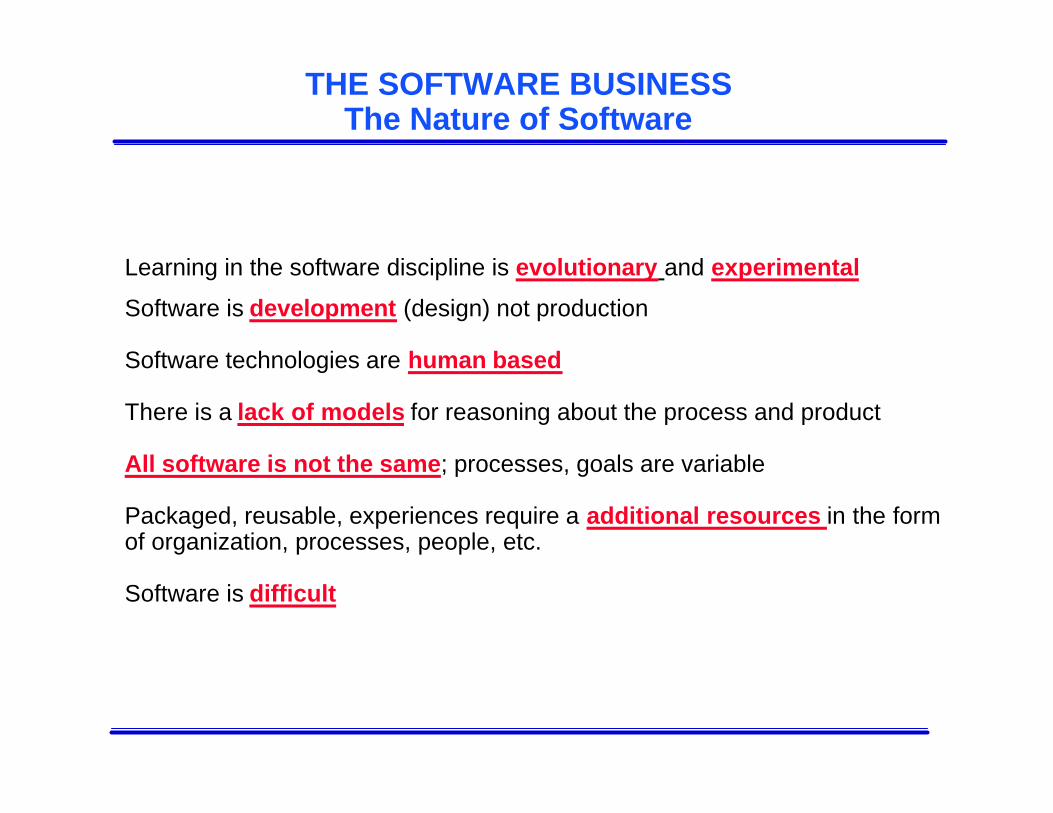
Learning in the software discipline is evolutionary and experimental
Software is development (design) not production
Software technologies are human based
There is a lack of models for reasoning about the process and product
All software is not the same; processes, goals are variable
Packaged, reusable, experiences require a additional resources in the formof organization, processes, people, etc.
Software is difficult

THE SOFTWARE BUSINESSSoftware Quality Needs
Quality Definition: Define qualities and quality goals operationally relative tothe project and the organization
Process Selection: Find criteria for selecting the appropriate methods and toolsand tailoring them to the needs of the project and the organization
Quality Evaluation: Evaluate the quality of the process and product relative tothe specific project and organizational goals
Quality Organization: Organize quality assurance from planning throughexecution through evaluation, feedback and improvement
THE SOFTWARE BUSINESSThe Pyramid of Quality
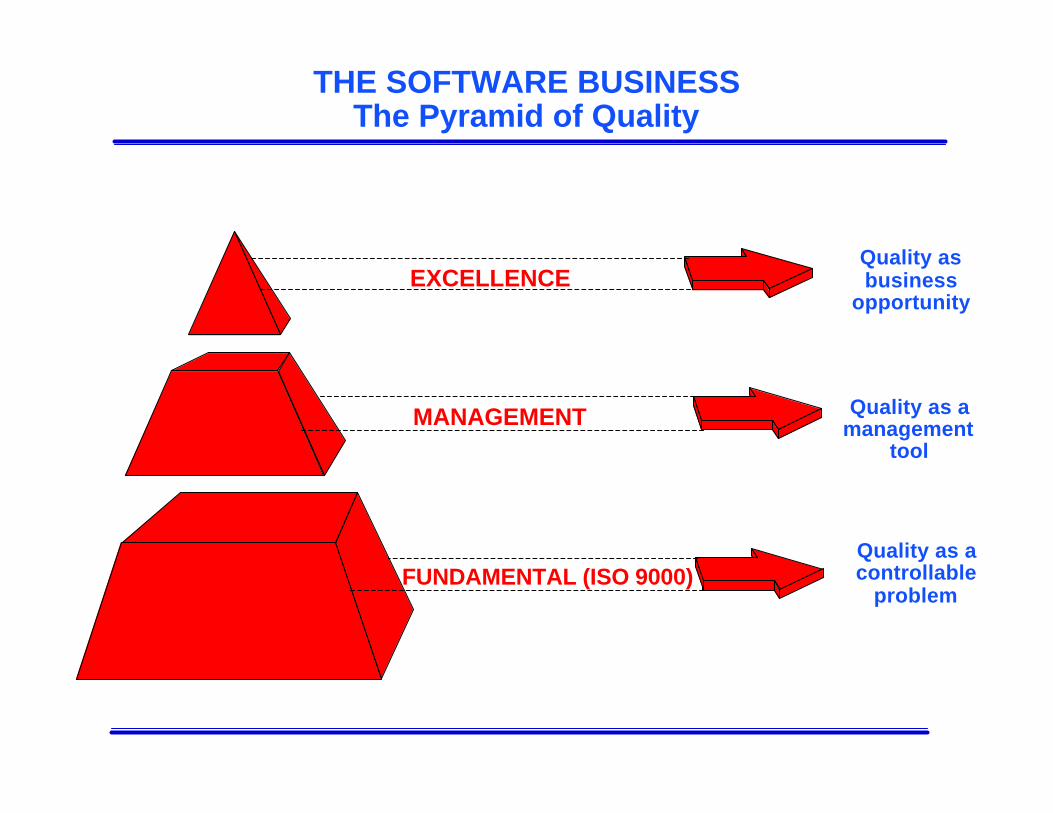
Quality asbusiness
opportunity
Quality as acontrollable
problemFUNDAMENTAL (ISO 9000)
EXCELLENCE
Quality as amanagement
tool
MANAGEMENT
Towards Software Quality Improvement
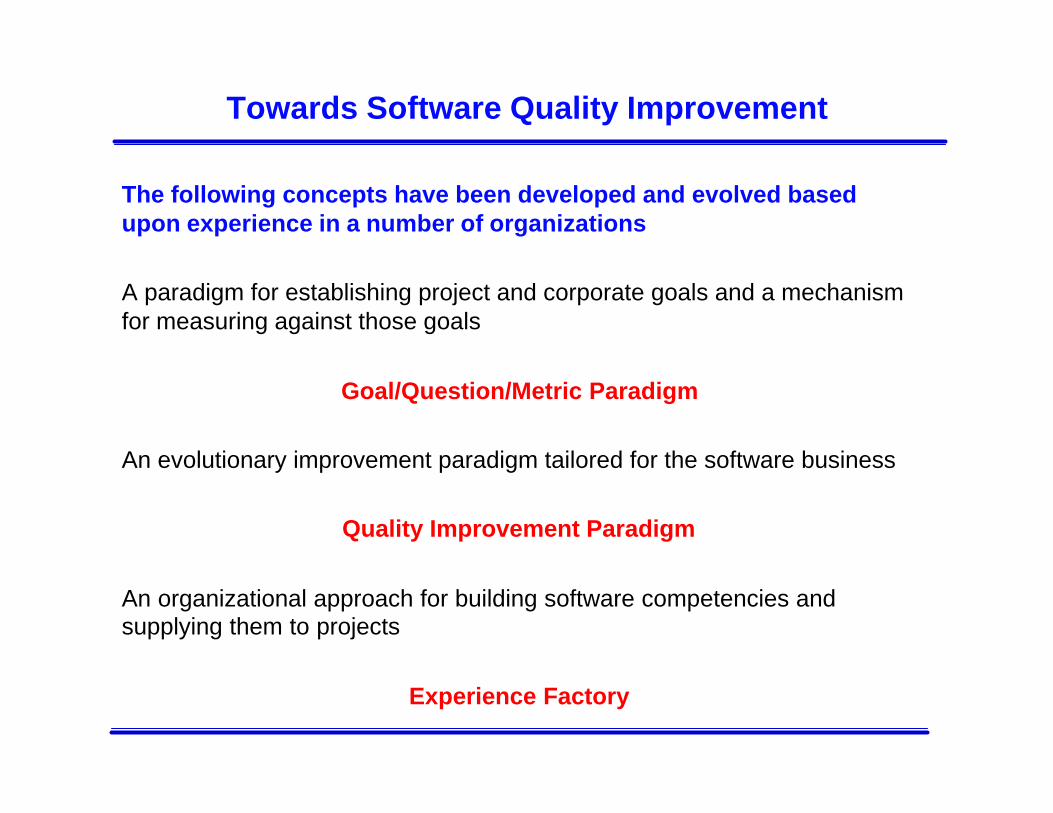
The following concepts have been developed and evolved basedupon experience in a number of organizations
A paradigm for establishing project and corporate goals and a mechanismfor measuring against those goals
Goal/Question/Metric Paradigm
An evolutionary improvement paradigm tailored for the software business
Quality Improvement Paradigm
An organizational approach for building software competencies andsupplying them to projects
Experience Factory

SOFTWARE MEASUREMENT
What can we do with measurement?
Create a corporate memory - baselines/models of current practicese.g., how much will a new project cost?
Determine strengths and weaknesses of the current process and producte.g., are certain types of errors commonplace?
Develop a rationale for adopting/refining techniquese.g., what techniques will minimize the problems, change the baselines?
Assess the impact of techniquese.g., does functional testing minimize certain error classes?
Evaluate the quality of the process/producte.g., are we applying inspections appropriately?
what is the reliability of the product after delivery?

SOFTWARE MEASUREMENT
Measurement is not just the collection of data/metrics
calendar time number of open problems
number of defects found in inspections
cyclomatic complexity machine time lines of code/module
total lines of code
severity of failures total effort
total number of defects lines of code/staff month
number of failures during system test
SOFTWARE MEASUREMENT
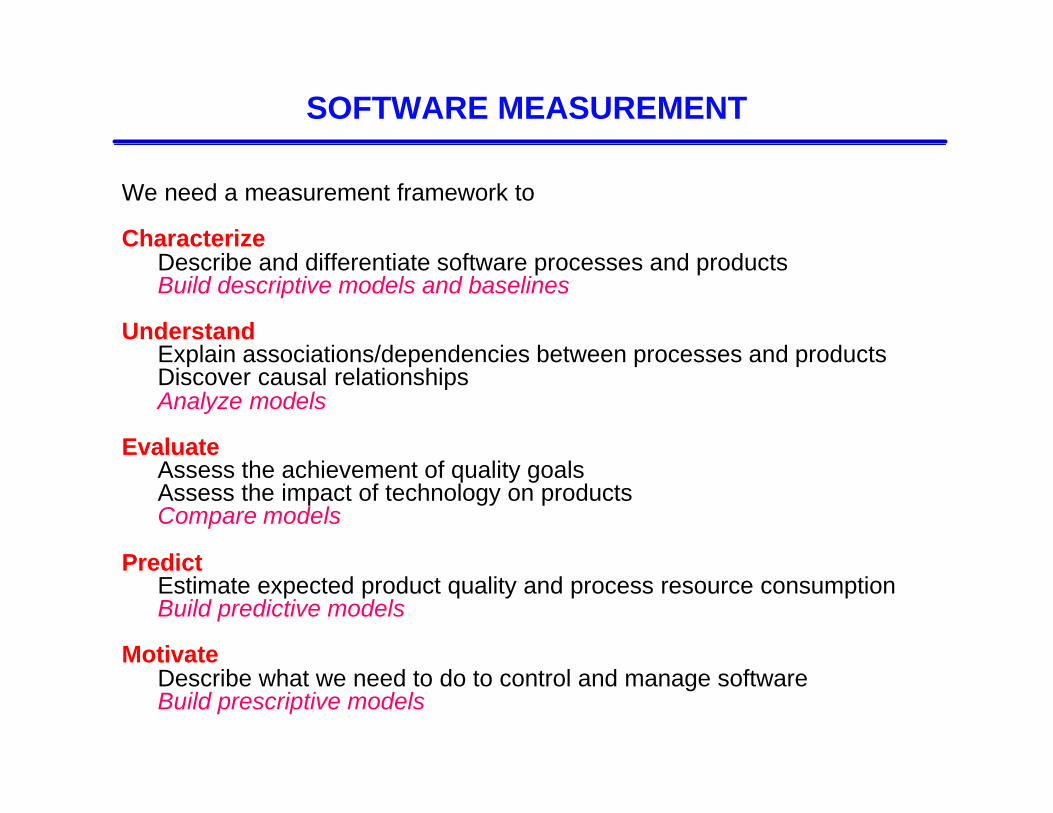
We need a measurement framework to
CharacterizeDescribe and differentiate software processes and productsBuild descriptive models and baselines
UnderstandExplain associations/dependencies between processes and productsDiscover causal relationshipsAnalyze models
EvaluateAssess the achievement of quality goalsAssess the impact of technology on productsCompare models
PredictEstimate expected product quality and process resource consumptionBuild predictive models
MotivateDescribe what we need to do to control and manage softwareBuild prescriptive models

MEASUREMENT FRAMEWORKS
Goal/Question/Metric Paradigm
A mechanism for defining and interpreting operational, measurable goals
It uses four parameters:
a model of an object of study,e.g., a process, product, or any other experience model
a model of one or more focuses,e.g., models that view the object of study for particular characteristics
a point of view,e.g., the perspective of the person needing the information
a purpose,e.g., how the results will be used
to generate a GQM model
relative to a particular environment
GOAL/QUESTION/METRIC PARADIGMGoal and Model Based Measurement
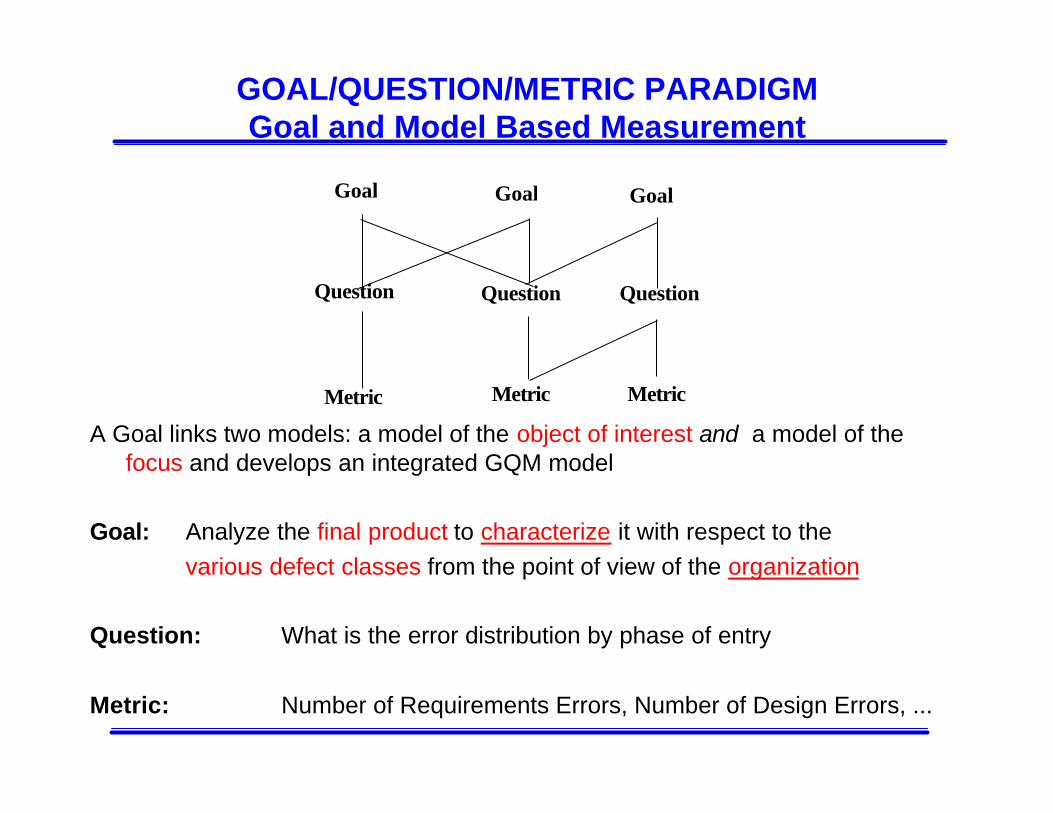
A Goal links two models: a model of the object of interest and a model of thefocus and develops an integrated GQM model
Goal: Analyze the final product to characterize it with respect to thevarious defect classes from the point of view of the organization
Question: What is the error distribution by phase of entry
Metric: Number of Requirements Errors, Number of Design Errors, ...
Goal Goal Goal
QuestionQuestion Question
Metric Metric Metric
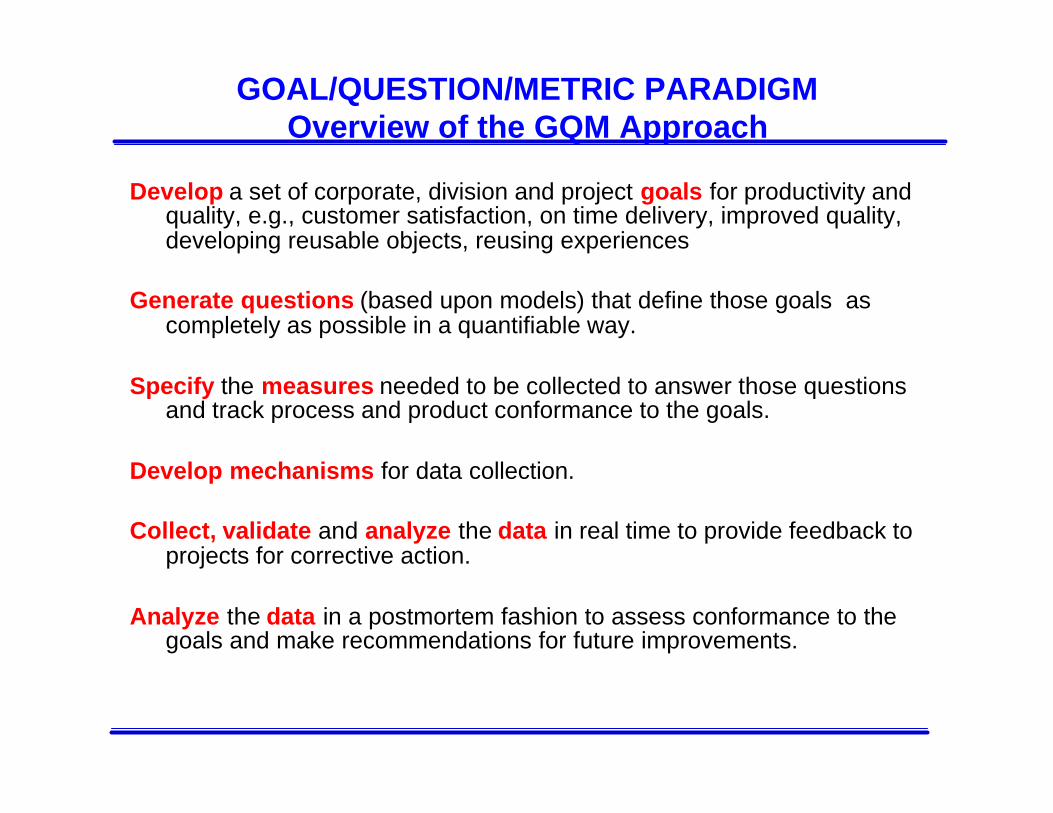
GOAL/QUESTION/METRIC PARADIGMOverview of the GQM Approach
Develop a set of corporate, division and project goals for productivity andquality, e.g., customer satisfaction, on time delivery, improved quality,developing reusable objects, reusing experiences
Generate questions (based upon models) that define those goals ascompletely as possible in a quantifiable way.
Specify the measures needed to be collected to answer those questionsand track process and product conformance to the goals.
Develop mechanisms for data collection.
Collect, validate and analyze the data in real time to provide feedback toprojects for corrective action.
Analyze the data in a postmortem fashion to assess conformance to thegoals and make recommendations for future improvements.
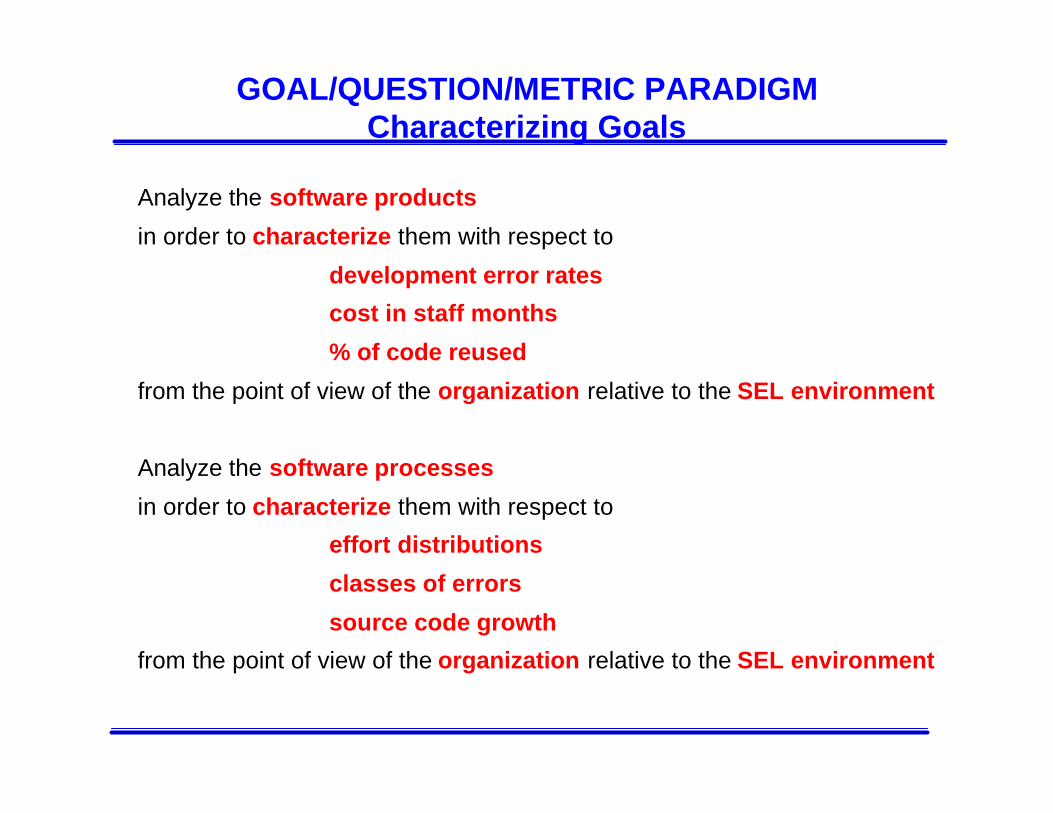
GOAL/QUESTION/METRIC PARADIGMCharacterizing Goals
Analyze the software products
in order to characterize them with respect to
development error rates
cost in staff months
% of code reused
from the point of view of the organization relative to the SEL environment
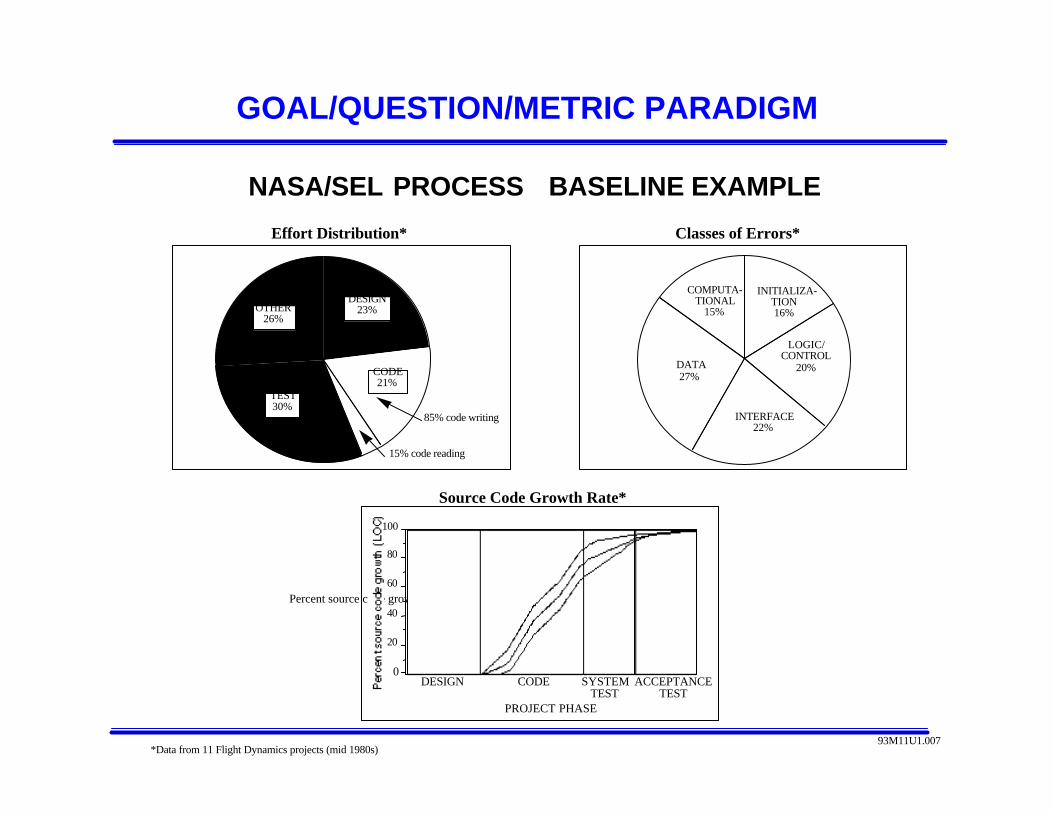
Analyze the software processes
in order to characterize them with respect to
effort distributions
classes of errors
source code growth
from the point of view of the organization relative to the SEL environment
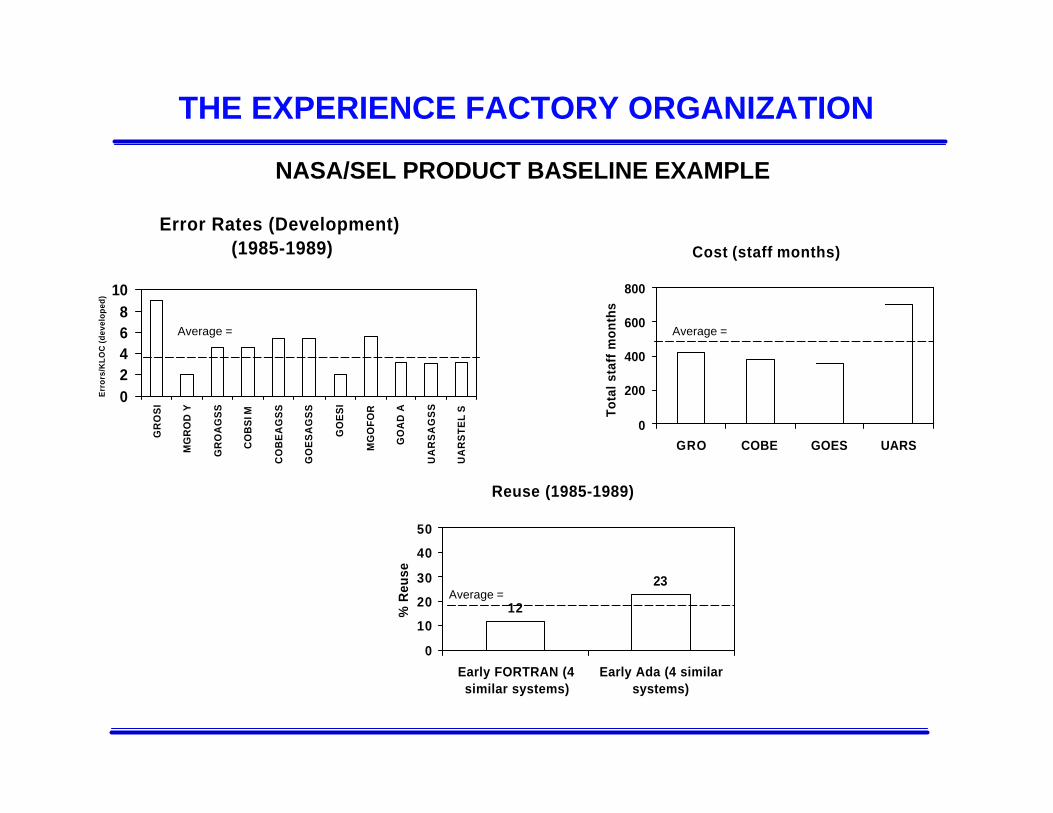
THE EXPERIENCE FACTORY ORGANIZATION
NASA/SEL PRODUCT BASELINE EXAMPLE
Error Rates (Development) (1985-1989)
02468
10
GR
OS
I
MG
RO
D Y
GR
OA
GS
S
CO
BS
I M
CO
BE
AG
SS
GO
ES
AG
SS
GO
ES
I
MG
OFO
R
GO
AD
A
UA
RS
AG
SS
UA
RS
TE
L S
Err
ors
/KL
OC
(dev
elo
ped
)
Cost (staff months)
0
200
400
600
800
GRO COBE GOES UARS
Tota
l sta
ff m
onth
s
Reuse (1985-1989)
12
23
0
10
20
30
40
50
Early FORTRAN (4similar systems)
Early Ada (4 similarsystems)
% R
euse
Average =
Average =Average =
GOAL/QUESTION/METRIC PARADIGM
*Data from 11 Flight Dynamics projects (mid 1980s)
COMPUTA-TIONAL
15%
DATA27%
INTERFACE 22%
LOGIC/CONTROL
20%
INITIALIZA- TION16%
TEST30%
DESIGN23%
CODE21%
OTHER 26%
85% code writing
15% code reading
NASA/SEL PROCESS BASELINE EXAMPLE
Effort Distribution* Classes of Errors*
Source Code Growth Rate*
93M11U1.007
Percent source code growth (LOC)
PROJECT PHASE
0
20
40
60
80
100
DESIGN CODE SYSTEMTEST
ACCEPTANCETEST
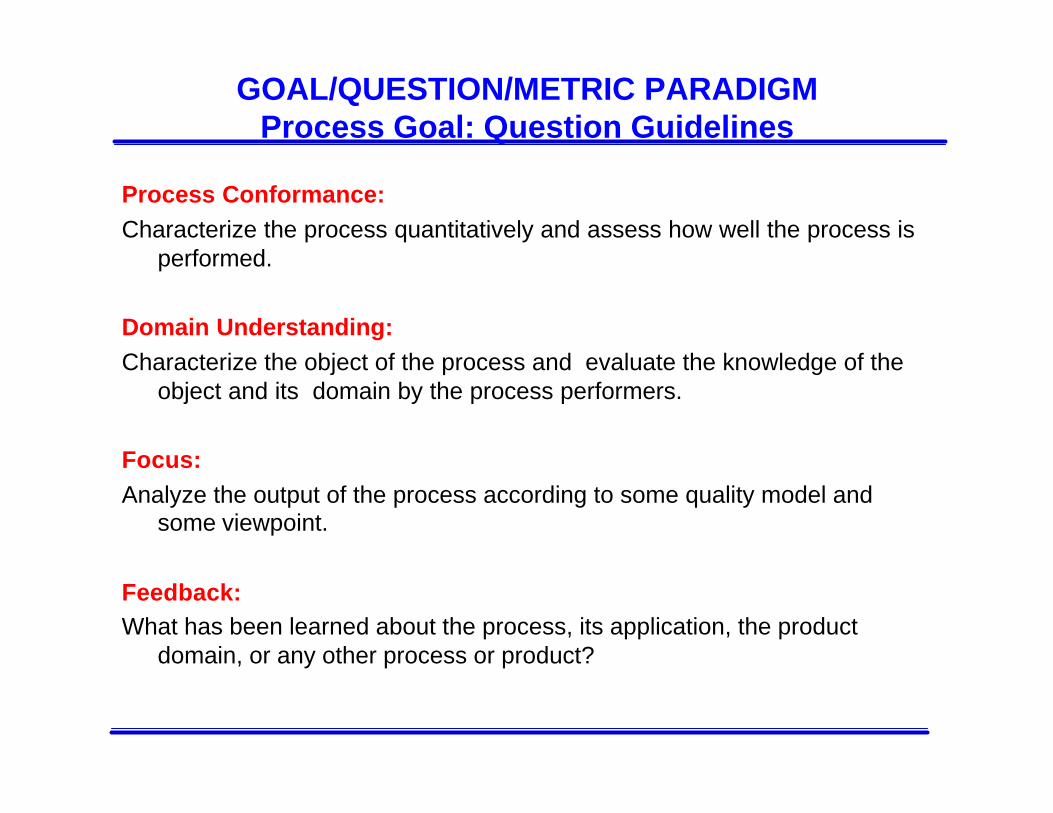
GOAL/QUESTION/METRIC PARADIGMProcess Goal: Question Guidelines
Process Conformance:Characterize the process quantitatively and assess how well the process is
performed.
Domain Understanding:Characterize the object of the process and evaluate the knowledge of the
object and its domain by the process performers.
Focus:Analyze the output of the process according to some quality model and
some viewpoint.
Feedback:What has been learned about the process, its application, the product
domain, or any other process or product?

GOAL/QUESTION/METRIC PARADIGMProcess Goal: Example
Analyze the system test process for the purpose of evaluation with respectto defect slippage from the point of view of the corporation.
System Test Process Model:Goal: Generate a set of tests consistent with the complexity and
importance of each requirement.
Procedure: (1) Enumerate the requirements, (2) Rate importance bymarketing, (3) Rate complexity by system tester, (4) ...
Defect Slippage Model:Let Fc = the ratio of faults found in system test to the faults found after
system test on this project.
Let Fs = the ratio of faults found in system test to the faults found aftersystem test in the set of projects used as a basis for comparison.
Let QF = Fc/Fs = the relationship of system test on this project to faults ascompared to the average the appropriate basis set.

GOAL/QUESTION/METRIC PARADIGMSimple Interpretation of Defect Slippage Model
if QF > 1 then method better than history check process conformance if process conformance poor
improve process or process conformance check domain understanding if domain conformance poor
improve object or domain trainingif QF = 1 then
method equivalent to history if cost lower than normal then method cost effective
check process conformanceif QF < 1 then
check process conformance if process conformance good
check domain conformanceif domain conformance good
method poor for this class of project

GOAL/QUESTION/METRIC PARADIGMProduct Goal: Question Guidelines
Product Model/Definition:Characterize the product qualitatively independent of the perspective ofinterest. Aspects of interest include:
Logical/Physical Attributes:Characterize the logical and physical attributes of the product e.g.,logical attributes: application domain, function
physical attributes: size, complexity, interfacesdynamic attributes: coverage, reliability
Cost:Characterize the resources expended, e.g., effort, computer time
Changes:Characterize the modifications associated with the product, e.g., enhancements, errors, faults, failure
Context:Characterize the customer community and their operational profiles

GOAL/QUESTION/METRIC PARADIGMProduct Goal: Question Guidelines
Perspective/Focus:Analyze the product models from each perspective of interest, e.g.,reliability, user friendliness, specifying the following:
Major model(s) usedSpecify some perspective model/definition and viewpoint
Validity of the model for the projectEvaluate the appropriateness of the model for the project environment
Validity of the data collectedEvaluate the quality of the data
{Substantiation of the modelGiven any alternate perspectives that provide support for the quality of the results}
Feedback:
What has been learned about the product, the processes that produced it,or any other product that will improve this project and future projects?
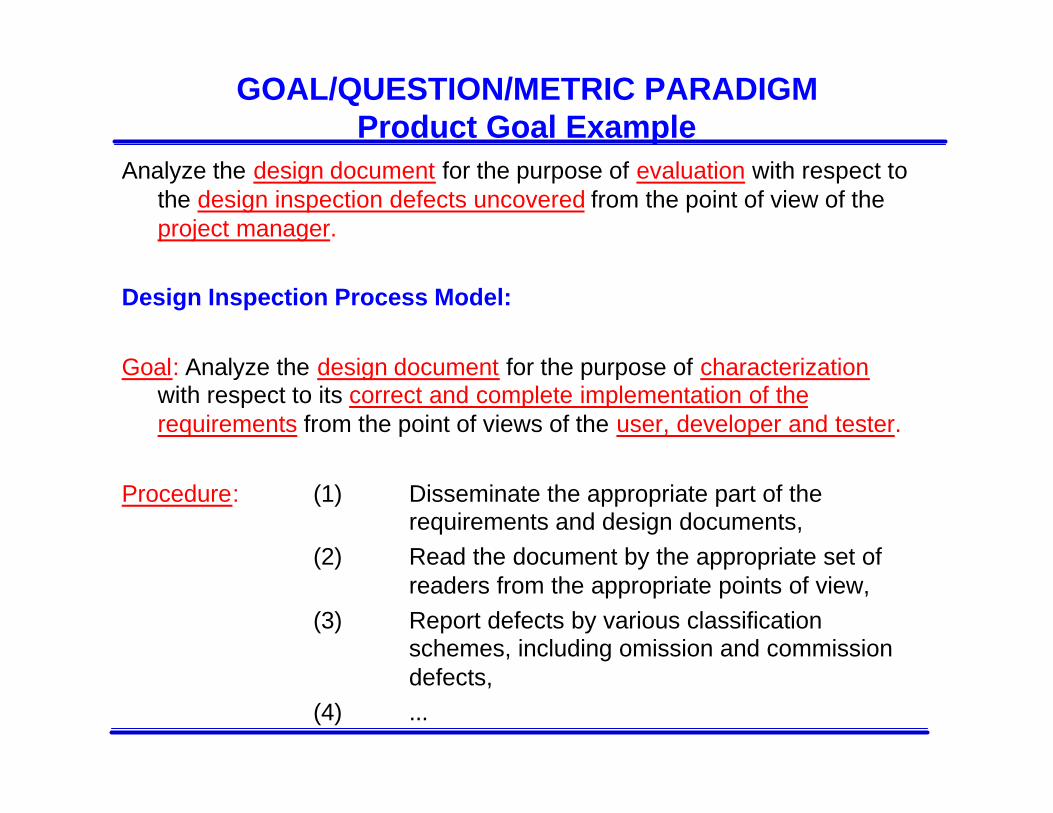
GOAL/QUESTION/METRIC PARADIGMProduct Goal Example
Analyze the design document for the purpose of evaluation with respect tothe design inspection defects uncovered from the point of view of theproject manager.
Design Inspection Process Model:
Goal: Analyze the design document for the purpose of characterizationwith respect to its correct and complete implementation of therequirements from the point of views of the user, developer and tester.
Procedure: (1) Disseminate the appropriate part of the requirements and design documents,
(2) Read the document by the appropriate set ofreaders from the appropriate points of view,
(3) Report defects by various classification schemes, including omission and commissiondefects,
(4) ...
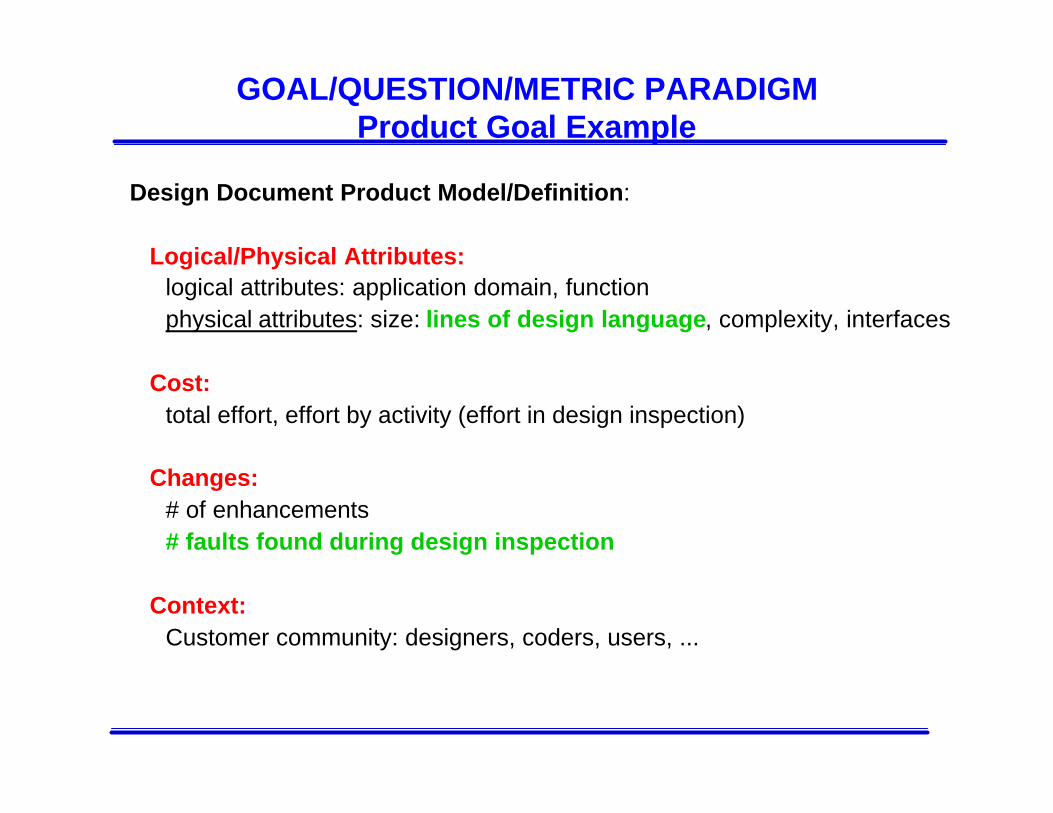
GOAL/QUESTION/METRIC PARADIGMProduct Goal Example
Design Document Product Model/Definition:
Logical/Physical Attributes:logical attributes: application domain, function
physical attributes: size: lines of design language, complexity, interfaces
Cost:total effort, effort by activity (effort in design inspection)
Changes:# of enhancements# faults found during design inspection
Context: Customer community: designers, coders, users, ...

GOAL/QUESTION/METRIC PARADIGMSimple Document/Defect Evaluation Model
KLOD = number of thousand lines of design language
Fc = number of faults/KLOD found in design inspections on this projectFs = number of faults/KLOD found in design inspections in the set of
projects used as a basis for comparison (same size, application, …)QF = Fc/Fs = the relationship of faults found on this project as compared to
the average the appropriate basis set
if QF > 1 then QF = H (worse than history)if QF <= 1 then QF = L (better than history)
PC = the process conformance rating on this project= C if inspections are performed to the definition, N otherwise
DU = the domain understanding rating on this project= S if domain understanding is satisfactory, U otherwise

GOAL/QUESTION/METRIC PARADIGMSimple Document/Defect Evaluation Model
QF = H if more faults found when compared with historyQF = L if less faults found when compared with history
PC = C if inspections are performed to the definition N otherwise
DU = S if domain understanding is satisfactory U otherwise
PC DU QF Design-in Design-out Design Process Inspection ProcessC S L good good effective effectiveC S H poor fixed-up not-effective effectiveN X X ? ? ? ?X U X ? ? ? ?
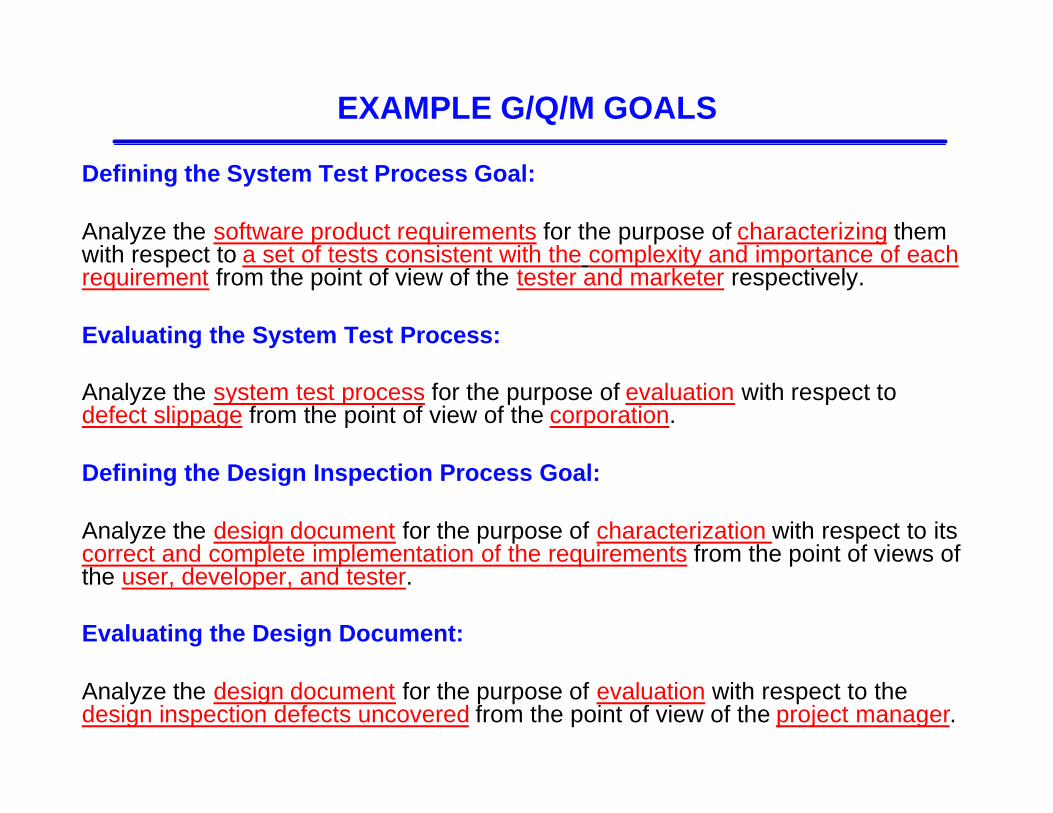
EXAMPLE G/Q/M GOALS
Defining the System Test Process Goal:
Analyze the software product requirements for the purpose of characterizing themwith respect to a set of tests consistent with the complexity and importance of eachrequirement from the point of view of the tester and marketer respectively.
Evaluating the System Test Process:
Analyze the system test process for the purpose of evaluation with respect todefect slippage from the point of view of the corporation.
Defining the Design Inspection Process Goal:
Analyze the design document for the purpose of characterization with respect to itscorrect and complete implementation of the requirements from the point of views ofthe user, developer, and tester.
Evaluating the Design Document:
Analyze the design document for the purpose of evaluation with respect to thedesign inspection defects uncovered from the point of view of the project manager.

Organizational Frameworks
Quality Improvement Paradigm
Characterize the current project and its environment with respect to modelsand metrics.
Set quantifiable goals for successful project performance and improvement.
Choose the appropriate process model and supporting methods and tools forthis project.
Execute the processes, construct the products, collect,validate, and analyzethe data to provide real-time feedback for corrective action.
Analyze the data to evaluate the current practices, determine problems,record findings, and make recommendations for future project improvements.
Package the experience in the form of updated and refined models and otherforms of structured knowledge gained from this and prior projects and save itin an experience base to be reused on future projects.

Approaches To Quality
Quality Improvement Paradigm
Choose
processes,
methods,
techniques,
and tools
Set goals
Characterize
& understand
Package
& store
experience
AnalyzeResults
ProcessExecution
AnalyzeResults
ProvideProcesswithFeedback
Corporate learning
Project
learning
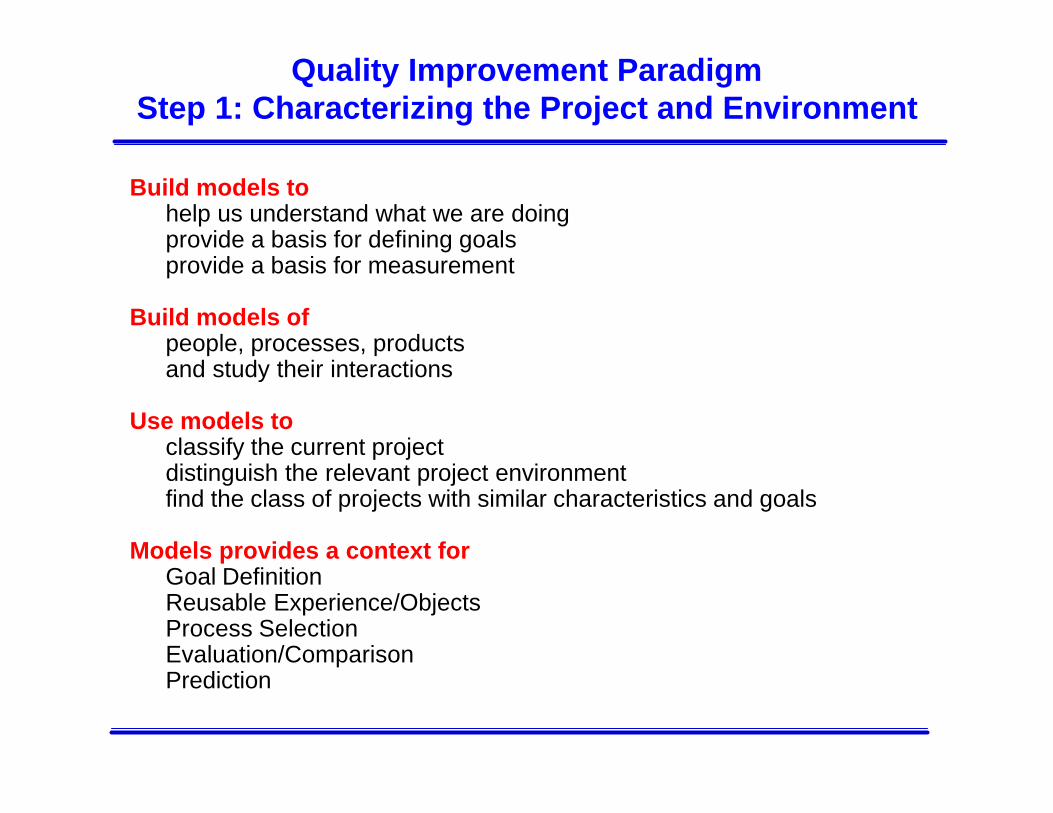
Quality Improvement ParadigmStep 1: Characterizing the Project and Environment
Build models tohelp us understand what we are doingprovide a basis for defining goalsprovide a basis for measurement
Build models ofpeople, processes, productsand study their interactions
Use models toclassify the current projectdistinguish the relevant project environmentfind the class of projects with similar characteristics and goals
Models provides a context forGoal DefinitionReusable Experience/ObjectsProcess SelectionEvaluation/ComparisonPrediction

CharacterizationProject Characteristics and Environmental Factors
People Factors: number of people, level of expertise, group organization,problem experience, process experience,...
Problem Factors: application domain, newness to state of the art,susceptibility to change, problem constraints, ...
Process Factors: life cycle model, methods, techniques, tools,programming language, other notations, ...
Product Factors: deliverables, system size, required qualities, e.g.,reliability, portability, ...
Resource Factors: target and development machines, calendar time,budget, existing software, ...

Quality Improvement Paradigm Step 2: Goal Setting and Measurement
Need to establish goals for the processes and products
Goals should be measurable, driven by the models
Goals should be defined from a variety of perspectives:
Customer: predictable schedule, correct functionalityProject: quality controllable process, adherence to scheduleCorporation: reusable experiences, improved quality/productivity
over time
There are a variety of mechanisms for defining measurable goals:Goal/Question/Metric Paradigm (GQM)Software Quality Metrics Approach (SQM)Quality Function Deployment Approach (QFD)

Quality Improvement ParadigmStep 3: Choosing the Processes
We need to choose and tailor an appropriate generic process model,integrated set of methods, and integrated set of techniques
We need to define their goals and give its definitions (models)
Choosing and tailoring are always done in the context of theenvironment, project characteristics, and goals established for theproducts and other processes
Examples:
If problem and solution well understoodchoose waterfall process model
If high number of faults of omission expectedemphasize traceability reading approach embedded in designinspections
When embedding traceability reading in design inspections, make suretraceability matrix exists
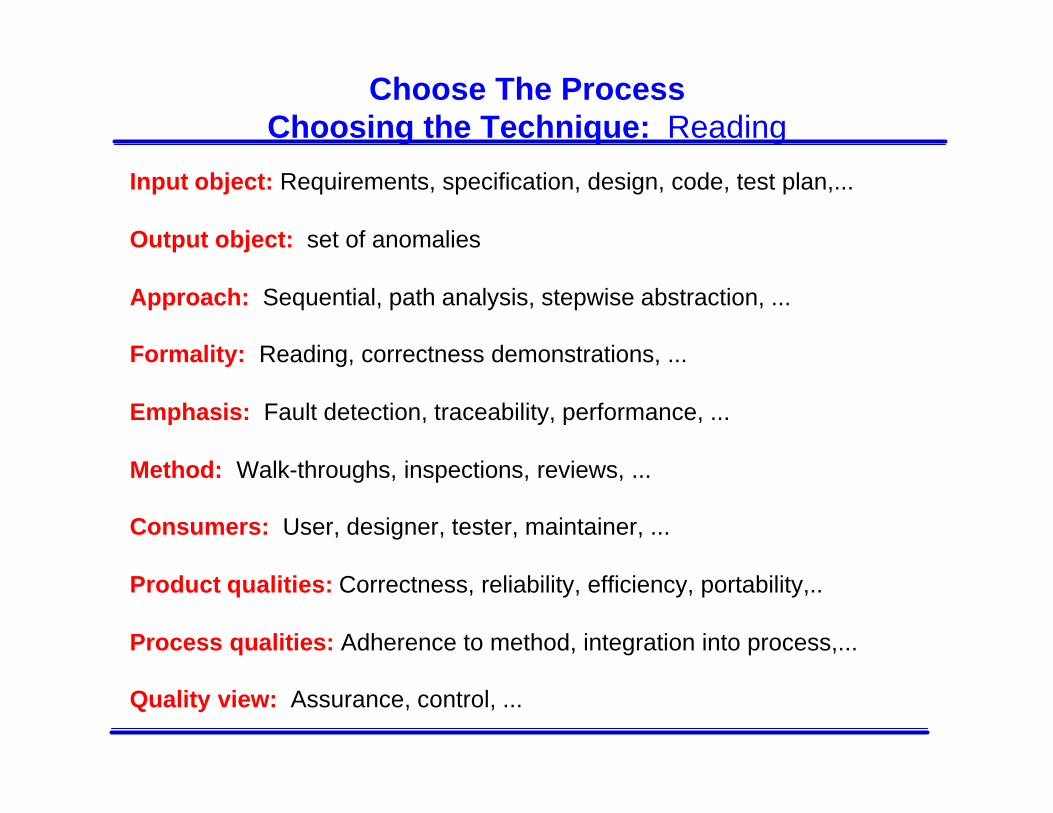
Choose The ProcessChoosing the Technique: Reading
Input object: Requirements, specification, design, code, test plan,...
Output object: set of anomalies
Approach: Sequential, path analysis, stepwise abstraction, ...
Formality: Reading, correctness demonstrations, ...
Emphasis: Fault detection, traceability, performance, ...
Method: Walk-throughs, inspections, reviews, ...
Consumers: User, designer, tester, maintainer, ...
Product qualities: Correctness, reliability, efficiency, portability,..
Process qualities: Adherence to method, integration into process,...
Quality view: Assurance, control, ...

Input object: System, subsystem, feature, module,..
Output object: Test results
Approach: structural, functional, error-based, statistical testing,..
Formality: Full adherence, partial adherence, ...
Emphasis: Fault detection, new features, reliability, performance,..
Method: As specified in the test plan
Consumers: Various classes of customer/hardware configurations,
Product qualities: Reliability, efficiency, ...
Process qualities: Adherence to method, integration into process,...
Quality view: Assurance, control
Choose The ProcessChoosing the Technique: Testing

Quality Improvement ParadigmStep 4: Executing the Processes
The development process must support the access and reuse of packagedexperience
Data items must be defined by the models and driven the by the goals
Data collection must be integrated into the processes, not an add on, e.g.,defect classification forms part of configuration control mechanism
Data validation important and necessary. e.g., defect data is error prone
Education and training in data collection are necessary, everyone mustunderstand the models
Some analysis must be done in close to real time for feedback for correctiveaction
The suppliers of the data need to gain from the data too
Automated support is necessary to:support mechanical tasksdeal with large amounts of data and information needed for analysis
however, the collection of the most interesting data cannot be automated
Executing The ProcessesKinds of Data Collected
Resource Data:Effort by activity, phase, type of personnelComputer timeCalendar time
Change/Defect Data:Changes and defects by various classification schemes
Process Data:Process definitionProcess conformanceDomain understanding
Product Data:Product characteristics
logical, e.g., application domain, functionphysical, e.g. size, structuredynamic, e.g., reliability, coverage
Use and context information, e.g., design method used

Quality Improvement ParadigmStep 5: Analyzing the Data
Based upon the goals, we interpret the data that has been collected.We can use this data to:characterize and understand, e.g.,
what project characteristics effect the choice of processes, methods andtechniques?
which phase is typically the greatest source of errors?
evaluate and analyze, e.g.what is the statement coverage of the acceptance test plan?does the Cleanroom Process reduce the rework effort?
predict and control, e.g.,given a set of project characteristics, what is the expected cost and
reliability, based upon our history?
motivate and improve, e.g.,for what classes of errors is a particular technique most effective
Quality Improvement ParadigmStep 6: Packaging the Experience
Resource Models and Baselines,e.g., local cost models, resource allocation models
Change and Defect Baselines and Models,e.g., defect prediction models, types of defects expected for application
Product Models and Baselines,e.g., actual vs. expected product size and library access over time
Process Definitions and Models,e.g., process models for Cleanroom, Ada
Method and Technique Evaluations,e.g., best method for finding interface faults
Products, e.g., Ada generics for simulation of satellite orbitsQuality Models,
e.g., reliability models, defect slippage models, ease of change modelsLessons Learned, e.g., risks associated with an Ada development

Packaging ExperienceForms of Packaged Experience
Equations defining the relationship between variables,e.g. Effort = 1.48*KSLOC.98, Number of Runs = 108 + 150*KSLOC
Histograms or pie charts of raw or analyzed data,e.g., Classes of Faults: 30% data, 24% interface, 16% control,
15% initialization, 15% computation Effort Distribution: 23% design, 21% code, 30%test, 26% other
Graphs defining ranges of “normal”e.g., Fault Slippage Rate: halve faults after each test phase (4,2,1,.5)
Specific lessons learned, e.g.,an Ada design should use library units rather than a deeply nested structureminimize the use of tasking as its payoff is minimal in this environment
size varies inversely with defect rate up to about 1KLOC per module
Processes descriptions (adapted to SEL), e.g.,Recommended Approach, Manager’s Handbook,Cleanroom Process Handbook,Ada Developer’s Guide, Ada Efficiency Guide
Quality Improvement Paradigm
Reuse InhibitorsNeed to reuse more than just code, need to reuse all kinds of experience
Experience requires the appropriate context definition for to be reusable
Experience needs to be identified and analyzed for its reuse potential
Experience cannot always be reused as is, it needs to be tailored
Experience needs to be packaged to make it easy to reuse
Reuse of experience has been too informal, not supported by theorganization
Reuse has to be fully incorporated into the development or maintenanceprocess models
Project focus is delivery, not reuse,i.e., reuse cannot be a byproduct of software development
Need a separate organization to support the reuse of local experience

Quality Improvement Paradigm
Activity Support for Improvement
Improving the software process and product requires
Learning
- the continual accumulation of evaluated experiences
Experience models
- in a form that can be effectively understood and modified
Experience base
- stored in a repository of integrated experience models
Reuse
- accessible and modifiable to meet the needs of the projects being
developed by the organization
Quality Improvement Paradigm
Activity Support For Improvement
Systematic learning requires support for recording, off-line generalizing, tailoring, synthesizing and formalizing
experience
Packaging and modeling useful experience requires a variety of models and formal notations that are tailorable, extendible,
understandable, flexible and accessible
An effective experience base must contain accessible and integrated set of models that capture the local
experiences
Systematic reuse requires support for using existing experience on-line generalizing or tailoring of candidate experience

Quality Improvement Paradigm
Organizational Support for Improvement
This combination of ingredients requires an organizational structure that
supports:
A software evolution model that supports reuse
Processes for learning, packaging, and storing experience
The integration of these two functions
It requires separate logical or physical organizations:
with different focuses/priorities,
process models,
expertise requirements

Quality Improvement Paradigm
Organizational Support for Experience Reuse
Project Organizationfocus/priority is deliverysupported by packaged experiences
Experience Factoryfocus is project development supportanalyzes and synthesizes all kinds of experienceacts as a repository for such experiencesupplies that experience to various projects on demand
The Experience Factory packages experience by buildinginformal, formal or schematized, and productized models and measuresof various software processes, products, and other forms of knowledgevia people, documents, and automated support

Experience Factory OrganizationRole of the Project Organization
Execute Process
Characterize
Set Goals
Choose Process
project/environment characteristics
tailorable goals, processes, toolsproducts, resource models, defect models, ... from similar projects
data, lessons learned, ...
project analysis, process modification, ...
Execution Plans
PROJECT ORGANIZATIONEXPERIENCE FACTORY
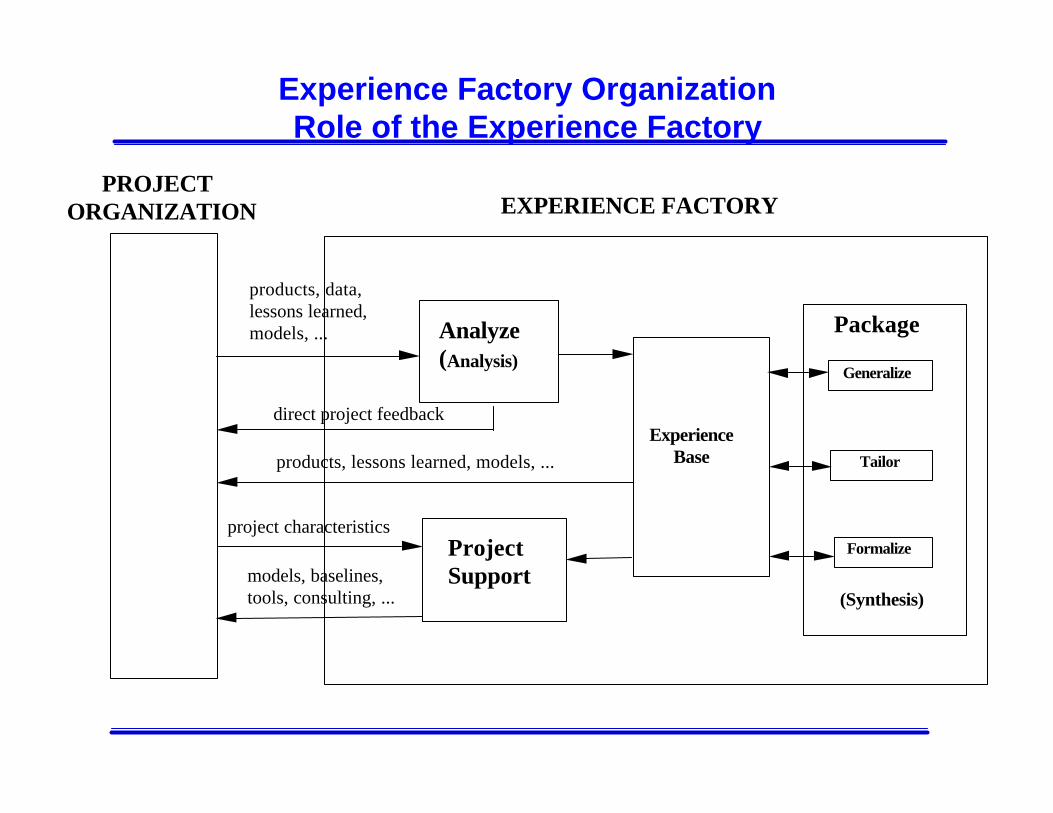
Experience Factory OrganizationRole of the Experience Factory
Analyze ( Analysis)
products, data, lessons learned,models, ...
direct project feedback
Package
Experience Base products, lessons learned, models, ...
models, baselines,tools, consulting, ...
Formalize
Tailor
Generalize
EXPERIENCE FACTORY PROJECT ORGANIZATION
Project Support
project characteristics
(Synthesis)
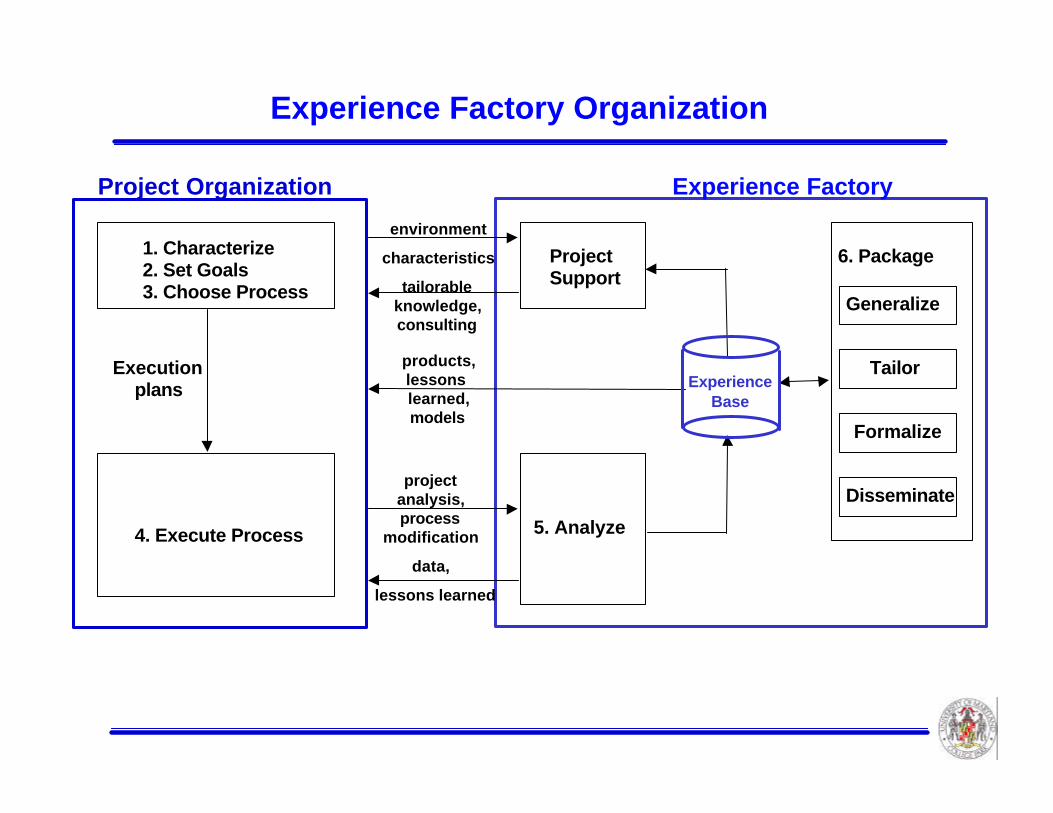
Experience Factory Organization
environment
characteristics
tailorableknowledge,consulting
Project Organization Experience Factory
1. Characterize2. Set Goals3. Choose Process
Execution plans
4. Execute Process
ProjectSupport
5. Analyze
products,lessons learned,models
projectanalysis,process
modification
data,
lessons learned
6. Package
Generalize
Tailor
Formalize
Disseminate
ExperienceBase
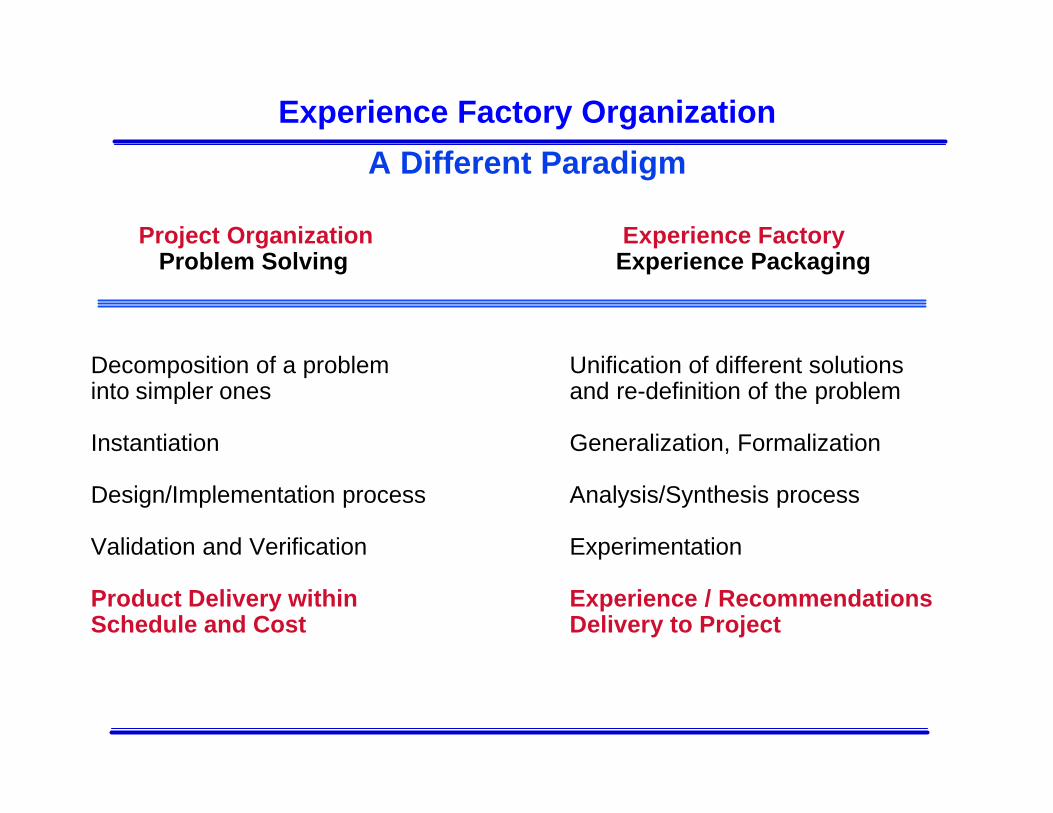
Experience Factory Organization
A Different Paradigm
Project Organization Experience Factory Problem Solving Experience Packaging
Decomposition of a problem Unification of different solutionsinto simpler ones and re-definition of the problem
Instantiation Generalization, Formalization
Design/Implementation process Analysis/Synthesis process
Validation and Verification Experimentation
Product Delivery within Experience / RecommendationsSchedule and Cost Delivery to Project

Multi-Project Analysis StudyImproving via the Experience Factory
Process Evolution/Evaluation
Experience
Factory
Project
Organization
Researcher
Analyst
Experimenter
Team
Model
PackagerProjects
2, 3, ...
Project
1
public domainprocess
tailored process
current localprocess
problems
goalsmeasurement &feedback
SEL tailoredprocess
lessons learned &recommendedchanges

An Example Experience FactoryThe Software Engineering Laboratory (SEL)
Consortium ofNASA/GSFCComputer Sciences CorporationUniversity of Maryland
Established in 1976
Goals have been to- better understand software development- improve the process and product qualityat Goddard, formerly in the Flight Dynamics Division , now at theInformation Systems Center
using observation, experimentation, learning, and model building

An Example Experience Factory
SEL STRUCTURE
DEVELOPERS(SOURCE OF EXPERIENCE) (PACKAGE EXPERIENCE FOR REUSE)
DATA BASE SUPPORT(MAINTAIN/QA EXPERIENCE INFORMATION)
Development measures for each
project
Refinements to development
process
STAFF 275-300 developers
TYPICAL PROJECT SIZE 100-300 KSLOC
ACTIVE PROJECTS 6-10 (at any given time)
PROJECT STAFF SIZE 5-25 people
TOTAL PROJECTS(1976-1994) 120
STAFF 10-15 Analysts
FUNCTION • Set goals/questions/metrics - Design studies/experiments
• Analysis/Research • Refine software process
- Produce reports/findings
PRODUCTS(1976-1994) 300 reports/documents
SEL DATA BASE
FORMS LIBRARY
REPORTS LIBRARY
160 MB
220,000
• SEL reports• Project documents• Reference papers
STAFF 3-6 support staff
FUNCTION • Process forms/data
• QA all data
• Record/archive data
• Maintain SEL data base
• Operate SEL library
NASA + CSC + U of MDNASA + CSC
NASA + CSC
PO PROCESS ANALYSTSEF
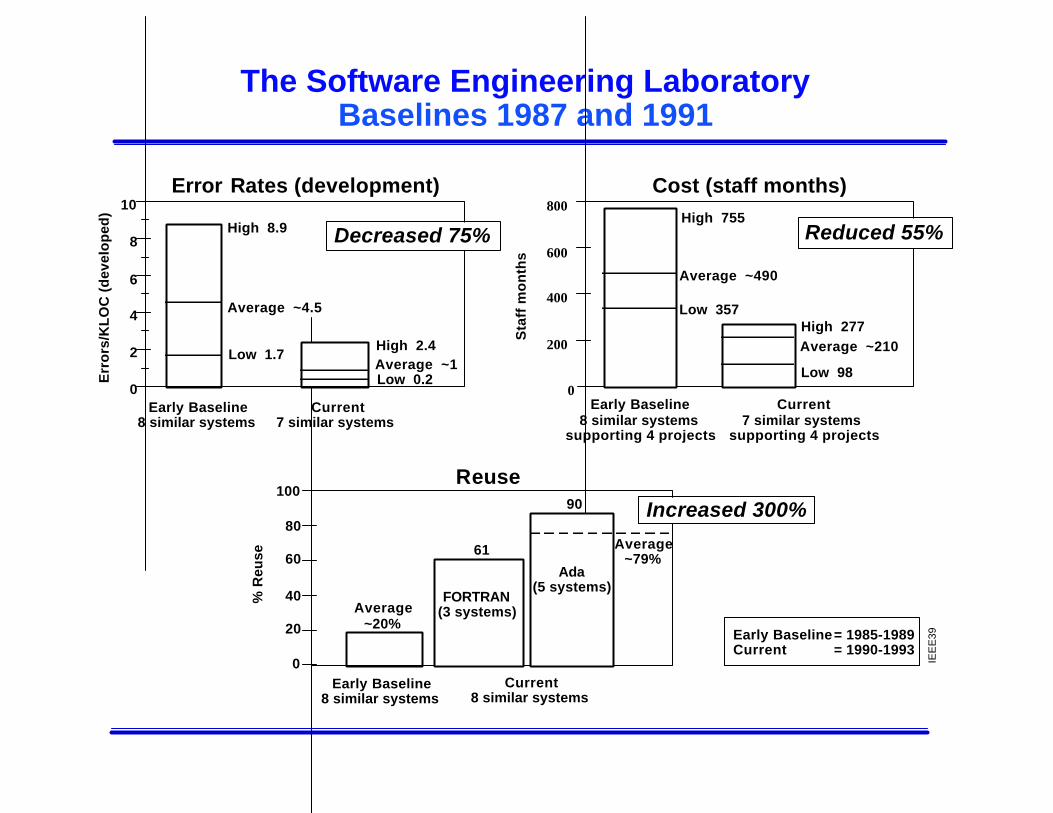
The Software Engineering LaboratoryBaselines 1987 and 1991
Error Rates (development)
0
2
4
6
8
10
Early Baseline 8 similar systems
Current 7 similar systems
Err
ors
/KL
OC
(d
evel
op
ed)
Average ~4.5
Average ~1Low 1.7
Low 0.2
High 2.4
High 8.9
0
200
400
600
800Cost (staff months)
Early Baseline 8 similar systems
supporting 4 projects
Current 7 similar systems
supporting 4 projects
Sta
ff m
on
ths
Average ~490
Average ~210
Low 357
High 755
Low 98
High 277
Reuse
Early Baseline 8 similar systems
Current 8 similar systems
% R
euse
FORTRAN (3 systems)
Ada (5 systems)
0
20
40
60
80
100
Average ~79%
61
90
IEE
E39
Average ~20%
Early Baseline = 1985-1989 Current = 1990-1993
Decreased 75% Reduced 55%
Increased 300%
The Software Engineering LaboratoryAn Experience Factory Example
The Software Engineering Laboratoryis the winner of the first
IEEE Computer Society Awardfor
Software Process Achievement
The award isan international award established in 1994sponsored by the U.S. Software Engineering Institutefor demonstrable, sustained, measured, significant softwareimprovement
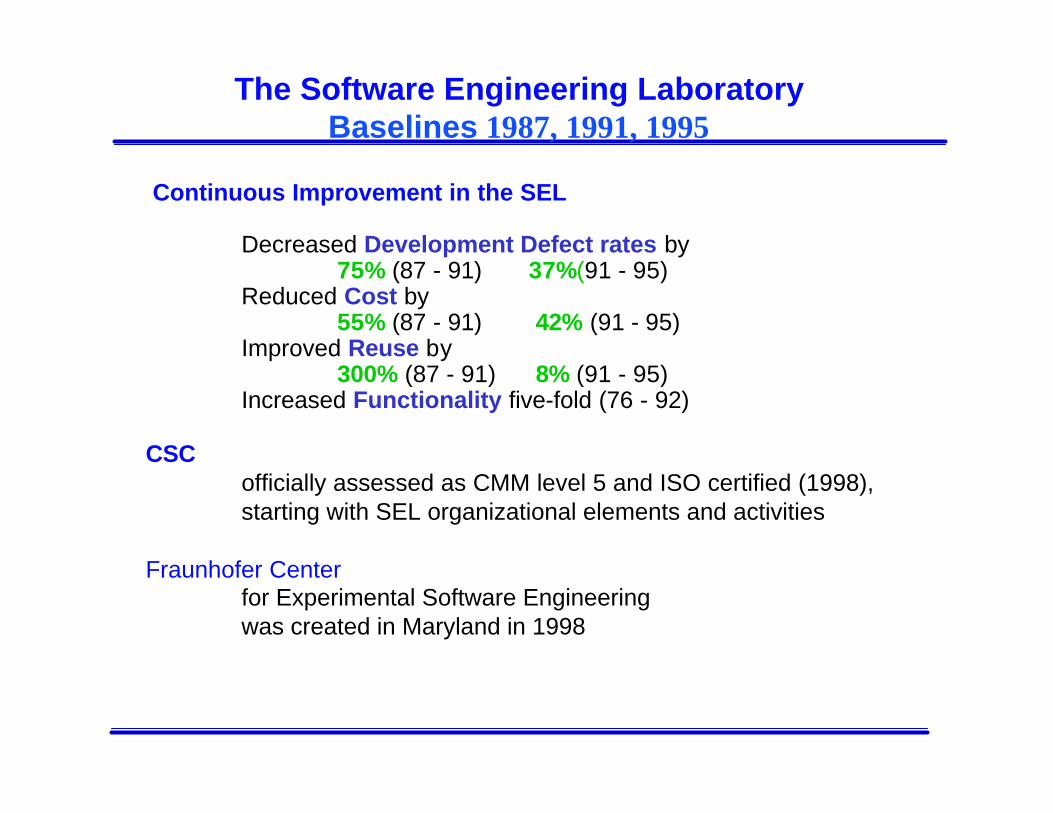
The Software Engineering LaboratoryBaselines 1987, 1991, 1995
Continuous Improvement in the SEL
Decreased Development Defect rates by75% (87 - 91) 37%(91 - 95)
Reduced Cost by55% (87 - 91) 42% (91 - 95)
Improved Reuse by300% (87 - 91) 8% (91 - 95)
Increased Functionality five-fold (76 - 92)
CSCofficially assessed as CMM level 5 and ISO certified (1998),starting with SEL organizational elements and activities
Fraunhofer Centerfor Experimental Software Engineeringwas created in Maryland in 1998
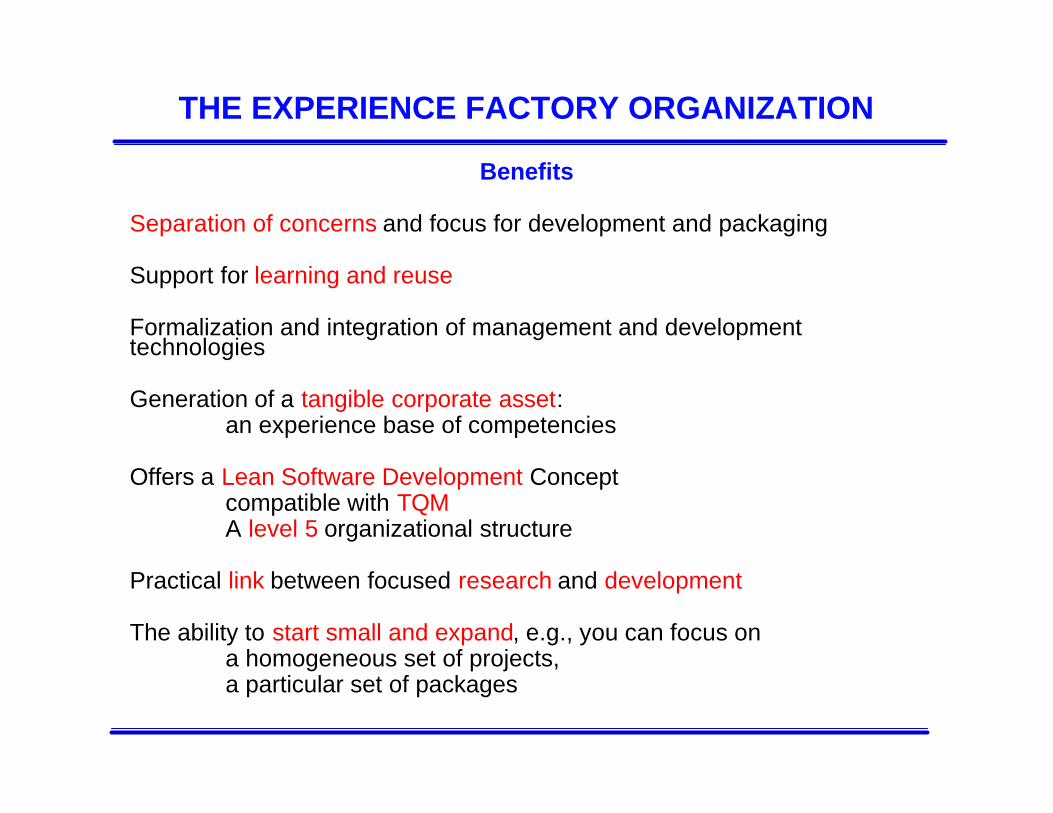
THE EXPERIENCE FACTORY ORGANIZATION
Benefits
Separation of concerns and focus for development and packaging
Support for learning and reuse
Formalization and integration of management and developmenttechnologies
Generation of a tangible corporate asset:an experience base of competencies
Offers a Lean Software Development Conceptcompatible with TQMA level 5 organizational structure
Practical link between focused research and development
The ability to start small and expand, e.g., you can focus ona homogeneous set of projects,a particular set of packages

THE EXPERIENCE FACTORYSpecific Steps
We need to:
Make the commitmentDecide to make the changeInvolve top level managementThink differently about software
Define a set of improvement goalsBased on intuition/available dataLook at high payoff areas, problem areasNeed to debug the process
Choose a projectSomething mainstreamMedium sizeCommitted people
Organize to support the changeRecognize the new processesAssign roles and resources
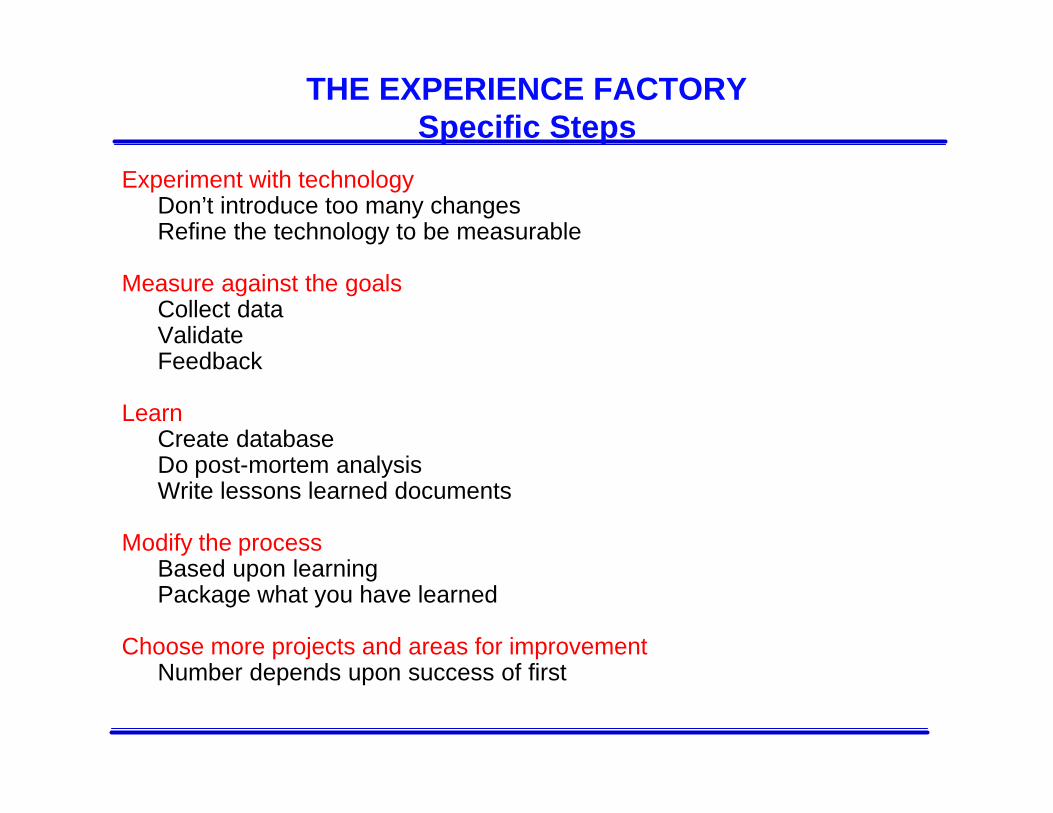
THE EXPERIENCE FACTORYSpecific Steps
Experiment with technologyDon’t introduce too many changesRefine the technology to be measurable
Measure against the goalsCollect dataValidateFeedback
LearnCreate databaseDo post-mortem analysisWrite lessons learned documents
Modify the processBased upon learningPackage what you have learned
Choose more projects and areas for improvementNumber depends upon success of first

THE EXPERIENCE FACTORY ORGANIZATIONConclusions
Integration of the Improvement ParadigmGoal/Question/Metric ParadigmExperience Factory Organization
Provides a consolidation of activities, e.g., packaging experience,consulting, quality assurance, education and training, process and toolsupport, measurement
Based upon our experience, it helps usunderstand how software is built and where the problems aredefine and formalize effective models of process and productevaluate the process and the product in the right contextpredict and control process and product qualitiespackage and reuse successful experiencesfeed back experience to current and future projects
Can be applied today and evolve with technology
THE EXPERIENCE FACTORY ORGANIZATION
The approach provides:
a framework for defining quality operationally relative to the project and theorganization
justification for selecting and tailoring the appropriate methods and toolsfor the project and the organization
a mechanism for evaluating the quality of the process and the productrelative to the specific project goals
a mechanism for improving the organization’s ability to develop qualitysystems productively
The approach is being adopted by several organizations, butit is not a simple solutionit requires long-term commitment by top level management
Top Related