


Languages
Pages
Legal


Proceedings of the ASME 2015 Pressure Vessels & Piping Division Conference PVP2015
July 15-19, 2015, Boston, Massachusetts, USA
PVP2015-45757
Comparison of Methods for Evaluation of Crack Growth at Welds in Offshore Risers
Fengjie Yin, Mark Cerkovnik, Wasy Akhtar, Tracy Yang 2H Offshore Inc.
15990 North Barkers Landing, Suite 200 Houston, TX, USA
Email: [email protected]
ABSTRACT
In checking the fitness of fatigue critical welded
structure, the stress concentration at the weld due to the weld
geometry needs to be considered. Where fatigue is assessed
using crack growth methodology, two approaches are
commonly used. In the offshore industry in regions where BS
7910 [1] is followed, the effect of weld geometry is assessed
using the Mk factor approach. The Mk factor directly magnifies
the stress intensity. Mk factor solutions are available for T-butt
weld joints from the British Standard BS7910.
Alternatively, API579 [2] offers stress intensity solutions that
can account for the stress profile through the wall thickness of
the pipe. In using this method, the engineer will use an FEA
program to find the stress profile for use as an input for the
stress intensity factor computation. Since the goal is the
assessment of crack growth, the stress profile must represent the
cyclic changes in stress. Further, a histogram of such profiles is
required.
While the Mk factor approach of BS7910 offers the easier path
by supplying factors for pre-solved geometries, the API
approach offers an opportunity to refine the solution by
conducting relatively simple linear FEA of the un-cracked
component. This study compares the two approaches using an
example taken from offshore riser fatigue analysis.
NOMENCLATURE
CTOD crack tip opening displacement
ECA engineering critical assessment
FCG fatigue crack growth
FEA finite element analysis
FFS fitness for service
HAZ heat affected zone
K stress intensity factor
KDF know down factor
Mk stress intensity magnification factor
R reference stress
R Ratio stress ratio
SCF stress concentration factor
SCR steel catenary riser
SN stress life
TDP touch down point
VIM vortex induced motion
VIV vortex induced vibration
INTRODUCTION
Most pressure vessels and pipelines are largely static with
fatigue cycles coming only from start-up and shut down cycles.
However, there is an important class of lines that are dynamic,
where mechanical load cycles are a fundamental part of the
loading. One example of this class of structure is offshore risers
on floating production systems. The risers act as conduits from
the subsea wells to the platforms. The motions of the host vessel
and the hydrodynamic loads result in fatigue stress cycles;
primarily from bending and axial loading. Dynamic loads
include first and second order vessel motions, wave loadings,
vortex induced vibration (VIV), vortex induced vessel motion
(VIM), pressure variations and slugging. Offshore risers used
for deep water applications are often fabricated by the girth
welding method. One typical girth weld configuration is shown
in Figure 1. Some flaws will usually be introduced during
welding procedure.
While for most cases the SN approach is used in design of
risers, fatigue crack growth (FCG) methodology also has an
important place. ECA is used to define acceptable initial flaw
Learn more at www.2hoffshore.com

2
dimensions and develop corresponding non-destructive
inspection criteria. If defects are found during inspection, they
are assessed using fatigue crack growth methods in FFS
assessment. Also, when the riser operates in a sour or corrosive
environment, it is often more practical to characterize the crack
growth rates in the environment than to develop SN curves.
When the SN method is employed in the assessment of welds,
the local stress concentration factor (SCF) at the weld toe and
weld root is accounted for in the fatigue curve; i.e. the fatigue
test specimen used to develop the fatigue curve have the typical
local weld geometry. Hence, no additional correction is needed.
However, when using the fatigue crack growth method to assess
welds, the stress concentration factor at the weld due to mis-
alignment must be accounted for.
In this paper, two different approaches of accounting for stress
concentration factor in fatigue crack growth analysis are
compared and contrasted. The two approaches stem from the
two most commonly used codes used for fatigue crack growth
analysis, namely API RP 579 [2] and BS 7910 [1].
API RP 579 [2] provides solutions using weight functions that
allow the analyst to input the stress profile through the
thickness. The detailed weight function methodology is
described in Section C.14 of API RP 579 [2]. BS7910 [1] gives
adjustment factors Mkm and Mkb in tabular form that directly
adjusts the stress intensity factor.
Figure 1 – Typical Girth Weld Configuration
Fatigue crack growth assessment for a typical offshore riser
using these two approaches are compared in this paper.
FRACTURE MECHANICS BASED STRUCTURAL
INTEGRITY ASSESSMENT Fracture mechanics based structural integrity assessments,
which are commonly referred to as ECA or FFS assessment,
date back to the 1960s. In the offshore oil and gas industry, the
focus is more on assessing the structural integrity of welded
offshore structures. It is widely accepted that all welded
structures contain flaws. The flaws are assumed to be crack-like
flaws in the fatigue crack growth (FCG) analysis. In offshore
risers, girth welds, which include weld metal and heat affected
zone, are the weakest link from FCG point of view because of
the local stress concentration and the initial flaws that may be
introduced by the welding process.
GIRTH WELD Circumferential girth welds in offshore risers are fatigue
sensitive locations. Welding involves the heating of metal to its
melting temperature followed by rapid cooling. Without
dressing, the welding procedure usually leaves a weld toe both
at the external surface and the internal surface. Mk APPROACH Weld toe stress intensity magnification factor, or Mk factor, is
defined as the ratio of the stress intensity factor including the
stress concentration effect at the weld toe to the stress intensity
factor of the same crack without the stress concentration effect
from the weld toe.
Mk = (K with weld toe attachment) / (K without weld toe
attachment) (1)
The general form of the stress intensity factor solution is given
as:
KI = (Y)√(a) (2)
For fatigue assessment the following equation applies:
(Y) = Mfw{ktmMkmMmm+ktbMkbMb[b+(km-1)m]} (3)
It can be seen from these two equations (equations 1 and 2) [1]
above that Mk is applied by multiplying the stress intensity
factors from primary membrane stress and primary bending
stress.
Mk for surface cracks at weld toes of the T-butt welds (both 2D
solution and 3D) are presented in BS7910 [1]. These two types
of pre-solved solutions provide an easier way to apply the effect
of weld toe on stress intensity factor and eventually on crack
growth. As these solutions are readily available, Mk solutions
from BS7910 is widely used in the offshore industry in
conducting ECA or FFS assessment. The commercial software
CRACKWISE [3] also adopts this method. However, if the weld
toe geometry is very different from the T-butt weld, using the
pre-solved Mk solutions from the T-butt weld might result in in-
Weld Toe
Weld Root
Learn more at www.2hoffshore.com

3
accurate results. Therefore, , FEA is recommended to generate
the Mk solution for the exact geometries with the crack because
the numerical methods provide more realistic results consistent
with actual weld geometry. However, the determination of K for
weld toe with cracks in pipes generally requires complicated
modelling and therefore, not many solutions are currently
available.
STRESS PROFILE APPROACH The API579 [2] standard contains an extensive list of K
solutions. One of the K solutions allows the user to input the
arbitrary through-wall stress field, or in another words, the stress
profile through the wall thickness. Since the K solutions already
include the effect of the crack, the stress profile can be obtained
by simpler FEA to account for the effect of weld bead geometry
without the crack. This numerical analysis is simpler compared
to the FEA of the weld toe with a crack.
DEEPWATER RISER FATIGUE CRACK GROWTH APPLICATION In order to study how these two approaches influence the
predicted fatigue crack growth, an analysis is conducted with a
deep water steel catenary riser (SCR) in the Gulf of Mexico
(GOM). The SCR configuration is shown in Figure 2. One of
identified fatigue critical locations,,the touch down point (TDP),
is selected in the fatigue crack growth analysis.
Figure 2 – SCR Configuration and Fatigue Critical Locations
The SCR pipe data is given in Table 1. The girth weld geometry
is summarized in Table 2.
Table 1 SCR Pipe Data
Parameter Value
Material Steel
Steel Grade X65
Nominal OD (mm) 273
Nominal Wall Thickness (mm) 33
Yield Strength (MPa) 448
Ultimate Tensile Strength (MPa) 530
Elastic Modulus (MPa) 207,000
Poisson’s Ratio 0.3
Table 2 Girth Weld Geometry
Weld Toe Geometry Value
Attachment Length 6mm
Weld Bead Height 3mm
Global analysis in time domain is conducted for the SCR using
FLEXCOM [8]. The effective tension and bending time
histories are extracted from the simulation for the TDP. Stress
time histories are obtained and Rainflow counted to calculate
the stress histograms. Two sources are included in the fatigue
histograms: one from wave induced motion (stress histograms
are shown in Figure 3), and another one from vortex induced
motions (VIM) (stress histograms are shown in Figure 4). Wave
induced fatigue for the riser includes the first and second order
motion from the vessel, which transfers to the riser motion and
the wave loading directly on the riser. Vortex induced motions
of a vessel are the result of the exciting forces by vortex
shedding on the vessel, causing response near the resonant
period of the vessel. When the vortex induced motion of the
vessel is transferred to the SCR, this results in fatigue damage to
the riser.
Figure 3 – Wave Fatigue Stress Histograms at TDP
Learn more at www.2hoffshore.com
4
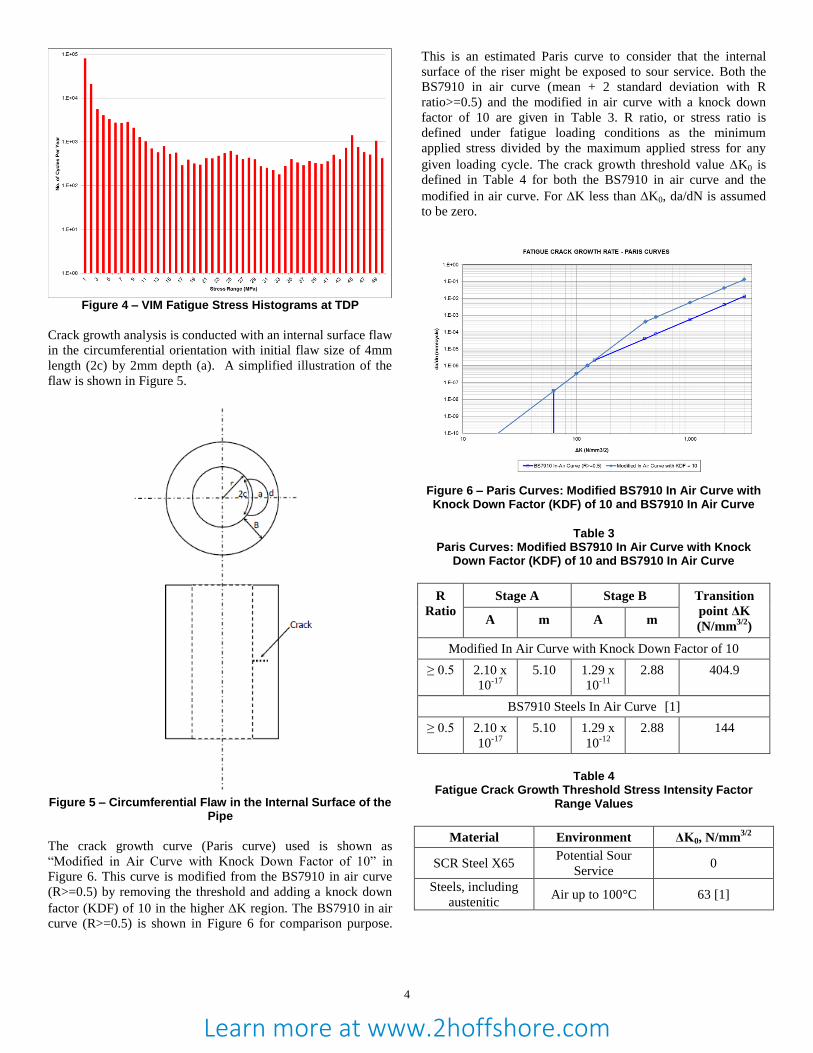
Figure 4 – VIM Fatigue Stress Histograms at TDP
Crack growth analysis is conducted with an internal surface flaw
in the circumferential orientation with initial flaw size of 4mm
length (2c) by 2mm depth (a). A simplified illustration of the
flaw is shown in Figure 5.
Figure 5 – Circumferential Flaw in the Internal Surface of the
Pipe
The crack growth curve (Paris curve) used is shown as
“Modified in Air Curve with Knock Down Factor of 10” in
Figure 6. This curve is modified from the BS7910 in air curve
(R>=0.5) by removing the threshold and adding a knock down
factor (KDF) of 10 in the higher K region. The BS7910 in air
curve (R>=0.5) is shown in Figure 6 for comparison purpose.
This is an estimated Paris curve to consider that the internal
surface of the riser might be exposed to sour service. Both the
BS7910 in air curve (mean + 2 standard deviation with R
ratio>=0.5) and the modified in air curve with a knock down
factor of 10 are given in Table 3. R ratio, or stress ratio is
defined under fatigue loading conditions as the minimum
applied stress divided by the maximum applied stress for any
given loading cycle. The crack growth threshold value K0 is
defined in Table 4 for both the BS7910 in air curve and the
modified in air curve. For K less than K0, da/dN is assumed
to be zero.
Figure 6 – Paris Curves: Modified BS7910 In Air Curve with Knock Down Factor (KDF) of 10 and BS7910 In Air Curve
Table 3
Paris Curves: Modified BS7910 In Air Curve with Knock Down Factor (KDF) of 10 and BS7910 In Air Curve
R
Ratio
Stage A Stage B Transition
point ΔK
(N/mm3/2
) A m A m
Modified In Air Curve with Knock Down Factor of 10
≥ 0.5 2.10 x
10-17
5.10 1.29 x
10-11
2.88 404.9
BS7910 Steels In Air Curve [1]
≥ 0.5 2.10 x
10-17
5.10 1.29 x
10-12
2.88 144
Table 4
Fatigue Crack Growth Threshold Stress Intensity Factor Range Values
Material Environment ΔK0, N/mm3/2
SCR Steel X65 Potential Sour
Service 0
Steels, including
austenitic Air up to 100°C 63 [1]
Learn more at www.2hoffshore.com

5
Crack growth analysis is conducted with BS7910 K solutions
(internal surface flaw in cylinder) with and without Mk effect
applied using an in house software 2HFLAW [4]. 2HFLAW is a
computer program that performs unstable fracture and crack
growth analysis. 2HFlaw includes both BS7910 and API579 K
and reference stress (R) solutions, and has been validated
against Crackwise [3] and SignalFFS [5]. Crackwise adopts
BS7910 K and reference stress (R) solutions, while SignalFFS
mainly applies API579 K and R solutions. The 3D Mk solution
in BS7910 [1] developed from the T-butt weld is adopted in the
analysis. Crack growth analysis is also conducted with API579
K solutions (internal surface flaw in cylinder) with and without
stress profile applied to the stress histogram input. The stress
profile is obtained from the numerical model of the girth weld.
A 2-D finite element model of the internal girth weld bead
geometry (weld toe length: 6mm and weld toe height: 3mm) is
constructed in ANSYS v. 15.0 [6] to solve for the stress profile
across the pipe wall thickness when subjected to an end cap load
of 10,000psi with the other end of the pipe as fixed support. The
finite element model along with a zoom in of the weld bead
region is shown in Figure 7. Solid element type PLANE 182 is
used in the model. Weld mismatch is not included in this model.
Figure 7 – Finite Element Model of Weld Bead Geometry
Figure 8 – Finite Element Model with Mesh
For the majority part of the model (other than the weld bead and
vicinity), mesh size of 2mm is used. Mesh sensitivity is
conducted for the weld bead and vicinity. The finite element
model with the mesh details is shown in Figure 8. The
normalized stress profile as a function of distance from the weld
toe obtained using the three mesh sizes is shown in Figure 9.
The solution at the finest mesh size of 0.05mm is considered to
be essentially converged given the singular behavior of the
stress field at the weld toe. The stress profile using this mesh
size is used in accordance with the guidance of API-RP-579 [2]
to conduct fatigue crack growth analysis.
Figure 9 – Normalized Stress Profile
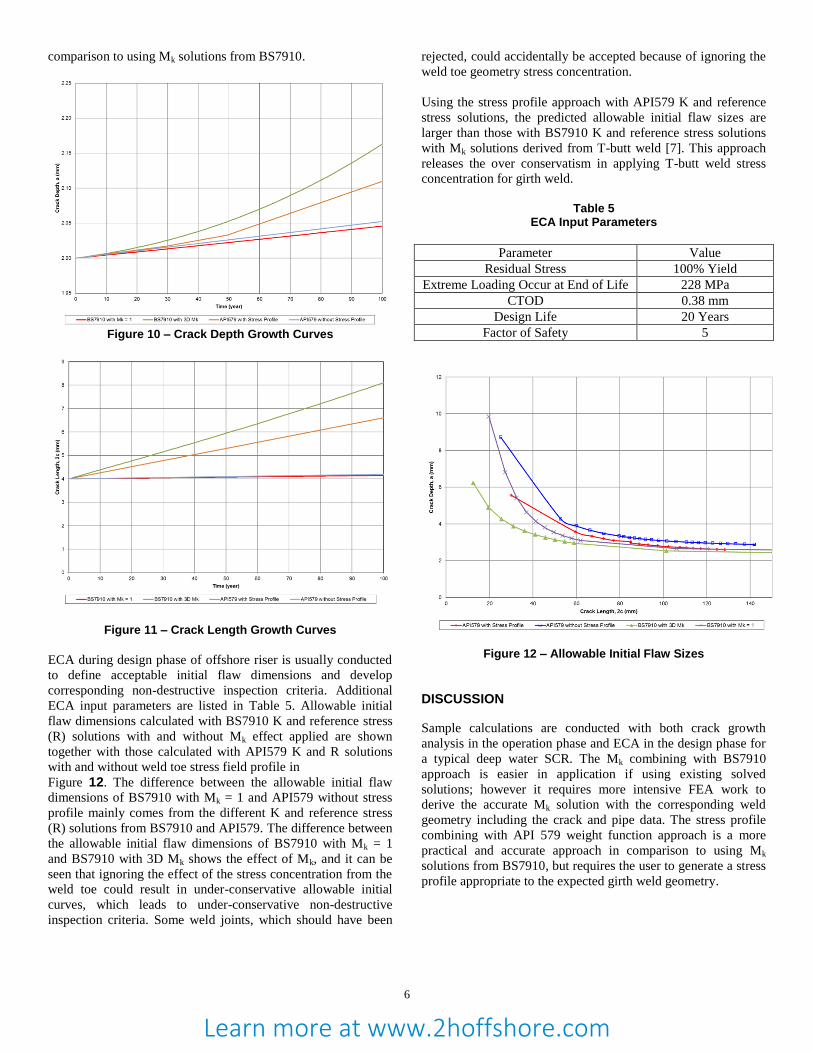
The crack depth (a) growth curves calculated with BS7910 K
solutions with and without Mk effect applied are shown in
Figure 10 together with the crack depth growth curves
calculated with API579 K solutions with and without weld toe
stress field profile. Similarly, the crack length (2a) growth
curves are shown in Figure 11. The difference between the crack
growth curves of BS7910 with Mk = 1 and API579 without
stress profile mainly comes from the different K solutions from
BS7910 and API579, which is very small in this case. The
difference between the crack growth curves of BS7910 with Mk
= 1 and BS7910 with 3D Mk shows the effect of Mk, and it can
be seen that the necessity to include the stress concentration
resulting from the discontinuity of the weld toe geometry.
However the Mk factor solutions adopted here are from weld toe
magnification factors calculated for T-butt weld [7]. Using the
Mk solutions from T-butt weld is shown to be overly
conservative for the girth weld. It is thus recommended to
calculate the Mk factors with geometry similar to that expected
in a girthweld rather than the more extreme T-butt weld
geometry. It is noted that generating and solving the 3D crack
models required do present difficulties
Using the stress profile approach with API579 K solutions, the
crack growth curve predicts slower crack growth compared to
the Mk solutions derived from T-butt weld [7]. This is
considered as a more practical and accurate approach in
0.0
0.5
1.0
1.5
2.0
2.5
3.0
3.5
4.0
4.5
0 5 10 15 20 25 30 35
No
rmalized
Str
ess
Distance from Weld Toe (mm)
STRESS PROFILE BENEATH WELD TOEMesh Convergence Check
Pipe Wall Thickness = 33.1mm, 3mm by 6mm Weld Bead
Mesh size - 0.2mm Mesh size - 0.1mm Mesh size - 0.05 mm
Learn more at www.2hoffshore.com
6
comparison to using Mk solutions from BS7910.
Figure 10 – Crack Depth Growth Curves
Figure 11 – Crack Length Growth Curves
ECA during design phase of offshore riser is usually conducted
to define acceptable initial flaw dimensions and develop
corresponding non-destructive inspection criteria. Additional
ECA input parameters are listed in Table 5. Allowable initial
flaw dimensions calculated with BS7910 K and reference stress
(R) solutions with and without Mk effect applied are shown
together with those calculated with API579 K and R solutions
with and without weld toe stress field profile in
Figure 12. The difference between the allowable initial flaw
dimensions of BS7910 with Mk = 1 and API579 without stress
profile mainly comes from the different K and reference stress
(R) solutions from BS7910 and API579. The difference between
the allowable initial flaw dimensions of BS7910 with Mk = 1
and BS7910 with 3D Mk shows the effect of Mk, and it can be
seen that ignoring the effect of the stress concentration from the
weld toe could result in under-conservative allowable initial
curves, which leads to under-conservative non-destructive
inspection criteria. Some weld joints, which should have been
rejected, could accidentally be accepted because of ignoring the
weld toe geometry stress concentration.
Using the stress profile approach with API579 K and reference
stress solutions, the predicted allowable initial flaw sizes are
larger than those with BS7910 K and reference stress solutions
with Mk solutions derived from T-butt weld [7]. This approach
releases the over conservatism in applying T-butt weld stress
concentration for girth weld.
Table 5
ECA Input Parameters
Parameter Value
Residual Stress 100% Yield
Extreme Loading Occur at End of Life 228 MPa
CTOD 0.38 mm
Design Life 20 Years
Factor of Safety 5
Figure 12 – Allowable Initial Flaw Sizes
DISCUSSION
Sample calculations are conducted with both crack growth
analysis in the operation phase and ECA in the design phase for
a typical deep water SCR. The Mk combining with BS7910
approach is easier in application if using existing solved
solutions; however it requires more intensive FEA work to
derive the accurate Mk solution with the corresponding weld
geometry including the crack and pipe data. The stress profile
combining with API 579 weight function approach is a more
practical and accurate approach in comparison to using Mk
solutions from BS7910, but requires the user to generate a stress
profile appropriate to the expected girth weld geometry.
Learn more at www.2hoffshore.com

7
REFERENCES
1. BS7910: “Guide to Methods for Assessing the Acceptability
of Flaws in Metallic Structures”, Third Edition, December
2013.
2. API 579 -1 /ASME FFS-1 2007 Fitness-For-Service.
3. TWI, CRACKWIDE 5, 2014.
4. 2H Offshore Inc., “2HFLAW – Unstable Fracture and Crack
Growth Analysis – User Manual”, 9406-MAN-1041,
Revision 1.2.0.1, July 2013.
5. Quest Integrity Group, SignalFFS.
6. ANSYS Inc. – “ANSYS Workbench”, Version 15.0.
7. Bowness D. and Lee M.M.K, “Prediction of Weld Toe
Magnification Factors for Semi-Elliptical Cracks in T-Butt
Joints”, International Journal of Fatigue 22, 2000.
8. MCS, FLEXCOM 8.0.
Learn more at www.2hoffshore.com
Top Related