


![Audit Board of Indonesia...standar operasional prosedur pelayanan perizinan dan non perizinan all dan pelayanan per]zinan dan non perizinan aj'ii dinas penana.man modal dan pelayanan](https://static.fdocuments.in/doc/165x107/606e7da44db50168e617b6e3/audit-board-of-indonesia-standar-operasional-prosedur-pelayanan-perizinan-dan.jpg)


Languages
Pages
Legal


Revealing The Missing Link
Private Sector Supply-Side Readinessfor Primary Maternal Health Services in Indonesia
Pub
lic D
iscl
osur
e A
utho
rized
Pub
lic D
iscl
osur
e A
utho
rized
Pub
lic D
iscl
osur
e A
utho
rized
Pub
lic D
iscl
osur
e A
utho
rized


Revealing The Missing LinkPrivate Sector Supply-Side Readinessfor Primary Maternal Health Services in Indonesia
MATERNAL HEALTH REPORT . 2017Revealing the Missing Link
iv

CONTENTS
ABBREVIATIONS AND ACRONYMS .................................................................... viACKNOWLEDGMENTS ............................................................................................. vii
EXECUTIVE SUMMARY ...............................................................................................1
section one.INTRODUCTION ............................................................................................................7
section two.BACKGROUND .............................................................................................................................11Socioeconomic Context ........................................................................................................... 12Health Sector Context ...............................................................................................................13Health Financing .........................................................................................................................14
section three.MATERNAL HEALTH OUTCOMES AND CONTEXT ..................................................17Internationally Contextualized Maternal Health Outcomes and Trends in Indonesia ...................................................................................18Provision and Utilization of Maternal Health Services ............................................22Maternal Health-Related Financing Schemes ...............................................................25
section four.PRIVATE PRIMARY MATERNAL HEALTH SUPPLY-SIDE ANALYSIS ......... 29Distribution, Density, and Coverage of Private Maternal Health Services ................................................................................... 31Service Readiness of Private Maternal Health Providers in Sampled Priority Districts ............................................................................ 36Private Maternal Health Provider Training and Ability in Sampled Priority Districts ..........................................................................47
section five.CONCLUSIONS AND POLICY IMPLICATIONS ......................................................... 55What is Already Known About the Maternal Health Context? ............................... 56What are the Key Messages Arising From This Analysis?..........................................57What are the Policy Implications of These Key Findings?........................................59
APPENDIXES................................................................................................................................69
v

MATERNAL HEALTH REPORT . 2017Revealing the Missing Link
Abbreviations
ANC Antenatal CareASEAN Association of Southeast Asian NationsBOK Bantuan Operasional Kesehatan
(Operational Health Assistance)BPJS Badan Penyelenggara Jaminan Sosial
(Social Security Implementation Agency)BRICS Brazil, Russia, India, China and South AfricaDAK Dana Alokasi Khusus (Special Allocation
Fund)Dinkes Dinas Kesehatan (District Health Office)HCW Health Care WorkerHDI Human Development IndexIBI Ikatan Bidan Indonesia (Indonesian
Midwives’ Association)IDHS Indonesia Demographic and Health SurveyIFLS Indonesia Family Life SurveyIHME Institute of Health Metrics and Evaluation IMPAC Integrated Management of Pregnancy and
ChildbirthJampersal Jaminan Persalinan (Maternity Insurance)JKN Jaminan Kesehatan Nasional (National
Health Insurance scheme)KIA Kesehatan Ibu dan Anak (Mother and Child
Health).KIS Kartu Indonesia Sehat (Indonesia Health
Card)MDG Millennium Development Goal MH Maternal health MMR Maternal Mortality RatioMoF Ministry of FinanceMoH Ministry of HealthNCD Noncommunicable DiseaseOOP Out-of-pocketPermen Peraturan Menteri (Ministerial Regulation)
Perpres Peraturan Presiden (Presidential Regulation)
PNC Postnatal CarePODES Potensi Desa (Village Potential)Polindes Pos Persalinan Desa (Village Maternity Post)PONED Pelayanan Obstetrik dan Neonatal
Emergensi Dasar (Basic Obstetric and Neonatal Emergency Care: BEONC).
Poskesdes Pos Kesehatan Desa (Village Health Post)Posyandu Pos Perlayanan Terpadu (Integrated Health
Services Post)PPH Postpartum hemorrhagePPM Provider payment mechanisms PPP Public-private partnerships Puskesmas Pusat Kesehatan Masyarakat (Community
Health Center)QSDS Quantitative Service Delivery SurveyRifaskes Riset Fasilitas Kesehatan (Health Facility
Survey)RPJMN Rencana Pembangunan Jangka Menengah
Nasional (National Medium-term Development Plan)
SARA Service Availability and Readiness Assessment
SDG Sustainable Development GoalSHI Social Health InsuranceSK Surat Keputusan (Decree)SPM Standar Pelayanan Minimal (Minimum
Service Standard)SUPAS Survei Penduduk Antar Sensus (Intercensal
Population Survey)SUSENAS Survei Sosial Ekonomi Nasional (National
Socioeconomic Survey)UHC Universal Health CoverageUNICEF United Nations Children’s FundWHO World Health Organization
vi

Acknowledgements
This policy paper was written by Wei Aun Yap (Consultant), Eko Setyo Pambudi (Research Analyst), Puti Marzoeki (Senior Health Specialist), Jewelwayne Salcedo Cain (Consultant), and Ajay Tandon (Lead Economist) of the World Bank (WB). The team also received substantive inputs during the review process from peer reviewers: Endang Achadi (Center for Family Welfare, University of Indonesia), Zohra Balsara (USAID), Theingi Myint (WHO), Rouselle Lavado (Health Economist, WB), Ellen van de Poel (Health Economist, WB), and Jeremy Maurice Veillard (Senior Health Specialist, WB).
The team would also like to thank WB colleagues who have provided valuable inputs: Pandu Harimurti (Senior Health Specialist, WB), Junedi (Consultant, WB), Ali Subandoro (Health Specialist, WB), and Vikram Rajan (Senior Health Specialist, WB). We would also like to thank the expert panel for the clinical vignettes: Susri Rahayu (East Java Provincial Health Office), Siti Fatimah (East Java Provincial Health Office), Parlyn Situmorang (DKI Jakarta Health Office), Lucas Hermawan (MoH), Mularsih Restianingrum (MoH), Muhamad Yusuf (MoH), Dwirani Amelia (Budi Kemuliaan Hospital), and Shinta Purwitasari (University of Gajah Mada). The editor is Christopher Stewart. This policy paper received cofinancing from the PFM MDTF (Public Financial Management Multi Donor Trust Fund) and the Gender Trust Fund.
vii

MATERNAL HEALTH REPORT . 2017Revealing the Missing Link
viii

EXECUTIVE SUMMARY
1
MATERNAL HEALTH REPORT . 2017Revealing the Missing Link
Every hour, the death of a woman from the complications of pregnancy serves as the most vexing reminder of Indonesia’s challenges with maternal health (MH). This is incommensurate with Indonesia’s strong economic development and stature compared with regional peers, especially as MH is a marker of overall health system performance and affects economic opportunities–especially for the poor. The maternal mortality ratio (MMR) is high and progress on improving MH outcomes has been slow, such that the Millennium Development Goal (MDG) for maternal health has already been missed. This contrasts starkly with Indonesia’s commendable commitment to improve the coverage and equity of health services, as there are less than two years before the 2019 target date for the attainment of universal health coverage (UHC) under Jaminan Kesehatan Nasional (JKN), Indonesia’s social health insurance (SHI) scheme.
This policy paper analyzes new data on the ‘missing link’ of primary MH service provision, that is, private providers. This is a critical factor, given that 54 percent of all deliveries in Indonesia occur in the private sector, compared with 22 percent in the public sector, although overall rates of institutional deliveries remain below target. Key findings from the analysis elucidate the potential value of the private sector in expanding access to MH services covered by the strategic and financial purchasing umbrella of JKN, the effectiveness of these private MH services, and patient satisfaction.
The analysis found that private providers have expanded access to MH services through extended opening hours, compared to public MH providers. Due to their distribution in urban areas and concentration in Java, however, there was no obvious expansion in geographic access attributable to private MH providers. This was accentuated by the low coverage of private MH providers under JKN (only one-third are empaneled). The reasons given for nonempanelment were financial (low reimbursement rates) and nonfulfilment of the eligibility criteria.
Private MH providers were generally low-volume providers, with an average of only four deliveries per month, and the service readiness of private MH providers, as measured using the World Health Organization’s (WHO) Service Availability and Readiness Assessment (SARA) framework, was generally lower and more variable than public sector puskesmas.1 The service readiness of single practitioner providers was also generally lower than multiple practitioner providers, but empanelment under JKN was associated with higher service readiness. Surprisingly, however, at an individual facility-level, there were generally no urban-rural differences (a rural facility was often better equipped than its urban counterpart), when the mix and distribution facilities were not considered.
On the other hand, poskesdes and polindes,2 which are important primary public MH facilities in rural areas, had notably weak service readiness to provide basic obstetric care. Although the government prioritizes 64 districts, which account for a substantial proportion of maternal deaths in Indonesia, the analysis found that there were only minimal differences between MH service readiness in these 64 high-priority districts compared with matched comparator districts.
Compared with public MH providers, private MH providers were relatively weak in the availability of emergency obstetric drugs and the actual use (measured by patient exit interviews) of diagnostic tests. Both the public and private sector do, however, have major weaknesses in the service readiness domains of medicines, diagnostics, basic obstetric care, and referrals. Provider ability, as measured using clinical vignettes validated by a panel of expert clinicians, indicated that the provision of comprehensive antenatal care and the management of obstetric emergencies was weak across both sectors. The similarities in provider ability were not surprising given the prevalence of dual practice, whereby 36 percent of private midwives were also practicing in the public sector. Patients, however, were generally more satisfied with public providers than private providers, due to the fees charged and perceived discrimination, although patients perceived that private providers
1 Puskesmas (Pusat Kesehatan Masyarakat): Community Health Center..2 Poskesdes (Pos Kesehatan Desa): Village Health Post; Polindes (Pos Persalinan Desa): Village Maternity Post.
2

EXECUTIVE SUMMARY
spent more time with them and had better facility supplies and equipment.
Key headline policy implications arising from the analysis, actionable by various key stakeholders, are summarized below.
Badan Penyelenggara Jaminan Sosial (BPJS):3 Advance strategic purchasing functions beyond claims administration, given mandated role as JKN’s strategic purchaser.
• Strengthen BPJS empanelment and contract renewal of private providers progressively, verifiably, and transparently, as BPJS is the key link to improving the quality and coverage of private MH providers. Firstly, service readiness standards should be progressively leveled-up to fully attain the norms set by an appropriate national and/or international technical authority–that is, MoH or WHO. Secondly, relationship between volume and outcomes should be leveraged by encouraging the consolidation of low-volume providers in densely populated urban areas. Thirdly, the assessment process should be made more robust and verifiable. Lastly, BPJS should increase the amount of published information on empaneled providers, both public and private, so that patients can make informed choices of provider.
• Increase the supply of BPJS-empaneled private MH providers in viable yet underserved areas, by systematically identifying coverage gaps using geographic analysis and incentivizing private investment. The potential coverage of JKN’s maternal health benefits package at a particular locality could be limited. While unavoidable in remote rural areas, pockets of underserved areas in urban areas or areas with sufficient population densities need to be identified and understood in greater detail. These need detailed geographic analysis to create a supply-side ‘masterplan’ to ensure effective depth of coverage throughout Indonesia. BPJS should then use financial and nonfinancial mechanisms to include private providers specifically in underserved areas.
• Reform BPJS provider payment mechanisms (PPMs) and tariff rates for MH services, as these
are powerful levers to improve service content, effectiveness, and equity. BPJS should undertake a review of current PPMs and tariff rates used to purchase maternal health services, to manage costs sustainably, improve the effectiveness of services, promote empanelment of private providers in viable underserved areas, and promote institutional deliveries, especially in rural areas. An equal/level reimbursement scheme across all provider and geographical contexts is not equitable as average unit costs may differ, for example, average costs may be higher where population densities and utilization rates are low. Although there is some evidence that BPJS reimbursement fees are not attractive to many private providers, BPJS should not be expected to reimburse at the high rates paid out of pocket (OOP) by patients.
Ministry of Finance (MoF): Spend more, right, and better.
• Spend more, right, and better. MH is a key human development investment opportunity for Indonesia, especially given the vast scope for improvement and the importance of locking in efficient and sustainable purchasing systems for the future, even if these require investments now. The current JKN deficit is acknowledged, but MH services are a relatively small proportion of services covered by JKN and, therefore, a feasible reform to implement.
• Invest to lever reforms. Policy implications for BPJS above may also have financial implications of note for MoF, but these investments should be made conditional on BPJS advancing its capabilities from passive claims administration to active strategic purchasing.
Ministry of Health (MoH): Clarify policies, and use financing levers and the private sector.
• Clarify the basis of district selection and program content for deciding on national high-priority MH districts. The basis of selecting the 64 high-priority districts should be considered
3 BPJS (Badan Penyelenggara Jaminan Sosial): Social Security Implementation Agency.
3
MATERNAL HEALTH REPORT . 2017Revealing the Missing Link
carefully as the MMR for these 64 districts collectively is slightly lower than the national MMR and the survey finds minimal differences in service readiness between priority and nonpriority districts, for both public and private providers. An alternative framework for reducing disparities and prioritizing areas for MMR-reducing interventions, which considers both MMR and absolute number of maternal deaths, is proposed in this paper.
• Clarify the role of polindes/poskesdes in providing MH services, as public providers are indispensable in remote rural areas. The study indicates that the service readiness of polindes/poskesdes is very weak, yet the public sector is indispensable as the business case for establishing a private MH provider in remote rural areas is not compelling. This is a fundamental problem in delivering services in sparsely populated remote areas with two paradigms: (i) invest substantially to bolster service readiness in poskesdes/polindes, even though many are underutilized; or (ii) limit (and strengthen) the use of polindes/poskesdes to antenatal care (ANC) (including as a platform for outreach and community-based activities to promote institutional deliveries) and other preventive nonemergency services, but recalibrate the role of polindes/poskesdes with regard to deliveries. Notably, the 2016 Jampersal benefits package, which includes funding for maternity waiting homes and referrals, can be used to entrench the role of polindes/poskesdes–not as a location for institutional deliveries–but to organize, encourage, and facilitate the timely transfer of a pregnant woman to the nearest puskesmas or, eventually, to an empaneled private MH facility for delivery.
• Use both supply-side (for example, DAK) and demand-side (for example, BPJS) financing levers to emphasize outcomes and reduce disparities. The central MoH has limited supply-side financing instruments to affect service delivery at the subnational level, apart from prioritizing a limited part of the budgetary inputs over which the central MoH has responsibility. There are few hard levers to enforce normative standards on subnational governments, apart from what
is permissible by technical guidelines for utilizing DAK funding. This DAK financing should, therefore, be monitored closely with greater emphasis on accountability and outcomes. Long-term reliance only on centralized vertical financing channels for specific programs down to the facility level on the supply side is not, however, ideal in terms of decentralization and fiscal reforms. Expanding financing on the demand-side in priority districts or subdistricts, by engaging with JKN through BPJS, is hence a synergistic channel which will require detailed information on MH utilization and outcomes to inform subnational priority setting. This priority setting can inform the use of financial and nonfinancial levers to improve the coverage and effectiveness of MH providers.
• Explore further opportunities to engage the private sector, including both for-profit and nonprofit organizations, through public-private partnerships (PPPs). PPPs should not only be confined to the provision of capital investments for health infrastructure but also for health services, including maternal health. Other PPP innovations can be considered–for example, training and deploying high-quality human resources for health, supporting services, and appropriate mechanisms to invest in health infrastructure. These partnerships will require the capacity to monitor and manage, to ensure they add value to the system and minimize unintended consequences.
Other Policy Implications.
• Empower district heath offices (dinkes)4 with a stronger stewardship role over the private sector, in collaboration with BPJS. The dinkes already has an existing obligation to provide strong quality monitoring of, and supervision to, facilities, including private MH facilities. Instruments and guidelines for these supervision activities are already developed and available, but these processes should be strengthened and standardized, with clear linkages to the credentialing process, BPJS contract renewals, and practice licensing so that it will have real
4 Dinkes:DinasKesehatan(ProvincialorDistrictHealthOffice).
4

implications for private providers. The dinkes will need to be empowered with adequate resources and incentives to perform these tasks.
• Strengthen integrated care across the continuum of providers, through improved referral systems for both the private and public sector at the primary and hospital level. Although it would not be possible to solve the referral challenges in Indonesia overnight, several possible next steps can be considered. On the supply-side, service readiness, including both ‘hardware’ (for example, transportation and communications) and ‘software’, referral plans, and formal or informal channels for referral can be strengthened. Risk stratification and individual delivery plans should be linked directly to the benefits provided by DAK Jampersal, which provides financing for maternity waiting homes and referrals. In addition, maldistribution of specialist obstetricians who can conduct cesarean sections could potentially be mitigated through task shifting and training local nonspecialist doctors to be able to conduct emergency cesarean sections. PPMs should not perversely incentivize primary MH providers to hold on to high-risk cases until complications happen. Integrated care would need to be enabled by appropriate PPMs.
• Involve private MH providers fully in in-service training and strengthen preservice training for all MH providers. Findings from this study indicate that there is weak public and private provider ability to deliver comprehensive ANC and to manage obstetric emergencies such as
postpartum hemorrhage according to clinical guidelines. Unless they are dual practicing, private midwives have fewer opportunities to participate in in-service training to maintain and update their clinical skills. This factor, therefore, underlines the importance of preservice training, by ensuring the adoption of competency-based education in midwife education, and that students get adequate clinical practice to develop their skills. The policy that requires practicing midwives to obtain training credit points to renew their five-yearly registration with the Indonesian Midwives’ Association (IBI) should be strengthened, not only through tighter enforcement but also by expanding opportunities. Ensuring standardized quality and equal access to the training program across the country is essential for skills maintenance.
• Promote higher quality standards through voluntary certification schemes, such as Bidan Delima, which complement the formal regulatory and accreditation processes. The Bidan Delima program is a franchise for certifying private midwives, managed by IBI. The process to be certified as a Bidan Delima involves registration with IBI, support from a facilitator to improve specific skills and competencies as identified by a self-assessment instrument, an onsite visit, and reference materials on clinical standards. Although there are areas for improvement in this program, initiatives such as these can be a helpful complement to improving standards, especially if professional bodies such as IBI are involved.
EXECUTIVE SUMMARY
5

MATERNAL HEALTH REPORT . 2017Revealing the Missing Link
6

section 1 .
INTRODUCTION7

MATERNAL HEALTH REPORT . 2017Revealing the Missing Link
Despite progress in recent decades, Indonesia’s maternal mortality ratio (MMR) remains high. Joint WHO-UNICEF-WB estimates (2017) indicate an MMR of 126 per 100,000 live births in 2015,5 down from 446 in 1990. Data from other sources such as the census indicate that the MMR may be even higher than this estimate. About 6,400 maternal deaths among 5 million live births occurred in the country in 2015: this amounts to one maternal death every 1.4 hours. At current levels, Indonesia’s MMR remains high relative to its income level and to regional and economic peers such as ASEAN and BRICS countries.6 Indonesia’s MMR is high due to a combination of factors–including poor access to emergency obstetric services, poor supply-side service readiness and quality of health care, and an insignificant share of non-institutional deliveries.
The MMR varies substantially within the country. In the eastern provinces of West Papua, Papua, Central Kalimantan, Central Sulawesi, and Maluku, the MMR is above 200; but DKI Jakarta, Jambi, West Java, Bali, and Lampung have MMRs that are less than 100. Due to their large populations, however, the absolute numbers of maternal deaths are higher in these latter provinces despite relatively low MMRs. The government has identified 64 high-priority districts across nine provinces for targeted efforts at reducing the national MMR. These 64 districts in the provinces of North Sumatra, South Sumatra, Lampung, DKI Jakarta, West Java, Banten, Central Java, East Java, and South Sulawesi are home to 33 percent of Indonesia’s population and account for 30 percent of maternal deaths. They were selected based on absolute numbers of maternal deaths, not district-level MMRs.
Indonesia’s high MMR contrasts starkly with its national commitment to attain universal health coverage (UHC) by 2019. Landmark legislation in 2004 and 2011 established a pathway to UHC and social health insurance (SHI) coverage rates have increased significantly recently. In 2014, when Indonesia merged its various SHI schemes under Jaminan Kesehatan Nasional (JKN), the country
formed one of the largest single-payer population coverage programs in the world, covering about 70 percent of the population. As the country gears towards attaining UHC and prepares to gain upper-middle-income status, its high MMR remains notably anomalous, despite decent utilization of antenatal care (ANC) and skilled birth attendance (SBA).
The importance of MH for human development was recognized by its inclusion in the Millennium Development Goals (MDGs) which called for a three-fourths reduction in the MMR over 1990-2015. The MDGs have been replaced by the Sustainable Development Goals (SDGs) which call for a reduction in the MMR to less than 70 per 100,000 live births by 2030. Unlike the child health MDG, Indonesia did not attain the 2015 MDG target and progress on reducing the MMR will need to be sustained in coming years for Indonesia to attain the 2030 SDG target. Many studies have demonstrated that poor MH outcomes–early pregnancies, unintended pregnancies, excess fertility, and poorly managed obstetric complications–adversely affect the opportunities for poor women and their families to escape poverty (Greene and Merrick 2005). Women’s full and equal participation in the development process is contingent on accessing essential MH services, including the ability to make voluntary and informed decisions about fertility; untreated pregnancy and birth complications deter the ability of women to support their families and communities. Access to maternal health and related coverage indicators–including family planning, ANC, and SBA–are recommended by WHO-WB among the dashboard of tracers for assessing progress towards UHC (WHO and World Bank 2015).
Various studies (Achadi et al. 2014; World Bank 2014; Tandon et al. 2016; and Koblinsky et al. 2017) have already described the health financing, demand-side, and public-sector context of MH in Indonesia and these findings will not be recapitulated here in detail, but a notable knowledge gap is the private sector context. This
5 TheMMRacceptedbytheGovernmentofIndonesia(Bappenas)is305per100,000livebirths(SUPAS2015).Thefiguresusedinthis report are based on the WHO-UNICEF-WB estimates.
6 ASEAN (Association of Southeast Asian Nations) is a regional organization comprising Brunei Darussalam, Cambodia, Indonesia, LaoPDR,Malaysia,Myanmar,Philippines,Singapore,Thailand,andVietnam.BRICSreferstotheassociationoffiveemergingcountries: Brazil, Russia, India, China, and South Africa.
8

INTRODUCTION
gap is significant as most MH service utilization is at private facilities. It is this gap or ‘missing link’ that this policy paper addresses by presenting fresh information on private sector service readiness to deliver key MH services such as ANC and basic obstetric care at the primary care level. This paper uses MH utilization data from the National Socioeconomic Survey (SUSENAS) and the Indonesia Family Life Survey (IFLS), combined with facility data collected in the Indonesia Quantitative Service Delivery Survey 2016 (Indonesia QSDS 2016), from a sample of private MH providers in the 64 high-priority districts. It compares service readiness for MH across these private providers with those in public providers in the sample districts. Detailed sampling and analytical methodology is described in Appendix One.
Although the Government of Indonesia has not articulated an overarching and formal vision for private health provision in Indonesia, the government has been positive about the role of the private sector. JKN, the government’s SHI initiative, purchases services from private providers consistent with Indonesia’s National Medium-term Development Plan 2015-2019 (RPJMN 2015-2019) (Bappenas 2015). This plan highlights the role of public-private partnerships (PPPs), which are regulated by Perpres No. 38/2015 and Permen PPN No. 4/2015. Given the current realities of MH service provision in Indonesia, where private provision is dominant yet overall utilization of institutional deliveries is below target, an ideological divide on private vs public provision is unnecessary as both sectors are needed to close the provision gap.
Strategies to improve the quality and extend the coverage of both sectors need to be informed by the common and distinct strengths and weaknesses of each sector. For example, different strategies may be needed in West Papua, a remote and rural area where the public sector will remain a critical provider, compared with the urban areas of Java, where the private sector has a vital role. Policy-relevant findings for the public sector, including issues specific to health financing, have already been articulated in earlier studies and are not the focus of this policy paper, which is the private sector. Together, these papers provide critical inputs to informing policy reforms aimed at helping Indonesia to reduce its MMR to levels that are, at the very least, commensurate with its socioeconomic status and for attaining UHC.
This policy paper is structured into five sections. Section Two provides some background on Indonesia, including general health-related outcomes and an overview of the country’s health system and financing. Section Three focuses on MH outcomes and context, including comparisons with global peers, and provides an overview of provision, utilization, and financing of MH services in the country, underscoring the importance of private providers. Section Four summarizes the distributional context and service readiness of private MH providers across the 64 high-priority districts, including a comparison with public providers for context. Section Five concludes with a summary of key findings and their policy implications.
9

MATERNAL HEALTH REPORT . 2017Revealing the Missing Link
10

section 2 .
BACKGROUND11

MATERNAL HEALTH REPORT . 2017Revealing the Missing Link
With a population of over 250 million, Indonesia is the fourth most populous country in the world after China, India, and the USA. Close to one-half of the population live in rural areas, where about 48 percent of women of reproductive age (15 to 49) currently reside. The country is an archipelago, comprising five major islands and more than 18,000 smaller islands, of which approximately 6,000 are inhabited. It has 34 provinces, 511 districts (including both rural districts [kabupaten] and urban districts [kota]), and some 72,000 villages. Indonesia is the largest economy in ASEAN, is a member of the G20 largest economies in the world, and is often compared with the BRICS countries.7 With a GNI per capita of US$3,440 in 2015, it is classified as a lower-middle-income country, ranking next to the Philippines and Egypt.
Socioeconomic Context
The national poverty rate stands at 11 percent, with approximately 36 percent of the population living on less than US$3.10 per day and 8 percent on less than US$1.90 per day in 2014.8 Economic growth rates have been robust and consistent in recent years and are expected to continue to be in the 5-6 percent range for the coming five years (IMF 2016). The bottom 40 percent of Indonesia’s population, however, has not benefited as much from the country’s economic growth in recent years. This has resulted in rising income inequality and a persistence of labor market informality. This rise in inequality is the second largest in the EAP region next to China (World Bank 2016a). The bottom 40 percent of the population remains highly vulnerable to shocks–including health shocks–and tends to work in low-productivity, low-pay, nontradable sectors. Persistence in labor market informality has also accompanied this rise in inequality, with over 54 percent of national employment continuing to be classified as informal (nonsalaried workers) (Sakernas 2015). Women comprised 38 percent of the labor force in 2014 and adult (above 15 years of age) female literacy rates were high at 94 percent in 2015 (World Bank 2016b).
7 The G20 countries include Argentina, Australia, Brazil, Canada, China, France, Germany, India, Indonesia, Italy, Japan, Mexico, Republic of Korea, Russia, Saudi Arabia, South Africa, Turkey, United Kingdom, USA, European Union.
8 (http://databank.worldbank.org/data/reports.aspx?source=poverty-and-equity-database) accessed September 27, 2017.
12

BACKGROUND
Indonesians have undoubtedly become healthier in recent decades. Life expectancy at birth has increased to 69 years in 2015, having risen steadily from 63 years in 1990 and only 49 years in 1960. The under-five mortality rate has declined from 222 per 1,000 live births in 1960 to 85 in 1990 and 27 in 2015. Indonesia met the child-health related MDG target of an under-five mortality rate of 28 or less by 2015. Infant mortality has declined six-fold since 1960, down to 23 per 1,000 live births in 2015. Both life expectancy and infant mortality rates are about average of what might be expected for Indonesia’s income level.
Furthermore, Indonesia has made important strides towards attaining UHC: landmark legislation in 2004 and 2011 have helped realize a potential pathway to UHC via SHI. Coverage rates have increased significantly in recent years, from ~27 percent in 2004 to ~70 percent in 2017.9 In terms of population coverage, Indonesia now has one of the largest single-payer SHI programs (Jaminan Kesehatan Nasional, or JKN) in the world. By 2019, everyone in Indonesia is supposed to have coverage under JKN.Indonesia has mixed public-private provision of health services.10 The public sector generally takes a dominant role in rural areas and at secondary levels of care, but this is not necessarily the case across all health services, as private providers play a dominant role in the provision of MH services.
Health Sector Context
Private provision has been increasing rapidly in recent years, especially for primary care. Dual practice is allowed and many private providers also work in public health services. There are 2,228 hospitals in the country and more than one-half of them are now private although, in terms of beds, the public sector is still dominant. Public provision is decentralized to the district level.
As a large country spanning several time zones and many islands, geography poses a significant obstacle to service delivery. Although the distribution of public primary health care facilities is quite good throughout the country and utilization is generally pro-poor, public hospital utilization tends to be skewed towards the upper economic quintiles. Supply-side readiness of public primary care facilities is highly variable across provinces. Despite having attained the minimum WHO norm for aggregate numbers of workers, human resources for health remains a key challenge. Key issues include maldistribution, a shortage of specialists, and poor skills and training. Furthermore, Indonesia has only 1.07 beds per 1,000 population, one of the lowest densities of beds in ASEAN. Quality of health care also varies considerably across the country–with richer, urban citizens often able to access much higher quality services than poorer families in remote districts.
9 There were 176,738,998 JKN enrollees as of May 1, 2017 (https://www.bpjs-kesehatan.go.id/)10Formoreinformationonhealthfinancing,includingatthedistrictlevelandthephysicalresourcesoftheIndonesianhealth
system, both public and private, see Tandon et al. 2016.
13

MATERNAL HEALTH REPORT . 2017Revealing the Missing Link
Total health expenditure (THE) per capita in Indonesia was US$126 in 2014, or about 3.6 percent of gross domestic product (GDP) per capita. Global and regional benchmarks indicate that Indonesia’s health system remains significantly underresourced (Table 2-1). Indonesia’s THE levels are among the lowest in the world, and are particularly low when benchmarked against other lower-middle-income countries and several comparators. Although Indonesia is following an SHI model for attaining UHC in principle, in reality the health system is financed through a combination of sources and disparate flows. The four primary sources of health financing include out-of-pocket (OOP) spending by households, government budgetary supply-side health spending, SHI (that is, JKN) expenditures, and a small amount of external financing.
OOP spending by households–a generally inefficient and inequitable financing modality–remains the largest source of financing for health in Indonesia. An estimated 8 percent of all households (7 million households) are either impoverished or pushed deeper into poverty because of high OOP spending every year. The OOP spending share of THE has remained more than 45 percent since 1995 (WHO recommends this share be less than 20 percent). OOP spending on health is unlikely to decline unless there is significant expansion in JKN coverage, an improvement in supply-side readiness at public facilities for health, and inclusion of branded pharmaceuticals in the benefits package.
Government budgetary supply-side spending is the second largest component of health financing in Indonesia. Despite recent increases, the overall level of public financing remains one of the lowest in the world. This is partly a result of low revenue generation capacity of the country and the fact that health is accorded a generally low priority as reflected in its relatively small share of the national budget.
Health Financing
JKN expenditures are the third largest source of health financing. Although JKN covers approximately 70 percent of the population, it accounts for only around 13 percent of THE. This is because demand-side reimbursements from JKN are not the primary source of financing for public facilities. Public facilities receive supply-side investments and operational financing in the form of equipment and drugs, determined and supplied by the local government (particularly the district-level government). Operational budgets (including salaries) are also provided by local governments (except for central hospitals) (Tandon et al. 2016). Accountability for supply-side readiness (especially for noncommodities such as equipment and staffing) is, therefore, to a large extent within the responsibility of local governments.
Almost one-half of JKN expenditure is currently sourced from the central government in the form of premium payments for the poor and near-poor, and significant cofinancing from government budgetary expenditure remains at public facilities. As JKN also purchases services from the private sector, it is an important instrument for engagement with the sector, however, a notable current weakness of JKN is contribution collection among nonpoor informal workers, which has resulted in limited JKN coverage for this population group.
External sources are the fourth largest source of financing. While these account for only 1 percent of THE, they remain an important source of financing and technical assistance for some specific programs including immunization, HIV, TB, and malaria. Indonesia disbursed approximately US$29 million in official development assistance (from all donors) for reproductive health care in 2015, a reduction from a peak of US$39 million in 2012 (OECD 2017).
14

Table 2.1 Key Health Financing Indicators for Indonesia and Comparators, 2014
Health Financing Indicators Indonesia ASEAN BRICS Low income
Lower middle income
Upper middle income
THE per capita US$126 US$502 US$581 US$41 US$141 US$494
THE as share of GDP (%) 3.6 4.3 6.9 6.3 5.9 7.0
Public share of THE (%) 40 52 46 40 54 63
Social insurance share of THE (%) 13 8 14 2 7 18
OOP share of THE (%) 46 41 34 41 38 29
External share of THE (%) 1 8 1 33 14 4
Source WDI.Selectedfinancingsourcesandfinancingagents.Categoriesselectedarenotmutuallyexclusiveandcollectivelyexhaustive.
BACKGROUND
15

MATERNAL HEALTH REPORT . 2017Revealing the Missing Link
16

section 3 .
MATERNAL HEALTH OUTCOMES AND CONTEXT
17

MATERNAL HEALTH REPORT . 2017Revealing the Missing Link
Despite notable progress in the health sector, several challenges remain, especially regarding MH. By most estimates, Indonesia has made steady and significant progress in attaining reductions in maternal mortality in the past few decades. Joint UN-WB data indicate that Indonesia’s MMR declined by an average of 5.1 percent per year over the period 1990-2015 (Figure 3.1). Estimates from the Institute of Health Metrics and Evaluation (IHME) model indicate an annual decline of 3.3 percent per year over the same period. The Indonesia Demographic and Health Survey (IDHS) data indicate a decline of 4.0 percent per year over 1994-2007 (albeit followed by an increase over the period 2007-2012).
The decline in maternal mortality is a result of improvements in general socioeconomic conditions as well as government initiatives specifically targeting MH and improving SBA. In addition
Internationally Contextualized Maternal Health Outcomes and Trends in Indonesia
to improving financial access via the expansion of SHI coverage, Indonesia has implemented several programs during the last three decades that include improving access to family planning, overhauling the national midwifery program (1980s), and earmarking funding for health services in disadvantaged areas (Webster 2012). At 126 maternal deaths per 100,000 live births, however, Indonesia did not attain the MDG MMR target of 102 or lower by 2015. As a consequence, sustained progress will be needed to meet the 2030 SDG target of 70.
Maternal hemorrhage (both postpartum and antepartum) and hypertensive disorders during pregnancy (including eclampsia and preeclampsia) are the two biggest causes of maternal deaths in Indonesia. The overall burden from maternal hemorrhage has been decreasing slowly over the years, but remains the main cause of
Figure 3.1 MMR in Indonesia (1990-2015)
Source Joint WB-UN estimates; Indonesian Cencus; Indonesia Demographic Health Survey (IDHS); Institute of Health Metrics and Evaluation (IHME)Note y axis in log scale
Baseline
MDG target
IDHS
Census
IHME
WB-UN estimated
SDG target<=70
5010
020
040
060
0M
ater
nal d
eath
s pe
r 100
,000
live
birt
hs
1990 1995 2000 2005 2010 2015 2030
18

MATERNAL HEALTH OUTCOMES AND CONTEXT
maternal mortality, while deaths from maternal hypertensive disorders are rising (Figure 3.2). Adolescent pregnancies are a further concern as mothers under the age of 18 are more likely to experience complications during pregnancy. According to survey data, 10 percent of adolescent women (age 15–19 years) had begun childbearing. Unsurprisingly, adolescent women from rural areas, with only primary education (or less), and those from lower wealth quintiles are associated with early childbearing. A further 10 percent of women who gave birth were in the older high-risk age-group over 39 years of age.
In terms of socioeconomic factors, a mother’s education and wealth are found to be significantly and negatively related to maternal mortality (Achadi et al. 2007; Cameron, Suarez and Cornwell 2016). First pregnancies are also found to have higher risks compared to those of women with at least one child (Cameron, Suarez and Cornwell 2016). While some papers determined that low socioeconomic factors, such as living in a rural area and poor hygiene have an influence on high maternal mortality, newer research argues that the effects of a household’s water and sanitation condition and living in a rural area become insignificant once health facility availability and access are considered (Taguchi et al. 2003; Cameron, Suarez and Cornwell 2016).
It is notable that MH outcomes–especially a country’s MMR—are often deemed to be some of the best ‘barometers’ of the performance of a country’s overall health system. Policies to strengthen MH generally strengthen the entire health care system. For example, infrastructure investments to improve access to, and quality of, MH services can also improve access to prevention and treatment of other health conditions. This positive spillover effect extends beyond the supply side and onto the demand side. The health of the mother is critical to the development of her children, who depend on her for the provision of food, care, emotional support, and so forth (Filippi et al. 2006).
Improving MH also involves continuity in the improvement of health care from pregnancy through childbirth, the neonatal period, and early childhood and across the entire range of preventive, promotive, curative, palliative, and rehabilitative health services, including emergency care. Some argue that increased maternal survival is one of the two basic goals which reflect improvement in the overall population’s other health problems (the other basic goal is increased overall life expectancy) (Garrett 2007). This is because indicators such as the MMR are highly dependent on the overall status of the health care system: if pregnant mothers survive, they do so
Figure 3.2 MMR in Indonesia (1990-2015)
Source Joint WB-UN estimates; Indonesian Cencus; Indonesia Demographic Health Survey (IDHS); Institute of Health Metrics and Evaluation (IHME)Note y axis in log scale
1990 2000 2010 2015
Maternal hemorrhage Maternal sepsis and other maternal infections
Maternal hypertensive disorders Maternal obstructed labor and uterine rupture
Maternal abortion, miscarriage, and ectopic pregnancy
47%
4%22%
1%
26%
45%
4%24%
1%
26%
41%
4%28%
2%
26%
40%
4%28%
2%
26%
19

MATERNAL HEALTH REPORT . 2017Revealing the Missing Link
in an environment with “safe, clean, round-the-clock surgical facilities”, well-trained medical staff, and a sufficient supply of sterile equipment and antibiotics (Garrett 2007).
Indonesia underperforms in its MMR attainment considering its economic status and THE per capita. For example, Sri Lanka has a similar GNI per capita as Indonesia, but has a substantially lower MMR of only 30 per 100,000 live births (Figure 3.3). Vietnam’s MMR is far lower than Indonesia’s, despite Indonesia having a much higher GNI per capita. In addition, progress over time in improvements in MMR have been relatively slow in Indonesia compared with BRICS and ASEAN countries (Figure 3.4). In fact, it is startling that the rate of improvement in the MMR in other ASEAN countries is similar to Indonesia’s rate, given that ASEAN countries start from a lower (and hence harder to improve) MMR baseline.
11 See Achadi et al. 2007; Taguchi et al. 2003; Hatt et al. 2007; Frankenberg et al. 2009; D’Ambruoso et al. 2013 and Cameron et al. 2016.
There are large provincial disparities in the absolute number of maternal deaths and in the MMR (also see Figure 5-1). Whereas the absolute number of maternal deaths was highest in populous provinces of Java in 2014, the MMR is highest in West Papua, Papua, Central Kalimantan, Central Sulawesi, and Maluku. DKI Jakarta, Jambi, West Java, Lampung, and Bali by contrast have MMRs below 100 (Figure 3.5). A previous assessment found a close inverse relationship between institutional delivery rates and the MMR (and lower socioeconomic parameters) across provinces (World Bank and MoH 2014). Access to health care facilities are associated with improved maternal mortality, especially in rural areas.11 Health care facility preparedness for emergency responses are also found to be important factors (Belton, Myers, and Ngana 2014). Home-based care is very limited and improvements in access to skilled delivery care in health centers and emergency care in hospitals is a sustainable way to reduce Indonesia’s maternal deaths (Ronsmans et al. 2009).
Figure 3.3 Causes of Maternal Mortality (1990-2015)
Source WDINote Both x and y axes in log scale
Brazil
India
Philippines
Russia
South Africa
Brunei
Lao PDR
Cambodia
Singapore
Vietnam
China
MalaysiaSri Lanka
Thailand
Myanmar
Indonesia
LOW INCOME
LOWERMIDDLEINCOME
UPPERMIDDLEINCOME HIGH INCOME
2510
050
01,5
00
Mat
erna
l dea
ths
per 1
00,0
00 li
ve b
irths
250 500 1,000 2,500 10,000 35,000 100,000GNI per capita
20

Figure 3.5 Provincial-level Maternal Deaths and MMR (2014)
Source MOH (Download from http://gizikia.depkes.go.id/data/(July 17,2016)
Figure 3.4 Trends in MMR (1990-2015): Indonesia and Comparator ASEAN and BRICS Countries
Source Joint WB-UN estimatesNote y axis in log scale
Indonesia
BRICS (average)
ASEAN (average)
5010
020
040
060
0
Mat
erna
l dea
ths
per 1
00,0
00 li
ve b
irths
1990 1995 2000 2005 2010 2015
0 200 400 600 800
Province
DKI JakartaJambi
West JavaLampung
BaliNorth Sumatera
DI YogyakartaEast Java
South SulawesiBangka Belitung
West Nusa TenggaraSouth Sumatera
RiauCentral Java
West SumateraWest Kalimantan
Southeast SulawesiEast KalimantanNorth Sulawesi
Riau IslandsNanggroe Aceh Darussalam
BengkuluEast Nusa Tenggara
South KalimantanBanten
GorontaloWest SulawesiNorth Maluku
MalukuCentral Sulawesi
Central KalimantanPapua
West Papua
Absolute Maternal Deaths
Maternal Mortality Ratio
21

MATERNAL HEALTH REPORT . 2017Revealing the Missing Link
Provision and Utilization of Maternal Health Services
reported attendance by a skilled provider, with the majority of “skilled” providers for the top 20 percent being obstetricians and gynecologists compared with a majority being midwives for the bottom 40 percent.
Although SBA rates are high, there are concerns about preservice and in-service training of midwives and their adherence to protocols, suggesting inadequate quality in provision of MH services. Access to emergency obstetric care in the case of complications remains a challenge in some parts of the country. In general, the number of obstetricians is low and availability is skewed, with most of them practicing in Java. Referral systems do not always function smoothly across different levels of care and quality of care in primary and referral facilities is also an issue. International experience indicates that between 11 and 17 percent of maternal deaths occur during childbirth and between 50 and 71 percent occur during the postpartum period (WHO 2005).
Another major area of weakness is the low rate of institutional deliveries. Nationally, only 77 percent of women reported delivering at a public or private institution in 2015 (Figure 3.6), a significant increase from 44 percent in 1997. Notably, private sector institutional deliveries increased faster than public sector institutional deliveries between 1997–2007. A contributory factor in the increase in private provision is due to low public salaries and allowance given for dual practice at private facilities. This has encouraged a blossoming of private practice by dual-practicing public midwives. Other commentators (Heywood and Harahap 2009) have also noted the rapid growth of private health education institutions (both medicine and midwifery) which contributed to a large increase in the number of graduates. These graduates could not be absorbed into the public sector and many became private providers immediately after graduation. To obtain a practice license from the DHO, graduates working in the private sector must register with the professional associations.
Public MH providers include a network of over 10,000 primary health care centers (puskesmas) with each serving a catchment area of 25,000-30,000 individuals, village delivery posts (polindes), village health posts (poskesdes), and public hospitals of various sizes and degrees of specialization. Although they are both public rural providers, polindes and poskesdes differ in that polindes are limited to maternity care, whereas poskesdes provide promotive, preventive and curative services within the authority of the health provider (midwife, nurse) placed in the poskesdes. Private MH providers include private hospitals, multipractitioner private maternity clinics (klinik bersalin), and single-practitioner home-based or clinic-based private midwives.
Utilization of ANC and SBA is relatively high in Indonesia. Data from IFLS 2015 indicates that more than 97 percent of women had at least one ANC visit during their pregnancy and 95 percent reported more than four ANC visits. Furthermore, 87 percent reported ANC visits as per schedule (at least one during the first trimester, at least one during the second, and at least two during the third). Differences in ANC between rural and urban areas and across regions was not substantial.
Recent data confirms the growing predominance of private primary care facilities for ANC. Nationally, over three-fourths of utilization of MH services occurred at private providers, up from just over 60 percent in 1997. Only about 20 percent of ANC visits occurred in puskesmas; and less than 5 percent each occurred at public hospitals, private hospitals, and polindes/poskesdes.
SBA rates were uniformly high across the country, even for those in the bottom 40 percent in terms of economic status, however, the composition of what comprised “skilled” varied significantly (Table 3.1). Over 99 percent of the top 20 percent by economic status and 86 percent of the bottom 40 percent
22

Table 3.1 SBA Rates in Indonesia (2015)
SBA Rate by Category Any SBA Specialist Obstetrician Primary Care Doctor Midwife
By economic statusBottom 40% 86% 14% 2% 70%Middle 40% 94% 26% 2% 66%Top 20% 99% 54% 3% 43%
By insurance statusUninsured 89% 17% 2% 70%Insured 92% 28% 2% 61%
By urban-ruralUrban 96% 32% 2% 62%Rural 85% 15% 2% 68%
National 91% 24% 2% 65%
Source SUSENAS 2015.Note Due to rounding errors, the breakdown in SBA rates may not total to 100%.
Figure 3.6 Trends in Institutional Delivery Rates at Public and Private Providers in Indonesia (% of All Deliveries) (1997–2015)
Source IFLS various year
9%
35%
10%
39%
12%
47%
22%
55%
1997 2000 2007 2015
Public Private
23
MATERNAL HEALTH REPORT . 2017Revealing the Missing Link
Figure 3.7 Districts with Low SBA and/or Institutional Delivery Rates
Source SUSENAS 2015
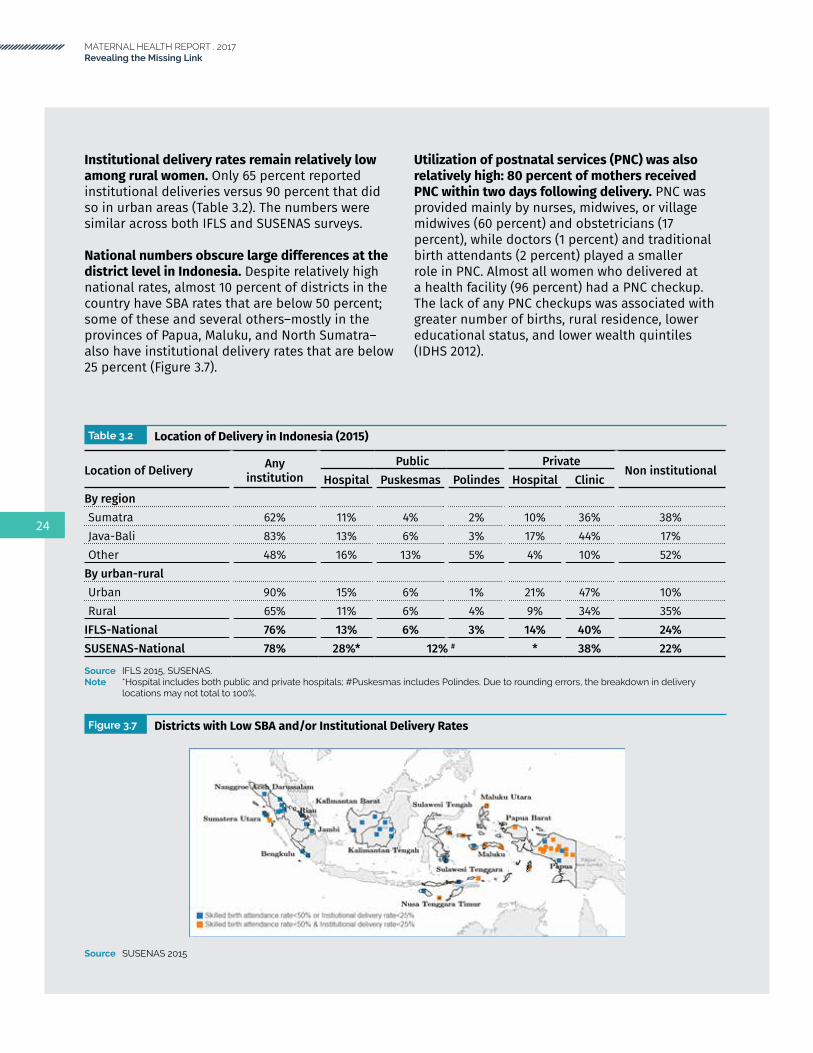
Institutional delivery rates remain relatively low among rural women. Only 65 percent reported institutional deliveries versus 90 percent that did so in urban areas (Table 3.2). The numbers were similar across both IFLS and SUSENAS surveys.
National numbers obscure large differences at the district level in Indonesia. Despite relatively high national rates, almost 10 percent of districts in the country have SBA rates that are below 50 percent; some of these and several others–mostly in the provinces of Papua, Maluku, and North Sumatra–also have institutional delivery rates that are below 25 percent (Figure 3.7).
Utilization of postnatal services (PNC) was also relatively high: 80 percent of mothers received PNC within two days following delivery. PNC was provided mainly by nurses, midwives, or village midwives (60 percent) and obstetricians (17 percent), while doctors (1 percent) and traditional birth attendants (2 percent) played a smaller role in PNC. Almost all women who delivered at a health facility (96 percent) had a PNC checkup. The lack of any PNC checkups was associated with greater number of births, rural residence, lower educational status, and lower wealth quintiles (IDHS 2012).
Table 3.2 Location of Delivery in Indonesia (2015)
Location of Delivery Any institution
Public PrivateNon institutional
Hospital Puskesmas Polindes Hospital ClinicBy regionSumatra 62% 11% 4% 2% 10% 36% 38%Java-Bali 83% 13% 6% 3% 17% 44% 17%Other 48% 16% 13% 5% 4% 10% 52%
By urban-ruralUrban 90% 15% 6% 1% 21% 47% 10%Rural 65% 11% 6% 4% 9% 34% 35%
IFLS-National 76% 13% 6% 3% 14% 40% 24%SUSENAS-National 78% 28%* 12% # * 38% 22%
Source IFLS 2015, SUSENAS.Note *Hospital includes both public and private hospitals; #Puskesmas includes Polindes. Due to rounding errors, the breakdown in delivery
locations may not total to 100%.
24

Maternal Health-Related Financing Schemes
There are two important health financing schemes that provide coverage for MH services:
• Jampersal, the MH-specific financing scheme which predates JKN and was discontinued in January 2014, but was reintroduced in 2016 in a revamped form; and
• JKN, the national flagship SHI scheme which was implemented in 2014.
Jampersal (2011–13; Revamped 2016–present)
Jampersal from 2011 to December 2013 was a special financing scheme for MH services financed by the central government, which provided a comprehensive MH benefits package. During that period, Indonesia essentially had universal MH services coverage as anyone not covered by earlier SHI programs (for example, Jamkesmas and Askes, which have now been merged into JKN), regardless of their socioeconomic status, had coverage via Jampersal (Achadi et al. 2014). When JKN was introduced in 2014, Jampersal was discontinued. This resulted in a loss of coverage for MH services for those not covered through JKN and is an important lesson that coverage lapses from policy changes such as this should be avoided in the future.
Jampersal was subsequently reintroduced and revamped in 2016, but with modifications to the benefits and coverage. These changes were enabled by an adjustment by Indonesia’s Ministry of Finance (MoF) of special purpose grants (Dana Alokasi Khusus or DAK) to cover noninfrastructure
expenditures (‘DAK nonfisik’) effective from 2015 onwards. MoH technical guidelines for DAK now state that DAK nonfisik can finance operational assistance for health (Bantuan Operasional Kesehatan or BOK), Jampersal, and accreditation of puskesmas and hospitals. The revamped Jampersal makes use of this adjustment and includes in its benefits package rent payments and the cost of a maternity waiting home (Rumah Tunggu Kelahiran) nearby a health facility, as a transit place for pregnant women who are near term. Jampersal also covers referrals from home to health care facility, delivery care, family planning services postpartum, neonatal care at puskesmas, and institutional deliveries at third class wards for poor pregnant women, who are not covered under JKN, Kartu Indonesia Sehat (KIS), or other health-financing schemes.
Jaminan Kesehatan Nasional (2014–present)
Although a broad-based national SHI program, the theoretical benefits package for MH services under JKN is comprehensive. MH services can be purchased from public and private providers, with the same tariff applying to sectors. The benefits package, provider payment mechanisms (PPMs), and tariff rates are summarized in Table 3.3. It should be noted that payments by capitation are only for primary health care clinics, as MH services are paid using a separate PPM.
Private primary care providers (that is, puskesmas, puskesmas PONED,12 and private GP clinics, although generally not private midwives) can
12 PONED (Pelayanan Obstetrik dan Neonatal Emergensi Dasar): Basic Obstetric and Neonatal Emergency Care (BEONC).
25

MATERNAL HEALTH REPORT . 2017Revealing the Missing Link
Table 3.3 JKN Benefits Package and PPMs for MH Services13
Benefits Package PPM and Tariff RatesAT THE PRIMARY LEVEL14
• Four ANC visits, for early detection and management of risk factors for obstetric and newborn complications. ANC services to be conducted according to clinical standards.
• Rp 200,000 per package including a minimum of four ANC visits
• If ANC services are provided in more than one facility, the fee is Rp 50,000 per ANC visit.
• Delivery care services: normal vaginal delivery, management of postabortion bleeding, vaginal delivery with basic emergency care, postpartum care (for example, manual removal of the placenta), prereferral care in maternal and neonatal complications.
• Newborn examination.
• Normal vaginal delivery: Rp 700,000/case (by midwife), Rp 800,000/case (by physician).
• Management of postabortion bleeding, vaginal delivery with basic emergency care: Rp 950,000/case.
• Postpartum emergency care (for example, manual placenta removal): Rp 175,000/case.
• Prereferral care in maternal and neonatal complications: Rp 125,000/case.
• The tariff is a package tariff including accommodation for the mother and the neonate, and for neonatal care. Copayment is not allowed.
Four postnatal care visits: general maternal and infant health, comprehensive screening for detection and treatment/referral of complications, counseling.
• Payment for first and second maternal and neonatal postnatal visit, third neonatal postnatal visit and third maternal postnatal visit during the postnatal period: Rp 25,000 per visit, paid to the first provider.
Family planning services. • Implant/IUD insertion and/or extraction: Rp 100,000/case.• Injectable contraceptives: Rp 15,000/case.• Family planning complication: Rp 125,000/case.• Vasectomy: Rp 350,000/case.
AT THE SECONDARY LEVEL:• Antenatal and postnatal care at a referral facility
can be covered on medical indication and referral from a primary care facility only.
• Normal delivery at a referral facility can be covered on emergency conditions only: bleeding, pregnancy with seizures, early rupture of membrane, fetal distress, or other mother life threatening conditions.
• Payment is according to INA-CBG tariff regulated by MoH.
13MinisterofHealthRegulationNo.52/2016onHealthServicesStandardTariffundertheNationalHealthInsuranceProgram(JKN),and BPJS Practical Guidelines for Maternal and Neonatal Services.
14 Obstetric and neonatal care, and family planning services performed by a physician or a midwife at a primary health care facility are not included in the capitation (noncapitation) payment to the facility but paid based on fee for service.
26

empanel directly with the administrator for JKN, Badan Penyelenggara Jaminan Sosial (BPJS), and receive reimbursements for JKN services provided directly.15 The process of empanelment involves online registration and completion of a self-assessment form, followed by formal credentialing and contracting.
Private midwives would be generally expected to participate in JKN indirectly, that is, as part of the network of a ‘parent’ facility (for example, a private primary care provider) subcontracted to do so. This ‘parent’ facility would be responsible for ensuring that the service readiness of its subcontractor is adequate, using the same criteria used for obtaining a practice license from the DHO. Subcontracted facilities would claim for payments through the ‘parent’ facility, but the ‘parent’ facility can withhold up to 10 percent of the reimbursement fee.
The exception to this general rule is where there are no private primary care providers to act as a ‘parent’ facility for private midwives in a particular geographic area, typically in a rural and remote area. In this situation, the district health officer16 can make an exception whereby a village midwife/private midwife can be empaneled directly with BPJS and receive payments directly from BPJS.17 Additional information on business registration and licensing of private health providers in Indonesia has been described in earlier studies (Chee, Borowitz and Barraclough 2009).
From a payments perspective, PPMs are similar for Jampersal and JKN. Under JKN, however, a private primary health care provider can empanel directly with, and receive payments directly from, BPJS as a ‘parent’ of a provider network, whereas under the earlier regime, payments for MH services under Jampersal (and Jamkesmas, another scheme which has been superseded by JKN) had to flow through puskesmas.
15 Panduan Praktis BPJS untuk Pelayanan KIA (Kesehatan Ibu dan Anak): BPJS Practical Guide for Health Services for Mothers and Children.
16 SK (Surat Keputusan) Kepala Dinas Kesehatan Kabupaten/Kota: Decree of Head of District/City Health Agency.17 Section III-2, Panduan Praktis BPJS untuk Pelayanan KIA.
27

MATERNAL HEALTH REPORT . 2017Revealing the Missing Link
28

section 4 .
PRIVATE PRIMARY MATERNAL HEALTH SUPPLY-SIDE ANALYSIS
29

MATERNAL HEALTH REPORT . 2017Revealing the Missing Link
Coverage of critical MH services such as ANC and SBA, and even institutional deliveries, will not be effective in improving MH outcomes without the right mix of inputs or ‘service readiness’, including trained, able, motivated, and present health workers, infrastructure, equipment, medicines, and diagnostics, including at private MH providers, where the largest share of utilization takes place. Although JKN provides a comprehensive benefits package that includes MH services in theory, the ‘effective’ depth (benefits package) of coverage–not just on paper, but also in effect (available at an accessible, high-quality, empaneled provider)–especially in rural, remote regions of the country is critical.
This section presents analysis on the service readiness of primary MH services. It is based on the Indonesia QSDS 2016, across the 64 high-priority
districts (see Appendix One), and contrasted with public providers–that is, puskesmas and polindes/poskesdes–where relevant. Hospital-level MH services are also a critical part of the continuum of the MH delivery system, but are not the focus of this policy paper as Indonesia QSDS 2016 focused on primary-level providers.
Key findings from this analysis are presented as a storyline. The storyline has the following overall structure: (a) the overall distribution, density, and coverage of private MH services; (b) at the facility level, the ‘hardware’ aspects of service readiness such as infrastructure, equipment, medicines, and diagnostics; and (c) at the health worker level, the ‘software’ aspects of service readiness, such as training, provider ability, and the content of care received by patients.
Figure 4.1 Distribution of the Sample of 12 of the 64 High-Priority Districts
Source Indonesia QSDS 2016.
30

Distribution, Density, and Coverage of Private Maternal Health Services
In the sampled priority districts, approximately one-half of primary MH providers were private and, of these, 56 percent were multiple-practitioner providers (Table 4.1). These include both home-based practices and maternity clinics or ‘klinik bersalin’, and were staffed by a mean of 2.6 midwives (Table 4.2). The remaining 44 percent were single-practitioner providers, which include both home-based private midwives (occasionally, there may be an ‘assistant’ midwife) and clinic-based private midwives. Single-practitioner private MH providers conducted on average, 22 deliveries per year, compared with 50 deliveries per year for multipractitioner private MH providers.
These private providers can be found in both urban and rural settings but there was a slightly higher proportion of multipractitioner MH providers in
urban areas (55 percent) compared with single practitioners. Single-practitioner MH providers were approximately evenly split among urban and rural areas (49 percent and 51 percent respectively). Private MH providers were highly concentrated in the provinces on Java and Bali, and North Sumatra and Jambi provinces.
Public primary MH providers comprise multipractitioner puskesmas and typically single-practitioner MH providers, polindes/poskesdes, which are predominantly rural. Each puskesmas served a catchment population of approximately 38,000 and conducted approximately 131 deliveries per year, with a typical (median) staffing of two general practitioner doctors, four midwives, and one nurse. From the MH perspective, all puskesmas are expected to provide basic obstetric care;18 and a minimum of four puskesmas per district should be designated as providers of PONED. In this sample of puskesmas, 45 percent were specifically designated as puskesmas PONED.
Two-thirds of puskesmas were located in urban settings and, therefore, in rural areas, apart from public polindes/poskesdes, private MH providers play a significant role. Public MH providers are concentrated in the provinces in Kalimantan, Sulawesi, East Nusa Tenggara, West Nusa Tenggara, Maluku, Papua and West Papua.
Storyline: The typical private primary MH provider is a multiple-practitioner clinic or home-based practice, in an urban setting in Java, which conducts about four deliveries per month.
18 Ministry of Health Regulation Permenkes No.75/2014 on Community Health Center (Puskesmas)19 Private providers were randomly sampled from within the sampled priority districts.
Table 4.1 Types of Private Primary MH Providers
Provider Type19 Percentage of Private MH Providers
Single-practitioner MH provider, including home-based midwives 44%
Multiple-practitioner MH provider, including maternity clinics (klinik bersalin) 56%
Source Indonesia QSDS 2016.
31

MATERNAL HEALTH REPORT . 2017Revealing the Missing Link
Private MH providers complement public MH providers by extending out-of-hours access to primary MH services, but …
Table 4.2 Basic Staffing and Other Indicators for Primary MH Providers in the Sampled Priority Districts
IndicatorPublic Private
Puskesmas Polindes/Poskesdes
Single-practitioner Private Midwife
Multi-practitioner Maternity Clinic
Distribution of FacilitiesPercentage of primary MH facilities in sampled priority districts
3% 47% 22% 28%
Percentage of the facility type which is urban 65% 20% 49% 55%Percentage of the facility type which is rural 35% 80% 51% 45%
Human Resources of Health, Mean (Median)Doctor (Obstetrician) 0 (0) . . 0 (0) 0 (0)Doctor (General Practitioner) 2.4 (2) . . 0 (0) 0 (0)Midwife 5.6 (4) 0.5 (0) 1.0 (1) 2.6 (2)Village Midwife - 1.7 (2) - -Nurse 1.0 (1) 0 (0) 0 (0) 0 (0)
Utilization per Year20
Maternal Health Visits . . 289 320 733Deliveries 131 22 22 50
Catchment Population21 37,676 2,358 . . . .
Source Indonesia QSDS 2016.
Table 4.3 Temporal Accessibility of Primary MH Providers in the Sampled Priority Districts
Proportion of facilities open at the indicated time Puskesmas Polindes/Poskesdes Private MH Providers
Monday 10:30 100% 93% 43%Monday 20:30 35% 40% 61%Sunday 10:30 35% 36% 44%Open 24 hours a day, 7 days a week 34% 32% 35%
Source Indonesia QSDS 2016.
20 Average from 2013-15.21 Average from 2013-15.
Public MH facilities were almost always open during normal office hours–for example, 100 percent of puskesmas and 93 percent of polindes/poskesdes were open on Monday mornings. Very much fewer puskesmas were, however, open on a weekday evening (35 percent) or weekend daytime (35 percent). Private MH providers complemented these by extending access to primary MH services beyond normal office hours: almost two-thirds of private MH providers were open on a weekday evening and 44 percent were open during weekend daytimes. Approximately one-third of both private and public MH providers provided round-the-clock access.
32

… despite these complementarities, there remain supply-side gaps in the numerical density of maternal health providers that are not filled by private providers opportunistically, …
At a district-aggregated level, there is wide variation in the combined density of public and private primary MH providers (see Figure 4.2) per 10,000 head of population. There is no clear pattern of a ‘filling of gaps’, whereby private MH providers establish supply in areas where there is a lower density of public MH providers. Many districts with a low density of public MH providers, on the left of the diagram, also have a low density of private MH providers, as the distributions of private and public MH providers are not often complementary, leaving a substantial gap in supply not covered by either public or private MH providers, and a lack of choice for pregnant women.
As approximately one-fifth of all live births in Indonesia–equivalent to approximately 17,600 births per day (or 730 births per hour)–occur outside a health facility, this provides a crude metric of the gap in MH provision and demand nationally and the growth potential for MH providers, including private MH providers in particular. In 2016, 40 percent of births in Indonesia were conducted by private primary MH providers and a further 20 percent of births occurred outside a facility.22 Even if demand-side barriers were eliminated through targeted demand-side interventions and incentives, private MH providers would have a prominent role to play in Indonesia’s MH strategy. The scale is significant: for example, if all the current noninstitutional births were shifted to private primary MH providers, this would present a valuable market opportunity as it implies an increase in the current workload of private primary MH providers by about 50 percent. If these were shifted to puskesmas, where only 6 percent of deliveries are conducted, the equivalent increase in workload would be in the order of 350 percent.
22 Indonesia Family Life Survey 2015.
Figure 4.2 District-level Density of Public and Private Primary MH Providers
Source MoH 2015; Village Potential Census (PODES) 2011.
0
5
10
15
20
Faci
lity
ratio
per
10.
000
popu
latio
n
Public facilityPrivate facility
33

MATERNAL HEALTH REPORT . 2017Revealing the Missing Link
Based on discussions with private MH providers in Kabupaten Bandung, in 2017, there were various qualitative reasons provided for the low rates of empanelment. These include: (i) the parent network can deduct up to 10 percent of the fee for services provided by the network member; (ii) the paperwork involved in registering as a provider and in claiming fees is considered burdensome; (iii) there is a time lag between service provision and fee payment from the parent network; (iv) JKN MH service fees are lower in general than OOP fees; and (v) nonJKN member patients who seek care from the clinic are still plentiful. These reasons, particularly the claim that JKN fees are too low, are consistent with findings from other studies (Rajkotia et al. 2016). Due to the similarities with the pre-2014 Jampersal program, providers who were previously included under Jampersal found it easier to transition to JKN.
… with implications on access to and …
… and even where private MH providers are physically present, ‘coverage’ of these private MH providers under JKN is inadequate, …
Although all sampled private MH providers reported providing ANC and basic obstetric services, only one-third (37 percent) of private MH providers in the sampled priority districts were empaneled under BPJS, the administrator of JKN. Reasons for nonempanelment are varied and, on a quantitative basis (based on the Indonesia QSDS 2016) are summarized in Table 4.4. The most common reason, indicated by one-third of nonempaneled private primary MH providers, is that BPJS requirements were not met. A further 11 percent were not aware of the JKN partnership mechanism. These two reasons–which cover almost one-half of nonempaneled providers–suggest at possible remedies to improve empanelment such as increasing awareness of JKN among providers and considering initiatives to help providers meet BPJS requirements.
Table 4.4 Reasons for Not Empaneling with BPJS
Reasons given for not empaneling with BPJS Percentage of nonempaneled private primary MH providers
BPJS requirements not met 33%Not interested 24%Not aware of JKN partnership mechanism 11%The capitation amount is too small 8%Has proposed, but did not pass credentialing or evaluation step 5%Noncapitation claim is too small 3%Others 16%
Source Indonesia QSDS 2016.
34

The low proportion of empaneled private MH providers has implications both on demand and supply. On the demand side, financial access barriers would compound existing demand-side barriers such as educational or cultural barriers, as pregnant women utilizing private MH providers who are not empaneled under BPJS would have to pay OOP. If there are geographical localities where there is an inadequate supply of empaneled private or public MH providers, the effective coverage of JKN would be diminished, although there may be private providers who are not empaneled and depend on OOP payments. This is significant, as overall institutional delivery rates are below the 85 percent target. The inadequate ‘coverage’ of private providers into JKN is also mirrored by the limited breadth of population coverage of JKN, especially of the informal sector, with only 70 percent of the national population enrolled in this national scheme.
… the effectiveness of MH service provision.
On the supply side, the effectiveness of private MH provision could also be weakened as BPJS empanelment was associated with better service readiness, particularly for single-practitioner providers. In the sampled priority districts, among single-practitioner private MH providers, empaneled providers had a higher (76 percent) mean general service readiness index compared with nonempaneled (68 percent) providers (see also Table 4.5). In addition, the variation between the service readiness indices of empaneled private MH providers is also smaller.
Furthermore, even where private supply exists, the benefit of additional private MH providers to increase the overall supply of MH provision is blunted by the prevalence of dual practice.
As many as 55 percent of private MH midwives in the sampled priority districts reported dual practice in both the public and private sectors. A typical dual-practicing midwife works at a public facility (such as a puskesmas or polindes) in the mornings and would then shift to her private practice later in the day (see also Table 4.3). These dual-practicing midwives are not, therefore, an addition to the supply of MH providers, apart from by extending opening hours, as they are one and the same practitioner, but just operating under a different payment and institutional context, most plausibly to supplement their income.
In urban areas, however, the prevalence of dual practice is lower, at 46 percent. The capacity of the private sector to create additional supply is, therefore, slightly greater in urban settings.
35

MATERNAL HEALTH REPORT . 2017Revealing the Missing Link
Service Readiness of Private Maternal Health Providers in Sampled Priority Districts
In addition to providing context on the geographic density and distribution of private MH providers, and their coverage under JKN, this study also assessed the service readiness of MH providers as service units, based on WHO’s SARA framework. For maternal health services, this framework involves two service readiness domains: (i) general service readiness, and (ii) specific service readiness for antenatal care and basic obstetric care. Comprehensive obstetric care is not covered by this analysis due to the focus on private primary MH providers. In addition, these service readiness indicators can be categorized into basic amenities, equipment, standard infection precautions, diagnostics, and medicines.
The ‘hardware’ aspects of service readiness – e.g., infrastructure, equipment, and medicines – of private MH providers are sub-par compared with public puskesmas, …
Both multi-practitioner maternity clinics and single-practitioner private MH providers have lower service readiness indicators for general
Table 4.5 Maternal Health Service Readiness Indexes for Public and Private MH Providers in Sampled Priority Districts (2016)
Service Readiness Index23
Puskesmas Polindes/ Poskesdes
Private Multi-Practitioner Maternity Clinic (All)
Private Multi-Practitioner Maternity Clinic (Empaneled with BPJS only)
Private Single-practitioner MH Provider (All)
Single-practitioner Private MH Provider (Empaneled with BPJS only)
General Service Readiness 79% 57% 71% 74% 68% 76%
Basic Amenities 87% 52% 79% 86% 71% 71%Equipment 88% 64% 77% 81% 76% 88%Standard infection precautions 88% 68% 85% 91% 82% 88%
Diagnostics 61% 51% 60% 60% 62% 80%Medicines 72% 52% 52% 51% 48% 53%Antenatal Care 87% 64% 76% 78% 68% 79%Basic Obstetric Care 74% 57% 67% 70% 60% 66%
Source Indonesia QSDS 2016.
23 An index of 0 (or 0 percent) implies that all facilities had none of the service readiness indicators (unweighted) met; while an index of 1 (or 100 percent) implies that all facilities met all the service readiness.
36

service readiness, antenatal care, and basic obstetric care, compared with puskesmas (Table 4.5). The weakness in private MH provider readiness is also noted in some subcategories of service readiness indicators–that is, basic amenities, equipment, and standard infection precautions–and is particularly stark for medicines, as discussed later. As mentioned earlier, private providers empaneled with BPJS are associated with slightly stronger service readiness.
WHO SARA indicators do not specifically capture elements of responsiveness (or service quality) which may be important to the user, such as comfortable surroundings, air conditioning, provider choice, or waiting times. Private MH providers may perform better in terms of responsiveness but these are not expected to affect MH outcomes, although access may be more favorable in a more responsive environment.
… especially single-practitioner private MH providers, …
Understandably, multi-practitioner private maternity clinics have stronger service readiness than single-practitioner private MH providers, as the larger providers can pool investments to strengthen service delivery. This pattern holds for general service readiness and specific service readiness for ANC and basic obstetric care, and may have important implications for strategies to improve the service readiness of private MH providers, especially in urban areas. With the exception of medicines, single-practitioner private MH providers are, however, clearly much more service ready than public polindes/poskesdes, even when only including those that purport to provide basic obstetric services.
… with two important differences: (i) There are specific yet critical deficiencies in medicines, especially emergency medicines; and …
There are stark deficiencies in the general availability of MH medicines among private MH providers compared with public puskesmas. The service readiness index for medicines is 72 percent at puskesmas, but only 52 percent at private multi-practitioner maternity clinics and 48 percent at private single-practitioner MH providers (Table 4.5). This large gap could be because readiness indicators include many different medicine types but private MH providers could perhaps be focusing on just a few commonly used drugs.
This limited repertoire of medicines is a concern as there is a specific lack of availability of emergency obstetric medicines. For example, intravenous magnesium sulphate (IV MgSO4) is the drug of choice for the treatment of preeclampsia/eclampsia, which is the second most common cause of maternal mortality in Indonesia after maternal hemorrhage, and is advised for use in national clinical guidelines. Only 55 percent of single-practitioner private MH providers had this medicine available, compared with 74 percent for puskesmas (Figure 4.3), and 61 percent at multi-practitioner private MH providers. Intravenous diazepam, an alternative but inferior treatment for eclampsia, is not even permitted in private primary facilities as it is a controlled drug.
Availability of oxytocin is comparable across public and private MH providers, and available in approximately nine-tenths of facilities. Injectable ergometrine, which is used for some causes of postpartum hemorrhage, the most common cause of maternal mortality is, however, much less available in private MH providers (55 percent at single-practitioner and 64 percent at multi-practitioner providers) compared with puskesmas (82 percent). A similar relative and absolute deficiency is noted for intravenous calcium gluconate.
Emergency medicines such as IV MgSO4 are rarely used as the situations which warrant their use are uncommon. From a business perspective, therefore, it may be unprofitable to obtain and maintain (including replacing expired stock) these medicines. When needed, these medicines can, however, be lifesaving and alternative treatments far inferior. Institutional deliveries are not adequate if the effectiveness of the institution is limited by nonavailability of emergency medicines.
37

MATERNAL HEALTH REPORT . 2017Revealing the Missing Link
(ii) there is greater variability in service readiness among private MH providers, compared with puskesmas, particularly for nonempaneled providers.
Not only do private MH providers compare unfavorably to public MH providers, there is greater variability among private MH providers, even if just single-practitioner private midwives are analyzed separately from multi-practitioner private maternity clinics (Table 4.6). The standard deviation of service readiness indexes for puskesmas for ANC is 12 percentage points, compared with 22 percent for single-practitioner private midwives. This means that there is a significant tail of poorly performing private MH providers compared with puskesmas, which may not have been appreciated by just a comparison of mean service readiness indexes alone.
For example, more than one-half (52 percent) of single-practitioner private MH providers have an ANC service readiness index of 75 percent and below, compared with less than one-sixth (16percent) of puskesmas. In other words, five-sixths of puskesmas have a service readiness index above
75 percent. In fact, 31 percent of puskesmas meet all the ANC service readiness indicators compared with just 4 percent for single-practitioner private MH providers. This tail of poor performance among private MH providers is starker for basic obstetric care: 81 percent of single-practitioner private MH providers have a service readiness index of 75 percent or less; but for puskesmas 63 percent have a service readiness index above 75 percent.
Importantly, from a policy perspective, both the variability and the ‘tail’ of poorly performing private MH providers is reduced very substantially for empaneled private MH providers. This provides very strong justification for accreditation, although the underperforming tail can still be much reduced.
Both private and public MH providers share an overall weakness in service readiness, in absolute terms, …
The indicators used in this analysis are normative indicators from WHO’s SARA framework and national guidelines. Regarding the latter, MoH Decree No. 43/2016 describes the Minimum Service Standards
Figure 4.3 Availability of Emergency Obstetric Drugs in Sampled Priority Districts
Source Indonesia QSDS 2016.
5686
4316
8190
7549
5488
5729
6794
6823
Percentage
Polindes
Puskesmas
Private MH-Single provider
Private MH-Multiple provider
Emergency Medicines by Type of Facility
Calcium Gluconate
MgSO4
Oxytocin
Inj Ergometrine
38
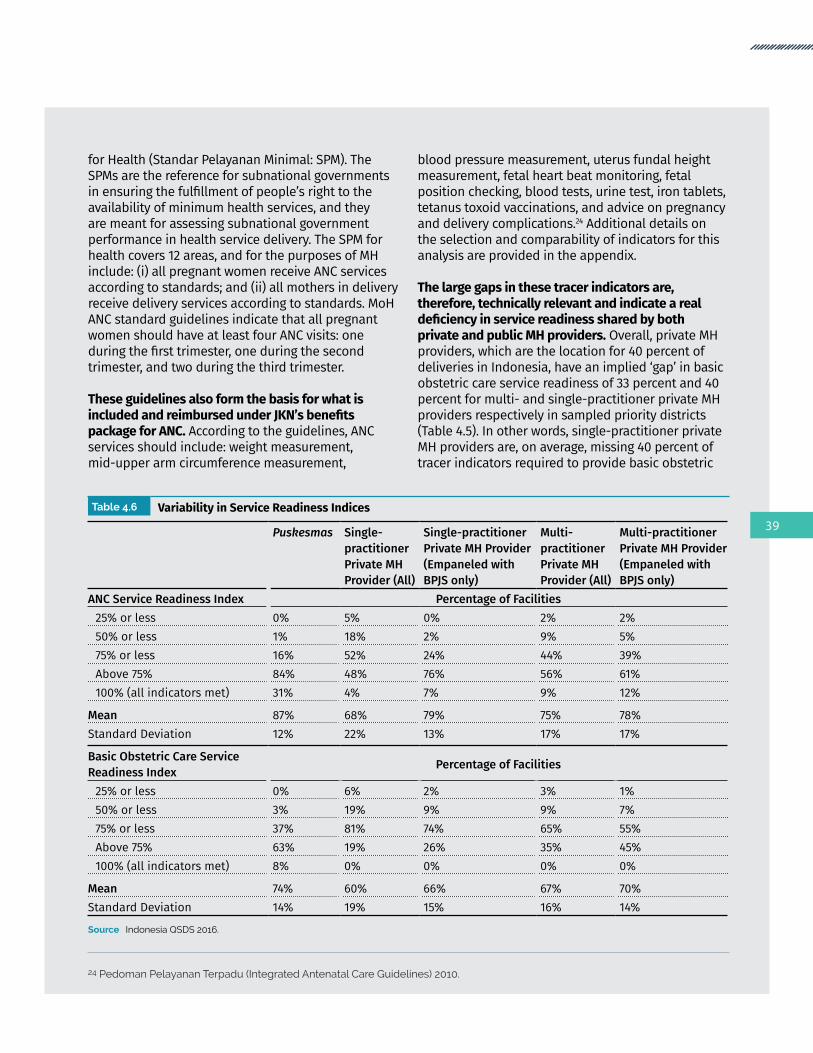
for Health (Standar Pelayanan Minimal: SPM). The SPMs are the reference for subnational governments in ensuring the fulfillment of people’s right to the availability of minimum health services, and they are meant for assessing subnational government performance in health service delivery. The SPM for health covers 12 areas, and for the purposes of MH include: (i) all pregnant women receive ANC services according to standards; and (ii) all mothers in delivery receive delivery services according to standards. MoH ANC standard guidelines indicate that all pregnant women should have at least four ANC visits: one during the first trimester, one during the second trimester, and two during the third trimester.
These guidelines also form the basis for what is included and reimbursed under JKN’s benefits package for ANC. According to the guidelines, ANC services should include: weight measurement, mid-upper arm circumference measurement,
blood pressure measurement, uterus fundal height measurement, fetal heart beat monitoring, fetal position checking, blood tests, urine test, iron tablets, tetanus toxoid vaccinations, and advice on pregnancy and delivery complications.24 Additional details on the selection and comparability of indicators for this analysis are provided in the appendix.
The large gaps in these tracer indicators are, therefore, technically relevant and indicate a real deficiency in service readiness shared by both private and public MH providers. Overall, private MH providers, which are the location for 40 percent of deliveries in Indonesia, have an implied ‘gap’ in basic obstetric care service readiness of 33 percent and 40 percent for multi- and single-practitioner private MH providers respectively in sampled priority districts (Table 4.5). In other words, single-practitioner private MH providers are, on average, missing 40 percent of tracer indicators required to provide basic obstetric
Table 4.6 Variability in Service Readiness Indices
Puskesmas Single-practitioner Private MH Provider (All)
Single-practitioner Private MH Provider (Empaneled with BPJS only)
Multi-practitioner Private MH Provider (All)
Multi-practitioner Private MH Provider (Empaneled with BPJS only)
ANC Service Readiness Index Percentage of Facilities25% or less 0% 5% 0% 2% 2%50% or less 1% 18% 2% 9% 5%75% or less 16% 52% 24% 44% 39%Above 75% 84% 48% 76% 56% 61%100% (all indicators met) 31% 4% 7% 9% 12%
Mean 87% 68% 79% 75% 78%Standard Deviation 12% 22% 13% 17% 17%
Basic Obstetric Care Service Readiness Index Percentage of Facilities
25% or less 0% 6% 2% 3% 1%50% or less 3% 19% 9% 9% 7%75% or less 37% 81% 74% 65% 55%Above 75% 63% 19% 26% 35% 45%100% (all indicators met) 8% 0% 0% 0% 0%
Mean 74% 60% 66% 67% 70%Standard Deviation 14% 19% 15% 16% 14%
Source Indonesia QSDS 2016.
24 Pedoman Pelayanan Terpadu (Integrated Antenatal Care Guidelines) 2010.
39

MATERNAL HEALTH REPORT . 2017Revealing the Missing Link
Table 4.7 General Service Availability (Basic Amenities)
Type of Facility Electricity Water Consultation Room with Auditory Privacy
Sanitation Access to Computer with Internet Access
Public: Puskesmas 100% 96% 50% 100% 95% Puskesmas-urban 100% 99% 53% 100% 98% Puskesmas-rural 100% 90% 46% 100% 89%Public: Polindes 96% 65% 44% 89% 3%Private: Single provider 100% 91% 51% 99% 12% Single provider-urban 100% 94% 53% 100% 11% Single provider-rural 100% 89% 49% 97% 13%Private: Multiple provider 100% 95% 71% 99% 24% Multiple provider-urban 100% 98% 69% 100% 17% Multiple provider-rural 100% 92% 73% 97% 32%
Source Indonesia QSDS 2016.
Figure 4.4 Communications and Emergency Transportation Service Readiness Indicators (by Type of Facility)
Source Indonesia QSDS 2016Note Communications can include mobile telephones and wired telephones (‘landlines’).
36
30
90
79
53
93
74
91
Percentage
Polindes
Puskesmas
Private MH-Single provider
Private MH-Multiple provider
Communication
Emergency Transportation
care. Service readiness for ANC is generally stronger than for basic obstetric care, reflecting the greater complexity and investments required to adequately provide this service, but there is still a notable gap of between 24 to 32 percent for private MH providers (Table 4.5). The opportunity to improve service readiness is, therefore, very significant for both public and private MH providers.
… especially regarding (i) capacity to manage emergency referrals; and …
40
General Service Readiness at Private and Public MH ProvidersGeneral service readiness includes basic amenities such as electricity, water, sanitation, facilities, and referral infrastructure. Although the availability of electricity, water and sanitation are high (generally above 90 percent) (Table 4.7), there is notably weak capacity to conduct emergency referrals (Figure 4.4). Primary MH providers are, at best, only expected to be able to provide basic obstetric care, but not comprehensive obstetric care (which includes cesarean sections). Some obstetric complications can be predicted in advance–for example, placenta previa–but many may not be anticipated and develop in an emergent manner. The timely conduct of emergency referrals to such comprehensive obstetric care centers can, therefore, often be lifesaving, especially if initial emergency treatment has already been instituted.
Unfortunately, both public and private primary MH providers have weak referral capacity. Only 53 and 74 percent of single- and multi-practitioner private MH providers, which collectively are responsible for 40 percent of all deliveries in Indonesia,25 had emergency transportation available. Regarding public MH providers, only 90 percent of puskesmas had emergency transportation available. Puskesmas in the sampled priority districts comprise PONED (32 percent) and nonPONED (68 percent) puskesmas. Polindes/poskesdes had extremely low availability (36 percent) of emergency transportation.
Apart from the deficiency in emergency transportation, there were also deficiencies in other WHO SARA general service readiness indicators (Table 4.7). These include: (i) a room with auditory privacy, required for consultations (only 51 percent of single-practitioner private MH providers); (ii) access to computer with Internet access (only 12 percent of single-practitioner private MH providers); and (iii) notably, water (only 89 percent of single-practitioner private MH providers in rural areas have a water supply).
(ii) ‘commodities’ like medicines and diagnostics of particular relevance for ANC services; and
ANC Services at Private and Public MH ProvidersRegarding ANC, specific service readiness indicators for reusable equipment such as blood pressure sets and weighing scales at private MH providers are high (Figure 4.5). There is, however, a pattern of deficiencies related to diagnostics–hemoglobin (56 percent) and urine protein (50 percent). During the antenatal period, these diagnostic tests should be used to identify potential risks and complications related to two causes of maternal deaths–postpartum hemorrhage and preeclampsia/eclampsia. The weak availability of tetanus toxoid vaccines is also a concern.
This deficiency in ‘commodities’–that is, health products that get used up and expire (such as diagnostics and medicines)–is a pattern also noted, but to a lesser degree, among public MH providers in this study and in other earlier studies of public sector readiness of health facilities in Indonesia (World Bank 2014a), even though the financing mechanism for purchasing these commodities differs by sector. In the public sector, commodities would typically be covered by operational rather than capital expenditures. In the private sector, these can be purchased using fees paid OOP or health financing scheme reimbursements or capitation payments.
(iii) the provision of basic obstetric care.
25 Deliveries with private MH providers account for 34 percent of all deliveries in rural areas (of which 65 percent are institutional deliveries) and 46 percent in urban areas (90 percent).
41
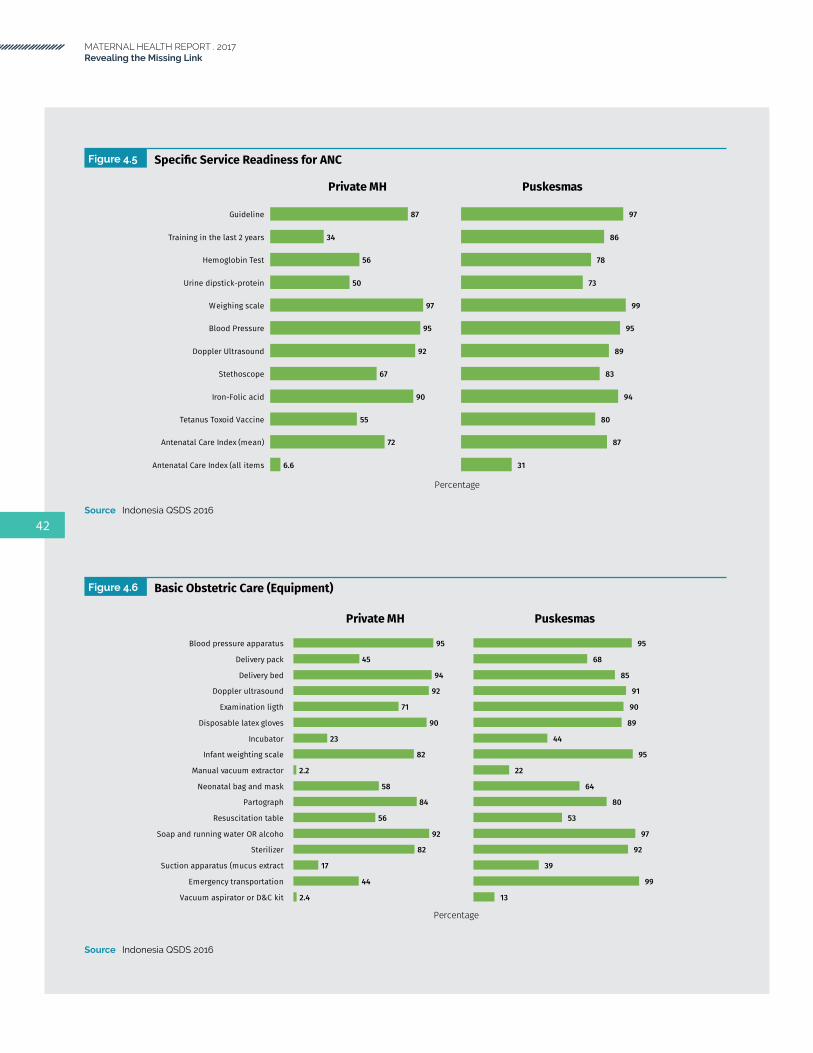
MATERNAL HEALTH REPORT . 2017Revealing the Missing Link
Figure 4.6 Basic Obstetric Care (Equipment)
Source Indonesia QSDS 2016
2.4
44
17
82
92
56
84
58
2.2
82
23
90
71
92
94
45
95
Percentage
Vacuum aspirator or D&C kit
Emergency transportation
Suction apparatus (mucus extract
Sterilizer
Soap and running water OR alcoho
Resuscitation table
Partograph
Neonatal bag and mask
Manual vacuum extractor
Infant weighting scale
Incubator
Disposable latex gloves
Examination ligth
Doppler ultrasound
Delivery bed
Delivery pack
Blood pressure apparatus
Private MH
13
99
39
92
97
53
80
64
22
95
44
89
90
91
85
68
95
Puskesmas
Figure 4.5 Specific Service Readiness for ANC
Source Indonesia QSDS 2016
6.6
72
55
90
67
92
95
97
50
56
34
87
Percentage
Antenatal Care Index (all items
Antenatal Care Index (mean)
Tetanus Toxoid Vaccine
Iron-Folic acid
Stethoscope
Doppler Ultrasound
Blood Pressure
Weighing scale
Urine dipstick-protein
Hemoglobin Test
Training in the last 2 years
Guideline
Private MH
31
87
80
94
83
89
95
99
73
78
86
97
Puskesmas
42

Figure 4.7 Basic Obstetric Care (Medicines)
Source Indonesia QSDS 2016Note Medicine not applicable for private MH providers: Adrenalin (injection); Diazepam; injectable antibiotics; Metronidazole; oral ergometrine
Basic Obstetric Care at Private and Public MH ProvidersSpecific service readiness indicators for basic obstetric care are also deficient for both public and private MH providers. Regarding equipment, although manual vacuum extractors (for instrumental deliveries) may not be needed by all facilities, and indeed availability of this equipment is very low (Figure 4.6), delivery packs, incubators, neonatal bag and masks, and resuscitation tables are commonly needed but are worryingly deficient at both private and public MH providers. There is decent availability of blood pressure apparatus, delivery beds, doppler ultrasound, and partographs. As with ANC, service readiness indicators for commodities–in the case of basic obstetric care, this pertains more to medicines than diagnostics–is also particularly deficient compared with equipment for both public and private MH providers, but also relatively deficient for private MH providers compared with public MH providers (Figure 4.7).
There may have been improvements–the availability of oxytocin at puskesmas was 36 percent, based on the nationally representative Rifaskes 2011 survey, but was 88 percent in this latest 2016 survey. Oxytocin is commonly used–for example, for active management of the third stage of labor–and, therefore, improvement in its availability is significant. Nevertheless, the availability of oxytocin is a notable contrast with that of emergency obstetric drugs that, although lifesaving, are used much less frequently when serious complications arise. An example of the latter is IV MgSO4 and IV calcium gluconate (as discussed earlier). From a policy perspective, it is important that all relevant emergency obstetric drugs are available as per national standards.
Although causation cannot be simplistically ascribed, it is notable that the availability of oxytocin as the specific treatment of postpartum hemorrhage (PPH), the main cause of maternal death, appears to have improved dramatically over time. On the other hand, IV MgSO4, the treatment of choice for preeclampsia/eclampsia, the second cause of maternal death, is not widely available.
75
92
87
58
93
60
85
51
25
73
80
76
Percentage
Vitamin K (injection)
Skin disinfectant
Oxytocin(injectable)
Oral Ergometrine
Metronidazole infusion
Magnesium sulphate Injectables
Intravenous solution(normal) sal
Ergometrine(Injectable)
Injectables antibiotics
Antibiotics Eye ointment
Diazepam(Inejectable)
Dexamethasone (Injectables)
Calcium gluconate(Injectable)
Oral antihypertensive drugs
Oral analgesics
Oral antibiotics
Adrenalin (Injectable)
Private MH Providers
93
94
88
82
42
74
98
82
43
90
66
72
43
81
93
95
69
Puskesmas
43

MATERNAL HEALTH REPORT . 2017Revealing the Missing Link
Portents for Polindes and Poskesdes Box 4.1
Although not the focus of this study, comparative data was collected on polindes/poskesdes to contextualize private MH providers. Polindes/poskesdes are public primary MH facilities that serve rural communities. Among polindes/poskesdes in sampled priority districts, 22 percent were polindes and 78 percent were poskesdes. In contrast to polindes which are limited to MH, poskesdes provide promotive, preventive and curative services within the authority of the health provider (midwife, nurse, and so forth) placed in the poskesdes.
This study finds that, even among polindes/poskesdes that purport to provide such basic obstetric care, their service readiness is so weak that a delivery at a typical polindes/poskesdes cannot be meaningfully considered an institutional birth, in terms of the level of complications that can be managed. One-third of polindes/poskesdes do not even have a water supply and, therefore, a birth at a polindes/poskesdes may not be much different from a home birth attended by a skilled birth attendant. Referral capacity is also very weak, with only 36 percent having emergency transportation and 30 percent communications systems (Figure 4.4).
Polindes/poskesdes do, however, attain a relatively significant number of specific service readiness indicators for ANC and, therefore, still have an MH role (Figure 4.8).
Figure 4.8 Service Readiness Indicators at Polindes/Poskesdes
Source Indonesia QSDS 2016
96
89
65
49
54
83
88
iron tablet
urine protein test
sanitation
oxytocin injection
hemoglobin test
water
electricity
Although not the specific focus of this study, public polindes/poskesdes have particularly weak service delivery.
Laudably, conditional on the presence of a facility, urban-rural disparities in service readiness are small amongst either the private or public sector, with most rural facilities more ‘ready’ to provide MH services than their urban counterpart.
44
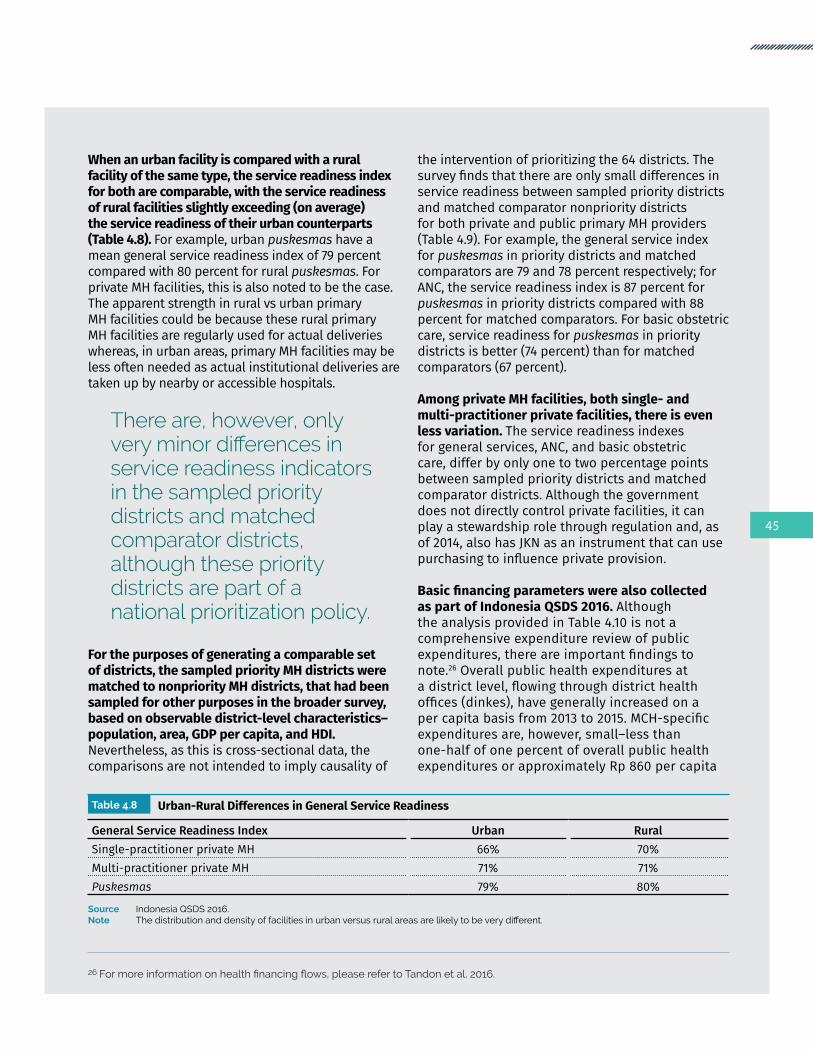
When an urban facility is compared with a rural facility of the same type, the service readiness index for both are comparable, with the service readiness of rural facilities slightly exceeding (on average) the service readiness of their urban counterparts (Table 4.8). For example, urban puskesmas have a mean general service readiness index of 79 percent compared with 80 percent for rural puskesmas. For private MH facilities, this is also noted to be the case. The apparent strength in rural vs urban primary MH facilities could be because these rural primary MH facilities are regularly used for actual deliveries whereas, in urban areas, primary MH facilities may be less often needed as actual institutional deliveries are taken up by nearby or accessible hospitals.
There are, however, only very minor differences in service readiness indicators in the sampled priority districts and matched comparator districts, although these priority districts are part of a national prioritization policy.
For the purposes of generating a comparable set of districts, the sampled priority MH districts were matched to nonpriority MH districts, that had been sampled for other purposes in the broader survey, based on observable district-level characteristics–population, area, GDP per capita, and HDI. Nevertheless, as this is cross-sectional data, the comparisons are not intended to imply causality of
the intervention of prioritizing the 64 districts. The survey finds that there are only small differences in service readiness between sampled priority districts and matched comparator nonpriority districts for both private and public primary MH providers (Table 4.9). For example, the general service index for puskesmas in priority districts and matched comparators are 79 and 78 percent respectively; for ANC, the service readiness index is 87 percent for puskesmas in priority districts compared with 88 percent for matched comparators. For basic obstetric care, service readiness for puskesmas in priority districts is better (74 percent) than for matched comparators (67 percent).
Among private MH facilities, both single- and multi-practitioner private facilities, there is even less variation. The service readiness indexes for general services, ANC, and basic obstetric care, differ by only one to two percentage points between sampled priority districts and matched comparator districts. Although the government does not directly control private facilities, it can play a stewardship role through regulation and, as of 2014, also has JKN as an instrument that can use purchasing to influence private provision.
Basic financing parameters were also collected as part of Indonesia QSDS 2016. Although the analysis provided in Table 4.10 is not a comprehensive expenditure review of public expenditures, there are important findings to note.26 Overall public health expenditures at a district level, flowing through district health offices (dinkes), have generally increased on a per capita basis from 2013 to 2015. MCH-specific expenditures are, however, small–less than one-half of one percent of overall public health expenditures or approximately Rp 860 per capita
26Formoreinformationonhealthfinancingflows,pleaserefertoTandonetal.2016.
Table 4.8 Urban-Rural Differences in General Service Readiness
General Service Readiness Index Urban RuralSingle-practitioner private MH 66% 70%Multi-practitioner private MH 71% 71%Puskesmas 79% 80%
Source Indonesia QSDS 2016.Note Thedistributionanddensityoffacilitiesinurbanversusruralareasarelikelytobeverydifferent.
45

MATERNAL HEALTH REPORT . 2017Revealing the Missing Link
(women within the reproductive age and children). Expenditures reaching puskesmas have increased from approximately Rp 9,000 to nearly Rp 37,000 during the same period.
As a national (but not necessarily subnational) priority, the MoH has identified these 64 priority MH districts for targeted efforts at reducing MMR. At the central level, this prioritization includes ensuring that these districts are prioritized for centrally purchased items and to encourage development partners to concentrate efforts on
these districts. The fiscal decentralization policy (that is, a reduction in the APBN deconcentration fund) has, however, meant that MoH has less ability to intervene directly on funding noncapital expenditures, such as activities to develop human resource capacity. There are, therefore, no specific interventions, programs, or funding tied to the 64 high-priority MH districts and, as a result, this remains policy just on paper with no apparent effects on financing at the local level nor on service readiness.
Table 4.10 District Health Office (Dinkes) Expenditures in Sampled Priority Districts (2013-15)
Median for Sampled Priority Districts (available data only) 2013 2014 2015
Total DHO Expenditure per capita (IDR) 59,486 92,977 143,137DHO Expenditure on MCH Program per capita27 (IDR) 330 598 860DHO Expenditure on MCH Program (percent of total) 0.5% 0.4% 0.3%DHO Expenditures on Puskesmas per capita (IDR) 9,238 24,092 36,888
Source Indonesia QSDS 2016.
Table 4.9 Mean Service Readiness Indicators for Sampled Priority Districts, Matched Comparator Districts, and Nationally Representative Districts
Service Readiness Indicators Sampled Priority Districts Matched Comparator Districts
Nationally Representative Districts
General Service ReadinessSingle-practitioner private MH 68% 66% ..Multi-practitioner private MH 71% 70% ..Puskesmas 79% 78% 77%Polindes/Poskesdes 57% 46% ..
ANC Single-practitioner private MH 68% 68% ..Multi-practitioner private MH 75% 77% ..Puskesmas 87% 88% 88%Polindes/Poskesdes 64% 49% ..
Basic Obstetric CareSingle-practitioner private MH 60% 58% ..Multi-practitioner private MH 67% 68% ..Puskesmas 74% 67% 72%Polindes/Poskesdes 57% 44% ..
Source Indonesia QSDS 2016.
27 In this context, the per capita denominator is women within the reproductive age and children.
46

Private Maternal Health Provider Training and Ability in Sampled Priority Districts
Critically, for both the private and public sector, although there are challenges in the ‘hardware’ service readiness indicators, there are major weaknesses in the ‘software’ aspects of the supply side, with concerns over private MH providers regarding (i) health worker training and the low availability of clinical guidelines; and
Although 93 percent of puskesmas had any staff trained in basic obstetric care in the last two years, only 42 percent of single-practitioner private MH providers and 71 percent of multi-practitioner private maternity clinics had staff receiving such training (Table 4.11). The earlier findings that 55 percent of private MH providers are dual practicing in both sectors should also be noted. For ANC, a similar discrepancy emerges between public and private, as only 27 percent of single-practitioner private MH providers had received ANC training compared with 86 percent for puskesmas.
BPJS empanelment among private MH providers is associated with a greater likelihood of trained staff, but urban-rural differences in availability of trained staff are surprisingly small. There were no notable differences between urban and rural puskesmas regarding training on basic obstetric care (93 percent in each case), and only a 6-percentage point difference for urban and rural single-practitioner private MH provider.
Table 4.11 Clinical Guidelines and Health Worker Training (Basic Obstetric Care)
Facility Type Clinical Guidelines for Obstetrics
Training for Basic Obstetric Care in the Last 2 Years
Puskesmas 65% 93% Puskesmas-urban 67% 93% Puskesmas-rural 63% 93%Polindes/Poskesdes 27% 61%Private MH-Single provider 41% 42% Private MH-Single provider-urban 46% 39% Private MH-Single provider-rural 35% 45%Private MH-Multiple provider 41% 71%Private MH facilities empaneled with BPJS 44% 83%Private MH facilities not empaneled with BPJS 38% 62%Sampled Priority Districts 37% 60%
Source Indonesia QSDS 2016.
47

MATERNAL HEALTH REPORT . 2017Revealing the Missing Link
Regarding the availability of clinical guidelines, less than one-half of private MH providers had basic obstetric care clinical guidelines available, compared with around two-thirds for puskesmas. Both training and clinical guidelines are increasingly important, given the shift from SBA to institutional deliveries–as facilities are expected to be able to manage less common but more serious life-threatening conditions. More critical than the availability of guidelines and recent exposure to training, however, is actual provider ability, as described in the following section.
ii) Similarly low levels of provider ability, among both private and public providers, to provide comprehensive ANC visit assessments and …
Provider ability is a critical aspect of supply-side readiness and availability. The survey included two
clinical vignettes that were posed to health workers (that is, doctors and midwives) to assess provider ability. The first clinical vignette describes a routine ANC visit and reports on the clinical questions (‘history taking’), examination, and investigations mentioned by the health worker (Table 4.12). The second clinical vignette describes an obstetric emergency (PPH) and reports on the emergency management of such a patient as mentioned by the health worker (Table 4.13). Both clinical vignettes also include a few closed questions on specific aspects of MH clinical knowledge. These clinical vignettes were presented as a clinical case read out by the enumerator.
During the routine ANC visit clinical vignette, private midwives frequently missed asking basic and routine questions on the past obstetric history of the pregnant woman.28 For example, only 21 percent asked about the number of previous pregnancies, 19 percent asked about complications during previous labor, and only 55 percent asked about the mode of delivery for the last child. Questions on past medical history were also frequently missed–only 23 percent, for example, asked whether the pregnant woman had diabetes. Questions related to the social circumstances of the pregnant woman were also infrequently asked–only 7 percent asked about whom the pregnant woman lives with and only 15 percent asked about family circumstances (Table 4.12).
Measuring blood pressure was very commonly mentioned by 83 percent of private midwives, but only 61 percent mentioned measuring fundal height. Similarly, a hemoglobin test was mentioned by 88 percent of private midwives, but fewer (around 66 percent), mentioned testing urine for protein routinely. Iron and folic acid supplements were mentioned by 80 percent of private midwives as management steps for the pregnant woman, but only 18 percent mentioned they would provide advice on danger signs during pregnancy.
Importantly, given that preeclampsia and eclampsia are significant contributors to maternal mortality, only 13 percent of private midwives asked about hypertension during the past pregnancy, and only 3 percent asked specifically about preeclampsia or eclampsia. When posed with a specific question, however, on the single most
28 This was also the case with public midwives and doctors
48

Table 4.12 General Service Availability (Basic Amenities)
Question / action should do PuskesmasDoctor
PuskesmasMidwife
Poskesdes / Polindes
Private Midwife
ANC history takingHow was the last child delivered? 72% 59% 60% 55%Number of prior pregnancies 21% 22% 14% 21%History of exclusive breastfeeding? 0% 4% 1% 1%TT received in past pregnancies? 12% 9% 16% 9%Medical history 41% 46% 37% 32%Any history of diabetes? 30% 26% 20% 23%Any hypertension in previous pregancies? 24% 7% 10% 13%History of pre-eclampsia/eclampsia 0% 0% 2% 3%Social history 3% 9% 9% 5%Any question on family 18% 19% 22% 15%Who are you living with? 11% 16% 10% 7%Any complication previous labor 22% 17% 18% 19%
ANC examinationBlood pressure 73% 79% 86% 83%Abdomen examination 9% 8% 9% 10%Fundal height 72% 61% 68% 61%Leopold II 39% 44% 31% 28%Leopold III 33% 33% 19% 19%Leopold IV 33% 32% 19% 19%
ANC TestHemoglobin 78% 89% 91% 88%Urine dipstick for glucose 11% 17% 10% 9%Urine dipstick for protein 73% 47% 49% 66%HIV test 28% 34% 21% 22%
ANC ManagementIron/folic acid supplements 95% 86% 93% 80%Tetanus toxoid 4% 6% 7% 6%Advice on danger signs during pregnancy 23% 15% 12% 18%Advice on disease symptoms 0% 0% 0% 3%Suggest routine ANC 86% 71% 66% 57%
PIH scenarioWill test urine protein 89% 89% 79% 90%
Source Indonesia QSDS 2016.Note Preliminary sample weighted applied
49

MATERNAL HEALTH REPORT . 2017Revealing the Missing Link
important test to order if faced with a pregnant woman at 37 weeks of gestation with new onset of hypertension, 90 percent responded correctly that they would check for protein in the urine. There were notably few differences between the ability of puskesmas midwives and private midwives on the ANC clinical vignette, which is perhaps unsurprising given the prevalence of dual practice.
… to manage life-threatening obstetric emergencies.
During the PPH clinical vignette, health workers were asked about their clinical management steps within the first 30 minutes after the onset of PPH and, separately, their clinical management steps after the first 30 minutes (Table 4.13). It assumed that they were in a fully equipped and stocked primary maternal care facility one hour away from the nearest hospital. Within the first 30 minutes, only 29 percent of private midwives would administer intravenous (IV) fluids and only 19 percent would administer it rapidly. One of the simplest and effective forms of initial treatment, which does not require equipment or drugs, is uterine massage, which was suggested by only 9 percent. Very few would examine for specific sources of bleeding from the cervix or uterus (3 percent in each instance).
Within the first 30 mins, 44 percent of private midwives mentioned they would refer the patient to the hospital. After the initial 30 minutes from the onset of PPH, 74 percent of private midwives mentioned they would refer the patient to the hospital if the bleeding continued. The diagnosis of PPH was mentioned by 32 percent of private midwives–with 38 percent specifying the cause as uterine atony and 59 percent specifying the cause as a retained placenta. In addition to this PPH clinical vignette, private midwives were asked a specific question on the contraindications (that is, when the medication should not be given) of ergometrine. Only 68 percent correctly mentioned hypertension, and very few specifically mentioned preeclampsia (3 percent) or eclampsia (1 percent).
Similar clinical vignettes were also posed to public midwives and doctors. Generally, the performance of public and private midwives on these clinical
vignettes were similar–with a slight difference being that public midwives were more likely (77 and 88 percent for puskesmas and polindes/poskesdes midwives respectively) to suggest a referral to hospital if the pregnant woman with PPH was still bleeding after 30 minutes, compared with private midwives (74 percent).
Compared with public doctors, midwives (both public and private) performed better in the management of PPH. Public doctors were less likely to mention administering oxytocin (30 percent) or ergometrine (16 percent) in the first 30 mins. Worryingly, only 47 percent of public doctors mentioned hypertension as a contraindication for ergometrine. The differences in performance could be related to a lack of experience, as only 46 percent of responding public doctors had managed a similar case before, compared with between 64 and 79 percent for midwives.
There were also weaknesses in the types of ANC services provided by private MH providers, particularly with blood and urine tests, although they were more likely to counsel on the need for institutional deliveries, and …
Indonesia QSDS 2016 included a patient exit survey containing interviews of patients who received health services at facilities in DKI Jakarta (not representative of the 64 high-priority districts). An exit survey is valuable because it is an important factor in the assessment of health care performance (Bleich, Ozaltin, and Murray 2009; Xesfingi and Vozikis 2016; Black and Kowal 2016). For MH care, in particular, only patients who received ANC services were interviewed. The exit survey was conducted only in DKI Jakarta (except in Kabupaten Kepulauan Seribu district) and the health facilities included were puskesmas and private maternity clinics/midwives.
50

Table 4.13 Vignette Tracer Indicator for Obstetric with PPH Indication
Question / action should do PuskesmasDoctor
PuskesmasMidwife
Poskesdes / Polindes
Private Midwife
First 30 minutesAdminister IV fluids 36% 21% 23% 29%Rapid IV fluids 13% 14% 18% 19%Check symptoms of shock 10% 0% 0% 0%Check contractions 2% 2% 5% 4%Oxytocin 30% 43% 42% 42%Ergometrine 16% 17% 19% 20%Uterine massage 11% 11% 12% 9%Bimanual uterine compression 12% 22% 12% 13%External aortic compression 0% 14% 7% 5%Refers to hospital 41% 47% 43% 44%Look for bleeding from cervix 2% 3% 3% 3%Look for bleeding from uterus 2% 2% 1% 3%Insert IV line 64% 65% 66% 52%
Next 30 minutesAdminister IV fluids 2% 20% 5% 11%Rapid IV fluids 3% 4% 5% 6%Check symptoms of shock 1% 0% 0% 0%Check contractions 2% 2% 2% 2%Oxytocin 7% 15% 9% 10%Ergometrine 6% 10% 4% 5%Uterine massage 9% 5% 7% 8%Apply bimanual uterine compression 12% 22% 18% 22%Apply external aortic compression 0% 12% 9% 10%Look for bleeding from cervix 0% 0% 0% 0%Look for bleeding from uterus 0% 0% 1% 0%Insert IV line 19% 26% 24% 26%Refers to hospital 80% 77% 88% 74%
DiagnosisPPH 52% 56% 41% 32%Uterine atony 44% 25% 21% 38%Retained placenta 64% 52% 67% 59%
Contraindications of ergometrineHypertension 47% 75% 61% 68%Pre-eclampsia 8% 4% 3% 3%Eclampsia 8% 4% 4% 1%Heart disease 7% 12% 5% 4%Allergic to ergometrine 3% 3% 2% 3%Twin pregnancy 1% 4% 0% 0%
OthersHave you managed a similar case? 46% 79% 64% 66%Correct route to administer oxytocin 90% 93% 98% 98%
Source Indonesia QSDS 2016.Note Preliminary sample weighted applied
51

MATERNAL HEALTH REPORT . 2017Revealing the Missing Link
The process started with a health worker being interviewed in each facility–a list of patients serviced by the health worker was then generated and, from this list, the patients to be interviewed for the exit survey were randomly selected. For puskesmas, two out of four randomly selected patients were pregnant women who came for ANC. Two patients were selected for private maternity clinics/midwives. Around one-third of the 503 interviewed pregnant women were patients of private maternity clinics/midwives.
In general, both private MH providers and puskesmas performed very well in blood pressure measurements, abdominal examination, actual provision of iron tablets, and estimating birth date. No less than 90 percent of the pregnant women interviewed reported that they received these health care services (Table 4.14). There were, however, notable weaknesses among both public and private MH providers regarding counseling on pregnancy warning signs (only about one-third of providers counseled on this), weight checks, urine tests, blood test, and tetanus toxoid vaccination.
Based on a simple unweighted mean of the content of ANC indicators, public MH providers generally performed better than private MH providers. These variations between the sectors are particularly large for antenatal tests: urine and blood tests, and enquiries about blood type. Private providers performed better regarding counseling on institutional deliveries but, for both sectors, such advice is rarely provided–24 and 9 percent for private and public MH providers respectively.
… patient satisfaction with private and public providers are comparable except for indicators related to fees and patient discrimination.
Based on this same exit interview of ANC patients (deliveries were not included), overall quality (as defined by the patient) of services provided was the same and high (97 percent satisfied) for both public and private providers. Nevertheless, a simple mean index reveals that patients were more
Table 4.14 Patient Exit Survey Results for MH Priority Districts
Type of ANC Services Received by Patient During Current/Previous Visit Private MH Puskesmas
Weight taken 33% 37%Blood pressure measured 99% 98%Blood pressure result informed 64% 64%Urine tested 28% 50%Blood sample taken 25% 51%Counseling on institutional delivery provided 24% 9%Abdominal examination 98% 96%Birth date estimate provided 90% 90%Uterus fundal height examined 63% 75%Blood type asked 59% 82%Diet information provided 82% 78%Iron tablet received 92% 94%TT injection received 63% 57%Pregnancy warning signs informed 36% 32%
Simple Mean 53% 60%Samples, n 173 204
Source Indonesia QSDS 2016; Unweighted.
52

satisfied with puskesmas compared with private MH providers (86 percent compared with 80 percent). These differences were mainly accounted for due to greater dissatisfaction among users of private MH services, with user (registration, medications, and laboratory) and transportation fees. There is dissatisfaction with fees (particularly lab fees) even for public puskesmas, although to a lesser degree than private but, nevertheless, this warrants further exploration as ANC services at puskesmas should be covered under JKN.
Private MH providers performed slightly better in terms of consultation time. Of concern, however, there was a large difference in patients’ perception of the way private MH providers acted towards
all patients–less than one-half (47 percent) of patients using private MH providers thought that health workers act the same way towards all patients, compared with 91 percent among patients using puskesmas.
These findings raise the question as to why patients use private facilities predominantly given the higher levels of satisfaction, quality, and financial access at public facilities. As a supply-side instrument, this survey does not answer this question but it suggests that there remain access issues with public providers– perhaps including limited opening hours and/or a scarcity of nearby facilities at a given locality.
Table 4.15 Patient Satisfaction Indicators in MH Priority Districts
Satisfaction Component Private MH Puskesmas
It is convenient to travel from your house to the health facility. 99% 98%The health facility is clean. 100% 98%The health workers are courteous and respectful. 99% 97%The health workers did a good job of explaining your condition. 98% 96%It is easy to get medicine that health workers prescribe. 93% 96%This facility is sufficiently supplied with medical supplies and equipment. 95% 90%The registration fees of this visit to the health facility were reasonable. 13% 47%The lab fees of this visit to the health facility were reasonable. 4% 14%The medication fees of this visit to the health facility were reasonable. 31% 43%The transport fees for this visit to the health facility were reasonable. 21% 61%The amount of time you spent waiting to be seen by a health worker was reasonable. 90% 86%You had enough privacy during your consultation. 94% 95%The health worker spent a sufficient amount of time with you. 98% 97%The hours the facility is open are adequate to meet your needs. 97% 98%You feel that this facility would take your feedback seriously. 99% 97%You trust in the skills and abilities of the health workers of this facility. 98% 97%The health workers in this facility are very friendly and approachable. 99% 97%The health workers in this facility care about your health just as much or more than you do. 99% 97%The health workers in this facility act differently toward rich people than toward poor people. 97% 97%The health workers in this facility treat female and male patients the same way. 97% 99%The health workers in this facility act the same towards all patients. 47% 91%The overall quality of services provided was satisfactory. 97% 97%
Simple Mean 80% 86%Samples, n 173 204
Source Indonesia QSDS 2016; Unweighted.Note Exit interviews were conducted only in DKI Jakarta (West Jakarta, East Jakarta and North Jakarta); For this MH-related analysis, only patients
who were attending for ANC services were included.
53

MATERNAL HEALTH REPORT . 2017Revealing the Missing Link
54

section 5 .
CONCLUSIONS AND POLICY IMPLICATIONS
55

MATERNAL HEALTH REPORT . 2017Revealing the Missing Link
What is Already Known About the Maternal Health Context?
Although detailed information on the service readiness of public sector MH providers has been previously available, systematic and detailed information on the supply-side context of private MH providers has not been available. This is the ‘missing link’, given that the use of private sector providers, in terms of institutional deliveries, far eclipses that of public sector providers. This policy note summarizes this new analysis of the Indonesia QSDS 2016 to shed light on this ‘missing link’ of MH service delivery–the private sector.
Key messages reflecting the broader context–especially the demand-side perspective which motivates this analysis–that are described in Sections One-Three are summarized in Box 5.1.
Critical MH Demand-side Contex Box 5.1
• There is one maternal death every hour in Indonesia, reflecting an MMR that is very high compared to regional and economic peer countries, although there have been some improvements. Indonesia did not attain the 2015 MDG target for reducing the MMR and it is unclear if the 2030 SDG target will be met. Key causes of MMR, in order of incidence, are (i) postpartum and antepartum hemorrhage and (ii) eclampsia/preeclampsia.
• There are large variations in MH outcomes and public-sector MH provision across Indonesia, motivating a national program to prioritize 64 high-priority districts where large numbers of maternal deaths occur.
• Institutional delivery rates (76 percent) are below target, especially in rural areas (65 percent). Although SBA and ANC coverage rates have improved, the content and effectiveness of either is unclear.
• Private sector MH providers are, by far, the dominant providers of institutional deliveries, especially in urban areas. Nationally, 55 percent of all deliveries occurred in the private sector in 2015, compared with 22 percent in the public sector.
• JKN, the national flagship SHI scheme, includes a theoretically comprehensive MH benefits package, covering both public and empaneled private providers but, critically, only 70 percent of the population is enrolled in JKN. A complementary scheme, Jampersal, was revamped in 2016 and now provides assistance on the demand side to encourage institutional deliveries in the form of waiting homes, referrals, and payment coverage for poor high-risk pregnant women who are not covered under JKN/KIS.
56

What are the Key Messages Arising from this Analysis?
The analysis focuses on the service readiness and effectiveness of private primary MH providers in sampled priority districts. This is contextualized with public primary MH providers (puskesmas and polindes/poskesdes) in the same districts and compared with matched comparator ‘nonpriority’ districts. Service readiness was measured in terms of both ‘hardware’ (that is, infrastructure, equipment, medicines, and diagnostics), and ‘software’ (training and provider ability, using facility, health worker, and patient survey instruments). Key policy-relevant differences and similarities in the characteristics and strengths of private and public primary MH providers are summarized in Table 5.1. 57

MATERNAL HEALTH REPORT . 2017Revealing the Missing Link
Table 5.1 Key Characteristics and Strengths of Private and Public Primary MH Providers
PRIVATE MH PROVIDERS PUBLIC MH PROVIDERSDIFFERENCES
• Mainly single-practitioner midwives operating from homes, with a small number of multipractitioner maternity clinics.
• 36 percent of private midwives are dual practicing in the public sector.
• Comprising both puskesmas and polindes/poskesdes.• Puskesmas are multipractitioner facilities, including both PONED
and nonPONED puskesmas, with a median of 4 midwives.• Polindes, typically staffed by 1 village midwife, focuses only
on MCH whereas poskesdes can also provide promotive, preventive and curative services.
• The ratio of poskesdes to polindes is 84:16.• Generally distributed in urban areas, and in provinces of
North Sumatra, Jambi, and the provinces on Java and Bali.• No clear pattern of the filling of public provider distribution ‘gaps’.
• Relatively more rural presence due to polindes/poskesdes network.
• Only one-third of private primary MH providers are BPJS empaneled, with implications on access and effectiveness.
• Reasons for nonempanelment are mainly nonfulfillment of BPJS requirements and, to a lesser extent, financial.
• Puskesmas are, by default, empaneled with BPJS.
• Almost all private primary MH providers cover both ANC and basic obstetric care.
• Puskesmas, polindes/poskesdes would all typically cover ANC.• 45 percent of puskesmas cover deliveries but only 40 percent
of polindes/poskesdes cover basic obstetric care.• Lower service readiness than puskesmas, but much better
than polindes/poskesdes.• Greater variation in service readiness among private MH
providers.
• Even among polindes/poskesdes which purport to provide delivery services, the service readiness of these facilities (including basic amenities such as water supply) is extremely weak and may not meaningfully count as an institutional delivery.
• Particular weaknesses in the average availability of emergency obstetric drugs used to treat preeclampsia/eclampsia, the second most common cause of maternal mortality.
• Although still low, puskesmas have higher average availability of emergency obstetric drugs.
• Relatively more likely to counsel pregnant women on importance of institutional delivery, but note that this is still infrequent.
• Relatively more likely to enquire about pregnant woman’s blood type.
• Particular weaknesses in the actual use of diagnostic tests for hemoglobin and urine protein (to identify anemia and pregnancy-induced hypertension related respectively to PPH and preeclampsia/eclampsia) during ANC visits, although average availability of these tests is comparable to puskesmas.
• Although still infrequent, puskesmas providers are more likely to actually test for hemoglobin and urine protein than private MH providers, although the average availability of tests is comparable to private MH.
• Overall, lower patient satisfaction with private providers due to fees and discrimination.
• Higher patient satisfaction generally, except for time spent with the patient and subjective perception of facility supplies and equipment.
COMMONALITIES• Service readiness of both public and private MH providers can be much improved, especially in the domains of medicines,
diagnostics, and basic obstetric care.• Provider ability can be much improved, especially the management of life-threatening obstetric emergencies.• Emergency referral networks can be further strengthened.• Public-private coordination, as part of the JKN network, can be improved.• Surprisingly, conditional on the presence of a facility, urban-rural disparities at a facility level (comparing similar facility
types in urban and rural areas) is remarkably similar–with rural facilities often ‘readier’ than their urban counterparts.• Despite the national prioritization of the 64 high-priority MH districts, there are minimal differences between these
districts and matched comparator nonpriority MH districts.• Notably, as these districts represent 33 percent of the national population and a smaller share, 30 percent, of maternal
deaths, these districts have lower MMR than the national ratio.
58

What are the Policy Implications of These Key Findings?
The overarching medium-term policy direction for addressing high MMR and reducing MMR disparities in Indonesia should focus on:
• Minimizing noninstitutional deliveries and covering all institutional deliveries, regardless of public or private provider, with the financial protection (and quality assurance) of a strategically purchasing social health insurer;
• Improving the effectiveness of institutional deliveries at both public and private providers, in terms of service readiness, provider ability, and referral systems. Nevertheless, in urban and densely populated areas, there remains debate on whether larger multipractitioner maternity facilities/centers or single-practitioner primary MH provider-centric institutional deliveries should be encouraged;
• Continued progress on both demand-side (for example, expanding the breadth of JKN coverage, health education, family planning, ANC, and preventive and public health measures) and supply-side interventions (for example, registration and licensing of providers and accreditation of facilities) is imperative.
Given the Indonesia context, an archipelago with thousands of islands and extremes in population densities, the specific policy direction undertaken by Indonesia would need to take into consideration the urban-rural context. It would also need to leverage the assets of both private and public MH providers, including opportunities provided by the introduction of JKN in 2014 as a purchaser of health services from both the public and private sector.
As this policy paper is motivated by the availability of new information about the private sector, policy implications described here are focused on improving the supply-side readiness of the private sector. This does not, however, imply that there are no policy
implications for public providers, nor can policies for either sector be undertaken in isolation. Specific crucial policy implications for public providers and the interface between private and public are also proposed. Many policies that are relevant for private providers would also be relevant for public providers but, given that institutional delivery rates are below target, this policy paper encourages both public and private deliveries, and does not offer a preferential view of either public or private.
These policy implications further recognize that heterogenous strategies are necessary, given the Indonesian context, for high (‘urban’ areas, loosely speaking) and low (‘rural’ areas, loosely speaking) population-density areas. Importantly, policies to strengthen MH services should also be seen within the broader context of primary health care strengthening, for which the eight ‘interlinked reform levers’ proposed for China’s primary health care reforms may be helpful (World Bank 2016b). With this broader context in mind, private sector-focused MH-related policy implications arising from the key findings from this analysis are presented below according to the key responsible stakeholder, noting that some policy actions involve multiple stakeholders.
Badan Penyelenggara Jaminan Sosial (BPJS)As a strategic purchaser of health services for JKN, BPJS is the key link to improving the quality and coverage of private MH providers. Many key policy implications are, therefore, achievable opportunities for BPJS to further strengthen its critical role in Indonesia’s health system through: (i) strengthening the empanelment/contract renewal process; (ii) PPM and tariff rate reforms; and (iii) increasing BPJS empanelment.
59

MATERNAL HEALTH REPORT . 2017Revealing the Missing Link
The strategic purchasing functions of BPJS should be extended beyond claims administration, given the mandated role of BPJS as JKN’s strategic purchaser of health services. This is enshrined in its vision to provide ‘quality’ (berkualitas) and ‘sustainable’ (berkesinambungan) health insurance by 2019, and its mission that includes improving the quality of services (meningkatkan kualitas layanan) and ensuring sustainability through the use of appropriate health facility payment systems (sistem pembayaran fasilitas kesehatan) in a transparent and accountable manner (transparan dan akuntabel) (BPJS Kesehatan. 2017).
BPJS empanelment and contract renewal of private providers should be strengthened progressively, verifiably, and transparently. Although it is encouraging that BPJS empanelment, which includes verification of a self-assessment checklist, is associated with higher mean service readiness indexes, the service readiness–even of BPJS-empaneled private (and public) providers–can be substantially improved.
Four opportunistic actions can be undertaken by BPJS to do so:
Firstly, service readiness standards should be progressively leveled-up to fully attain the norms set by an appropriate national and/or international technical authority such as MoH or WHO. Specifically, these standards must also include: (i) valid (that is, nonexpired) emergency obstetric drugs–even if these are rarely used; (ii) diagnostics required by national guidelines as part of ANC; and (iii) preplanned arrangements for emergency referrals.
There are two options for progressive leveling-up of standards:
• empanelment requirements for all newly empaneled facilities can be raised over time, with the same increased standards applied for contract renewals for existing empaneled facilities; or
• different ‘tiers’ of standards can be applied on an interim basis (with different reimbursement prices) for different geographical contexts (for example, with higher standards for wealthier urban areas in Java) so that the requirements for empanelment for new entrants would not be too onerous for providers in more rural areas.
The lowest tier of standards should not be lower than the current status quo and the standards of all tiers should increase and converge over time. Once empaneled, even under a lower tier, providers have the discretion to spend BPJS reimbursement and should use these to make investments to keep up with standards. These standards should be applied not only during the empanelment process but also during the contract renewal stage. Renewals should not be automatic or assumed but require an assessment against progressively increased standards.
Secondly, the relationship between volume and outcomes should be leveraged by encouraging the consolidation of small (that is, low-volume) providers in densely populated urban areas. Heavy-handed regulations would not be required as this would be a natural market response to progressive leveling-up of standards, as the costs and rationale of doing so as numerous small-scale single-practitioner private midwife practices may be less justifiable–especially in a dense urban environment. Small single providers can merge and consolidate into multipractitioner maternity facilities/centers, such that service readiness investments can be pooled to meet increasingly stringent criteria. In a study of five African countries, the quality of basic maternal care functions in low delivery volume facilities, using an index of 12 indicators of care derived from health system surveys, was ‘consistently associated with poor quality’ (Kruk et al. 2016).
Thirdly, the assessment process should be made more robust and verifiable. This applies particularly to network providers who are part of a ‘parent’ network, as responsibility for verifying service readiness lies with the ‘parent’ facility. Furthermore, self-assessment tools for verifying compliance with standards may not be appropriate given the evidence provided in this policy paper and BPJS should adopt a more involved approach. In addition, BPJS can seek the help of other stakeholders such as dinkes, professional bodies, and civil society to verify compliance with standards using spot checks and/or on a random sampled basis.
Lastly, BPJS should increase the amount of published information on empaneled providers, both public and private, so that patients can make
60

informed choices of provider. The BPJS website currently provides information on the type, name, and location of empaneled facilities, together with information on opening hours and staffing. Information that can be used to infer some element of quality–verified service readiness, training and certifications, and utilization information by types of health services–would, however, be more useful to patients who need to decide on a provider.
As a note for the future, public facilities should not be automatically privileged with empanelment under BPJS (even though this study indicates that service readiness is better in puskesmas than private MH providers). They should be, eventually, subject to the same empanelment and contract renewal standards as private facilities. Users should be confident that any provider participating in JKN–public or private–can effectively and safely provide delivery services.
The supply of BPJS-empaneled private MH providers should be increased in viable yet underserved areas, by systematically identifying coverage gaps using geographic analysis and incentivizing private investment. As only approximately one-third of private primary MH providers are empaneled with BPJS, the potential coverage of JKN’s MH benefits package at a particular locality could be limited. While this is understandable and arguably unavoidable in remote rural areas, pockets of underserved areas in urban areas or areas with sufficient population densities need to be identified and understood in greater detail.
Identifying such coverage gaps would need more detailed geographic analysis, not only of the locations of currently empaneled facilities but, importantly, of populated areas where there are no empaneled facilities to create a supply-side ‘masterplan’ to ensure effective depth of coverage throughout Indonesia. Obtaining high-quality and systematic data on private providers was a significant challenge faced during the data collection process for this survey and this should be rectified as it will also affect the planning and implementing policies.
BPJS should then use an arsenal of financial and nonfinancial mechanisms to signal the need for,
and its interest in, including private providers specifically in viable underserved areas (for example, where claims for institutional deliveries from both public providers and empaneled private providers are below an expected norm given the population catchment area).
Financial mechanisms can range in sophistication from simple sign-up incentives, loans (against future reimbursements), subsidies, or grants for capital investments to equip and stock a new facility. This would avoid a ‘Catch-22’ situation whereby facilities with inadequate service readiness would not be able to empanel and receive payments for services provided.
Nonfinancial mechanisms would include raising awareness by publishing information on provider coverage gaps (at the very least), reducing the administrative overhead of the empanelment process, and coordination with MoH and subnational governments on the deployment of human resources for health and the establishment of facilities. Reverse incentives may also be considered in areas that are objectively overserved (not just relatively overserved) by a surplus of private providers who are underutilized despite high coverage of institutional deliveries, whereby new entrants in overserved areas face a sign-on fee unless they move and establish themselves in underserved areas.
These initiatives to increase the coverage of BPJS-empaneled providers should be complemented with initiatives to increase the enrolment of the population in JKN. This arsenal of mechanisms can be fine-tuned with a further detailed study of the diagnostics for empanelment, nonempanelment, and drop-outs after empanelment, although action should not be delayed while awaiting fine-tuning. This survey only included basic questions on BPJS empanelment and nonempanelment as it was not focused on this study.
Although recently revised in 2016,29 BPJS should undertake a review of current PPMs and tariff rates used to purchase MH services to manage costs sustainably (as per BPJS’s own mission and mandate), improve the effectiveness of services, promote empanelment of private
29 Permenkes No. 52/2016
61
MATERNAL HEALTH REPORT . 2017Revealing the Missing Link
providers in viable underserved areas, and promote institutional deliveries, especially in rural areas. An equal/level reimbursement scheme across all provider and geographical contexts is not an ‘equitable’ reimbursement as average unit costs may differ–for example, average costs may be higher where population densities and utilization rates are low. A higher reimbursement fee multiplier should be considered in viable underserved areas, with regular dynamic adjustments to this fee as empanelment and claims increase. To allow new facilities to fund initial investments in viable underserved areas, this multiplier can be used synergistically for a time-limited period, with the financing mechanisms mentioned earlier.
There is some evidence that BPJS reimbursement fees are not attractive to many private providers, who indicate that they receive much higher fees when patients pay OOP and service volumes are already adequate. Although purchasing power is different across countries, as a regional comparator, PhilHealth in the Philippines (which has lower GDP per capita than Indonesia) provides a maternity package to insured members for ₱8,000 (approximately Rp 2.1 million) that is higher than reimbursements under JKN (PIA 2017).
As a volume-purchaser, BPJS should not be expected to reimburse at the high rates paid OOP by patients, but the basis of pricing reimbursements for private providers may need to be revisited, especially in the period where enrolment with BPJS nationally is not high enough to ensure market power (as a purchaser) in many localities. PPMs for ANC services may also need to be explored further, as, although it is important to incentivize the provision of at least four antenatal visits as per guidelines, delaying payment to the provider effectively for almost the entire duration of pregnancy may discourage providers. The content of service provision–for example, diagnostic tests to be conducted during ANC visits and counseling on warning signs during pregnancy–should also be specifically required for payment purposes.
Further study at a later stage can inform refinements to the BPJS payments system, including understanding if, and where, delays in reporting and/or payments are occurring between BPJS and providers, and between providers and
their network, but action now on PPM reforms should not be postponed while awaiting further study. PPM reforms are also an important requirement to enable the integration of the delivery system (across hospital and primary care; and across the public, private, and dual-practicing providers) and in changing the mix-appropriate MH services, by emphasizing more preventive content and not incentivizing cesarean sections except where clinically justified–and these reforms should remain on the agenda even if not feasible in the immediate term.
Ministry of Finance (MoF)As outlined in the introduction, improvements in MH are a key human development investment opportunity, yet Indonesia’s MMR remains high relative to its income level, thus stymying the full realization of the development potential of Indonesians. JKN, through its strategic purchaser BPJS, establishes a demand-side financing channel for both the public and private sector.
JKN’s financing channel can be leveraged by the demand-side investments outlined earlier under the recommendations for BPJS–with modest budgetary implications. The current JKN deficit is acknowledged but MH services are a relatively small proportion of services covered by JKN and this is, therefore, a feasible initiative–especially in terms of the developmental outcome and as an ‘early win’ that catalyzes broader system-wide reforms to make Indonesia’s goal of UHC by 2019 meaningful.
These investments should be made conditional on BPJS advancing its capabilities from passive claims administration to active strategic purchasing. The latter is vital for carving out a sustainable health financing path for Indonesia. It should be noted that to make efficiency gains, initial investments may often be needed.
Ministry of Health (MoH)The national prioritizing of 64 high-priority MH districts should be clarified, in terms of the basis of district selection and content of the program. This survey finds minimal differences in service readiness overall between priority and nonpriority
62
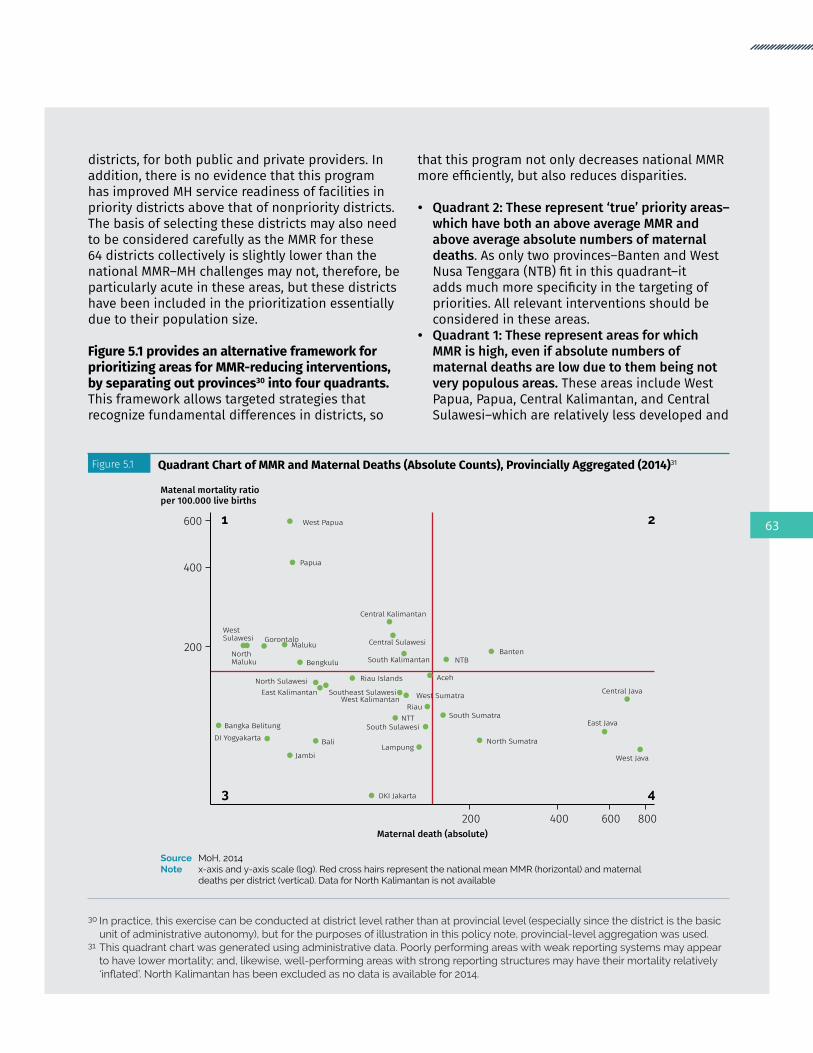
districts, for both public and private providers. In addition, there is no evidence that this program has improved MH service readiness of facilities in priority districts above that of nonpriority districts. The basis of selecting these districts may also need to be considered carefully as the MMR for these 64 districts collectively is slightly lower than the national MMR–MH challenges may not, therefore, be particularly acute in these areas, but these districts have been included in the prioritization essentially due to their population size. Figure 5.1 provides an alternative framework for prioritizing areas for MMR-reducing interventions, by separating out provinces30 into four quadrants. This framework allows targeted strategies that recognize fundamental differences in districts, so
that this program not only decreases national MMR more efficiently, but also reduces disparities.
• Quadrant 2: These represent ‘true’ priority areas–which have both an above average MMR and above average absolute numbers of maternal deaths. As only two provinces–Banten and West Nusa Tenggara (NTB) fit in this quadrant–it adds much more specificity in the targeting of priorities. All relevant interventions should be considered in these areas.
• Quadrant 1: These represent areas for which MMR is high, even if absolute numbers of maternal deaths are low due to them being not very populous areas. These areas include West Papua, Papua, Central Kalimantan, and Central Sulawesi–which are relatively less developed and
30 In practice, this exercise can be conducted at district level rather than at provincial level (especially since the district is the basic unit of administrative autonomy), but for the purposes of illustration in this policy note, provincial-level aggregation was used.
31 This quadrant chart was generated using administrative data. Poorly performing areas with weak reporting systems may appear to have lower mortality; and, likewise, well-performing areas with strong reporting structures may have their mortality relatively ‘inflated’.NorthKalimantanhasbeenexcludedasnodataisavailablefor2014.
Figure 5.1 Quadrant Chart of MMR and Maternal Deaths (Absolute Counts), Provincially Aggregated (2014)31
Source MoH, 2014Note x-axis and y-axis scale (log). Red cross hairs represent the national mean MMR (horizontal) and maternal
deaths per district (vertical). Data for North Kalimantan is not available
200
400
600
Matenal mortality ratioper 100.000 live births
Maternal death (absolute)200 400 600 800
1 2
3 4
West Papua
Papua
BantenNTB
Central Kalimantan
NorthMaluku Bengkulu South Kalimantan
Central SulawesiMalukuGorontalo
WestSulawesi
Central Java
West Java
East Java
DKI Jakarta
Aceh
North Sumatra
South Sumatra
Bali
Jambi
Bangka Belitung
North Sulawesi
DI Yogyakarta
West Sumatra
South Sulawesi
Lampung
RiauWest Kalimantan
NTT
East Kalimantan
Riau Islands
Southeast Sulawesi
63

MATERNAL HEALTH REPORT . 2017Revealing the Missing Link
less populous than the rest of the country. These areas would not be well represented among the 64 high-priority MH districts. This should be reconsidered as MMR, even at the provincially aggregated basis, can be six times that of some high-priority MH districts. Redirecting resources away from areas in this quadrant to quadrant 3 may be ethically and morally questionable. Strengthening the public system may be critical in these sparsely populated areas–through supply-side investments and training, coupled with appropriate demand-side strategies to promote appropriate utilization of services. As MMR is high in these areas, improvements could be easier to achieve.
• Quadrant 4: These represent relatively better developed areas with below average MMR but are populous–such as Central, East, and West Java. Due to their sheer population sizes, they contribute substantially towards maternal death numbers. Reducing MMR in these areas requires different strategies compared with Quadrant 1 areas. As these are more developed and densely populated areas, strategies which leverage the private sector–including improving readiness and effectiveness using regulatory and strategic purchasing mechanisms–may be more appropriate.
• Quadrant 3: These areas include Bali, DI Yogyakarta, DKI Jakarta, which are well developed and wealthier parts of the country, for which MH prioritization given limited resources may be unhelpful. These areas should, however, continue making progress in maintaining and improving maternal and other health outcomes.
Both supply-side (for example, DAK) and demand-side (for example, BPJS) financing levers should be used to emphasize outcomes and reduce disparities. Although prioritizing 64 districts is a national initiative, the central MoH has limited means to affect service delivery at the subnational level given the decentralization context, apart from prioritizing a limited part of the budgetary inputs for which the central MoH has responsibility. In addition, there are few hard levers to enforce normative standards on subnational governments, apart from what is permissible by technical guidelines for utilizing DAK funding. This technical guideline includes a list of items that can be purchased, including MH service inputs and health commodities.
DAK financing should be monitored closely–with greater emphasis on accountability and outcomes. This includes monitoring the use of capitation fees (that is, at puskesmas in priority districts) to ensure prioritization of critical drugs and equipment. Long-term reliance only on centralized vertical financing channels for specific programs down to the facility level on the supply side is not, however, ideal in terms of decentralization and fiscal reforms.
A synergistic mechanism is to expand financing on the demand-side in priority districts or subdistricts, by engaging with JKN through BPJS. This will firstly require detailed information on MH utilization and outcomes to inform subnational priority setting (to identify weak districts or subdistricts) that can then be linked to the financial and nonfinancial levers recommended above to improve the coverage and quality of MH providers. Progress on outcomes also acts as some form of district-level league table, to ‘name and shame’ underperformers while learning from the interventions implemented by districts demonstrating improvements.
Further opportunities to engage the private sector should be explored, including both for-profit and nonprofit organizations, through public-private partnerships (PPPs). This is consistent with RPJMN 2015-2019 and is regulated by Perpres No. 38/2015 and Permen PPN No. 4/2015. PPPs should not only be confined to the provision of investments for health infrastructure but also for MH service delivery. BPJS, as a purchaser of health services, is an important arm of the strategy to leverage the private sector, but further PPP innovations can also be considered–for example, training and deploying high-quality human resources for health, supporting services (such as diagnostics and pharmaceuticals), and appropriate mechanisms to invest in health infrastructure. These partnerships will require capacity to monitor and manage carefully, to ensure it adds value to the system and minimizes unintended consequences.
The role of polindes/poskesdes in providing MH services should be clarified because public providers are indispensable in remote rural areas. Given the Indonesian geographic context, there would be rural areas for which the business case for establishing a private MH provider would simply
64

not be compelling, especially in remote rural areas, and it would, therefore, be left to public providers to cover health services in these areas.
Polindes/poskesdes are key public providers of MH services, however, given that the service readiness of such facilities is very weak, the role of polindes/poskesdes needs to be clarified. In many cases, even where basic obstetric care is ostensibly provided at that facility, the service readiness of many such facilities is so poor as to doubt that the effectiveness of a delivery at a polindes/poskesdes is any better than a home birth attended by a skilled attendant. This issue also relates to private provision due to dual practice. Many village midwives who are also resident at the polindes/poskesdes would also use the facility for private provision outside of hours and, therefore, be exposed to similar service readiness (for example, availability of equipment, medicines, and diagnostics) issues at these facilities.
To remedy this fundamental issue, there are broadly two solutions: Firstly, the service readiness of polindes/poskesdes can be leveled-up through substantial investments in service readiness, but such investments would be considerable as there are many polindes/poskesdes and many are underutilized. The recruitment and retention of human resources would also be a major challenge. Furthermore, in such an environment of low utilization, the skills and expertise of even the most well-trained midwife will grow rusty, even if supervision and monitoring is improved. As mentioned earlier, international experience indicates that outcomes for low-volume providers are poor.
Alternatively, limit (and strengthen) the use of polindes/poskesdes to ANC (including as a platform for outreach and community-based activities to promote institutional deliveries) and other preventive nonemergency services, but recalibrate the role of polindes/poskesdes regarding deliveries. The 2016 Jampersal benefits package, which includes funding for maternity waiting homes and referrals, can be used to entrench the role polindes/poskesdes–not as a location for institutional deliveries but to organize, encourage, and facilitate the timely transfer of a pregnant woman to the nearest puskesmas or, eventually, empaneled private MH facility for delivery.
DistrictHealthOffice(Dinkes)
Dinkes should be empowered with a stronger stewardship role over the private sector, in collaboration with BPJS. Although BPJS is responsible for empanelment, cooperation at the local level in strengthening the health service delivery system is also in the interest of the dinkes. As a start, the capacity of the dinkes and/or puskesmas must be enhanced to effectively support the monitoring of private providers. The dinkes already has an existing obligation to provide strong quality monitoring of, and supervision to, facilities, including private MH facilities, although further study is needed to understand the strengths and challenges faced by this existing monitoring system to ensure that it can be effectively applied and/or adapted to private providers, and to learn lessons from the monitoring of public providers.
Instruments and guidelines for these supervision activities are already developed and available, but these processes should be strengthened and standardized, with clear linkages to the credentialing process, BPJS contract renewals, and practice licensing so that it will have real implications for private providers. The dinkes will need to be empowered with adequate resources and incentives to perform these tasks. Although not having a stewardship role, the government should also study the feasibility of allowing private providers to purchase supplies from the government e-catalogue.
Health System-WideIntegrated care should be strengthened across the continuum of providers, through improved referral systems for both the private and public sector at the primary and hospital level. There are weaknesses in the referral systems for both the public and private sector, particularly the availability of transportation and communications. Although it would not be possible to solve the referral challenges in Indonesia overnight, several possible next steps can be considered. On the supply-side, the service readiness including both ‘hardware’ (for example, transportation and communications) and ‘software’, in the form of referral plans and formal or informal channels for referral can be strengthened.
65
MATERNAL HEALTH REPORT . 2017Revealing the Missing Link
Individual pregnant women should be stratified for obstetric risks and high-risk pregnancies should have an individualized delivery plan and be specifically encouraged to deliver at a more comprehensive facility capable of managing serious obstetric complications. This risk stratification and individual delivery plans should be linked directly to the benefits provided by Jampersal since 2016, which provides financing for maternity waiting homes and referrals.
As obstetric complications can arise even in low-risk pregnancies, all frontline health workers at the primary MH level should be trained to identify and provide initial treatment for obstetric and neonatal emergencies so that safe and timely referrals can be conducted. In addition, at the hospital level, although not the specific focus of this study, there is a maldistribution of specialist obstetricians who can conduct cesarean sections. Potential mitigations could also include task shifting and training local nonspecialist doctors to be able to conduct emergency cesarean sections. PPMs should not also perversely incentivize primary MH providers to hold on to high-risk cases until complications happen. Integrated care would need to be enabled by appropriate PPMs, including the choice of ‘whom’ (that is, what level of provider or provider network) to purchase from.
Private MH providers should be fully involved in in-service training and preservice training for all MH providers should be strengthened. Findings from this study indicate that there is weak provider ability to deliver ANC and to manage obstetric complications like PPH according to clinical guidelines. Differences between public and private providers were minimal. Unless they are dual practicing, private midwives have fewer opportunities to participate in in-service training to maintain and update their clinical skills. This factor, therefore, underlines the importance of preservice training.
Although Indonesia requires midwifery students to pass the national midwifery competency examination to standardize the quality of midwifery academy graduates, the graduation passing grade is still low at approximately 40 percent. These training programs, therefore, need to be strengthened, by ensuring the adoption of competency-based education in midwife education, and that students get adequate clinical practice to develop their skills.
The existing policy that requires practicing midwives to obtain training credit points to renew their five-yearly registration with the Indonesian Midwives’ Association (IBI) should be strengthened–not only through tighter enforcement, but also by expanding opportunities for in-service training which is the responsibility of local government. For example, IBI has designed and organized a three-day midwifery training program covering antenatal and obstetric care to provide private midwives with access to training. Nevertheless, ensuring standardized quality and equal access to the training program across the country, as well as encouraging more frequent competency updates than the current five-yearly requirements, is essential for skills maintenance.
A further opportunity for incentivizing in-service training among private providers is during renewal of empanelment, which can be also made contingent on training credit points. Collaboration and cooperation between the public and private sectors may also be helpful, and may be in the best interest of public providers who receive incoming referrals for obstetric complications, such that training programs for public providers are made available to private providers.
Civil SocietyComplement formal regulatory and accreditation processes with voluntary certification schemes, such as Bidan Delima, to promote higher-quality standards. The Bidan Delima program is a franchise for certifying private midwives, managed by IBI since 2003 following an initial investment from USAID. The process to be certified as a Bidan Delima involves registration with IBI, support from a facilitator to improve specific skills and competencies as identified by a self-assessment instrument, an onsite visit, and reference materials on clinical standards. Once certified, a Bidan Delima would receive clinic signage materials to brand the clinic to signal quality and will also be routinely supervised by a facilitator. Although there are areas for improvement in this program, particularly continued monitoring to ensure standards are maintained at a higher level than uncertified peers, initiatives such as these can be a helpful complement to improving standards, especially if professional bodies such as IBI are involved.
66

Concluding Remarks
As this policy note is grounded in an analysis of MH service provision at the primary level, the above is not an exhaustive list of recommendations required to address MH in Indonesia more broadly. MH service provision in private and public hospitals will need further study and attention. Demand-side interventions should also be continued and expanded.
The current MH challenges facing Indonesia are too great for either the public or private sector to address in isolation of the other. Pregnant women have voted with their feet to and many have chosen private providers who are, consequently, responsible for conducting most of the institutional deliveries in Indonesia. Private providers should
continue to play a significant role in the provision, however, although there are many strengths as outlined above, there are also challenges and opportunities for improvement.
Although the government does not have direct control over private providers, JKN provides an avenue for influencing both sectors as it covers both public and private providers. This avenue together with the stewardship responsibilities of MoH, should be leveraged to strengthen both sectors to improve the level and equity of institutional delivery rates and the effectiveness of institutional deliveries in terms of service readiness, provider ability, and access to timely and appropriate emergency referrals.
67

MATERNAL HEALTH REPORT . 2017Revealing the Missing Link
68

APPENDIXES69

MATERNAL HEALTH REPORT . 2017Revealing the Missing Link
Appendix 1.Indonesia QSDS 2016:Sampling and Analytic Methodology
Background and Objectives
Indonesia comprises 34 provinces (propinsi) and special administrative areas, such as DKI Jakarta, and 98 urban districts (kota) and 413 rural districts (kabupaten). It consists of a vast archipelago of 250 million people in 18,000 islands ranging from densely populated areas (including one of the largest conurbations in the world–Jabodetabek) to remote and isolated islands and jungle communities.
Due to reforms in decentralization, districts have greater autonomy and, therefore, are an important of unit of analysis. Furthermore, within the health sector, a major reform initiative (JKN) was introduced, effective from January 2014. Given this background context, Indonesia QSDS 2016 was envisioned as a primary health care facility and services survey in Indonesia, with specific ‘disease-focus’ on nutrition, maternal and child health, communicable diseases (particularly, HIV/AIDS, tuberculosis, and malaria), and noncommunicable diseases (NCDs). Thematically, the survey captured information based on WHO’s SARA conceptual framework, adjusted according to national guidelines, but also included modules on governance, health indicators, health financing (but not costing information), provider ability, and patient satisfaction.
Instruments were developed to survey dinkes, various primary health care facilities (puskesmas, polindes/poskesdes, private MH providers, and private clinics), health workers, and conduct patient exit interviews in DKI Jakarta. As one of the key objectives of this survey is to provide baseline indicators for JKN, facilities established in 2014 or later were excluded from the survey. In addition, a small number of hospitals were also sampled while at the community level; and posyandu were also
sampled–especially for nutrition-related indicators. For the purposes of this private MH policy note, however, only MH-relevant instruments were used in the analysis.
Where possible, baseline quantitative data–for example on financing and health-related indicators–were collected for the period 2013–15. This time period was selected so that the government could assess changes in the financing of frontline service delivery because of the transition to JKN in 2014 and to serve as a baseline for the implementation of JKN.
As the government indicated its concern for remote and rural areas, for sampling of districts and facilities, methodologies that would oversample large and heavily populated districts or facilities (for example, sampling methodologies that were proportionate to district population) were judged to be less appropriate for the intended objectives of this survey, especially given the large variations in the population and sizes of districts in Indonesia. Sampling was not designed to be regionally representative (for example, regions like Java, NTT, and Sumatera). Resource constraints were a further important consideration and, therefore, an efficient survey methodology was desired.
The primary objectives of, and tradeoffs considered in, the sampling methodology were to provide, especially as a baseline for JKN:
1. National estimates of facility-level indicators for: (i) public primary care (puskesmas); (ii) private primary care; and (iii) posyandu, stratified by urban (kota) and rural (kabupaten) districts;
2. DKI Jakarta estimates of facility-level indicators: (i) public primary care (puskesmas); (ii) private primary care; and (iii) posyandu, not further stratified by urban or rural districts;
70

3. Estimates of facility-level indicators for the 64 high-priority districts: (i) public primary care (puskesmas); (ii) public maternity care (such as polindes, poskesdes, and bidan di desa); (iii) private maternity care (both single and multiprovider facilities); and (iv) posyandu, stratified by kota and kabupaten;
4. Estimates for a sample of matched counterfactual districts to the 64 high-priority maternity districts, for the same facilities as for the priority MH districts, stratified by kota and kabupaten;
5. Estimates for the 75 priority HIV/AIDS and TB districts for: (i) public hospitals; (ii) private hospitals; (iii) puskesmas; and (iv) private primary care;
6. Estimates for a sample of matched counterfactual districts to the 75 priority HIV/AIDS and TB districts for the same facilities as for the 75 priority HIV/AIDS and TB districts;
7. Estimates for the 132 priority malaria districts for: (i) puskesmas; and (ii) private primary, not further stratified by urban or rural districts;
8. For each of the sampled districts, an estimate at the level of that district for facility-level indicators. This was intended to allow comparisons between district-level indicators and district characteristics;
9. Estimates for health care worker-level indicators, including provider ability, for health workers at puskesmas, private primary care, public maternity care, and private maternity care;
10. In DKI Jakarta, where the supply readiness was not anticipated to be a critical constraint, estimates of patient user-level indicators through patient exit surveys.
Field work for this survey was conducted from May 30 to October 31, 2016.
Sampling Methodology Summary
SAMPLING OF DISTRICTS
Due to resource constraints and the desire to produce district-level estimates for the sampled districts, there were relatively few districts (Level 1) sampled and a relatively larger number of facilities per district (Level 2) sampled in this two-level clustered random sampling.
To reduce the likelihood of randomly selecting districts that were less typical of sample frame of districts, cube sampling (Grafström 2014) was, therefore, used. This balances the sampled districts with the sample frame of districts, based on observable characteristics: (i) district population in 2013; (ii) GDP per capita; (iii) Human Development Index (HDI); and (iv) district land area. This does not, however, specifically address intraclass correlation issues between the two levels and the variation of facility-level indicators between districts was, therefore, traded off to strengthen estimates within a district.
For each sample frame of districts–that is, DKI Jakarta districts, nonDKI Jakarta national districts, MH priority districts, HIV/AIDS and TB priority districts, and malaria districts–sampling of districts was conducted independently of each other. There was further stratification between urban districts (kota) and rural districts (kabupaten) for nonDKI Jakarta national districts, MH priority districts, and HIV/AIDS, TB priority districts, and counterfactuals for the latter three.
There is, however, overlap in the sampling frame of districts for each of these selected districts, except for DKI Jakarta districts and nonDKI Jakarta districts which were mutually exclusive and commonly exhaustive to represent Indonesia nationally when combined. Due to this overlap in sample frames, there were also overlaps among sampled districts, that were sampled out of different but overlapping sample frames. This chance overlap was exploited as similar instruments and facilities were often involved for the different sample frames. All relevant survey instruments and facilities were applied to satisfy the requirements of the different sample frames in an overlap district, although overlaps considerably reduced the resources required for this survey.
Twelve districts were sampled from the 64 high-priority MH districts.
SAMPLING OF COUNTERFACTUAL DISTRICTS
For the populations of two districts–MH priority districts and HIV/AIDS and TB priority districts, and for their urban districts (kota) and rural districts (kabupaten) independently–‘counterfactual’ districts
71

MATERNAL HEALTH REPORT . 2017Revealing the Missing Link
were matched to districts from the overall sample of districts already sampled (for example, DKI Jakarta and nonDKI Jakarta). As these districts had already been sampled, albeit for other purposes, there were fewer additional resources required to include these, apart from ensuring the relevant counterfactual survey instruments and facilities were included.
These counterfactual districts were matched (Hansen and Klopfer 2006) from a counterfactual sample frame comprising districts sampled for other purposes if they were not ‘intervention’ districts–that is, in the case of MH priority counterfactual districts, the counterfactual sample frame excluded all MH priority districts. Matching was based on the same four observable characteristics: (i) district population in 2013; (ii) GDP per capita; (iii) HDI; and (iv) district land area. Health outcomes or health outputs were not considered appropriate parameters for balancing the sample due to endogeneity. The output of the balanced sampling also allows pair-wise matching of an intervention and a counterfactual and this could be exploited for analysis if required.
Matching of counterfactual districts for malaria priority districts was attempted but, due to the systematic differences in the observable characteristics of malaria priority districts, this attempt was discarded. As malaria is associated with the jungle, there were no appropriate counterfactual districts to these.
GENERATING THE HEALTH FACILITY SAMPLING FRAMES AND SAMPLING HEALTH FACILITIES
District sample frames, health facility types included, and other instruments used are summarized in Table 1A-1 and Table 1A-2.
Within each district, health facilities were sampled by simple random sampling, with equal probability of sampling, regardless of catchment population, utilization, or the ‘size’ of the health facility (in terms of staff or financing).
Public Primary and Maternity Care Facilities: The sample frame for puskesmas was obtained from the dinkes. Polindes and poskesdes were treated as essentially the same facility type for the purposes of sampling and analysis. The sample frame for polindes/poskesdes was obtained from sampled puskesmas as these facilities form part of a ‘network’ under the puskesmas.
Generating the sample frame for private facilities (private MH and private primary care facilities, independently of each other) was challenging, as up-to-date, accurate, and complete information on private facilities was not consistently available at the district level. Although attempts were made to use methods described in an earlier study (Heywood and Harahap 2009a), these were insufficient to generate a reliable district-wide sample frame of private facilities.
Table 1A.1 District Sample Frames, Sampled Health Facility Types
District Sample Frame Puskesmas
Private Primary
Care
Public Maternity
Care
Private Maternity
CarePosyandu Private
HospitalsPublic
Hospitals
DKI Jakarta Yes Yes No No Yes No No
National nonDKI Jakarta Yes Yes No No Yes No No
Priority MH and counterfactual Yes No Yes Yes Yes No No
Priority HIV/AIDS/TB and counterfactual Yes Yes No No No Yes, see
noteYes, see
note
Priority Malaria Yes Yes No No No No No
Note Fewer than expected hospitals consented to be part of this survey and therefore: (i) representativeness at the district level for hospitals may be underpowered; and (ii) additional opportunistic samples of hospitals were taken from HIV/AIDS and TB priority districts that were included by chance into the overall sample of districts. District IDs for these districts are: 1871, 3171, 3174, 3175, 3204, 3578, and 9171. In these added districts, there was no attempt to sample an adequate number of hospitals to ensure representativeness at the district level.
72
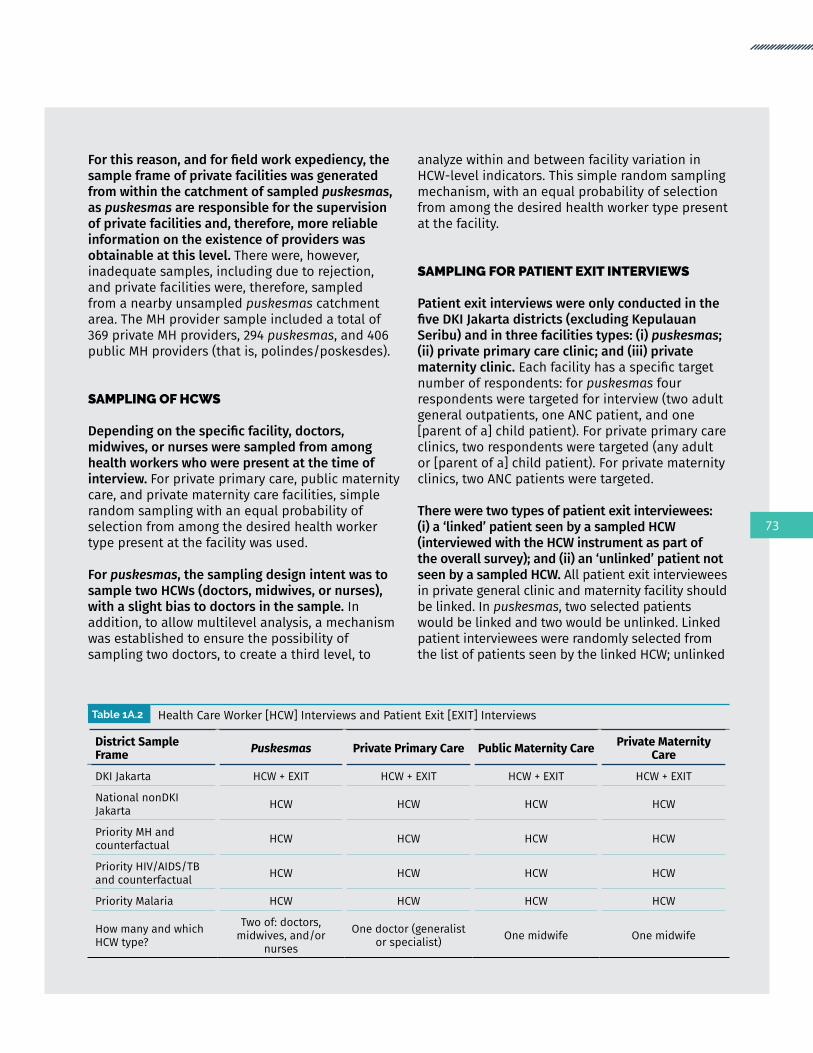
For this reason, and for field work expediency, the sample frame of private facilities was generated from within the catchment of sampled puskesmas, as puskesmas are responsible for the supervision of private facilities and, therefore, more reliable information on the existence of providers was obtainable at this level. There were, however, inadequate samples, including due to rejection, and private facilities were, therefore, sampled from a nearby unsampled puskesmas catchment area. The MH provider sample included a total of 369 private MH providers, 294 puskesmas, and 406 public MH providers (that is, polindes/poskesdes).
SAMPLING OF HCWS
Depending on the specific facility, doctors, midwives, or nurses were sampled from among health workers who were present at the time of interview. For private primary care, public maternity care, and private maternity care facilities, simple random sampling with an equal probability of selection from among the desired health worker type present at the facility was used.
For puskesmas, the sampling design intent was to sample two HCWs (doctors, midwives, or nurses), with a slight bias to doctors in the sample. In addition, to allow multilevel analysis, a mechanism was established to ensure the possibility of sampling two doctors, to create a third level, to
analyze within and between facility variation in HCW-level indicators. This simple random sampling mechanism, with an equal probability of selection from among the desired health worker type present at the facility.
SAMPLING FOR PATIENT EXIT INTERVIEWS
Patient exit interviews were only conducted in the five DKI Jakarta districts (excluding Kepulauan Seribu) and in three facilities types: (i) puskesmas; (ii) private primary care clinic; and (iii) private maternity clinic. Each facility has a specific target number of respondents: for puskesmas four respondents were targeted for interview (two adult general outpatients, one ANC patient, and one [parent of a] child patient). For private primary care clinics, two respondents were targeted (any adult or [parent of a] child patient). For private maternity clinics, two ANC patients were targeted.
There were two types of patient exit interviewees: (i) a ‘linked’ patient seen by a sampled HCW (interviewed with the HCW instrument as part of the overall survey); and (ii) an ‘unlinked’ patient not seen by a sampled HCW. All patient exit interviewees in private general clinic and maternity facility should be linked. In puskesmas, two selected patients would be linked and two would be unlinked. Linked patient interviewees were randomly selected from the list of patients seen by the linked HCW; unlinked
Table 1A.2 Health Care Worker [HCW] Interviews and Patient Exit [EXIT] Interviews
District Sample Frame Puskesmas Private Primary Care Public Maternity Care Private Maternity
Care
DKI Jakarta HCW + EXIT HCW + EXIT HCW + EXIT HCW + EXIT
National nonDKI Jakarta HCW HCW HCW HCW
Priority MH and counterfactual HCW HCW HCW HCW
Priority HIV/AIDS/TB and counterfactual HCW HCW HCW HCW
Priority Malaria HCW HCW HCW HCW
How many and which HCW type?
Two of: doctors, midwives, and/or
nurses
One doctor (generalist or specialist) One midwife One midwife
73

MATERNAL HEALTH REPORT . 2017Revealing the Missing Link
patient interviewees were randomly selected from the remaining list of patients not seen by the linked HCW. The interviews were conducted after the clinical encounter, at the patient’s house or in the facility/place preferred by the patient.
SAMPLE SIZE CALCULATIONS AND ASSUMPTIONS
The target number of facilities to be sampled within a sampled district was based on standard sample size calculations and assumptions used by WHO SARA (2013).
Analytical Methods Summary
SUPPLY-SIDE AND DEMAND-SIDE WEIGHTS
As the survey design is a two-level cluster survey, weights are needed to correct for the differential probability of a district and facility to be included in the sample from the overall sample frame. Depending on the choice of perspective, different weights may be applied. Supply-side weights provide an estimate of facility-level indicators from the perspective of the supply. If Indonesia has, for example, 100 health facilities in total, a supply-side weight would allow the estimate of the mean value for a specific indicator for facilities in Indonesia. Some facilities may, however, be remote and serve a limited population and hardly be utilized, yet would be weighted in the same way as a large and busy facility that serves a much larger population and is heavily utilized.
To construct such weights, the number of facilities in each district forms the basis of this weight. A further option is financing indicators–such as the total income or expenditure of a health facility–that can also be used to weight, depending on the intent of the desired indicator. Alternatively, the perspective of the potential (that is, proxied by the target population in the catchment area) or actual
user (that is, proxied by utilization of the relevant health service) may be more important to provide a picture of what would be the mean value for a specific facility-level indicator, as experienced or potentially experienced from the demand-side. This would answer the question of what would be the typical expected experience of a health facility by a user of the health facility. For the purposes of this survey, information was collected to allow the use of either weights, although for the purposes of the analysis, supply-side weights were generally used.
SERVICE READINESS INDICATORS
WHO’s SARA framework consists of multiple binary indicators (for example, the availability of specific drugs or equipment). These binary indicators are organized in two-dimensions: (i) the ‘service’ being provided (for example, general or specific service readiness for specific health services); and (ii) domains for staff and guidelines, equipment, diagnostics, and medicines and commodities. These indicators were contextualized with national guidelines as described in Appendix Two. It should be noted that these indicators are generally not comparable to the licensing and BPJS self-assessment list.
To collapse these multiple binary indicators, a simple unweighted mean is used. This methodology, suggested by WHO (2013), is also used in earlier SARA-related reports on Indonesia (World Bank 2014a), and more broadly in the published literature for similar surveys such as the Demographic and Health Survey–Service Provision Assessments (Kruk et al. 2016). A mean of 100 percent or 1 would imply that all the binary indicators are met. This simple unweighted mean can apply to a single facility and a simple mean of facility means can be used to compare groups of facilities (for example, private vs public, across time, and across geographical locations). A mean of 100 percent or 1 would imply that all facilities have met all the binary indicators.
74

HCW ABILITY
In addition to modules that included health worker demographics, workload, compensation, and training, the health worker survey instrument included seven different clinical vignettes. These were: (i) preventive child health (growth monitoring and immunization); (ii) curative child health; (iii) ANC; (iv) obstetrics (PPH); (iv) HIV/AIDS; (v) malaria; (vi) tuberculosis; and (vii) an NCD (hypertension). Not all cases were presented to all health workers.
Given the limitation of the survey whereby enumerators were not trained medical practitioners, clinical vignettes were used to assess provider ability. These clinical vignettes present the health worker with a written description of a clinical case, which is read out by the enumerator, and may include data analysis (in the form, for example, of growth charts and blood test results). To standardize the clinical context, the cases included an initial description of the facility and referral context including, where relevant, the expected equipment, medicines, and referral times.
To validate the responses provided by health workers, a panel of Indonesian clinical specialists in the relevant field was convened and the same case and responses posed to them. Using a modified Delphi technique to gain consensus, appropriate responses expected of a health worker in a local Indonesian setting were elicited and used for the analysis. As this MH policy paper was not intended as a detailed analysis of the health worker instrument, tracer question-response indicators were presented in Table 4-12 and Table 4-13, disaggregated by the health worker type and facility type.
The percentages for each question-response represent the mean of the binary mark, for the relevant health worker and facility type. Given the prevalence of dual practice, with the same health worker potentially working at both a public and private facility, health workers were analyzed from the patient’s perspective, according to the current facility that the health worker was sampled at. If a patient chose a private provider, what would be the provider ability expected from that encounter at that facility given that on occasion this may include a dual-practicing public provider; and vice versa. The analytical findings included in this MH policy paper are only a subset of the full health worker instrument, and further analysis of this instrument is possible.
PATIENT EXITS
The patient exit instrument included, inter alia, modules on the content of ANC services received by the patient and patient satisfaction. The simple unweighted mean of each of the responses for these modules are reported in Table 4-14 and Table 4-15, disaggregated according to the relevant facility type. Detailed analysis comparing various health worker types and formal analytic linkages with the exit surveys were envisioned when the survey was designed and is being considered for later products. For this specific piece on private sector service readiness, summary analysis of the health worker and patient exit instruments were added to contextualize the facility-level supply-side indicators.
75
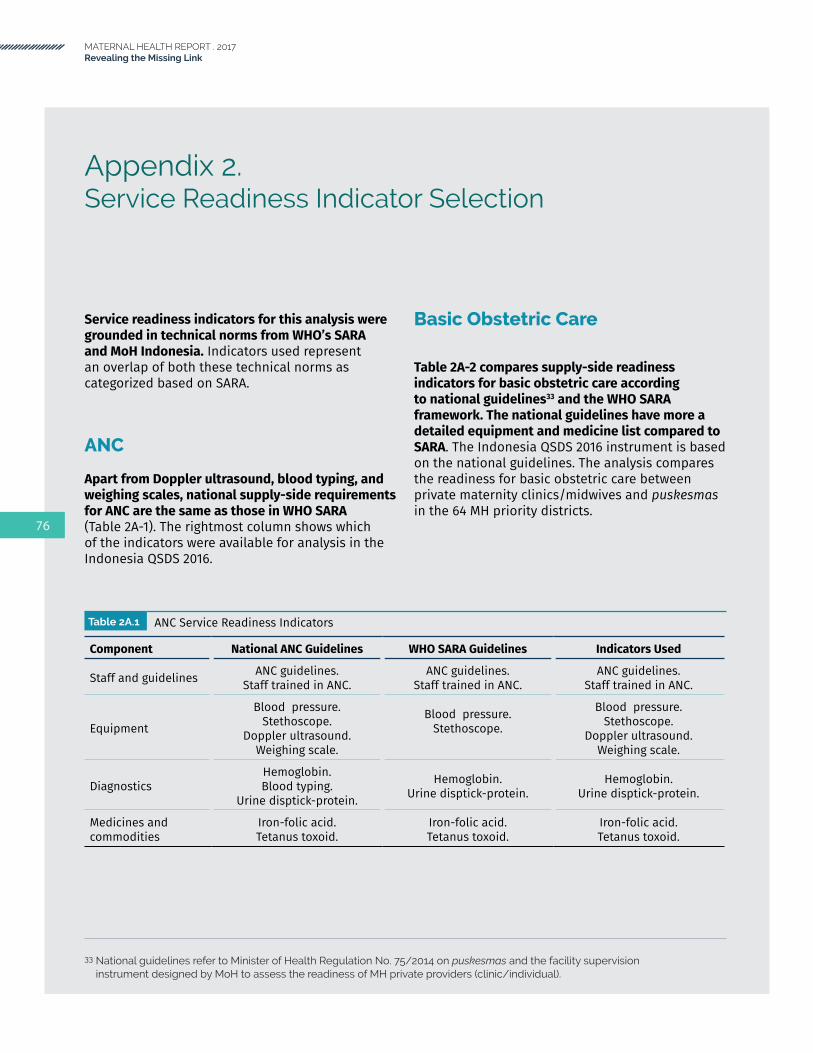
MATERNAL HEALTH REPORT . 2017Revealing the Missing Link
Appendix 2.Service Readiness Indicator Selection
Service readiness indicators for this analysis were grounded in technical norms from WHO’s SARA and MoH Indonesia. Indicators used represent an overlap of both these technical norms as categorized based on SARA.
ANC
Apart from Doppler ultrasound, blood typing, and weighing scales, national supply-side requirements for ANC are the same as those in WHO SARA (Table 2A-1). The rightmost column shows which of the indicators were available for analysis in the Indonesia QSDS 2016.
Basic Obstetric Care
Table 2A-2 compares supply-side readiness indicators for basic obstetric care according to national guidelines33 and the WHO SARA framework. The national guidelines have more a detailed equipment and medicine list compared to SARA. The Indonesia QSDS 2016 instrument is based on the national guidelines. The analysis compares the readiness for basic obstetric care between private maternity clinics/midwives and puskesmas in the 64 MH priority districts.
Table 2A.1 ANC Service Readiness Indicators
Component National ANC Guidelines WHO SARA Guidelines Indicators Used
Staff and guidelines ANC guidelines.Staff trained in ANC.
ANC guidelines.Staff trained in ANC.
ANC guidelines.Staff trained in ANC.
Equipment
Blood pressure.Stethoscope.
Doppler ultrasound.Weighing scale.
Blood pressure.Stethoscope.
Blood pressure.Stethoscope.
Doppler ultrasound.Weighing scale.
DiagnosticsHemoglobin.Blood typing.
Urine disptick-protein.
Hemoglobin.Urine disptick-protein.
Hemoglobin.Urine disptick-protein.
Medicines and commodities
Iron-folic acid.Tetanus toxoid.
Iron-folic acid.Tetanus toxoid.
Iron-folic acid.Tetanus toxoid.
33 National guidelines refer to Minister of Health Regulation No. 75/2014 on puskesmas and the facility supervision instrument designed by MoH to assess the readiness of MH private providers (clinic/individual).
76

Table 2A.2 ANC Service Readiness Indicators
Component National ANC Guidelines WHO SARA Guidelines Indicators Used
Staff and guidelines
• IMPAC guidelines.• Staff trained in IMPAC.
• Pocket book on maternal health care in primary and referral facilities.
• Training on assisted vaginal delivery.• Training on basic emergency
obstetric and neonatal life-saving skills.
• Training on management of asphyxia in neonates.
Equipment
• Obstetrics and Gynecology set (49 items). 34
• Infant resuscitation set (13 items). 35
• Emergency transport.• Examination light.• Delivery pack.• Suction apparatus.• Manual vacuum extractor.• Vacuum aspirator/dilation
and curettage (D&C) kit.• Neonatal bag and mask.• Partograph.• Gloves.
• Emergency transport.• Examination light.• Delivery bed.• Delivery pack.• Partograph.• Doppler ultrasound.• Manual vacuum extractor.• Vacuum aspirator or D&C kit.36
• Neonatal bag and mask.• Resuscitation table.• Incubator.• Disposable latex gloves.
Medicines and commodities
• Oral Ergometrine.• Ergometrine (injectable).• Oxytocin (injectable).• Magnesium sulphate (injectable).• Calcium gluconate (injectable).• Diazepam (injectable).• Oral antihypertensive drugs
(Methyldopa, Nifedipine)• Injectable antihypertensive drugs
(Labetalol, Hydralazine).• Injectable antibiotics (Ampicillin,
Gentamycin).• Metronidazole infusion. • Oral antibiotics (Amoxicillin).• Oral analgesics (Paracetamol,
Mefenamic acid). • Adrenalin (injectable).• Dexamethasone (injectable).• Intravenous solution (normal
saline, Ringer’s lactate).
• Antibiotic eye ointment for newborn.
• Injectable uterotonic (Oxytocin).
• Injectable antibiotic (broad spectrum, usually Gentamycin or Penicillin and Ampicillin).
• Magnesium sulphate (injectable).
• Diazepam (injectable). • Skin disinfectant.• Intravenous solution with
infusion set (normal saline or Ringer’s lactate, and Dextrose 5%).
• Antibiotic eye ointment for newborn.• Oral Ergometrine. • Ergometrine (injectable).• Oxytocin (injectable).• Magnesium sulphate (injectable).• Calcium gluconate (injectable).• Diazepam (injectable).• Oral antihypertensive drugs
(Methyldopa, Nifedipine)• Injectable antihypertensive drugs
(Labetalol, Hydralazine).• Injectable antibiotics (Ampicillin,
Gentamycin).• Metronidazole infusion. • Oral antibiotics (Amoxicillin).• Oral analgesics (Paracetamol,
Mefenamic acid). • Adrenalin (injectable).• Dexamethasone (injectable).• Intravenous solution (normal saline,
Ringer’s lactate).
34 Obstetrics and Gynecology set: instrument tray with cover (3 sizes), doppler, curved doyeri probe, adult endotracheal tubes (threesizes),scissors(fivetypes),forceps/clamps(seventypes),halogenexaminationlight,oxygenmaskandadultnasalcannula, instrument table, needle holder, obstetric pelvimeter, tweezers (three types), adult resuscitator, retractor, one half kocher forceps, scalpels (two types), Sims speculum (three sizes), grave speculum (three sizes), IV stand, adult stethoscope, fetoscope, endotracheal tube stylet, oxygen tank plus regulator, examination bed, delivery bed, adult sphygmomanometer, adult thermometer
35 Infant resuscitation set: portable baby suction pump, endotracheal tubes (4 sizes), infant T piece resuscitator with PEEP, infant T piece system, neonatal laryngoscope, resuscitation table with infant radiant warmer, oxygen concentrator, De Lee mucous suction, electric mucous suction pump, neonatal duplex stethoscope.
36 Although D&C kits are included in the WHO SARA instrument set, WHO no longer recommends the use of this sharp curettage routinely for surgical abortion.
77

MATERNAL HEALTH REPORT . 2017Revealing the Missing Link
Com
pone
ntTy
pe o
f Fac
ility
BA
SIC
AM
EN
ITIE
SEl
ectr
icity
(%
)W
ater
(%
)Pr
ivac
y Ro
om (%
)Sa
nita
tion
(%)
Com
mun
icat
ion
(%)
Com
pute
r with
in
tern
et (%
)Em
erge
ncy
tran
spor
tatio
n (%
)Ba
sic
Amen
ities
In
dex
(mea
n) (%
)Ba
sic
Amen
ities
In
dex
(all
met
) (%
)Nu
mbe
r of
faci
litie
s
MH
Prio
rity
Dist
rict
Pusk
esm
as10
096
5010
079
9590
8736
294
Pusk
esm
as-u
rban
100
9953
100
9398
8590
4222
8Pu
skes
mas
-rur
al10
090
4610
053
8910
083
2566
Polin
des
9665
4489
303
3652
140
6Po
linde
s-ur
ban
9672
4384
323
2651
215
4Po
linde
s-ru
ral
9663
4490
293
3852
125
2Pr
ivat
e M
H-Si
ngle
pro
vide
r10
091
5199
9312
5371
214
0Pr
ivat
e M
H-Si
ngle
pro
vide
r-ur
ban
100
9453
100
9311
5672
282
Priv
ate
MH-
Sing
le p
rovi
der-
rura
l10
089
4997
9213
5070
358
Priv
ate
MH-
Sing
le p
rovi
der-
BPJS
100
9361
9684
1551
714
50Pr
ivat
e M
H-Si
ngle
pro
vide
r-No
n BP
JS10
090
4710
097
1054
711
90Pr
ivat
e M
H-M
ultip
le p
rovi
der
100
9571
9991
2474
7919
229
Priv
ate
MH-
Mul
tiple
pro
vide
r-ur
ban
100
9869
100
9318
7078
1318
3Pr
ivat
e M
H-M
ultip
le p
rovi
der-
rura
l10
092
7397
8932
8080
2746
Priv
ate
MH-
Mul
tiple
pro
vide
r-BP
JS10
097
8210
098
4082
8638
88Pr
ivat
e M
H-M
ultip
le p
rovi
der-
Non
BPJS
100
9463
9886
1269
756
141
MH
Prio
rity
Dist
rict a
ll ty
pe fa
cilit
y98
8053
9462
1352
657
1069
Com
para
tor
Dist
rict
Pusk
esm
as10
096
6497
8387
8788
4719
3Pu
skes
mas
-urb
an10
099
6797
9392
8891
5413
0Pu
skes
mas
-rur
al99
8555
9750
7182
7722
63Po
linde
s87
7738
7221
126
460
241
Polin
des-
urba
n85
8648
7731
227
540
94Po
linde
s-ru
ral
8774
3570
170
2544
014
7Pr
ivat
e M
H-Si
ngle
pro
vide
r10
095
5894
806
6471
515
2Pr
ivat
e M
H-Si
ngle
pro
vide
r-ur
ban
100
100
6210
092
771
766
76Pr
ivat
e M
H-Si
ngle
pro
vide
r-ru
ral
100
9054
8867
557
665
76Pr
ivat
e M
H-Si
ngle
pro
vide
r-BP
JS10
095
6398
8512
7676
1143
Priv
ate
MH-
Sing
le p
rovi
der-
Non
BPJS
100
9555
9177
357
683
109
Priv
ate
MH-
Mul
tiple
pro
vide
r10
099
7110
086
1566
7710
134
Priv
ate
MH-
Mul
tiple
pro
vide
r-ur
ban
100
9975
100
9316
6478
1110
8Pr
ivat
e M
H-M
ultip
le p
rovi
der-
rura
l10
097
5610
057
1473
716
26Pr
ivat
e M
H-M
ultip
le p
rovi
der-
BPJS
100
9769
100
8426
6577
1651
Priv
ate
MH-
Mul
tiple
pro
vide
r-No
n BP
JS10
010
072
100
879
6776
683
MH
Prio
rity
Dist
rict a
ll ty
pe fa
cilit
y95
9054
8860
1152
647
720
Natio
nal
Natio
nal
9992
5297
6580
9383
3426
8Pu
skes
mas
-urb
an10
095
6999
8899
9893
5615
8Pu
skes
mas
-rur
al99
9040
9649
6690
7619
110
78
Ap
pe
nd
ix 3
.G
en
era
l Se
rvic
e R
ead
ine
ss: B
asic
Am
en
itie
s

Ap
pe
nd
ix 4
.G
en
era
l Se
rvic
e R
ead
ine
ss: B
asic
Eq
uip
me
nt
Com
pone
ntTy
pe o
f Fac
ility
BA
SIC
EQ
UIP
ME
NT
Adul
t sc
ale
(%)
Child
sca
le
(%)
Infa
nt
scal
e (%
)Th
erm
omet
er
(%)
Stet
hosc
ope
(%)
BP a
ppar
atus
(%
)Li
ght
sour
ce (%
)Ba
sic
Amen
ities
In
dex
(mea
n) (%
)Ba
sic
Amen
ities
In
dex
(all
met
) (%
)Nu
mbe
r of
faci
litie
s
MH
Prio
rity
Dist
rict
Pusk
esm
as98
8796
8983
9565
8846
294
Pusk
esm
as-u
rban
9885
9690
8393
5886
3922
8Pu
skes
mas
-rur
al99
9096
8883
9877
9058
66Po
linde
s90
6165
6869
8313
647
406
Priv
ate
MH-
Sing
le p
rovi
der
9458
7573
7294
6976
3814
0Pr
ivat
e M
H-Si
ngle
pro
vide
r-ur
ban
9544
6867
6397
7773
3482
Priv
ate
MH-
Sing
le p
rovi
der-
rura
l93
7281
7981
9161
7942
58Pr
ivat
e M
H-Si
ngle
pro
vide
r-BP
JS10
075
8683
9098
8988
5950
Priv
ate
MH-
Sing
le p
rovi
der-
Non
BPJS
9150
6968
6492
5970
2790
Priv
ate
MH-
Mul
tiple
pro
vide
r99
4887
7764
9673
7733
229
Priv
ate
MH-
Mul
tiple
pro
vide
r-ur
ban
9943
8373
6399
7676
3218
3Pr
ivat
e M
H-M
ultip
le p
rovi
der-
rura
l99
5591
8164
9268
7934
46Pr
ivat
e M
H-M
ultip
le p
rovi
der-
BPJS
9862
9081
6398
7881
4688
Priv
ate
MH-
Mul
tiple
pro
vide
r-No
n BP
JS99
3984
7464
9469
7523
141
MH
Prio
rity
Dist
rict a
ll ty
pe fa
cilit
y94
5774
7269
8944
7122
1069
Com
para
tor
Dist
rict
Pusk
esm
as96
8994
9289
9741
8530
193
Pusk
esm
as-u
rban
9894
9696
9198
3887
3113
0Pu
skes
mas
-rur
al89
7186
7780
9551
7825
63Po
linde
s81
6264
5570
7612
608
241
Priv
ate
MH-
Sing
le p
rovi
der
9662
7579
7894
6678
4015
2Pr
ivat
e M
H-Si
ngle
pro
vide
r-ur
ban
9558
7269
7294
7977
4476
Priv
ate
MH-
Sing
le p
rovi
der-
rura
l97
6578
8883
9554
8036
76Pr
ivat
e M
H-Si
ngle
pro
vide
r-BP
JS93
7484
8178
8977
8252
43Pr
ivat
e M
H-Si
ngle
pro
vide
r-No
n BP
JS97
5571
7877
9760
7734
109
Priv
ate
MH-
Mul
tiple
pro
vide
r98
6673
7369
9887
8153
134
Priv
ate
MH-
Mul
tiple
pro
vide
r-ur
ban
9763
7171
6998
9380
5410
8Pr
ivat
e M
H-M
ultip
le p
rovi
der-
rura
l10
078
8078
7110
064
8245
26Pr
ivat
e M
H-M
ultip
le p
rovi
der-
BPJS
9474
7780
7196
8682
5251
Priv
ate
MH-
Mul
tiple
pro
vide
r-No
n BP
JS10
061
8168
6810
088
7853
83M
H Pr
iorit
y Di
stric
t all
type
faci
lity
9164
7269
7389
5173
3172
0
Natio
nal
Natio
nal
9585
9387
8697
5986
3926
8Pu
skes
mas
-urb
an99
9196
9688
9849
8843
158
Pusk
esm
as-r
ural
9381
9281
8596
6785
3711
0
79

MATERNAL HEALTH REPORT . 2017Revealing the Missing Link
Ap
pe
nd
ix 5
.G
en
era
l Se
rvic
e R
ead
ine
ss: S
tan
dar
d P
reca
utio
ns
Com
pone
ntTy
pe o
f Fac
ility
ST
AN
DA
RD
PR
EC
AU
TIO
NS
Ster
ilize
r (%
)
Safe
fina
l di
spos
al fo
r sh
arps
(%)
Safe
fina
l di
spos
al fo
r in
fect
ious
w
aste
s (%
)
Appr
opria
te
stor
age
for
shar
ps w
aste
(%
)
Appr
opria
te
stor
age
for
infe
ctio
n w
aste
(%
)
Disi
nfec
tant
(%
)
Stan
dard
di
spos
able
(%
)
Hand
was
hing
(%
)Gl
oves
(%
)
Stan
dard
pr
ecau
tions
in
dex
(mea
n)
(%)
Stan
dard
pr
ecau
tions
in
dex
(all
met
) (%
)
Num
ber o
f fa
cilit
ies
MH
Prio
rity
Dist
rict
Pusk
esm
as88
9492
9060
8695
9695
8844
294
Pusk
esm
as-u
rban
8895
9690
6789
9496
9590
5122
8Pu
skes
mas
-rur
al87
9184
9047
8196
9694
8530
66Po
linde
s53
8680
7116
7589
6977
687
406
Priv
ate
MH-
Sing
le p
rovi
der
7393
8672
5686
9283
9382
2814
0Pr
ivat
e M
H-Si
ngle
pro
vide
r-ur
ban
7997
9275
5591
9282
9584
3582
Priv
ate
MH-
Sing
le p
rovi
der-
rura
l67
8881
6957
8293
8391
7921
58Pr
ivat
e M
H-Si
ngle
pro
vide
r-BP
JS76
100
8689
7089
9193
9888
3850
Priv
ate
MH-
Sing
le p
rovi
der-
Non
BPJS
7289
8763
5086
9378
9179
2290
Priv
ate
MH-
Mul
tiple
pro
vide
r87
8884
8049
9395
9395
8532
229
Priv
ate
MH-
Mul
tiple
pro
vide
r-ur
ban
8892
8579
5892
9593
9586
4018
3Pr
ivat
e M
H-M
ultip
le p
rovi
der-
rura
l85
8483
8237
9595
9295
8321
46Pr
ivat
e M
H-M
ultip
le p
rovi
der-
BPJS
8698
9596
5395
9897
9891
4188
Priv
ate
MH-
Mul
tiple
pro
vide
r-No
n BP
JS87
8377
6946
9293
9093
8125
141
MH
Prio
rity
Dist
rict a
ll ty
pe fa
cilit
y68
8883
7435
8392
8086
7720
1069
Com
para
tor
Dist
rict
Pusk
esm
as91
9094
9758
9197
9698
9044
193
Pusk
esm
as-u
rban
9698
9799
6395
9899
9994
5313
0Pu
skes
mas
-rur
al72
6382
8839
7692
8692
779
63Po
linde
s36
8885
6814
6384
5567
624
241
Priv
ate
MH-
Sing
le p
rovi
der
8683
8580
3988
9690
9482
2615
2Pr
ivat
e M
H-Si
ngle
pro
vide
r-ur
ban
9010
083
8748
9396
9695
8839
76Pr
ivat
e M
H-Si
ngle
pro
vide
r-ru
ral
8265
8673
3183
9685
9477
1576
Priv
ate
MH-
Sing
le p
rovi
der-
BPJS
9297
8976
5587
9197
9185
3943
Priv
ate
MH-
Sing
le p
rovi
der-
Non
BPJS
8376
8381
3188
9892
9681
2010
9Pr
ivat
e M
H-M
ultip
le p
rovi
der
9094
8486
6897
9797
9790
4713
4Pr
ivat
e M
H-M
ultip
le p
rovi
der-
urba
n94
9884
9472
9998
9899
9352
108
Priv
ate
MH-
Mul
tiple
pro
vide
r-ru
ral
7376
8658
4889
9292
9278
2526
Priv
ate
MH-
Mul
tiple
pro
vide
r-BP
JS89
9580
8668
9610
097
100
9044
51Pr
ivat
e M
H-M
ultip
le p
rovi
der-
Non
BPJS
9193
8787
6797
9497
9690
4983
MH
Prio
rity
Dist
rict a
ll ty
pe fa
cilit
y69
8885
7838
8192
8086
7724
720
Natio
nal
Natio
nal
8778
8689
4485
9590
9583
2926
8Pu
skes
mas
-urb
an94
9488
9656
9296
9598
9047
158
Pusk
esm
as-r
ural
8267
8583
3580
9486
9278
1511
0
80

Ap
pe
nd
ix 6
.G
en
era
l Se
rvic
e R
ead
ine
ss: D
iag
no
stic
Cap
acity
Com
pone
ntTy
pe o
f Fac
ility
DIA
GN
OS
TIC
CA
PA
CIT
Y
Hem
oglo
bin
(%)
Bloo
d gl
ucos
e (%
)M
alar
ia d
iagn
ostic
ca
paci
ty (%
)
Urin
e di
pstic
k pr
otei
n (%
)
Urin
e di
pstic
k gl
ucos
e (%
)
HIV
diag
nost
ic
capa
city
(RDT
ki
t) (%
)
Syph
illis
ra
pid
test
(%
)
Urin
e te
st fo
r pr
egna
ncy
(%)
Diag
nost
ic
Capa
city
Inde
x (m
ean)
(%)
Diag
nost
ic
Capa
city
Inde
x
(all
met
) (%
)
Num
ber o
f fa
cilit
ies
MH
Prio
rity
Dist
rict
Pusk
esm
as78
7644
7381
3524
8061
729
4Pu
skes
mas
-urb
an73
7227
6877
3522
7556
522
8Pu
skes
mas
-rur
al87
8477
8289
3426
8971
1166
Polin
des
5430
n.a
4951
n.a
n.a
7151
1540
6Pr
ivat
e M
H-Si
ngle
pro
vide
r56
63n.
a48
60n.
an.
a83
6227
140
Priv
ate
MH-
Sing
le p
rovi
der-
urba
n52
47n.
a50
60n.
an.
a82
5824
82Pr
ivat
e M
H-Si
ngle
pro
vide
r-ru
ral
5978
n.a
4561
n.a
n.a
8365
3058
Priv
ate
MH-
Sing
le p
rovi
der-
BPJS
8671
n.a
7481
n.a
n.a
9180
4850
Priv
ate
MH-
Sing
le p
rovi
der-
Non
BPJS
4059
n.a
3550
n.a
n.a
7953
1690
Priv
ate
MH-
Mul
tiple
pro
vide
r57
58n.
a52
56n.
an.
a79
6026
229
Priv
ate
MH-
Mul
tiple
pro
vide
r-ur
ban
5756
n.a
5655
n.a
n.a
7359
2318
3Pr
ivat
e M
H-M
ultip
le p
rovi
der-
rura
l57
61n.
a47
57n.
an.
a86
6131
46Pr
ivat
e M
H-M
ultip
le p
rovi
der-
BPJS
5660
n.a
5158
n.a
n.a
7760
3388
Priv
ate
MH-
Mul
tiple
pro
vide
r-No
n BP
JS57
57n.
a53
54n.
an.
a80
6022
141
MH
Prio
rity
Dist
rict a
ll ty
pe fa
cilit
y56
4744
5055
3524
7656
2110
69
Com
para
tor
Dist
rict
Pusk
esm
as78
7540
6877
4519
8160
619
3Pu
skes
mas
-urb
an79
7930
7180
5220
8262
613
0Pu
skes
mas
-rur
al76
5877
5568
2214
7856
563
Polin
des
2226
n.a
712
n.a
n.a
3621
224
1Pr
ivat
e M
H-Si
ngle
pro
vide
r54
47n.
a29
37n.
an.
a86
5013
152
Priv
ate
MH-
Sing
le p
rovi
der-
urba
n48
36n.
a25
30n.
an.
a82
4411
76Pr
ivat
e M
H-Si
ngle
pro
vide
r-ru
ral
5956
n.a
3344
n.a
n.a
8856
1676
Priv
ate
MH-
Sing
le p
rovi
der-
BPJS
5247
n.a
2133
n.a
n.a
8447
1143
Priv
ate
MH-
Sing
le p
rovi
der-
Non
BPJS
5547
n.a
3339
n.a
n.a
8652
1410
9Pr
ivat
e M
H-M
ultip
le p
rovi
der
6759
n.a
4650
n.a
n.a
8962
2813
4Pr
ivat
e M
H-M
ultip
le p
rovi
der-
urba
n70
58n.
a51
50n.
an.
a89
6429
108
Priv
ate
MH-
Mul
tiple
pro
vide
r-ru
ral
5564
n.a
2748
n.a
n.a
8957
2026
Priv
ate
MH-
Mul
tiple
pro
vide
r-BP
JS72
61n.
a44
43n.
an.
a89
6128
51Pr
ivat
e M
H-M
ultip
le p
rovi
der-
Non
BPJS
6358
n.a
4855
n.a
n.a
8963
2783
MH
Prio
rity
Dist
rict a
ll ty
pe fa
cilit
y47
4440
2734
4519
6943
1272
0
Natio
nal
Natio
nal
8280
7474
7938
2083
6610
268
Pusk
esm
as-u
rban
9589
6491
9156
3190
7616
158
Pusk
esm
as-r
ural
7474
8262
6925
1277
596
110
81
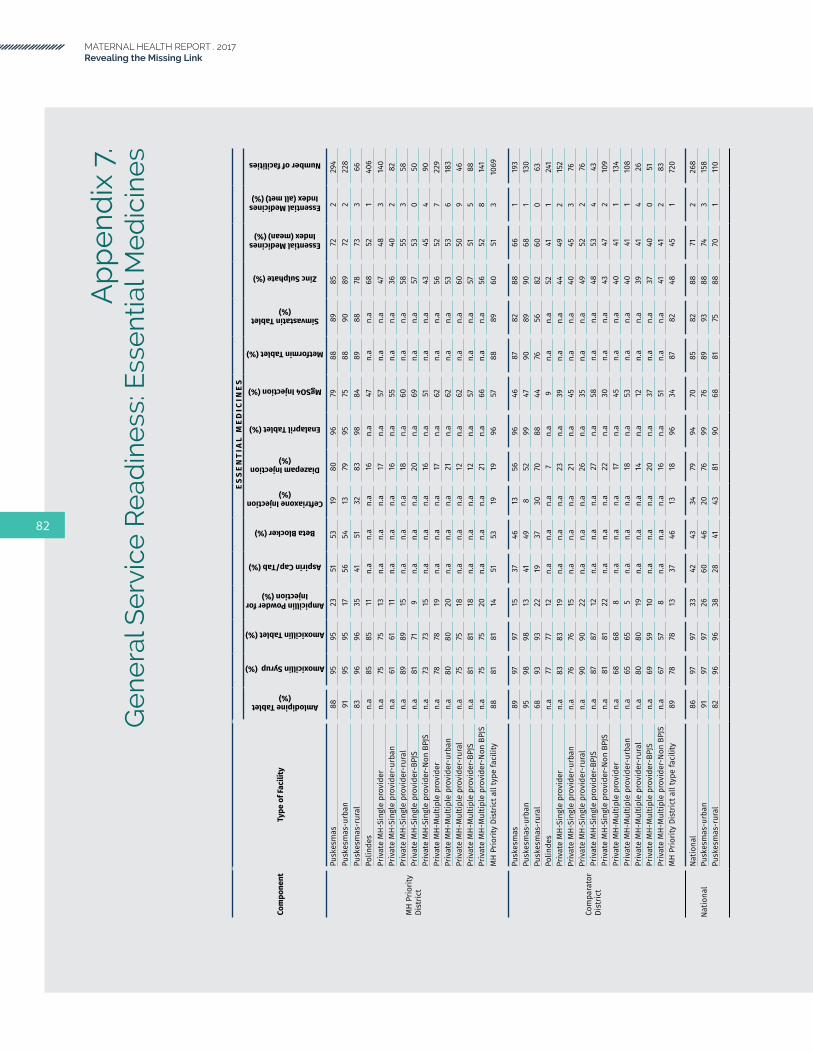
MATERNAL HEALTH REPORT . 2017Revealing the Missing Link
Ap
pe
nd
ix 7
.G
en
era
l Se
rvic
e R
ead
ine
ss: E
sse
ntia
l Me
dic
ine
s
Com
pone
ntTy
pe o
f Fac
ility
ES
SE
NT
IAL
ME
DIC
INE
S
Amlodipine Tablet (%)
Amoxicillin Syrup (%)
Amoxicillin Tablet (%)
Ampicillin Powder for Injection (%)
Aspirin Cap/Tab (%)
Beta Blocker (%)
Ceftriaxone Injection (%)
Diazepam Injection (%)
Enalapril Tablet (%)
MgSO4 Injection (%)
Metformin Tablet (%)
Simvastatin Tablet (%)
Zinc Sulphate (%)
Essential Medicines Index (mean) (%)
Essential Medicines Index (all met) (%)
Number of facilities
MH
Prio
rity
Dist
rict
Pusk
esm
as88
9595
2351
5319
8096
7988
8985
722
294
Pusk
esm
as-u
rban
9195
9517
5654
1379
9575
8890
8972
222
8Pu
skes
mas
-rur
al83
9696
3541
5132
8398
8489
8878
733
66Po
linde
sn.
a85
8511
n.a
n.a
n.a
16n.
a47
n.a
n.a
6852
140
6Pr
ivat
e M
H-Si
ngle
pro
vide
rn.
a75
7513
n.a
n.a
n.a
17n.
a57
n.a
n.a
4748
314
0Pr
ivat
e M
H-Si
ngle
pro
vide
r-ur
ban
n.a
6161
11n.
an.
an.
a16
n.a
55n.
an.
a36
402
82Pr
ivat
e M
H-Si
ngle
pro
vide
r-ru
ral
n.a
8989
15n.
an.
an.
a18
n.a
60n.
an.
a58
553
58Pr
ivat
e M
H-Si
ngle
pro
vide
r-BP
JSn.
a81
719
n.a
n.a
n.a
20n.
a69
n.a
n.a
5753
050
Priv
ate
MH-
Sing
le p
rovi
der-
Non
BPJS
n.a
7373
15n.
an.
an.
a16
n.a
51n.
an.
a43
454
90Pr
ivat
e M
H-M
ultip
le p
rovi
der
n.a
7878
19n.
an.
an.
a17
n.a
62n.
an.
a56
527
229
Priv
ate
MH-
Mul
tiple
pro
vide
r-ur
ban
n.a
8080
20n.
an.
an.
a21
n.a
62n.
an.
a53
536
183
Priv
ate
MH-
Mul
tiple
pro
vide
r-ru
ral
n.a
7575
18n.
an.
an.
a12
n.a
62n.
an.
a60
509
46Pr
ivat
e M
H-M
ultip
le p
rovi
der-
BPJS
n.a
8181
18n.
an.
an.
a12
n.a
57n.
an.
a57
515
88Pr
ivat
e M
H-M
ultip
le p
rovi
der-
Non
BPJS
n.a
7575
20n.
an.
an.
a21
n.a
66n.
an.
a56
528
141
MH
Prio
rity
Dist
rict a
ll ty
pe fa
cilit
y88
8181
1451
5319
1996
5788
8960
513
1069
Com
para
tor
Dist
rict
Pusk
esm
as89
9797
1537
4613
5696
4687
8288
661
193
Pusk
esm
as-u
rban
9598
9813
4149
852
9947
9089
9068
113
0Pu
skes
mas
-rur
al68
9393
2219
3730
7088
4476
5682
600
63Po
linde
sn.
a77
7712
n.a
n.a
n.a
7n.
a9
n.a
n.a
5241
124
1Pr
ivat
e M
H-Si
ngle
pro
vide
rn.
a83
8319
n.a
n.a
n.a
23n.
a39
n.a
n.a
4449
215
2Pr
ivat
e M
H-Si
ngle
pro
vide
r-ur
ban
n.a
7676
15n.
an.
an.
a21
n.a
45n.
an.
a40
453
76Pr
ivat
e M
H-Si
ngle
pro
vide
r-ru
ral
n.a
9090
22n.
an.
an.
a26
n.a
35n.
an.
a49
522
76Pr
ivat
e M
H-Si
ngle
pro
vide
r-BP
JSn.
a87
8712
n.a
n.a
n.a
27n.
a58
n.a
n.a
4853
443
Priv
ate
MH-
Sing
le p
rovi
der-
Non
BPJS
n.a
8181
22n.
an.
an.
a22
n.a
30n.
an.
a43
472
109
Priv
ate
MH-
Mul
tiple
pro
vide
rn.
a68
688
n.a
n.a
n.a
17n.
a45
n.a
n.a
4041
113
4Pr
ivat
e M
H-M
ultip
le p
rovi
der-
urba
nn.
a65
655
n.a
n.a
n.a
18n.
a53
n.a
n.a
4041
110
8Pr
ivat
e M
H-M
ultip
le p
rovi
der-
rura
ln.
a80
8019
n.a
n.a
n.a
14n.
a12
n.a
n.a
3941
426
Priv
ate
MH-
Mul
tiple
pro
vide
r-BP
JSn.
a69
5910
n.a
n.a
n.a
20n.
a37
n.a
n.a
3740
051
Priv
ate
MH-
Mul
tiple
pro
vide
r-No
n BP
JSn.
a67
578
n.a
n.a
n.a
16n.
a51
n.a
n.a
4141
283
MH
Prio
rity
Dist
rict a
ll ty
pe fa
cilit
y89
7878
1337
4613
1896
3487
8248
451
720
Natio
nal
Natio
nal
8697
9733
4243
3479
9470
8582
8871
226
8Pu
skes
mas
-urb
an91
9797
2660
4620
7699
7689
9388
743
158
Pusk
esm
as-r
ural
8296
9638
2841
4381
9068
8175
8870
111
0
82

Ap
pe
nd
ix 8
.G
en
era
l Se
rvic
e R
ead
ine
ss: O
vera
ll In
dex
Com
pone
ntTy
pe o
f Fac
ility
BASI
C AM
ENIT
IES
BASI
C EQ
UIPM
ENT
STAN
DARD
PR
ECAU
TIO
NDI
AGNO
STIC
CA
PACI
TYES
SENT
IAL
MED
ICIN
ESGE
NERA
L SE
RVIC
ESNu
mbe
r of f
acili
ties
Mea
n (%
)Al
l met
(%
)M
ean
(%)
All m
et
(%)
Mea
n (%
)Al
l met
(%
)M
ean
(%)
All m
et
(%)
Mea
n (%
)Al
l met
(%
)M
ean
(%)
All m
et
(%)
MH
Prio
rity
Dist
rict
Pusk
esm
as87
3688
4688
4461
772
279
039
4Pu
skes
mas
-urb
an90
4286
3990
5156
572
279
022
8Pu
skes
mas
-rur
al83
2590
5886
3071
1173
380
066
Polin
des
521
647
677
5115
521
570
406
Priv
ate
MH-
Sing
le p
rovi
der
712
7638
8228
6227
483
680
140
Priv
ate
MH-
Sing
le p
rovi
der-
urba
n72
273
3484
3558
2440
266
082
Priv
ate
MH-
Sing
le p
rovi
der-
rura
l70
379
4279
2165
3055
370
058
Priv
ate
MH-
Sing
le p
rovi
der-
BPJS
714
8859
8838
8048
531
760
50Pr
ivat
e M
H-Si
ngle
pro
vide
r-No
n BP
JS71
170
2779
2253
1645
464
090
Priv
ate
MH-
Mul
tiple
pro
vide
r79
1977
3385
3260
2652
771
022
9Pr
ivat
e M
H-M
ultip
le p
rovi
der-
urba
n78
1376
3286
4059
2353
671
018
3Pr
ivat
e M
H-M
ultip
le p
rovi
der-
rura
l80
2779
3483
2161
3150
971
046
Priv
ate
MH-
Mul
tiple
pro
vide
r-BP
JS86
3881
4691
4160
3351
574
088
Priv
ate
MH-
Mul
tiple
pro
vide
r-No
n BP
JS75
675
2381
2560
2252
869
014
1M
H Pr
iorit
y Di
stric
t all
type
faci
lity
657
7122
7720
5621
513
640
1069
Com
para
tor
Dist
rict
Pusk
esm
as88
4785
3090
4460
666
178
019
3Pu
skes
mas
-urb
an91
5487
3194
5362
668
180
013
0Pu
skes
mas
-rur
al77
2278
2577
956
560
070
063
Polin
des
460
608
624
212
411
460
241
Priv
ate
MH-
Sing
le p
rovi
der
815
7840
8226
5013
492
660
152
Priv
ate
MH-
Sing
le p
rovi
der-
urba
n76
677
4488
3944
1145
366
076
Priv
ate
MH-
Sing
le p
rovi
der-
rura
l66
580
3677
1556
1652
266
076
Priv
ate
MH-
Sing
le p
rovi
der-
BPJS
7611
8252
8539
4711
534
690
43Pr
ivat
e M
H-Si
ngle
pro
vide
r-No
n BP
JS68
377
3481
2052
1447
265
010
9Pr
ivat
e M
H-M
ultip
le p
rovi
der
7710
8153
9047
6228
411
700
134
Priv
ate
MH-
Mul
tiple
pro
vide
r-ur
ban
7811
8054
9352
6429
411
710
108
Priv
ate
MH-
Mul
tiple
pro
vide
r-ru
ral
716
8245
7825
5720
414
660
26Pr
ivat
e M
H-M
ultip
le p
rovi
der-
BPJS
7716
8252
9044
6128
400
700
51Pr
ivat
e M
H-M
ultip
le p
rovi
der-
Non
BPJS
766
7953
9049
6327
412
700
83M
H Pr
iorit
y Di
stric
t all
type
faci
lity
647
7331
7724
4312
451
610
720
Natio
nal
Natio
nal
8334
8639
8329
6610
712
780
268
Pusk
esm
as-u
rban
9356
8843
9047
7616
743
840
158
Pusk
esm
as-r
ural
7619
8537
7815
596
701
740
110
83
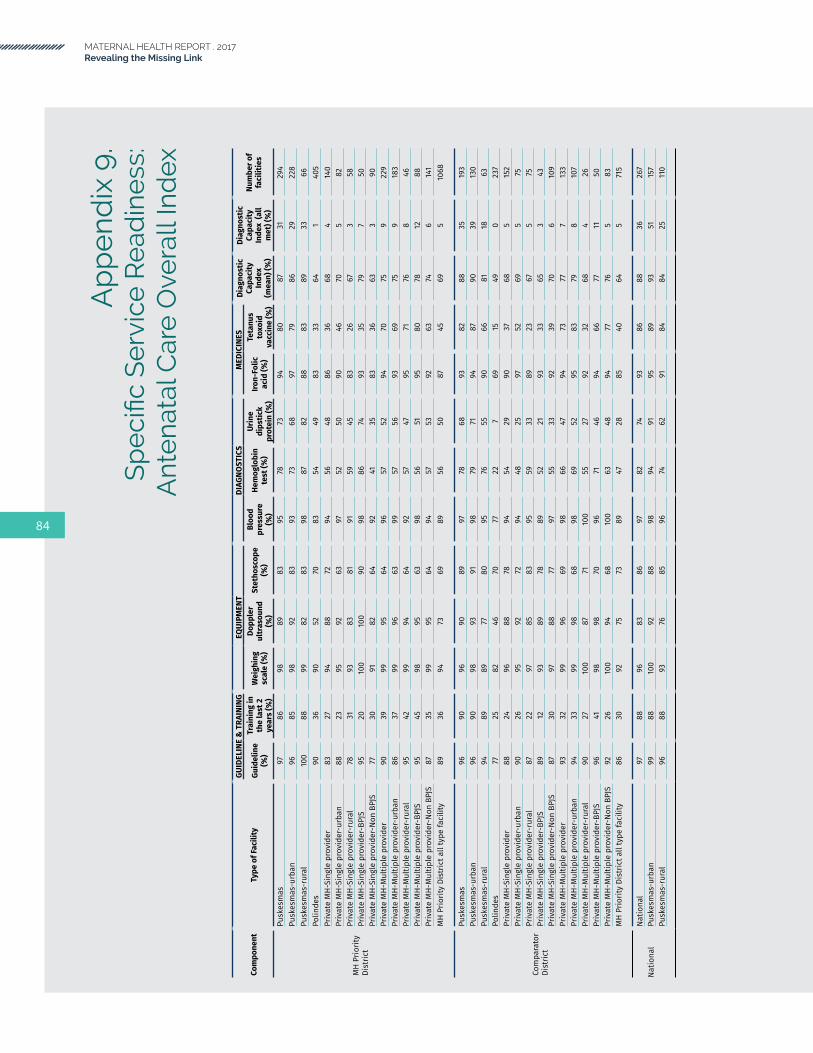
MATERNAL HEALTH REPORT . 2017Revealing the Missing Link
Ap
pe
nd
ix 9
.S
pe
cific
Se
rvic
eR
ead
ine
ss:
Ant
en
atal
Car
e O
vera
ll In
dex
Com
pone
ntTy
pe o
f Fac
ility
GUID
ELIN
E &
TRA
ININ
GEQ
UIPM
ENT
DIAG
NOST
ICS
MED
ICIN
ESDi
agno
stic
Ca
paci
ty
Inde
x (m
ean)
(%)
Diag
nost
ic
Capa
city
In
dex
(all
met
) (%
)
Num
ber o
f fa
cilit
ies
Guid
elin
e (%
)
Trai
ning
in
the
last
2
year
s (%
)
Wei
ghin
g sc
ale
(%)
Dopp
ler
ultr
asou
nd
(%)
Stet
hosc
ope
(%)
Bloo
d pr
essu
re
(%)
Hem
oglo
bin
test
(%)
Urin
e di
pstic
k pr
otei
n (%
)
Iron-
Folic
ac
id (%
)
Teta
nus
toxo
id
vacc
ine
(%)
MH
Prio
rity
Dist
rict
Pusk
esm
as97
8698
8983
9578
7394
8087
3129
4Pu
skes
mas
-urb
an96
8598
9283
9373
6897
7986
2922
8Pu
skes
mas
-rur
al10
088
9982
8398
8782
8883
8933
66Po
linde
s90
3690
5270
8354
4983
3364
140
5Pr
ivat
e M
H-Si
ngle
pro
vide
r83
2794
8872
9456
4886
3668
414
0Pr
ivat
e M
H-Si
ngle
pro
vide
r-ur
ban
8823
9592
6397
5250
9046
705
82Pr
ivat
e M
H-Si
ngle
pro
vide
r-ru
ral
7831
9383
8191
5945
8326
673
58Pr
ivat
e M
H-Si
ngle
pro
vide
r-BP
JS95
2010
010
090
9886
7493
3579
750
Priv
ate
MH-
Sing
le p
rovi
der-
Non
BPJS
7730
9182
6492
4135
8336
633
90Pr
ivat
e M
H-M
ultip
le p
rovi
der
9039
9995
6496
5752
9470
759
229
Priv
ate
MH-
Mul
tiple
pro
vide
r-ur
ban
8637
9996
6399
5756
9369
759
183
Priv
ate
MH-
Mul
tiple
pro
vide
r-ru
ral
9542
9994
6492
5747
9571
768
46Pr
ivat
e M
H-M
ultip
le p
rovi
der-
BPJS
9545
9895
6398
5651
9580
7812
88Pr
ivat
e M
H-M
ultip
le p
rovi
der-
Non
BPJS
8735
9995
6494
5753
9263
746
141
MH
Prio
rity
Dist
rict a
ll ty
pe fa
cilit
y89
3694
7369
8956
5087
4569
510
68
Com
para
tor
Dist
rict
Pusk
esm
as96
9096
9089
9778
6893
8288
3519
3Pu
skes
mas
-urb
an96
9098
9391
9879
7194
8790
3913
0Pu
skes
mas
-rur
al94
8989
7780
9576
5590
6681
1863
Polin
des
7725
8246
7077
227
6915
490
237
Priv
ate
MH-
Sing
le p
rovi
der
8824
9688
7894
5429
9037
685
152
Priv
ate
MH-
Sing
le p
rovi
der-
urba
n90
2695
9272
9448
2597
5269
575
Priv
ate
MH-
Sing
le p
rovi
der-
rura
l87
2297
8583
9559
3389
2367
575
Priv
ate
MH-
Sing
le p
rovi
der-
BPJS
8912
9389
7889
5221
9333
653
43Pr
ivat
e M
H-Si
ngle
pro
vide
r-No
n BP
JS87
3097
8877
9755
3392
3970
610
9Pr
ivat
e M
H-M
ultip
le p
rovi
der
9332
9996
6998
6647
9473
777
133
Priv
ate
MH-
Mul
tiple
pro
vide
r-ur
ban
9433
9998
6898
6952
9583
798
107
Priv
ate
MH-
Mul
tiple
pro
vide
r-ru
ral
9027
100
8771
100
5527
9232
684
26Pr
ivat
e M
H-M
ultip
le p
rovi
der-
BPJS
9641
9898
7096
7146
9466
7711
50Pr
ivat
e M
H-M
ultip
le p
rovi
der-
Non
BPJS
9226
100
9468
100
6348
9477
765
83M
H Pr
iorit
y Di
stric
t all
type
faci
lity
8630
9275
7389
4728
8540
645
715
Natio
nal
Natio
nal
9788
9683
8697
8274
9386
8836
267
Pusk
esm
as-u
rban
9988
100
9288
9894
9195
8993
5115
7Pu
skes
mas
-rur
al96
8893
7685
9674
6291
8484
2511
0
84

Ap
pe
nd
ix 1
0.
Sp
eci
ficS
erv
ice
Re
adin
ess
:B
asic
Ob
ste
tric
Car
e G
uid
elin
es
and
Tra
inin
g
Com
pone
ntTy
pe o
f Fac
ility
STAF
F IT
EMS
(GU
IDEL
INE
& T
RAIN
ING
) ITE
MS
Num
ber o
f fac
ilitie
sGu
idel
ine
(%)
Trai
ning
in th
e la
st 2
yea
rs (%
)
MH
Prio
rity
Dist
rict
Pusk
esm
as65
9315
1Pu
skes
mas
-urb
an67
9391
Pusk
esm
as-r
ural
6393
60Po
linde
s27
6115
6Pr
ivat
e M
H-Si
ngle
pro
vide
r41
4213
9Pr
ivat
e M
H-Si
ngle
pro
vide
r-ur
ban
4639
82Pr
ivat
e M
H-Si
ngle
pro
vide
r-ru
ral
3545
57Pr
ivat
e M
H-Si
ngle
pro
vide
r-BP
JS53
3750
Priv
ate
MH-
Sing
le p
rovi
der-
Non
BPJS
3544
89Pr
ivat
e M
H-M
ultip
le p
rovi
der
4171
228
Priv
ate
MH-
Mul
tiple
pro
vide
r-ur
ban
3762
183
Priv
ate
MH-
Mul
tiple
pro
vide
r-ru
ral
4582
45Pr
ivat
e M
H-M
ultip
le p
rovi
der-
BPJS
4483
88Pr
ivat
e M
H-M
ultip
le p
rovi
der-
Non
BPJS
3862
140
MH
Prio
rity
Dist
rict a
ll ty
pe fa
cilit
y37
6067
4
Com
para
tor D
istr
ict
Pusk
esm
as67
7811
0Pu
skes
mas
-urb
an78
7559
Pusk
esm
as-r
ural
4585
51Po
linde
s24
4413
2Pr
ivat
e M
H-Si
ngle
pro
vide
r37
3015
2Pr
ivat
e M
H-Si
ngle
pro
vide
r-ur
ban
3635
76Pr
ivat
e M
H-Si
ngle
pro
vide
r-ru
ral
3825
76Pr
ivat
e M
H-Si
ngle
pro
vide
r-BP
JS27
3843
Priv
ate
MH-
Sing
le p
rovi
der-
Non
BPJS
4226
109
Priv
ate
MH-
Mul
tiple
pro
vide
r47
5713
3Pr
ivat
e M
H-M
ultip
le p
rovi
der-
urba
n45
6010
8Pr
ivat
e M
H-M
ultip
le p
rovi
der-
rura
l54
4425
Priv
ate
MH-
Mul
tiple
pro
vide
r-BP
JS53
6251
Priv
ate
MH-
Mul
tiple
pro
vide
r-No
n BP
JS43
5382
MH
Prio
rity
Dist
rict a
ll ty
pe fa
cilit
y38
4352
7
Natio
nal
Natio
nal
5982
181
Pusk
esm
as-u
rban
6998
86Pu
skes
mas
-rur
al56
7695
85

MATERNAL HEALTH REPORT . 2017Revealing the Missing Link
Ap
pe
nd
ix 1
1.S
pe
cific
Se
rvic
eR
ead
ine
ss:
Bas
ic O
bst
etr
ic C
are
Eq
uip
me
nt
Com
pone
ntTy
pe o
f Fac
ility
EQ
UIP
ME
NT
IT
EM
S
Num
ber
of
faci
litie
s
Emergency transportation
(%)
Examination light (%)
Delivery bed (%)
Delivery pack (%)
Partograph (%)
Doppler ultrasound (%)
Manual vacuum extracttor (%)
Vacuum aspirator or D&C kit (%)
Neonatal bag and mask (%)
Resuscitation table (%)
Incubator (%)
Sterilizer (%)
Suction apparatus
(mucus extractor) (%)
Infant weighting scale
(%)
Blood pressure apparatus (%)
MH
Prio
rity
Dist
rict
Pusk
esm
as99
9085
6880
9122
1364
5344
9239
9595
151
Pusk
esm
as-u
rban
9994
7968
7895
2112
6151
5090
3994
9291
Pusk
esm
as-r
ural
100
8592
6882
8722
1367
5637
9540
9798
60Po
linde
s45
2888
2277
613
128
196
733
7594
156
Priv
ate
MH-
Sing
le p
rovi
der
2569
8926
8088
12
5449
2175
1675
9413
9Pr
ivat
e M
H-Si
ngle
pro
vide
r-ur
ban
2977
9238
8692
03
4645
2282
1568
9782
Priv
ate
MH-
Sing
le p
rovi
der-
rura
l22
6286
1574
731
062
5320
6816
8291
57Pr
ivat
e M
H-Si
ngle
pro
vide
r-BP
JS18
8998
2494
100
20
6874
3376
2086
9850
Priv
ate
MH-
Sing
le p
rovi
der-
Non
BPJS
2960
8528
7381
02
4737
1575
1470
9289
Priv
ate
MH-
Mul
tiple
pro
vide
r59
7397
5986
953
361
6125
8818
8796
228
Priv
ate
MH-
Mul
tiple
pro
vide
r-ur
ban
6376
9862
8396
63
7066
2789
1883
9918
3Pr
ivat
e M
H-M
ultip
le p
rovi
der-
rura
l55
6997
5690
950
350
5422
8718
9192
45Pr
ivat
e M
H-M
ultip
le p
rovi
der-
BPJS
7978
9881
9795
31
6870
2987
2190
9888
Priv
ate
MH-
Mul
tiple
pro
vide
r-No
n BP
JS46
7097
4579
954
456
5422
8916
8494
140
MH
Prio
rity
Dist
rict a
ll ty
pe fa
cilit
y46
5892
3881
823
249
4418
8013
8095
674
Com
para
tor
Dist
rict
Pusk
esm
as91
8073
7085
8618
1054
4133
9128
9297
110
Pusk
esm
as-u
rban
9588
7085
9091
1610
5944
3595
2295
9759
Pusk
esm
as-r
ural
8264
7942
7676
219
4537
3084
7287
9651
Polin
des
2122
6720
6765
20
265
358
466
8013
2Pr
ivat
e M
H-Si
ngle
pro
vide
r25
6679
3085
882
143
4417
8710
7594
152
Priv
ate
MH-
Sing
le p
rovi
der-
urba
n38
7990
4686
924
244
5017
9215
7294
76Pr
ivat
e M
H-Si
ngle
pro
vide
r-ru
ral
1254
7017
8485
00
4338
1782
678
9576
Priv
ate
MH-
Sing
le p
rovi
der-
BPJS
3677
9137
9389
51
5057
2592
1284
8943
Priv
ate
MH-
Sing
le p
rovi
der-
Non
BPJS
1960
7427
8288
01
4037
1484
971
9710
9Pr
ivat
e M
H-M
ultip
le p
rovi
der
5588
9566
9394
44
6375
3292
3473
9813
3Pr
ivat
e M
H-M
ultip
le p
rovi
der-
urba
n55
9397
7297
965
566
8536
9535
7198
108
Priv
ate
MH-
Mul
tiple
pro
vide
r-ru
ral
5466
8843
7786
00
5136
1580
3079
100
25Pr
ivat
e M
H-M
ultip
le p
rovi
der-
BPJS
5486
9258
9294
23
6477
3391
3177
9651
Priv
ate
MH-
Mul
tiple
pro
vide
r-No
n BP
JS55
8997
7294
946
563
7431
9336
7010
082
MH
Prio
rity
Dist
rict a
ll ty
pe fa
cilit
y35
6281
4083
843
246
4419
8217
7392
527
Natio
nal
Natio
nal
9079
9163
8578
154
6243
5490
8737
9318
1Pu
skes
mas
-urb
an96
8491
6997
8713
265
5671
9793
4396
86Pu
skes
mas
-rur
al88
7791
6080
7515
561
3848
8786
3591
95
86

Ap
pe
nd
ix 1
2.S
pe
cific
Se
rvic
eR
ead
ine
ss:
Bas
ic O
bst
etr
ic C
are
Me
dic
ine
s an
d C
om
mo
diti
es
Com
pone
ntTy
pe o
f Fac
ility
ME
DIC
INE
S &
CO
MM
OD
ITIE
S I
TE
MS
Num
ber
of
faci
litie
sGloves (%)
Soap and running water or alcohol based hand rub
(%)
Ergometrine (oral) (%)
Ergometrine (injectable) (%)
Oxytocin (injectable) (%)
MgSO4 (injectable) (%)
Calcium gluconate (injectable) (%)
Diazepam (injectable) (%)
Oral Antihypertensive
drugs (%)
Injectables antibiotics (%)
Metronidazole infusion (%)
Oral antibiotics (%)
Oral analgesics (%)
Adrenalin (injectable) (%)
Dexamethasone (injectable) (%)
Intravenous solution (normal)
saline (%)
Vitamin K (injectable) (%)
Skin disinfectant (%)
Antibiotics Eye ointment (%)
MH
Prio
rity
Dist
rict
Pusk
esm
as89
9782
8288
7443
6681
4342
9593
6972
9892
9490
151
Pusk
esm
as-u
rban
8797
8184
9069
4868
8540
4094
9476
7197
9395
9191
Pusk
esm
as-r
ural
9197
8381
8681
3863
7647
4595
9260
7399
9292
8960
Polin
des
8785
n.a
5788
4416
n.a
68n.
an.
a91
93n.
a78
9073
9690
156
Priv
ate
MH-
Sing
le p
rovi
der
8688
n.a
5585
5530
n.a
64n.
an.
a75
78n.
a56
9173
9287
139
Priv
ate
MH-
Sing
le p
rovi
der-
urba
n89
87n.
a50
9052
30n.
a60
n.a
n.a
6167
n.a
4592
7691
8682
Priv
ate
MH-
Sing
le p
rovi
der-
rura
l83
90n.
a60
8057
29n.
a69
n.a
n.a
8989
n.a
6790
7192
8857
Priv
ate
MH-
Sing
le p
rovi
der-
BPJS
9493
n.a
5289
6936
n.a
60n.
an.
a81
85n.
a59
9373
9588
50Pr
ivat
e M
H-Si
ngle
pro
vide
r-No
n BP
JS82
86n.
a56
8348
26n.
a67
n.a
n.a
7274
n.a
5590
7390
8889
Priv
ate
MH-
Mul
tiple
pro
vide
r94
95n.
a64
8961
22n.
a79
n.a
n.a
7782
n.a
4795
7792
8222
8Pr
ivat
e M
H-M
ultip
le p
rovi
der-
urba
n93
95n.
a60
8560
23n.
a79
n.a
n.a
8081
n.a
4894
8490
8218
3Pr
ivat
e M
H-M
ultip
le p
rovi
der-
rura
l95
95n.
a69
9262
21n.
a80
n.a
n.a
7584
n.a
4795
6795
8245
Priv
ate
MH-
Mul
tiple
pro
vide
r-BP
JS98
98n.
a60
9056
21n.
a77
n.a
n.a
8184
n.a
4291
7490
8988
Priv
ate
MH-
Mul
tiple
pro
vide
r-No
n BP
JS91
93n.
a66
8764
23n.
a81
n.a
n.a
7580
n.a
5197
7893
7814
0M
H Pr
iorit
y Di
stric
t all
type
faci
lity
8990
8260
8754
2366
7243
4281
8569
6092
7593
8667
4
Com
para
tor
Dist
rict
Pusk
esm
as90
9560
7770
3522
5677
2831
9495
5959
9675
9689
110
Pusk
esm
as-u
rban
9499
5374
6138
2453
8521
2595
9664
5095
7394
9059
Pusk
esm
as-r
ural
8386
7383
8629
1963
6140
4294
9449
7510
079
100
8751
Polin
des
7565
n.a
3961
64
n.a
43n.
an.
a81
88n.
a42
7446
8473
132
Priv
ate
MH-
Sing
le p
rovi
der
9093
n.a
6090
357
n.a
70n.
an.
a83
81n.
a50
9569
9581
152
Priv
ate
MH-
Sing
le p
rovi
der-
urba
n89
96n.
a56
9241
10n.
a78
n.a
n.a
7674
n.a
4496
7295
7976
Priv
ate
MH-
Sing
le p
rovi
der-
rura
l90
89n.
a63
8830
5n.
a62
n.a
n.a
9088
n.a
5695
6695
8376
Priv
ate
MH-
Sing
le p
rovi
der-
BPJS
8587
n.a
6093
475
n.a
70n.
an.
a87
84n.
a59
9864
9585
43Pr
ivat
e M
H-Si
ngle
pro
vide
r-No
n BP
JS92
95n.
a59
8830
9n.
a70
n.a
n.a
8180
n.a
4594
7195
7910
9Pr
ivat
e M
H-M
ultip
le p
rovi
der
9699
n.a
5292
4414
n.a
78n.
an.
a68
70n.
a49
9486
9793
133
Priv
ate
MH-
Mul
tiple
pro
vide
r-ur
ban
9798
n.a
5694
5116
n.a
81n.
an.
a65
67n.
a51
9692
9894
108
Priv
ate
MH-
Mul
tiple
pro
vide
r-ru
ral
9110
0n.
a38
8612
7n.
a62
n.a
n.a
7980
n.a
4186
6191
8625
Priv
ate
MH-
Mul
tiple
pro
vide
r-BP
JS98
100
n.a
5793
357
n.a
84n.
an.
a69
78n.
a61
9281
9896
51Pr
ivat
e M
H-M
ultip
le p
rovi
der-
Non
BPJS
9498
n.a
4991
5019
n.a
73n.
an.
a66
65n.
a41
9589
9691
82M
H Pr
iorit
y Di
stric
t all
type
faci
lity
8888
6053
8331
956
6628
3178
8059
4890
6993
8352
7
Natio
nal
Natio
nal
9790
7582
8263
2870
8353
3697
9666
8610
092
9894
181
Pusk
esm
as-u
rban
100
9474
8376
7551
6882
4941
100
9687
8810
088
100
9286
Pusk
esm
as-r
ural
9689
7681
8558
1971
8355
3496
9658
8510
094
9894
95
87
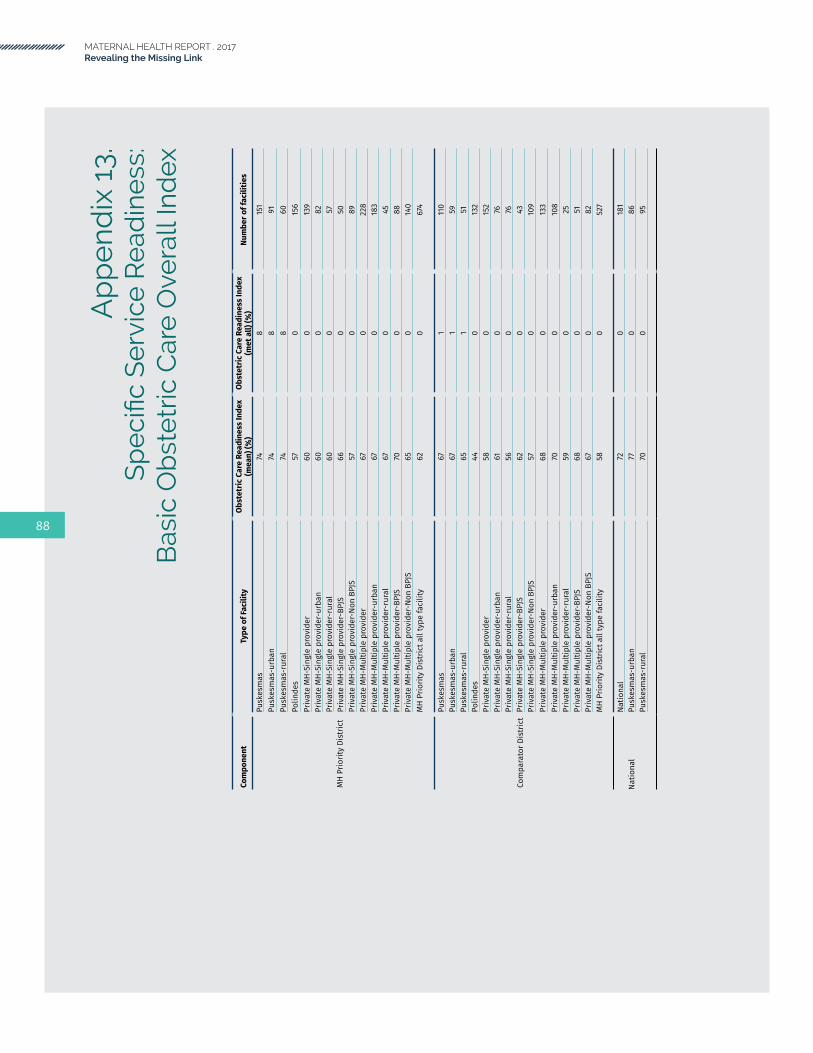
MATERNAL HEALTH REPORT . 2017Revealing the Missing Link
Ap
pe
nd
ix 1
3.S
pe
cific
Se
rvic
eR
ead
ine
ss:
Bas
ic O
bst
etr
ic C
are
Ove
rall
Ind
ex
Com
pone
ntTy
pe o
f Fac
ility
Obst
etric
Car
e Re
adin
ess
Inde
x (m
ean)
(%)
Obst
etric
Car
e Re
adin
ess
Inde
x (m
et a
ll) (%
)Nu
mbe
r of f
acili
ties
MH
Prio
rity
Dist
rict
Pusk
esm
as74
815
1Pu
skes
mas
-urb
an74
891
Pusk
esm
as-r
ural
748
60Po
linde
s57
015
6Pr
ivat
e M
H-Si
ngle
pro
vide
r60
013
9Pr
ivat
e M
H-Si
ngle
pro
vide
r-ur
ban
600
82Pr
ivat
e M
H-Si
ngle
pro
vide
r-ru
ral
600
57Pr
ivat
e M
H-Si
ngle
pro
vide
r-BP
JS66
050
Priv
ate
MH-
Sing
le p
rovi
der-
Non
BPJS
570
89Pr
ivat
e M
H-M
ultip
le p
rovi
der
670
228
Priv
ate
MH-
Mul
tiple
pro
vide
r-ur
ban
670
183
Priv
ate
MH-
Mul
tiple
pro
vide
r-ru
ral
670
45Pr
ivat
e M
H-M
ultip
le p
rovi
der-
BPJS
700
88Pr
ivat
e M
H-M
ultip
le p
rovi
der-
Non
BPJS
650
140
MH
Prio
rity
Dist
rict a
ll ty
pe fa
cilit
y62
067
4
Com
para
tor D
istr
ict
Pusk
esm
as67
111
0Pu
skes
mas
-urb
an67
159
Pusk
esm
as-r
ural
651
51Po
linde
s44
013
2Pr
ivat
e M
H-Si
ngle
pro
vide
r58
015
2Pr
ivat
e M
H-Si
ngle
pro
vide
r-ur
ban
610
76Pr
ivat
e M
H-Si
ngle
pro
vide
r-ru
ral
560
76Pr
ivat
e M
H-Si
ngle
pro
vide
r-BP
JS62
043
Priv
ate
MH-
Sing
le p
rovi
der-
Non
BPJS
570
109
Priv
ate
MH-
Mul
tiple
pro
vide
r68
013
3Pr
ivat
e M
H-M
ultip
le p
rovi
der-
urba
n70
010
8Pr
ivat
e M
H-M
ultip
le p
rovi
der-
rura
l59
025
Priv
ate
MH-
Mul
tiple
pro
vide
r-BP
JS68
051
Priv
ate
MH-
Mul
tiple
pro
vide
r-No
n BP
JS67
082
MH
Prio
rity
Dist
rict a
ll ty
pe fa
cilit
y58
052
7
Natio
nal
Natio
nal
720
181
Pusk
esm
as-u
rban
770
86Pu
skes
mas
-rur
al70
095
88

89

MATERNAL HEALTH REPORT . 2017Revealing the Missing Link
Achadi, E., S. Scott, E.S. Pambudi, K. Makowiecka, T. Marshall, A. Adisasmita, P.E. Deviany, and C. Ronsmans. 2007. “Midwifery provision and uptake of maternity care in Indonesia.” Tropical Medicine and International Health 12(12): 1490-7.
Achadi, E.L., A. Achadi, E. Pambudi, and P. Marzoeki. 2014. “A Study on the Implementation of Jampersal Policy in Indonesia.” Washington DC: The World Bank.
Bappenas. 2015. “National Medium-term Development Plan 2015-2019 (RPJMN 2015-2019).” Kementerian PPN/Bappenas. http://www.bappenas.go.id/files/6514/6225/7153/Buku_I_RPJMN_SDALH.pdf.
Black, C., and H.C. Kowal. 2016. “Patient Satisfaction: A Key Factor In Healthcare Performance Assessment.” Health Policy Forum, Altarum Institute. http://altarum.org/health-policy-blog/patient-satisfaction-a-key-factor-in-healthcare-performance-assessment.
Bleich, S.N., E. Ozaltin, and C.J.L. Murray. 2009. “How does satisfaction with the health-care system relate to patient experience?” Bulletin of the World Health Organization 87: 271-78. http://www.who.int/bulletin/volumes/87/4/07-050401.pdf?ua=1.
BPJS Kesehatan. 2017. https://www.bpjs-kesehatan.go.id/bpjs/index.php/pages/detail/2010/2.
Cameron, L., D.C. Suarez, and K. Cornwell. 2016. Understanding the determinants of maternal mortality in Indonesia. Brown Bag Lunch Discussion. MAMPU-Monash University.
Chee, G., M. Borowitz, and A. Barraclough. 2009. Private Sector Health Care in Indonesia. Bethesda MD: Abt Associates Inc.
References
D’Ambruoso, L., E. Martha, Y. Izati, A. Kiger, and A. Coates. 2013. “Maternal mortality and severe morbidity in rural Indonesia, Part 1: The community perspective.” Social Medicine 7(2): 47-67.
Filippi, V., C. Ronsmans, O.M. Campbell, W.J. Graham, A. Mills, J. Borghi, M. Koblinsky, and D. Osrin. 2006. “Maternal health in poor countries: the broader context and a call for action.” The Lancet 368(9546): 1535-41.
Frankenberg, E., A. Buttenheim, B. Sikoki, W. Suriastini. 2009. “Do Women Increase Their Use of Reproductive Health Care When It Becomes More Available? Evidence from Indonesia.” Studies in Family Planning 40(1): 27-38.
Garrett, L. 2007. “The Challenge of Global Health.” Foreign Affairs 86(1): 14-38.
Grafström, A. 2014. “Balanced Sampling: Balanced and spatially balanced sampling.” R package version 1.4. http://www.antongrafstrom.se/balancedsampling
Greene, M.E. and T.W. Merrick. 2005. “Poverty Reduction: Does Reproductive Health Matter?” HNP Discussion Paper Series. Washington, DC: World Bank.
Hansen, B.B., and S. Olsen Klopfer. 2006. “Optimal full matching and related designs via network flows.” Journal of Computational and Graphical Statistics 15(3): 609-627.
Hatt, L., C. Stanton, K. Makowiecka, A. Adisasmita, E. Achadi, and C. Ronsmans. 2007. “Did the strategy of skilled attendance at birth reach the poor in Indonesia?” Bulletin of the World Health Organization 85(10):774-83.
90

Heywood, P.F., and N.P. Harahap. 2009. “Human resources for health at the district level in Indonesia: the smoke and mirrors of decentralization.” Human Resources for Health 7(6).
Heywood, P., and N.P. Harahap. 2009a. “Health facilities at the district level in Indonesia.” Australia and New Zealand Health Policy 6:13.
International Monetary Fund (IMF). 2016. “World Economic Outlook: Subdued Demand: Symptom and Remedies.” Washington, DC: IMF. http://www.imf.org/external/pubs/ft/weo/2016/02/
Kruk, M.E., H.H. Leslie, S. Verguet, G.M. Mbaruku, R.M.K. Adanu, and A. Langer. 2016. “Quality of basic maternal care functions in health facilities of five African countries: an analysis of national health system surveys.” The Lancet Global Health 4(11): e845–e855.
Mize, L., E. Pambudi, M. Koblinsky, S. Stout, P. Marzoeki, P. Harimurti, and C. Rokx. 2010. “‘... and then she died’ Indonesia Maternal Health Assessment.” Accessed May 29. https://openknowledge.worldbank.org/bitstream/ handle/10986/2837/ 533270ESW0Whit10Box345625B01PUBLIC1.txt.
Organisation for Economic Co-operation and Development (OECD). 2017. “Aid at a glance charts.” http://www.oecd.org/dac/ financing-sustainable-development/development-finance-data/aid-at-a-glance.htm
Philippine Information Agency (PIA). 2017. “Philhealth Offers New Benefit Package for Women about to Give Birth.” http://news.pia.gov.ph/article/view/1091455068894/philhealth-offers-new-benefit-package-for-women-about-to-give-birth.
Rajkotia, Y., J. Gergen, I. Djurovic, S. Koseki, M. Coe, K. Jobarteh, C. Miller, and S. Rana. 2016. “Re-envisioning Maternal and Newborn Health in Indonesia: How the Private Sector and Civil Society Can Ignite Change.” Health Policy Plus Washington, DC: Palladium.
Ronsmans, C., S. Scott, S.N. Qomariyah, E. Achadi, D. Braunholtz, T. Marshall, E. Pambudi, K.H. Witten, and W.J. Graham. 2009. “Professional assistance during birth and maternal mortality in two Indonesian districts.” Bulletin of the World Health Organization 87: 416-23.
Statistics Indonesia. 2015. Sakernas National Labor Statistics Survey (Sakernas).
Taguchi, N., M. Kawabata, M. Maekawa, T. Maruo, Aditiawarman, and L. Dewata. 2003. “Influence of socio-economic background and antenatal care programmes on maternal mortality in Surabaya, Indonesia.” Tropical Medicine and International Health 8(9): 847-52.
Tandon, A., E. Pambudi, P. Harimurti, E. Masaki, A. Subandoro, and P. Marzoeki. 2016. “Indonesia Health Financing System Assessment: Spend More, Right & Better.” Jakarta: World Bank.
Webster, P.C. 2012. “Indonesia makes maternal health a national priority.” The Lancet 380(9858): 1981-1982.
World Bank and MoH National Institute of Research and Development. 2014. “Universal Maternal Health Coverage? Assessing the Readiness of Public Health Facilities to Provide Maternal Health Care in Indonesia.” Jakarta: World Bank. http://documents.worldbank.org/ curated/en/875841468038945861/pdf/905100WP0P13340re0in0Indonesia02014.pdf.
World Bank. 2016a. “Indonesia’s Rising Divide: Why Inequality is Rising, Why it Matters and What Can be Done.” Jakarta: World Bank. https://openknowledge.worldbank.org/handle/10986/24765.
World Bank. 2016b. “World Development Indicators.” Washington, DC: World Bank.
World Bank 2016b. China Joint Study Partnership “Deepening Health Reform in China.” World Bank Group.
World Health Organization (WHO). 2005. The World Health Report 2005: Make every mother and child count. Geneva, Switzerland: WHO.
91

MATERNAL HEALTH REPORT . 2017Revealing the Missing Link
World Health Organization (WHO). 2013. “Service Availability and Readiness Assessment (SARA): An annual monitoring system for service delivery (Implementation Guide, Version 2.2).” Geneva, Switzerland: WHO. http://www.who.int/healthinfo/systems/sara_implementation_guide/en/.
World Health Organization (WHO) and the World Bank. 2015. “Tracking Universal Health Coverage: First Global Monitoring Report.” Geneva, Switzerland: WHO. http://www.who.int/healthinfo/universal_health_coverage/report/2015/en/.
WHO, UNICEF, UNFPA, World Bank Group, and United Nations Population Division (Maternal Mortality Estimation Inter-Agency Group). 2017. “Maternal mortality in 1990-2015.” http://www.who.int/gho/ maternal_health/countries/idn.pdf?ua=1
Xesfingi, S., and A. Vozikis. 2016. “Patient satisfaction with the healthcare system: Assessing the impact of socio-economic and healthcare provision factors.” BMC Health Services Research 16(94). Available: https://bmchealthservres.biomedcentral.com/ articles/10.1186/s12913-016-1327-4.
92


Top Related