


Languages
Pages
Legal


1
Private Placements and
Wealth Constraints of Owner-Managers
V. Ravi Anshuman
Indian Institute of Management, Bangalore
Venkatesh Panchapgesan
Indian Institute of Management, Bangalore
Marti G. Subrahmanyam
Stern School of Business, New York University
2
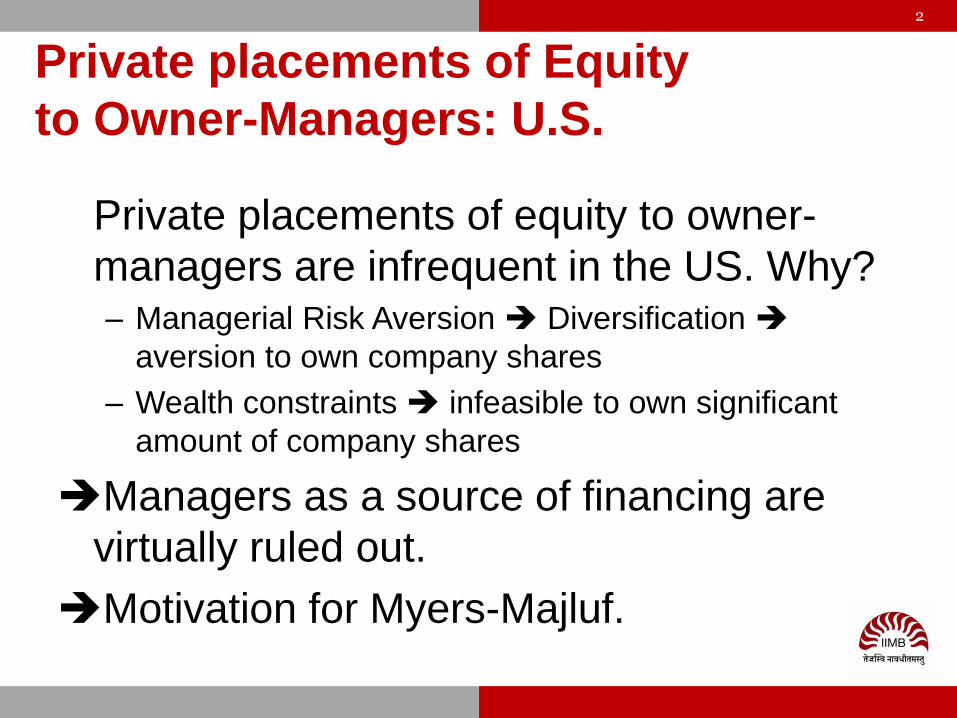
Private placements of Equity
to Owner-Managers: U.S.
Private placements of equity to owner-
managers are infrequent in the US. Why?– Managerial Risk Aversion Diversification
aversion to own company shares
– Wealth constraints infeasible to own significant
amount of company shares
Managers as a source of financing are
virtually ruled out.
Motivation for Myers-Majluf.

Myers Majluf Model
UNDERINVESTMENT IS caused by ASYMMETRIC INFORMATION
12/4/2019 V Ravi Anshuman IIM Bangalore
3
INFORMATION ASYMMETRY
OUTSIDE EQUITY UNDER INVEST

4
Elsewhere…
Private placements of equity to managers
are quite common outside of the US,
particularly in Asia. Why?
– Significant fraction of economy is driven by
family businesses– Stand-alone companies
– Group companies
Owner-managers are an important
source of financing in many economies.

5
Key Concern: Managerial Self-Dealing
1. Timing - Asymmetric information helps managers
2. Manipulation- Possible expropriation of shareholders
Managerial Self Dealing
Regulation: 1) Insiders are prohibited or 2) Issue price restrictions

6
Securities and Exchange Board of India (SEBI) Issue Price Regulations:
HIGH PRICE PATH
LOW PRICE PATH

Not less than the higher of
(i) the average of the High and Low closing prices during six months before the relevant date
(ii) the average of the High and the Low closing prices during 2 weeks before the relevant date
Post Aug 2004, closing prices are replaced with daily
VWAP
12/4/2019 V Ravi Anshuman IIM Bangalore
7
Securities and Exchange Board of India (SEBI) RegulationsLower Bound on Issue Price in Preferential Allotments

OUR CONTRIBUTION
12/4/2019 V Ravi Anshuman IIM Bangalore
8
• We develop a theoretical model, by extending Myers and Majluf (1984), to show that underinvestment can be mitigated, if not eliminated, by issuing equity through private placements to owner managers.
• We extend the literature by addressing corporate financing choices unique to emerging markets and quite different from theories proposed by keeping developed markets in the context.
• We provide empirical evidence supporting the Undervaluation Hypothesis of the asymmetric information model using 1064 private placements issued in India during years 2001-2018.
• Our results support Undervaluation Hypothesis even after controlling for alternative explanations based on Monitoring, Certification, and Entrenchment hypotheses, and also the Business Group Hypothesis and the Manipulation Revelation Hypothesis.

Asset Value
12/4/2019 V Ravi Anshuman IIM Bangalore
9
Assets in place (s)
NPV of project (NPV)
Hidden Value (t)
10
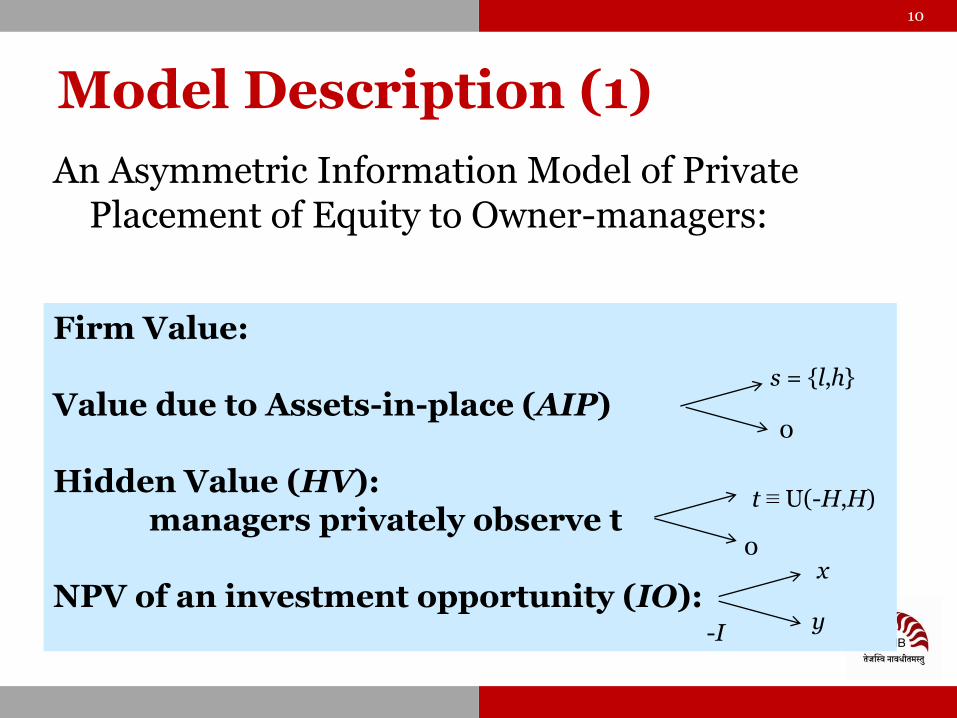
Model Description (1)
An Asymmetric Information Model of Private Placement of Equity to Owner-managers:
Firm Value:
Value due to Assets-in-place (AIP)
Hidden Value (HV): managers privately observe t
NPV of an investment opportunity (IO):
s = {l,h}
0
t ≡ U(-H,H)
0
-I
x
y

11
Model Description (2)
t = -1 t = 0 t = +1
Three Date Model
AIP: s = h or l is revealed at t = -1
A positive NPV project arises; Owner-managers “sees” Hidden Value (t)
All payoffs realized and firms liquidated
Investment/Financing Decision at t = 0+
t = 0- t = 0+

Caveats
Information asymmetry about Hidden Value only
Assets-in-place, Hidden Value, and NPV can be modeled in a simpler manner than as a binary value (s,0).
- just ensures that complete resolution of uncertainty occurs on terminal date
Deterministic component of assets-in-place ensures non-negative asset values.
Zero risk free rate and risk neutral investors.
12

1313
13
Managerial Decision at Date t = 0
• Owner-manager owns a fraction a of the firm
• Owner-manager has a wealth constraint
g = R/I < 1; R is wealth, I is investment
• Owner-managers observes signal (t) of Hidden Value (HV), which takes the form {t,0}.
• Owner-manager’s investment-financing decision:
1. Whether to invest in the project or not (UI)
2. If the decision is to invest, then whether to finance it with Outside Equity (OE), Rights Offering (RO), Preferential Allotment (PA) – fully owner-manager or joint with institutional investor if wealth constraints are there
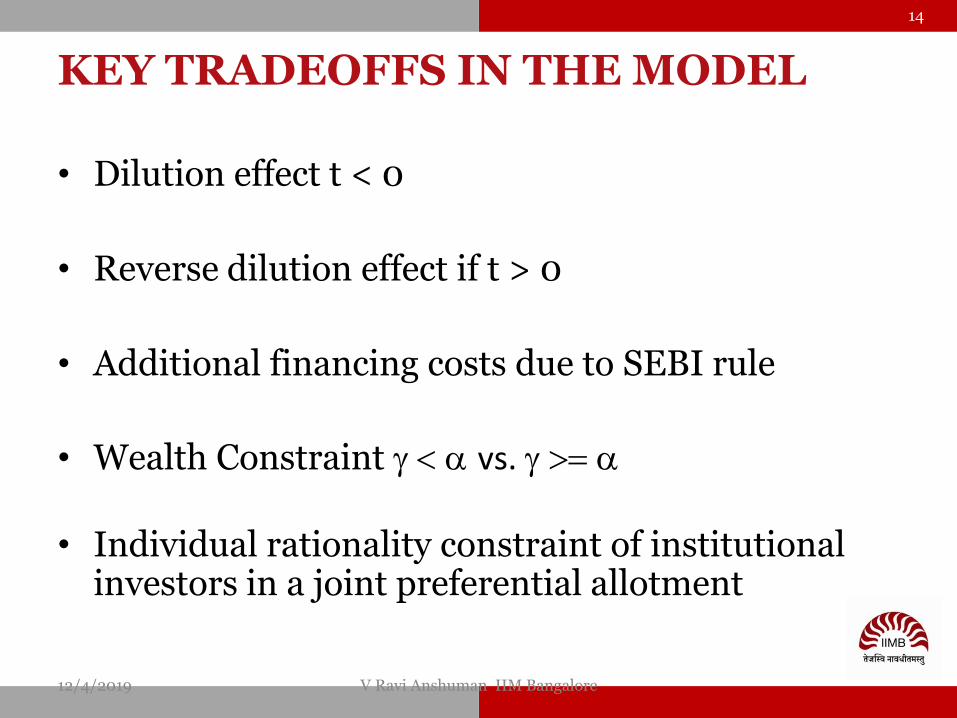
KEY TRADEOFFS IN THE MODEL
• Dilution effect t < 0
• Reverse dilution effect if t > 0
• Additional financing costs due to SEBI rule
• Wealth Constraint g < a vs. g >= a
• Individual rationality constraint of institutional investors in a joint preferential allotment
12/4/2019 V Ravi Anshuman IIM Bangalore
14
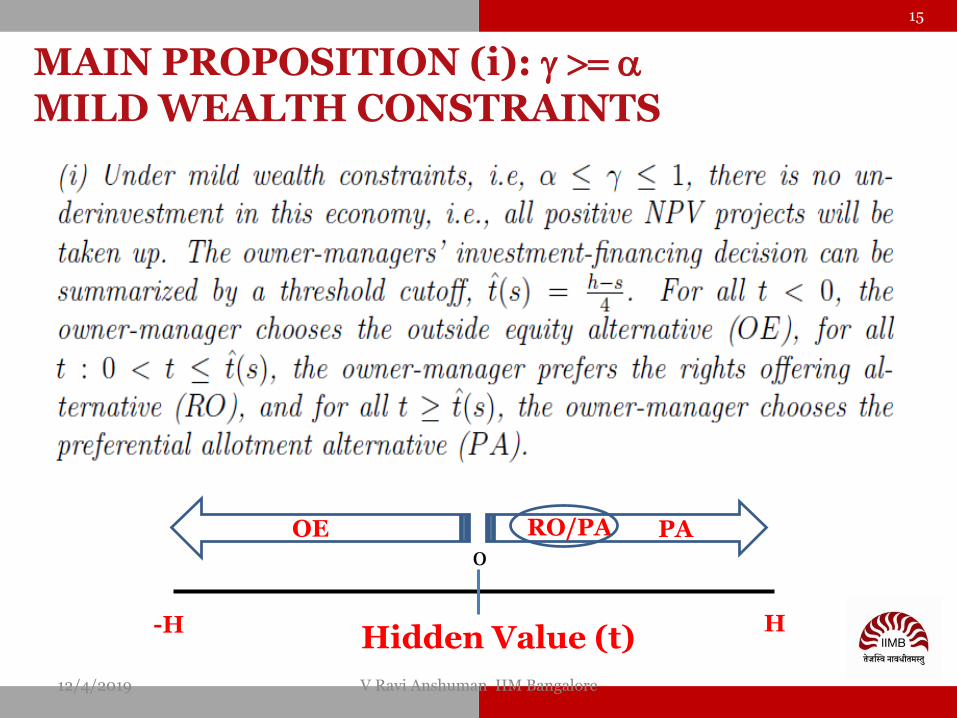
MAIN PROPOSITION (i): g >= a
MILD WEALTH CONSTRAINTS
12/4/2019 V Ravi Anshuman IIM Bangalore
15
-H HHidden Value (t)
0
RO/PA PAOE
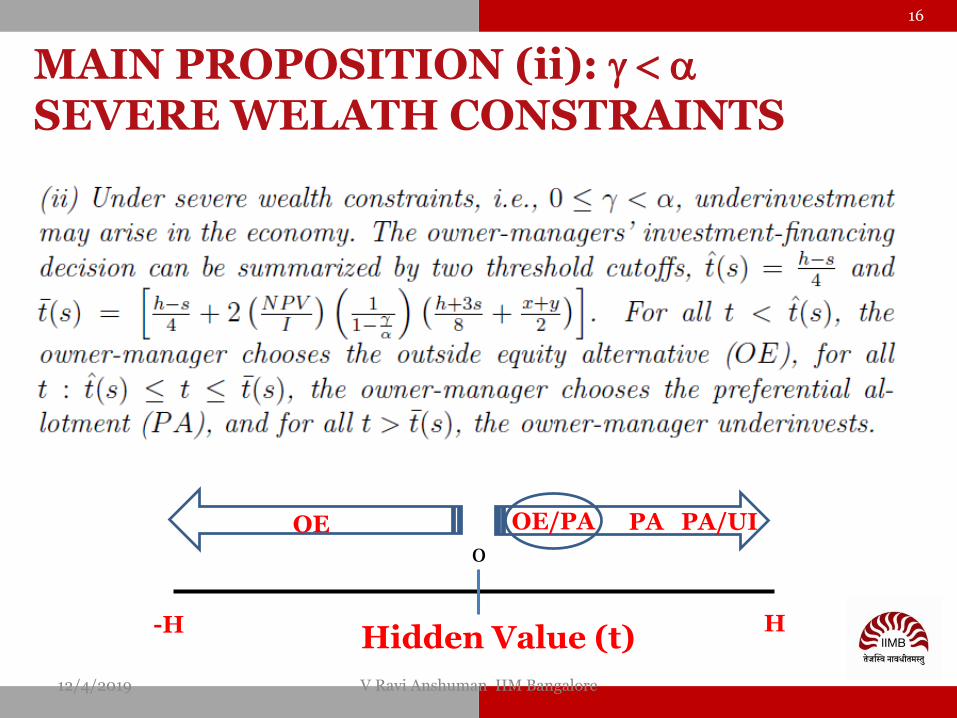
MAIN PROPOSITION (ii): g < a
SEVERE WELATH CONSTRAINTS
12/4/2019 V Ravi Anshuman IIM Bangalore
16
-H HHidden Value (t)
0
OE/PA PAOE PA/UI
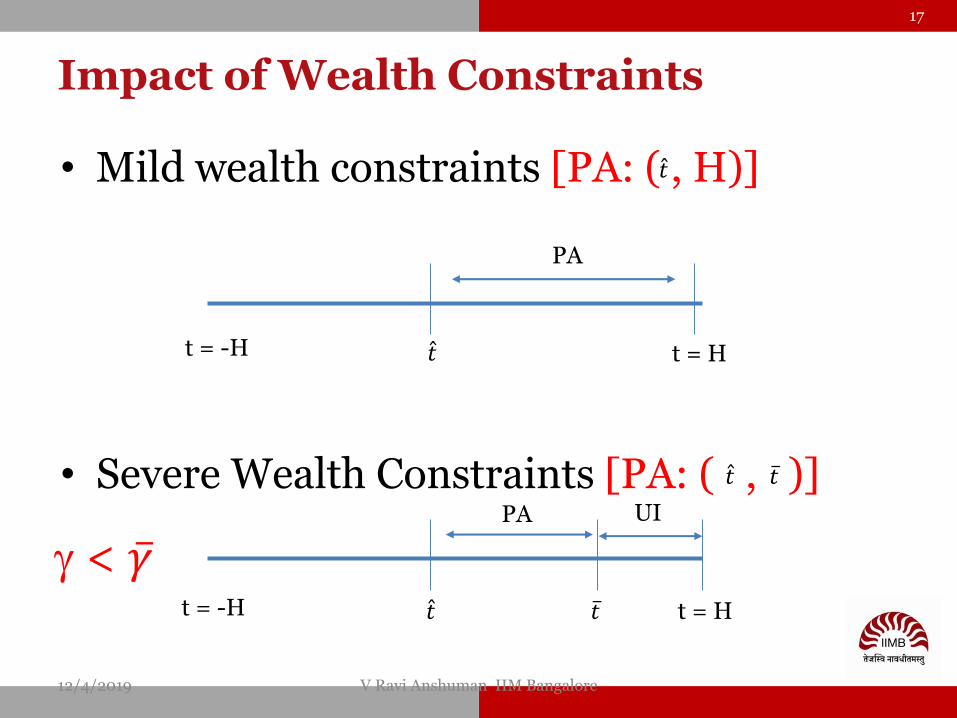
Impact of Wealth Constraints
• Mild wealth constraints [PA: ( , H)]
• Severe Wealth Constraints [PA: ( , )]
12/4/2019 V Ravi Anshuman IIM Bangalore
17
t = -H t = H
PA
t = -H t = H
PA UI
𝑡
𝑡
𝑡
𝑡
𝑡 𝑡
g < 𝛾

Severe Wealth Constraints:Impact of 𝛾
• g > 𝛾
• g < 𝛾
12/4/2019 V Ravi Anshuman IIM Bangalore
18
t = -H t = H
PA
t = -H t = H
PA UI
𝑡 = H
< H 𝑡
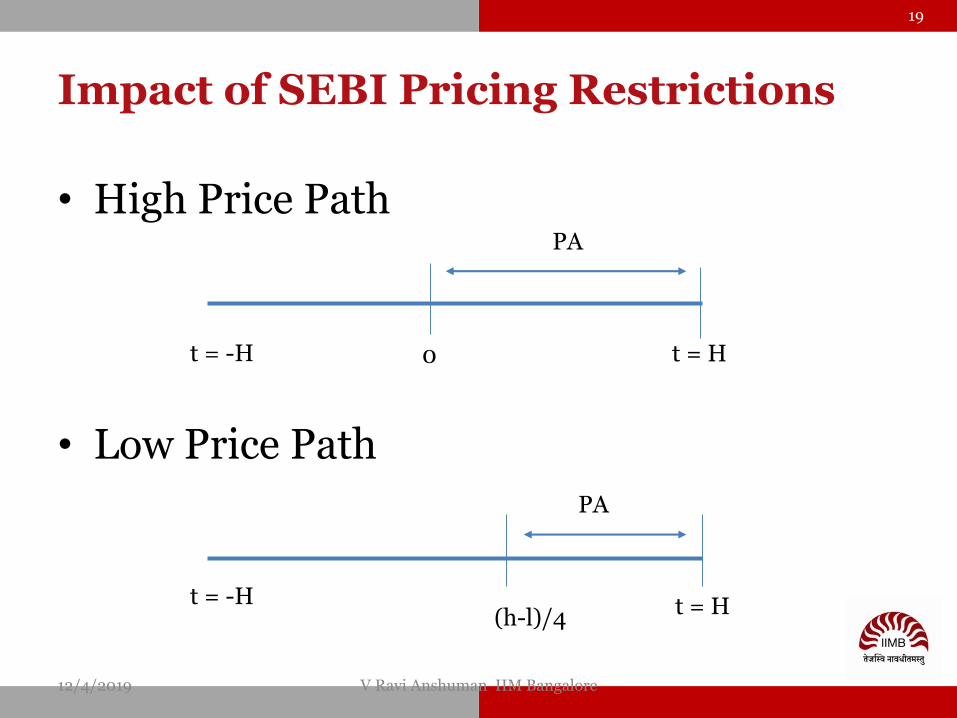
Impact of SEBI Pricing Restrictions
• High Price Path
• Low Price Path
12/4/2019 V Ravi Anshuman IIM Bangalore
19
t = -H t = H
PA
t = -H t = H
PA
0
(h-l)/4

EMPIRICAL IMPLICATIONS
12/4/2019 V Ravi Anshuman IIM Bangalore
20
Announcement Period Reaction should be positive
Announcement Period Reaction should be higher for preferential allotments for owner-managers facing mild wealth constraints
Announcement Period Reaction between high price path and low price path preferential allotments should be greater under severe wealth constraints
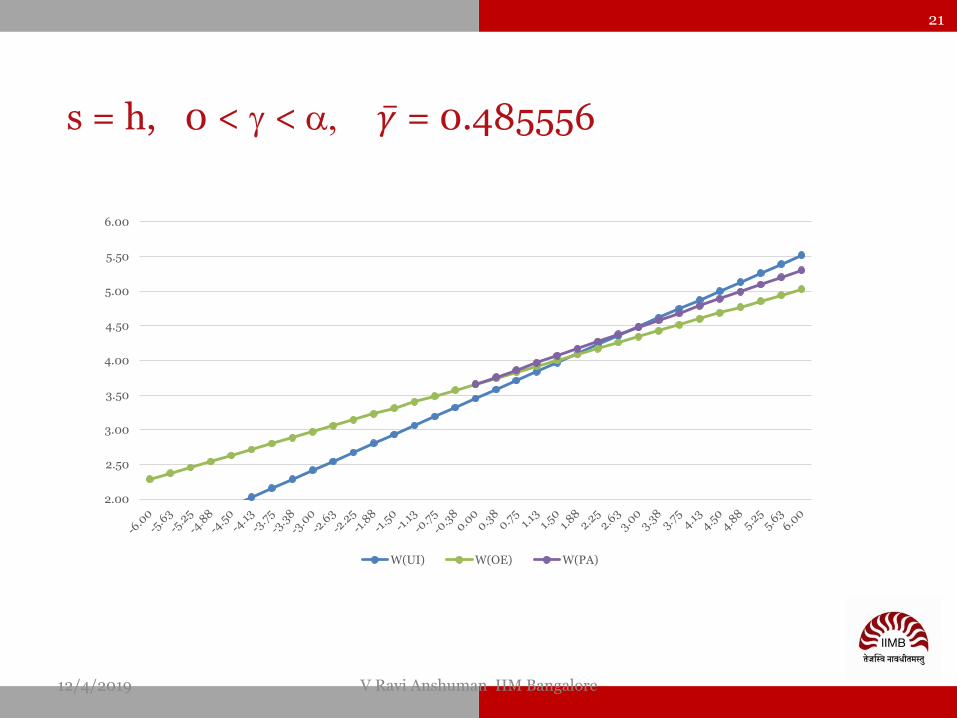
s = h, 0 < g < a, 𝛾 = 0.485556
12/4/2019 V Ravi Anshuman IIM Bangalore
21
2.00
2.50
3.00
3.50
4.00
4.50
5.00
5.50
6.00
W(UI) W(OE) W(PA)

s = l, 0 < g < a, 𝛾 = 0.168667
12/4/2019 V Ravi Anshuman IIM Bangalore
22
0.00
0.50
1.00
1.50
2.00
2.50
3.00
3.50
4.00
4.50
W(UI) W(OE) W(PA)
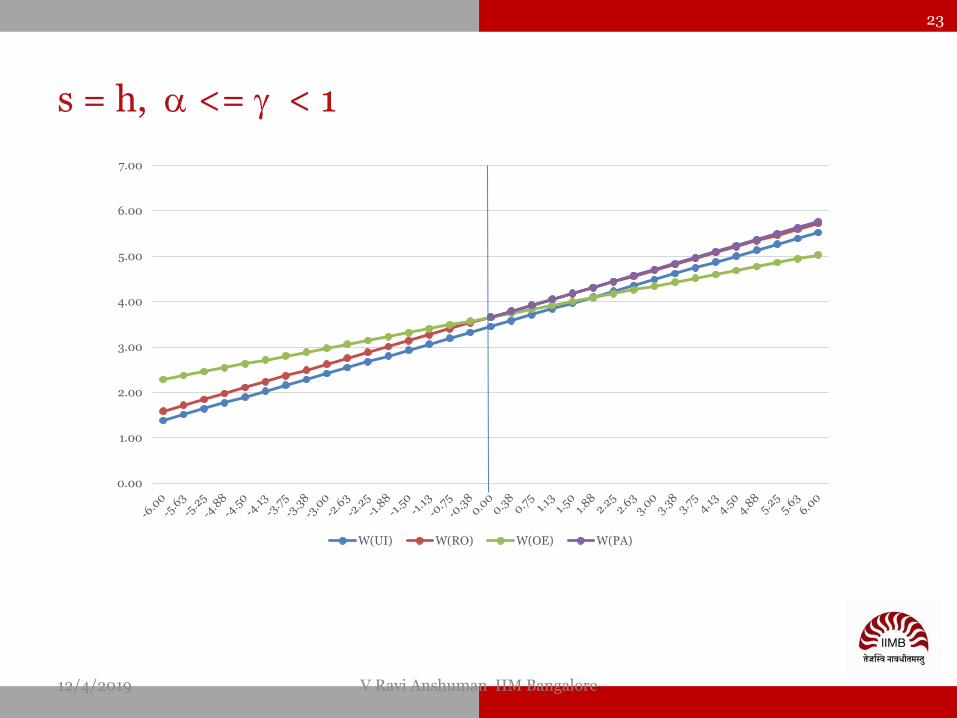
s = h, a <= g < 1
12/4/2019 V Ravi Anshuman IIM Bangalore
23
0.00
1.00
2.00
3.00
4.00
5.00
6.00
7.00
W(UI) W(RO) W(OE) W(PA)
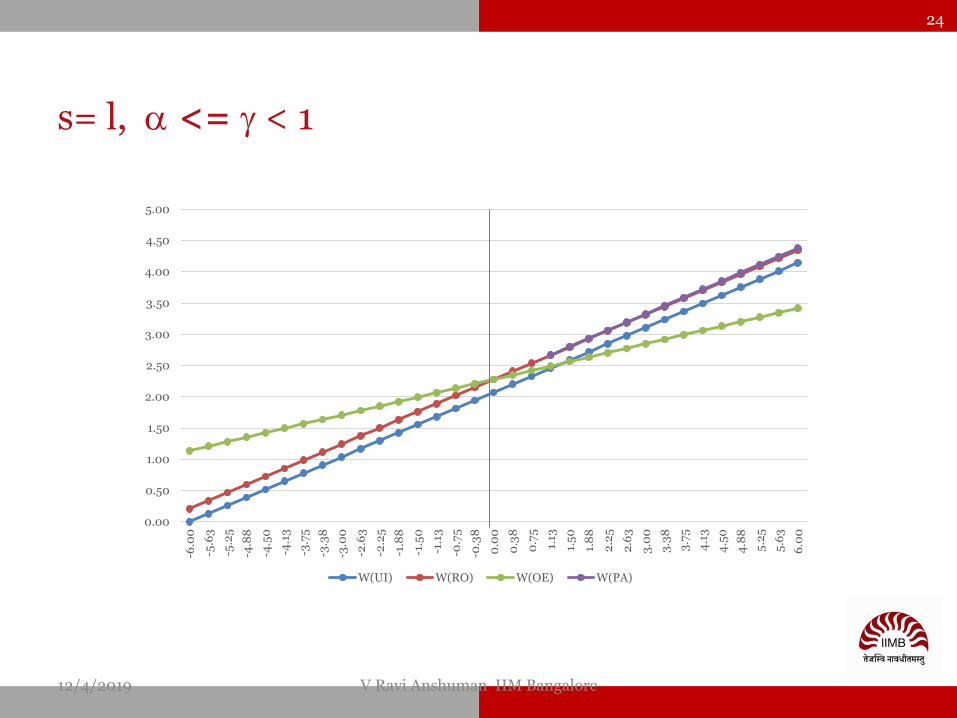
s= l, a <= g < 1
12/4/2019 V Ravi Anshuman IIM Bangalore
24
0.00
0.50
1.00
1.50
2.00
2.50
3.00
3.50
4.00
4.50
5.00
-6.0
0
-5.6
3
-5.2
5
-4.8
8
-4.5
0
-4.1
3
-3.7
5
-3.3
8
-3.0
0
-2.6
3
-2.2
5
-1.8
8
-1.5
0
-1.1
3
-0.7
5
-0.3
8
0.0
0
0.3
8
0.7
5
1.13
1.5
0
1.8
8
2.2
5
2.6
3
3.0
0
3.3
8
3.7
5
4.1
3
4.5
0
4.8
8
5.2
5
5.6
3
6.0
0
W(UI) W(RO) W(OE) W(PA)

s = h, g = 0, 𝛾 = 0.485556
12/4/2019 V Ravi Anshuman IIM Bangalore
25
0.00
1.00
2.00
3.00
4.00
5.00
6.00
W(UI) W(OE) W(PA) y-axis
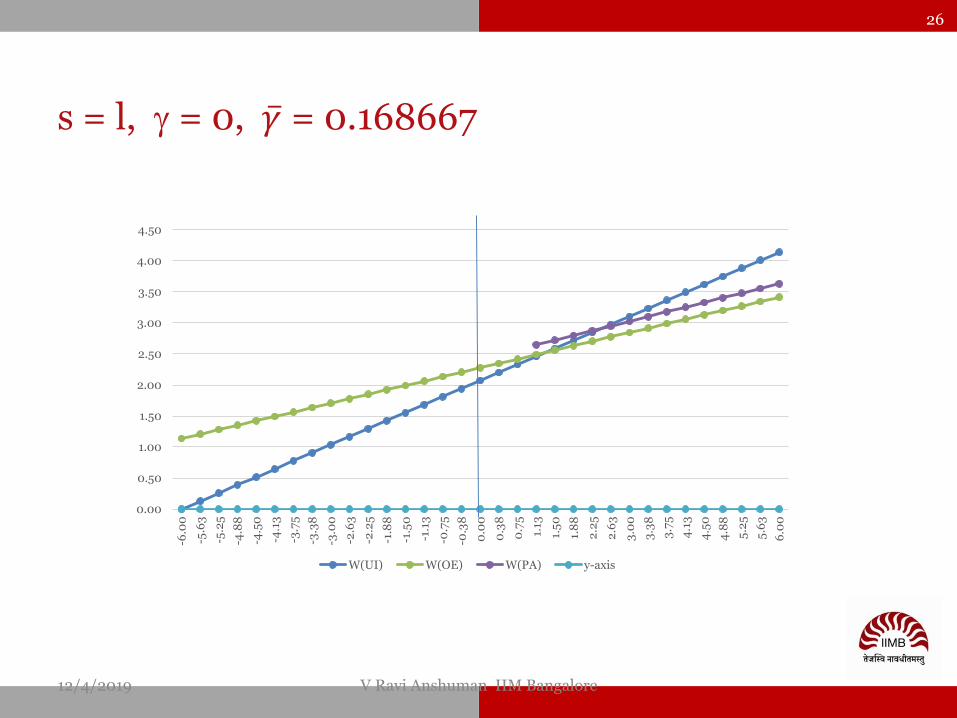
s = l, g = 0, 𝛾 = 0.168667
12/4/2019 V Ravi Anshuman IIM Bangalore
26
0.00
0.50
1.00
1.50
2.00
2.50
3.00
3.50
4.00
4.50
-6.0
0
-5.6
3
-5.2
5
-4.8
8
-4.5
0
-4.1
3
-3.7
5
-3.3
8
-3.0
0
-2.6
3
-2.2
5
-1.8
8
-1.5
0
-1.1
3
-0.7
5
-0.3
8
0.0
0
0.3
8
0.7
5
1.13
1.5
0
1.8
8
2.2
5
2.6
3
3.0
0
3.3
8
3.7
5
4.1
3
4.5
0
4.8
8
5.2
5
5.6
3
6.0
0
W(UI) W(OE) W(PA) y-axis
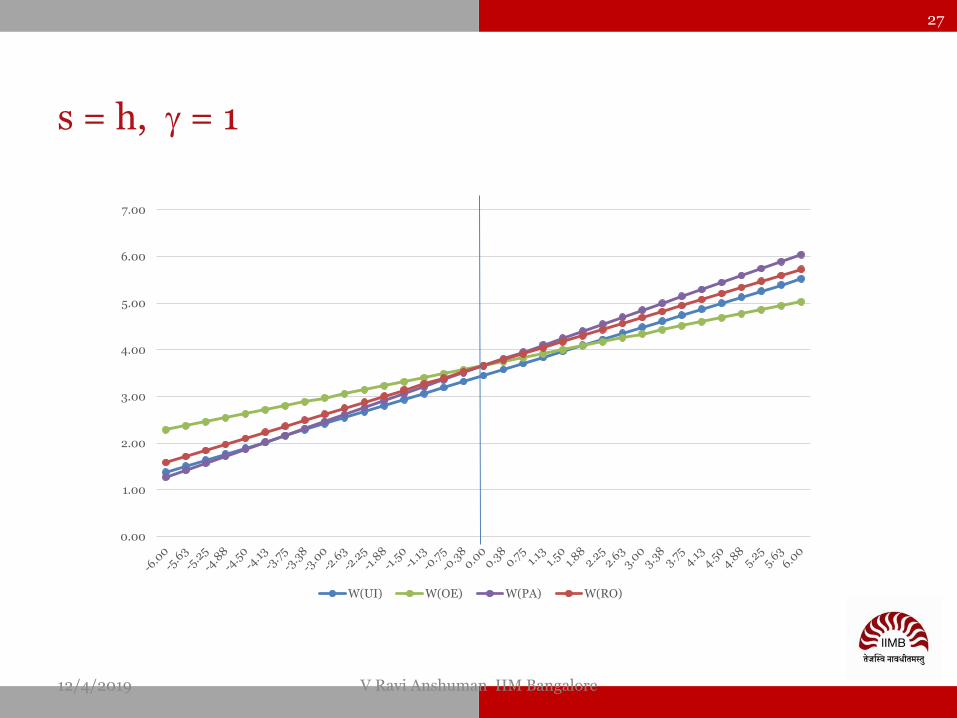
s = h, g = 1
12/4/2019 V Ravi Anshuman IIM Bangalore
27
0.00
1.00
2.00
3.00
4.00
5.00
6.00
7.00
W(UI) W(OE) W(PA) W(RO)

s = l, g = 1
12/4/2019 V Ravi Anshuman IIM Bangalore
28
-1.00
0.00
1.00
2.00
3.00
4.00
5.00
W(UI) W(OE) W(PA) W(RO)
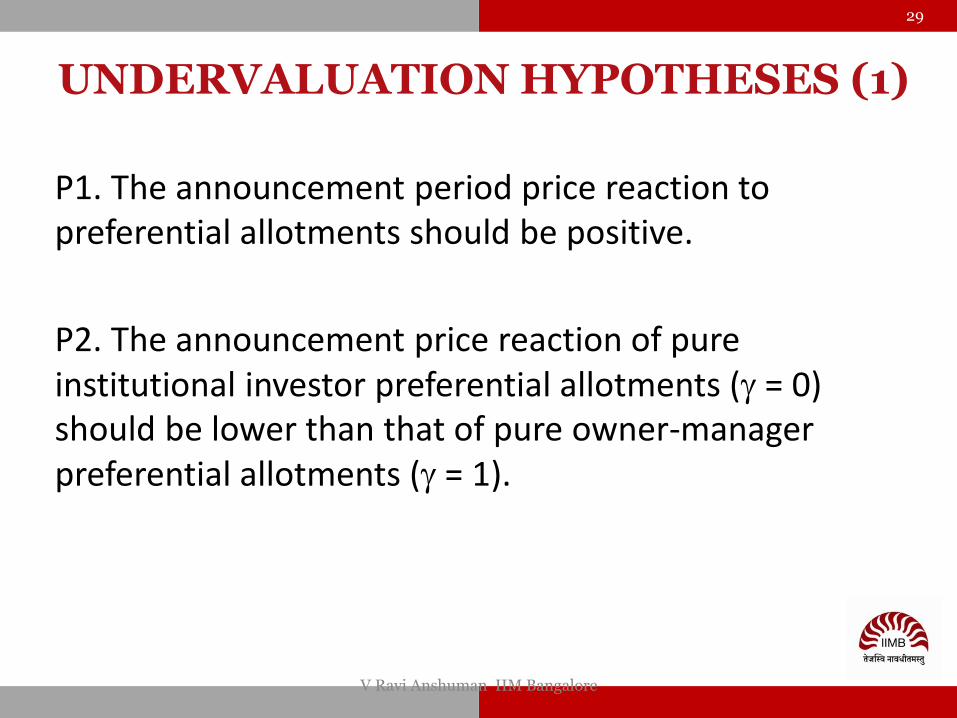
P1. The announcement period price reaction to preferential allotments should be positive.
P2. The announcement price reaction of pure institutional investor preferential allotments (g = 0) should be lower than that of pure owner-manager preferential allotments (g = 1).
V Ravi Anshuman IIM Bangalore
29
UNDERVALUATION HYPOTHESES (1)

P3. The announcement period reaction to preferential allotments should be (a) negatively related to the market capitalization of the rm, (b) positively related to volatility of returns, if it proxies for information asymmetry, (c) negatively related to the volatility of returns, if it proxies for the uncertainty in the private information of owner-managers of the rm, and (d) unrelated to the owner-managers' pre-announcement shareholdings.
P4. The difference in announcement period reaction to preferential allotments under a high price path and a low price path should be greater for pure institutional investor preferential allotments (g = 0) than for pure owner-manager preferential allotments (g = 1).
12/4/2019 V Ravi Anshuman IIM Bangalore
30
UNDERVALUATION HYPOTHESES (2)

UNDERVALUATION HYPOTHESES
12/4/2019 V Ravi Anshuman IIM Bangalore
31

12/4/2019 V Ravi Anshuman IIM Bangalore
32
UNDERVALUATION HYPOTHESES
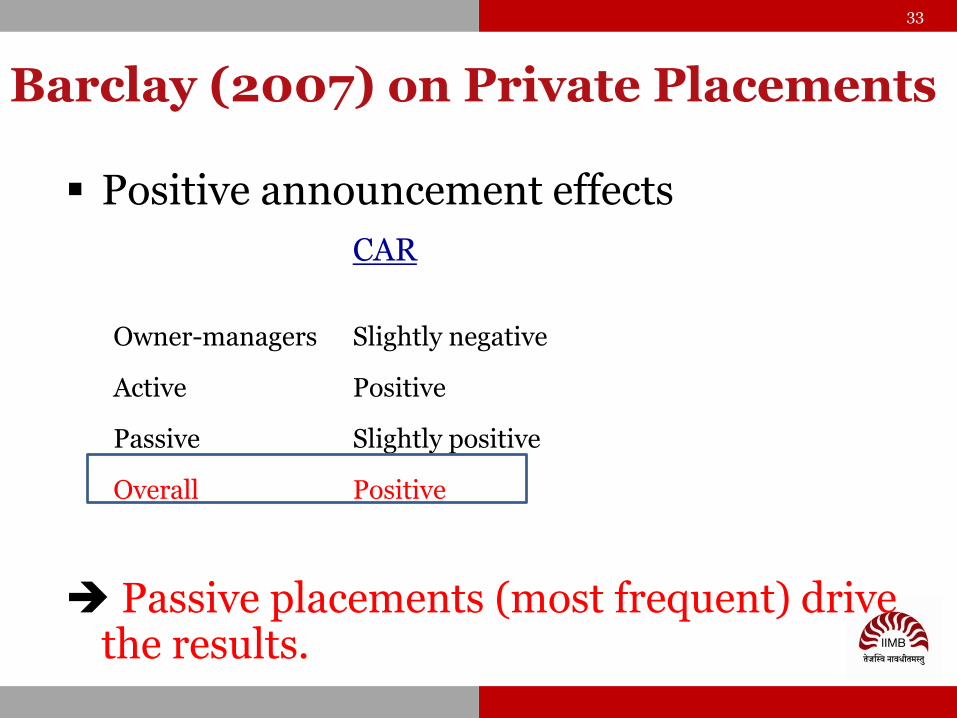
Barclay (2007) on Private Placements
Positive announcement effects
CAR
Owner-managers Slightly negative
Active Positive
Passive Slightly positive
Overall Positive
Passive placements (most frequent) drive the results.
33

34
Extant Literature (Private Placements)
Monitoring Hypothesis
• Wruck (1989)
• Private equity investors ensure better monitoring
• better resource allocation of corporate resources
• Positive announcement effect
Certification Hypothesis
• Hertzel & Smith (1993)
• Private equity investors certify hidden value prospects in the firm in a credible manner
• Positive announcement effect
Entrenchment Hypothesis
• Dann and De Angelo (1978)
• Passive investors give incumbent managers a free reign
• Negative announcement effect
• Managerial self-dealing (discounts)
35
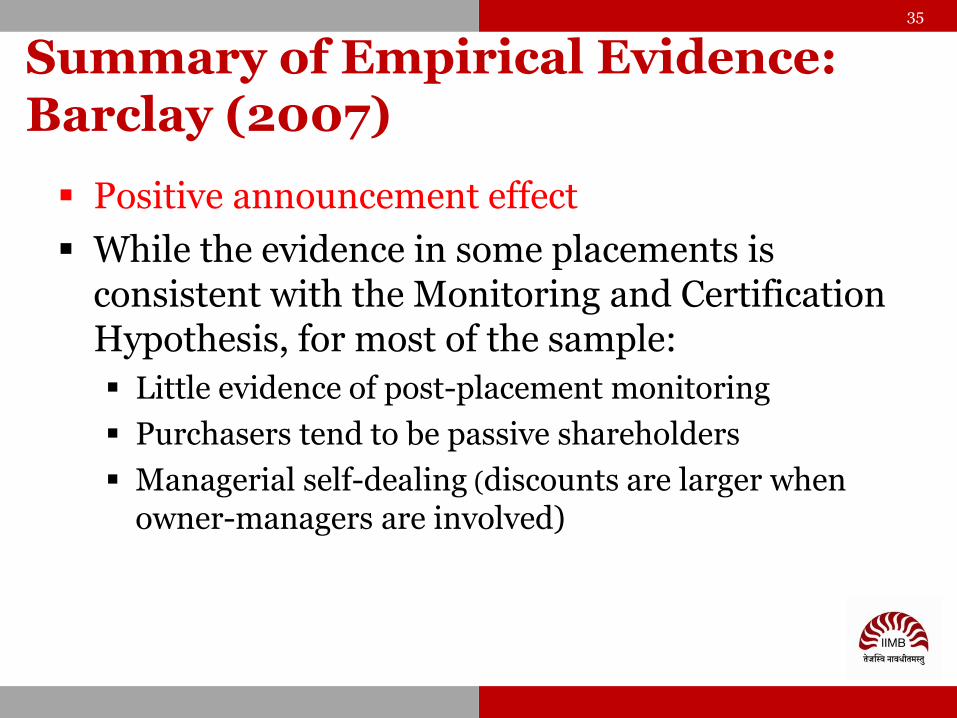
Summary of Empirical Evidence:Barclay (2007)
Positive announcement effect
While the evidence in some placements is consistent with the Monitoring and Certification Hypothesis, for most of the sample:
Little evidence of post-placement monitoring
Purchasers tend to be passive shareholders
Managerial self-dealing (discounts are larger when owner-managers are involved)

COMPETING HYPOTHESES
• CERTIFICATION HYPOTHESIS
• MONITORING HYPOTHESIS
• ENTRENCHMENT HYPOTHESIS
• BUSINESS GROUP HYPOTHESIS
• MANIPULATION REVELATION HYPOTHESIS
12/4/2019 V Ravi Anshuman IIM Bangalore
36

37
37
PPL ALLOTMENT PROCESS
*Regulation 30 – Outcome of Board Meeting (Schedule III Part A- (4))
Announcement Date
(Announcement to Exchange that Board’s intent to issue PPL)
Board Meeting Date
(Discusses the PPL)
A/EGM or Postal Ballot
(Relevant Date = A/EGM Date - 30 days to determine price path)*
Board Meeting to pass Resolution of A/EGM
Issuance Date
(Date of actual Issuance of PPL)

38
3838
PPL ALLOTMENT PROCESS
• Announcement Date: The firm informs the exchange that • It intends to issue PPL • Will be discussed by the Board. • We call this date the Announcement Date
• Board Meeting Date: Board of Directors meet to discuss the PPL issuance. • We call this date as “Board Meeting Date” in our sample. • SEBI mandates that
• The notification of the carry through motion has to happen within 30 minutes of the completion of the meeting
• Should the resolution carry, it is put to vote through an Annual/Extraordinary General Body Meeting (A/EGM) or Postal Ballot.*
*Regulation 30 – Outcome of Board Meeting (Schedule III Part A- (4))

39
3939
PPL ALLOTMENT PROCESS
• A/EGM or Postal Ballot: • An A/EGM or take the postal ballot route is taken to put the matter
to vote if the board approves • This information is not captured in the Prowess Database.
• Relevant Date:• The result of the A/EGM or postal ballot vote is notified to the
exchange either on the date of A/EGM or when the ballot counting is done as the case may be.
• This data is not available in Prowess• This is the date from which the relevant date (=AGM date – 30
days) for the SEBI-mandated price band computation is determined.
*Regulation 30 – Outcome of Board Meeting (Schedule III Part A- (4))

40
4040
PPL ALLOTMENT PROCESS
• Call of Board Meeting post A/EGM or Postal Ballot:• If the resolution carries in the A/EGM, the firm next informs
the exchange of a call for Board Meeting to allot the PPL
• Board Meeting: • The board affirms the resolution of the A/EGM and allots the
PPL to the said parties
• Issue Date: • This is when the PPL is officially registered and included in
exchanges information (ex-date for PPL) • Available in the Prowess Database. • In a number of cases, it happens to be the same day as last
board meeting above. • We call this the “Issue Date” in our sample
*Regulation 30 – Outcome of Board Meeting (Schedule III Part A- (4))

41
4141
DATA DESCRIPTION
• 2,972 PRIVATE PLACEMENTS 2001-2009
2,315 for which we have relevant board meeting information
• 1,968 issuances with clean announcement dates
• 347 issuances with assumed announcement dates
• 1,282 issuances with firm-level financial and trading data
• 1,064 issuances with mostly fresh issue of shares
• Excludes redistribution of shares among owners
• >1% of existing shares outstanding
• Forms our sample universe

42
4242
DATA DESCRIPTION – UNIVERSE
• 1,057 Issuances involving only one type (PPL/PPL-QIP+) on issue day
• 7 Issuances involving more than one type on issue day
• 93 Issuance to qualified institutional investors
• 971 Issuance to other investors
• 385 Issuances by business group firms
• 679 Issuances by stand-alone firms
• 823 Issuances to others
• 356 Issuances by low price path firms
• 708 Issuances by high price path firms

43
4343
ISSUANCES BY YEAR
050
10
0
Fre
quen
cy
2000 2005 2010 2015 2020Year of Announcement
Distribution of Sample Issuances

44
Mean Median Std Min Max
Market Cap in Rs M (6-monthly Average) 4,120.11 598.67 11,626.65 19.37 85,457.46
Close Price (6-monthly Average) 97.70 37.81 168.80 1.08 1,098.57
Monthly Return (12-monthly Average) in % 6.57% 4.95% 24.54% ( 69.73%) 88.88%
Annualized Volatility (scaled using daily volatility over past year) in % 64.88% 62.21% 19.74% 29.03% 152.06%
Annualized Garman-Klass Volatility in % 17.69% 16.21% 8.83% 2.03% 53.66%
Variance Ratio (monthly variance over scaled daily variance) 14.70 4.33 26.93 0.00 153.7
EBITDA as percent of Income 16.61 12.05 29.47 -126.67 89.77
PAT as percent of Income -7.86 2.83 72.76 -600.00 65.17
Total Assets in Rs M 8,178.84 1,396.30 23,505.67 18.50 185619.80
Net Fixed Assets in Rs M 2,034.73 338.50 5,831.38 0.10 44,730.40
Debt Equity Ratio in multiples 1.85 0.84 3.92 0.00 32.19
Average Daily Value Traded in Rs. M 22.72 1.32 76.35 0.00 581.91
Amihud Illiquidity Ratio over previous month 6.02 0.04 19.54 0.00 130.85
Shares held by Owner-Managers in % 45.56 47.51 18.11 0.32 80.35
Shares Pledged by Owner-Managers in % 10.92 0.00 24.93 0.00 100.00
Price Path Ratio 1.16 1.09 0.36 0.38 2.38
Preferential Allotment as % of Shares Outstanding (prev qtr) 26.59 14.05 38.24 1.37 249.44
Preferential Allotment as % of Owner-Manager Shares (prev qtr) 124.96 29.89 399.74 2.68 3080.80
Preferential Allotment to All Owner-Managers in % 37.13 3.66 43.85 -2.68 100.91
Preferential Allotment to All Institutional Investors in % 18.02 0.00 38.00 -50.58 131.83
Days from Announcement to First Board Meeting 2.41 2.00 1.55 1.00 11.00
Days from Announcement to Issue 26.93 31.00 46.34 1.00 286.00
DESCRIPTIVE STATISTICS
45
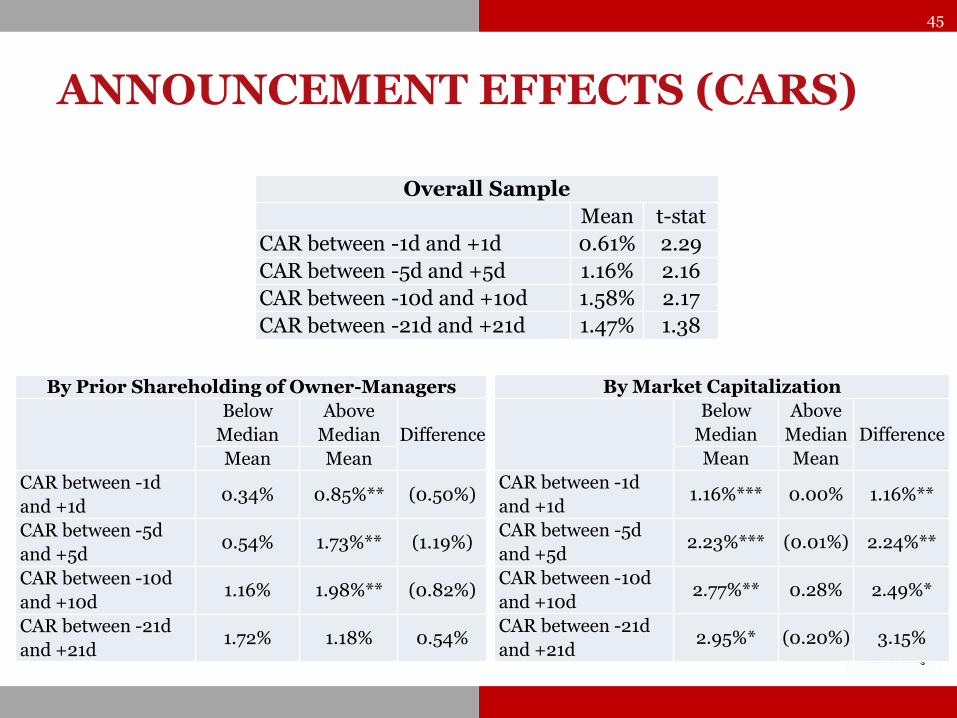
ANNOUNCEMENT EFFECTS (CARS)
Overall Sample
Mean t-stat
CAR between -1d and +1d 0.61% 2.29
CAR between -5d and +5d 1.16% 2.16
CAR between -10d and +10d 1.58% 2.17
CAR between -21d and +21d 1.47% 1.38
By Prior Shareholding of Owner-Managers
Below
Median
Above
Median Difference
Mean Mean
CAR between -1d
and +1d0.34% 0.85%** (0.50%)
CAR between -5d
and +5d0.54% 1.73%** (1.19%)
CAR between -10d
and +10d1.16% 1.98%** (0.82%)
CAR between -21d
and +21d1.72% 1.18% 0.54%
By Market Capitalization
Below
Median
Above
Median Difference
Mean Mean
CAR between -1d
and +1d1.16%*** 0.00% 1.16%**
CAR between -5d
and +5d2.23%*** (0.01%) 2.24%**
CAR between -10d
and +10d2.77%** 0.28% 2.49%*
CAR between -21d
and +21d2.95%* (0.20%) 3.15%

46
ANNOUNCEMENT EFFECTS (CARS)
By Stock Volatility
Below Median Above Median Difference
Mean Mean
CAR between -1d and +1d 0.65%** 0.57% 0.08%
CAR between -5d and +5d 1.55%** 0.77% 0.78%
CAR between -10d and +10d 2.26%*** 0.90% 1.36%
CAR between -21d and +21d 3.21%*** (0.34%) 3.55%*
By Debt-Equity Ratio
Below Median Above Median Difference
Mean Mean
CAR between -1d and +1d 0.87%** 0.34% 0.53%
CAR between -5d and +5d 0.95% 1.37%* (0.42%)
CAR between -10d and +10d 1.60% 1.57%* 0.04%
CAR between -21d and +21d 0.83% 2.07% (1.24%)

47
ANNOUNCEMENT EFFECTS (CARS)
By Investor Type
Owner-
Managers
Others Difference
Mean Mean
CAR between -1d
and +1d1.15%** 0.45% 0.70%
CAR between -5d
and +5d2.11%** 0.88% 1.22%
CAR between -10d
and +10d2.19%* 1.41% 0.78%
CAR between -21d
and +21d3.10%* 0.96% 2.14%
By Group Affiliation
Group Firms Stand-
Alone
Firms
Differenc
e
Mean Mean
CAR between -1d
and +1d0.89%** 0.45% 0.44%
CAR between -5d
and +5d1.39% 1.03% 0.37%
CAR between -10d
and +10d1.74% 1.49% 0.25%
CAR between -21d
and +21d1.67% 1.32% 0.35%
By Price Path
Low Price Path High Price Path Difference
Mean Mean
CAR between -1d and +1d (1.07%)** 1.45%*** (2.52%)***
CAR between -5d and +5d (3.95%)*** 3.73%*** (7.69%)***
CAR between -10d and +10d (6.86%)*** 5.83%*** (12.69%)***
CAR between -21d and +21d (8.63%)*** 6.51%*** (15.13%)***

48
ANNOUNCEMENT EFFECTS (CARS)
Dependent VariableCAR
[-1,+1]CAR
[-5,+5] CAR
[-10,+10] CAR
[-21,+21]
Intercept0.039757 0.012528 0.07244 0.305706
(1) (0.18) (0.78) (2.24)
Firm Characteristics
Age (in years)-0.00013 0.000125 0.000275 0.000634
(-0.79) (0.35) (0.62) (1.02)
Log Market Capitalization-0.00974*** -0.01568*** -0.02581*** -0.04359***
(-3.03) (-2.74) (-3.39) (-3.83)
EBITDA (% ) 0.000307** 0.000618*** 0.000721** 0.001281***
(2.63) (2.76) (2.19) (2.87)
Debt-Equity (Multiple)-0.00063 -0.00064 -0.00194 -0.00196
(-0.84) (-0.62) (-1.37) (-0.92)
Annualized volatility (% )-0.03391 -0.07909** -0.11655** -0.27794***
(-1.54) (-2.01) (-2.02) (-3.38)
Owner-Managers Equity (% ) 0.00025 0.000403 0.00077 0.000789
(1.44) (1.14) (1.6) (1.17)
Institutional Equity (% )-0.00003 0.000127 0.001872** 0.003091***
(-0.08) (0.19) (1.98) (2.69)
Owner-Managers Pledging of Equity (% )0.00043** 0.0000201 0.000292 0.000848*
(2.5) (0.06) (0.76) (1.68)
Group Affiliation Dummy0.013118** 0.023569* 0.019033 0.030683
(2.02) (1.89) (1.21) (1.45)

49
ANNOUNCEMENT EFFECTS (CARS)
Dependent VariableCAR
[-1,+1]CAR
[-5,+5] CAR
[-10,+10] CAR
[-21,+21]
Prior Period CARs (-252, -30)0.00064 0.0803*** 0.200959*** 0.476746***
(0.06) (3.89) (7.24) (11.62)
Allotment Size as % of Total Equity -0.000094 -0.00022 -0.00022 -0.00042
(-0.88) (-1.14) (-0.87) (-0.95)
Qualified Institutional Placement Dummy-0.00554 0.007815 0.007692 -0.03483
(-0.62) (0.55) (0.38) (-1.32)
Owner-Manager Issuance Dummy0.031045** 0.083643*** 0.077728** 0.089859**
(2.58) (3.73) (2.42) (2.09)
Institution Issuance Dummy 0.011304 0.052556 0.046814 0.052293
(0.89) (1.65) (1.27) (1.14)
Price Path Dummy (=1 if high price path) 0.006745 0.081392* 0.112858* 0.058398
(0.25) (1.78) (1.79) (0.62)
Price Path Dummy* Owner-Manager Issuance Dummy
-0.02902* -0.05987** -0.04096 -0.01822
(-1.83) (-2.1) (-1.06) (-0.35)
Price Path Dummy*Institutional Issuance Dummy
-0.02019 -0.04934 -0.02165 -0.01472
(-1.35) (-1.42) (-0.52) (-0.28)
Price Path Dummy*Log Market Capitalization 0.005275 0.002315 0.001564 0.004777
(1.59) (0.4) (0.21) (0.42)
Owner Manager Issuance Dummy*Pledging Percent by Owner-Managers
-0.00053*** -0.00048 -0.00015 -0.00073
(-2.23) (-1.08) (-0.28) (-1.07)
Year Dummies YES YES YES YES
R-square 0.0764 0.1443 0.2194 0.3676
Number of Observation 813 813 813 813
50
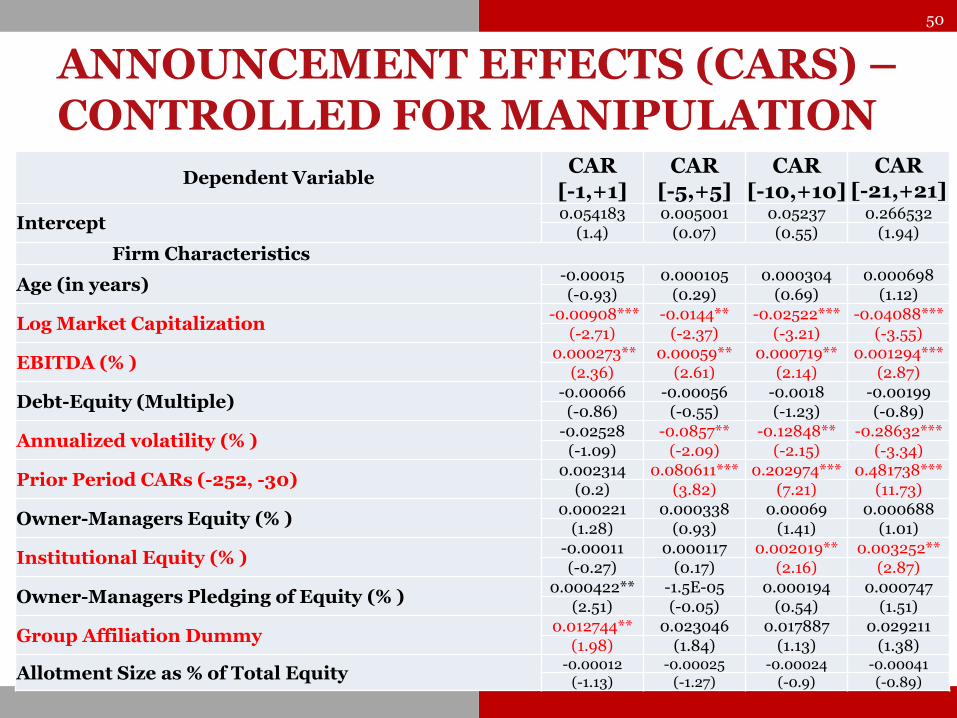
ANNOUNCEMENT EFFECTS (CARS) –CONTROLLED FOR MANIPULATION
Dependent VariableCAR
[-1,+1]CAR
[-5,+5] CAR
[-10,+10] CAR
[-21,+21]
Intercept 0.054183 0.005001 0.05237 0.266532
(1.4) (0.07) (0.55) (1.94)
Firm Characteristics
Age (in years) -0.00015 0.000105 0.000304 0.000698
(-0.93) (0.29) (0.69) (1.12)
Log Market Capitalization-0.00908*** -0.0144** -0.02522*** -0.04088***
(-2.71) (-2.37) (-3.21) (-3.55)
EBITDA (% )0.000273** 0.00059** 0.000719** 0.001294***
(2.36) (2.61) (2.14) (2.87)
Debt-Equity (Multiple) -0.00066 -0.00056 -0.0018 -0.00199
(-0.86) (-0.55) (-1.23) (-0.89)
Annualized volatility (% ) -0.02528 -0.0857** -0.12848** -0.28632***
(-1.09) (-2.09) (-2.15) (-3.34)
Prior Period CARs (-252, -30) 0.002314 0.080611*** 0.202974*** 0.481738***
(0.2) (3.82) (7.21) (11.73)
Owner-Managers Equity (% ) 0.000221 0.000338 0.00069 0.000688
(1.28) (0.93) (1.41) (1.01)
Institutional Equity (% ) -0.00011 0.000117 0.002019** 0.003252**
(-0.27) (0.17) (2.16) (2.87)
Owner-Managers Pledging of Equity (% ) 0.000422** -1.5E-05 0.000194 0.000747
(2.51) (-0.05) (0.54) (1.51)
Group Affiliation Dummy 0.012744** 0.023046 0.017887 0.029211
(1.98) (1.84) (1.13) (1.38)
Allotment Size as % of Total Equity -0.00012 -0.00025 -0.00024 -0.00041
(-1.13) (-1.27) (-0.9) (-0.89)

51
ANNOUNCEMENT EFFECTS (CARS) –CONTROLLED FOR MANIPULATION
Dependent VariableCAR
[-1,+1]CAR
[-5,+5] CAR
[-10,+10] CAR
[-21,+21]
Qualified Institutional Placement Dummy-0.00504 0.009973 0.016701 -0.02094
(-0.55) (0.7) (0.8) (-0.79)
Owner-Manager Issuance Dummy 0.027985** 0.083571*** 0.080916** 0.097461**
(2.46) (3.81) (2.51) (2.25)
Institution Issuance Dummy 0.009388 0.054001* 0.050711 0.056302
(0.75) (1.68) (1.37) (1.22)
Price Path Dummy (=1 if high price path) 0.007929 0.083031* 0.103625 0.052021
(0.3) (1.76) (1.56) (0.53)
Price Path Dummy* Owner-Manager Issuance Dummy -0.02642* -0.06093** -0.04736 -0.02939
(-1.72) (-2.2) (-1.23) (-0.57)
Price Path Dummy* Institutional Issuance Dummy-0.01871 -0.05198 -0.02876 -0.02267
(-1.27) (-1.49) (-0.69) (-0.43)
Price Path Dummy* Log Market Capitalization0.004735 0.002117 0.003526 0.007034
(-1.27) (-1.49) (-0.69) (-0.43)
Owner Manager Issuance Dummy*Pledging % by Owner-Managers
-0.00045** -0.00037 -1.7E-05 -0.00063
(-2.03) (0.35) (0.46) (0.6)
Annualized Garman-Klass Volatility -0.08381 0.018504 0.084202 0.082989
(-1.62) (-0.89) (-0.03) (-0.96)
Amihud Illiquidity Ratio over previous month 0.000183 0.000396 0.000329 0.000673
(-1.62) (0.19) (0.66) (0.52)
Variance Ratio 0.000181 0.000658** 0.000934 0.000672
(0.76) (2.11) (0.54) (0.8)
Prior Period CAVs (-252, -30) 1.6E-06 2.18E-06 -5.9E-06 -1.6E-05***
(1.37) (0.55) (-1.09) (-2.70)
Year Dummies YES YES YES YES
R-square 0.08 0.15 0.23 0.37
Number of Observation 813 813 813 813

COMPETING HYPOTHESES
12/4/2019 V Ravi Anshuman IIM Bangalore
52

OTHER HYPOTHESES
12/4/2019 V Ravi Anshuman IIM Bangalore
53

54
CONCLUSIONS
• Theoretical model that shows that private placements of equity to owner-managers mitigates the Myers-Majluf underinvestmentproblem.
Private placements to owner-managers are critical for capital formation and the growth of the economy.
• Empirical Evidence based on Indian capital market data confirms that asymmetric information is a key driver of private placements of equity to owner-managers.
Top Related