


Languages
Pages
Legal

* Corresponding author. E-mail address: [email protected] ( R. Sehgal) © 2018 Growing Science Ltd. All rights reserved. doi: 10.5267/j.dsl.2017.8.003
Decision Science Letters 7 (2018) 257–272
Contents lists available at GrowingScience
Decision Science Letters
homepage: www.GrowingScience.com/dsl
Prioritizing the refactoring need for critical component using combined approach
Rajni Sehgala*, Deepti Mehrotraa and Manju Balab aAmity School of Engineering and Technology, Amity University, Noida, Uttar Pradesh, India bI.P college for women, University of Delhi, Delhi, India
C H R O N I C L E A B S T R A C T
Article history: Received March 16, 2017 Received in revised format: August 20, 2017 Accepted August 27, 2017 Available online August 29, 2017
One of the most promising strategies that will smooth out the maintainability issues of the software is refactoring. Due to lack of proper design approach, the code often inherits some bad smells which may lead to improper functioning of the code, especially when it is subject to change and requires some maintenance. A lot of studies have been performed to optimize the refactoring strategy which is also a very expensive process. In this paper, a component based system is considered, and a Fuzzy Multi Criteria Decision Making (FMCDM) model is proposed by combining subjective and objective weights to rank the components as per their urgency of refactoring. Jdeodorant tool is used to detect the code smells from the individual components of a software system. The objective method uses the Entropy approach to rank the component having the code smell. The subjective method uses the Fuzzy TOPSIS approach based on decision makers’ judgement, to identify the critically and dependency of these code smells on the overall software. The suggested approach is implemented on component-based software having 15 components. The constitute components are ranked based on refactoring requirements.
Growing Science Ltd. All rights reserved.8© 201
Keywords: Code smell Refactoring FMCDM analysis Entropy Fuzzy TOPSIS
1. Introduction
The quality of any software system is an important aspect that software industry looks forward to its survival for its current scenario because of increase in complexity, less cost, and universalness. Development of software constitutes majorly in two parts, in the first part, software is developed which is followed by the maintenance process and it includes the evolvement of the software according to the customer needs in the second part. Optimizing the software evolvement w.r.t time and the cost is challenging task (Khomh et al., 2009). Adding new functionality into a software system makes the design of the system inconsistent; therefore it is violating the blueprint of the original design. Enhancement of software leads to addition or deletion of methods, which degrades design and structure of the software, which is called Anti-pattern (Li & Shatnawi, 2007; Mansoor et al., 2013; Peters & Zaidman, 2012). An Antipattern is defined as a commonly occurring solution to the enhancement of
258
the functionality of the software. It always produces an adverse effect on the system. When anti-pattern occurs in a software system, it is detected by the code smells (Rahman et al., 2012). Code smell is not Antipattern at the deign level, but it can be at the programming level (Carneiro et al., 2010). Certain code smells like duplicate code; parallel inheritance occurs due to poor programming practices, not because of lack of design in the software system (Moha et al., 2010; Van Emden & Moonen, 2002).
According to the Fowler and Beck (1999), code smell should be dislodged by applying the appropriate refactoring technique to enhance the quality of the source code. Refactoring is the process of changing the structure of the code without changing program behavior (Mens et al., 2007). Refactoring not only increases the quality of the software but it also increases the reusability of the code (Murphy-Hill et al., 2012). Refactoring gives more flexibility to the developers to alter their programs when there is a change in requirement from the user. Applying refactoring techniques does not come for free; a lot of challenges are associated while doing the refactoring to large source code size, like interdependency of a module and lack of tool support for refactoring (Alshayab, 2009). A lot of research have been done to prioritize and optimize the refactoring. Along with selecting appropriate refactoring strategy, it is equally important to decide the order in which the refactoring should be done. For this, some techniques are required which can help to determine the critical module or component of a software system so that more and more refactoring effort should be put on a critical module to improve the quality of the software. In this paper, a medium size component based software system is considered, and code smells are detected from the individual components of the system using the Jdeordent which is an Eclipse-based tool. Entropy method is applied in the objective approach to rank in the critical component based on the code smell presented in the component. Further expert opinion is considered to rank the component based on attributes of components and code smell namely priority, severity, dependency and importance. The combined approach is adopted for making a decision on the component which is more affected by the presence of code smell; it has both objective and subjective dimensions (Nagpal et al., 2016) i.e. they are measured on the absolute scale using analytical approach and also relative grading is given for estimating their importance using subjective approach.
The basic idea of this work is to reorganize components that need to be taken care on future adaptations and extensions. Thus, in this paper, components of a given software are ranked as per their refactoring need. This paper is divided into five sections. The literature on the existing approach of refactoring is discussed in section 2 and framework is proposed. Section 3 presents the analytical method using entropy approach in detail for the weight evaluation of the component of the software. In section 4, Fuzzy TOPSIS approach used to evaluate the subjective weights is discussed. In Section 5, the ranking suggested using combined approach is discussed. The conclusion and future scope are discussed in the last section.
2. Frame work for ranking the components as per the refactoring need
Once the code smell introduced in the code, it is only cured by refactoring (Mens et al., 2007). It is important to apply the refactoring effort in right direction to improve the quality of the code (Murphy et al., 2012; Alshayeb, 2009). A lot of studies have been recently executed on when and how to refactor the code. Both manual and automated refactoring approaches are suggested in the literature. According to Murphy-Hill et al. (2012), about 90% of refactoring edits are performed manually (Kim et al., 2014; Soetens & Demeyer, 2010; Ouni et al., 2017). Also Vakilian et al. (2012) concluded that automated refactoring is underused and misused. Thus software designer recommends the manual refactoring. Refactoring leads to change in the code which may increase the bugs if the software is not properly designed according to design pattern rules. Weißgerber and Diehl (2006) concluded that the number of bug report increases after refactoring. Researchers have identified the approaches for refactoring for given code smell but still determining which code needs to be refactored on priority is still matter of research.
R. Sehgal et al. / Decision Science Letters 7 (2018)
259
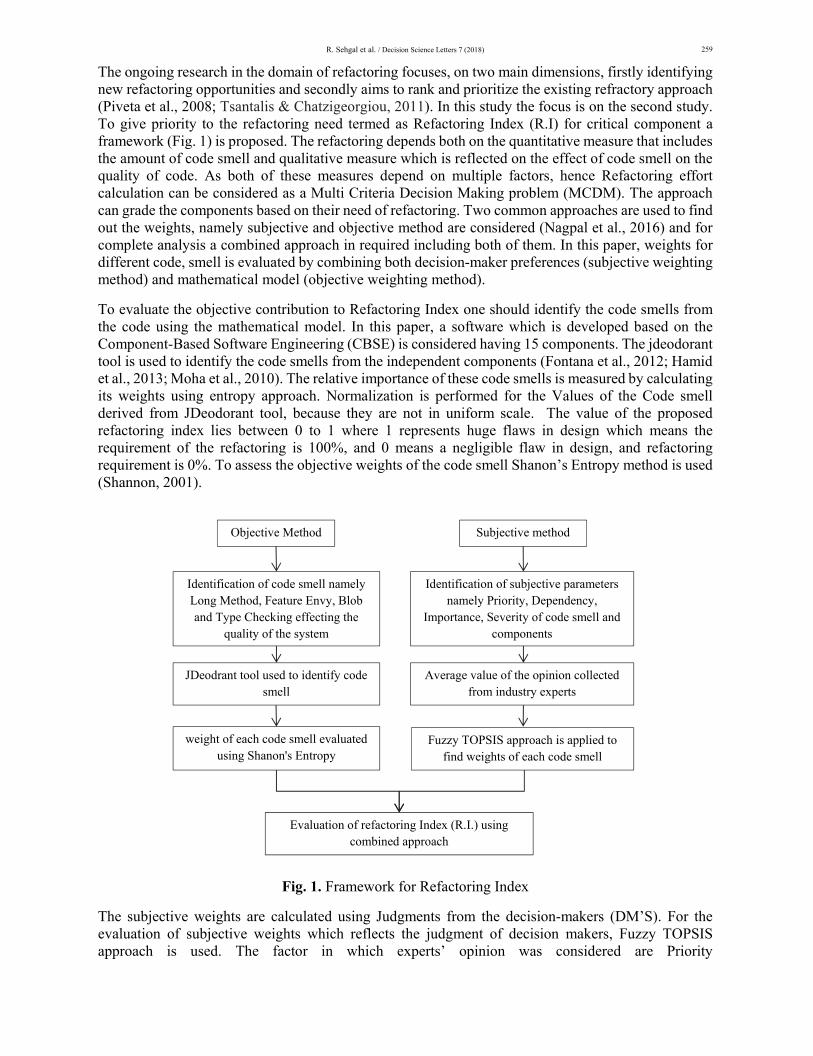
The ongoing research in the domain of refactoring focuses, on two main dimensions, firstly identifying new refactoring opportunities and secondly aims to rank and prioritize the existing refractory approach (Piveta et al., 2008; Tsantalis & Chatzigeorgiou, 2011). In this study the focus is on the second study. To give priority to the refactoring need termed as Refactoring Index (R.I) for critical component a framework (Fig. 1) is proposed. The refactoring depends both on the quantitative measure that includes the amount of code smell and qualitative measure which is reflected on the effect of code smell on the quality of code. As both of these measures depend on multiple factors, hence Refactoring effort calculation can be considered as a Multi Criteria Decision Making problem (MCDM). The approach can grade the components based on their need of refactoring. Two common approaches are used to find out the weights, namely subjective and objective method are considered (Nagpal et al., 2016) and for complete analysis a combined approach in required including both of them. In this paper, weights for different code, smell is evaluated by combining both decision-maker preferences (subjective weighting method) and mathematical model (objective weighting method).
To evaluate the objective contribution to Refactoring Index one should identify the code smells from the code using the mathematical model. In this paper, a software which is developed based on the Component-Based Software Engineering (CBSE) is considered having 15 components. The jdeodorant tool is used to identify the code smells from the independent components (Fontana et al., 2012; Hamid et al., 2013; Moha et al., 2010). The relative importance of these code smells is measured by calculating its weights using entropy approach. Normalization is performed for the Values of the Code smell derived from JDeodorant tool, because they are not in uniform scale. The value of the proposed refactoring index lies between 0 to 1 where 1 represents huge flaws in design which means the requirement of the refactoring is 100%, and 0 means a negligible flaw in design, and refactoring requirement is 0%. To assess the objective weights of the code smell Shanon’s Entropy method is used (Shannon, 2001).
Fig. 1. Framework for Refactoring Index
The subjective weights are calculated using Judgments from the decision-makers (DM’S). For the evaluation of subjective weights which reflects the judgment of decision makers, Fuzzy TOPSIS approach is used. The factor in which experts’ opinion was considered are Priority
Objective Method Subjective method
weight of each code smell evaluated using Shanon's Entropy
Identification of code smell namely Long Method, Feature Envy, Blob and Type Checking effecting the
quality of the system
Fuzzy TOPSIS approach is applied to find weights of each code smell
Average value of the opinion collected from industry experts
Identification of subjective parameters namely Priority, Dependency,
Importance, Severity of code smell and components
JDeodrant tool used to identify code smell
Evaluation of refactoring Index (R.I.) using combined approach
260
( ,Severity( ,Dependency( ,Importance( . These factors signify to reflect how the code smell affects the quality of the software. In the evaluation of Refactoring index, each code smell has its contributing weight. Combined weight assessment vector is evaluated after rescaling these weights in the same range. Finally, Refactoring index is calculated by multiplying the normalized value of the codes smells with their respective combined weights. Based on the weights, the components are ranked in order to do refactoring needed.
In the following section objective and subjective weight evaluation is discussed.
3. Objective weight evaluation
Entropy method by Shannon is most popularly used to measure the system disorder in thermodynamics (Shannon, 2001). A software system is having a multi-attribute problem; entropy proves very useful to find the disorder from the system (Zhang, 2015). The small value of the information entropy of a given parameter provides the substantial contribution to the comprehensive evaluation. In this study, code smells are detected using the JDeodorant tool from the individual component of the software system, and weight of each code smell is evaluated using the Entropy method. If different code smell under consideration has a large difference, then the weight of that code smell is significant, and the value of entropy is reduced and vice versa (Zou et al., 2006). Entropy method is based on mathematical computation and overlooks the decision maker’s preference. The description of the code smell and how they are measured is given below. 3.1 Code smell
Although a large variety of code smells are reported in the literature. In this study, the focus is on the following four code smells. Reason for considering these code smells is that poses feature of both large and complex projects like long method and God Class as well as smells related to the lack of adoption of good Object-Oriented coding practice which include type checking and feature envy. These code smells are measured using Jdeordent tool.
3.1.1 Long Method
When a method is having more than ten lines of code, this method is called long method code smell. The reason of the occurrence of this particular code smell is that when there is a need to add a new functionality in the software; it is much convenient to add a new line in the existing method rather than to write a new method. It is tough to maintain a function which is having a long method. Refactoring technique used to reduce this code smell is Extract Method (Singh & Kaur, 2017).
3.1.2 Type Checking Type checking code smell occurs basically in the conditional statement of the code fragments. For example java programmers who are frequently users of switch statements, they need to take care of that switch statements co-occurs with the Enumerated data Types. If another set of data types is used then the type of smell occurs is called Type Checking (Singh & Kaur, 2017).
3.1.2 Blob (God Class) When a class has several responsibilities, having a large number of attributes, operations, and dependencies with other data classes such that it becomes difficult for a class to work, a class that centralizes the system’s behavior and has a dependency towards data classes is called a Blob If the Blob code smell is present in the system, and there is a single change in a piece of the program there is a need of modification in the other part of the program too. This increases the difficulties for the
R. Sehgal et al. / Decision Science Letters 7 (2018)
261
programmers. Extract method refactoring technique can be applied to remove this code smell (Singh & Kaur, 2017).
3.1.3 Feature Envy This code smell occurs particularly in methods of a class, a method when used more feature of another class than its class then the smell occurs is called Feature Envy. This particular code smell increases the coupling between two classes. Move Method Refactoring technique is used to remove this code smell (Singh & Kaur, 2017).
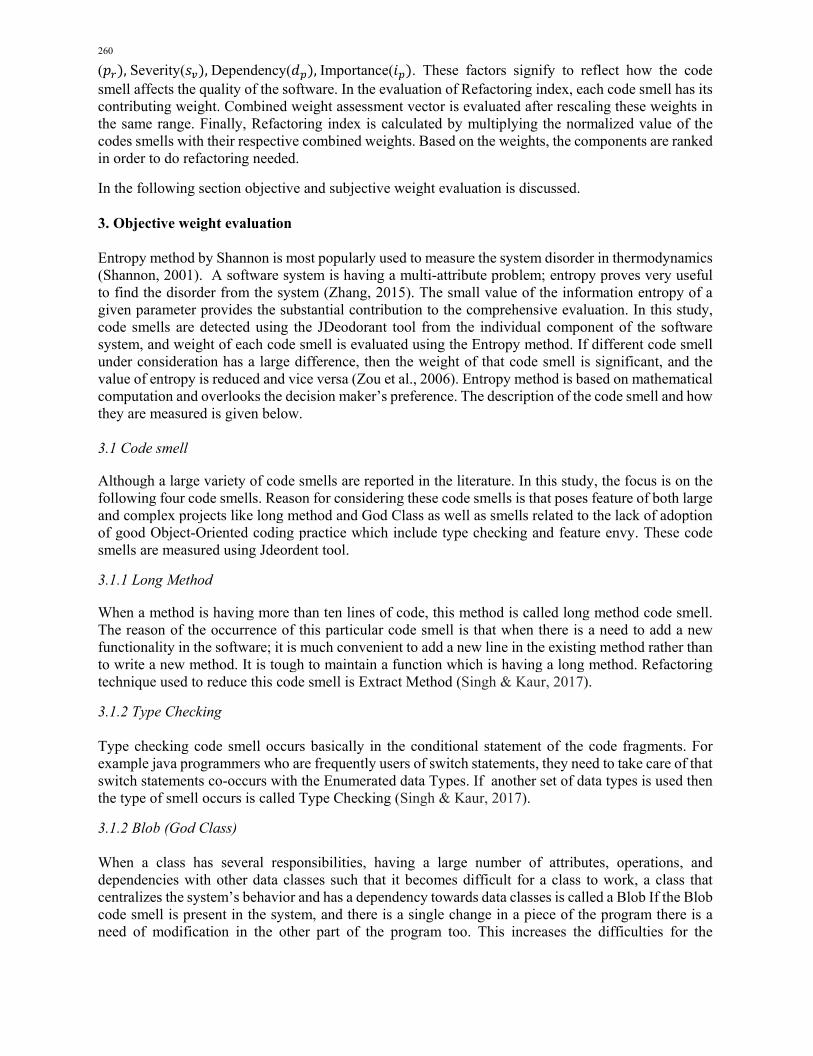
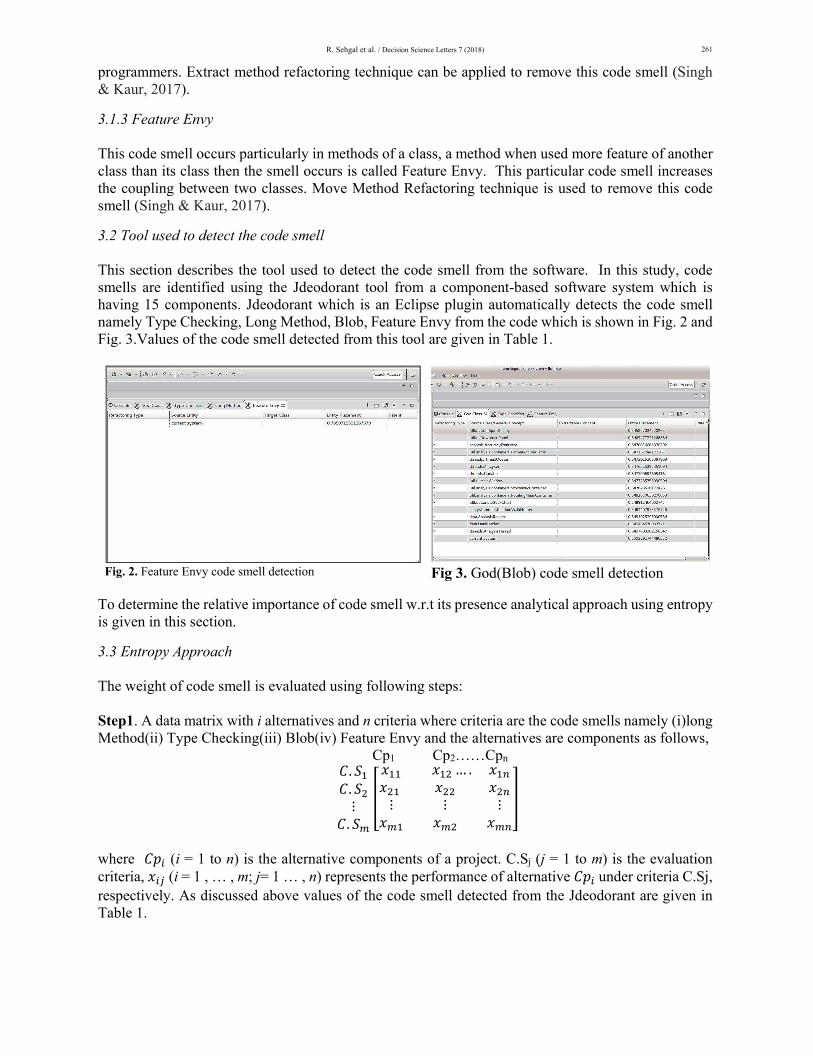
3.2 Tool used to detect the code smell This section describes the tool used to detect the code smell from the software. In this study, code smells are identified using the Jdeodorant tool from a component-based software system which is having 15 components. Jdeodorant which is an Eclipse plugin automatically detects the code smell namely Type Checking, Long Method, Blob, Feature Envy from the code which is shown in Fig. 2 and Fig. 3.Values of the code smell detected from this tool are given in Table 1.
Fig. 2. Feature Envy code smell detection Fig 3. God(Blob) code smell detection
To determine the relative importance of code smell w.r.t its presence analytical approach using entropy is given in this section.
3.3 Entropy Approach The weight of code smell is evaluated using following steps: Step1. A data matrix with i alternatives and n criteria where criteria are the code smells namely (i)long Method(ii) Type Checking(iii) Blob(iv) Feature Envy and the alternatives are components as follows,
Cp1 Cp2……Cpn ..⋮.
… .
⋮ ⋮ ⋮
where (i = 1 to n) is the alternative components of a project. C.Sj (j = 1 to m) is the evaluation criteria, (i = 1 , … , m; j= 1 … , n) represents the performance of alternative under criteria C.Sj, respectively. As discussed above values of the code smell detected from the Jdeodorant are given in Table 1.
262
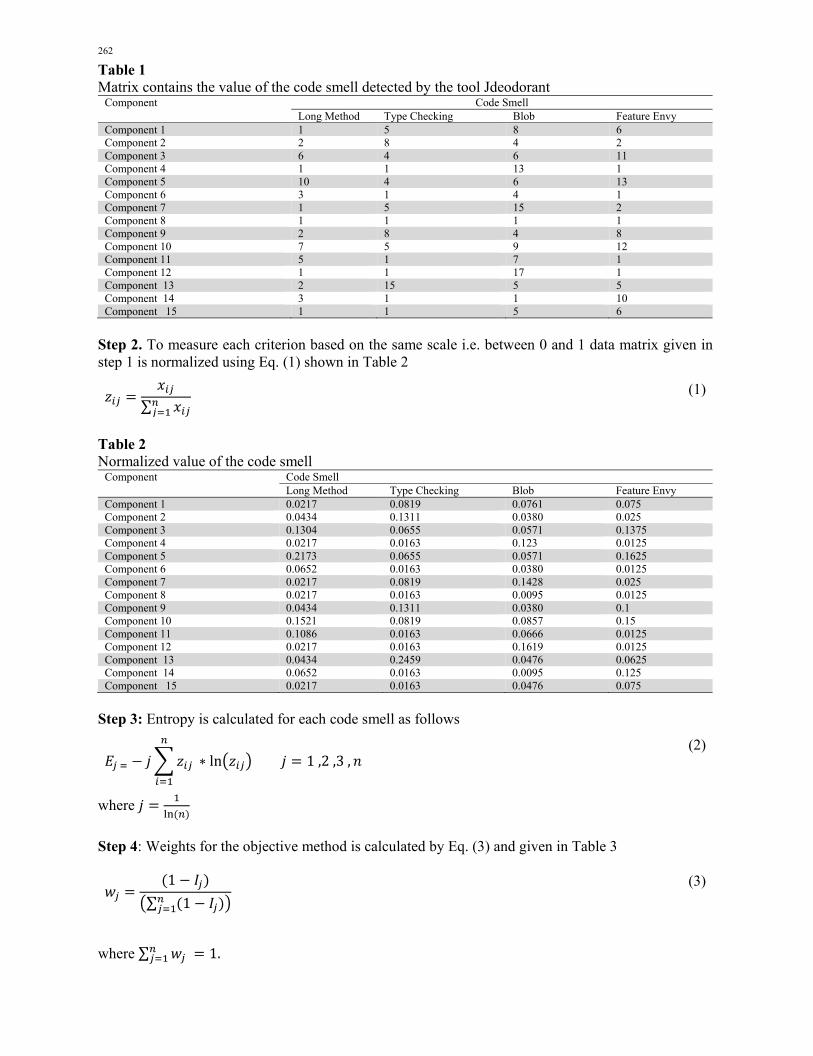
Table 1 Matrix contains the value of the code smell detected by the tool Jdeodorant
Component Code Smell Long Method Type Checking Blob Feature Envy
Component 1 1 5 8 6 Component 2 2 8 4 2 Component 3 6 4 6 11 Component 4 1 1 13 1 Component 5 10 4 6 13 Component 6 3 1 4 1 Component 7 1 5 15 2 Component 8 1 1 1 1 Component 9 2 8 4 8 Component 10 7 5 9 12 Component 11 5 1 7 1 Component 12 1 1 17 1 Component 13 2 15 5 5 Component 14 3 1 1 10 Component 15 1 1 5 6
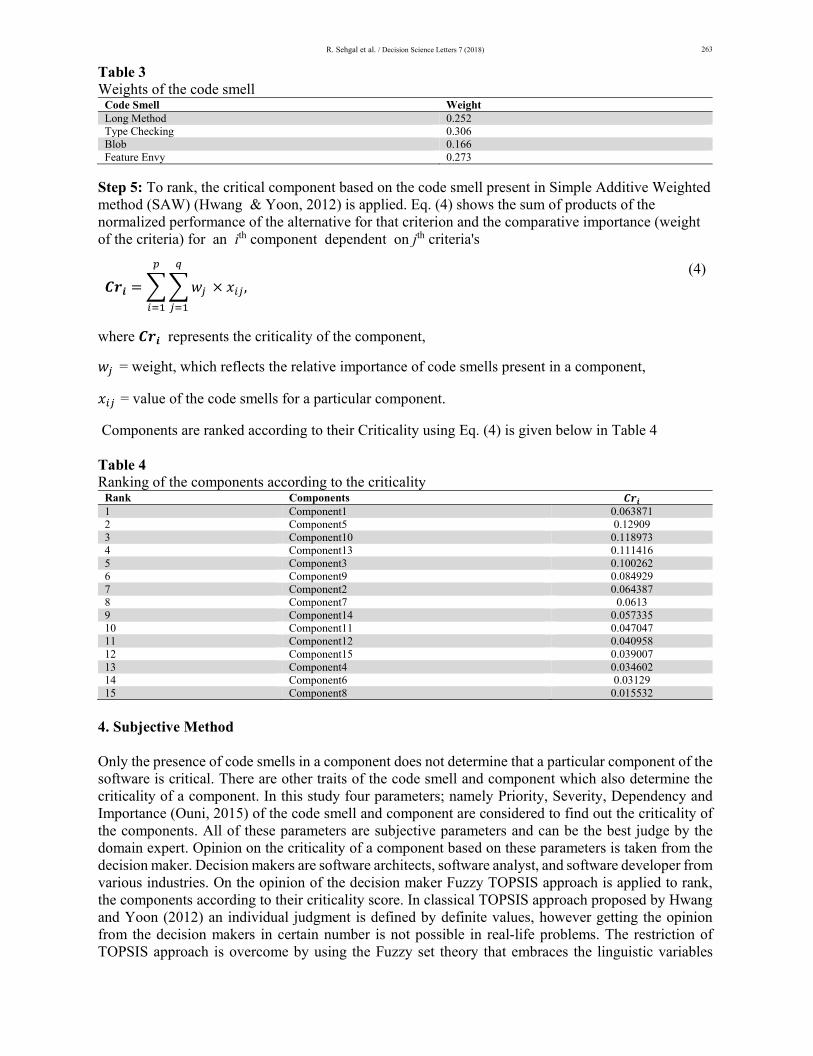
Step 2. To measure each criterion based on the same scale i.e. between 0 and 1 data matrix given in step 1 is normalized using Eq. (1) shown in Table 2
∑ (1)
Table 2 Normalized value of the code smell
Component Code Smell Long Method Type Checking Blob Feature Envy
Component 1 0.0217 0.0819 0.0761 0.075 Component 2 0.0434 0.1311 0.0380 0.025 Component 3 0.1304 0.0655 0.0571 0.1375 Component 4 0.0217 0.0163 0.123 0.0125 Component 5 0.2173 0.0655 0.0571 0.1625 Component 6 0.0652 0.0163 0.0380 0.0125 Component 7 0.0217 0.0819 0.1428 0.025 Component 8 0.0217 0.0163 0.0095 0.0125 Component 9 0.0434 0.1311 0.0380 0.1 Component 10 0.1521 0.0819 0.0857 0.15 Component 11 0.1086 0.0163 0.0666 0.0125 Component 12 0.0217 0.0163 0.1619 0.0125 Component 13 0.0434 0.2459 0.0476 0.0625 Component 14 0.0652 0.0163 0.0095 0.125 Component 15 0.0217 0.0163 0.0476 0.075
Step 3: Entropy is calculated for each code smell as follows
∗ ln 1,2 ,3 , (2)
where
Step 4: Weights for the objective method is calculated by Eq. (3) and given in Table 3
1
∑ 1
(3)
where ∑ 1.
R. Sehgal et al. / Decision Science Letters 7 (2018)
263
Table 3 Weights of the code smell
Code Smell Weight Long Method 0.252 Type Checking 0.306 Blob 0.166 Feature Envy 0.273
Step 5: To rank, the critical component based on the code smell present in Simple Additive Weighted method (SAW) (Hwang & Yoon, 2012) is applied. Eq. (4) shows the sum of products of the normalized performance of the alternative for that criterion and the comparative importance (weight of the criteria) for an ith component dependent on jth criteria's
, (4)
where represents the criticality of the component,
= weight, which reflects the relative importance of code smells present in a component,
= value of the code smells for a particular component.
Components are ranked according to their Criticality using Eq. (4) is given below in Table 4 Table 4 Ranking of the components according to the criticality
Rank Components 1 Component1 0.063871 2 Component5 0.12909 3 Component10 0.118973 4 Component13 0.111416 5 Component3 0.100262 6 Component9 0.084929 7 Component2 0.064387 8 Component7 0.0613 9 Component14 0.057335 10 Component11 0.047047 11 Component12 0.040958 12 Component15 0.039007 13 Component4 0.034602 14 Component6 0.03129 15 Component8 0.015532
4. Subjective Method
Only the presence of code smells in a component does not determine that a particular component of the software is critical. There are other traits of the code smell and component which also determine the criticality of a component. In this study four parameters; namely Priority, Severity, Dependency and Importance (Ouni, 2015) of the code smell and component are considered to find out the criticality of the components. All of these parameters are subjective parameters and can be the best judge by the domain expert. Opinion on the criticality of a component based on these parameters is taken from the decision maker. Decision makers are software architects, software analyst, and software developer from various industries. On the opinion of the decision maker Fuzzy TOPSIS approach is applied to rank, the components according to their criticality score. In classical TOPSIS approach proposed by Hwang and Yoon (2012) an individual judgment is defined by definite values, however getting the opinion from the decision makers in certain number is not possible in real-life problems. The restriction of TOPSIS approach is overcome by using the Fuzzy set theory that embraces the linguistic variables
264
rather than certain values. This method based on the principle that selected alternative is having the shortest distance from the ideal solution and the farthest distance from the negative ideal solution. In the below section, the chosen parameter and the Fuzzy TOPSIS approach is discussed.
4.1 Priority
According to the decision makers, different code smells have different impacts on the software quality. In this study, opinions of decision makers on the criticality of the component depend on the amount of code smell present in the component. For example in a component of a software four different code smells; namely long method type checking Blob and Feature Envy are present. Decision makers take the opinion on the criticality of the components on the maximum presence of a code smell in a component.
4.2 Severity
Code smell detected in this study has a different impact on the software system, only quantitative measure of a code smell does not help in determining the criticality of a component; but it also depends on the severity of the code smell. According to the decision makers, every code smell has different severity score; the severity of code smell measures how much each code smell negatively contributes to the software system. For example, if the two code smells namely God class and Feature Envy have the same values detected from the tool Jdeordent, God class has more severity score than feature envy. Although these two code smells are present in the same amount, a critical component is identified by the severity of the code smell.
4.3 Dependency
To provide a complex system functionality, in a software system a group of components depends on each other. This composite functionality is affected if any modification is made in any component of the software. In addition, the replacement of a new version component will also cause the change of dependency between components. A component having more code smell but less dependent is said to be less critical than the component with more dependency with less code smell.
4.4 Importance
The importance of a component of software system depends on the usage of a component. A component of a software system is said to be more important than others if its usage is more than others. A component is said to be more critical than the other if it is frequently used, but it contains less code smell, rather than the component which is less in use but having more code smells. Identifying the importance of component can save the refactoring effort.
Based on the above discussed parameters Fuzzy TOPSIS approach is applied, below section described (i)Fuzzy sets (ii)Linguistic Variables (iii) Triangular Fuzzy Number (iv) Defuzzification
4.5 Fuzzy sets
An individual perception and general information using linguistic terms can be easily expressed by the Fuzzy sets
4.5.1Linguisticvariables These are the variables used in such a position which is difficult to define and is very complex. Artificial intelligence, pattern recognition, information retrieval and other related areas are the domain of the linguistic approach (Zadeh, 1975). For example, rather measuring the exact temperature, it can also be represented as linguistic variable if its values are compared with fuzzy variables like very cold, cold, hot, and very hot
R. Sehgal et al. / Decision Science Letters 7 (2018)
265
4.5.2TriangularFuzzyNumber
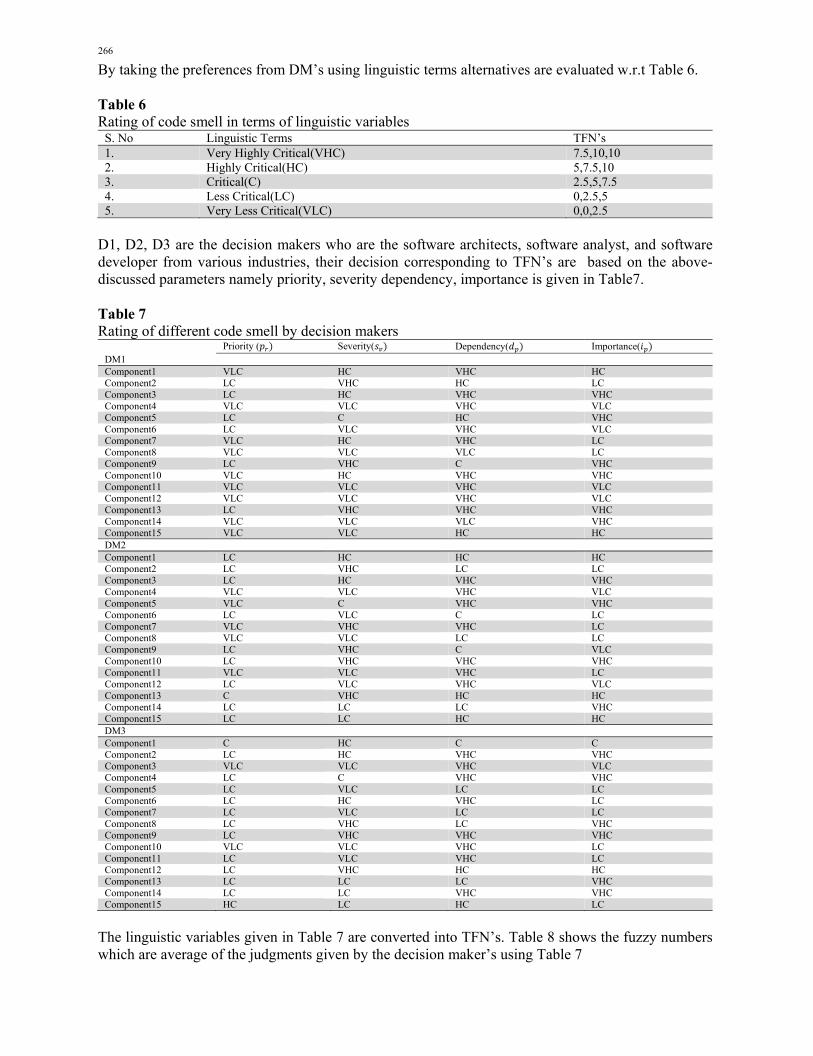
Individual perception of the decision maker is approximated by the linguistic variables. The approximation of the linguistic variable is represented by the Triangular Fuzzy Number (TFN) approach which is a widely adopted approach (Zadeh, 1975). Using the membership function as given below Eq. (5). A TFN is defined by a triplet low, medium, high (l, m, h).
if
if m q h
0 otherwise
q ll q m
m lm q
qh q
(5)
Table 5 shows the important weights for each criteria and membership function. Using the triangular membership function various fuzzy arithmetic operations can be applied.
If Y=(a1,b1,c1) and Z=(a2,b2,c2) then Addition: (Y+Z) = (a1+a2, b1+b2, c1+c2) Multiplication :( Y*Z) = (a1a2, b1b2, c2c3) Inverse: Y-1= (1/a1, 1/b1.1/c1) Table 5 Linguistic variable for importance weight of each code smell
Fuzzy number Linguistic scale Membership function 1 Very less Critical 1,1,3 3 Less Critical 1,3,5 5 Critical 3,5,7 7 Highly Critical 5,7,9 9 Very Highly Critical 7,9,9
4.5.3Defuzzfication To get the weights in real number defuzzification is required. Defuzzification can be performed in many ways, but the most popular way of defuzzification is centroid which is given in Eq. (6) (Deng, 1999).
46
(6)
4.6 Fuzzy TOPSIS method to calculate the subjective weight Based on the above discussion on chosen parameters the following steps are used to rank the components according to their criticality score using Fuzzy TOPSIS method (Sun, 2010). Step (i) The evaluation of three decision makers(DM’s) with three alternatives and four criteria namely Priority ( ,Severity( ,Dependency( ,Importance( are calculated by Eq. (7) using Chen’s methodology (Chen, 2000). The elements of yij of the decision matrix show that the performance rating of ith alternatives component of software system corresponding to the nth criteria w.r.t the mth DM
… .
⋮ ⋮ ⋮
(7)
266
By taking the preferences from DM’s using linguistic terms alternatives are evaluated w.r.t Table 6. Table 6 Rating of code smell in terms of linguistic variables
S. No Linguistic Terms TFN’s 1. Very Highly Critical(VHC) 7.5,10,10 2. Highly Critical(HC) 5,7.5,10 3. Critical(C) 2.5,5,7.5 4. Less Critical(LC) 0,2.5,5 5. Very Less Critical(VLC) 0,0,2.5
D1, D2, D3 are the decision makers who are the software architects, software analyst, and software developer from various industries, their decision corresponding to TFN’s are based on the above-discussed parameters namely priority, severity dependency, importance is given in Table7. Table 7 Rating of different code smell by decision makers
Priority ( Severity( Dependency( Importance( DM1 Component1 VLC HC VHC HC Component2 LC VHC HC LC Component3 LC HC VHC VHC Component4 VLC VLC VHC VLC Component5 LC C HC VHC Component6 LC VLC VHC VLC Component7 VLC HC VHC LC Component8 VLC VLC VLC LC Component9 LC VHC C VHC Component10 VLC HC VHC VHC Component11 VLC VLC VHC VLC Component12 VLC VLC VHC VLC Component13 LC VHC VHC VHC Component14 VLC VLC VLC VHC Component15 VLC VLC HC HC DM2 Component1 LC HC HC HC Component2 LC VHC LC LC Component3 LC HC VHC VHC Component4 VLC VLC VHC VLC Component5 VLC C VHC VHC Component6 LC VLC C LC Component7 VLC VHC VHC LC Component8 VLC VLC LC LC Component9 LC VHC C VLC Component10 LC VHC VHC VHC Component11 VLC VLC VHC LC Component12 LC VLC VHC VLC Component13 C VHC HC HC Component14 LC LC LC VHC Component15 LC LC HC HC DM3 Component1 C HC C C Component2 LC HC VHC VHC Component3 VLC VLC VHC VLC Component4 LC C VHC VHC Component5 LC VLC LC LC Component6 LC HC VHC LC Component7 LC VLC LC LC Component8 LC VHC LC VHC Component9 LC VHC VHC VHC Component10 VLC VLC VHC LC Component11 LC VLC VHC LC Component12 LC VHC HC HC Component13 LC LC LC VHC Component14 LC LC VHC VHC Component15 HC LC HC LC
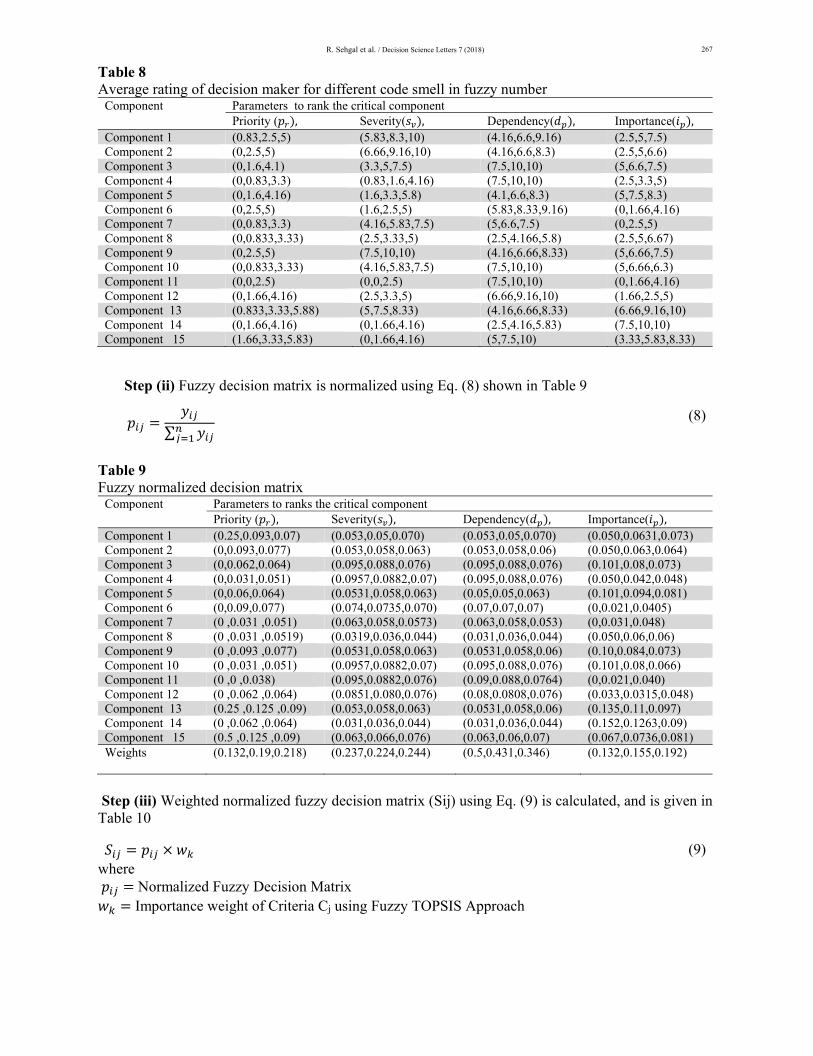
The linguistic variables given in Table 7 are converted into TFN’s. Table 8 shows the fuzzy numbers which are average of the judgments given by the decision maker’s using Table 7
R. Sehgal et al. / Decision Science Letters 7 (2018)
267
Table 8 Average rating of decision maker for different code smell in fuzzy number
Component Parameters to rank the critical componentPriority ( , Severity( , Dependency( , Importance( ,
Component 1 (0.83,2.5,5) (5.83,8.3,10) (4.16,6.6,9.16) (2.5,5,7.5) Component 2 (0,2.5,5) (6.66,9.16,10) (4.16,6.6,8.3) (2.5,5,6.6) Component 3 (0,1.6,4.1) (3.3,5,7.5) (7.5,10,10) (5,6.6,7.5) Component 4 (0,0.83,3.3) (0.83,1.6,4.16) (7.5,10,10) (2.5,3.3,5) Component 5 (0,1.6,4.16) (1.6,3.3,5.8) (4.1,6.6,8.3) (5,7.5,8.3) Component 6 (0,2.5,5) (1.6,2.5,5) (5.83,8.33,9.16) (0,1.66,4.16) Component 7 (0,0.83,3.3) (4.16,5.83,7.5) (5,6.6,7.5) (0,2.5,5) Component 8 (0,0.833,3.33) (2.5,3.33,5) (2.5,4.166,5.8) (2.5,5,6.67) Component 9 (0,2.5,5) (7.5,10,10) (4.16,6.66,8.33) (5,6.66,7.5) Component 10 (0,0.833,3.33) (4.16,5.83,7.5) (7.5,10,10) (5,6.66,6.3) Component 11 (0,0,2.5) (0,0,2.5) (7.5,10,10) (0,1.66,4.16) Component 12 (0,1.66,4.16) (2.5,3.3,5) (6.66,9.16,10) (1.66,2.5,5) Component 13 (0.833,3.33,5.88) (5,7.5,8.33) (4.16,6.66,8.33) (6.66,9.16,10) Component 14 (0,1.66,4.16) (0,1.66,4.16) (2.5,4.16,5.83) (7.5,10,10) Component 15 (1.66,3.33,5.83) (0,1.66,4.16) (5,7.5,10) (3.33,5.83,8.33)
Step (ii) Fuzzy decision matrix is normalized using Eq. (8) shown in Table 9
∑ (8)
Table 9 Fuzzy normalized decision matrix
Component Parameters to ranks the critical component Priority ( , Severity( , Dependency( , Importance( ,
Component 1 (0.25,0.093,0.07) (0.053,0.05,0.070) (0.053,0.05,0.070) (0.050,0.0631,0.073) Component 2 (0,0.093,0.077) (0.053,0.058,0.063) (0.053,0.058,0.06) (0.050,0.063,0.064) Component 3 (0,0.062,0.064) (0.095,0.088,0.076) (0.095,0.088,0.076) (0.101,0.08,0.073) Component 4 (0,0.031,0.051) (0.0957,0.0882,0.07) (0.095,0.088,0.076) (0.050,0.042,0.048)Component 5 (0,0.06,0.064) (0.0531,0.058,0.063) (0.05,0.05,0.063) (0.101,0.094,0.081) Component 6 (0,0.09,0.077) (0.074,0.0735,0.070) (0.07,0.07,0.07) (0,0.021,0.0405)Component 7 (0 ,0.031 ,0.051) (0.063,0.058,0.0573) (0.063,0.058,0.053) (0,0.031,0.048) Component 8 (0 ,0.031 ,0.0519) (0.0319,0.036,0.044) (0.031,0.036,0.044) (0.050,0.06,0.06) Component 9 (0 ,0.093 ,0.077) (0.0531,0.058,0.063) (0.0531,0.058,0.06) (0.10,0.084,0.073)Component 10 (0 ,0.031 ,0.051) (0.0957,0.0882,0.07) (0.095,0.088,0.076) (0.101,0.08,0.066) Component 11 (0 ,0 ,0.038) (0.095,0.0882,0.076) (0.09,0.088,0.0764) (0,0.021,0.040) Component 12 (0 ,0.062 ,0.064) (0.0851,0.080,0.076) (0.08,0.0808,0.076) (0.033,0.0315,0.048)Component 13 (0.25 ,0.125 ,0.09) (0.053,0.058,0.063) (0.0531,0.058,0.06) (0.135,0.11,0.097) Component 14 (0 ,0.062 ,0.064) (0.031,0.036,0.044) (0.031,0.036,0.044) (0.152,0.1263,0.09) Component 15 (0.5 ,0.125 ,0.09) (0.063,0.066,0.076) (0.063,0.06,0.07) (0.067,0.0736,0.081) Weights (0.132,0.19,0.218)
(0.237,0.224,0.244)
(0.5,0.431,0.346)
(0.132,0.155,0.192)
Step (iii) Weighted normalized fuzzy decision matrix (Sij) using Eq. (9) is calculated, and is given in Table 10
(9) where Normalized Fuzzy Decision Matrix
Importance weight of Criteria Cj using Fuzzy TOPSIS Approach
268
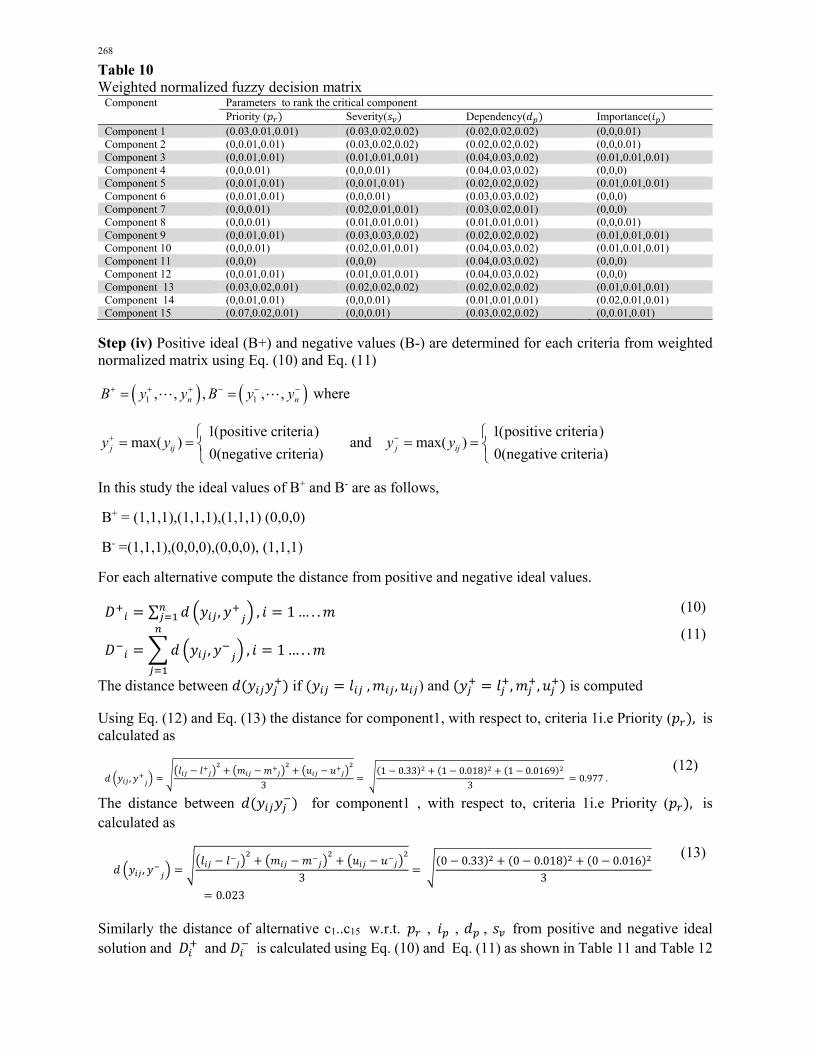
Table 10 Weighted normalized fuzzy decision matrix
Component Parameters to rank the critical component Priority ( Severity( Dependency( Importance(
Component 1 (0.03,0.01,0.01) (0.03,0.02,0.02) (0.02,0.02,0.02) (0,0,0.01) Component 2 (0,0.01,0.01) (0.03,0.02,0.02) (0.02,0.02,0.02) (0,0,0.01) Component 3 (0,0.01,0.01) (0.01,0.01,0.01) (0.04,0.03,0.02) (0.01,0.01,0.01) Component 4 (0,0,0.01) (0,0,0.01) (0.04,0.03,0.02) (0,0,0) Component 5 (0,0.01,0.01) (0,0.01,0.01) (0.02,0.02,0.02) (0.01,0.01,0.01) Component 6 (0,0.01,0.01) (0,0,0.01) (0.03,0.03,0.02) (0,0,0) Component 7 (0,0,0.01) (0.02,0.01,0.01) (0.03,0.02,0.01) (0,0,0) Component 8 (0,0,0.01) (0.01,0.01,0.01) (0.01,0.01,0.01) (0,0,0.01) Component 9 (0,0.01,0.01) (0.03,0.03,0.02) (0.02,0.02,0.02) (0.01,0.01,0.01) Component 10 (0,0,0.01) (0.02,0.01,0.01) (0.04,0.03,0.02) (0.01,0.01,0.01) Component 11 (0,0,0) (0,0,0) (0.04,0.03,0.02) (0,0,0) Component 12 (0,0.01,0.01) (0.01,0.01,0.01) (0.04,0.03,0.02) (0,0,0) Component 13 (0.03,0.02,0.01) (0.02,0.02,0.02) (0.02,0.02,0.02) (0.01,0.01,0.01) Component 14 (0,0.01,0.01) (0,0,0.01) (0.01,0.01,0.01) (0.02,0.01,0.01) Component 15 (0.07,0.02,0.01) (0,0,0.01) (0.03,0.02,0.02) (0,0.01,0.01)
Step (iv) Positive ideal (B+) and negative values (B-) are determined for each criteria from weighted normalized matrix using Eq. (10) and Eq. (11)
1 1, , , , ,n nB y y B y y where
1(positive criteria)max( )
0(negative criteria)j ijy y
and
1(positive criteria)max( )
0(negative criteria)j ijy y
In this study the ideal values of B+ and B- are as follows,
B+ = (1,1,1),(1,1,1),(1,1,1) (0,0,0)
B- =(1,1,1),(0,0,0),(0,0,0), (1,1,1)
For each alternative compute the distance from positive and negative ideal values.
∑ , , 1… . . (10)
, , 1… . . (11)
The distance between if , , ) and , , is computed
Using Eq. (12) and Eq. (13) the distance for component1, with respect to, criteria 1i.e Priority ( , is calculated as
,3
1 0.33 1 0.018 1 0.01693
0.977. (12)
The distance between for component1 , with respect to, criteria 1i.e Priority ( , is calculated as
,3
0 0.33 0 0.018 0 0.0163
0.023
(13)
Similarly the distance of alternative c1..c15 w.r.t. , , , from positive and negative ideal solution and and is calculated using Eq. (10) and Eq. (11) as shown in Table 11 and Table 12
R. Sehgal et al. / Decision Science Letters 7 (2018)
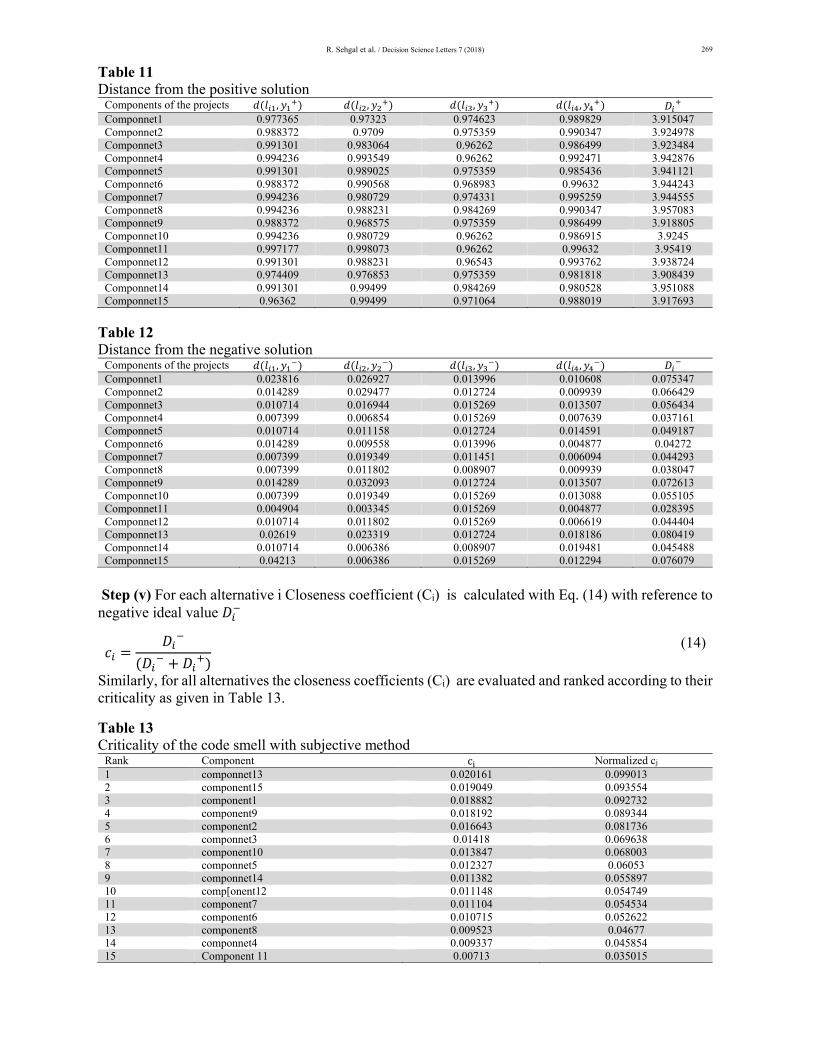
269
Table 11 Distance from the positive solution
Components of the projects , , , , Componnet1 0.977365 0.97323 0.974623 0.989829 3.915047 Componnet2 0.988372 0.9709 0.975359 0.990347 3.924978Componnet3 0.991301 0.983064 0.96262 0.986499 3.923484 Componnet4 0.994236 0.993549 0.96262 0.992471 3.942876 Componnet5 0.991301 0.989025 0.975359 0.985436 3.941121 Componnet6 0.988372 0.990568 0.968983 0.99632 3.944243 Componnet7 0.994236 0.980729 0.974331 0.995259 3.944555 Componnet8 0.994236 0.988231 0.984269 0.990347 3.957083 Componnet9 0.988372 0.968575 0.975359 0.986499 3.918805 Componnet10 0.994236 0.980729 0.96262 0.986915 3.9245 Componnet11 0.997177 0.998073 0.96262 0.99632 3.95419 Componnet12 0.991301 0.988231 0.96543 0.993762 3.938724 Componnet13 0.974409 0.976853 0.975359 0.981818 3.908439 Componnet14 0.991301 0.99499 0.984269 0.980528 3.951088Componnet15 0.96362 0.99499 0.971064 0.988019 3.917693
Table 12 Distance from the negative solution
Components of the projects , , , , Componnet1 0.023816 0.026927 0.013996 0.010608 0.075347 Componnet2 0.014289 0.029477 0.012724 0.009939 0.066429 Componnet3 0.010714 0.016944 0.015269 0.013507 0.056434 Componnet4 0.007399 0.006854 0.015269 0.007639 0.037161 Componnet5 0.010714 0.011158 0.012724 0.014591 0.049187 Componnet6 0.014289 0.009558 0.013996 0.004877 0.04272 Componnet7 0.007399 0.019349 0.011451 0.006094 0.044293 Componnet8 0.007399 0.011802 0.008907 0.009939 0.038047 Componnet9 0.014289 0.032093 0.012724 0.013507 0.072613 Componnet10 0.007399 0.019349 0.015269 0.013088 0.055105 Componnet11 0.004904 0.003345 0.015269 0.004877 0.028395 Componnet12 0.010714 0.011802 0.015269 0.006619 0.044404 Componnet13 0.02619 0.023319 0.012724 0.018186 0.080419 Componnet14 0.010714 0.006386 0.008907 0.019481 0.045488 Componnet15 0.04213 0.006386 0.015269 0.012294 0.076079
Step (v) For each alternative i Closeness coefficient (Ci) is calculated with Eq. (14) with reference to negative ideal value
(14)
Similarly, for all alternatives the closeness coefficients (Ci) are evaluated and ranked according to their criticality as given in Table 13.
Table 13 Criticality of the code smell with subjective method
Rank Component c Normalized cj 1 componnet13 0.020161 0.099013 2 component15 0.019049 0.093554 3 component1 0.018882 0.092732 4 component9 0.018192 0.089344 5 component2 0.016643 0.081736 6 componnet3 0.01418 0.069638 7 component10 0.013847 0.068003 8 componnet5 0.012327 0.06053 9 componnet14 0.011382 0.055897 10 comp[onent12 0.011148 0.054749 11 component7 0.011104 0.054534 12 component6 0.010715 0.052622 13 component8 0.009523 0.04677 14 componnet4 0.009337 0.045854 15 Component 11 0.00713 0.035015
270
5. Combined ranking using sensitivity Analysis.
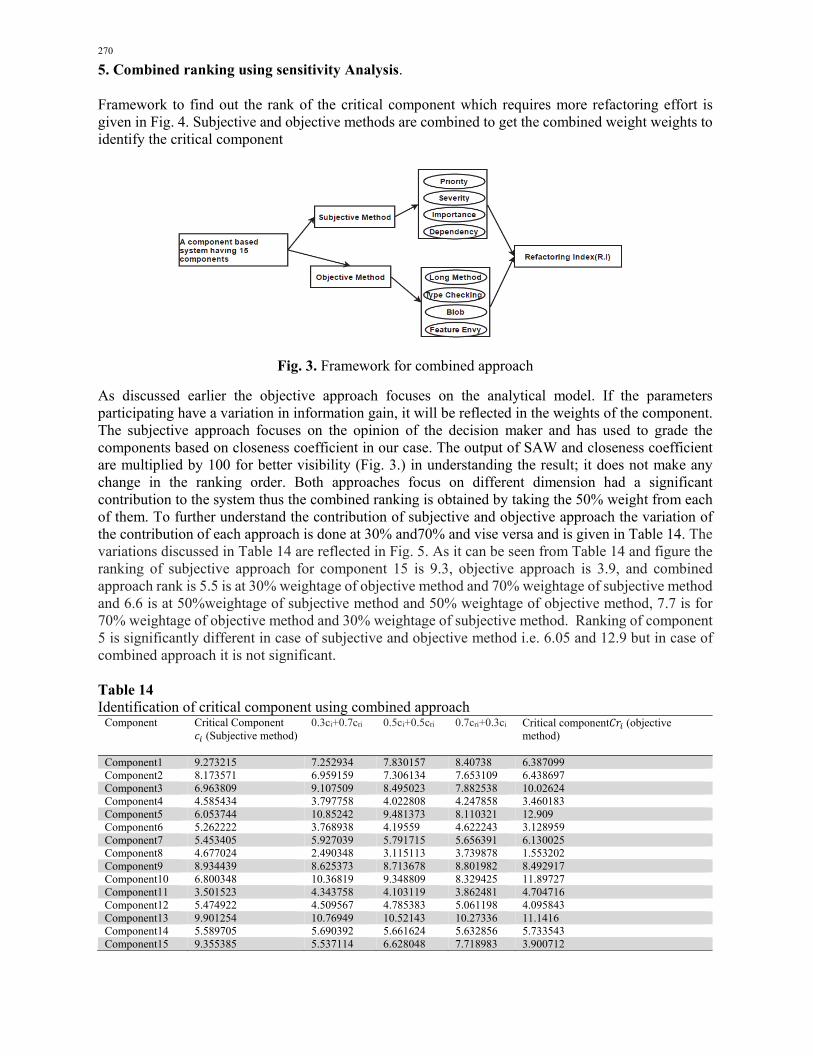
Framework to find out the rank of the critical component which requires more refactoring effort is given in Fig. 4. Subjective and objective methods are combined to get the combined weight weights to identify the critical component
Fig. 3. Framework for combined approach
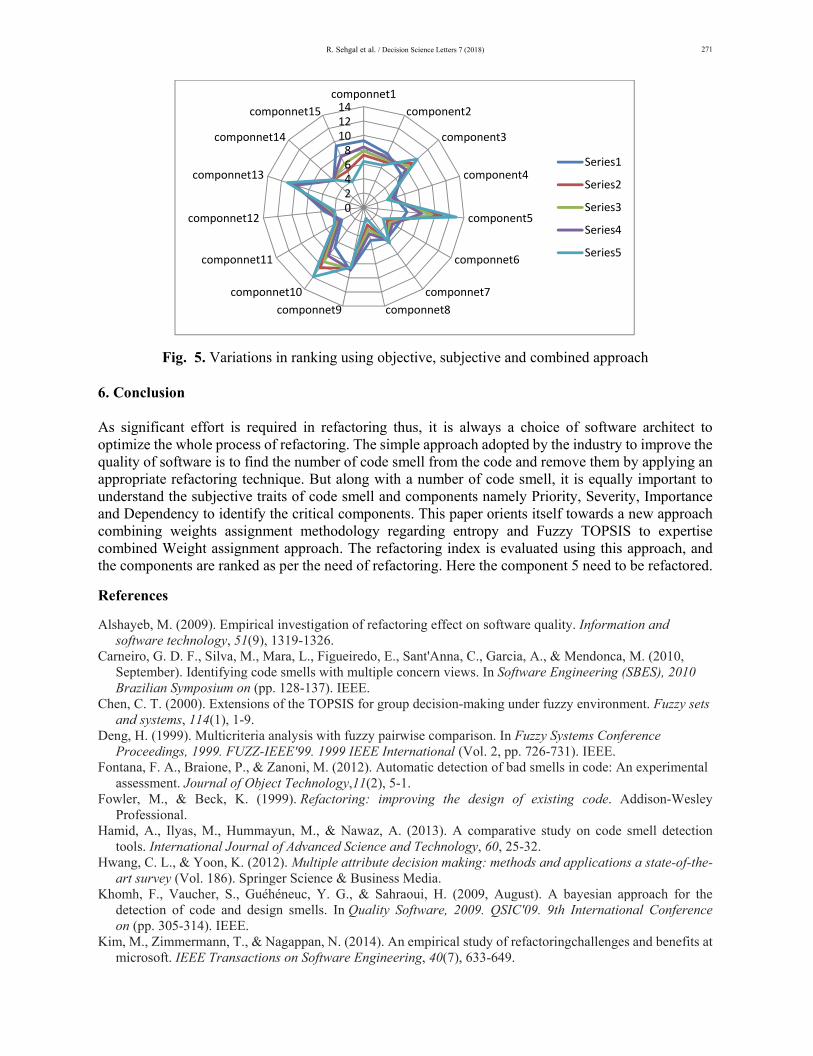
As discussed earlier the objective approach focuses on the analytical model. If the parameters participating have a variation in information gain, it will be reflected in the weights of the component. The subjective approach focuses on the opinion of the decision maker and has used to grade the components based on closeness coefficient in our case. The output of SAW and closeness coefficient are multiplied by 100 for better visibility (Fig. 3.) in understanding the result; it does not make any change in the ranking order. Both approaches focus on different dimension had a significant contribution to the system thus the combined ranking is obtained by taking the 50% weight from each of them. To further understand the contribution of subjective and objective approach the variation of the contribution of each approach is done at 30% and70% and vise versa and is given in Table 14. The variations discussed in Table 14 are reflected in Fig. 5. As it can be seen from Table 14 and figure the ranking of subjective approach for component 15 is 9.3, objective approach is 3.9, and combined approach rank is 5.5 is at 30% weightage of objective method and 70% weightage of subjective method and 6.6 is at 50%weightage of subjective method and 50% weightage of objective method, 7.7 is for 70% weightage of objective method and 30% weightage of subjective method. Ranking of component 5 is significantly different in case of subjective and objective method i.e. 6.05 and 12.9 but in case of combined approach it is not significant. Table 14 Identification of critical component using combined approach
Component Critical Component (Subjective method)
0.3ci+0.7cri 0.5ci+0.5cri 0.7cri+0.3ci Critical component (objective method)
Component1 9.273215 7.252934 7.830157 8.40738 6.387099 Component2 8.173571 6.959159 7.306134 7.653109 6.438697 Component3 6.963809 9.107509 8.495023 7.882538 10.02624 Component4 4.585434 3.797758 4.022808 4.247858 3.460183 Component5 6.053744 10.85242 9.481373 8.110321 12.909 Component6 5.262222 3.768938 4.19559 4.622243 3.128959 Component7 5.453405 5.927039 5.791715 5.656391 6.130025 Component8 4.677024 2.490348 3.115113 3.739878 1.553202 Component9 8.934439 8.625373 8.713678 8.801982 8.492917 Component10 6.800348 10.36819 9.348809 8.329425 11.89727 Component11 3.501523 4.343758 4.103119 3.862481 4.704716 Component12 5.474922 4.509567 4.785383 5.061198 4.095843 Component13 9.901254 10.76949 10.52143 10.27336 11.1416 Component14 5.589705 5.690392 5.661624 5.632856 5.733543 Component15 9.355385 5.537114 6.628048 7.718983 3.900712
R. Sehgal et al. / Decision Science Letters 7 (2018)
271
Fig. 5. Variations in ranking using objective, subjective and combined approach
6. Conclusion
As significant effort is required in refactoring thus, it is always a choice of software architect to optimize the whole process of refactoring. The simple approach adopted by the industry to improve the quality of software is to find the number of code smell from the code and remove them by applying an appropriate refactoring technique. But along with a number of code smell, it is equally important to understand the subjective traits of code smell and components namely Priority, Severity, Importance and Dependency to identify the critical components. This paper orients itself towards a new approach combining weights assignment methodology regarding entropy and Fuzzy TOPSIS to expertise combined Weight assignment approach. The refactoring index is evaluated using this approach, and the components are ranked as per the need of refactoring. Here the component 5 need to be refactored.
References
Alshayeb, M. (2009). Empirical investigation of refactoring effect on software quality. Information and software technology, 51(9), 1319-1326.
Carneiro, G. D. F., Silva, M., Mara, L., Figueiredo, E., Sant'Anna, C., Garcia, A., & Mendonca, M. (2010, September). Identifying code smells with multiple concern views. In Software Engineering (SBES), 2010 Brazilian Symposium on (pp. 128-137). IEEE.
Chen, C. T. (2000). Extensions of the TOPSIS for group decision-making under fuzzy environment. Fuzzy sets and systems, 114(1), 1-9.
Deng, H. (1999). Multicriteria analysis with fuzzy pairwise comparison. In Fuzzy Systems Conference Proceedings, 1999. FUZZ-IEEE'99. 1999 IEEE International (Vol. 2, pp. 726-731). IEEE.
Fontana, F. A., Braione, P., & Zanoni, M. (2012). Automatic detection of bad smells in code: An experimental assessment. Journal of Object Technology,11(2), 5-1.
Fowler, M., & Beck, K. (1999). Refactoring: improving the design of existing code. Addison-Wesley Professional.
Hamid, A., Ilyas, M., Hummayun, M., & Nawaz, A. (2013). A comparative study on code smell detection tools. International Journal of Advanced Science and Technology, 60, 25-32.
Hwang, C. L., & Yoon, K. (2012). Multiple attribute decision making: methods and applications a state-of-the-art survey (Vol. 186). Springer Science & Business Media.
Khomh, F., Vaucher, S., Guéhéneuc, Y. G., & Sahraoui, H. (2009, August). A bayesian approach for the detection of code and design smells. In Quality Software, 2009. QSIC'09. 9th International Conference on (pp. 305-314). IEEE.
Kim, M., Zimmermann, T., & Nagappan, N. (2014). An empirical study of refactoringchallenges and benefits at microsoft. IEEE Transactions on Software Engineering, 40(7), 633-649.
02468101214
componnet1
component2
component3
component4
component5
componnet6
componnet7
componnet8componnet9
componnet10
componnet11
componnet12
componnet13
componnet14
componnet15
Series1
Series2
Series3
Series4
Series5
272
Li, W., & Shatnawi, R. (2007). An empirical study of the bad smells and class error probability in the post-release object-oriented system evolution. Journal of systems and software, 80(7), 1120-1128.
Mens, T., Taentzer, G., & Runge, O. (2007). Analysing refactoring dependencies using graph transformation. Software and Systems Modeling,6(3), 269.
Murphy-Hill, E., Parnin, C., & Black, A. P. (2012). How we refactor, and how we know it. IEEE Transactions on Software Engineering, 38(1), 5-18.
Mansoor, U., Kessentini, M., Bechikh, S., & Deb, K. (2013). Code-smells detection using good and bad software design examples. Technical report, Technical Report.
Moha, N., Guéhéneuc, Y. G., Le Meur, A. F., Duchien, L., & Tiberghien, A. (2010). From a domain analysis to the specification and detection of code and design smells. Formal Aspects of Computing, 22(3-4), 345-361.
Nagpal, R., Mehrotra, D., & Bhatia, P. K. (2016). Usability evaluation of website using combined weighted method: fuzzy AHP and entropy approach.International Journal of System Assurance Engineering and Management,7(4), 408-417.
Ouni, A., Kessentini, M., Cinnéide, M. O., Sahraoui, H., Deb, K., & Inoue, K. (2017). MORE: A Multi-objective Refactoring Recommendation Approach to Introducing Design Patterns and Fixing Code Smells.
Ouni, A. (2015). A Mono-and Multi-objective Approach for Recommending Software Refactoring. Peters, R., & Zaidman, A. (2012, March). Evaluating the lifespan of code smells using software repository
mining. In Software Maintenance and Reengineering (CSMR), 2012 16th European Conference on (pp. 411-416). IEEE.
Piveta, E., Araújo, J., Pimenta, M., Moreira, A., Guerreiro, P., & Price, R. T. (2008, July). Searching for opportunities of refactoring sequences: reducing the search space. In Computer Software and Applications, 2008. COMPSAC'08. 32nd Annual IEEE International (pp. 319-326). IEEE.
Rahman, F., Bird, C., & Devanbu, P. (2012). Clones: What is that smell?.Empirical Software Engineering, 17(4-5), 503-530.
Shannon, C. E. (2001). A mathematical theory of communication. ACM SIGMOBILE Mobile Computing and Communications Review, 5(1), 3-55.
Soetens, Q. D., & Demeyer, S. (2010, September). Studying the effect of refactorings: a complexity metrics perspective. In Quality of Information and Communications Technology (QUATIC), 2010 Seventh International Conference on the (pp. 313-318). IEEE.
Singh, S., & Kaur, S. (2017). A systematic literature review: Refactoring for disclosing code smells in object oriented software. Ain Shams Engineering Journal.
Sun, C. C. (2010). A performance evaluation model by integrating fuzzy AHP and fuzzy TOPSIS methods. Expert systems with applications, 37(12), 7745-7754.
Tsantalis, N., & Chatzigeorgiou, A. (2011, March). Ranking refactoring suggestions based on historical volatility. In Software Maintenance and Reengineering (CSMR), 2011 15th European Conference on (pp. 25-34). IEEE.
Van Emden, E., & Moonen, L. (2002). Java quality assurance by detecting code smells. In Reverse Engineering, 2002. Proceedings. Ninth Working Conference on (pp. 97-106). IEEE.
Vakilian, M., Chen, N., Negara, S., Rajkumar, B. A., Bailey, B. P., & Johnson, R. E. (2012, June). Use, disuse, and misuse of automated refactorings. InProceedings of the 34th International Conference on Software Engineering(pp. 233-243). IEEE Press.
Weißgerber, P., & Diehl, S. (2006, May). Are refactorings less error-prone than other changes?. In Proceedings of the 2006 international workshop on Mining software repositories (pp. 112-118). ACM.
Zhang, H. P. (2015). Application on the entropy method for determination of weight of evaluating index in fuzzy mathematics for wine quality assessment.Advance Journal of Food Science and Technology, 7(3), 195-198.
Zou, Z. H., Yi, Y., & Sun, J. N. (2006). Entropy method for determination of weight of evaluating indicators in fuzzy synthetic evaluation for water quality assessment. Journal of Environmental Sciences, 18(5), 1020-1023.
Zadeh, L. A. (1975). The concept of a linguistic variable and its application to approximate reasoning—I. Information sciences, 8(3), 199-249.
© 2018 by the authors; licensee Growing Science, Canada. This is an open access article distributed under the terms and conditions of the Creative Commons Attribution (CC-BY) license (http://creativecommons.org/licenses/by/4.0/).
Top Related