


Languages
Pages
Legal


5th International Freiberg Conference on IGCC & XtL Technologies - IFC2012
Pressurized CO2-gasification of coal
Marek Sciazkoa, Tomasz Chmielniaka,
Grzegorz Tomaszewicza, Martyna Tomaszewiczb
a Institute for Chemical Processing of Coal, Zabrze, Poland
b Faculty of Chemistry, Silesian University of Technology, Gliwice, Poland
23 May 2012 Leipzig, Germany
1

Scope of presentation
1. A few words about the Institute for Chemical Processing of Coal
2. Clean Coal Technology Center
3. Coal gasification with CO2 as a co-gasifing agent
4. Factors influencing the Boudouard reaction
5. Process thermodynamic modeling
6. Coal samples and experimental setup
7. Results of preliminary studies on kinetics of Boudouard reaction
and evaluation of kinetic constants, and the latter dependencies
from selected coal parameters
8. Conclusions
9. Acknowledgments
2/23

Research Institute
57 years of experience
238 employees
184 research and scientific staff
4 accredited laboratories
Institute for Chemical Processing of Coal (IChPW)
3/23

Heat & power production
Fuels
IChPW R&D – main activities
4/23

Clean Coal Technology Center
5/23

C + CO2 ↔ 2CO + 172 kJ/mol C + O2 → CO2 - 396 kJ/mol C + H2O ↔ CO + H2 + 131 kJ/mol C + ½O2 → CO - 110 kJ/mol Effects:
• utilization of CO2 removed from fossil fuels conversion,
• increase of process yield and improvement of syngas synthesis economy,
• reduction of fossil fuels consumption in syngas production,
• decrease of oxygen consumption (CO2 as oxidation agent).
circulating fluidized bed reactor
Crude syngas
Char
Fossil fuel
CO2 O2, H2O
Coal gasification with CO2 as a co-gsifing agent
6/23
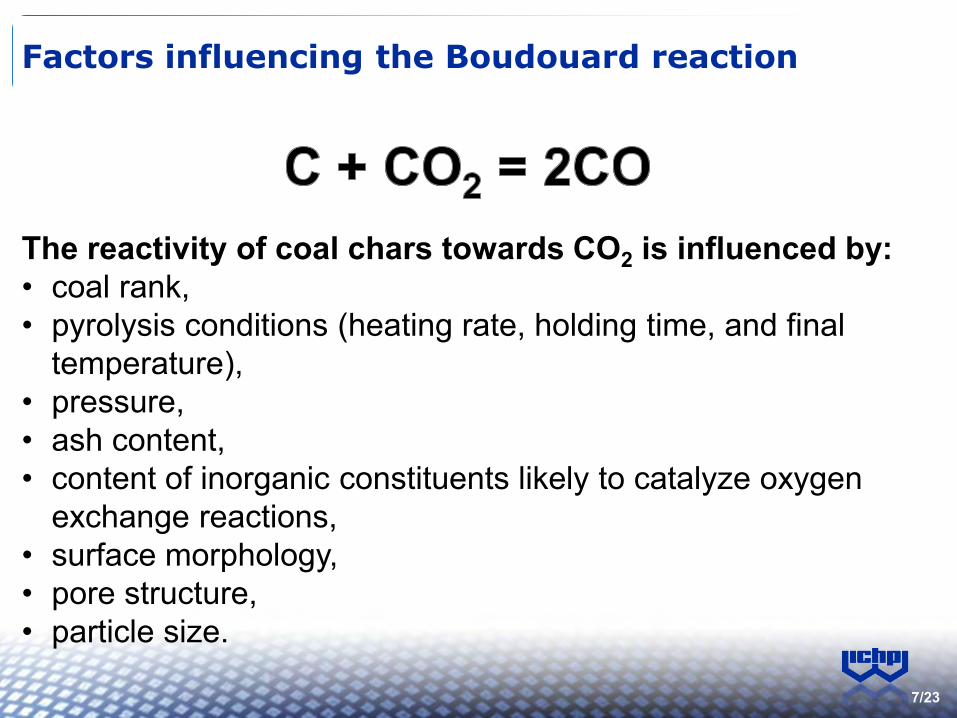
Factors influencing the Boudouard reaction
The reactivity of coal chars towards CO2 is influenced by: • coal rank, • pyrolysis conditions (heating rate, holding time, and final
temperature), • pressure, • ash content, • content of inorganic constituents likely to catalyze oxygen
exchange reactions, • surface morphology, • pore structure, • particle size.
7/23

Thermodynamic modeling
8/23
60
65
70
75
80
85
90
95
0.00 0.05 0.10 0.15 0.20 0.25 0.30 0.35 0.40
Col
d ga
s ef
ficie
ncy,
%
CO2/C, molar ratio
80090010001300

Thermodynamic modeling - summary
Parameter Unit Value Remarks
Consumption of fuel Mg/h 100 Janina (sub-bituminous coal)
Production
Methanol synthesis Mg/h 45.3 -
Power generation (oxy-fuel
combustion MW 75 net
Power generation (total) MW 36 net, including total system
needs
Efficiencies
Cold gas efficiency
(gasification) % 90.4 -
Methanol synthesis % 57.2 gross
Power generation (oxy-fuel
combustion) % 30.2 LHV, compression
9/23

hvCb
Coal samples
Coal
Turów Piast
Bogdanka Janina
LigB SubA
SubB
10/23
Heating rate = 5 K/min
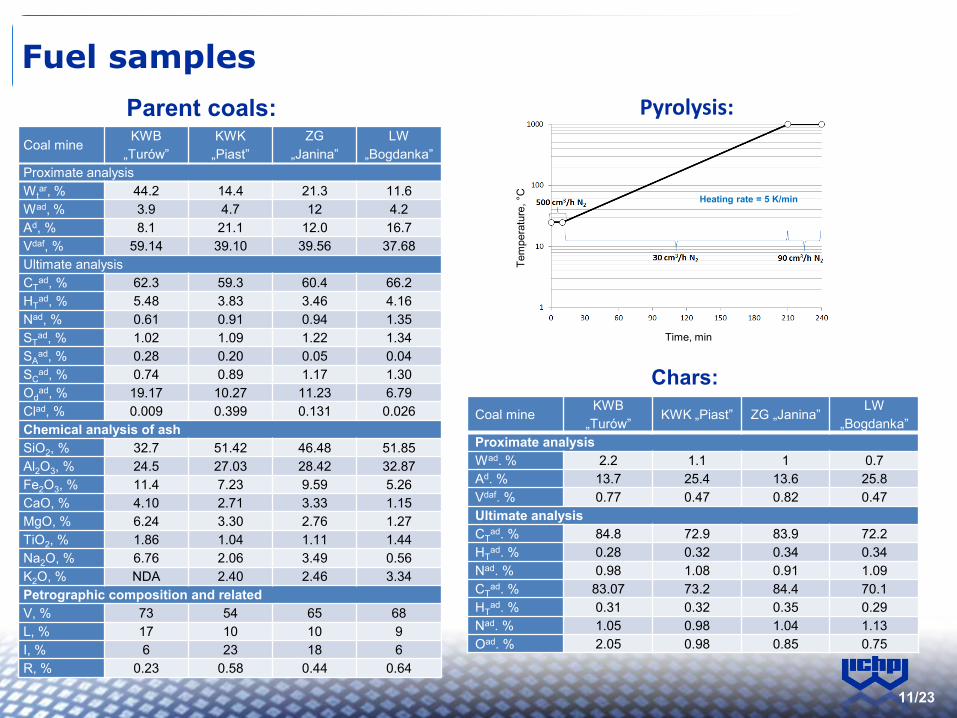
Coal mine KWB
„Turów” KWK
„Piast” ZG
„Janina” LW
„Bogdanka” Proximate analysis Wt
ar, % 44.2 14.4 21.3 11.6 Wad, % 3.9 4.7 12 4.2 Ad, % 8.1 21.1 12.0 16.7 Vdaf, % 59.14 39.10 39.56 37.68 Ultimate analysis CT
ad, % 62.3 59.3 60.4 66.2 HT
ad, % 5.48 3.83 3.46 4.16 Nad, % 0.61 0.91 0.94 1.35 ST
ad, % 1.02 1.09 1.22 1.34 SA
ad, % 0.28 0.20 0.05 0.04 SC
ad, % 0.74 0.89 1.17 1.30 Od
ad, % 19.17 10.27 11.23 6.79 Clad, % 0.009 0.399 0.131 0.026 Chemical analysis of ash SiO2, % 32.7 51.42 46.48 51.85 Al2O3, % 24.5 27.03 28.42 32.87 Fe2O3, % 11.4 7.23 9.59 5.26 CaO, % 4.10 2.71 3.33 1.15 MgO, % 6.24 3.30 2.76 1.27 TiO2, % 1.86 1.04 1.11 1.44 Na2O, % 6.76 2.06 3.49 0.56 K2O, % NDA 2.40 2.46 3.34 Petrographic composition and related V, % 73 54 65 68 L, % 17 10 10 9 I, % 6 23 18 6 R, % 0.23 0.58 0.44 0.64
Parent coals: Pyrolysis:
Coal mine KWB
„Turów” KWK „Piast” ZG „Janina”
LW „Bogdanka”
Proximate analysis Wad. % 2.2 1.1 1 0.7 Ad. % 13.7 25.4 13.6 25.8 Vdaf. % 0.77 0.47 0.82 0.47 Ultimate analysis CT
ad. % 84.8 72.9 83.9 72.2 HT
ad. % 0.28 0.32 0.34 0.34 Nad. % 0.98 1.08 0.91 1.09 CT
ad. % 83.07 73.2 84.4 70.1 HT
ad. % 0.31 0.32 0.35 0.29 Nad. % 1.05 0.98 1.04 1.13 Oad. % 2.05 0.98 0.85 0.75
Chars:
Fuel samples
Time, min
Tem
pera
ture
, °C
11/23

Char Sample mass – 3 g (ar) Grain size – 13.15 mm CO2 flow – 66 g/h Temperature – 950°C Pressure – 1, 10 and 20 bar
Schematic diagram of the experimental setup
12/23

The calculation procedure and analized models
44
32)(
28
16)(
44
3222
tmtmmout
CO
out
CO
in
CO
28
12)(
44
12)()(
44
1222
tmtmtmmout
CO
out
COC
in
CO
)(14
3)( tmtm
out
COC
m
(t)dtmtX
t
C
0
Xkdt
dXVM
1 tkXVM 1ln
3
2
1 Xkdt
dXGM
tkXGM 3
1
113
XXdt
dX 1ln1)1(
2
0
0014
S
L
tkXRPM 11ln1
2
11ln2
2
max
X
L0 – initial pore length related to volume of sample, S0 - initial surface area related to volume of sample, ε0 – initial porosity of sample.
1) Volumetric Model, VM:
2) Grain Model, GM:
3) Random Pore Model, RPM:
The rates of char conversion were calculated by balancing the amounts of carbon, and oxygen entering, and exiting the reaction system as a function of mass flowrate:
Combining of equations above yields an expression for an instantaneous mass consumption rate:
The relationship between the fractional conversion of carbon in the char (X) and time (t):
13/23

0
0.1
0.2
0.3
0.4
0.5
0.6
0.7
0.8
0.9
1
0 1200 2400 3600 4800 6000 7200 8400
Car
bo
n c
on
vers
ion
, X
, -
Time, t, s
Piast Char
1 bar
10 bar
20 bar
0
0.1
0.2
0.3
0.4
0.5
0.6
0.7
0.8
0.9
1
0 1200 2400 3600 4800 6000 7200 8400
Car
bo
n c
on
vers
ion
, X
, -
Time, t, s
Janina Char
1 bar
10 bar
20 bar
0
0.1
0.2
0.3
0.4
0.5
0.6
0.7
0.8
0.9
1
0 2400 4800 7200 9600 12000 14400
Car
bo
n c
on
vers
ion
, X
, -
Time, t ,s
Bogdanka Char
1 bar
10 bar
20 bar
Conversion vs. time data
0
0.1
0.2
0.3
0.4
0.5
0.6
0.7
0.8
0.9
1
0 600 1200 1800 2400 3000 3600 4200
Car
bo
n c
on
vers
ion
, X
, -
Czas, t, s
Turów Char
1 bar
10 bar
20 bar

y = 0.0006x r² = 0.8254
y = 0.0006x r² = 0.8222
y = 0.0007x r² = 0.8196
0
1
2
3
4
5
6
7
0 1200 2400 3600 4800 6000 7200 8400
-ln
(1-X
)
Time, t, s
Piast Char
1 bar
10 bar
20 bar
y = 0.000645x r² = 0.8802
y = 0.000655x r² = 0.8151
y = 0.000658x r² = 0.7855
0
1
2
3
4
5
6
7
8
9
0 1200 2400 3600 4800 6000 7200 8400
-ln
(1-X
)
Time, t, s
Janina Char
1 bar
10 bar
20 bar
y = 0.000225x r² = 0.7646
y = 0.000457x r² = 0.8489
y = 0.000382x r² = 0.7625
0
1
2
3
4
5
6
7
8
0 2400 4800 7200 9600 12000 14400
-ln
(1-X
)
Time, t, s
Bogdanka Char
1 bar
10 bar
20 bar
Volumetric Model
y = 0.001161x r² = 0.7835 y = 0.001180x
r² = 0.7884
y = 0.001127x r² = 0.7885
0
1
2
3
4
5
6
7
8
0 600 1200 1800 2400 3000 3600 4200
-ln
(1-X
)
Czas, t, s
Turów Char
1 bar
10 bar
20 bar

y = 0.000322x r² = 0.9724
y = 0.000377x r² = 0.9656
y = 0.000405x r² = 0.9741
0
0.5
1
1.5
2
2.5
3
0 1200 2400 3600 4800 6000 7200 8400
3(1
-(1
-X)1
/3)
Time, t, s
Piast Char
1 bar
10 bar
20 bar
y = 0.000331x r² = 0.9934
y = 0.000374x r² = 0.9761
y = 0.000383x r² = 0.9658
0
0.5
1
1.5
2
2.5
3
3.5
0 1200 2400 3600 4800 6000 7200 8400
3(1
-(1
-X)1/
3)
Time, t, s
Janina Char
1 bar
10 bar
20 bar
y = 0.000254x r² = 0.9861
y = 0.000262x r² = 0.9720
y = 0.000260x r² = 0.9688
0
0.5
1
1.5
2
2.5
3
0 1200 2400 3600 4800 6000 7200 8400 9600 10800
3(1
-(1
-X)1
/3)
Time, t, s
Bogdanka Char
1 bar
10 bar
20 bar
Grain Model
y = 0.000640x R² = 0.9722
y = 0.000663x R² = 0.9725
y = 0.000660x R² = 0.9770
0
0.5
1
1.5
2
2.5
3
0 600 1200 1800 2400 3000 3600 4200
3(1
-(1
-X)1
/3)
Time, t, s
Turów Char
1 bar
10 bar
20 bar

y = 0.000077x r² = 0.9963
y = 0.000155x r² = 0.9941 y = 0.000125x
r² = 0.9907
0
0.1
0.2
0.3
0.4
0.5
0.6
0.7
0.8
0 1200 2400 3600 4800 6000 7200 8400
Time, t, s
Bogdanka Char
1 bar
10 bar
20 bar
y = 0.000146x r² = 0.9995
y = 0.000166x r² = 0.9983
y = 0.000223x r² = 0.9922
0
0.1
0.2
0.3
0.4
0.5
0.6
0.7
0.8
0 600 1200 1800 2400 3000 3600 4200 4800
Time, t, s
Piast Char
1 bar
10 bar
20 bar
y = 0.000249x r² = 0.9896
y = 0.000280x r² = 0.9674
y = 0.000276x r² = 0.9511
0
0.5
1
1.5
2
2.5
0 1200 2400 3600 4800 6000 7200 8400Time, t, s
Janina Char
1 bar
10 bar
20 bar
Random Pore Model
y = 0.000382x r² = 0.9958
y = 0.000411x r² = 0.9929
y = 0.000420x R² = 0.99294r
0
0.2
0.4
0.6
0.8
1
1.2
0 600 1200 1800 2400 3000 3600
Czas, t, s
1 bar
10 bar
20 bar

kGM kRPM Pressure, bar 1 10 20 1 10 20 Bogdanka 0.000147 0.000257 0.000238 0.000077 0.000155 0.000125 Janina 0.000331 0.000374 0.000383 0.000249 0.000280 0.000276 Piast 0.000322 0.000377 0.000405 0.000146 0.000167 0.000234 Turów 0.00064 0.000663 0.000660 0.00039 0.000411 0.000420
Odiff/C, - CI, % R, % Bogdanka 0.103 3.663 0.64 Janina 0.186 5.734 0.44 Piast 0.173 7.817 0.58 Turów 0.308 9.877 0.23
Next step: to find a correlation between estimated kinetic
coefficients and properties of parent coals.
Results - summary
18/23

%,100
100
322
2232
OAlSiO
ONaOKOFeMgOCaOA
VCI d
daf
y = 0.0024x - 0.0001 r² = 0.9979
y = 0.0022x + 3E-06 r² = 0.9752
y = 0.002x + 3E-05 R² = 0.9874
0
0.0001
0.0002
0.0003
0.0004
0.0005
0.0006
0.0007
0.05 0.1 0.15 0.2 0.25 0.3 0.35 0.4
k GM
, 1/s
Odiff/C, -
1 bar
10 bar
20 bar
y = 0.0015x - 8E-05 r² = 0.9372
y = 0.0013x + 2E-06 r² = 0.8736
y = 0.0012x + 2E-05 r² = 0.9575
0
0.0001
0.0002
0.0003
0.0004
0.0005
0.05 0.1 0.15 0.2 0.25 0.3 0.35 0.4
k RP
M, 1
/s
Odiff/C, -
1 bar
10 bar
20 bar
y = 7E-05x - 0.0001 R² = 0.8557
y = 6E-05x + 2E-05 R² = 0.8308
y = 6E-05x + 9E-07 R² = 0.8973
0
0.0001
0.0002
0.0003
0.0004
0.0005
0.0006
0.0007
3 4 5 6 7 8 9 10
k GM
, 1/s
Catalytic index, %
1 bar
10 bar
20 bar
y = 4E-05x - 6E-05 R² = 0.6268
y = 3E-05x + 4E-05 R² = 0.5004
y = 4E-05x - 1E-05 R² = 0.7933
0
0.0001
0.0002
0.0003
0.0004
0.0005
3 4 5 6 7 8 9 10
k RP
M, 1
/s
Catalytic index, %
1 bar
10 bar
20 bar
y = -0.0011x + 0.0009 R² = 0.9083
y = -0.0009x + 0.0008 R² = 0.8962
y = -0.0009x + 0.0008 R² = 0.8645
0
0.0001
0.0002
0.0003
0.0004
0.0005
0.0006
0.0007
0.2 0.3 0.4 0.5 0.6 0.7 0.8
k GM
, 1/s
Ro, %
1 bar
10 bar
20 bar
y = -0.0007x + 0.0006 R² = 0.9924
y = -0.0007x + 0.0006 R² = 0.9903
y = -0.0007x + 0.0006 R² = 0.9422
0
0.0001
0.0002
0.0003
0.0004
0.0005
0.2 0.3 0.4 0.5 0.6 0.7 0.8
k RP
M, 1
/s
Ro, %
1 bar
10 bar
20 bar
19/23

Conclusions (1)
1. Results of performed thermodynamic calculations indicate that the addition of CO2 has beneficial effects, leading to a 30% decrease in coal consumption at the same carbon monoxide capacity as a conventional gasification system without CO2 addition.
2. Additionally, due to the oxidative role of CO2 as a gasifying agent, oxygen demand is also decreased. According to thermodynamic calculations, an increase in process pressure strongly diminishes the CO capacity.
3. In contrast to the thermodynamic calculations, our experimental data revealed that increasing the CO2 pressure leads to a higher reaction rate for medium-rank coal chars and low-rank lignite coal char, resulting in higher efficiency for carbon monoxide production.
4. The pressure influences the reactivity more strongly in the range of 1 to 10 bar; further pressure increases affect the rate almost insignificantly.
20/23
Conclusions (2)
5. The observed behavior representing the changes in the degree of carbon conversion during gasification are satisfactorily described by the grain model and random pore model.
6. The char derived from the Turów lignite proved to be much more reactive under the applied pressure conditions than the chars from the Janina, Piast and Bogdanka coals.
7. The very satisfactory values of the determination coefficients indicate a strong relationship between coal parameters and the reaction rate. The derived relationships suggest a great possibility for the development of semi-empirical rate expressions that can be used for the prediction of coal char behavior during pressurized gasification.
21/23

Acknowledgments
The research results presented herein were obtained during the course of the project “Development of coal gasification technology for high-efficiency production of fuels and energy”, Task No. 3 of the Strategic Program for Research and Development: "Advanced energy generation technologies" funded by the Polish National Center for Research and Development.
22/23

INSTITUTE FOR CHEMICAL PROCESSING OF COAL Zamkowa 1 Str. 41803 Zabrze, POLAND
Phone: +48 32 271 00 41 Fax: +48 32 271 08 09
E-mail: [email protected] Web: www.ichpw.zabrze.pl
THANK YOU FOR YOUR KIND ATTENTION
23/23
Top Related