


Languages
Pages
Legal


www.swagelok.com
Pressure Regulator F low CurvesTechnical Bul let in
ScopeSelecting a regulator for an application first requires review of its performance capabilities and their alignment with the application’s requirements. The best starting point is the regulator’s flow curve provided by the manufacturer, because it illustrates the regulator’s range of capabilities at one glance. The curve represents the range of pressures that a regulator will maintain given certain flow rates in a system.
This technical bulletin provides an overview of how to read regulator flow curves for pressure-reducing regulators. It describes some of the complexities, including droop, seat-load drop or lockup, choked flow, hysteresis, and supply pressure effect (SPE), also known as dependency.
In addition, SPE values and flow curves for many Swagelok® series pressure-reducing regulators are provided for the full line of maximum inlet pressure ranges and flow coefficients available.
The BasicsA regulator’s main purpose is to maintain a constant pressure on one side of the regulator even though there is a different pressure or fluctuating pressure on the other side. In the case of a pressure-reducing regulator, pressure is controlled downstream of the regulator.
A flow curve illustrates a regulator’s performance in terms of outlet pressure (Y axis) and flow rate (X axis). Flow is not controlled by the regulator. It is controlled downstream by a valve or flow meter. The curve shows how a regulator will respond as flow in the system changes.
Let us examine how to read a flow curve. Examine the top curve in Fig. 1. The curve starts at 400 psig (27.5 bar), but drops slightly as flow increases across most of the graph.
When reading a flow curve, identify the range of flows that are seen in the system. Then, mark them on the graph to see what the corresponding changes in outlet pressure will be. Is that range of pressures acceptable? If not, a different regulator is needed.
Ideally, a regulator operates best on the flattest part of the curve, and will maintain relatively constant pressures, even with significant changes in flow. At the extreme ends of the curve, however, there are steep drops where pressures change dramatically with even the slightest change in flow. The regulator will not operate at the highest level of efficiency at these locations.
For every set pressure, there is a different curve. In Fig. 1, there are two main sets of curves: one based on a set pressure of 400 psig (27.5 bar) with a control range of 0 to 500 psig (34.4 bar) and one on a set pressure of 200 psig (13.7 bar) with a control range of 0 to 250 psig (17.2 bar). The control ranges represent two separate regulators and the curves must be used separately. If the desired set pressure or inlet pressure is not shown on the graph, one can interpolate within a control range, but not between different control ranges.
There is one additional variable that affects the shape of a curve—the inlet pressure (i.e., pressure going into a pressure-reducing regulator on the upstream side). Note that for each of the two sets of curves in Fig. 1, there are three curves representing a range of inlet pressures.
Fig. 1. Manufacturers often provide multiple flow curves for the same regulator at different inlet pressures to provide a range of the regulator’s operating capabilities.
Pressure Control Ranges
10
100
200
300
400
20 30 50 40 60 70
0 800 400 1200 1600
0
5.0
10
20
25
15
0
KPR — 0.06 Cv USA -
10
100
200
300
400
20 30 50 40 60 70 0
800 400 1200 1600 0
5,0
10
20
25
15
0
800 400 1200 1600 0
800 400 1200 1600 0
KPR — 0.06 Cv EURO -
10 20 30 50 40 60 70 0
0
5.0
10
20
25
15 KPR — 0.06 Cv CHINA -
0.5
1.0
1.5
2.0
2.5
0.5
1.0
1.5
2.0
2.5
KPR — 0.06 Cv JAPAN -
500 psig (34.4 bar) 1000 psig
(68.9 bar)
2200 psig (151 bar)
1000 psig (68.9 bar)
500 psig (34.4 bar)
Inlet Pressure 2200 psig (151 bar)
Nitrogen Flow, std ft3/min
Nitrogen Flow, std L/min
Out
let
Pre
ssur
e, p
sig
Out
let
Pre
ssur
e, b
ar
0 to 250 psig (0 to 17.2 bar)
0 to 500 psig (0 to 34.4 bar)

2 Pressure-Reducing Regulator Flow Curves
Droop, Seat-Load Drop, Choked Flow, Supply-Pressure Effect, and HysteresisAs mentioned, it is best to operate a regulator along the flattest—or most horizontal—part of a flow curve. Indeed, an ideal flow curve would be a flat line. However, no regulator can produce a perfectly flat line over its full range of pressures because its internal components have limitations.
Typically, a flow curve consists of three parts (Fig. 2.):
■The ideal operating range, a relatively flat part in the middle
■A steep drop on the far left, which shows seat-load drop or lockup
■A steep drop on the far right, which shows the choked-flow area.
DroopThe flat part in the middle is not perfectly flat. It slopes downward, which is called droop. As flow increases, outlet pressure will drop some—or a lot, depending on the regulator design. While droop is relatively modest along the flat part of the curve, it is quite steep at the far ends of the curve.
Supplying a regulator with pressures substantially lower than
the inlet pressure rating results in a flow curve with more droop than flow curves for regulators whose inlet pressure rating closely matches actual system pressure (Fig. 3). In addition, selecting a regulator that closely matches inlet pressure requirements provides the best handle resolution (smaller amount of pressure change per turn of the handle) and control, enabling a broader ideal operating range.
Seat-Load Drop or LockupSeat-load drop occurs on the far left of the regulator curve (Fig. 2), where there is initially a steep drop in pressure. If reading the curve from left to right, imagine that the system is in a no-flow state. The regulator is set to a certain pressure, but there is no flow. Then, imagine that an operator slowly opens a downstream valve to initiate flow. Immediately, there is a sharp drop in pressure because it is difficult for a regulator to maintain pressure at this location. A regulator operating along this steep drop in the curve may emit chattering or pulsating sounds as it fluctuates between flow and no-flow conditions.
Now read the curve from right to left. Imagine that the system is operating along the flat part of the curve. Then, imagine that an operator slowly closes a downstream valve, reducing flow to near zero. We are moving up the curve. As the no-flow
Fig. 2. This typical flow curve for a pressure-reducing regulator illustrates several phenomena, including the ideal operating range, droop, choked flow, and seat-load drop or lockup.
Fig. 3. Flow curves for regulators whose inlet pressure rating closely matches actual system pressure show less droop and a broader ideal operating range than the curve for a regulator whose inlet pressure rating is much higher than the actual system pressure.
00 20 40 60 80 100 120 140 160
10
20
30
40
50
60
70
80
0
2.0
3.0
4.0
5.0
1.0
0
0 20 40 60 80 100 120 140 160
0 500 1000 1500 2000 2500 400035003000 4500
10
20
30
40
50
60
70
80
0
2.0
3.0
4.0
5.0
1.0
0 500 1000 1500 2000 2500 400035003000 4500
0 500 1000 1500 2000 2500 400035003000 45000
0.2
0.3
0.4
0.5
0.1
USA
EURO
JPN
Nitrogen Flow, std ft3/minO
utle
t P
ress
ure,
psi
g
Out
let
Pre
ssur
e, b
ar
Nitrogen Flow, std L/min
Flow
Ideal Operating Range
Seat-Load Drop or Lockup
Droop
Choked Flow
0
5.0
10
15
20
25
30
0
0.5
1.0
1.5
2.0
0 2.0 4.0 6.0 8.0 10 12
0 50 100 150 200 250 300
0
5.0
10
15
20
25
30
0
0.5
1.0
1.5
2.0
0 2.0 4.0 6.0 8.0 10 12
0 50 100 150 200 250 300
0
0.05
0.10
0.15
0.20
0 50 100 150 200 250 300
USA
EURO
JPN
Nitrogen Flow, std ft3/min
Out
let
Pre
ssur
e, p
sig
Out
let
Pre
ssur
e, b
ar
Nitrogen Flow, std L/min
3600 psig (248 bar) model, 3600 psig (248 bar) inlet pressure
3600 psig (248 bar) model, 100 psig (6.8 bar) inlet pressure
100 psig (6.8 bar) model, 100 psig (6.8 bar) inlet pressure

Pressure-Reducing Regulator Flow Curves 3
state nears, the regulator has difficulty maintaining the set pressure. Again, the regulator may emit a chattering sound. Eventually, the regulator snaps shut, stopping flow. This is called lockup. (Lockup may not be shown on all flow data. Typiclaly, lockup pressures are less than 5% of control range.)
The terms seat-load drop and lockup are essentially interchangeable. Sometimes, lockup is used to describe both conditions. It is not advisable to operate a regulator under these conditions. Some regulator flow data will not reflect lock-up, especially for higher flow models. Typically, lock-up pressures will be less than 5 % of the total control range for a given model.
Choked FlowChoked flow occurs on the far right of a curve. See the choked-flow area in Fig. 2, where pressure begins to droop sharply at 140 std ft3/min (3960 std L/min). At this point, the flow demand has exceeded the pressure-controlling capabilities of the regulator. Here, the regulator is wide open and is no longer regulating pressure. Essentially, it has changed from a pressure-controlling device to an open orifice. Increasing downstream flow to this point or beyond renders the regulator ineffective. It is not advisable to operate a regulator in the choked-flow area due to the sharp pressure drop.
Note that Cv is measured at the regulator’s fully open position, and that is why it cannot describe the overall performance of the regulator.
In fact, selecting a regulator based solely on its flow coefficient (Cv) can result in unsatisfactory performance. If the system flow is within range of the regulator’s Cv, one may believe that the regulator is the right “size.” But that is not necessarily true. The Cv represents the regulator’s maximum flow capacity. At maximum flow, a regulator can no longer control pressure.
HysteresisSee Fig. 4, above. When reading left to right, flow is increasing. And the reverse is true when reading right to left. Depending on whether flow is increasing or decreasing, the curve differs slightly. Outlet pressure does not follow the same “droop line” or end at the original set pressure. This phenomenon is called hysteresis.
Fig. 4. The phenomenon of hysteresis reveals that at the same flow volume, outlet pressure is higher with decreasing flow than with increasing flow. Hysteresis is shown larger than normal for illustration purposes.
Hysteresis results from dynamic friction forces within the regulator, but is usually not an issue when evaluating the performance of a regulator. However, it can be a point of confusion during system operation. Suppose an operator sets up a system to deliver an outlet pressure of 50 psig (3.4 bar) at 110 std ft3/min (3115 std L/min). The next day, the pressure is now 50.5 psig (3.48 bar), but the flow is still 110 std ft3/min (3115 std L/min). It is likely that something in the system temporarily created more flow demand downstream. Moving from left to right on the curve, the temporary flow increase slightly reduced the outlet pressure. Then, as the flow demand returned to 110 std ft3/min (3115 std L/min), hysteresis caused the outlet pressure to return to a point slightly higher than the initial set point.
It is recommended to approach set pressure from a lower pressure. Another best practice is to employ pressure gauges in the system to help fine tune regulator settings to achieve desired operating pressures.
Supply-Pressure EffectSupply-pressure effect (SPE) or dependency is a ratio describing the change in outlet pressure per 100 psi (6.8 bar) change in inlet pressure. In other words, for every 100 psi (6.8 bar) drop in inlet pressure, the outlet pressure will increase by X psi. X is the SPE. For standard pressure-reducing regulators, the outlet pressure increases as supply pressure decreases. The opposite is true as supply pressure increases. This effect can also be realized on system startup or shutdown.
The regulator should be set to the “off” position before turning the supply pressure on or off to prevent overpressurization of regulator diaphragms, outlet pressure gauges, or other equipment downstream. When selecting an antitamper model, it is important to make sure that SPE will not cause excessive overpressurization on opening and closing of the supply pressure.
00 20 40 60 80 100 120 140 160
10
20
30
40
50
60
70
80
0
2.0
3.0
4.0
5.0
1.0
0
0 20 40 60 80 100 120 140 160
0 500 1000 1500 2000 2500 400035003000 4500
10
20
30
40
50
60
70
80
0
2.0
3.0
4.0
5.0
1.0
0 500 1000 1500 2000 2500 400035003000 45000
0.2
0.3
0.4
0.5
0.1
USA
EURO
JPN
0 500 1000 1500 2000 2500 400035003000 4500
Nitrogen Flow, std ft3/min
Out
let
Pre
ssur
e, p
sig
Out
let
Pre
ssur
e, b
ar
Nitrogen Flow, std L/min
Flow
Decreasing Flow
Hysteresis
Increasing Flow
4 Pressure-Reducing Regulator Flow Curves
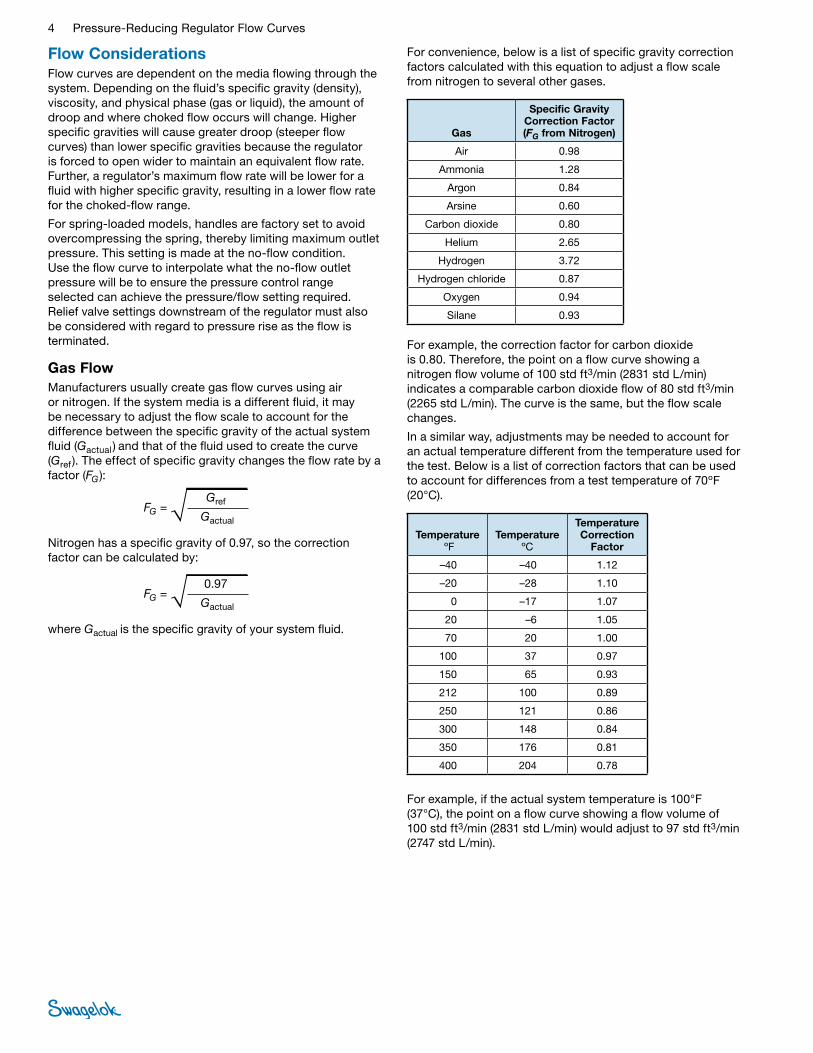
Flow Considerations Flow curves are dependent on the media flowing through the system. Depending on the fluid’s specific gravity (density), viscosity, and physical phase (gas or liquid), the amount of droop and where choked flow occurs will change. Higher specific gravities will cause greater droop (steeper flow curves) than lower specific gravities because the regulator is forced to open wider to maintain an equivalent flow rate. Further, a regulator’s maximum flow rate will be lower for a fluid with higher specific gravity, resulting in a lower flow rate for the choked-flow range.
For spring-loaded models, handles are factory set to avoid overcompressing the spring, thereby limiting maximum outlet pressure. This setting is made at the no-flow condition. Use the flow curve to interpolate what the no-flow outlet pressure will be to ensure the pressure control range selected can achieve the pressure/flow setting required. Relief valve settings downstream of the regulator must also be considered with regard to pressure rise as the flow is terminated.
Gas FlowManufacturers usually create gas flow curves using air or nitrogen. If the system media is a different fluid, it may be necessary to adjust the flow scale to account for the difference between the specific gravity of the actual system fluid (Gactual ) and that of the fluid used to create the curve (Gref ). The effect of specific gravity changes the flow rate by a factor (FG ):
FG =Gref
Gactual
Nitrogen has a specific gravity of 0.97, so the correction factor can be calculated by:
FG =0.97
Gactual
where Gactual is the specific gravity of your system fluid.
For convenience, below is a list of specific gravity correction factors calculated with this equation to adjust a flow scale from nitrogen to several other gases.
Gas
Specific Gravity Correction Factor (FG from Nitrogen)
Air 0.98
Ammonia 1.28
Argon 0.84
Arsine 0.60
Carbon dioxide 0.80
Helium 2.65
Hydrogen 3.72
Hydrogen chloride 0.87
Oxygen 0.94
Silane 0.93
For example, the correction factor for carbon dioxide is 0.80. Therefore, the point on a flow curve showing a nitrogen flow volume of 100 std ft3/min (2831 std L/min) indicates a comparable carbon dioxide flow of 80 std ft3/min (2265 std L/min). The curve is the same, but the flow scale changes.
In a similar way, adjustments may be needed to account for an actual temperature different from the temperature used for the test. Below is a list of correction factors that can be used to account for differences from a test temperature of 70ºF (20°C).
Temperature ºF
TemperatureºC
Temperature Correction
Factor
–40 –40 1.12
–20 –28 1.10
0 –17 1.07
20 –6 1.05
70 20 1.00
100 37 0.97
150 65 0.93
212 100 0.89
250 121 0.86
300 148 0.84
350 176 0.81
400 204 0.78
For example, if the actual system temperature is 100°F (37°C), the point on a flow curve showing a flow volume of 100 std ft3/min (2831 std L/min) would adjust to 97 std ft3/min (2747 std L/min).
Pressure-Reducing Regulator Flow Curves 5
Liquid Flow The same regulator will produce flow curves with substantial differences between gas and liquid fluids—flow curves for liquid media will show steeper droop rates and lower maximum flow. Avoid using flow curves generated with gas flow when selecting a regulator for a liquid flow application, as the differences between the curve and the regulator’s performance in a liquid system will be significant.
Also keep in mind that not all regulators are suitable for liquid service. The higher forces on the poppet from liquid flows can cause extreme chatter, resulting in damage within the regulator. Be sure the regulator model and pressure range have been tested for liquid applications to ensure a positive performance.
Another consideration is to understand fully the effects of pressure drop on the liquid, given the application parameters. In applications where the liquid is close to its bubble point, it is likely that the pressure drop within the regulator will create bubbles or even start to vaporize the liquid. A two-phase mixture can cause component failure, fluid sample distortion, or clogging of lines. Be sure that the pressure drop will consistently maintain a liquid phase throughout a wide temperature range, or install the regulator in a location that minimizes the risk of bubble creation.
Finally, as is the case with gases, you may need to adjust the flow scale based on the difference in specific gravity between the liquid used to generate the flow curve (typically hydraulic oil or water) and the liquid to be used in your system. The liquid flow curves in this document were generated from flow tests using hydraulic oil with a specific gravity of 0.86.
For convenience, below is a list of specific gravity correction factors calculated to adjust a flow scale from hydraulic oil to several other liquids.
Liquid
Specific Gravity Correction Factor
(FG from Hydraulic Oil)
Ethyl alcohol 1.04
Gasoline 1.07
Kerosene 1.02
Pentane 1.18
Water 0.93
For example, the correction factor for water is 0.93. Therefore, the point on a flow curve showing a hydraulic oil flow volume of 10 U.S. gal/min (37.8 L/min) indicates a comparable water flow of 9.3 U.S. gal/min 35.2 L/min).
A safety concern can arise when using a positive displacement pump in a liquid system. The pump can cause impulses through the regulator that can fatigue and eventually cause failure in a metal diaphragm. Also, without proper relief mechanisms, the pump may cause excessive pressure rises that rupture components within the fluid system, even with a properly operating regulator. Always ensure proper relief devices are installed to protect components from burst failure.
Flow Curve ChecklistWhen selecting a regulator, consult the flow curve in addition to the Cv value.
■Identify the range of flows expected. Given that range, the curve will indicate what pressures the regulator can be expected to maintain.
■ A regulator operates best along the relatively flat part of its curve. Make sure the control range selected can accommodate the droop to meet the pressure requirement at the desired flow rate.
■ Avoid operating a regulator at the far ends of the curve where undesirable conditions like lockup and choked flow occur.
■Does it reflect the required pressure, set pressure, and inlet pressure range?
■For gas regulators, will supply-pressure effect be an issue when the system is shut down or restarted?
■Do you need to calculate any specific gravity or temperature adjustments?
■Finally, make sure all measurement units agree. Pressure readings are provided most commonly in psig or bar. Flow rate units of measure depend on the system media, so be sure to note whether the regulator is rated for liquid or gas service. Liquid flow is typically expressed as gallons per minute (U.S. gal/min) or liters per minute (L/min), while gas flow is conveyed as standard cubic feet per minute (std ft3/min) or standard liters per minute (std L/min).
Note: Flow curves for regulators greater than 1 1/2 inch may have been generated using either test flow data or mathematical modeling.
If a flow curve is not available or if you need additional help in selecting a regulator, contact your authorized Swagelok sales and service representative for guidance on properly sizing a regulator for an application.
6 Pressure-Reducing Regulator Flow Curves
KPR Series
■Flow coefficients of 0.02, 0.06, 0.20, and 0.50
■Pressure control ranges from 0 to 10 psig (0 to 0.68 bar) through 0 to 500 psig (0 to 34.4 bar)
■Maximum inlet pressures from 100 to 6000 psig (6.8 to 413 bar)
Gas Flow . . . . . . . . . . . . . . . . . . . . . . . . . . . . . . . . . . . . . . 9
Liquid Flow . . . . . . . . . . . . . . . . . . . . . . . . . . . . . . . . . . . . 84
KCY Series
■Flow coefficients of 0.06, 0.20, and 0.50
■Pressure control ranges from 0 to 10 psig (0 to 0.68 bar) through 0 to 500 psig (0 to 34.4 bar)
■Maximum inlet pressures from 3000 to 6000 psig (206 to 413 bar)
Gas Flow . . . . . . . . . . . . . . . . . . . . . . . . . . . . . . . . . . . . . . 21
Liquid Flow . . . . . . . . . . . . . . . . . . . . . . . . . . . . . . . . . . . . 93
KLF Series
■Flow coefficients of 0.02, 0.06, 0.20, and 0.50
■Pressure control ranges from 0 to 2.0 psig (0 to 0.13 bar) through 0 to 250 psig (0 to 17.2 bar)
■Maximum inlet pressures from 15 to 3600 psig (1.0 to 248 bar)
Gas Flow . . . . . . . . . . . . . . . . . . . . . . . . . . . . . . . . . . . . . . 30
Liquid Flow . . . . . . . . . . . . . . . . . . . . . . . . . . . . . . . . . . . 101
KHF Series
■Flow coefficient of 1.0
■Pressure control ranges from 0 to 10 psig (0.68 bar) through 0 to 250 psig (17.2 bar)
■Maximum inlet pressures from 100 to 3600 psig (6.8 to 248 bar)
Gas Flow . . . . . . . . . . . . . . . . . . . . . . . . . . . . . . . . . . . . . . 46
KCP Series
■Flow coefficients of 0.02, 0.06, 0.20, and 0.50
■Pressure control ranges from 0 to 10 psig (0.68 bar) through 0 to 1500 psig (103 bar)
■Maximum inlet pressures from 100 to 3600 psig (6.8 to 248 bar)
Gas Flow . . . . . . . . . . . . . . . . . . . . . . . . . . . . . . . . . . . . . 50
Liquid Flow . . . . . . . . . . . . . . . . . . . . . . . . . . . . . . . . . . . 108
KPP Series
■Flow coefficients of 0.02 and 0.06
■Pressure control ranges from 0 to 1000 psig (68.9 bar) through 0 to 3600 psig (248 bar)
■Maximum inlet pressures from 2000 to 6000 psig (137 to 413 bar)
Gas Flow . . . . . . . . . . . . . . . . . . . . . . . . . . . . . . . . . . . . . 66
Liquid Flow . . . . . . . . . . . . . . . . . . . . . . . . . . . . . . . . . . . 119
KPF Series
■Flow coefficient of 1.0
■Pressure control ranges from 0 to 1000 psig (68.9 bar) through 0 to 4000 psig (275 bar)
■Maximum inlet pressure of 6000 psig (413 bar)
Gas Flow . . . . . . . . . . . . . . . . . . . . . . . . . . . . . . . . . . . . . 73
Liquid Flow . . . . . . . . . . . . . . . . . . . . . . . . . . . . . . . . . . . 122
KHP Series and KHR Series
■Flow coefficients of 0.06 and 0.25
■Pressure control ranges from 0 to 500 psig (34.4 bar) through 100 to 10 000 psig (6.8 to 689 bar)
■Maximum inlet pressure of 10 000 psig (689 bar)
KHP Gas Flow . . . . . . . . . . . . . . . . . . . . . . . . . . . . . . . . . 76
KHR Liquid Flow . . . . . . . . . . . . . . . . . . . . . . . . . . . . . . . 125
Flow Curves
Pressure-Reducing Regulator Flow Curves 7
RS(H)2 Series
■Flow coefficient of 0.05■Pressure control ranges from 0 to 145 psig (0 to 10.0 bar)
through ■ RS2: 0 to 5075 psig (0 to 350 bar)
■ RSH2: 0 to 10 150 psig (0 to 700 bar)
■Maximum inlet pressure: 5800 psig (400 bar)
Gas Flow . . . . . . . . . . . . . . . . . . . . . . . . . . . . . . . . . . . . . 133
RS(H)4, RS(H)6, and RS(H)8 Series
■Flow coefficients of 1.84 and 1.95■Pressure control ranges from 0 to 2175 psig (0 to 150 bar)
through 0 to 58000 psig (0 to 400 bar)
■Maximum inlet pressure: 5800 psig (400 bar)
Gas Flow . . . . . . . . . . . . . . . . . . . . . . . . . . . . . . . . . . . . . 136
RS(H)10, RS(H)15, and RS(H)20 Series
■Flow coefficients of 3.79, 7.30 and 13■Pressure control ranges from 0 to 43 psig (0 to 3.0 bar)
through ■ RSH10 and RSH15: 0 to 3625 psig (0 to 350 bar)
■ RSH20: 0 to 290 psig (0 to 20.0 bar)
■Maximum inlet pressures:
■ RS10: 1015 psig (70.0 bar)
■ RSH10 and RS(H)15: 5800 psig (400 bar)
■ RS20: 1015 psig (70.0 bar)
■ RSH20: 3630 psig (250 bar)
Gas Flow . . . . . . . . . . . . . . . . . . . . . . . . . . . . . . . . . . . . . 142
LRS(H)4 Series
■Flow coefficients of 0.73 and 0.10■Pressure control ranges from 0 to 43 psig (0 to 3.0 bar)
through 0 to 290 psig (0 to 20.0 bar)
■Maximum inlet pressures:
■ LRS4: 507 psig (35.0 bar)
■ LRSH4: 5800 psig (400 bar)
Gas Flow . . . . . . . . . . . . . . . . . . . . . . . . . . . . . . . . . . . . . 147
LPRS4, LPRS6, and LPRS8 Series
■Flow coefficients of 1.84, 1.95 and 2.07■Pressure control ranges from 1.4 to 14.5 psig
(0.10 to 1.0 bar) through 4.3 to 43 psig (0.30 to 3.0 bar)
■Maximum inlet pressure: 218 psig (15.0 bar)
Gas Flow . . . . . . . . . . . . . . . . . . . . . . . . . . . . . . . . . . . . . 150
LPRS10, and LPRS15 Series
■Flow coefficients of 3.79 and 7.3■Pressure control ranges from 1.4 to 14.5 psig
(0.10 to 1.0 bar) through 4.3 to 43 psig (0.30 to 3.0 bar)
■Maximum inlet pressure: 232 psig (16.0 bar)
Gas Flow . . . . . . . . . . . . . . . . . . . . . . . . . . . . . . . . . . . . . 152
RD2 Series
■Flow coefficient of 0.05
■Pressure control ranges: 0 to 5800 psig (0 to 400 bar)
■Maximum inlet pressures: 5800 psig (400 bar)
Gas Flow . . . . . . . . . . . . . . . . . . . . . . . . . . . . . . . . . . . . . 154
RD(H)6 and RD(H)8 Series
■Flow coefficients of 1.95 and 2.07
■Pressure control ranges from 0 to 145 psig (0 to 10.0 bar) through ■ RDH6: 0 to 2539 psig (0 to 175 bar)
■ RDH8: 0 to 2537 psig (0 to 175 bar)
■Maximum inlet pressures:
■ RDH6: 5800 psig (400 bar)
■ RDH8: 3990 psig (275 bar)
Gas Flow . . . . . . . . . . . . . . . . . . . . . . . . . . . . . . . . . . . . . 156
RD6DP and RDH6DP Series
■Flow coefficient of 1.95
■Pressure control ranges from 0 to 1015 psig (0 to 70.0 bar) through ■ RD6DP: 0 to 3335 psig (0 to 230 bar)
■Maximum inlet pressures:
■ RD6DP: 1015 psig (70.0 bar)
■ RDH6DP: 3990 psig (275 bar)
Gas Flow . . . . . . . . . . . . . . . . . . . . . . . . . . . . . . . . . . . . . 160
RD(H)10 and RD(H)15 Series
■Flow coefficients of 3.79 and 7.30
■Pressure control ranges from 0 to 43 psig (0 to 3.0 bar) through ■ RD: 0 to 1015 psig (0 to 70.0 bar)
■ RDH: 0 to 3625 psig (0 to 250 bar)
■Maximum inlet pressures:
■ RD: 1015 psig (70.0 bar)
■ RDH: 5800 psig (400 bar)
Gas Flow . . . . . . . . . . . . . . . . . . . . . . . . . . . . . . . . . . . . . 162
Flow Curves
8 Pressure-Reducing Regulator Flow Curves
RD(H)20 and RD(H)25 Series
■Flow coefficients of 13 and 21
■Pressure control ranges from 0 to 43 psig (0 to 3.0 bar) through ■ RD20 and RD25: 0 to 1015 psig (0 to 70.0 bar)
■ RDH20 and RDH25: 0 to 2900 psig (0 to 200 bar)
■Maximum inlet pressures:
■ RD20 and RD25: 1015 psig (70.0 bar)
■ RDH20: 5800 psig (400 bar)
■ RDH25: 4060 psig (280 bar)
Gas Flow . . . . . . . . . . . . . . . . . . . . . . . . . . . . . . . . . . . . . 175
RD(H)30 and RD(H)40 Series
■Flow coefficients of 36 and 73
■Pressure control ranges from 0 to 43 psig (0 to 3.0 bar) through ■ RD30 and RD40: 1015 psig (70.0 bar)
■ RDH30 and RDH40: 0 to 2900 psig (0 to 200 bar)
■Maximum inlet pressures:
■ RD30 and RD30: 1015 psig (70.0 bar)
■ RDH30 and RDH40: 4060 psig (280 bar)
Gas Flow . . . . . . . . . . . . . . . . . . . . . . . . . . . . . . . . . . . . . 188
RA4, RA6 and RA8 Series
■Flow coefficient of 1.84
■Pressure ratios from 1:15 through 1:70
■Maximum inlet pressure: 5800 psig (400 bar)
Gas Flow . . . . . . . . . . . . . . . . . . . . . . . . . . . . . . . . . . . . . 201
BS(H)2 Series
■Flow coefficient of 0.10
■Pressure control ranges from 0 to 145 psig (0 to10.0 bar) through ■ BS2: 0 to 5075 psig (0 to 350 bar)
■ BSH2: 0 to 10 150 psig (0 to 700 bar)
■Maximum inlet pressures:
■ BS2: 5800 psig (400 bar)
■ BSH2: 10 150 psig (700 bar)
Gas Flow . . . . . . . . . . . . . . . . . . . . . . . . . . . . . . . . . . . . 204
BS(H)2 Series
■Flow coefficient of 0.10
■Pressure control ranges from 0 to 145 psig (0 to 10.0 bar) through 5075 psig (0 to 350 bar)
■Maximum inlet pressures:
■ BS2: 5800 psig (400 bar)
■ BSH2: 10 150 psig (700 bar)
Gas Flow . . . . . . . . . . . . . . . . . . . . . . . . . . . . . . . . . . . . . 204
BS(H)4, BS(H)6, and BS(H)8 Series
■Flow coefficient from 0.49 to 2.07
■Pressure control ranges from 0 to 5220 psig (0 to 360 bar) through 0 to 5220 psig (0 to 360 bar)
■Maximum inlet pressure: 5800 psig (400 bar)
Gas Flow . . . . . . . . . . . . . . . . . . . . . . . . . . . . . . . . . . . . . 207
BS(H)10 and BS(H)15 Series
■Flow coefficient from 3.84 to 7.3
■Pressure control ranges from 0 to 203 psig (0 to 14.0 bar) through 0 to 5220 psig (0 to 360 bar)
■Maximum inlet pressure: 5800 psig (400 bar)
Gas Flow . . . . . . . . . . . . . . . . . . . . . . . . . . . . . . . . . . . . . 210
LBS4 Series
■Flow coefficient of 1.3
■Pressure control ranges from 0 to 43 psig (0 to 3.0 bar) through 0 to 290 psig (0 to 20.0 bar)
■Maximum inlet pressure: 507 psig (35.0 bar)
Gas Flow . . . . . . . . . . . . . . . . . . . . . . . . . . . . . . . . . . . . . 214

Pressure-Reducing Regulator Flow Curves 9
KPR Series Pressure-Reducing Regulators Gas Flow
Flow CurvesThe flow curves assume an initial set flow rate of 0.035 std ft3/min (1 std L/min) and an initial temperature of 70°F (20°C).
Supply-Pressure Effect
Flow Coefficient
(Cv )
Pressure Control Range
Up to 100 psig (6.8 bar)
250 psig (17.2 bar)
and Higher
Supply Pressure Effect, %
0.02 0.3 0.5
0.06 1.0 1.5
0.20 1.7 2.5
0.50 2.3 3.3
The KPR series is a compact regulator with excellent accuracy, sensitivity, and set-point pressure stability.
For features, additional technical data, materials of construction, and ordering information, see the Swagelok Pressure Regulators catalog, MS-02-230.
Pressure Control Range
0 to 25 psig (0 to 1.7 bar)
0 to 10 psig (0 to 0.68 bar)
Flow Coefficient 0.02, Pressure Control Ranges 0 to 25 psig (0 to 1.7 bar) and 0 to 10 psig (0 to 0.68 bar)
0
5.0
10
15
20
25
30
0 2.0 4.0 6.0 8.0 1210 14 16
0
0.5
1.0
1.5
2.0
0 50 100 150 250 300 350 400 450200
0
5,0
10
15
20
25
30
0 2,0 4,0 6,0 8,0 1210 14 16
0
0,5
1,0
1,5
2,0
0 50 100 150 250 300 350 400 450200
0
0.05
0.10
0.15
0.20
0 50 100 150 250 300 350 400 450200
USA
EURO
JPN
500 (34.4)
50 (3.4), 100 (6.8)500 (34.4), 1000 (68.9)
3600 (248), 6000 (413)
50 (3.4),100 (6.8)
1000 (68.9),3600 (248), 6000 (413)
50 (3.4), 100 (6.8) 500 (34.4), 1000 (68.9), 3600 (248), 6000 (413)
34.4 (500)
3.4 (50), 6.8 (100)34.4 (500), 68.9 (1000)
248 (3600), 413 (6000)
3.4 (50),6.8 (100)
68.9 (1000),248 (3600), 413 (6000)
3.4 (50), 6.8 (100) 34.4 (500), 68.9 (1000), 248 (3600), 413 (6000)
3.44
0.34, 0.683.44, 6.89
24.8, 41.3
0.34,0.68
6.89,24.8, 41.3
0.34, 0.68 3.44, 6.89, 24.8, 41.3
Nitrogen Flow, std ft3/min
Out
let
Pre
ssur
e, p
sig
Out
let
Pre
ssur
e, b
ar
Nitrogen Flow, std L/min
0
5.0
10
15
20
25
30
0 1.0 2.0 3.0 4.0 5.0
0
0.5
1.0
1.5
2.0
0 20 40 60 80 140100 120
0 1,0 2,0 3,0 4,0 5,0
0 20 40 60 80 140100 120
USA
EURO
JPN
0
5,0
10
15
20
25
30
0
0,5
1,0
1,5
2,0
0 20 40 60 80 140100 1200
0.05
0.10
0.15
0.20
500 (34.4)
50 (3.4), 100 (6.8) 500 (34.4), 1000 (68.9),3600 (248), 6000 (413)
50 (3.4), 100 (6.8)
1000 (68.9),3600 (248), 6000 (413)
34.4 (500)
3.4 (50), 6.8 (100) 34.4 (500), 68.9 (1000),248 (3600), 413 (6000)
3.4 (50), 6.8 (100)
68.9 (1000),248 (3600), 413 (6000)
3.44
0.34, 0.68 3.44, 6.89,24.8, 41.3
0.34, 0.686.89, 24.8, 41.3
50 (3.4), 100 (6.8)500 (34.4), 1000 (68.9),3600 (248), 6000 (413)
3.4 (50), 6.8 (100)34.4 (500), 68.9 (1000),248 (3600), 413 (6000)
0.34, 0.68 3.44, 6.89, 24.8, 41.3
Nitrogen Flow, std ft3/min
Out
let
Pre
ssur
e, p
sig
Out
let
Pre
ssur
e, b
ar
Nitrogen Flow, std L/minDetail A
A

10 Pressure-Reducing Regulator Flow Curves
Flow CurvesThe flow curves assume an initial set flow rate of 0.035 std ft3/min (1 std L/min) and an initial temperature of 70°F (20°C).
Pressure Control Range
0 to 100 psig (0 to 6.8 bar)
0 to 50 psig (0 to 3.4 bar)
Flow Coefficient 0.02, Pressure Control Ranges 0 to 100 psig (0 to 6.8 bar) and 0 to 50 psig (0 to 3.4 bar)
0
20
40
60
80
100
0 5.0 10 15 20 3025 35 40
0
1.0
3.0
5.0
7.0
4.0
6.0
2.0
0 200100 400300 600500 1000 1100800 900700
0
20
40
60
80
100
0 5,0 10 15 20 3025 35 40
0
1,0
3,0
5,0
7,0
4,0
6,0
2,0
0 200100 400300 600500 1000 1100800 900700
0
0.1
0.3
0.5
0.7
0.4
0.6
0.2
0 200100 400300 600500 1000 1100800 900700
USA
EURO
JPN
3.4 (50), 6.8 (100)
100 (6.8)
500 (34.4)1000 (68.9)
3600 (248), 6000 (413)
50 (3.4), 100 (6.8)
50 (3.4), 100 (6.8)
500 (34.4)
500 (34.4)
1000 (68.9)
1000 (68.9)
3600 (248), 6000 (413)
3600 (248), 6000 (413)
6.8 (100)
0.68
34.4 (500)68.9 (1000)
248 (3600), 413 (6000)
3.4 (50), 6.8 (100)
34.4 (500)
34.4 (500)
68.9 (1000)
68.9 (1000)
248 (3600), 413 (6000)
248 (3600), 413 (6000)
0.34 6.89
24.8, 41.3
0.34, 0.68
0.34, 0.68
3.44
3.44
6.89
6.89
24.8, 41.3
24.8, 41.3
Nitrogen Flow, std ft3/min
Out
let
Pre
ssur
e, p
sig
Out
let
Pre
ssur
e, b
ar
Nitrogen Flow, std L/min
0
20
40
60
80
100
0
1.0
3.0
5.0
7.0
4.0
6.0
2.0
0 1.0 2.0 3.0 4.0 5.0
0 20 40 60 80 140100 120
0
20
40
60
80
100
0
1,0
3,0
5,0
7,0
4,0
6,0
2,0
0 1,0 2,0 3,0 4,0 5,0
0 20 40 60 80 140100 120
0
0.1
0.3
0.5
0.7
0.4
0.6
0.2
0 20 40 60 80 140100 120
USA
EURO
JPN
100 (6.8)
500 (34.4) 1000 (68.9), 3600 (248), 6000 (413)
50 (3.4), 100 (6.8)
50 (3.4), 100 (6.8)
50 (3.4), 100 (6.8), 500 (34.4)
500 (34.4)
500 (34.4) 3600 (248), 6000 (413)
1000 (68.9),3600 (248), 6000 (413)
1000 (68.9)
6.8 (100)
68.9 (1000),248 (3600), 413 (6000)
34.4 (500)
3.4 (50), 6.8 (100)
3.4 (50), 6.8 (100)
3.4 (50), 6.8 (100), 34.4 (500)
34.4 (500)
34.4 (500)
68.9 (1000),248 (3600), 413 (6000)
68.9 (1000),248 (3600), 413 (6000)
248 (3600), 413 (6000)
68.9 (1000)
0.68
3.44 6.89, 24.8, 41.3
0.34, 0.68
0.34, 0.68
0.34, 0.68, 3.44
3.44
3.44
6.89, 24.8, 41.3
6.89, 24.8, 41.3
24.8, 41.36.89
1000 (68.9),3600 (248), 6000 (413)
Nitrogen Flow, std ft3/min
Out
let
Pre
ssur
e, p
sig
Out
let
Pre
ssur
e, b
ar
Nitrogen Flow, std L/min
KPR Series Pressure-Reducing Regulators Gas Flow
Detail A
A

Pressure-Reducing Regulator Flow Curves 11
Flow CurvesThe flow curves assume an initial set flow rate of 0.035 std ft3/min (1 std L/min) and an initial temperature of 70°F (20°C).
Pressure Control Range
0 to 500 psig (0 to 34.4 bar)
0 to 250 psig (0 to 17.2 bar)
Flow Coefficient 0.02, Pressure Control Ranges 0 to 500 psig (0 to 34.4 bar) and 0 to 250 psig (0 to 17.2 bar)
0
100
200
300
400
500
0 4.0 6.0 8.02.0 14 16 181210 20
0
5.0
15
25
35
20
30
10
0 50 100 150 200 350 400 450 500 550250 300
0
100
200
300
400
500
0 4,0 6,0 8,02,0 14 16 181210 20
0
5,0
15
25
35
20
30
10
0 50 100 150 200 350 400 450 500 550250 300
0
0.5
1.5
2.5
3.5
2.0
3.0
1.0
0 50 100 150 200 350 400 450 500 550250 300
USA
EURO
JPN
500 (34.4) 1000 (68.9) 3600 (248), 6000 (413)
100 (6.8)
500 (34.4) 1000 (68.9)3600 (248), 6000 (413)
500 (34.4)1000 (68.9)
3600 (248), 6000 (413)
34.4 (500) 68.9 (1000)248 (3600), 413 (6000)
34.4 (500)68.9 (1000)
248 (3600), 413 (6000)
6.8 (100) 34.4 (500) 68.9 (1000) 248 (3600), 413 (6000)
3.44 6.8924.8, 41.3
3.44 6.8924.8, 41.3
0.68 3.44 6.89 24.8, 41.3
Nitrogen Flow, std ft3/min
Out
let
Pre
ssur
e, p
sig
Out
let
Pre
ssur
e, b
ar
Nitrogen Flow, std L/min
0
100
200
300
400
500
0
10
15
25
35
20
30
20
0 1.0 2.0 3.0 4.0 5.0
0 20 40 60 80 140100 120
USA
EURO
JPN
0
100
200
300
400
500
0
5,0
15
25
35
20
30
10
0 1,0 2,0 3,0 4,0 5,0
0 20 40 60 80 140100 120
0
0.5
1.5
2.5
3.5
2.0
3.0
1.0
0 20 40 60 80 140100 120
500 (34.4)
1000 (68.9),3600 (248), 6000 (413)
500 (34.4)1000 (68.9),3600 (248), 6000 (413)
500 (34.4)1000 (68.9),3600 (248), 6000 (413)
100 (6.8)
34.4 (500)
68.9 (1000),248 (3600), 413 (6000)
68.9 (1000),248 (3600), 413 (6000)
68.9 (1000),248 (3600), 413 (6000)
34.4 (500)
34.4 (500)6.8 (100)
3.44
6.89, 24.8, 41.3
6.89, 24.8, 41.3
6.89, 24.8, 41.3
3.44
3.440.68
Nitrogen Flow, std ft3/min
Out
let
Pre
ssur
e, p
sig
Out
let
Pre
ssur
e, b
ar
Nitrogen Flow, std L/min
KPR Series Pressure-Reducing Regulators Gas Flow
Detail A
A

12 Pressure-Reducing Regulator Flow Curves
Flow CurvesThe flow curves assume an initial set flow rate of 0.035 std ft3/min (1 std L/min) and an initial temperature of 70°F (20°C).
Pressure Control Range
0 to 25 psig (0 to 1.7 bar)
0 to 10 psig (0 to 0.68 bar)
Flow Coefficient 0.06, Pressure Control Ranges 0 to 25 psig (0 to 1.7 bar) and 0 to 10 psig (0 to 0.68 bar)
0
5.0
10
15
20
25
30
0 2.0 4.0 6.0 8.0 10 12
0
0.5
1.0
1.5
2.0
0 40 80 120 160 280 320200 240
0 2,0 4,0 6,0 8,0 10 12
0 40 80 120 160 280 320200 2400
5,0
10
15
20
25
30
0
0,5
1,0
1,5
2,0
0 40 80 120 160 280 320200 2400
0.05
0.10
0.15
0.20
USA
EURO
JPN
50 (3.4), 100 (6.8), 500 (34.4)
1000 (68.9)3600 (248), 6000 (413)
50 (3.4) 100 (6.8), 500 (34.4), 1000 (68.9), 3600 (248), 6000 (413)
3.4 (50), 6.8 (100), 34.4 (500)
68.9 (1000)248 (3600), 413 (6000)
3.4 (50) 6.8 (100), 34.4 (500), 68.9 (1000), 248 (3600), 413 (6000)
0.34, 0.68, 3.44
6.8924.8, 41.3
0.34 0.68, 3.44, 6.89, 24.8, 41.3
Nitrogen Flow, std ft3/min
Out
let
Pre
ssur
e, p
sig
Out
let
Pre
ssur
e, b
ar
Nitrogen Flow, std L/min
0
5.0
10
15
20
25
30
0 1.0 2.0 3.0 4.0 5.0
0
0.5
1.0
1.5
2.0
0 20 40 60 80 140100 120
0 1,0 2,0 3,0 4,0 5,0
0 20 40 60 80 140100 120
USA
EURO
JPN
0
5,0
10
15
20
25
30
0
0,5
1,0
1,5
2,0
0 20 40 60 80 140100 1200
0.05
0.10
0.15
0.20
50 (3.4), 100 (6.8), 500 (34.4)
1000 (68.9)
3600 (248), 6000 (413)
50 (3.4)100 (6.8)
100 (6.8), 500 (34.4), 1000 (68.9),3600 (248), 6000 (413)3600 (248), 6000 (413)
50 (3.4), 500 (34.4), 1000 (68.9)
3.4 (50), 6.8 (100), 34.4 (500)
68.9 (1000)
248 (3600), 413 (6000)
6.8 (100), 34.4 (500), 68.9 (1000), 248 (3600), 413 (6000)
3.4 (50)6.8 (100)
3.4 (50), 34.4 (500), 68.9 (1000)
248 (3600), 413 (6000)
6.89
24.8, 41.30.34, 0.68, 3.44
0.68, 3.44, 6.89, 24.8, 41.30.340.68
0.34, 3.44, 6.89
24.8, 41.3
Nitrogen Flow, std ft3/min
Out
let
Pre
ssur
e, p
sig
Out
let
Pre
ssur
e, b
ar
Nitrogen Flow, std L/min
KPR Series Pressure-Reducing Regulators Gas Flow
Detail A
A

Pressure-Reducing Regulator Flow Curves 13
Flow CurvesThe flow curves assume an initial set flow rate of 0.035 std ft3/min (1 std L/min) and an initial temperature of 70°F (20°C).
Pressure Control Range
0 to 100 psig (0 to 6.8 bar)
0 to 50 psig (0 to 3.4 bar)
Flow Coefficient 0.06, Pressure Control Ranges 0 to 100 psig (0 to 6.8 bar) and 0 to 50 psig (0 to 3.4 bar)
0
20
40
60
80
100
0 5.0 10 15 20 3025 35 40
0
1.0
3.0
5.0
7.0
4.0
6.0
2.0
0 100 200 300 400 700 800 900 1000 1100500 600
0
20
40
60
80
100
0 5,0 10 15 20 3025 35 40
0
1,0
3,0
5,0
7,0
4,0
6,0
2,0
0 200100 400300 600500 1000 1100800 900700
0
0.1
0.3
0.5
0.7
0.4
0.6
0.2
0 200100 400300 600500 1000 1100800 900700
USA
EURO
JPN
100 (6.8)
500 (34.4)
1000 (68.9)
3600 (248), 6000 (413)
100 (6.8), 500 (34.4)
50 (3.4)
100 (6.8), 500 (34.4)
50 (3.4)1000 (68.9), 3600 (248), 6000 (413)
1000 (68.9)
3600 (248), 6000 (413)
6.8 (100)
34.4 (500)
68.9 (1000)
248 (3600), 413 (6000)
3.4 (50)
6.8 (100), 34.4 (500)
6.8 (100), 34.4 (500)
3.4 (50)68.9 (1000), 248 (3600), 413 (6000)
68.9 (1000)
248 (3600), 413 (6000)
0.68
3.44
6.89
24.8, 41.3
0.68, 3.44
0.68, 3.440.34
0.34 6.89, 24.8, 41.3
6.8924.8, 41.3
Nitrogen Flow, std ft3/min
Out
let
Pre
ssur
e, p
sig
Out
let
Pre
ssur
e, b
ar
Nitrogen Flow, std L/min
0
20
40
60
80
100
0
1.0
3.0
5.0
7.0
4.0
6.0
2.0
0 1.0 2.0 3.0 4.0 5.0
0 20 40 60 80 140100 120
0
20
40
60
80
100
0
1,0
3,0
5,0
7,0
4,0
6,0
2,0
0 1,0 2,0 3,0 4,0 5,0
0 20 40 60 80 140100 120
0
0.1
0.3
0.5
0.7
0.4
0.6
0.2
0 20 40 60 80 140100 120
USA
EURO
JPN
100 (6.8)
500 (34.4), 1000 (68.9),3600 (248), 6000 (413)
1000 (68.9),3600 (248), 6000 (413)
1000 (68.9),3600 (248), 6000 (413)
100 (6.8), 500 (34.4)50 (3.4)
50 (3.4) 100 (6.8), 500 (34.4) 50 (3.4), 100 (6.8), 500 (34.4)
1000 (68.9), 3600 (248),6000 (413)
6.8 (100)
34.4 (500), 68.9 (1000),248 (3600), 413 (6000)
3.4 (50)
6.8 (100)34.4 (500)
68.9 (1000),248 (3600), 413 (6000)
68.9 (1000),248 (3600), 413 (6000)
68.9 (1000),248 (3600), 413 (6000)
3.4 (50), 6.8 (100), 34.4 (500)
6.8 (100), 34.4 (500)3.4 (50)
3.44, 6.89,24.8, 41.3
0.68
0.34 0.68, 3.44
6.89, 24.8, 41.3
6.89, 24.8, 41.3
6.89, 24.8, 41.30.34, 0.68, 3.440.34 0.68, 3.44
Nitrogen Flow, std ft3/min
Out
let
Pre
ssur
e, p
sig
Out
let
Pre
ssur
e, b
ar
Nitrogen Flow, std L/min
KPR Series Pressure-Reducing Regulators Gas Flow
Detail A
A

14 Pressure-Reducing Regulator Flow Curves
Flow CurvesThe flow curves assume an initial set flow rate of 0.035 std ft3/min (1 std L/min) and an initial temperature of 70°F (20°C).
Pressure Control Range
0 to 500 psig (0 to 34.4 bar)
0 to 250 psig (0 to 17.2 bar)
Flow Coefficient 0.06, Pressure Control Ranges 0 to 500 psig (0 to 34.4 bar) and 0 to 250 psig (0 to 17.2 bar)
0
100
200
300
400
500
0 20 30 4010 70 80 906050 100
0
5.0
15
25
35
20
30
10
0 400 800 2000 2400 28001200 1600
0 20 30 4010 70 80 906050 100
0 400 800 2000 2400 28001200 1600
USA
EURO
JPN
0
100
200
300
400
500
0
5,0
15
25
35
20
30
10
0 400 800 2000 2400 28001200 16000
0.5
1.5
2.5
3.5
2.0
3.0
1.0
3600 (248), 6000 (413)
500 (34.4)
1000 (68.9)
500 (34.4) 1000 (68.9)
3600 (248), 6000 (413)
3600 (248), 6000 (413)1000 (68.9)
500 (34.4)
100 (6.8)
34.4 (500)
68.9 (1000) 248 (3600), 413 (6000)
248 (3600), 413 (6000)
34.4 (500) 68.9 (1000)
248 (3600), 413 (6000)6.8 (100)
34.4 (500)68.9 (1000)
3.44
6.89 24.8, 41.3
24.8, 41.3
3.44 6.89
24.8, 41.36.893.44
0.68
Nitrogen Flow, std ft3/min
Out
let
Pre
ssur
e, p
sig
Out
let
Pre
ssur
e, b
ar
Nitrogen Flow, std L/min
0
100
200
300
400
500
0
10
15
25
35
20
30
20
0 5.0 10 15 20 25
0 100 200 300 400 700500 600
0 5,0 10 15 20 25
0 100 200 300 400 700500 600
USA
EURO
JPN
0
100
200
300
400
500
0
5,0
15
25
35
20
30
10
0 100 200 300 400 700500 6000
0.5
1.5
2.5
3.5
2.0
3.0
1.0
1000 (68.9)
500 (34.4)
1000 (68.9)
3600 (248), 6000 (413)
500 (34.4)
1000 (68.9), 3600 (248), 6000 (413)
3600 (248), 6000 (413)
100 (6.8)
500 (34.4)
248 (3600), 413 (6000)
68.9 (1000)
34.4 (500)
68.9 (1000), 248 (3600), 413 (6000)
34.4 (500)
248 (3600), 413 (6000)
68.9 (1000)34.4 (500)
6.8 (100)
24.8, 41.3
6.89
3.44
3.44
24.8, 41.3
6.89, 24.8, 41.3
6.893.44
0.68
Nitrogen Flow, std ft3/min
Out
let
Pre
ssur
e, p
sig
Out
let
Pre
ssur
e, b
ar
Nitrogen Flow, std L/min
KPR Series Pressure-Reducing Regulators Gas Flow
Detail A
A

Pressure-Reducing Regulator Flow Curves 15
Flow CurvesThe flow curves assume an initial set flow rate of 0.035 std ft3/min (1 std L/min) and an initial temperature of 70°F (20°C).
Pressure Control Range
0 to 25 psig (0 to 1.7 bar)
0 to 10 psig (0 to 0.68 bar)
Flow Coefficient 0.20, Pressure Control Ranges 0 to 25 psig (0 to 1.7 bar) and 0 to 10 psig (0 to 0.68 bar)
0
5.0
10
15
20
25
30
0 2.0 4.0 6.0 8.0 1210 14
0
0.5
1.0
1.5
2.0
0 40 80 120 160 280 320 360200 240
0 2,0 4,0 6,0 8,0 1210 14
0 40 80 120 160 280 320 360200 240
USA
EURO
JPN
0
5,0
10
15
20
25
30
0
0,5
1,0
1,5
2,0
0 40 80 120 160 280 320 360200 240
0
0.05
0.10
0.15
0.20
500 (34.4)
50 (3.4)
100 (6.8)3600 (248)
500 (34.4)
100 (6.8)50 (3.4)
34.4 (500)
68.9 (1000),
1000 (68.9)
248 (3600)6.8 (100)
3.4 (50)
34.4 (500)
6.8 (100)3.4 (50)
3.44
0.340.68
6.89
24.8
3.44
0.34 0.68
Nitrogen Flow, std ft3/min
Out
let
Pre
ssur
e, p
sig
Out
let
Pre
ssur
e, b
ar
Nitrogen Flow, std L/min
0
5.0
10
15
20
25
30
0 1.0 2.0 3.0 4.0 5.0
0
0.5
1.0
1.5
2.0
0 20 40 60 80 140100 120
0 1,0 2,0 3,0 4,0 5,0
0 20 40 60 80 140100 120
USA
EURO
JPN
0
5,0
10
15
20
25
30
0
0,5
1,0
1,5
2,0
0 20 40 60 80 140100 1200
0.05
0.10
0.15
0.20
500 (34.4), 1000 (68.9)
3600 (248)
100 (6.8)
50 (3.4)
3600 (248)
100 (6.8), 500 (34.4), 1000 (68.9)3600 (248)50 (3.4)50 (3.4)
100 (6.8), 500 (34.4), 1000 (68.9)
34.4 (500), 68.9 (1000)
248 (3600)
6.8 (100)
3.4 (50)
248 (3600)
6.8 (100), 34.4 (500), 68.9 (1000)248 (3600)
6.8 (100), 34.4 (500), 68.9 (1000)
3.4 (50) 3.4 (50)
3.44, 6.89
24.8
0.68
0.34
24.8
0.68, 3.44, 6.8924.8
0.68, 3.44, 6.89
0.34 0.34
Nitrogen Flow, std ft3/min
Out
let
Pre
ssur
e, p
sig
Out
let
Pre
ssur
e, b
ar
Nitrogen Flow, std L/min
KPR Series Pressure-Reducing Regulators Gas Flow
Detail A
A

16 Pressure-Reducing Regulator Flow Curves
Flow CurvesThe flow curves assume an initial set flow rate of 0.035 std ft3/min (1 std L/min) and an initial temperature of 70°F (20°C).
Pressure Control Range
0 to 100 psig (0 to 6.8 bar)
0 to 50 psig (0 to 3.4 bar)
Flow Coefficient 0.20, Pressure Control Ranges 0 to 100 psig (0 to 6.8 bar) and 0 to 50 psig (0 to 3.4 bar)
0
20
40
60
80
100
0 5.0 10 15 20 3025 35 40
0
1.0
3.0
5.0
7.0
4.0
6.0
2.0
0 100 200 300 400 700 800 900 1000 1100500 600
0
20
40
60
80
100
0 5,0 10 15 20 3025 35 40
0
1,0
3,0
5,0
7,0
4,0
6,0
2,0
0 200100 400300 600500 1000 1100800 900700
0
0.1
0.3
0.5
0.7
0.4
0.6
0.2
0 200100 400300 600500 1000 1100800 900700
USA
EURO
JPN
100 (6.8)500 (34.4)
1000 (68.9),3600 (248), 6000 (413)500 (34.4), 1000 (68.9),
3600 (248), 6000 (413)
50 (3.4), 100 (6.8)
500 (34.4), 1000 (68.9)
3600 (248), 6000 (413)50 (3.4)
100 (6.8)
68.9 (1000),248 (3600), 413 (6000)
34.4 (500)6.8 (100)
34.4 (500), 68.9 (1000),248 (3600), 413 (6000)
3.4 (50), 6.8 (100)
248 (3600), 413 (6000)
34.4 (500), 68.9 (1000)3.4 (50)
6.8 (100)
6.89, 24.8, 41.3
3.440.68
3.44, 6.89, 24.8, 41.30.34, 0.68
3.44, 6.8924.8, 41.30.680.34
Nitrogen Flow, std ft3/min
Out
let
Pre
ssur
e, p
sig
Out
let
Pre
ssur
e, b
ar
Nitrogen Flow, std L/min
0
20
40
60
80
100
0
1.0
3.0
5.0
7.0
4.0
6.0
2.0
0 2.0 4.0 6.0 8.0 10
0 40 80 120 160 280200 240
0
20
40
60
80
100
0
1,0
3,0
5,0
7,0
4,0
6,0
2,0
0 2,0 4,0 6,0 8,0 10
0 40 80 120 160 280200 240
0
0.1
0.3
0.5
0.7
0.4
0.6
0.2
0 40 80 120 160 280200 240
USA
EURO
JPN
1000 (68.9), 3600 (248), 6000 (413)
100 (6.8),500 (34.4)
500 (34.4), 1000 (68.9),3600 (248), 6000 (413)
50 (3.4), 100 (6.8)
100 (6.8)50 (3.4)
50 (3.4)100 (6.8)
500 (34.4), 1000 (68.9),3600 (248), 6000 (413)
68.9 (1000), 248 (3600), 413 (6000)
6.8 (100), 34.4 (500)
34.4 (500), 68.9 (1000),248 (3600), 413 (6000)
3.4 (50), 6.8 (100)
3.4 (50)
3.4 (50)
6.8 (100)
6.8 (100)
34.4 (500), 68.9 (1000),248 (3600), 413 (6000)
6.89, 24.8, 41.3
0.68, 3.44
3.44, 6.89, 24.8, 41.3
0.34, 0.68
3.44, 6.89, 24.8, 41.3
0.68
0.68
3.44, 6.89, 24.8, 41.30.34
0.34
Nitrogen Flow, std ft3/min
Out
let
Pre
ssur
e, p
sig
Out
let
Pre
ssur
e, b
ar
Nitrogen Flow, std L/min
KPR Series Pressure-Reducing Regulators Gas Flow
Detail A
A
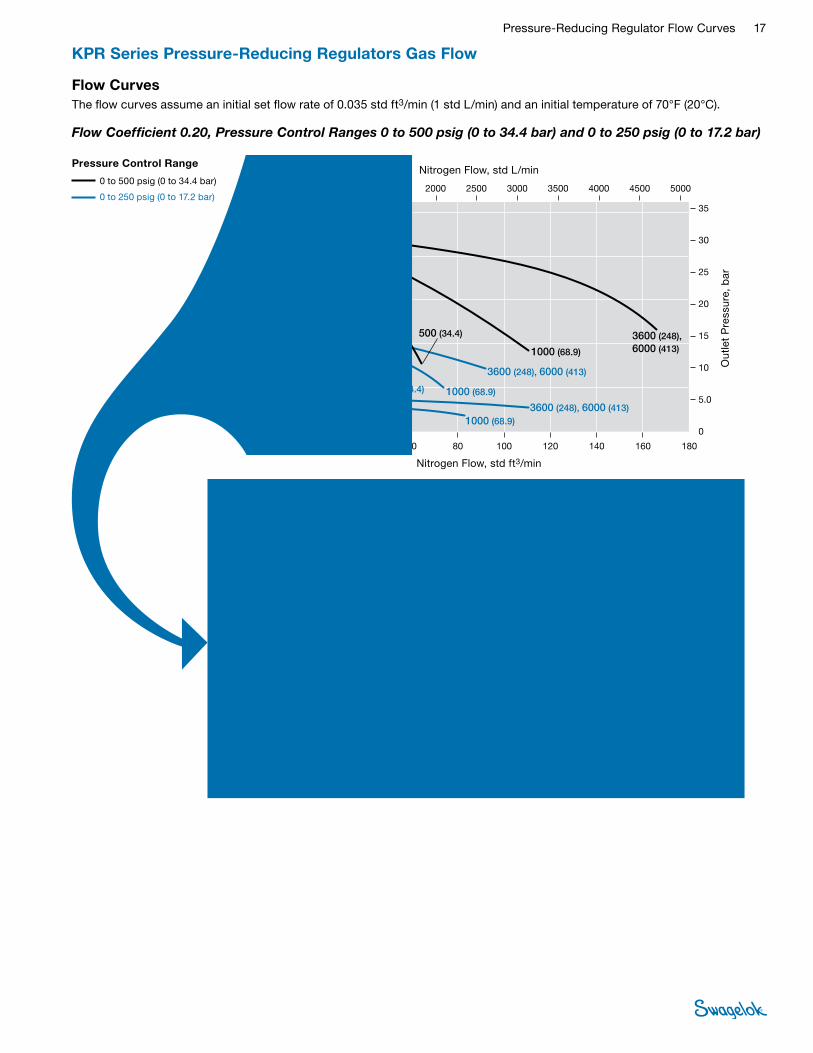
Pressure-Reducing Regulator Flow Curves 17
Flow CurvesThe flow curves assume an initial set flow rate of 0.035 std ft3/min (1 std L/min) and an initial temperature of 70°F (20°C).
Pressure Control Range
0 to 500 psig (0 to 34.4 bar)
0 to 250 psig (0 to 17.2 bar)
Flow Coefficient 0.20, Pressure Control Ranges 0 to 500 psig (0 to 34.4 bar) and 0 to 250 psig (0 to 17.2 bar)
0
100
200
300
400
500
0 20 40 60 120 140 16010080 180
0
5.0
15
25
35
20
30
10
0 500 15001000 4000 4500 500025002000 35003000
0 20 40 60 120 140 16010080 180
0 500 15001000 4000 4500 500025002000 35003000
USA
EURO
JPN
0
100
200
300
400
500
0
5,0
15
25
35
20
30
10
0
0.5
1.5
2.5
3.5
2.0
3.0
1.0
0 500 15001000 4000 4500 500025002000 35003000
500 (34.4)
1000 (68.9)
3600 (248), 6000 (413)
3600 (248), 6000 (413)
3600 (248), 6000 (413)
100 (6.8)
500 (34.4)
500 (34.4)
1000 (68.9)
1000 (68.9)
248 (3600), 413 (6000)68.9 (1000)
34.4 (500)
248 (3600), 413 (6000)
248 (3600), 413 (6000)
68.9 (1000)
68.9 (1000)
34.4 (500)
34.4 (500)6.8 (100)
3.446.89
24.8, 41.3
24.8, 41.3
24.8, 41.3
6.89
6.89
3.44
3.440.68
Nitrogen Flow, std ft3/min
Out
let
Pre
ssur
e, p
sig
Out
let
Pre
ssur
e, b
ar
Nitrogen Flow, std L/min
0
100
200
300
400
500
0
10
15
25
35
20
30
20
0 10 20 30 40 50 60
0 200 400 600 800 16001000 1200 1400
0 10 20 30 40 50 60
0 200 400 600 800 16001000 1200 1400
0 200 400 600 800 16001000 1200 1400
USA
EURO
JPN
0
100
200
300
400
500
0
5,0
15
25
35
20
30
10
0
0.5
1.5
2.5
3.5
2.0
3.0
1.0
3600 (248), 6000 (413)
1000 (68.9)
500 (34.4)
3600 (248), 6000 (413)
1000 (68.9)
500 (34.4)
1000 (68.9), 3600 (248), 6000 (413)500 (34.4)100 (6.8)
248 (3600), 413 (6000)
68.9 (1000)
34.4 (500)
248 (3600), 413 (6000)
68.9 (1000)
34.4 (500)
68.9 (1000), 248 (3600), 413 (6000)34.4 (500)6.8 (100)
24.8, 41.3
6.89
3.44
24.8, 41.3
6.89
3.44
3.440.68 6.89, 24.8, 41.3
Nitrogen Flow, std ft3/min
Out
let
Pre
ssur
e, p
sig
Out
let
Pre
ssur
e, b
ar
Nitrogen Flow, std L/min
KPR Series Pressure-Reducing Regulators Gas Flow
Detail A
A

18 Pressure-Reducing Regulator Flow Curves
Flow CurvesThe flow curves assume an initial set flow rate of 0.035 std ft3/min (1 std L/min) and an initial temperature of 70°F (20°C).
Pressure Control Range
0 to 25 psig (0 to 1.7 bar)
0 to 10 psig (0 to 0.68 bar)
Flow Coefficient 0.50, Pressure Control Ranges 0 to 25 psig (0 to 1.7 bar) and 0 to 10 psig (0 to 0.68 bar)
0
5.0
10
15
20
25
30
0 2.0 4.0 6.0 8.0 10 12
0
0.5
1.0
1.5
2.0
0 40 80 120 160 280 320200 240
0 2,0 4,0 6,0 8,0 10 12
0 40 80 120 160 280 320200 2400
5,0
10
15
20
25
30
0
0,5
1,0
1,5
2,0
0 40 80 120 160 280 320200 2400
0.05
0.10
0.15
0.20
USA
EURO
JPN
1000 (68.9)
3600 (248), 6000 (413)
100 (6.8), 500 (34.4)
1000 (68.9)
100 (6.8)
50 (3.4)3600 (248), 6000 (413)
68.9 (1000),
248 (3600), 413 (6000)
6.8 (100), 34.4 (500)
3.4 (50)
6.8 (100) 248 (3600), 413 (6000)
68.9 (1000),
6.89
24.8, 41.30.68, 3.44
6.89
24.8, 41.30.34
0.68
Nitrogen Flow, std ft3/min
Out
let
Pre
ssur
e, p
sig
Out
let
Pre
ssur
e, b
ar
Nitrogen Flow, std L/min
0
5.0
10
15
20
25
30
0 1.00.5 2.01.5 3.0 3.52.5 4.0
0
0.5
1.0
1.5
2.0
0 2010 4030 6050 80 9070 100 110
0 1,00,5 2,01,5 3,0 3,52,5 4,0
0 2010 4030 6050 80 9070 100 110
USA
EURO
JPN
0
5,0
10
15
20
25
30
0
0,5
1,0
1,5
2,0
0 2010 4030 6050 80 9070 100 1100
0.05
0.10
0.15
0.20
100 (6.8), 500 (34.4)
1000 (68.9), 3600 (248), 6000 (413)
1000 (68.9)
100 (6.8), 3600 (248), 6000 (413)
50 (3.4)
3600 (248), 6000 (413)50 (3.4), 100 (6.8),500 (34.4), 1000 (68.9)
6.8 (100), 34.4 (500)
68.9 (1000), 248 (3600), 413 (6000)
6.8 (100), 248 (3600), 413 (6000)
3.4 (50)
68.9 (1000)
3.4 (50), 6.8 (100),34.4 (500), 68.9 (1000)
248 (3600), 413 (6000)
0.68, 3.44
6.89, 24.8, 41.3
0.68, 24.8, 41.3
6.89
0.340.34, 0.68,3.44, 6.89
24.8, 41.3
Nitrogen Flow, std ft3/min
Out
let
Pre
ssur
e, p
sig
Out
let
Pre
ssur
e, b
ar
Nitrogen Flow, std L/min
KPR Series Pressure-Reducing Regulators Gas Flow
Detail A
A

Pressure-Reducing Regulator Flow Curves 19
Flow CurvesThe flow curves assume an initial set flow rate of 0.035 std ft3/min (1 std L/min) and an initial temperature of 70°F (20°C).
Pressure Control Range
0 to 100 psig (0 to 6.8 bar)
0 to 50 psig (0 to 3.4 bar)
0
20
40
60
80
100
0 5.0 10 15 20 3025 35 40
0
1.0
3.0
5.0
7.0
4.0
6.0
2.0
0 100 200 300 400 700 800 900 1000 1100500 600
USA
EURO
JPN
0
20
40
60
80
100
0 5,0 10 15 20 3025 35 40
0
1,0
3,0
5,0
7,0
4,0
6,0
2,0
0 200100 400300 600500 1000 1100800 900700
0
0.1
0.3
0.5
0.7
0.4
0.6
0.2
0 200100 400300 600500 1000 1100800 900700
100 (6.8)
500 (34.4)
1000 (68.9), 3600 (248), 6000 (413)
50 (3.4)
50 (3.4)
100 (6.8),500 (34.4)
3600 (248), 6000 (413)
100 (6.8)
500 (34.4)
1000 (68.9)
6.8 (100)
34.4 (500)
68.9 (1000), 248 (3600), 413 (6000)
248 (3600), 413 (6000)
3.4 (50)
3.4 (50)
6.8 (100),34.4 (500)
68.9 (1000),
34.4 (500)
6.8 (100)
0.68
3.44
6.89, 24.8, 41.3
0.34
0.34
0.68, 3.44
24.8, 41.3
0.68
3.44
6.89
Nitrogen Flow, std ft3/min
Out
let
Pre
ssur
e, p
sig
Out
let
Pre
ssur
e, b
ar
Nitrogen Flow, std L/min
0
20
40
60
80
100
0
1.0
3.0
5.0
7.0
4.0
6.0
2.0
0 2.01.0 4.03.0 5.0 6.0 7.0 8.0
0 5025 75 125100 150 225200175
0 2,01,0 4,03,0 5,0 6,0 7,0 8,0
0 5025 75 125100 150 225200175
0 5025 75 125100 150 225200175
0
20
40
60
80
100
0
1,0
3,0
5,0
7,0
4,0
6,0
2,0
0
0.1
0.3
0.5
0.7
0.4
0.6
0.2
USA
EURO
JPN
1000 (68.9), 3600 (248), 6000 (413)
100 (6.8), 500 (34.4)
100 (6.8), 500 (34.4)
50 (3.4)
100 (6.8), 500 (34.4)50 (3.4)
1000 (68.9), 3600 (248), 6000 (413)
1000 (68.9), 3600 (248), 6000 (413)
68.9 (1000), 248 (3600), 413 (6000)
6.8 (100), 34.4 (500)
6.8 (100), 34.4 (500)
68.9 (1000), 248 (3600), 413 (6000)
68.9 (1000), 248 (3600), 413 (6000) 3.4 (50)
6.8 (100), 34.4 (500)3.4 (50)
6.89, 24.8, 41.3
0.68, 3.44
0.68, 3.44
6.89, 24.8, 41.3
0.346.89, 24.8, 41.3
0.68, 3.440.34
Nitrogen Flow, std ft3/min
Out
let
Pre
ssur
e, p
sig
Out
let
Pre
ssur
e, b
ar
Nitrogen Flow, std L/min
KPR Series Pressure-Reducing Regulators Gas Flow
Flow Coefficient 0.50, Pressure Control Ranges 0 to 100 psig (0 to 6.8 bar) and 0 to 50 psig (0 to 3.4 bar)
Detail A
A

20 Pressure-Reducing Regulator Flow Curves
Flow CurvesThe flow curves assume an initial set flow rate of 0.035 std ft3/min (1 std L/min) and an initial temperature of 70°F (20°C).
Pressure Control Range
0 to 500 psig (0 to 34.4 bar)
0 to 250 psig (0 to 17.2 bar)
Flow Coefficient 0.50, Pressure Control Ranges 0 to 500 psig (0 to 34.4 bar) and 0 to 250 psig (0 to 17.2 bar)
0
100
200
300
400
500
0 20 40 60 120 140 16010080 180
0
5.0
15
25
35
20
30
10
0 500 15001000 4000 4500 500025002000 35003000
0 20 40 60 120 140 16010080 180
0 500 15001000 4000 4500 500025002000 35003000
USA
EURO
JPN
0
100
200
300
400
500
0
5,0
15
25
35
20
30
10
0
0.5
1.5
2.5
3.5
2.0
3.0
1.0
0 500 15001000 4000 4500 500025002000 35003000
500 (34.4)
1000 (68.9)3600 (248), 6000 (413)
3600 (248), 6000 (413)
1000 (68.9)500 (34.4)
3600 (248), 6000 (413)
500 (34.4), 1000 (68.9)100 (6.8)
34.4 (500)
68.9 (1000)248 (3600), 413 (6000)
34.4 (500)68.9 (1000)
248 (3600), 413 (6000)
248 (3600), 413 (6000)
34.4 (500), 68.9 (1000)6.8 (100)
24.8, 41.36.89
3.44
24.8, 41.3
24.8, 41.3
3.44
3.44, 6.890.68
6.89
Nitrogen Flow, std ft3/min
Out
let
Pre
ssur
e, p
sig
Out
let
Pre
ssur
e, b
ar
Nitrogen Flow, std L/min
0
100
200
300
400
500
0
10
15
25
35
20
30
20
0 10 20 30 40 50 60
0 200 400 600 800 16001000 1200 1400
0 10 20 30 40 50 60
0 200 400 600 800 16001000 1200 1400
0 200 400 600 800 16001000 1200 1400
USA
EURO
JPN
0
100
200
300
400
500
0
5,0
15
25
35
20
30
10
0
0.5
1.5
2.5
3.5
2.0
3.0
1.0
3600 (248), 6000 (413)
1000 (68.9)
500 (34.4)
1000 (68.9),3600 (248), 6000 (413)
500 (34.4)
3600 (248), 6000 (413)500 (34.4), 1000 (68.9)100 (6.8)
248 (3600), 413 (6000)
68.9 (1000)
34.4 (500)
68.9 (1000),248 (3600),413 (6000)
34.4 (500)
248 (3600), 413 (6000)34.4 (500), 68.9 (1000)6.8 (100)
24.8, 41.3
6.89
3.44
6.89, 24.8, 41.33.44
24.8, 41.30.68 3.44, 6.89
Nitrogen Flow, std ft3/min
Out
let
Pre
ssur
e, p
sig
Out
let
Pre
ssur
e, b
ar
Nitrogen Flow, std L/min
KPR Series Pressure-Reducing Regulators Gas Flow
Detail A
A

Pressure-Reducing Regulator Flow Curves 21
KCY Series Two-Stage Pressure-Reducing Regulators Gas Flow
Flow CurvesThe flow curves assume an initial set flow rate of 0.035 std ft3/min (1 std L/min) and an initial temperature of 70°F (20°C).
The KCY series is designed for use in applications requiring constant outlet pressure even with wide variations in inlet pressure. This two-stage regulator is comparable to two single-stage regulators connected in series. The first stage is factory set to reduce the inlet pressure to 500 psig (34.4 bar). The second stage can be adjusted with the handle to achieve the required outlet pressure.
For features, additional technical data, materials of construction, and ordering information, see the Swagelok Pressure Regulators catalog, MS-02-230.
Pressure Control Range
0 to 25 psig (0 to 1.7 bar)
0 to 10 psig (0 to 0.68 bar)
Flow Coefficient 0.06, Pressure Control Ranges 0 to 25 psig (0 to 1.7 bar) and 0 to 10 psig (0 to 0.68 bar)
0
0 0.5 1.0 1.5 2.0 3.02.5 3.5 4.0
0
0 20 60 8040
0
0 0,5 1,0 1,5 2,0 3,02,5 3,5 4,0
0 0 20 40 60 80 100
JPN
EURO
USA
100
5,0
10
15
20
25
30
5.0
10
15
20
25
30
0,5
1,0
1,5
2,0
0.5
1.0
1.5
2.0
0 0 20 40 60 80 100
0.05
0.10
0.15
0.20
500 (34.4), 1000 (68.9), 3600 (248)
500 (34.4), 1000 (68.9), 3600 (248)
500 (34.4), 1000 (68.9), 3600 (248)
34.4 (500), 68.9 (1000), 248 (3600)
34.4 (500),68.9 (1000),248 (3600)34.4 (500), 68.9 (1000), 248 (3600)
3.44, 6.89, 24.8
3.44, 6.89, 24.83.44, 6.89, 24.8
Nitrogen Flow, std ft3/min
Out
let
Pre
ssur
e, p
sig
Out
let
Pre
ssur
e, b
ar
Nitrogen Flow, std L/min
0
5.0
10
15
20
25
30
0 0.2 0.4 0.6 0.8 1.0
0
0.5
1.0
1.5
2.0
0 16 2812
0
5,0
10
15
20
25
0 0,2 0,4 0,6 0,8 1,0
0
0,5
1,0
1,5
2,0
0
USA
EURO
JPN
4.0 8.0 2420
16 28124,0 8,0 2420
0
0.05
0 16 28124.0 8.0 2420
30
0.10
0.20
0.15
500 (34.4), 1000 (68.9), 3600 (248)
500 (34.4), 1000 (68.9), 3600 (248)
500 (34.4), 1000 (68.9), 3600 (248)
34.4 (500), 68.9 (1000), 248 (3600)
34.4 (500), 68.9 (1000), 248 (3600)
34.4 (500), 68.9 (1000), 248 (3600)
3.44, 6.89, 24.8
3.44, 6.89, 24.8
3.44, 6.89, 24.8
Nitrogen Flow, std ft3/min
Out
let
Pre
ssur
e, p
sig
Out
let
Pre
ssur
e, b
ar
Nitrogen Flow, std L/min
Supply-Pressure Effect
Flow Coefficient
(Cv )
Pressure Control Range
Up to 100 psig (6.8 bar)
250 psig (17.2 bar)
and Higher
Supply Pressure Effect, %
0.06 0.01 0.02
0.20 0.02 0.06
0.50 0.05 0.13
Detail A
A
22 Pressure-Reducing Regulator Flow Curves
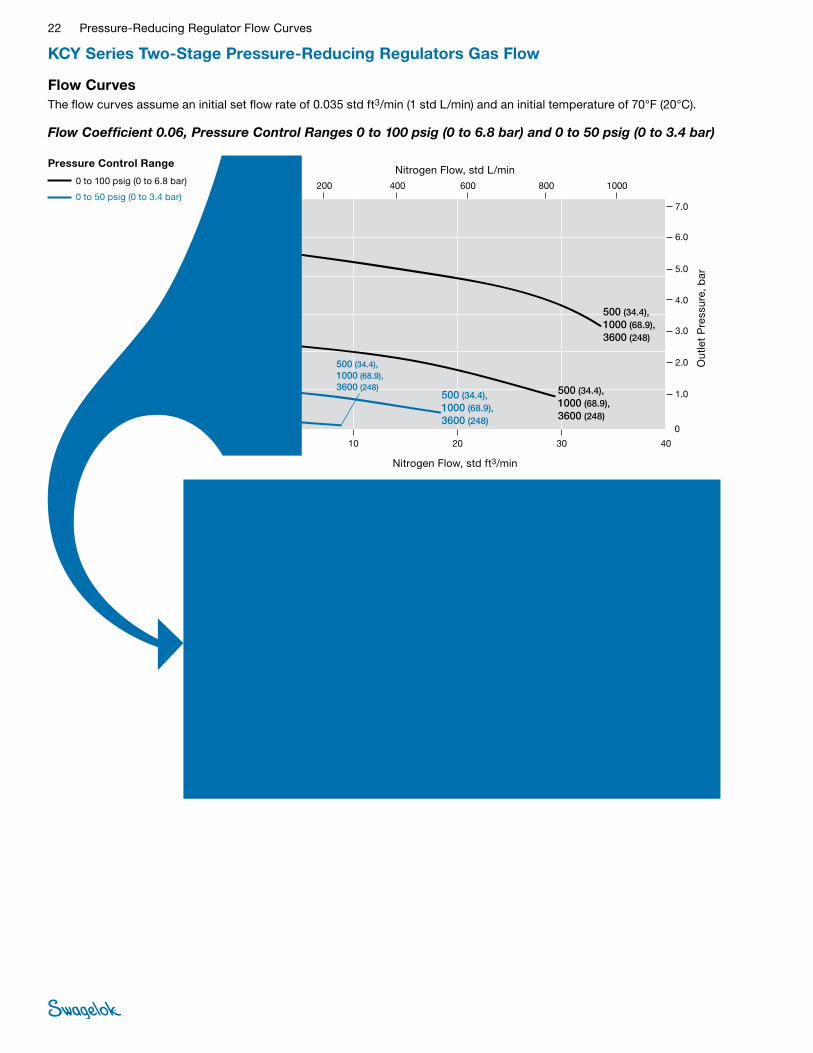
KCY Series Two-Stage Pressure-Reducing Regulators Gas Flow
Flow CurvesThe flow curves assume an initial set flow rate of 0.035 std ft3/min (1 std L/min) and an initial temperature of 70°F (20°C).
Pressure Control Range
0 to 100 psig (0 to 6.8 bar)
0 to 50 psig (0 to 3.4 bar)
Flow Coefficient 0.06, Pressure Control Ranges 0 to 100 psig (0 to 6.8 bar) and 0 to 50 psig (0 to 3.4 bar)
0
0 10 20 30 40
0
0 200 600 800400
0
0 5,0 10 15 20 3025 35 40
0 0 200 400 600 800 1000
JPN
EURO
USA
1000
20
40
60
120
20
40
60
80
1,0
2,0
3,0
7,0
6,0
5,0
4,0
1.0
2.0
3.0
7.0
6.0
5.0
4.0
0 0 200 400 600 800 1000
0.1
0.2
0.3
0.7
0.6
0.5
0.4
100
120
80
100
500 (34.4), 1000 (68.9), 3600 (248)
500 (34.4), 1000 (68.9), 3600 (248)
500 (34.4), 1000 (68.9), 3600 (248)
500 (34.4), 1000 (68.9), 3600 (248)
34.4 (500), 68.9 (1000), 248 (3600)
34.4 (500), 68.9 (1000), 248 (3600)
34.4 (500), 68.9 (1000), 248 (3600)
34.4 (500), 68.9 (1000), 248 (3600)
3.44, 6.89, 24.8
3.44, 6.89, 24.83.44, 6.89, 24.8
3.44, 6.89, 24.8
Nitrogen Flow, std ft3/min
Out
let
Pre
ssur
e, p
sig
Out
let
Pre
ssur
e, b
ar
Nitrogen Flow, std L/min
0
20
40
60
80
0 1.0 2.0 3.0 4.0 5.0
0
1.0
2.0
3.0
7.0
0 80 14060
0
0 1,0 2,0 3,0 4,0 5,0
0 0
USA
EURO
JPN
20 40 120100
80 1406020 40 120100
6.0
5.0
4.0
1,0
2,0
3,0
7,0
6,0
5,0
4,0
20
40
60
100
0 0 80 1406020 40 120100
0.1
0.2
0.3
0.7
0.6
0.5
0.4
100
120
80
120
500 (34.4), 1000 (68.9), 3600 (248)
500 (34.4), 1000 (68.9), 3600 (248)
500 (34.4), 1000 (68.9), 3600 (248)
500 (34.4), 1000 (68.9), 3600 (248)
34.4 (500), 68.9 (1000), 248 (3600)
34.4 (500), 68.9 (1000), 248 (3600)
34.4 (500), 68.9 (1000), 248 (3600)
34.4 (500), 68.9 (1000), 248 (3600)
3.44, 6.89, 24.8
3.44, 6.89, 24.8
3.44, 6.89, 24.8
3.44, 6.89, 24.8
Nitrogen Flow, std ft3/min
Out
let
Pre
ssur
e, p
sig
Out
let
Pre
ssur
e, b
ar
Nitrogen Flow, std L/minDetail A
A

Pressure-Reducing Regulator Flow Curves 23
KCY Series Two-Stage Pressure-Reducing Regulators Gas Flow
Flow CurvesThe flow curves assume an initial set flow rate of 0.035 std ft3/min (1 std L/min) and an initial temperature of 70°F (20°C).
Pressure Control Range
0 to 500 psig (0 to 34.4 bar)
0 to 250 psig (0 to 17.2 bar)
Flow Coefficient 0.06, Pressure Control Ranges 0 to 500 psig (0 to 34.4 bar) and 0 to 250 psig (0 to 17.2 bar)
0
0 5.0 10 15 20
0
0 100 200 300 400 500
0
0
0 0
JPN
EURO
USA
5,0 10 15 20
100 200 300 400 500
100
200
300
400
500
600
10
20
30
40
10
20
30
40
100
200
300
400
500
600
0 0 100 200 300 400 500
1.0
2.0
3.0
4.0
500 (34.4), 1000 (68.9), 3600 (248)
500 (34.4), 1000 (68.9), 3600 (248)
500 (34.4), 1000 (68.9), 3600 (248)
34.4 (500), 68.9 (1000), 248 (3600)
34.4 (500), 68.9 (1000), 248 (3600)
34.4 (500), 68.9 (1000), 248 (3600)
3.44, 6.89, 24.8
3.44, 6.89, 24.8
3.44, 6.89, 24.8
Nitrogen Flow, std ft3/min
Out
let
Pre
ssur
e, p
sig
Out
let
Pre
ssur
e, b
ar
Nitrogen Flow, std L/min
0
100
200
300
400
500
600
0 1.0 2.0 3.0 4.0 5.0
0
10
20
30
40
0 80 14060
0
100
200
300
400
500
0 1,0 2,0 3,0 4,0 5,0
0
10
20
30
40
0
USA
EURO
JPN
20 40 120100
80 1406020 40 120100
0
1.0
2.0
3.0
4.0
0 80 1406020 40 120100
600
500 (34.4), 1000 (68.9), 3600 (248)
500 (34.4), 1000 (68.9), 3600 (248)
500 (34.4), 1000 (68.9), 3600 (248)
34.4 (500), 68.9 (1000), 248 (3600)
34.4 (500), 68.9 (1000), 248 (3600)
34.4 (500), 68.9 (1000), 248 (3600)
3.44, 6.89, 24.8
3.44, 6.89, 24.8
3.44, 6.89, 24.8
Nitrogen Flow, std ft3/min
Out
let
Pre
ssur
e, p
sig
Out
let
Pre
ssur
e, b
ar
Nitrogen Flow, std L/minDetail A
A
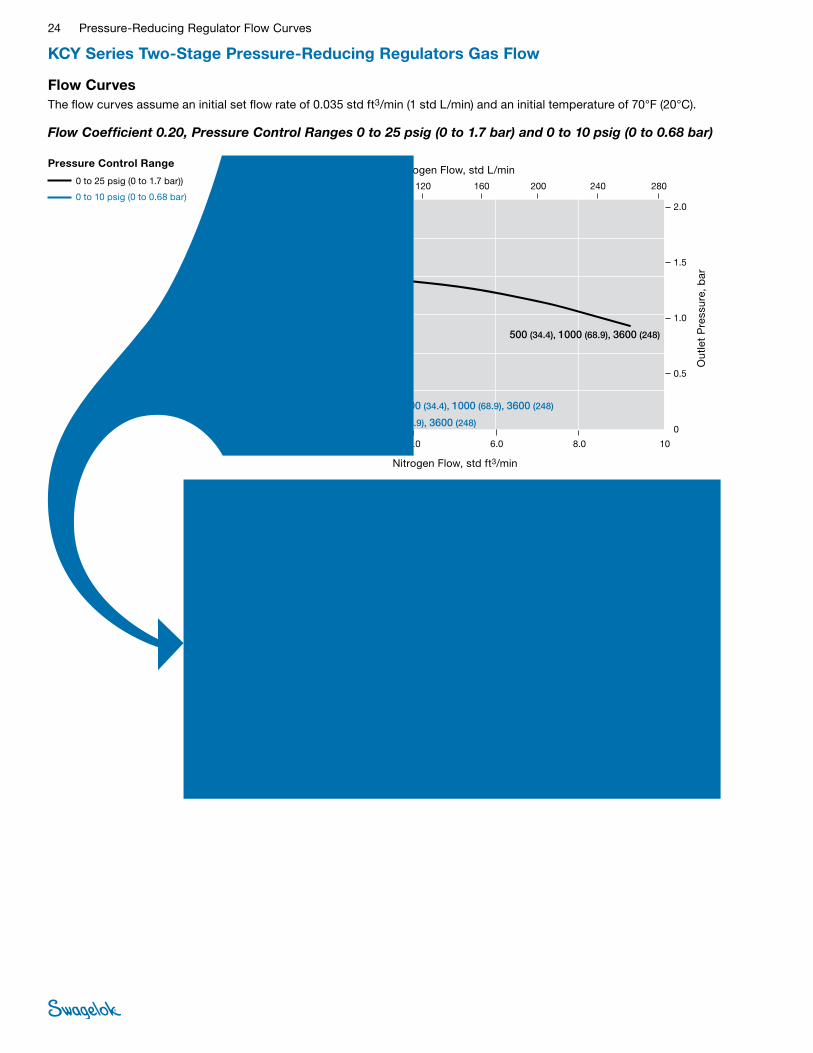
24 Pressure-Reducing Regulator Flow Curves
KCY Series Two-Stage Pressure-Reducing Regulators Gas Flow
Flow CurvesThe flow curves assume an initial set flow rate of 0.035 std ft3/min (1 std L/min) and an initial temperature of 70°F (20°C).
Pressure Control Range
0 to 25 psig (0 to 1.7 bar))
0 to 10 psig (0 to 0.68 bar)
Flow Coefficient 0.20, Pressure Control Ranges 0 to 25 psig (0 to 1.7 bar) and 0 to 10 psig (0 to 0.68 bar)
0
5.0
10
15
20
25
30
0 2.0 4.0 6.0 8.0 10
0
0.5
1.0
1.5
2.0
0 160 280120
0
5,0
10
15
20
25
0 2,0 4,0 6,0 8,0 10
0
0,5
1,0
1,5
2,0
0
USA
EURO
JPN
40 80 240200
160 28012040 80 240200
0
0.05
0 160 28012040 80 240200
30
0.10
0.20
0.15
500 (34.4), 1000 (68.9), 3600 (248)
500 (34.4), 1000 (68.9), 3600 (248)
500 (34.4), 1000 (68.9), 3600 (248)
34.4 (500), 68.9 (1000), 248 (3600)
34.4 (500), 68.9 (1000), 248 (3600)
34.4 (500), 68.9 (1000), 248 (3600)
3.44, 6.89, 24.8
3.44, 6.89, 24.83.44, 6.89, 24.8
Nitrogen Flow, std ft3/min
Out
let
Pre
ssur
e, p
sig
Out
let
Pre
ssur
e, b
ar
Nitrogen Flow, std L/min
0
0 1.0 2.0 3.0 4.0
0
0 20 60 8040
0
0 1,0 2,0 3,0 4,0
0 0 20 40 60 80 100
JPN
EURO
USA
100
5.0
10
15
20
25
30
5.0
10
15
20
25
30
0,5
1,0
1,5
2,0
0.5
1.0
1.5
2.0
0 0 20 40 60 80 100
0.05
0.10
0.15
0.20
500 (34.4), 1000 (68.9), 3600 (248)
500 (34.4), 1000 (68.9), 3600 (248)
500 (34.4), 1000 (68.9), 3600 (248)
34.4 (500), 68.9 (1000), 248 (3600)
34.4 (500), 68.9 (1000), 248 (3600)
34.4 (500), 68.9 (1000), 248 (3600)
3.44, 6.89, 24.8
3.44, 6.89, 24.8
3.44, 6.89, 24.8
Nitrogen Flow, std ft3/min
Out
let
Pre
ssur
e, p
sig
Out
let
Pre
ssur
e, b
ar
Nitrogen Flow, std L/minDetail A
A

Pressure-Reducing Regulator Flow Curves 25
KCY Series Two-Stage Pressure-Reducing Regulators Gas Flow
Flow CurvesThe flow curves assume an initial set flow rate of 0.035 std ft3/min (1 std L/min) and an initial temperature of 70°F (20°C).
Pressure Control Range
0 to 100 psig (0 to 6.8 bar)
0 to 50 psig (0 to 3.4 bar)
Flow Coefficient 0.20, Pressure Control Ranges 0 to 100 psig (0 to 6.8 bar) and 0 to 50 psig (0 to 3.4 bar)
0
20
40
60
80
100
120
0 5.0 10 15 2520 35
0
2.0
4.0
6.0
8.0
0 200 600 800400
20
40
60
80
100
0
0
2,0
4,0
6,0
8,0
0
USA
JPN
EURO
30
120
5.0 10 15 2520 3530
200 600 800400
0
0.2
0.4
0.6
0.8
0 200 600 800400
0
500 (34.4), 1000 (68.9), 3600 (248)500 (34.4),
1000 (68.9), 3600 (248)
500 (34.4), 1000 (68.9), 3600 (248)
500 (34.4), 1000 (68.9), 3600 (248)
34.4 (500), 68.9 (1000), 248 (3600)34.4 (500),
68.9 (1000), 248 (3600)
34.4 (500), 68.9 (1000), 248 (3600)
34.4 (500), 68.9 (1000), 248 (3600)
3.44, 6.89, 24.8
3.44, 6.89, 24.83.44, 6.89, 24.8
3.44, 6.89, 24.8
Nitrogen Flow, std ft3/min
Out
let
Pre
ssur
e, p
sig
Out
let
Pre
ssur
e, b
ar
Nitrogen Flow, std L/min
0
20
40
60
80
0 1.0 2.0 3.0 4.0 5.0
0
1.0
2.0
3.0
7.0
0 80 14060
0
0 1,0 2,0 3,0 4,0 5,0
0 0
USA
EURO
JPN
20 40 120100
80 1406020 40 120100
6.0
5.0
4.0
1,0
2,0
3,0
7,0
6,0
5,0
4,0
80
100
120
0 0 80 1406020 40 120100
0.1
0.2
0.3
0.7
0.6
0.5
0.4
100
120
60
20
40
500 (34.4), 1000 (68.9), 3600 (248)
500 (34.4), 1000 (68.9), 3600 (248)
500 (34.4), 1000 (68.9), 3600 (248)
500 (34.4), 1000 (68.9), 3600 (248)
34.4 (500), 68.9 (1000), 248 (3600)
34.4 (500), 68.9 (1000), 248 (3600)
34.4 (500), 68.9 (1000), 248 (3600)
34.4 (500), 68.9 (1000), 248 (3600)
3.44, 6.89, 24.8
3.44, 6.89, 24.8
3.44, 6.89, 24.8
3.44, 6.89, 24.8
Nitrogen Flow, std ft3/min
Out
let
Pre
ssur
e, p
sig
Out
let
Pre
ssur
e, b
ar
Nitrogen Flow, std L/minDetail A
A
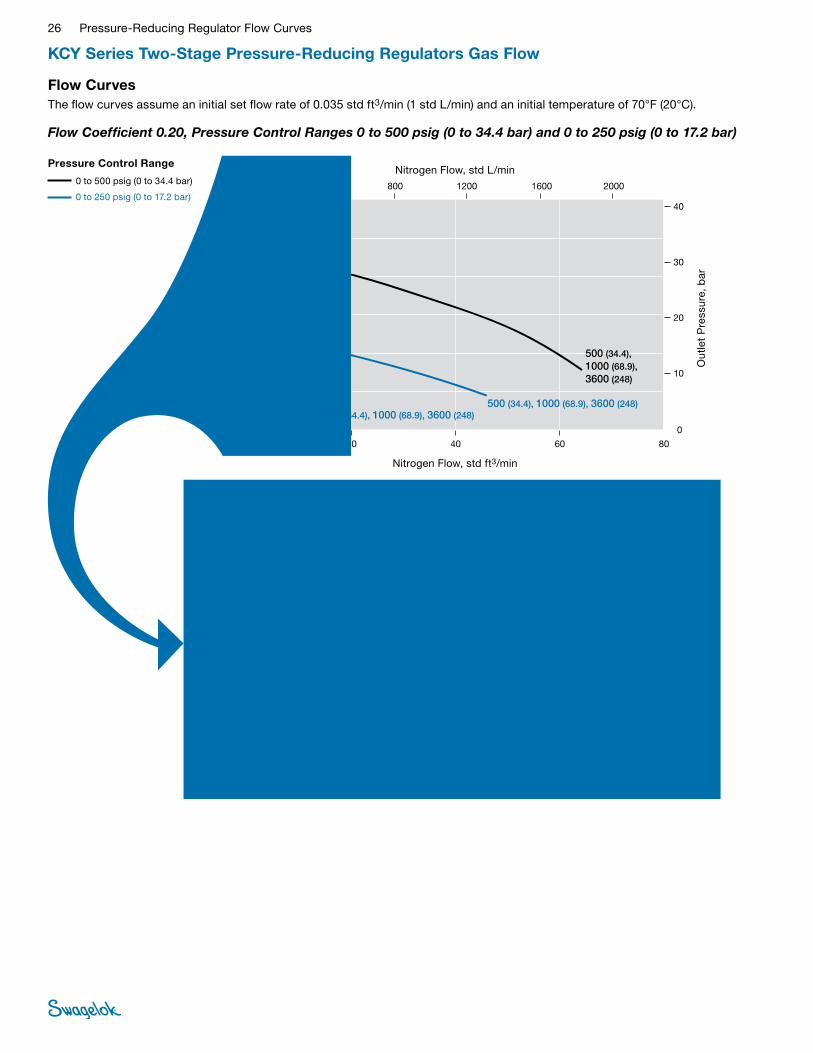
26 Pressure-Reducing Regulator Flow Curves
KCY Series Two-Stage Pressure-Reducing Regulators Gas Flow
Flow CurvesThe flow curves assume an initial set flow rate of 0.035 std ft3/min (1 std L/min) and an initial temperature of 70°F (20°C).
Pressure Control Range
0 to 500 psig (0 to 34.4 bar)
0 to 250 psig (0 to 17.2 bar)
Flow Coefficient 0.20, Pressure Control Ranges 0 to 500 psig (0 to 34.4 bar) and 0 to 250 psig (0 to 17.2 bar)
0
0 20 40 60 80
0
0 400 800 1200 1600 2000
0
0
0 0
JPN
EURO
USA
20 40 60 80
400 800 1200 1600 2000
100
200
300
400
500
600
10
20
30
40
10
20
30
40
100
200
300
400
500
600
0 0 400 800 1200 1600 2000
1.0
2.0
3.0
4.0
500 (34.4), 1000 (68.9), 3600 (248)
500 (34.4), 1000 (68.9), 3600 (248)500 (34.4), 1000 (68.9), 3600 (248)
34.4 (500), 68.9 (1000), 248 (3600)
34.4 (500), 68.9 (1000), 248 (3600)
34.4 (500), 68.9 (1000), 248 (3600)
3.44, 6.89, 24.8
3.44, 6.89, 24.83.44, 6.89, 24.8
Nitrogen Flow, std ft3/min
Out
let
Pre
ssur
e, p
sig
Out
let
Pre
ssur
e, b
ar
Nitrogen Flow, std L/min
0
0 5.0 10 15 20
0
0 100 200 300 400 500
0
0
0 0
JPN
EURO
USA
5,0 10 15 20
100 200 300 400 500
100
200
300
400
500
600
10
20
30
40
10
20
30
40
100
200
300
400
500
600
0 0 100 200 300 400 500
1.0
2.0
3.0
4.0
500 (34.4), 1000 (68.9), 3600 (248)
500 (34.4), 1000 (68.9), 3600 (248)
500 (34.4), 1000 (68.9), 3600 (248)
34.4 (500), 68.9 (1000), 248 (3600)
34.4 (500), 68.9 (1000), 248 (3600)
34.4 (500), 68.9 (1000), 248 (3600)
3.44, 6.89, 24.8
3.44, 6.89, 24.8
3.44, 6.89, 24.8
Nitrogen Flow, std ft3/min
Out
let
Pre
ssur
e, p
sig
Out
let
Pre
ssur
e, b
ar
Nitrogen Flow, std L/minDetail A
A

Pressure-Reducing Regulator Flow Curves 27
KCY Series Two-Stage Pressure-Reducing Regulators Gas Flow
Flow CurvesThe flow curves assume an initial set flow rate of 0.035 std ft3/min (1 std L/min) and an initial temperature of 70°F (20°C).
Pressure Control Range
0 to 25 psig (0 to 1.7 bar))
0 to 10 psig (0 to 6.8 bar)
Flow Coefficient 0.50, Pressure Control Ranges 0 to 25 psig (0 to 1.7 bar) and 0 to 10 psig (0 to 0.68 bar)
0
0 1.0 2.0 3.0 4.0 6.05.0 7.0 8.0
0
0 40 120 16080
0
0 1,0 2,0 3,0 4,0 6,05,0 7,0 8,0
0 0 40 80 120 160 200
JPN
EURO
USA
200
5,0
10
15
20
25
30
5.0
10
15
20
25
30
0,5
1,0
1,5
2,0
0.5
1.0
1.5
2.0
0 0 40 80 120 160 200
0.05
0.10
0.15
0.20
500 (34.4), 1000 (68.9), 3600 (248)
500 (34.4), 1000 (68.9), 3600 (248)
500 (34.4), 1000 (68.9), 3600 (248)
34.4 (500), 68.9 (1000), 248 (3600)
34.4 (500), 68.9 (1000), 248 (3600)
34.4 (500), 68.9 (1000), 248 (3600)
3.44, 6.89, 24.8
3.44, 6.89, 24.83.44, 6.89, 24.8
Nitrogen Flow, std ft3/min
Out
let
Pre
ssur
e, p
sig
Out
let
Pre
ssur
e, b
ar
Nitrogen Flow, std L/min
0
0 0.5 1.0 1.5 2.0
0
0 10 20 30 40 50
0
0
0 0
JPN
EURO
USA
0,5 1,0 1,5 2,0
10 20 30 40 50
5.0
10
15
20
25
30
0.5
1.0
1.5
2.0
0,5
1,0
1,5
2,0
5,0
10
15
20
25
30
0 0 10 20 30 40 50
0.05
0.10
0.15
0.20
500 (34.4), 1000 (68.9), 3600 (248)
500 (34.4), 1000 (68.9), 3600 (248)
500 (34.4), 1000 (68.9), 3600 (248)
34.4 (500), 68.9 (1000), 248 (3600)
34.4 (500), 68.9 (1000), 248 (3600)
34.4 (500), 68.9 (1000), 248 (3600)
3.44, 6.89, 24.8
3.44, 6.89, 24.8
3.44, 6.89, 24.8
Nitrogen Flow, std ft3/min
Out
let
Pre
ssur
e, p
sig
Out
let
Pre
ssur
e, b
ar
Nitrogen Flow, std L/minDetail A
A

28 Pressure-Reducing Regulator Flow Curves
KCY Series Two-Stage Pressure-Reducing Regulators Gas Flow
Flow CurvesThe flow curves assume an initial set flow rate of 0.035 std ft3/min (1 std L/min) and an initial temperature of 70°F (20°C).
Pressure Control Range
0 to 100 psig (0 to 6.8 bar)
0 to 50 psig (0 to 3.4 bar)
Flow Coefficient 0.50, Pressure Control Ranges 0 to 100 psig (0 to 6.8 bar) and 0 to 50 psig (0 to 3.4 bar)
0
0 4.0 8.0 12 16 20
0
0 320 560240
0
0 4,0 8,0 12 16 20
0 0
USA
EURO
JPN
80 160 480400
320 56024080 160 480400
1814106.02.0
6,02,0 181410
25
50
75
100
25
50
75
100
1.0
2.0
3.0
7.0
6.0
5.0
4.0
1,0
2,0
3,0
7,0
6,0
5,0
4,0
0 0 320 56024080 160 480400
0.1
0.2
0.3
0.7
0.6
0.5
0.4
500 (34.4), 1000 (68.9), 3600 (248)
500 (34.4), 1000 (68.9), 3600 (248)
500 (34.4), 1000 (68.9), 3600 (248)
34.4 (500), 68.9 (1000), 248 (3600)
34.4 (500), 68.9 (1000), 248 (3600)
34.4 (500), 68.9 (1000), 248 (3600)
3.44, 6.89, 24.8
3.44, 6.89, 24.8
3.44, 6.89, 24.8
Nitrogen Flow, std ft3/min
Out
let
Pre
ssur
e, p
sig
Out
let
Pre
ssur
e, b
ar
Nitrogen Flow, std L/min
0
25
50
75
100
0 1.0 2.0 3.0 4.0 5.0
0
1.0
2.0
3.0
7.0
0 80 14060
0
0 1,0 2,0 3,0 4,0 5,0
0 0
USA
EURO
JPN
20 40 120100
80 1406020 40 120100
6.0
5.0
4.0
1,0
2,0
3,0
7,0
6,0
5,0
4,0
25
50
75
100
0 0 80 1406020 40 120100
0.1
0.2
0.3
0.7
0.6
0.5
0.4
500 (34.4), 1000 (68.9), 3600 (248)
500 (34.4), 1000 (68.9), 3600 (248)
500 (34.4), 1000 (68.9), 3600 (248)
34.4 (500), 68.9 (1000), 248 (3600)
34.4 (500), 68.9 (1000), 248 (3600)
34.4 (500), 68.9 (1000), 248 (3600)
3.44, 6.89, 24.8
3.44, 6.89, 24.8
3.44, 6.89, 24.8
Nitrogen Flow, std ft3/min
Out
let
Pre
ssur
e, p
sig
Out
let
Pre
ssur
e, b
ar
Nitrogen Flow, std L/minDetail A
A

Pressure-Reducing Regulator Flow Curves 29
KCY Series Two-Stage Pressure-Reducing Regulators Gas Flow
Flow CurvesThe flow curves assume an initial set flow rate of 0.035 std ft3/min (1 std L/min) and an initial temperature of 70°F (20°C).
Pressure Control Range
0 to 500 psig (0 to 34.4 bar)
0 to 250 psig (0 to 17.2 bar)
Flow Coefficient 0.50, Pressure Control Ranges 0 to 500 psig (0 to 34.4 bar) and 0 to 250 psig (0 to 17.2 bar)
0
100
200
300
400
500
600
0 10 20 30 5040 60
0
10
20
30
40
0 400 1200 1600800
0
100
200
300
400
500
0 10 20 30 40 6050
0
10
20
30
40
0 400 1200 1600800
0
1.0
2.0
3.0
4.0
0 400 1200 1600800
USA
JPN
EURO
600
500 (34.4), 1000 (68.9), 3600 (248)
500 (34.4), 1000 (68.9), 3600 (248)
500 (34.4), 1000 (68.9), 3600 (248)
34.4 (500), 68.9 (1000), 248 (3600)
34.4 (500), 68.9 (1000), 248 (3600)
34.4 (500), 68.9 (1000), 248 (3600)
3.44, 6.89, 24.8
3.44, 6.89, 24.8
3.44, 6.89, 24.8
Nitrogen Flow, std ft3/min
Out
let
Pre
ssur
e, p
sig
Out
let
Pre
ssur
e, b
ar
Nitrogen Flow, std L/min
0
0 2,0 4,0 6,0 8,0 10
0 0
USA
EURO
160 28012040 80 240200
100
200
300
400
500
600
10
20
30
40
JPN
0 0 160 28012040 80 240200
1.0
2.0
3.0
4.0
0
0 2.0 4.0 6.0 8.0 10
0
0 160 28012040 80 240200
100
200
300
400
500
600
10
20
30
40
500 (34.4), 1000 (68.9), 3600 (248)
500 (34.4), 1000 (68.9), 3600 (248)
500 (34.4), 1000 (68.9), 3600 (248)
34.4 (500), 68.9 (1000), 248 (3600)
34.4 (500), 68.9 (1000), 248 (3600)
34.4 (500), 68.9 (1000), 248 (3600)
3.44, 6.89, 24.8
3.44, 6.89, 24.8
3.44, 6.89, 24.8
Nitrogen Flow, std ft3/min
Out
let
Pre
ssur
e, p
sig
Out
let
Pre
ssur
e, b
ar
Nitrogen Flow, std L/minDetail A
A
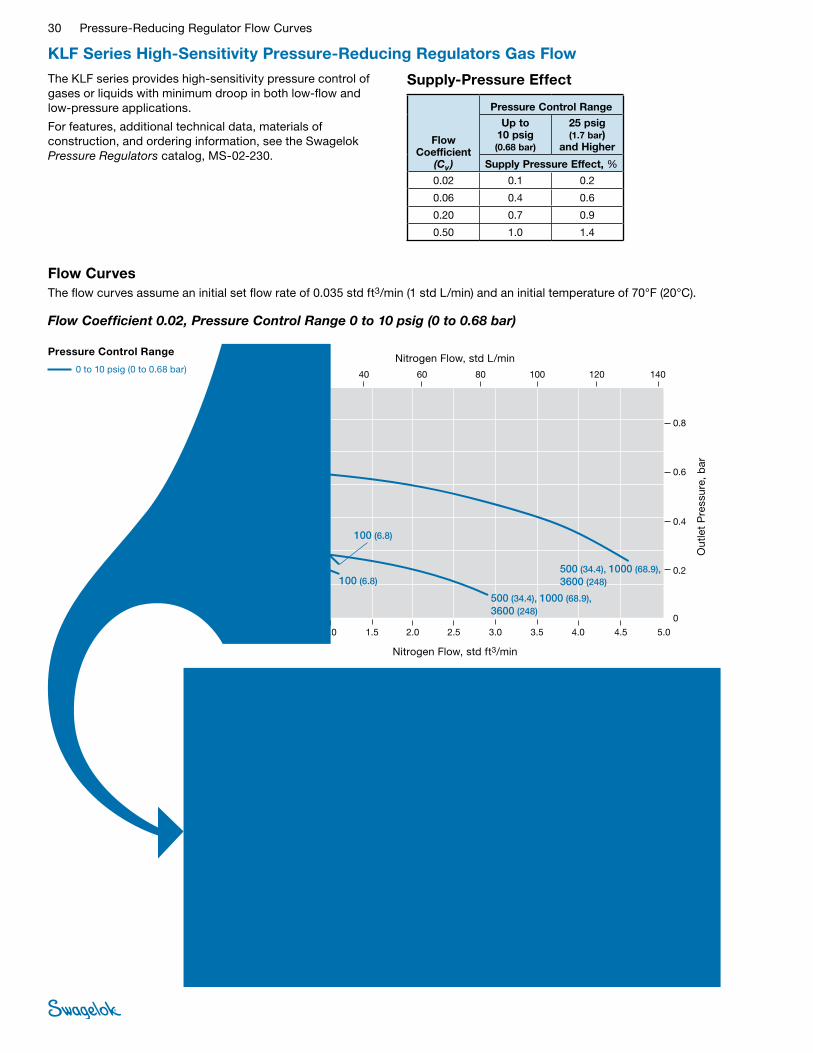
30 Pressure-Reducing Regulator Flow Curves
KLF Series High-Sensitivity Pressure-Reducing Regulators Gas Flow
Flow CurvesThe flow curves assume an initial set flow rate of 0.035 std ft3/min (1 std L/min) and an initial temperature of 70°F (20°C).
The KLF series provides high-sensitivity pressure control of gases or liquids with minimum droop in both low-flow and low-pressure applications.
For features, additional technical data, materials of construction, and ordering information, see the Swagelok Pressure Regulators catalog, MS-02-230.
Pressure Control Range
0 to 10 psig (0 to 0.68 bar)
Flow Coefficient 0.02, Pressure Control Range 0 to 10 psig (0 to 0.68 bar)
0
2.0
4.0
6.0
8.0
10
14
0 1.0 2.0 3.0 4.0 5.0
0
0.2
0.4
0.6
0.8
0 80 14060
0
0 1,0 2,0 3,0 4,0 5,0
0
0,2
0
USA
EURO
JPN
20 40 120100
80 1406020 40 120100
4.53.52.51.50.5
1,50,5 4,53,52,5
12
0,4
0,6
0,8
2,0
4,0
6,0
8,0
10
14
12
0
0.02
0 80 1406020 40 120100
0.04
0.06
0.08
50 (3.4)
50 (3.4)
100 (6.8)
100 (6.8)
500 (34.4), 1000 (68.9),3600 (248)
500 (34.4), 1000 (68.9),3600 (248)
3.4 (50)
3.4 (50) 6.8 (100)
6.8 (100)
34.4 (500), 68.9 (1000),248 (3600)
34.4 (500), 68.9 (1000),248 (3600)
0.34
0.340.68
0.68
3.44, 6.89, 24.8
3.44, 6.89, 24.8
Nitrogen Flow, std ft3/min
Out
let
Pre
ssur
e, p
sig
Out
let
Pre
ssur
e, b
ar
Nitrogen Flow, std L/min
0
4.0
6.0
8.0
10
14
0 0.2 0.4 0.6 0.8 1.0
0
0.2
0.4
0.6
0.8
0 16 2812
0
0 0,2 0,4 0,6 0,8 1,0
0
0,2
0
USA
EURO
JPN
4.0 8.0 2420
16 28124,0 8,0 2420
0.90.70.50.30.1
0,30,1 0,90,70,5
12
0,4
0,6
0,8
4,0
14
0
0.02
0 16 28124.0 8.0 2420
0.04
0.06
0.08
2,0
6,0
8,0
10
12
2.0
50 (3.4)
50 (3.4)
500 (34.4), 1000 (68.9),3600 (248)
500 (34.4), 1000 (68.9),3600 (248)
100 (6.8)
100 (6.8)
34.4 (500), 68.9 (1000),248 (3600)
3.4 (50)
3.4 (50)
6.8 (100)
6.8 (100)34.4 (500), 68.9 (1000),248 (3600)
3.44, 6.89, 24.8
0.68
0.683.44, 6.89, 24.8
0.34
0.34
Nitrogen Flow, std ft3/min
Out
let
Pre
ssur
e, p
sig
Out
let
Pre
ssur
e, b
ar
Nitrogen Flow, std L/min
Supply-Pressure Effect
Flow Coefficient
(Cv )
Pressure Control Range
Up to 10 psig (0.68 bar)
25 psig (1.7 bar)
and Higher
Supply Pressure Effect, %
0.02 0.1 0.2
0.06 0.4 0.6
0.20 0.7 0.9
0.50 1.0 1.4
Detail A
A

Pressure-Reducing Regulator Flow Curves 31
Flow CurvesThe flow curves assume an initial set flow rate of 0.035 std ft3/min (1 std L/min) and an initial temperature of 70°F (20°C).
Pressure Control Range
0 to 50 psig (0 to 3.4 bar)
0 to 25 psig (0 to 1.7 bar)
Flow Coefficient 0.02, Pressure Control Range 0 to 50 psig (0 to 3.4 bar) and 0 to 25 psig (0 to 1.7 bar)
0
0 2.0 4.0 6.0 108.0 14
0
0 80 240 320160
0
0 0
JPN
EURO
12
2,0 4,0 6,0 108,0 1412
80 240 3201600
10
20
30
40
50
60
1.0
2.0
3.0
4.0
1,0
2,0
3,0
4,0
USA
10
20
30
40
50
60
0 0 80 240 320160
0.1
0.2
0.3
0.4
100 (6.8)
500 (34.4) 1000 (68.9)
3600 (248)
50 (3.4), 100 (6.8)
50 (3.4), 100 (6.8) 500 (34.4), 1000 (68.9), 3600 (248)
1000 (68.9), 3600 (248)500 (34.4)
6.8 (100)34.4 (500)
68.9 (1000)
248 (3600)
3.4 (50), 6.8 (100)
3.4 (50), 6.8 (100) 34.4 (500), 68.9 (1000), 248 (3600)
34.4 (500) 68.9 (1000), 248 (3600)
0.683.44 6.89
24.8
0.34, 0.68
0.34, 0.68 3.44, 6.89, 24.8
3.44 6.89, 24.8
Nitrogen Flow, std ft3/min
Out
let
Pre
ssur
e, p
sig
Out
let
Pre
ssur
e, b
ar
Nitrogen Flow, std L/min
0
0 1.0 2.0 3.0 4.0 5.0
0
0 80 14060
0
0 1,0 2,0 3,0 4,0 5,0
0 0
USA
EURO
JPN
20 40 120100
80 1406020 40 120100
10
20
30
40
50
60
1,0
2,0
3,0
4,0
10
20
30
40
50
60
1.0
2.0
3.0
4.0
0 0 80 1406020 40 120100
0.1
0.2
0.3
0.4
100 (6.8)
50 (3.4), 100 (6.8)
50 (3.4), 100 (6.8)
1000 (68.9), 3600 (248)
1000 (68.9), 3600 (248)
500 (34.4)
500 (34.4)
500 (34.4), 1000 (68.9),3600 (248)
6.8 (100)34.4 (500)
68.9 (1000), 248 (3600)
34.4 (500)
68.9 (1000), 248 (3600)
34.4 (500), 68.9 (1000),248 (3600)
3.4 (50), 6.8 (100)
3.4 (50), 6.8 (100)
0.683.44
6.89, 24.8
6.89, 24.8
3.44
3.44, 6.89, 24.8
0.34, 0.68
0.34, 0.68
Nitrogen Flow, std ft3/min
Out
let
Pre
ssur
e, p
sig
Out
let
Pre
ssur
e, b
ar
Nitrogen Flow, std L/min
KLF Series High-Sensitivity Pressure-Reducing Regulators Gas Flow
Detail A
A

32 Pressure-Reducing Regulator Flow Curves
Flow CurvesThe flow curves assume an initial set flow rate of 0.035 std ft3/min (1 std L/min) and an initial temperature of 70°F (20°C).
Pressure Control Range
0 to 100 psig (0 to 6.8 bar)
Flow Coefficient 0.02, Pressure Control Range 0 to 100 psig (0 to 6.8 bar)
0
0 4.0 8.0 12 16 20
0
0 320 560240
0
0 4,0 8,0 12 16 20
0 0
USA
EURO
JPN
80 160 480400
320 56024080 160 480400
1814106.02.0
6,02,0 181410
20
40
60
80
100
120
20
40
60
80
100
120
2.0
4.0
6.0
8.0
2,0
4,0
6,0
8,0
0 0 320 56024080 160 480400
0.2
0.4
0.6
0.8
500 (34.4) 1000 (68.9)
3600 (248)
3600 (248)1000 (68.9),3600 (248)
1000 (68.9)500 (34.4)
500 (34.4)
100 (6.8)
50 (3.4), 100 (6.8)
34.4 (500)
34.4 (500)
34.4 (500)
68.9 (1000),
68.9 (1000),
68.9 (1000),248 (3600)
248 (3600)
248 (3600)
6.8 (100)
3.4 (50), 6.8 (100)
6.89
6.89
3.44
3.44
3.44
0.68
0.34, 0.68 6.89, 24.8
24.8
24.8
Nitrogen Flow, std ft3/min
Out
let
Pre
ssur
e, p
sig
Out
let
Pre
ssur
e, b
ar
Nitrogen Flow, std L/min
0
0 1.0 2.0 3.0 4.0 5.0
0
0 80 14060
0
0 1,0 2,0 3,0 4,0 5,0
0 0
USA
EURO
JPN
20 40 120100
80 1406020 40 120100
20
40
60
80
100
120
20
40
60
80
100
120
2.0
4.0
6.0
8.0
2,0
4,0
6,0
8,0
0 0 80 1406020 40 120100
0.2
0.4
0.6
0.8
1000 (68.9), 3600 (248)
1000 (68.9), 3600 (248)
1000 (68.9), 3600 (248)
500 (34.4)
500 (34.4)
500 (34.4)
100 (6.8)
50 (3.4), 100 (6.8)
68.9 (1000), 248 (3600)
68.9 (1000), 248 (3600)
68.9 (1000), 248 (3600)
34.4 (500)
34.4 (500)
34.4 (500)
6.8 (100)
3.4 (50), 6.8 (100)
6.89, 24.8
6.89, 24.8
6.89, 24.8
3.44
3.44
3.44
0.68
0.34, 0.68
Nitrogen Flow, std ft3/min
Out
let
Pre
ssur
e, p
sig
Out
let
Pre
ssur
e, b
ar
Nitrogen Flow, std L/min
KLF Series High-Sensitivity Pressure-Reducing Regulators Gas Flow
Detail A
A
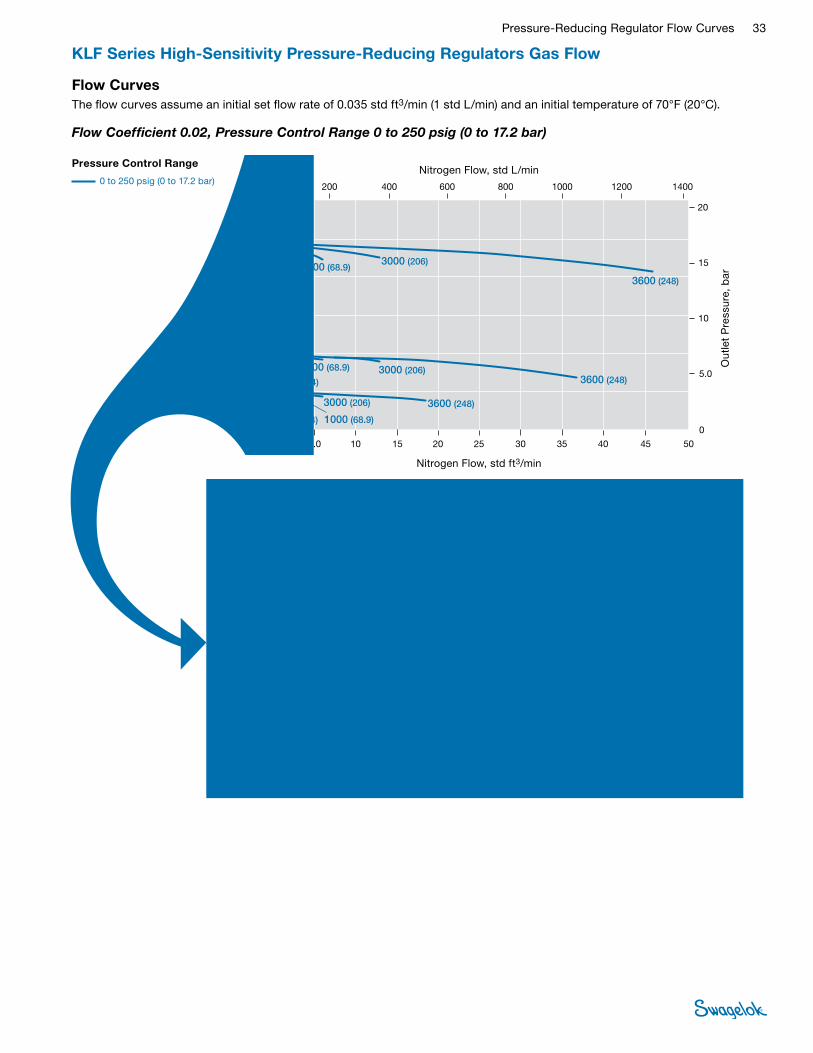
Pressure-Reducing Regulator Flow Curves 33
Flow CurvesThe flow curves assume an initial set flow rate of 0.035 std ft3/min (1 std L/min) and an initial temperature of 70°F (20°C).
Pressure Control Range
0 to 250 psig (0 to 17.2 bar)
Flow Coefficient 0.02, Pressure Control Range 0 to 250 psig (0 to 17.2 bar)
0
0 10 20 30 40 50
0
0 800 1400600
0
0 10 20 30 40 50
0 0
USA
EURO
JPN
200 400 12001000
800 1400600200 400 12001000
453525155.0
155,0 453525
50
100
150
200
250
300
50
100
150
200
250
300
5,0
10
15
20
5.0
10
15
20
0 0 800 1400600200 400 12001000
0.5
1.0
1.5
2.0
1000 (68.9)
500 (34.4)
500 (34.4)
1000 (68.9)
1000 (68.9)
3000 (206)
3000 (206)
3000 (206) 3600 (248)
3600 (248)
3600 (248)
68.9 (1000)
34.4 (500)
34.4 (500)
68.9 (1000)
68.9 (1000)
206 (3000)
206 (3000)
206 (3000)
248 (3600)
248 (3600)
248 (3600)
6.89
3.44
3.44
6.89
6.89
20.6
20.6
20.6 24.8
24.8
24.8
Nitrogen Flow, std ft3/min
Out
let
Pre
ssur
e, p
sig
Out
let
Pre
ssur
e, b
ar
Nitrogen Flow, std L/min
0
0 1.0 2.0 3.0 4.0 5.0
0
0 80 14060
0
0 1,0 2,0 3,0 4,0 5,0
0 0
USA
EURO
JPN
20 40 120100
80 1406020 40 120100
50
100
150
200
250
300
50
100
150
200
250
300
5,0
10
15
20
5.0
10
15
20
0 0 80 1406020 40 120100
0.5
1.0
1.5
2.0
1000 (68.9), 3000 (206), 3600 (248)
1000 (68.9), 3000 (206), 3600 (248)
3000 (206), 3600 (248)1000 (68.9)
500 (34.4)
500 (34.4)
68.9 (1000), 206 (3000), 248 (3600)
68.9 (1000), 206 (3000), 248 (3600)
206 (3000), 248 (3600)68.9 (1000)
34.4 (500)
34.4 (500)
6.89, 20.6, 24.8
6.89, 20.6, 24.8
20.6, 24.86.89
3.44
3.44
Nitrogen Flow, std ft3/min
Out
let
Pre
ssur
e, p
sig
Out
let
Pre
ssur
e, b
ar
Nitrogen Flow, std L/min
KLF Series High-Sensitivity Pressure-Reducing Regulators Gas Flow
Detail A
A

34 Pressure-Reducing Regulator Flow Curves
Flow CurvesThe flow curves assume an initial set flow rate of 0.035 std ft3/min (1 std L/min) and an initial temperature of 70°F (20°C).
Pressure Control Range
0 to 10 psig (0 to 0.68 bar)
Flow Coefficient 0.06, Pressure Control Range 0 to 10 psig (0 to 0.68 bar)
0
2.0
4.0
6.0
8.0
10
12
0 1.0 2.0 3.0 4.0 5.0
0
0.2
0.4
0.6
0.6
0 80 14060
0
2,0
4,0
6,0
8,0
10
0 1,0 2,0 3,0 4,0 5,0
0
0,2
0,4
0,6
0,8
0
USA
EURO
JPN
20 40 120100
80 1406020 40 120100
0
0.02
0.04
0.06
0.08
0 80 1406020 40 120100
12
50 (3.4)
50 (3.4) 100 (6.8), 3600 (248)
500 (34.4), 1000 (68.9)
100 (6.8), 3600 (248)
500 (34.4), 1000 (68.9)
3.4 (50)
3.4 (50) 6.8 (100),248 (3600)
6.8 (100), 248 (3600)
34.4 (500),68.9 (1000)
34.4 (500), 68.9 (1000)
0.34
0.340.68,24.8
0.68, 24.8
3.44, 6.89
3.44, 6.89
Nitrogen Flow, std ft3/min
Out
let
Pre
ssur
e, p
sig
Out
let
Pre
ssur
e, b
ar
Nitrogen Flow, std L/min
0
0 0.2 0.4 0.6 0.8 1.0
0
0 16 2812
0
0 0,2 0,4 0,6 0,8 1,0
0 0
USA
EURO
JPN
4.0 8.0 2420
16 28124,0 8,0 2420
2,0
4,0
6,0
8,0
10
12
2.0
4.0
6.0
8.0
10
12
0.2
0.4
0.6
0.8
0,2
0,4
0,6
0,8
0 0 16 28124.0 8.0 2420
0.02
0.04
0.06
0.08
500 (34.4), 1000 (68.9)
50 (3.4), 100 (6.8)
50 (3.4), 100 (6.8), 3600 (248)
500 (34.4), 1000 (68.9)
34.4 (500), 68.9 (1000)
3.4 (50), 6.8 (100), 248 (3600)
34.4 (500), 68.9 (1000)
3.4 (50), 6.8 (100), 248 (3600)
3.44, 6.89
0.34, 0.68, 24.8
0.34, 0.68, 24.8
3.44, 6.89
Nitrogen Flow, std ft3/min
Out
let
Pre
ssur
e, p
sig
Out
let
Pre
ssur
e, b
ar
Nitrogen Flow, std L/min
KLF Series High-Sensitivity Pressure-Reducing Regulators Gas Flow
Detail A
A

Pressure-Reducing Regulator Flow Curves 35
Flow CurvesThe flow curves assume an initial set flow rate of 0.035 std ft3/min (1 std L/min) and an initial temperature of 70°F (20°C).
Pressure Control Range
0 to 50 psig (0 to 3.4 bar)
0 to 25 psig (0 to 1.7 bar)
Flow Coefficient 0.06, Pressure Control Ranges 0 to 50 psig (0 to 3.4 bar) and 0 to 25 psig (0 to 1.7 bar)
0
0 2.0 4.0 6.0 108.0 14
0
0 80 240 320160
0
0 0
JPN
EURO
12
2,0 4,0 6,0 108,0 1412
80 240 3201600
10
20
30
40
50
60
1.0
2.0
3.0
4.0
1,0
2,0
3,0
4,0
USA
10
20
30
40
50
60
0 0 80 240 320160
0.1
0.2
0.3
0.4
100 (6.8)
100 (6.8)50 (3.4)
50 (3.4) 100 (6.8)500 (34.4), 1000 (68.9), 3600 (248)
500 (34.4), 1000 (68.9), 3600 (248)
500 (34.4), 1000 (68.9), 3600 (248)
3.4 (50) 6.8 (100)34.4 (500), 68.9 (1000), 248 (3600)
34.4 (500), 68.9 (1000),248 (3600)
34.4 (500), 68.9 (1000),248 (3600)
6.8 (100)
6.8 (100)3.4 (50)
0.68
0.680.34
0.34 0.683.44, 6.89, 24.8
3.44, 6.89, 24.8
3.44, 6.89, 24.8
Nitrogen Flow, std ft3/min
Out
let
Pre
ssur
e, p
sig
Out
let
Pre
ssur
e, b
ar
Nitrogen Flow, std L/min
0
0 1.0 2.0 3.0 4.0 5.0
0
0 80 14060
0
0 1,0 2,0 3,0 4,0 5,0
0 0
USA
EURO
JPN
20 40 120100
80 1406020 40 120100
10
20
30
40
50
60
1,0
2,0
3,0
4,0
10
20
30
40
50
60
1.0
2.0
3.0
4.0
0 0 80 1406020 40 120100
0.1
0.2
0.3
0.4
500 (34.4), 1000 (68.9),3600 (248)
500 (34.4), 1000 (68.9),3600 (248)
100 (6.8)
100 (6.8)50 (34.4)
50 (34.4) 100 (6.8)500 (34.4), 1000 (68.9),3600 (248)
34.4 (500), 68.9 (1000),248 (3600)
34.4 (500), 68.9 (1000),248 (3600)
34.4 (500), 68.9 (1000),248 (3600)
6.8 (100)
6.8 (100)
6.8 (100)
3.4 (50)
3.4 (50)
0.34
0.34
0.68
0.68
0.68
3.44, 6.89, 24.8
3.44, 6.89, 24.8
3.44, 6.89, 24.8
Nitrogen Flow, std ft3/min
Out
let
Pre
ssur
e, p
sig
Out
let
Pre
ssur
e, b
ar
Nitrogen Flow, std L/min
KLF Series High-Sensitivity Pressure-Reducing Regulators Gas Flow
Detail A
A

36 Pressure-Reducing Regulator Flow Curves
Flow CurvesThe flow curves assume an initial set flow rate of 0.035 std ft3/min (1 std L/min) and an initial temperature of 70°F (20°C).
Pressure Control Range
0 to 100 psig (0 to 6.8 bar)
Flow Coefficient 0.06, Pressure Control Range 0 to 100 psig (0 to 6.8 bar)
0
0 5.0 10 15 20
0
0 100 300 400200
0
0 5,0 10 15 20
0 0 100 200 300 400 500
JPN
EURO
USA
500
20
40
60
80
100
120
20
40
60
80
100
120
2,0
4,0
6,0
8,0
2.0
4.0
6.0
8.0
0 0 100 200 300 400 500
0.2
0.4
0.6
0.8
500 (34.4)
100 (6.8)
100 (6.8)50 (3.4) 500 (34.4), 1000 (68.9), 3600 (248)
500 (34.4), 1000 (68.9),3600 (248)
1000 (68.9),3600 (248)
34.4 (500), 68.9 (1000),248 (3600)
68.9 (1000),248 (3600)
34.4 (500)
34.4 (500), 68.9 (1000), 248 (3600)
6.8 (100)
6.8 (100)3.4 (50)
3.44, 6.89, 24.8
3.44, 6.89, 24.8
0.68
0.680.34
3.44
6.89, 24.8
Nitrogen Flow, std ft3/min
Out
let
Pre
ssur
e, p
sig
Out
let
Pre
ssur
e, b
ar
Nitrogen Flow, std L/min
0
0 1.0 2.0 3.0 4.0 5.0
0
0 80 14060
0
0 1,0 2,0 3,0 4,0 5,0
0 0
USA
EURO
JPN
20 40 120100
80 1406020 40 120100
20
40
60
80
100
120
2,0
4,0
6,0
8,0
20
40
60
80
100
120
2.0
4.0
6.0
8.0
0 0 80 1406020 40 120100
0.2
0.4
0.6
0.8
50 (3.4)
100 (6.8)
100 (6.8)
500 (34.4), 1000 (68.9),3600 (248)
500 (34.4), 1000 (68.9),3600 (248)
500 (34.4), 1000 (68.9),3600 (248)
3.4 (50)
6.8 (100)
6.8 (100)
34.4 (500), 68.9 (1000),248 (3600)
34.4 (500), 68.9 (1000),248 (3600)
34.4 (500), 68.9 (1000),248 (3600)
0.34
0.68
0.68
3.44, 6.89, 24.8
3.44, 6.89, 24.8
3.44, 6.89, 24.8
Nitrogen Flow, std ft3/min
Out
let
Pre
ssur
e, p
sig
Out
let
Pre
ssur
e, b
ar
Nitrogen Flow, std L/min
KLF Series High-Sensitivity Pressure-Reducing Regulators Gas Flow
Detail A
A

Pressure-Reducing Regulator Flow Curves 37
Flow CurvesThe flow curves assume an initial set flow rate of 0.035 std ft3/min (1 std L/min) and an initial temperature of 70°F (20°C).
Pressure Control Range
0 to 250 psig (0 to 17.2 bar)
Flow Coefficient 0.06, Pressure Control Range 0 to 250 psig (0 to 17.2 bar)
0
50
100
150
200
250
300
0 10 20 30 5040 60
0
5.0
10
15
20
0 400 1200 1600800
0
50
100
150
200
250
0 10 20 30 40 6050
0
5,0
10
15
20
0 400 1200 1600800
USA
JPN
EURO
300
0
0.5
1.0
1.5
2.0
0 400 1200 1600800
3600 (248)
1000 (68.9)500 (34.4)
500 (34.4)100 (6.8) 1000 (68.9), 3600 (248)
1000 (68.9), 3600 (248)
500 (34.4)
248 (3600)
68.9 (1000),34.4 (500)
34.4 (500)
34.4 (500)6.8 (100) 68.9 (1000), 248 (3600)
68.9 (1000), 248 (3600)
24.86.893.44
3.44
3.44
6.89, 24.8
6.89, 24.80.68
Nitrogen Flow, std ft3/min
Out
let
Pre
ssur
e, p
sig
Out
let
Pre
ssur
e, b
ar
Nitrogen Flow, std L/min
0
0 2.0 4.0 6.0 8.0 10
0
0 160 280120
0
0 2,0 4,0 6,0 8,0 10
0 0
USA
EURO
JPN
40 80 240200
160 28012040 80 240200
50
100
150
200
250
300
50
100
150
200
250
300
5,0
10
15
20
5.0
10
15
20
0 0 160 28012040 80 240200
0.5
1.0
1.5
2.0
1000 (68.9), 3600 (248)
500 (34.4)
1000 (68.9), 3600 (248)
500 (34.4), 1000 (68.9),3600 (248)
100 (6.8)
34.4 (500), 68.9 (1000),248 (3600)
68.9 (1000), 248 (3600)
68.9 (1000), 248 (3600)
34.4 (500)
6.8 (100)
3.44, 6.89, 24.8
6.89, 24.8
6.89, 24.8
3.44
0.68
Nitrogen Flow, std ft3/min
Out
let
Pre
ssur
e, p
sig
Out
let
Pre
ssur
e, b
ar
Nitrogen Flow, std L/min
KLF Series High-Sensitivity Pressure-Reducing Regulators Gas Flow
Detail A
A

38 Pressure-Reducing Regulator Flow Curves
Flow CurvesThe flow curves assume an initial set flow rate of 0.035 std ft3/min (1 std L/min) and an initial temperature of 70°F (20°C).
Pressure Control Range
0 to 10 psig (0 to 0.68 bar)
Flow Coefficient 0.20, Pressure Control Range 0 to 10 psig (0 to 0.68 bar)
0
2.0
4.0
6.0
8.0
10
12
0 1.0 2.0 3.0 4.0 5.0
0
0.2
0.4
0.6
0.6
0 80 14060
0
2,0
4,0
6,0
8,0
10
0 1,0 2,0 3,0 4,0 5,0
0
0,2
0,4
0,6
0,8
0
USA
EURO
JPN
20 40 120100
80 1406020 40 120100
0
0.02
0.04
0.06
0.08
0 80 1406020 40 120100
12
50 (3.4)
50 (3.4)
500 (34.4),1000 (68.9)
100 (6.8),3600 (248)
100 (6.8),500 (34.4), 1000 (68.9),3600 (248)
34.4 (500),68.9 (1000)
6.8 (100),248 (3600)3.4 (50)
3.4 (50)
6.8 (100), 34.4 (500), 68.9 (1000),248 (3600)
0.34
0.343.44, 6.890.68,
24.80.68, 3.44, 6.89, 24.8
Nitrogen Flow, std ft3/min
Out
let
Pre
ssur
e, p
sig
Out
let
Pre
ssur
e, b
ar
Nitrogen Flow, std L/min
0
0 0.5 1.0 1.5 2.0
0
0 10 30 4020
0
0 0,5 1,0 1,5 2,0
0 0 10 20 30 40 50
JPN
EURO
USA
50
2,0
4,0
6,0
8,0
10
12
2.0
4.0
6.0
8.0
10
12
0,2
0,4
0,6
0,8
0.2
0.4
0.6
0.8
0 0 10 20 30 40 50
0.02
0.04
0.06
0.08
50 (3.4)
50 (3.4), 100 (6.8),3600 (248)
500 (34.4), 1000 (68.9)
100 (6.8), 500 (34.4), 1000 (68.9), 3600 (248)
3.4 (50)
3.4 (50), 6.8 (100),248 (3600)
34.4 (500), 68.9 (1000)
6.8 (100), 34.4 (500), 68.9 (1000), 248 (3600)
0.34
3.44, 6.89
0.34, 0.68, 24.8
0.68, 3.44, 6.89, 24.8
Nitrogen Flow, std ft3/min
Out
let
Pre
ssur
e, p
sig
Out
let
Pre
ssur
e, b
ar
Nitrogen Flow, std L/min
KLF Series High-Sensitivity Pressure-Reducing Regulators Gas Flow
Detail A
A

Pressure-Reducing Regulator Flow Curves 39
Flow CurvesThe flow curves assume an initial set flow rate of 0.035 std ft3/min (1 std L/min) and an initial temperature of 70°F (20°C).
Flow Coefficient 0.20, Pressure Control Ranges 0 to 50 psig (0 to 3.4 bar) and 0 to 25 psig (0 to 1.7 bar)
0
0 2.0 4.0 6.0 108.0 14
0
0 80 240 320160
0
0 0
JPN
EURO
12
2,0 4,0 6,0 108,0 1412
80 240 3201600
10
20
30
40
50
60
1.0
2.0
3.0
4.0
1,0
2,0
3,0
4,0
USA
10
20
30
40
50
60
0 0 80 240 320160
0.1
0.2
0.3
0.4
100 (6.8)
500 (34.4), 1000 (68.9),3600 (248)
100 (6.8)
500 (34.4), 1000 (68.9),3600 (248)
500 (34.4), 1000 (68.9),3600 (248)
50 (3.4)
100 (6.8)50 (3.4)
34.4 (500), 68.9 (1000),248 (3600)
34.4 (500), 68.9 (1000),248 (3600)
6.8 (100)
6.8 (100)
6.8 (100)
34.4 (500), 68.9 (1000),248 (3600)
3.4 (50)
3.4 (50)
3.44, 6.89, 24.8
3.44, 6.89, 24.8
3.44, 6.89, 24.8
0.68
0.68
0.34
0.34
0.68
Nitrogen Flow, std ft3/min
Out
let
Pre
ssur
e, p
sig
Out
let
Pre
ssur
e, b
ar
Nitrogen Flow, std L/min
0
0 0.5 1.0 1.5 2.0
0 10 20 30 40 50
0
0
0 0
JPN
EURO
USA
0,5 1,0 1,5 2,0
10 20 30 40 50
10
20
30
40
50
60
1.0
2.0
3.0
4.0
1,0
2,0
3,0
4,0
10
20
30
40
50
60
0 0 10 20 30 40 50
0.1
0.2
0.3
0.4
0
50 (3.4)
50 (3.4)
100 (6.8), 500 (34.4), 1000 (68.9), 3600 (248)
100 (6.8), 500 (34.4), 1000 (68.9), 3600 (248)
100 (6.8), 500 (34.4), 1000 (68.9), 3600 (248)
6.8 (100), 34.4 (500), 68.9 (1000), 248 (3600)
3.4 (50)
3.4 (50)
6.8 (100), 34.4 (500), 68.9 (1000), 248 (3600)
6.8 (100), 34.4 (500), 68.9 (1000), 248 (3600)
0.34
0.34
0.68, 3.44, 6.89, 24.8
0.68, 3.44, 6.89, 24.8
0.68, 3.44, 6.89, 24.8
Nitrogen Flow, std ft3/min
Out
let
Pre
ssur
e, p
sig
Out
let
Pre
ssur
e, b
ar
Nitrogen Flow, std L/min
KLF Series High-Sensitivity Pressure-Reducing Regulators Gas Flow
Pressure Control Range
0 to 50 psig (0 to 3.4 bar)
0 to 25 psig (0 to 1.7 bar)
Detail A
A

40 Pressure-Reducing Regulator Flow Curves
Flow CurvesThe flow curves assume an initial set flow rate of 0.035 std ft3/min (1 std L/min) and an initial temperature of 70°F (20°C).
Pressure Control Range
0 to 100 psig (0 to 6.8 bar)
Flow Coefficient 0.20, Pressure Control Range 0 to 100 psig (0 to 6.8 bar)
0
0 5.0 10 15 20 3025 35 40
0
0 200 600 800400
0
0 5.0 10 15 20 3025 35 40
0 0 200 400 600 800 1000
JPN
EURO
USA
1000
20
40
60
80
100
120
20
40
60
80
100
120
2,0
4,0
6,0
8,0
2.0
4.0
6.0
8.0
0 0 200 400 600 800 1000
0.2
0.4
0.6
0.8
50 (3.4)
50 (3.4)
100 (6.8)
100 (6.8)
100 (6.8)
500 (34.4), 1000 (68.9),3600 (248)
500 (34.4), 1000 (68.9),3600 (248)
500 (34.4)
1000 (68.9),3600 (248)
3.4 (50)
3.4 (50)
6.8 (100)
6.8 (100)
6.8 (100)
34.4 (500), 68.9 (1000),248 (3600)
34.4 (500), 68.9 (1000),248 (3600)
68.9 (1000),248 (3600)
34.4 (500)
0.34
0.34
0.68
0.68
0.68 3.44, 6.89, 24.8
3.44, 6.89, 24.8
6.89, 24.8
3.44
Nitrogen Flow, std ft3/min
Out
let
Pre
ssur
e, p
sig
Out
let
Pre
ssur
e, b
ar
Nitrogen Flow, std L/min
0
0 2.0 4.0 6.0 8.0 10
0
0 160 280120
0
0 2,0 4,0 6,0 8,0 10
0 0
USA
EURO
JPN
40 80 240200
160 28012040 80 240200
20
40
60
80
100
120
20
40
60
80
100
120
2.0
4.0
6.0
8.0
2,0
4,0
6,0
8,0
0 0 160 28012040 80 240200
0.2
0.4
0.6
0.8
500 (34.4), 1000 (68.9),3600 (248)
100 (6.8)500 (34.4), 1000 (68.9),3600 (248)
100 (6.8)50 (3.4)
50 (3.4)100 (6.8)
3.4 (50)
3.4 (50)6.8 (100)
6.8 (100)
6.8 (100)
34.4 (500), 68.9 (1000),248 (3600)
34.4 (500), 68.9 (1000),248 (3600)
3.44, 6.89, 24.8
3.44, 6.89, 24.8
0.34
0.340.68
0.68
0.68
Nitrogen Flow, std ft3/min
Out
let
Pre
ssur
e, p
sig
Out
let
Pre
ssur
e, b
ar
Nitrogen Flow, std L/min
KLF Series High-Sensitivity Pressure-Reducing Regulators Gas Flow
Detail A
A

Pressure-Reducing Regulator Flow Curves 41
Flow CurvesThe flow curves assume an initial set flow rate of 0.035 std ft3/min (1 std L/min) and an initial temperature of 70°F (20°C).
Pressure Control Range
0 to 250 psig (0 to 17.2 bar)
Flow Coefficient 0.20, Pressure Control Range Pressure Control Range 0 to 250 psig (0 to 17.2 bar)
0
0 20 40 60 80 100
0
0 1600 28001200
0
0 20 40 60 80 100
0 0
USA
EURO
JPN
400 800 24002000
1600 28001200400 800 24002000
50
100
150
200
250
300
50
100
150
200
250
300
5,0
10
15
20
5.0
10
15
20
0 0 1600 28001200400 800 24002000
0.5
1.0
1.5
2.0
100 (6.8)
100 (6.8) 500 (34.4)1000 (68.9), 3600 (248)
500 (34.4), 1000 (68.9), 3600 (248)
500 (34.4)
1000 (68.9)
3600 (248)
6.8 (100)
6.8 (100) 34.4 (500)68.9 (1000), 248 (3600)
34.4 (500), 68.9 (1000), 248 (3600)
34.4 (500)
68.9 (1000)
248 (3600)
3.44
6.89
24.8
3.44, 6.89, 24.86.89, 24.8
0.68
0.68 3.44
Nitrogen Flow, std ft3/min
Out
let
Pre
ssur
e, p
sig
Out
let
Pre
ssur
e, b
ar
Nitrogen Flow, std L/min
0
0 5.0 10 15 20
0
0 100 200 300 400 500
0
0
0 0
JPN
EURO
USA
5,0 10 15 20
100 200 300 400 500
50
100
150
200
250
300
5.0
10
15
20
5,0
10
15
20
50
100
150
200
250
300
0 0 100 200 300 400 500
0.5
1.0
1.5
2.0
6.8 (100)
3.440.68
1000 (68.9), 3600 (248)
500 (34.4), 1000 (68.9),3600 (248)
500 (34.4)
500 (34.4)
100 (6.8)
100 (6.8) 1000 (68.9), 3600 (248)
68.9 (1000), 248 (3600)
68.9 (1000), 248 (3600)
34.4 (500), 68.9 (1000),248 (3600)
34.4 (500)
34.4 (500)
6.8 (100)
6.89, 24.8
3.44, 6.89, 24.8
6.89, 24.8
3.44
0.68
Nitrogen Flow, std ft3/min
Out
let
Pre
ssur
e, p
sig
Out
let
Pre
ssur
e, b
ar
Nitrogen Flow, std L/min
KLF Series High-Sensitivity Pressure-Reducing Regulators Gas Flow
Detail A
A

42 Pressure-Reducing Regulator Flow Curves
Flow CurvesThe flow curves assume an initial set flow rate of 0.035 std ft3/min (1 std L/min) and an initial temperature of 70°F (20°C).
Pressure Control Range
0 to 10 psig (0 to 0.68 bar)
Flow Coefficient 0.50, Pressure Control Range 0 to 10 psig (0 to 0.68 bar)
0
2.0
4.0
6.0
8.0
10
12
0 1.0 2.0 3.0 5.04.0 6.0
0
0.2
0.4
0.6
0.8
0 40 120 16080
0
2,0
4,0
6,0
8,0
10
0 1,0 2,0 3,0 4,0 6,05,0
0
0,2
0,4
0,6
0,8
0 40 120 16080
USA
JPN
EURO
12
0
0.02
0.04
0.06
0.08
0 40 120 16080
50 (3.4)
50 (3.4), 100 (6.8)
500 (34.4)
500 (34.4)
1000 (68.9),3600 (248)100 (6.8), 1000 (68.9),
3600 (248)
3.4 (50)
3.4 (50), 6.8 (100)
68.9 (1000),248 (3600)
34.4 (500)
34.4 (500)
6.8 (100), 68.9 (1000),248 (3600
0.34
0.34, 0.68
6.89, 24.8
3.44
0.68, 6.89, 24.8
3.44
Nitrogen Flow, std ft3/min
Out
let
Pre
ssur
e, p
sig
Out
let
Pre
ssur
e, b
ar
Nitrogen Flow, std L/min
0
0 0.5 1.0 1.5 2.0
0
0 10 30 4020
0
0 0,5 1,0 1,5 2,0
0 0 10 20 30 40 50
JPN
EURO
USA
50
2,0
4,0
6,0
8,0
10
12
2.0
4.0
6.0
8.0
10
12
0,2
0,4
0,6
0,8
0.2
0.4
0.6
0.8
0 0 10 20 30 40 50
0.02
0.04
0.06
0.08
500 (34.4)
500 (34.4)
50 (3.4)
50 (3.4), 100 (6.8), 1000 (68.9),3600 (248)
100 (6.8), 1000 (68.9),3600 (248)
3.4 (50)
3.4 (50), 6.8 (100), 68.9 (1000),248 (3600)
34.4 (500)
34.4 (500)
6.8 (100), 68.9 (1000),248 (3600)
3.44
3.44
0.34, 0.68, 6.89, 24.8
0.68, 6.89, 24.8 0.34
Nitrogen Flow, std ft3/min
Out
let
Pre
ssur
e, p
sig
Out
let
Pre
ssur
e, b
ar
Nitrogen Flow, std L/min
KLF Series High-Sensitivity Pressure-Reducing Regulators Gas Flow
Detail A
A

Pressure-Reducing Regulator Flow Curves 43
Flow CurvesThe flow curves assume an initial set flow rate of 0.035 std ft3/min (1 std L/min) and an initial temperature of 70°F (20°C).
Flow Coefficient 0.50, Pressure Control Ranges 0 to 50 psig (0 to 3.4 bar) and 0 to 25 psig (0 to 1.7 bar)
0
5.0
10
15
20
25
30
0 2.0 4.0 6.0 108.0 12
0
0.5
1.0
1.5
2.0
0 80 240 320160
0
5,0
10
15
20
25
0 2,0 4,0 6,0 8,0 1210
0
0,5
1,0
1,5
2,0
0 80 240 320160
USA
JPN
EURO
30
0
0.05
0.10
0.15
0.20
0 80 240 320160
50 (3.4)100 (6.8), 3600 (248)
100 (6.8), 3600 (248)
50 (3.4)500 (34.4),1000 (68.9)500 (34.4),
1000 (68.9)
6.8 (100),248 (3600)
6.8 (100), 248 (3600
34.4 (500),68.9 (1000)
34.4 (500),68.9 (1000)3.4 (50)
3.4 (50)
0.34
0.34
0.68, 24.8
0.68, 24.8
3.44, 6.89
3.44, 6.89
Nitrogen Flow, std ft3/min
Out
let
Pre
ssur
e, p
sig
Out
let
Pre
ssur
e, b
ar
Nitrogen Flow, std L/min
0
0 1.0 2.0 3.0 4.0
0
0 20 60 8040
0
0 1.0 2.0 3.0 4.0
0 0 20 40 60 80 100
JPN
EURO
USA
100
5.0
10
15
20
25
30
5.0
10
15
20
25
30
0.5
1.0
1.5
2.0
0.5
1.0
1.5
2.0
0 0 20 40 60 80 100
0.05
0.10
0.15
0.20
500 (34.4), 1000 (68.9)
500 (34.4), 1000 (68.9)
100 (6.8), 3600 (248)
50 (3.4), 100 (6.8),3600 (248)
50 (3.4)
34.4 (500), 68.9 (1000)
34.4 (500), 68.9 (1000)
3.4 (50), 6.8 (100),248 (3600)
3.4 (50)
6.8 (100), 248 (3600)
3.44, 6.89
3.44, 6.89
0.34, 0.68, 24.8
0.68, 24.8
0.34
Nitrogen Flow, std ft3/min
Out
let
Pre
ssur
e, p
sig
Out
let
Pre
ssur
e, b
ar
Nitrogen Flow, std L/min
KLF Series High-Sensitivity Pressure-Reducing Regulators Gas Flow
Pressure Control Range
0 to 50 psig (0 to 3.4 bar)
0 to 25 psig (0 to 1.7 bar)
Detail A
A

44 Pressure-Reducing Regulator Flow Curves
Flow CurvesThe flow curves assume an initial set flow rate of 0.035 std ft3/min (1 std L/min) and an initial temperature of 70°F (20°C).
Pressure Control Range
0 to 100 psig (0 to 6.8 bar)
Flow Coefficient 0.50, Pressure Control Range 0 to 100 psig (0 to 6.8 bar)
0
0 10 155.0 20 25 30
0
0 200 300100 600 700 800400 500
00
JPN
EURO
0 10 155,0 20 25 30
0 200 300100 600 700 800400 500
0 200 300100 600 700 800400 500
USA
20
40
60
80
100
120
20
40
60
80
100
120
2,0
4,0
6,0
8,0
2.0
4.0
6.0
8.0
0
0.2
0.4
0.6
0.8
50 (3.4)
50 (3.4) 100 (6.8)
100 (6.8)
100 (6.8)
500 (34.4), 1000 (68.9),3600 (248)
500 (34.4), 1000 (68.9),3600 (248)
500 (34.4), 1000 (68.9), 3600 (248)
34.4 (500), 68.9 (1000),248 (3600)
34.4 (500), 68.9 (1000),248 (3600)
34.4 (500), 68.9 (1000), 248 (3600)
6.8 (100)
6.8 (100)
6.8 (100)
3.4 (50)
3.4 (50)
0.68
0.68
0.68
0.34
0.34 3.44, 6.89, 24.8
3.44, 6.89, 24.8
3.44, 6.89, 24.8
Nitrogen Flow, std ft3/min
Out
let
Pre
ssur
e, p
sig
Out
let
Pre
ssur
e, b
ar
Nitrogen Flow, std L/min
0
0 2.0 4.0 6.0 8.0 10
0
0 160 280120
0
0 2,0 4,0 6,0 8,0 10
0 0
USA
EURO
JPN
40 80 240200
160 28012040 80 240200
20
40
60
80
100
120
20
40
60
80
100
120
2.0
4.0
6.0
8.0
2,0
4,0
6,0
8,0
0 0 160 28012040 80 240200
0.2
0.4
0.6
0.8
500 (34.4), 1000 (68.9),3600 (248)
500 (34.4), 1000 (68.9), 3600 (248)
100 (6.8)
100 (6.8)
100 (6.8)
50 (3.4)
50 (3.4)500 (34.4), 1000 (68.9),3600 (248)
34.4 (500), 68.9 (1000),248 (3600)
34.4 (500), 68.9 (1000), 248 (3600)
6.8 (100)
6.8 (100)
3.4 (50)
3.4 (50)
6.8 (100)
34.4 (500), 68.9 (1000),248 (3600)
3.44, 6.89, 24.8
3.44, 6.89, 24.8
3.44, 6.89, 24.8
0.68
0.680.34
0.34
0.68
Nitrogen Flow, std ft3/min
Out
let
Pre
ssur
e, p
sig
Out
let
Pre
ssur
e, b
ar
Nitrogen Flow, std L/min
KLF Series High-Sensitivity Pressure-Reducing Regulators Gas Flow
Detail A
A
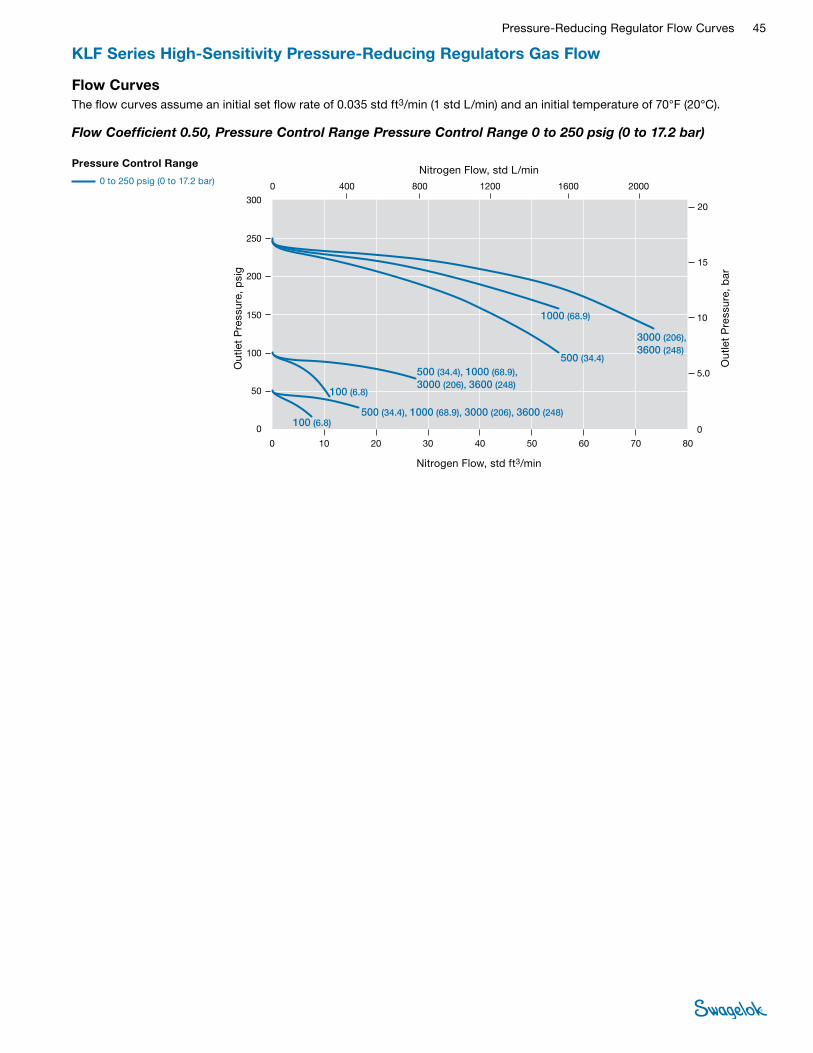
Pressure-Reducing Regulator Flow Curves 45
Flow CurvesThe flow curves assume an initial set flow rate of 0.035 std ft3/min (1 std L/min) and an initial temperature of 70°F (20°C).
Pressure Control Range
0 to 250 psig (0 to 17.2 bar)
Flow Coefficient 0.50, Pressure Control Range Pressure Control Range 0 to 250 psig (0 to 17.2 bar)
0
0 10 20 30 40 6050 70 80
0
0 400 1200 1600800
0
0 10 20 30 40 6050 70 80
0 0 400 800 1200 1600 2000
JPN
EURO
USA
2000
50
100
150
200
250
300
50
100
150
200
250
300
5.0
10
15
20
5.0
10
15
20
0 0 400 800 1200 1600 2000
0.5
1.0
1.5
2.0
100 (6.8)
100 (6.8)500 (34.4), 1000 (68.9), 3000 (206), 3600 (248)
500 (34.4), 1000 (68.9), 3000 (206), 3600 (248)
500 (34.4)
1000 (68.9)
3000 (206), 3600 (248)
206 (3000), 248 (3600)
34.4 (500), 68.9 (1000), 206 (3000), 248 (3600)
34.4 (500), 68.9 (1000), 206 (3000), 248 (3600)
6.8 (100)
6.8 (100)
34.4 (500)
68.9 (1000)
20.6, 24.8
6.89
3.44
0.68
0.683.44, 6.89, 20.6, 24.8
3.44, 6.89, 20.6, 24.8
Nitrogen Flow, std ft3/min
Out
let
Pre
ssur
e, p
sig
Out
let
Pre
ssur
e, b
ar
Nitrogen Flow, std L/min
KLF Series High-Sensitivity Pressure-Reducing Regulators Gas Flow
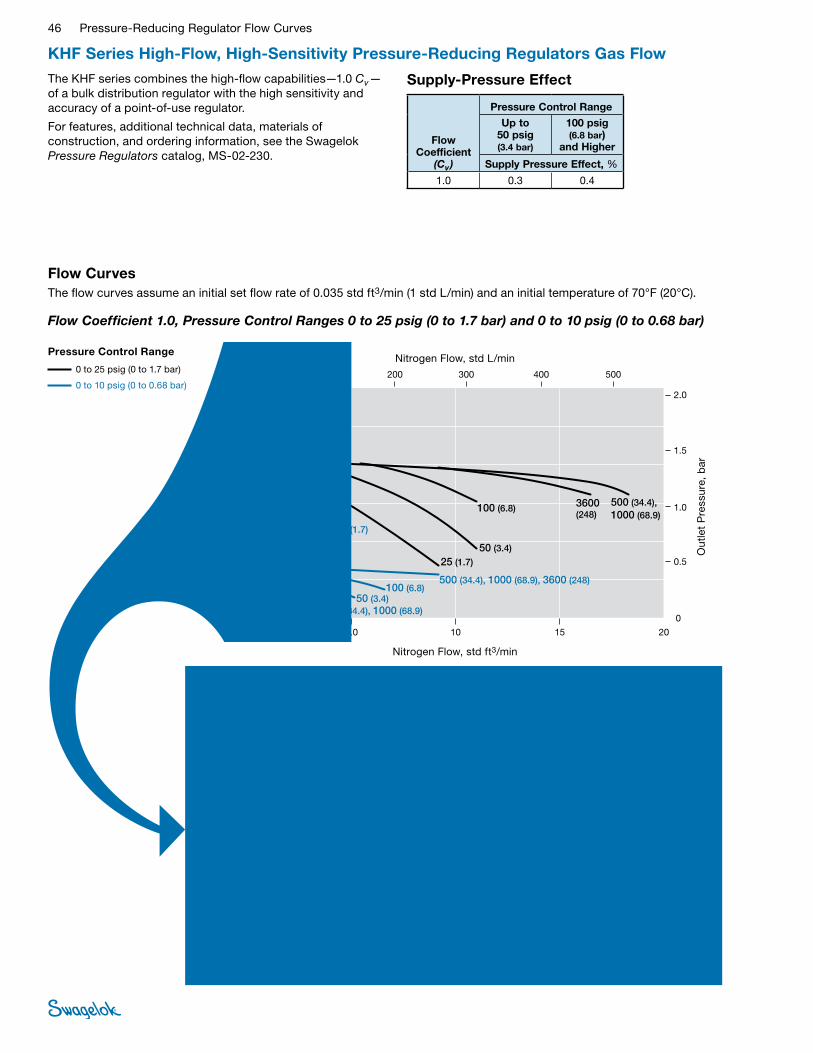
46 Pressure-Reducing Regulator Flow Curves
KHF Series High-Flow, High-Sensitivity Pressure-Reducing Regulators Gas Flow
Flow CurvesThe flow curves assume an initial set flow rate of 0.035 std ft3/min (1 std L/min) and an initial temperature of 70°F (20°C).
The KHF series combines the high-flow capabilities—1.0 Cv—of a bulk distribution regulator with the high sensitivity and accuracy of a point-of-use regulator.
For features, additional technical data, materials of construction, and ordering information, see the Swagelok Pressure Regulators catalog, MS-02-230.
Pressure Control Range
0 to 25 psig (0 to 1.7 bar)
0 to 10 psig (0 to 0.68 bar)
Flow Coefficient 1.0, Pressure Control Ranges 0 to 25 psig (0 to 1.7 bar) and 0 to 10 psig (0 to 0.68 bar)
0
0 5.0 10 15 20
0 100 200 300 400 500
0
0
0 0
JPN
EURO
USA
5.0 10 15 20
100 200 300 400 500
5.0
10
15
20
25
30
0.5
1.0
1.5
2.0
0,5
1,0
1,5
2,0
5,0
10
15
20
25
30
0 0 100 200 300 400 500
0.05
0.10
0.15
0.20
0
25 (1.7)
50 (3.4)
100 (6.8)500 (34.4), 1000 (68.9)
3600 (248)
500 (34.4), 1000 (68.9), 3600 (248)100 (6.8)
50 (3.4)500 (34.4), 1000 (68.9)
25 (1.7)
3600 (248)
25 (1.7),50 (3.4)
100 (6.8)
248 (3600)
34.4 (500),68.9 (1000)
6.8 (100)
3.4 (50)
1.7 (25)
34.4 (500), 68.9 (1000), 248 (3600)6.8 (100)3.4 (50)
34.4 (500), 68.9 (1000)
248 (3600)
1.7 (25),3.4 (50)
6.8 (100)
1.7 (25)
0.170.34
0.683.44,6.89
24.8
3.44, 6.89, 24.80.68
0.68
0.34
0.170.17, 0.34
3.44, 6.89
24.8
Nitrogen Flow, std ft3/min
Out
let
Pre
ssur
e, p
sig
Out
let
Pre
ssur
e, b
ar
Nitrogen Flow, std L/min
0
5.0
10
15
20
25
30
0 1.0 2.0 3.0 4.0 5.0
0
0.5
1.0
1.5
2.0
0 80 14060
0
5,0
10
15
20
25
0 1.0 2.0 3.0 4.0 5.0
0
0,5
1,0
1,5
2,0
0
USA
EURO
JPN
20 40 120100
80 1406020 40 120100
0
0.05
0.10
0.15
0.20
0 80 1406020 40 120100
30
0.68, 3.44, 6.89, 24.8
100 (6.8), 500 (34.4), 1000 (68.9), 3600 (248)
50 (3.4)
25 (1.7)
500 (34.4), 1000 (68.9), 3600 (248)
100 (6.8)
50 (3.4)
3600 (248)25 (1.7), 50 (3.4)
100 (6.8) 500 (34.4), 1000 (68.9)
25 (1.7)
6.8 (100), 34.4 (500), 68.9 (1000), 248 (3600)
3.4 (50)
1.7 (25)
34.4 (500), 68.9 (1000), 248 (3600)
6.8 (100)
3.4 (50)1.7 (25)
34.4 (500), 68.9 (1000)6.8 (100)
248 (3600)1.7 (25), 3.4 (50)
0.34
0.17
3.44, 6.89, 24.8
0.68
0.340.17
0.17, 0.34 0.6824.8 3.44, 6.89
Nitrogen Flow, std ft3/min
Out
let
Pre
ssur
e, p
sig
Out
let
Pre
ssur
e, b
ar
Nitrogen Flow, std L/min
Supply-Pressure Effect
Flow Coefficient
(Cv )
Pressure Control Range
Up to 50 psig (3.4 bar)
100 psig (6.8 bar)
and Higher
Supply Pressure Effect, %
1.0 0.3 0.4
Detail A
A
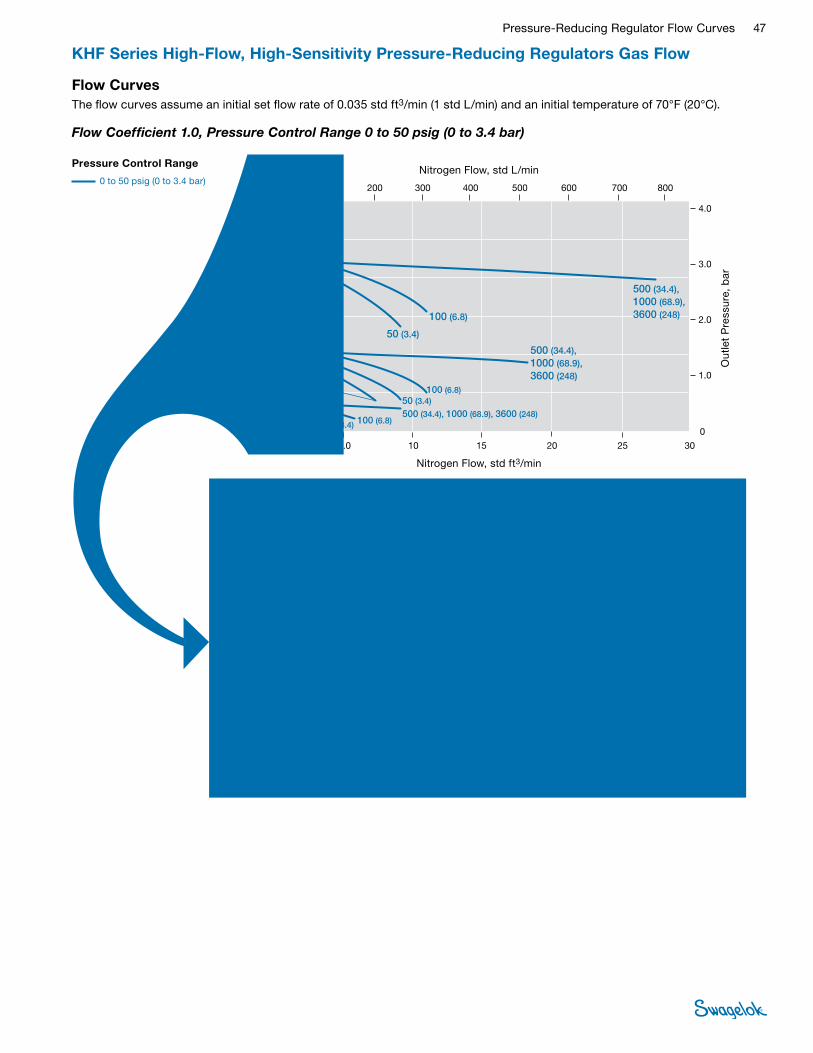
Pressure-Reducing Regulator Flow Curves 47
KHF Series High-Flow, High-Sensitivity Pressure-Reducing Regulators Gas Flow
Flow CurvesThe flow curves assume an initial set flow rate of 0.035 std ft3/min (1 std L/min) and an initial temperature of 70°F (20°C).
Pressure Control Range
0 to 50 psig (0 to 3.4 bar)
Flow Coefficient 1.0, Pressure Control Range 0 to 50 psig (0 to 3.4 bar)
0
10
20
30
40
50
60
0 5.0 10 15 2520 30
0
1.0
2.0
3.0
4.0
0 200 600 800400
0
10
20
30
40
50
0 5,0 10 15 20 3025
0
1,0
2,0
3,0
4,0
0 100 200 300 500 600 700 800400
0
0.1
0.2
0.3
0.4
0 100 200 300 500 600 700 800400
USA
JPN
100 300 500 700
EURO
60
50 (3.4)
100 (6.8)
500 (34.4), 1000 (68.9), 3600 (248)
500 (34.4), 1000 (68.9), 3600 (248)
100 (6.8)
500 (34.4), 1000 (68.9), 3600 (248)
25 (1.7)
25 (1.7)50 (3.4)
50 (3.4) 100 (6.8)
34.4 (500), 68.9 (1000), 248 (3600)
34.4 (500), 68.9 (1000), 248 (3600)
6.8 (100)
3.4 (50)
1.7 (25)
1.7 (25) 3.4 (50)
3.4 (50)6.8 (100)
6.8 (100)34.4 (500), 68.9 (1000), 248 (3600)
3.44, 6.89, 24.8
3.44, 6.89, 24.8
3.44, 6.89, 24.8
0.34
0.68
0.680.340.17
0.340.68
0.17
Nitrogen Flow, std ft3/min
Out
let
Pre
ssur
e, p
sig
Out
let
Pre
ssur
e, b
ar
Nitrogen Flow, std L/min
0
10
20
30
40
50
60
0 1.0 2.0 3.0 4.0 5.0
0
1.0
2.0
3.0
4.0
0 80 14060
0
10
20
30
40
50
0 1,0 2,0 3,0 4,0 5,0
0
1,0
2,0
3,0
4,0
0
USA
EURO
JPN
20 40 120100
80 1406020 40 120100
0
0.1
0.2
0.3
0.4
0 80 1406020 40 120100
60
100 (6.8), 500 (34.4), 1000 (68.9), 3600 (248)
50 (3.4)
100 (6.8), 500 (34.4), 1000 (68.9), 3600 (248)
50 (3.4)
25 (1.7)100 (6.8), 500 (34.4), 1000 (68.9), 3600 (248)
50 (3.4)25 (1.7)
6.8 (100), 34.4 (500), 68.9 (1000), 248 (3600)
3.4 (50)
6.8 (100), 34.4 (500), 68.9 (1000), 248 (3600)
3.4 (50)
1.7 (25)6.8 (100), 34.4 (500), 68.9 (1000), 248 (3600)
3.4 (50)1.7 (25)
0.68, 3.44, 6.89, 24.8
0.68, 3.44, 6.89, 24.8
0.68, 3.44, 6.89, 24.8
0.34
0.340.17
0.340.17
Nitrogen Flow, std ft3/min
Out
let
Pre
ssur
e, p
sig
Out
let
Pre
ssur
e, b
ar
Nitrogen Flow, std L/minDetail A
A
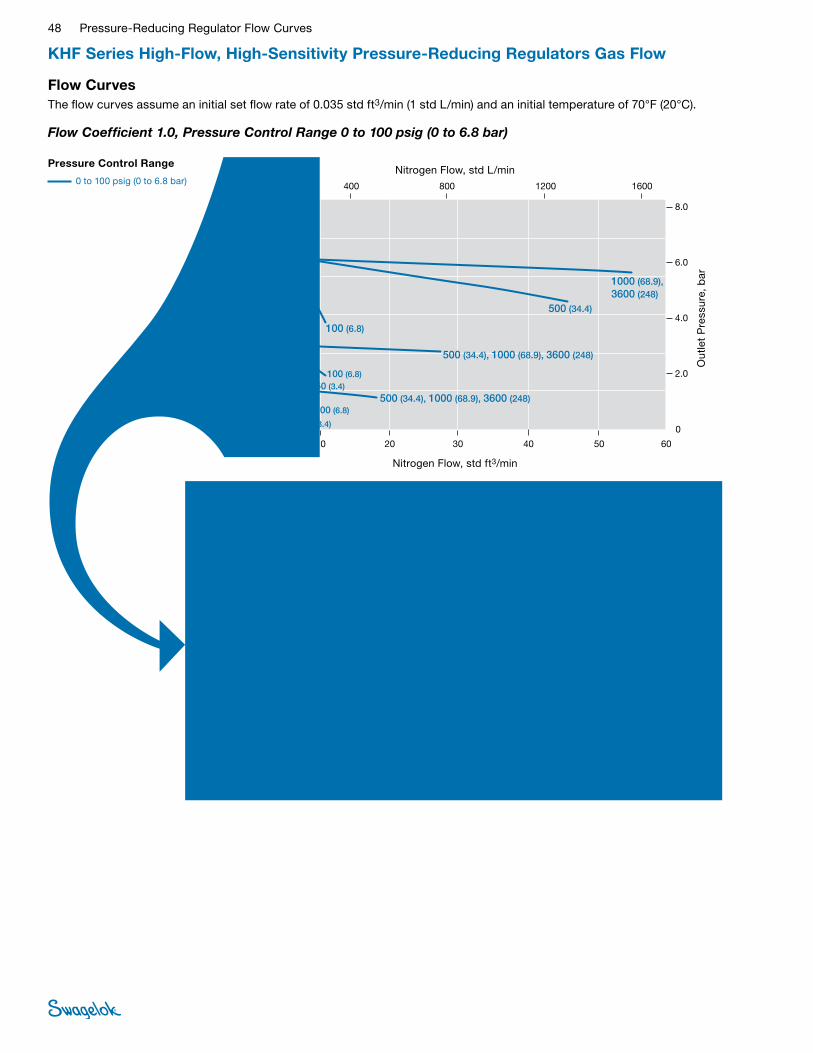
48 Pressure-Reducing Regulator Flow Curves
KHF Series High-Flow, High-Sensitivity Pressure-Reducing Regulators Gas Flow
Flow CurvesThe flow curves assume an initial set flow rate of 0.035 std ft3/min (1 std L/min) and an initial temperature of 70°F (20°C).
Pressure Control Range
0 to 100 psig (0 to 6.8 bar)
Flow Coefficient 1.0, Pressure Control Range 0 to 100 psig (0 to 6.8 bar)
0
20
40
60
80
100
120
0 10 20 30 5040 60
0
2.0
4.0
6.0
8.0
0 400 1200 1600800
0
20
40
60
80
100
0 10 20 30 40 6050
0
2,0
4,0
6,0
8,0
0 400 1200 1600800
0
0.2
0.4
0.6
0.8
0 400 1200 1600800
USA
JPN
EURO
120
100 (6.8)
500 (34.4)
500 (34.4), 1000 (68.9), 3600 (248)
1000 (68.9), 3600 (248)
500 (34.4), 1000 (68.9), 3600 (248)
50 (3.4)
50 (3.4)100 (6.8)
100 (6.8)
25 (1.7)
34.4 (500), 68.9 (1000), 248 (3600)
34.4 (500), 68.9 (1000), 248 (3600)
68.9 (1000), 248 (3600)
34.4 (500)
6.8 (100)
6.8 (100)
6.8 (100)3.4 (50)
3.4 (50)
1.7 (25)
3.44, 6.89, 24.8
3.44, 6.89, 24.8
6.89, 24.8
3.44
0.68
0.68
0.68
0.34
0.340.17
Nitrogen Flow, std ft3/min
Out
let
Pre
ssur
e, p
sig
Out
let
Pre
ssur
e, b
ar
Nitrogen Flow, std L/min
0
0 2.0 4.0 6.0 8.0 10
0
0 160 280120
0
0 2,0 4,0 6,0 8,0 10
0 0
USA
EURO
JPN
40 80 240200
160 28012040 80 240200
20
40
60
80
100
120
20
40
60
80
100
120
2.0
4.0
6.0
8.0
2,0
4,0
6,0
8,0
0 0 160 28012040 80 240200
0.2
0.4
0.6
0.8
500 (34.4), 1000 (68.9), 3600 (248)
100 (6.8)
500 (34.4), 1000 (68.9), 3600 (248)
100 (6.8)
50 (3.4)
50 (3.4) 100 (6.8)25 (1.7)500 (34.4), 1000 (68.9), 3600 (248)
34.4 (500), 68.9 (1000), 248 (3600)
34.4 (500), 68.9 (1000), 248 (3600)
34.4 (500), 68.9 (1000), 248 (3600) 1.7 (25) 3.4 (50)
3.4 (50)
6.8 (100)
6.8 (100)
6.8 (100)
3.44, 6.89, 24.8
3.44, 6.89, 24.8
3.44, 6.89, 24.8
0.34
0.34
0.68
0.68
0.680.17
Nitrogen Flow, std ft3/min
Out
let
Pre
ssur
e, p
sig
Out
let
Pre
ssur
e, b
ar
Nitrogen Flow, std L/minDetail A
A
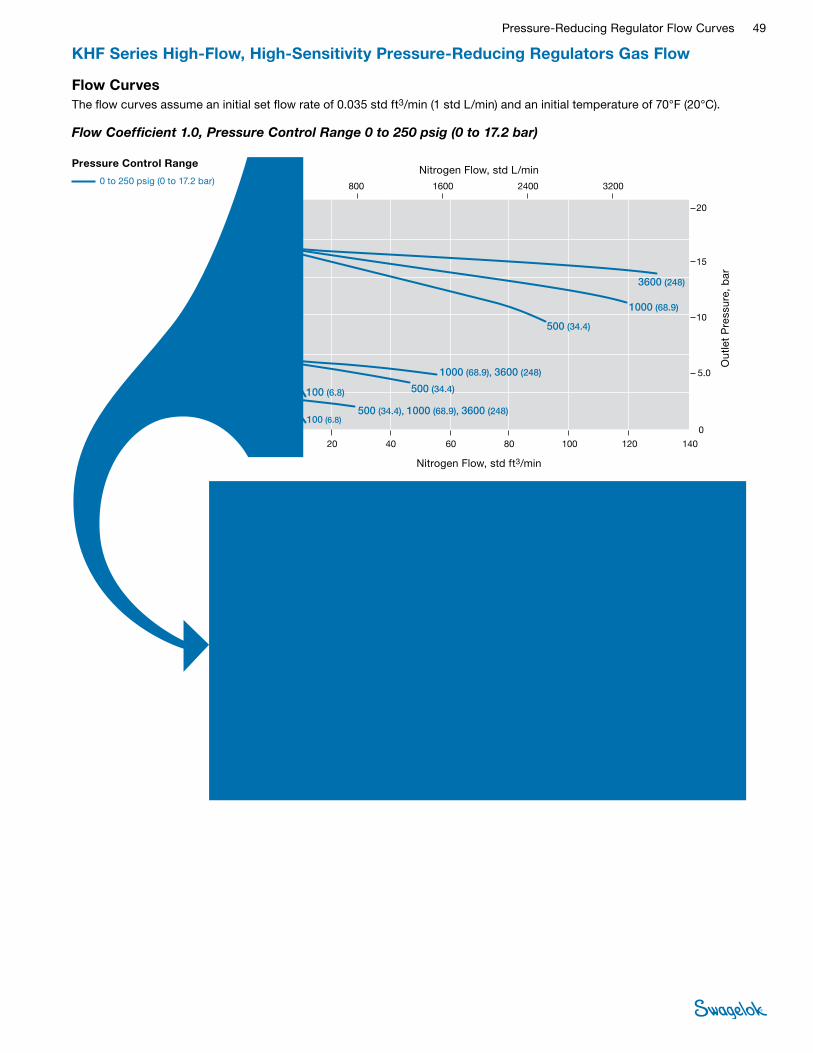
Pressure-Reducing Regulator Flow Curves 49
KHF Series High-Flow, High-Sensitivity Pressure-Reducing Regulators Gas Flow
Flow CurvesThe flow curves assume an initial set flow rate of 0.035 std ft3/min (1 std L/min) and an initial temperature of 70°F (20°C).
Pressure Control Range
0 to 250 psig (0 to 17.2 bar)
Flow Coefficient 1.0, Pressure Control Range 0 to 250 psig (0 to 17.2 bar)
0
0 20 40 60 10080 140
0
0 800 2400 32001600
0
0 0
JPN
EURO
120
20 40 60 10080 140120
800 2400 320016000
50
100
150
200
250
300
5.0
10
15
20
5,0
10
15
20
USA
50
100
150
200
250
300
0 0 800 2400 32001600
0.5
1.0
1.5
2.0
3600 (248)
1000 (68.9)
500 (34.4)
500 (34.4), 1000 (68.9), 3600 (248)
1000 (68.9), 3600 (248)
500 (34.4)100 (6.8)
100 (6.8)50 (3.4)
34.4 (500), 68.9 (1000), 248 (3600)
68.9 (1000), 248 (3600)
34.4 (500)
34.4 (500)
68.9 (1000)
248 (3600)
3.4 (50)
6.8 (100)
6.8 (100)
24.8
6.89
3.44
3.44
3.44, 6.89, 24.8
6.89, 24.8
0.68
0.680.34
Nitrogen Flow, std ft3/min
Out
let
Pre
ssur
e, p
sig
Out
let
Pre
ssur
e, b
ar
Nitrogen Flow, std L/min
0
50
100
150
200
250
300
0 2.0 4.0 6.0 8.0 10
0
5.0
10
15
20
0 160 280120
0
50
100
150
200
250
0 2.0 4.0 6.0 8.0 10
0
5,0
10
15
20
0
USA
EURO
JPN
40 80 240200
160 28012040 80 240200
0
0.5
0 160 28012040 80 240200
300
1.0
2.0
1.5
500 (34.4), 1000 (68.9), 3600 (248)
1000 (68.9), 3600 (248)
500 (34.4)
100 (6.8)
100 (6.8)50 (3.4)
500 (34.4), 1000 (68.9), 3600 (248)
34.4 (500), 68.9 (1000), 248 (3600)
34.4 (500), 68.9 (1000), 248 (3600)
68.9 (1000), 248 (3600)
34.4 (500)
6.8 (100)
6.8 (100)3.4 (50)
3.44, 6.89, 24.8
6.89, 24.8
3.44
0.68
0.680.34
3.44, 6.89, 24.8
Nitrogen Flow, std ft3/min
Out
let
Pre
ssur
e, p
sig
Out
let
Pre
ssur
e, b
ar
Nitrogen Flow, std L/minDetail A
A
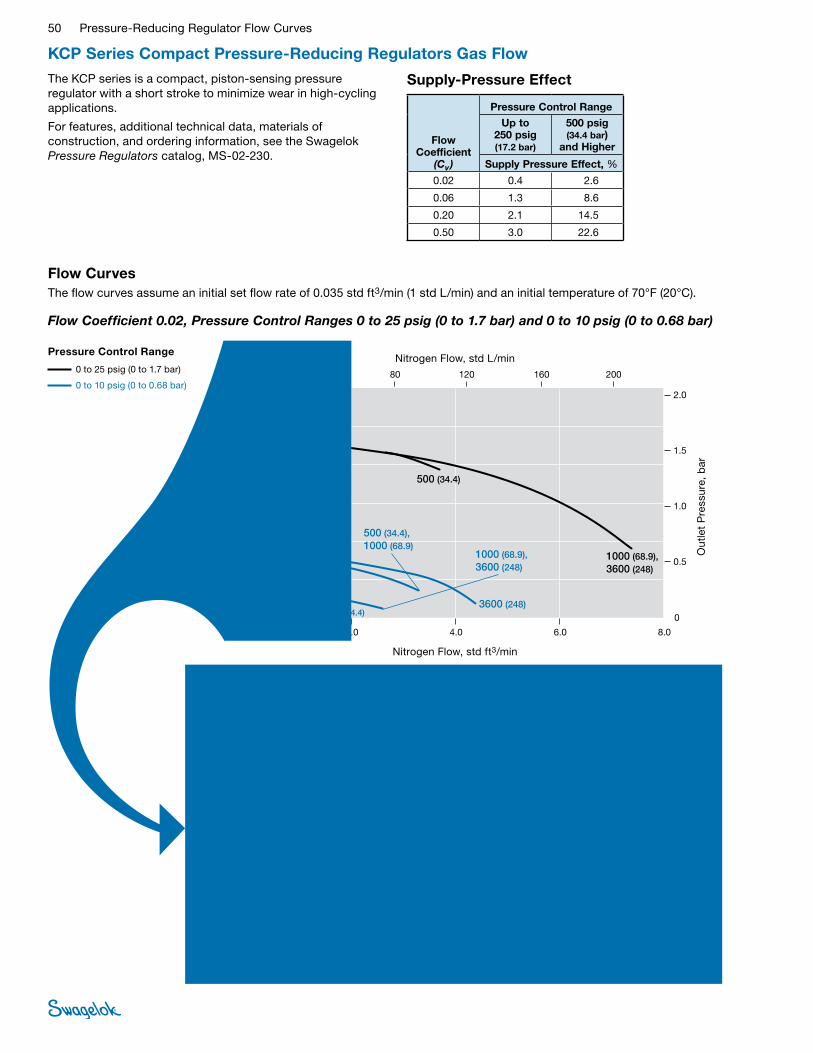
50 Pressure-Reducing Regulator Flow Curves
KCP Series Compact Pressure-Reducing Regulators Gas Flow
Flow CurvesThe flow curves assume an initial set flow rate of 0.035 std ft3/min (1 std L/min) and an initial temperature of 70°F (20°C).
The KCP series is a compact, piston-sensing pressure regulator with a short stroke to minimize wear in high-cycling applications.
For features, additional technical data, materials of construction, and ordering information, see the Swagelok Pressure Regulators catalog, MS-02-230.
Pressure Control Range
0 to 25 psig (0 to 1.7 bar)
0 to 10 psig (0 to 0.68 bar)
Flow Coefficient 0.02, Pressure Control Ranges 0 to 25 psig (0 to 1.7 bar) and 0 to 10 psig (0 to 0.68 bar)
0
0 2.0 4.0 6.0 8.0
0
0 40 80 120 160 200
0
0
0
0
JPN
EURO
USA
2,0 4,0 6,0 8,0
40 80 120 160 200
5.0
10
15
20
25
30
0.5
1.0
1.5
2.0
0,5
1,0
1,5
2,0
5,0
10
15
20
25
30
0
0 40 80 120 160 200
0.05
0.10
0.15
0.20
50 (3.4), 100 (6.8) 500 (34.4)
1000 (68.9),3600 (248)
1000 (68.9),3600 (248)
500 (34.4), 1000 (68.9)
3600 (248)500 (34.4)
100 (6.8)
100 (6.8)
50 (3.4)
50 (3.4)
3.4 (50), 6.8 (100) 34.4 (500)
68.9 (1000),248 (3600)
248 (3600)
34.4 (500), 68.9 (1000)
68.9 (1000),248 (3600)
34.4 (500)
34.4 (500)
34.4 (500)
6.8 (100)
6.8 (100)
0.34, 0.68 3.44
6.89,24.80.34
0.34
0.68
0.68 3.446.89, 24.8
3.44, 6.89 24.8
Nitrogen Flow, std ft3/min
Out
let
Pre
ssur
e, p
sig
Out
let
Pre
ssur
e, b
ar
Nitrogen Flow, std L/min
0
0 0.5 1.0 1.5 2.0
0 10 20 30 40 50
0
0
0
0
JPN
EURO
USA
0.5 1.0 1.5 2.0
10 20 30 40 50
5.0
10
15
20
25
30
0.5
1.0
1.5
2.0
0.5
1.0
1.5
2.0
5.0
10
15
20
25
30
0
0 10 20 30 40 50
0.05
0.10
0.15
0.20
0
50 (3.4), 100 (6.8) 500 (34.4), 1000 (68.9), 3600 (248)
500 (34.4), 1000 (68.9), 3600 (248)
1000 (68.9), 3600 (248)
50 (3.4) 100 (6.8)
50 (3.4) 100 (6.8)500 (34.4)
34.4 (500), 68.9 (1000), 248 (3600)
34.4 (500), 68.9 (1000), 248 (3600)
68.9 (1000), 248 (3600)
34.4 (500)
3.4 (50), 6.8 (100)
3.4 (50) 6.8 (100)
3.4 (50) 6.8 (100)
0.34, 0.68 3.44, 6.89, 24.8
3.44, 6.89, 24.8
6.89, 24.8
3.44
0.34 0.68
0.34 0.68
Nitrogen Flow, std ft3/min
Out
let
Pre
ssur
e, p
sig
Out
let
Pre
ssur
e, b
ar
Nitrogen Flow, std L/min
Supply-Pressure Effect
Flow Coefficient
(Cv )
Pressure Control Range
Up to 250 psig (17.2 bar)
500 psig (34.4 bar)
and Higher
Supply Pressure Effect, %
0.02 0.4 2.6
0.06 1.3 8.6
0.20 2.1 14.5
0.50 3.0 22.6
Detail A
A
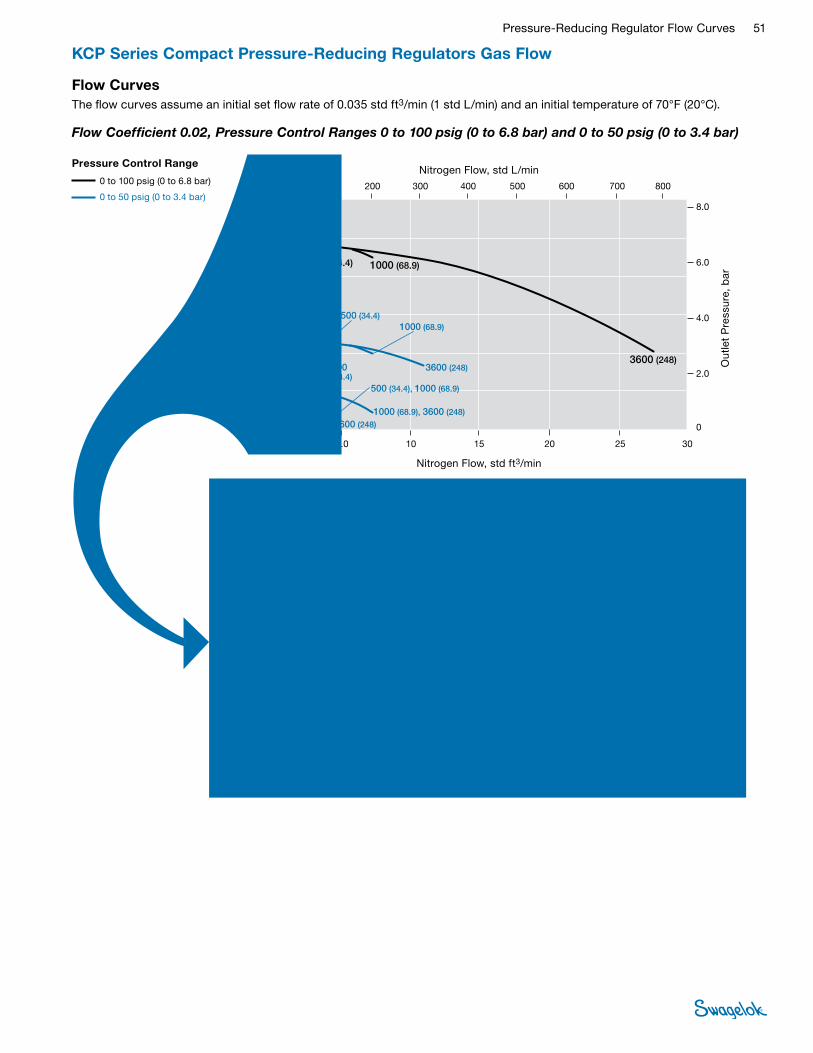
Pressure-Reducing Regulator Flow Curves 51
KCP Series Compact Pressure-Reducing Regulators Gas Flow
Flow CurvesThe flow curves assume an initial set flow rate of 0.035 std ft3/min (1 std L/min) and an initial temperature of 70°F (20°C).
Pressure Control Range
0 to 100 psig (0 to 6.8 bar)
0 to 50 psig (0 to 3.4 bar)
Flow Coefficient 0.02, Pressure Control Ranges 0 to 100 psig (0 to 6.8 bar) and 0 to 50 psig (0 to 3.4 bar)
0
20
40
60
80
100
120
0 5.0 10 15 2520 30
0
2.0
4.0
6.0
8.0
0 200 600 800400
0
20
40
60
80
100
0 5,0 10 15 20 3025
0
2,0
4,0
6,0
8,0
0 100 200 300 500 600 700 800400
0
0.2
0.4
0.6
0.8
0 100 200 300 500 600 700 800400
USA
JPN
100 300 500 700
EURO
120
500 (34.4) 1000 (68.9)
3600 (248)
100 (6.8)
3600 (248)
500 (34.4)1000 (68.9)
50 (3.4), 100 (6.8)
1000 (68.9), 3600 (248)
3600 (248)
500 (34.4)
500 (34.4), 1000 (68.9)
50 (3.4), 100 (6.8)
68.9 (1000),34.4 (500)
6.8 (100)
248 (3600)
3.4 (50), 6.8 (100)
34.4 (500)68.9 (1000)
248 (3600)3.4 (50), 6.8 (100) 34.4
(500)
34.4 (500), 68.9 (1000)
68.9 (1000), 248 (3600)
248 (3600)
0.68
3.44 6.89
24.8
0.34, 0.68 3.446.89
24.8
24.86.89, 24.8
3.44
3.44, 6.89
0.34, 0.68
Nitrogen Flow, std ft3/min
Out
let
Pre
ssur
e, p
sig
Out
let
Pre
ssur
e, b
ar
Nitrogen Flow, std L/min
0
20
40
60
80
100
120
0 1.0 2.0 3.0 4.0 5.0
0
2.0
4.0
6.0
8.0
0 80 14060
0
20
40
60
80
100
0 1,0 2,0 3,0 4,0 5,0
0
2,0
4,0
6,0
8,0
0
USA
EURO
JPN
20 40 120100
80 1406020 40 120100
0
0.2
0.4
0.6
0.8
0 80 1406020 40 120100
120
50 (3.4), 100 (6.8)
50 (3.4), 100 (6.8)
50 (3.4), 100 (6.8)
100 (6.8)
500 (34.4)
1000 (68.9),3600 (248)
1000 (68.9),3600 (248)
1000 (68.9),3600 (248)
3600 (248)
500 (34.4), 1000 (68.9)
500 (34.4)
500 (34.4)
34.4 (500)
6.8 (100)
68.9 (1000),248 (3600)
68.9 (1000),248 (3600)
68.9 (1000),248 (3600)
34.4 (500)
34.4 (500)
248 (3600)
34.4 (500), 68.9 (1000)
3.4 (50), 6.8 (100)
3.4 (50), 6.8 (100)
3.4 (50), 6.8 (100)
6.89, 24.8
6.89, 24.8
6.89, 24.8
3.44
3.44
3.44
24.8
3.44, 6.89
0.34, 0.68
0.34, 0.68
0.34, 0.68
0.68
Nitrogen Flow, std ft3/min
Out
let
Pre
ssur
e, p
sig
Out
let
Pre
ssur
e, b
ar
Nitrogen Flow, std L/minDetail A
A
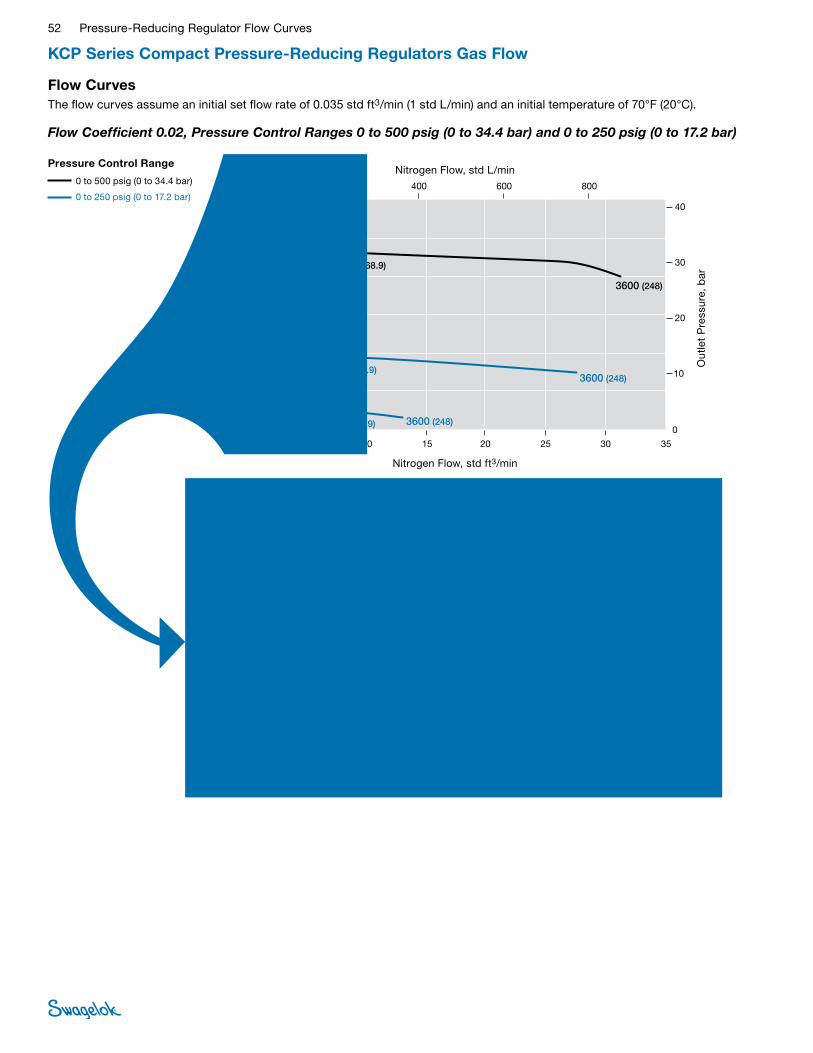
52 Pressure-Reducing Regulator Flow Curves
KCP Series Compact Pressure-Reducing Regulators Gas Flow
Flow CurvesThe flow curves assume an initial set flow rate of 0.035 std ft3/min (1 std L/min) and an initial temperature of 70°F (20°C).
Pressure Control Range
0 to 500 psig (0 to 34.4 bar)
0 to 250 psig (0 to 17.2 bar)
Flow Coefficient 0.02, Pressure Control Ranges 0 to 500 psig (0 to 34.4 bar) and 0 to 250 psig (0 to 17.2 bar)
0
100
200
300
400
500
600
0 5.0 10 15 2520 35
0
10
20
30
40
0 200 600 800400
100
200
300
400
500
0
0
10
20
30
40
0
USA
JPN
EURO
30
600
5,0 10 15 2520 3530
200 600 800400
0
1.0
2.0
3.0
4.0
0 200 600 800400
0
500 (34.4)
1000 (68.9)
3600 (248)
3600 (248)500 (34.4) 1000 (68.9)
3600 (248)1000 (68.9)500 (34.4)
34.4 (500)
34.4 (500)
34.4 (500)
68.9 (1000)
68.9 (1000)
68.9 (1000)
248 (3600)
248 (3600)
248 (3600)
6.89
3.44
24.8
24.8
6.89
6.89
3.44
3.44
24.8
Nitrogen Flow, std ft3/min
Out
let
Pre
ssur
e, p
sig
Out
let
Pre
ssur
e, b
ar
Nitrogen Flow, std L/min
0
100
200
300
400
500
600
0 2.0 4.0 6.0 8.0 10
0
10
20
30
40
0 160 280120
0
100
200
300
400
500
0 2,0 4,0 6,0 8,0 10
0
10
20
30
40
0
USA
EURO
JPN
40 80 240200
160 28012040 80 240200
0
1.0
0 160 28012040 80 240200
600
2.0
4.0
3.0
1000 (68.9)
500 (34.4)
3600 (248)
1000 (68.9)500 (34.4) 3600 (248)
1000 (68.9)500 (34.4) 3600 (248)
68.9 (1000) 248 (3600)
34.4 (500)
68.9 (1000) 248 (3600)34.4 (500)
68.9 (1000) 248 (3600)34.4 (500)
3.44
6.89 24.8
3.44 6.89 24.8
3.44 6.89 24.8
Nitrogen Flow, std ft3/min
Out
let
Pre
ssur
e, p
sig
Out
let
Pre
ssur
e, b
ar
Nitrogen Flow, std L/minDetail A
A

Pressure-Reducing Regulator Flow Curves 53
KCP Series Compact Pressure-Reducing Regulators Gas Flow
Flow CurvesThe flow curves assume an initial set flow rate of 0.035 std ft3/min (1 std L/min) and an initial temperature of 70°F (20°C).
Flow Coefficient 0.02, Pressure Control Ranges 0 to 1500 psig (0 to 103 bar) and 0 to 1000 psig (0 to 68.9 bar)
0
0 5.0 10 15 2520 35
0
0 200 600 800400
0
0 0
USA
JPN
EURO
30
5,0 10 15 2520 3530
200 600 800400
200
400
600
800
1000
1600
1200
1400
0
200
400
600
800
1000
1600
1200
1400
20
40
60
100
80
20
40
60
100
80
0 0 200 600 800400
2.0
4.0
6.0
10
8.0
3600 (248)
3600 (248)
3600 (248)
1000 (68.9)
1000 (68.9)
248 (3600)
248 (3600)
248 (3600)
68.9 (1000)
68.9 (1000)
24.8
24.8
24.8
6.89
6.89
Nitrogen Flow, std ft3/min
Out
let
Pre
ssur
e, p
sig
Out
let
Pre
ssur
e, b
ar
Nitrogen Flow, std L/min
0
200
400
600
800
1000
1600
00
20
40
60
100
0
0
0
0
20
60
80
100
0
USA
JPN
1200
1400
80
200
400
600
800
1000
1200
1400
40
EURO
1600
2.0 4.0 6.0 8.0 10
160 28012040 80 240200
2,0 4,0 6,0 8,0 10
160 28012040 80 240200
0
2.0
6.0
8.0
10
0
4.0
160 28012040 80 240200
L
L
R
R
R
3600 (248)
3600 (248)
3600 (248)
1000 (68.9)
1000 (68.9)
68.9 (1000)
248 (3600)
248 (3600)
248 (3600)
68.9 (1000)
Nitrogen Flow, std ft3/min
Out
let
Pre
ssur
e, p
sig
Out
let
Pre
ssur
e, b
ar
Nitrogen Flow, std L/min
Pressure Control Range
0 to 1500 psig (0 to 103 bar)
0 to 1000 psig (0 to 68.9 bar)
Detail A
A

54 Pressure-Reducing Regulator Flow Curves
KCP Series Compact Pressure-Reducing Regulators Gas Flow
Flow CurvesThe flow curves assume an initial set flow rate of 0.035 std ft3/min (1 std L/min) and an initial temperature of 70°F (20°C).
Pressure Control Range
0 to 25 psig (0 to 1.7 bar)
0 to 10 psig (0 to 0.68 bar)
Flow Coefficient 0.06, Pressure Control Ranges 0 to 25 psig (0 to 1.7 bar) and 0 to 10 psig (0 to 0.68 bar)
0
0 2.0 4.0 6.0 8.0
0
0 40 80 120 160 200
0
0
0
0
JPN
EURO
USA
2,0 4,0 6,0 8,0
40 80 120 160 200
5.0
10
15
20
25
30
0.5
1.0
1.5
2.0
0,5
1,0
1,5
2,0
5,0
10
15
20
25
30
0
0 40 80 120 160 200
0.05
0.10
0.15
0.20
100 (6.8)
50 (3.4)
500 (34.4), 1000 (68.9),3600 (248)
500 (34.4), 1000 (68.9), 3600 (248)
500 (34.4), 1000 (68.9)
50 (3.4) 100 (6.8)
50 (3.4) 100
(6.8)
3600 (248)
3.4 (50)
6.8 (100)
34.4 (500), 68.9 (1000),248 (3600)
34.4 (500), 68.9 (1000), 248 (3600)
34.4 (500), 68.9 (1000)
3.4 (50) 6.8 (100)
3.4 (50)
6.8 (100)
248 (3600)
0.340.68
3.44, 6.89, 24.8
0.34 0.68
0.34
0.68
3.44, 6.89
3.44, 6.89, 24.8
24.8
Nitrogen Flow, std ft3/min
Out
let
Pre
ssur
e, p
sig
Out
let
Pre
ssur
e, b
ar
Nitrogen Flow, std L/min
0
0 0.5 1.0 1.5 2.0
0
0 10 20 30 40 50
0
0
0
0
JPN
EURO
USA
0,5 1,0 1,5 2,0
10 20 30 40 50
5.0
10
15
20
25
30
0.5
1.0
1.5
2.0
0,5
1,0
1,5
2,0
5,0
10
15
20
25
30
0
0 10 20 30 40 50
0.05
0.10
0.15
0.20
500 (34.4), 1000 (68.9), 3600 (248)
500 (34.4), 1000 (68.9), 3600 (248)
100 (6.8)50 (3.4)
500 (34.4), 1000 (68.9)
50 (3.4), 100 (6.8)3600 (248)
50 (3.4) 100 (6.8)
34.4 (500), 68.9 (1000), 248 (3600)
3.4 (50) 6.8 (100)
34.4 (500), 68.9 (1000)
3.4 (50) 6.8 (100)
34.4 (500), 68.9 (1000),248 (3600)
248 (3600)3.4 (50), 6.8 (100)
3.44, 6.89, 24.8
0.34 0.68
3.44, 6.89, 24.8
0.34 0.68
0.34, 0.68
3.44, 6.89
3.44
Nitrogen Flow, std ft3/min
Out
let
Pre
ssur
e, p
sig
Out
let
Pre
ssur
e, b
ar
Nitrogen Flow, std L/minDetail A
A

Pressure-Reducing Regulator Flow Curves 55
KCP Series Compact Pressure-Reducing Regulators Gas Flow
Flow CurvesThe flow curves assume an initial set flow rate of 0.035 std ft3/min (1 std L/min) and an initial temperature of 70°F (20°C).
Pressure Control Range
0 to 100 psig (0 to 6.8 bar)
0 to 50 psig (0 to 3.4 bar)
Flow Coefficient 0.06, Pressure Control Ranges 0 to 100 psig (0 to 6.8 bar) and 0 to 50 psig (0 to 3.4 bar)
0
0 5.0 10 15 20
0
0 100 300 400200
0
0 5,0 10 15 20
0
0 100 200 300 400 500
JPN
EURO
USA
500
20
40
60
80
100
120
20
40
60
80
100
120
2,0
4,0
6,0
8,0
2.0
4.0
6.0
8.0
0 0 100 200 300 400 500
0.2
0.4
0.6
0.8
100 (6.8) 500 (34.4)
1000 (68.9)
3600 (248)
50 (3.4)
100 (6.8)
50 (3.4) 100 (6.8)500 (34.4), 1000 (68.9), 3600 (248)
500 (34.4), 1000 (68.9), 3600 (248)
6.8 (100) 34.4 (500)
68.9 (1000)
248 (3600)
34.4 (500), 68.9 (1000),248 (3600)
34.4 (500), 68.9 (1000), 248 (3600)
3.4 (50)
6.8 (100)
3.4 (50) 6.8 (100)
0.34
0.68
0.34 0.68 3.44, 6.89, 24.83.44, 6.89, 24.8
6.890.68 3.44 24.8
Nitrogen Flow, std ft3/min
Out
let
Pre
ssur
e, p
sig
Out
let
Pre
ssur
e, b
ar
Nitrogen Flow, std L/min
0
20
40
60
80
100
120
0 1.0 2.0 3.0 4.0 5.0
0
2.0
4.0
6.0
8.0
0 80 14060
0
20
40
60
80
100
0 1,0 2,0 3,0 4,0 5,0
0
2,0
4,0
6,0
8,0
0
USA
EURO
JPN
20 40 120100
80 1406020 40 120100
0
0.2
0.4
0.6
0.8
0 80 1406020 40 120100
120
50 (3.4)
50 (3.4)
100 (6.8)
100 (6.8)
100 (6.8)
500 (34.4), 1000 (68.9), 3600 (248)
500 (34.4), 1000 (68.9), 3600 (248)
500 (34.4), 1000 (68.9), 3600 (248)
34.4 (500), 68.9 (1000), 248 (3600)
34.4 (500), 68.9 (1000), 248 (3600)
34.4 (500), 68.9 (1000), 248 (3600)
6.8 (100)
6.8 (100)
6.8 (100)
3.4 (50)
3.4 (50)
3.44, 6.89, 24.8
0.68
0.68
0.68
3.44, 6.89, 24.8
3.44, 6.89, 24.80.34
0.34
Nitrogen Flow, std ft3/min
Out
let
Pre
ssur
e, p
sig
Out
let
Pre
ssur
e, b
ar
Nitrogen Flow, std L/minDetail A
A

56 Pressure-Reducing Regulator Flow Curves
KCP Series Compact Pressure-Reducing Regulators Gas Flow
Flow CurvesThe flow curves assume an initial set flow rate of 0.035 std ft3/min (1 std L/min) and an initial temperature of 70°F (20°C).
Pressure Control Range
0 to 500 psig (0 to 34.4 bar)
0 to 250 psig (0 to 17.2 bar)
Flow Coefficient 0.06, Pressure Control Ranges 0 to 500 psig (0 to 34.4 bar) and 0 to 250 psig (0 to 17.2 bar)
0
100
200
300
400
500
600
0 20 40 60 80 100
0
10
20
30
40
0 1600 28001200
0
100
200
300
400
500
0 20 40 60 80 100
0
10
20
30
40
0
USA
EURO
JPN
400 800 24002000
1600 28001200400 800 24002000
0
1.0
0 1600 28001200400 800 24002000
600
2.0
4.0
3.0
500 (34.4)
1000 (68.9)
3600 (248)
500 (34.4)
1000 (68.9)3600 (248)
3600 (248)
500 (34.4), 1000 (68.9)
34.4 (500)
34.4 (500)
68.9 (1000)
248 (3600)
68.9 (1000)248 (3600)
248 (3600)
34.4 (500), 68.9 (1000)
3.44
6.89
24.8
24.8
24.8
6.89
3.44
3.44, 6.89
Nitrogen Flow, std ft3/min
Out
let
Pre
ssur
e, p
sig
Out
let
Pre
ssur
e, b
ar
Nitrogen Flow, std L/min
0
100
200
300
400
500
600
0 2.0 4.0 6.0 8.0 10
0
10
20
30
40
0 160 280120
0
100
200
300
400
500
0 2,0 4,0 6,0 8,0 10
0
10
20
30
40
0
USA
EURO
JPN
40 80 240200
160 28012040 80 240200
0
1.0
0 160 28012040 80 240200
600
2.0
4.0
3.0
1000 (68.9), 3600 (248)
500 (34.4)
3600 (248)
3600 (248)
500 (34.4), 1000 (68.9)
500 (34.4), 1000 (68.9)
68.9 (1000), 248 (3600)
34.4 (500)
248 (3600)
34.4 (500), 68.9 (1000)
248 (3600)
34.4 (500), 68.9 (1000)
6.89, 24.8
3.44
24.8
24.8
3.44, 6.89
3.44, 6.89
Nitrogen Flow, std ft3/min
Out
let
Pre
ssur
e, p
sig
Out
let
Pre
ssur
e, b
ar
Nitrogen Flow, std L/minDetail A
A
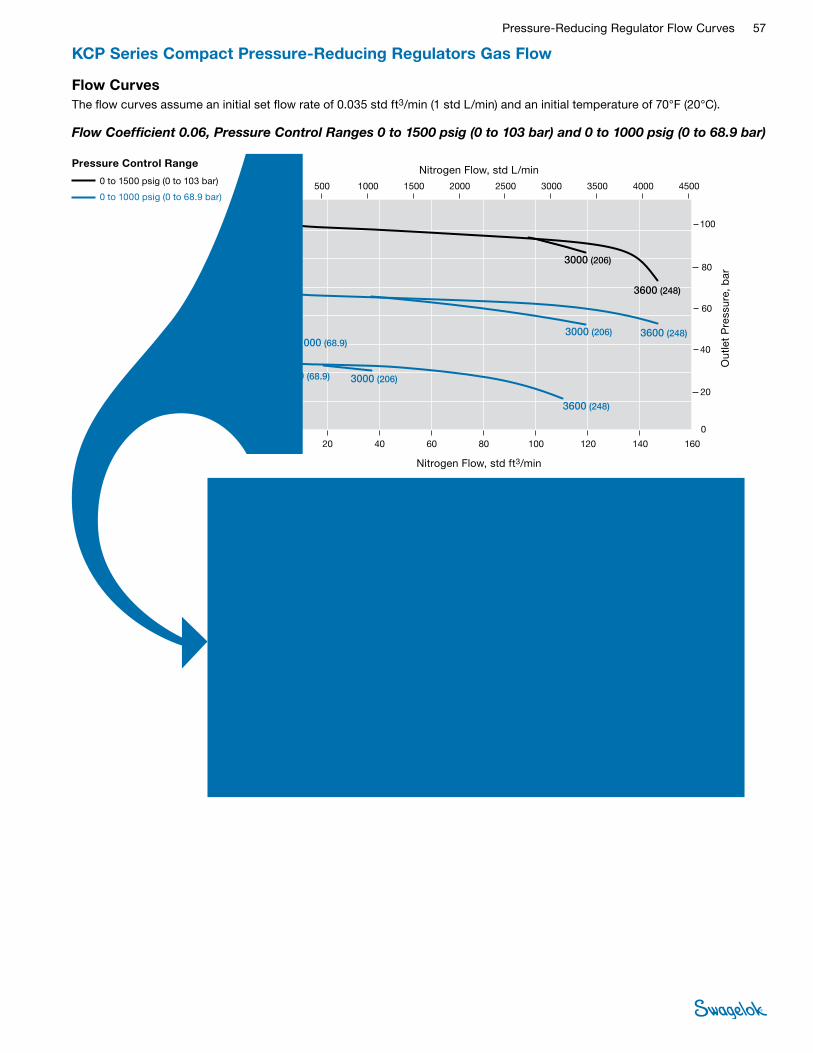
Pressure-Reducing Regulator Flow Curves 57
KCP Series Compact Pressure-Reducing Regulators Gas Flow
Flow CurvesThe flow curves assume an initial set flow rate of 0.035 std ft3/min (1 std L/min) and an initial temperature of 70°F (20°C).
Pressure Control Range
0 to 1500 psig (0 to 103 bar)
0 to 1000 psig (0 to 68.9 bar)
Flow Coefficient 0.06, Pressure Control Ranges 0 to 1500 psig (0 to 103 bar) and 0 to 1000 psig (0 to 68.9 bar)
0
0 20 40 60 80 120100 140 160
0
0 500 1000 1500 2500 3000 3500 4000 45002000
0
0 20 40 60 80 120100 140 160
0
0 500 1000 1500 2500 3000 3500 4000 45002000
JPN
200
400
600
800
1000
1600
1200
1400
EURO
20
40
60
100
80
200
400
600
800
1000
1600
1200
1400
20
60
80
100
40
0
0 500 1000 1500 2500 3000 3500 4000 45002000
2.0
4.0
6.0
10
8.0
USA
1000 (68.9)
1000 (68.9) 3000 (206)
3000 (206)
3000 (206)
3600 (248)
3600 (248)
3600 (248)
68.9 (1000)
68.9 (1000)
206 (3000)
206 (3000)
206 (3000)
248 (3600)
248 (3600)
248 (3600)
6.89
6.89
20.6
20.6
20.6
24.8
24.8
24.8
Nitrogen Flow, std ft3/min
Out
let
Pre
ssur
e, p
sig
Out
let
Pre
ssur
e, b
ar
Nitrogen Flow, std L/min
0
200
400
600
800
1000
1600
0
0
20
40
60
100
0
0
0
0
20
60
80
100
0
USA
JPN
1200
1400
80
200
400
600
800
1000
1200
1400
40
EURO
1600
2.0 4.0 6.0 8.0 10
160 28012040 80 240200
2,0 4,0 6,0 8,0 10
160 28012040 80 240200
0
2.0
6.0
8.0
10
0
4.0
160 28012040 80 240200
20.6, 24.8
1000 (68.9)
1000 (68.9)
3000 (206),3600 (248)
3000 (206),3600 (248)
3000 (206),3600 (248)
206 (3000), 248 (3600)
206 (3000), 248 (3600)
206 (3000), 248 (3600)
68.9 (1000)
68.9 (1000)
20.6, 24.8
20.6, 24.8
6.89
6.89
Nitrogen Flow, std ft3/min
Out
let
Pre
ssur
e, p
sig
Out
let
Pre
ssur
e, b
ar
Nitrogen Flow, std L/minDetail A
A

58 Pressure-Reducing Regulator Flow Curves
KCP Series Compact Pressure-Reducing Regulators Gas Flow
Flow CurvesThe flow curves assume an initial set flow rate of 0.035 std ft3/min (1 std L/min) and an initial temperature of 70°F (20°C).
Pressure Control Range
0 to 25 psig (0 to 1.7 bar)
0 to 10 psig (0 to 0.68 bar)
Flow Coefficient 0.20, Pressure Control Ranges 0 to 25 psig (0 to 1.7 bar) and 0 to 10 psig (0 to 0.68 bar)
0
0 2.0 4.0 6.0 8.0
0
0 40 80 120 160 200
0
0
0
0
JPN
EURO
USA
2,0 4,0 6,0 8,0
40 80 120 160 200
5.0
10
15
20
25
30
0.5
1.0
1.5
2.0
0,5
1,0
1,5
2,0
5,0
10
15
20
25
30
0
0 40 80 120 160 200
0.05
0.10
0.15
0.20
100 (6.8)
50 (3.4)
500 (34.4), 1000 (68.9),3600 (248)
500 (34.4)3600 (248)
50 (3.4), 100 (6.8)
500 (34.4), 1000 (68.9)
50 (3.4), 100 (6.8), 3600 (248)
3.4 (50)
6.8 (100)
34.4 (500), 68.9 (1000),248 (3600)
34.4 (500)248 (3600)
3.4 (50), 6.8 (100)
3.4 (50), 6.8 (100),248 (3600) 34.4 (500),
68.9 (1000)
3.44, 6.89, 24.8
0.34
0.68
6.89
1000 (68.9)
68.9 (1000)
3.4424.8
0.34, 0.68,24.8 3.44,
6.890.34, 0.68
Nitrogen Flow, std ft3/min
Out
let
Pre
ssur
e, p
sig
Out
let
Pre
ssur
e, b
ar
Nitrogen Flow, std L/min
0
0 0.5 1.0 1.5 2.0
0
0 10 20 30 40 50
0
0
0
0
JPN
EURO
USA
0.5 1.0 1.5 2.0
10 20 30 40 50
5.0
10
15
20
25
30
0.5
1.0
1.5
2.0
0.5
1.0
1.5
2.0
5.0
10
15
20
25
30
0
0 10 20 30 40 50
0.05
0.10
0.15
0.20
500 (34.4), 1000 (68.9), 3600 (248)
100 (6.8)
50 (3.4)
1000 (68.9)
50 (3.4), 100 (6.8), 3600 (248) 500 (34.4), 1000 (68.9)
50 (3.4), 100 (6.8)
500 (34.4), 3600 (248)
34.4 (500), 68.9 (1000), 248 (3600)
3.4 (50)
6.8 (100)
68.9 (1000)
34.4 (500), 68.9 (1000)
3.4 (50), 6.8 (100)
3.4 (50), 6.8 (100), 248 (3600)
34.4 (500), 248 (3600)
3.44, 6.89, 24.8
0.34
0.68
6.89
0.34, 0.68, 24.8 3.44, 6.89
3.44, 24.8
0.34, 0.68
Nitrogen Flow, std ft3/min
Out
let
Pre
ssur
e, p
sig
Out
let
Pre
ssur
e, b
ar
Nitrogen Flow, std L/minDetail A
A

Pressure-Reducing Regulator Flow Curves 59
KCP Series Compact Pressure-Reducing Regulators Gas Flow
Flow CurvesThe flow curves assume an initial set flow rate of 0.035 std ft3/min (1 std L/min) and an initial temperature of 70°F (20°C).
Pressure Control Range
0 to 100 psig (0 to 6.8 bar)
0 to 50 psig (0 to 3.4 bar)
Flow Coefficient 0.20, Pressure Control Ranges 0 to 100 psig (0 to 6.8 bar) and 0 to 50 psig (0 to 3.4 bar)
0
0 5.0 10 15 20
0
0 100 200 300 400 500
0
0
0
0
JPN
EURO
USA
5,0 10 15 20
100 200 300 400 500
20
40
60
80
100
120
2.0
4.0
6.0
8.0
2,0
4,0
6,0
8,0
20
40
60
80
100
120
0
0 100 200 300 400 500
0.2
0.4
0.6
0.8
100 (6.8)
500 (34.4), 1000 (68.9),3600 (248)
50 (3.4) 100 (6.8)
500 (34.4), 1000 (68.9), 3600 (248)
500 (34.4), 1000 (68.9)3600 (248)
50 (3.4) 100 (6.8)
6.8 (100)
34.4 (500), 68.9 (1000),248 (3600)
34.4 (500), 68.9 (1000), 248 (3600)
34.4 (500), 68.9 (1000)248 (3600)3.4 (50) 6.8 (100)
3.4 (50) 6.8 (100)
0.68
3.44, 6.89, 24.8
3.44, 6.89, 24.8
3.44, 6.8924.80.34 0.68
0.34 0.68
Nitrogen Flow, std ft3/min
Out
let
Pre
ssur
e, p
sig
Out
let
Pre
ssur
e, b
ar
Nitrogen Flow, std L/min
0
20
40
60
80
100
120
0 1.0 2.0 3.0 4.0 5.0
0
2.0
4.0
6.0
8.0
0 80 14060
0
20
40
60
80
100
0 1,0 2,0 3,0 4,0 5,0
0
2,0
4,0
6,0
8,0
0
USA
EURO
JPN
20 40 120100
80 1406020 40 120100
0
0.2
0.4
0.6
0.8
0 80 1406020 40 120100
120
500 (34.4), 1000 (68.9), 3600 (248)
100 (6.8)
100 (6.8), 500 (34.4), 1000 (68.9), 3600 (248)
500 (34.4), 1000 (68.9), 3600 (248)50 (3.4)
50 (3.4) 100 (6.8)
34.4 (500), 68.9 (1000), 248 (3600)
6.8 (100)
6.8 (100), 34.4 (500), 68.9 (1000), 248 (3600)
34.4 (500), 68.9 (1000), 248 (3600)
3.4 (50)
6.8 (100)3.4 (50)
3.44, 6.89, 24.8
0.68
0.68, 3.44, 6.89, 24.8
0.34
0.34 0.68
3.44, 6.89, 24.8
Nitrogen Flow, std ft3/min
Out
let
Pre
ssur
e, p
sig
Out
let
Pre
ssur
e, b
ar
Nitrogen Flow, std L/minDetail A
A

60 Pressure-Reducing Regulator Flow Curves
KCP Series Compact Pressure-Reducing Regulators Gas Flow
Flow CurvesThe flow curves assume an initial set flow rate of 0.035 std ft3/min (1 std L/min) and an initial temperature of 70°F (20°C).
Pressure Control Range
0 to 500 psig (0 to 34.4 bar)
0 to 250 psig (0 to 17.2 bar)
Flow Coefficient 0.20, Pressure Control Ranges 0 to 500 psig (0 to 34.4 bar) and 0 to 250 psig (0 to 17.2 bar)
0
100
200
300
400
500
600
0 20 40 60 10080 120
0
10
20
30
40
0 800 2400 32001600
0
100
200
300
400
500
0 20 40 60 80 120100
0
10
20
30
40
0 800 2400 32001600
USA
JPN
EURO
600
0
1.0
2.0
3.0
4.0
0 800 2400 32001600
LJ
1000 (68.9)
3600 (248)
500 (34.4)
1000 (68.9)3600 (248)
500(34.4)
1000(68.9)
3600 (248)
500 (34.4)
248 (3600)
34.4 (500)68.9 (1000)
248 (3600)
34.4 (500)68.9 (1000)
248 (3600)
34.4 (500)
68.9 (1000)
3.446.89
24.8
3.44 6.8924.8
24.8
3.44
6.89
Nitrogen Flow, std ft3/min
Out
let
Pre
ssur
e, p
sig
Out
let
Pre
ssur
e, b
ar
Nitrogen Flow, std L/min
0
0 5.0 10 15 20
0
0 100 200 300 400 500
0
0
0 0
JPN
EURO
USA
5,0 10 15 20
100 200 300 400 500
100
200
300
400
500
600
10
20
30
40
10
20
30
40
100
200
300
400
500
600
0 0 100 200 300 400 500
1.0
2.0
3.0
4.0
1000 (68.9), 3600 (248)
500 (34.4)
3600 (248)
3600 (248)500 (34.4)
500 (34.4)
1000 (68.9)
1000 (68.9)
68.9 (1000), 248 (3600)
34.4 (500)
248 (3600)
248 (3600)
34.4 (500)
34.4 (500) 68.9 (1000)
68.9 (1000)
6.89, 24.8
3.44
24.8
24.83.44
3.44 6.89
6.89
Nitrogen Flow, std ft3/min
Out
let
Pre
ssur
e, p
sig
Out
let
Pre
ssur
e, b
ar
Nitrogen Flow, std L/minDetail A
A
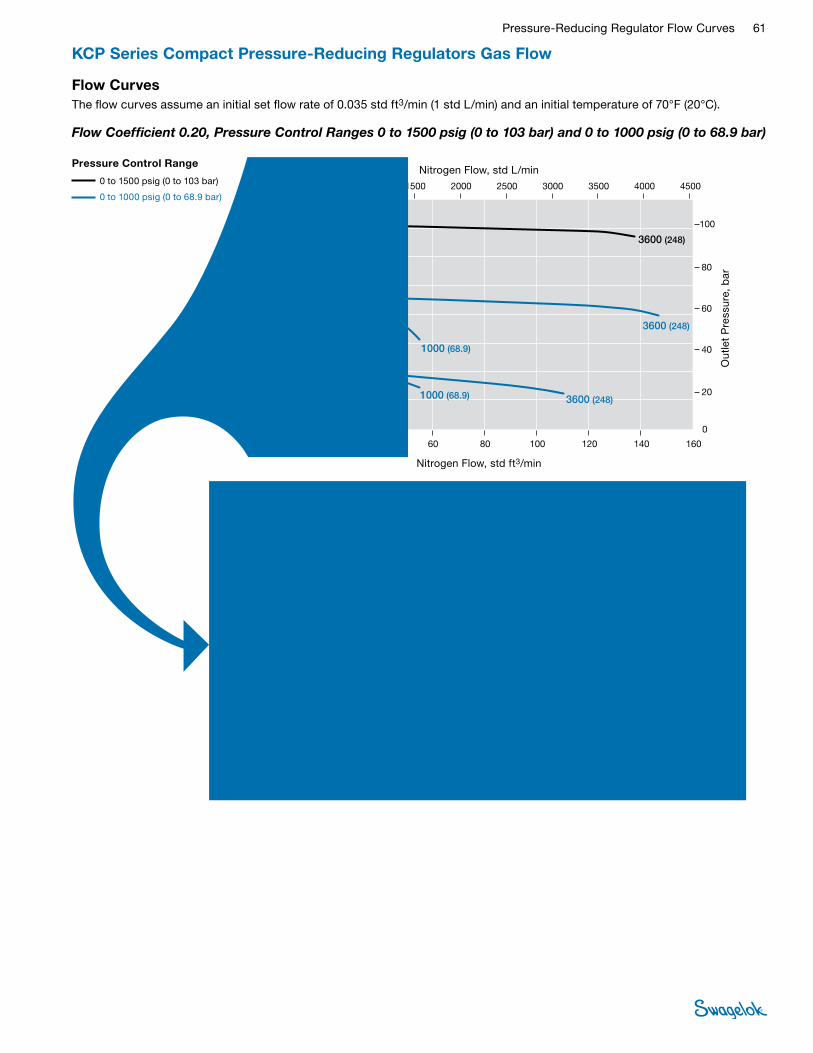
Pressure-Reducing Regulator Flow Curves 61
KCP Series Compact Pressure-Reducing Regulators Gas Flow
Flow CurvesThe flow curves assume an initial set flow rate of 0.035 std ft3/min (1 std L/min) and an initial temperature of 70°F (20°C).
Pressure Control Range
0 to 1500 psig (0 to 103 bar)
0 to 1000 psig (0 to 68.9 bar)
Flow Coefficient 0.20, Pressure Control Ranges 0 to 1500 psig (0 to 103 bar) and 0 to 1000 psig (0 to 68.9 bar)
0
0 20 40 60 80 120100 140 160
0
0 500 1000 1500 2500 3000 3500 4000 45002000
0
0 20 40 60 80 120100 140 160
0 0 500 1000 1500 2500 3000 3500 4000 45002000
JPN
200
400
600
800
1000
1600
1200
1400
EURO
20
40
60
100
80
200
400
600
800
1000
1600
1200
1400
20
60
80
100
40
0 0 500 1000 1500 2500 3000 3500 4000 45002000
2.0
4.0
6.0
10
8.0
USA
3600 (248)
3600 (248)
3600 (248)
1000 (68.9)
1000 (68.9)
248 (3600)
248 (3600)
248 (3600)68.9 (1000)
68.9 (1000)
24.8
24.8
24.8
6.89
6.89
Nitrogen Flow, std ft3/min
Out
let
Pre
ssur
e, p
sig
Out
let
Pre
ssur
e, b
ar
Nitrogen Flow, std L/min
0
200
400
600
800
1000
1600
0
0
20
40
60
100
0
0
0
0
20
60
80
100
0
USA
JPN
1200
1400
80
200
400
600
800
1000
1200
1400
40
EURO
1600
10 20 30 40 50
800 1400600200 400 12001000
10 20 30 40 50
800 1400600200 400 12001000
0
2.0
6.0
8.0
10
0
4.0
800 1400600200 400 12001000
3600 (248)
3600 (248)
1000 (68.9), 3600 (248)
1000 (68.9)
248 (3600)
248 (3600)
68.9 (1000), 248 (3600)
68.9 (1000)
24.8
24.8
6.89
6.89, 24.8
Nitrogen Flow, std ft3/min
Out
let
Pre
ssur
e, p
sig
Out
let
Pre
ssur
e, b
ar
Nitrogen Flow, std L/minDetail A
A

62 Pressure-Reducing Regulator Flow Curves
KCP Series Compact Pressure-Reducing Regulators Gas Flow
Flow CurvesThe flow curves assume an initial set flow rate of 0.035 std ft3/min (1 std L/min) and an initial temperature of 70°F (20°C).
Pressure Control Range
0 to 25 psig (0 to 1.7 bar)
0 to 10 psig (0 to 0.68 bar)
Flow Coefficient 0.50, Pressure Control Ranges 0 to 25 psig (0 to 1.7 bar) and 0 to 10 psig (0 to 0.68 bar)
0
5.0
10
15
20
25
30
0 2.0 4.0 6.0 8.0 10
0
0.5
1.0
1.5
2.0
0 160 280120
0
5,0
10
15
20
25
0 2,0 4,0 6,0 8,0 10
0
0,5
1,0
1,5
2,0
0
USA
EURO
JPN
40 80 240200
160 28012040 80 240200
0
0.05
0 160 28012040 80 240200
30
0.10
0.20
0.15
50 (3.4)
100 (6.8)
500 (34.4), 1000 (68.9),3600 (248)
500 (34.4), 1000 (68.9),3600 (248)
50 (3.4), 100 (6.8)
1000 (68.9)
500 (34.4)
50 (3.4), 100 (6.8), 3600 (248)
3.4 (50)
6.8 (100)
34.4 (500), 68.9 (1000),248 (3600)
34.4 (500), 68.9 (1000),248 (3600)
3.4 (50), 6.8 (100)
68.9 (1000)
34.4 (500)
3.4 (50), 6.8 (100), 248 (3600)
0.34
0.68
3.44, 6.89, 24.8
3.44, 6.89, 24.8
0.34, 0.68
0.34, 0.68, 24.8
3.446.89
Nitrogen Flow, std ft3/min
Out
let
Pre
ssur
e, p
sig
Out
let
Pre
ssur
e, b
ar
Nitrogen Flow, std L/min
0
0 0.5 1.0 1.5 2.0
0
0 10 20 30 40 50
0
0
0
0
JPN
EURO
USA
0,5 1,0 1,5 2,0
10 20 30 40 50
5.0
10
15
20
25
30
0.5
1.0
1.5
2.0
0,5
1,0
1,5
2,0
5,0
10
15
20
25
30
0
0 10 20 30 40 50
0.05
0.10
0.15
0.20
500 (34.4), 1000 (68.9), 3600 (248)
50 (3.4), 100 (6.8)
500 (34.4), 1000 (68.9)
50 (3.4), 100 (6.8), 3600 (248)
500 (34.4), 1000 (68.9), 3600 (248)
50 (3.4), 100 (6.8)
34.4 (500), 68.9 (1000), 248 (3600)
34.4 (500), 68.9 (1000), 248 (3600)
3.4 (50), 6.8 (100), 248 (3600)
34.4 (500),68.9 (1000)
3.4 (50), 6.8 (100)
3.44, 6.89, 24.8
3.44, 6.89, 24.80.34, 0.68
3.44, 6.89
0.34, 0.68, 24.8
0.34, 0.68
3.4 (50), 6.8 (100)
Nitrogen Flow, std ft3/min
Out
let
Pre
ssur
e, p
sig
Out
let
Pre
ssur
e, b
ar
Nitrogen Flow, std L/minDetail A
A

Pressure-Reducing Regulator Flow Curves 63
KCP Series Compact Pressure-Reducing Regulators Gas Flow
Flow CurvesThe flow curves assume an initial set flow rate of 0.035 std ft3/min (1 std L/min) and an initial temperature of 70°F (20°C).
Pressure Control Range
0 to 100 psig (0 to 6.8 bar)
0 to 50 psig (0 to 3.4 bar)
Flow Coefficient 0.50, Pressure Control Ranges 0 to 100 psig (0 to 6.8 bar) and 0 to 50 psig (0 to 3.4 bar)
0
20
40
60
80
100
120
0 5.0 10 15 2520 30
0
2.0
4.0
6.0
8.0
0 200 600 800400
0
20
40
60
80
100
0 5,0 10 15 20 3025
0
2,0
4,0
6,0
8,0
0 100 200 300 500 600 700 800400
0
0.2
0.4
0.6
0.8
0 100 200 300 500 600 700 800400
USA
JPN
100 300 500 700
EURO
120
3.4 (50)
100 (6.8)500 (34.4)
1000 (68.9),3600 (248)
50 (3.4)
50 (3.4)
100 (6.8)
100 (6.8)
500 (34.4), 1000 (68.9), 3600 (248)
3600 (248)
500 (34.4),1000 (68.9)
6.8 (100)
34.4 (500)
68.9 (1000),248 (3600)3.4 (50) 6.8 (100)
6.8 (100)
34.4 (500), 68.9 (1000)
248 (3600)
34.4 (500), 68.9 (1000), 248 (3600)
0.68
3.44
6.89,24.80.34 0.68
0.340.68 24.8
3.44, 6.89, 24.8
3.44, 6.89
Nitrogen Flow, std ft3/min
Out
let
Pre
ssur
e, p
sig
Out
let
Pre
ssur
e, b
ar
Nitrogen Flow, std L/min
0
20
40
60
80
100
120
0 1.0 2.0 3.0 4.0 5.0
0
2.0
4.0
6.0
8.0
0 80 14060
0
20
40
60
80
100
0 1,0 2,0 3,0 4,0 5,0
0
2,0
4,0
6,0
8,0
0
USA
EURO
JPN
20 40 120100
80 1406020 40 120100
0
0.2
0.4
0.6
0.8
0 80 1406020 40 120100
120
500 (34.4), 1000 (68.9), 3600 (248)
100 (6.8)100 (6.8), 500 (34.4), 1000 (68.9), 3600 (248)
50 (3.4)
50 (3.4) 100 (6.8)
500 (34.4), 1000 (68.9), 3600 (248)
34.4 (500), 68.9 (1000), 248 (3600)
6.8 (100)
3.4 (50)
3.4 (50)
6.8 (100)
34.4 (500), 68.9 (1000), 248 (3600)
6.8 (100), 34.4 (500), 68.9 (1000), 248 (3600)
3.44, 6.89, 24.8
6.890.68, 3.44, 6.89, 24.8
0.34
0.34
0.68
3.44, 6.89, 24.8
Nitrogen Flow, std ft3/min
Out
let
Pre
ssur
e, p
sig
Out
let
Pre
ssur
e, b
ar
Nitrogen Flow, std L/minDetail A
A

64 Pressure-Reducing Regulator Flow Curves
KCP Series Compact Pressure-Reducing Regulators Gas Flow
Flow CurvesThe flow curves assume an initial set flow rate of 0.035 std ft3/min (1 std L/min) and an initial temperature of 70°F (20°C).
Pressure Control Range
0 to 500 psig (0 to 34.4 bar)
0 to 250 psig (0 to 17.2 bar)
Flow Coefficient 0.50, Pressure Control Ranges 0 to 500 psig (0 to 34.4 bar) and 0 to 250 psig (0 to 17.2 bar)
0
100
200
300
400
500
600
0 20 40 60 10080 120
0
10
20
30
40
0 800 2400 32001600
0
100
200
300
400
500
0 20 40 60 80 120100
0
10
20
30
40
0 800 2400 32001600
USA
JPN
EURO
600
0
1.0
2.0
3.0
4.0
0 800 2400 32001600
500 (34.4)
1000 (68.9)
3600 (248)
3600 (248)500 (34.4)
500 (34.4)
1000 (68.9), 3600 (248)
1000 (68.9)
34.4 (500)
68.9 (1000)
248 (3600)
248 (3600)68.9 (1000)34.4 (500)
34.4 (500)
68.9 (1000), 248 (3600)
3.44
6.89
24.8
24.86.893.44
3.44 6.89, 24.8
Nitrogen Flow, std ft3/min
Out
let
Pre
ssur
e, p
sig
Out
let
Pre
ssur
e, b
ar
Nitrogen Flow, std L/min
0
100
200
300
400
500
600
0 1.0 2.0 3.0 4.0 5.0
0
10
20
30
40
0 80 14060
0
100
200
300
400
500
0 1,0 2,0 3,0 4,0 5,0
0
10
20
30
40
0
USA
EURO
JPN
20 40 120100
80 1406020 40 120100
0
1.0
2.0
3.0
4.0
0 80 1406020 40 120100
600
500 (34.4), 1000 (68.9), 3600 (248)
1000 (68.9), 3600 (248)
500 (34.4)
500 (34.4), 1000 (68.9), 3600 (248)
34.4 (500), 68.9 (1000), 248 (3600)
34.4 (500), 68.9 (1000), 248 (3600)
34.4 (500)
68.9 (1000), 248 (3600)
3.44, 6.89, 24.8
3.44, 6.89, 24.8
3.44
6.89, 24.8
Nitrogen Flow, std ft3/min
Out
let
Pre
ssur
e, p
sig
Out
let
Pre
ssur
e, b
ar
Nitrogen Flow, std L/minDetail A
A

Pressure-Reducing Regulator Flow Curves 65
KCP Series Compact Pressure-Reducing Regulators Gas Flow
Flow CurvesThe flow curves assume an initial set flow rate of 0.035 std ft3/min (1 std L/min) and an initial temperature of 70°F (20°C).
Pressure Control Range
0 to 1500 psig (0 to 103 bar)
0 to 1000 psig (0 to 68.9 bar)
Flow Coefficient 0.50, Pressure Control Ranges 0 to 1500 psig (0 to 103 bar) and 0 to 1000 psig (0 to 68.9 bar)
0
200
400
600
800
1000
1600
0 50 100 150 250200 300
0
20
40
60
100
0 2000 6000 80004000
0
0 50 100 150 200 300250
0
20
60
80
100
0 1000 2000 3000 5000 6000 7000 80004000
USA
JPN
1000 3000 5000 7000
1200
1400
80
200
400
600
800
1000
1200
1400
40
0
2.0
6.0
8.0
10
0 1000 2000 3000 5000 6000 7000 80004000
4.0
EURO
1600
1000 (68.9), 3600 (248)
3600 (248)
3600 (248)
1000 (68.9)
1000 (68.9)
68.9 (1000), 248 (3600)
248 (3600)
248 (3600)
68.9 (1000)
68.9 (1000)
6.89, 24.8
24.8
24.8
6.89
6.89
Nitrogen Flow, std ft3/min
Out
let
Pre
ssur
e, p
sig
Out
let
Pre
ssur
e, b
ar
Nitrogen Flow, std L/min
0
200
400
600
800
1000
1600
0
0
20
40
60
100
0
0
0
0
20
60
80
100
0
USA
JPN
1200
1400
80
200
400
600
800
1000
1200
1400
40
EURO
1600
10 20 30 40 50
800 1400600200 400 12001000
10 20 30 40 50
800 1400600200 400 12001000
0
2.0
6.0
8.0
10
0
4.0
800 1400600200 400 12001000
1000 (68.9), 3600 (248)
1000 (68.9), 3600 (248)
1000 (68.9), 3600 (248)
68.9 (1000), 248 (3600)
68.9 (1000), 248 (3600)
68.9 (1000), 248 (3600)
6.89, 24.8
6.89, 24.8
6.89, 24.8
Nitrogen Flow, std ft3/min
Out
let
Pre
ssur
e, p
sig
Out
let
Pre
ssur
e, b
ar
Nitrogen Flow, std L/minDetail A
A

66 Pressure-Reducing Regulator Flow Curves
KPP Series Medium- to High-Pressure Pressure-Reducing Regulators Gas Flow
Flow CurvesThe flow curves assume an initial set flow rate of 0.035 std ft3/min (1 std L/min) and an initial temperature of 70°F (20°C).
The KPP series meets the demands of a wide range of gas or liquid applications in a lightweight, compact installation footprint. These features make the KPP pressure regulator an ideal pressure control solution within high-density OEM equipment.
For features, additional technical data, materials of construction, and ordering information, see the Swagelok Pressure Regulators catalog, MS-02-230.
Pressure Control Range
0 to 1000 psig (0 to 68.9 bar)
Flow Coefficient 0.02, Pressure Control Range 0 to 1000 psig (0 to 68.9 bar)
0
200
400
600
800
1000
1200
0 5.0 10 15 2520 30
0
20
40
60
80
0 200 600 800400
0
200
400
600
800
1000
0 5.0 10 15 20 3025
0
20
40
60
80
0 100 200 300 500 600 700 800400
0
2.0
4.0
6.0
8.0
0 100 200 300 500 600 700 800400
USA
JPN
100 300 500 700
1200
EURO
J
1000 (68.9)
1000 (68.9)
1000 (68.9)
500 (34.4)
500 (34.4)
3600 (248), 6000 (413)
3600 (248), 6000 (413)
3600 (248), 6000 (413)
68.9 (1000)
68.9 (1000)
68.9 (1000)
34.4 (500)
34.4 (500)
248 (3600), 413 (6000)
248 (3600), 413 (6000)
248 (3600), 413 (6000)
6.89
6.89
6.89
3.44
3.44
24.8, 41.3
24.8, 41.3
24.8, 41.3
Nitrogen Flow, std ft3/min
Out
let
Pre
ssur
e, p
sig
Out
let
Pre
ssur
e, b
ar
Nitrogen Flow, std L/min
0
200
400
600
800
1000
1200
0 2.0 4.0 6.0 8.0 10
0
20
40
60
80
0 160 280120
0
200
400
600
800
1000
0 2.0 4.0 6.0 8.0 10
0
20
40
60
80
0
USA
EURO
JPN
40 80 240200
1200
160 28012040 80 240200
0
2.0
4.0
6.0
8.0
0 160 28012040 80 240200
J
J
500 (34.4)
500 (34.4) 1000 (68.9)
1000 (68.9)
1000 (68.9)
3600 (248), 6000 (413)
3600 (248), 6000 (413)
3600 (248), 6000 (413)
248 (3600), 413 (6000)
248 (3600), 413 (6000)
248 (3600), 413 (6000)
68.9 (1000)
68.9 (1000)
68.9 (1000)34.4 (500)
34.4 (500)
24.8, 41.3
24.8, 41.3
24.8, 41.3
6.89
6.89
6.89
3.44
3.44
Nitrogen Flow, std ft3/min
Out
let
Pre
ssur
e, p
sig
Out
let
Pre
ssur
e, b
ar
Nitrogen Flow, std L/min
Supply-Pressure Effect
Flow Coefficient
(Cv )
Supply Pressure Effect, %
0.02 2.2
0.06 7.2
Detail A
A
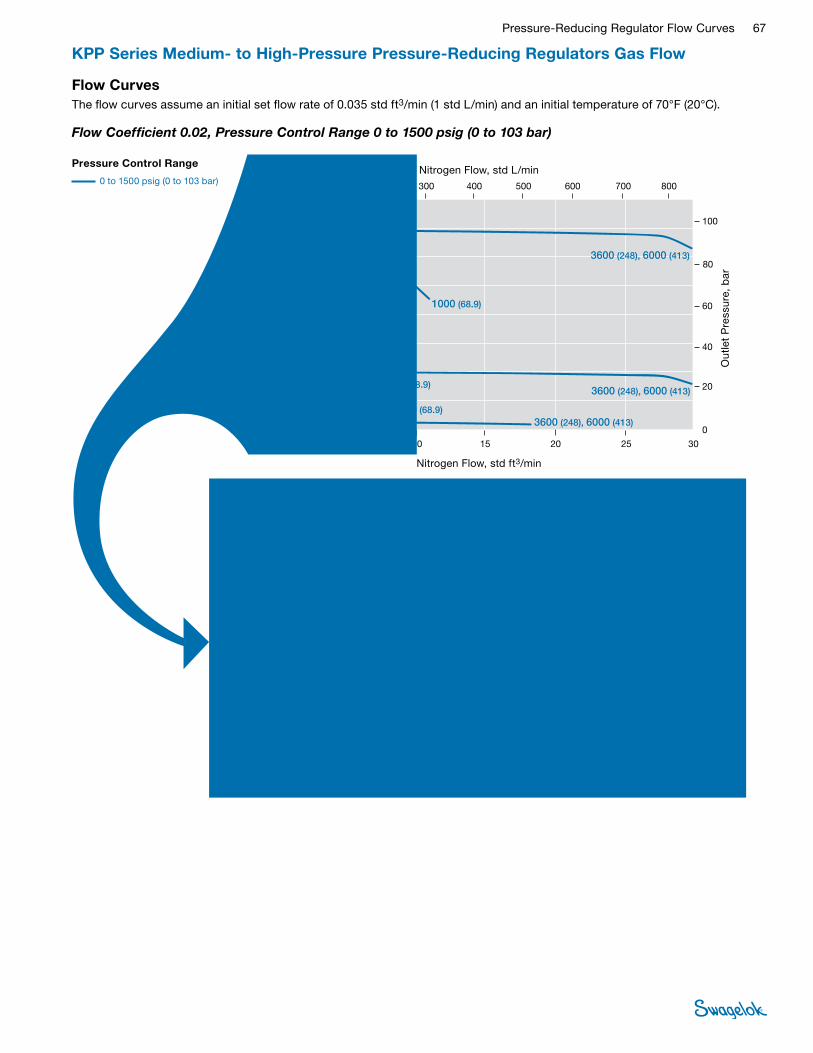
Pressure-Reducing Regulator Flow Curves 67
KPP Series Medium- to High-Pressure Pressure-Reducing Regulators Gas Flow
Flow CurvesThe flow curves assume an initial set flow rate of 0.035 std ft3/min (1 std L/min) and an initial temperature of 70°F (20°C).
Pressure Control Range
0 to 1500 psig (0 to 103 bar)
Flow Coefficient 0.02, Pressure Control Range 0 to 1500 psig (0 to 103 bar)
0
200
400
600
800
1000
1600
0 5.0 10 15 2520 30
0
20
40
60
100
0 200 600 800400
0
0 5.0 10 15 20 3025
0
20
60
80
100
0 100 200 300 500 600 700 800400
USA
JPN
100 300 500 700
1200
1400
80
200
400
600
800
1000
1200
1400
40
0
2.0
6.0
8.0
10
0 100 200 300 500 600 700 800400
4.0
EURO
1600
500 (34.4)
500 (34.4) 1000 (68.9)
1000 (68.9)3600 (248), 6000 (413)
3600 (248), 6000 (413)
3600 (248), 6000 (413)
1000 (68.9)
34.4 (500)
34.4 (500)
68.9 (1000)
68.9 (1000)
68.9 (1000)
248 (3600), 413 (6000)
248 (3600), 413 (6000)
248 (3600), 413 (6000)
24.8, 41.3
24.8, 41.3
24.8, 41.3
6.89
6.89
6.89
3.44
3.44
Nitrogen Flow, std ft3/min
Out
let
Pre
ssur
e, p
sig
Out
let
Pre
ssur
e, b
ar
Nitrogen Flow, std L/min
0
200
400
600
800
1000
1600
0
0
20
40
60
100
0
0
0
0
20
60
80
100
0
USA
JPN
1200
1400
80
200
400
600
800
1000
1200
1400
40
EURO
1600
2.0 4.0 6.0 8.0 10
160 28012040 80 240200
2,0 4,0 6,0 8,0 10
160 28012040 80 240200
0
2.0
6.0
8.0
10
0
4.0
160 28012040 80 240200
500 (34.4)
500 (34.4)
1000 (68.9)
1000 (68.9)
3600 (248), 6000 (413)
1000 (68.9)
3600 (248), 6000 (413)
3600 (248), 6000 (413)
248 (3600), 413 (6000)
248 (3600), 413 (6000)
248 (3600), 413 (6000)
68.9 (1000)
68.9 (1000)
68.9 (1000)
34.4 (500)
34.4 (500)
24.8, 41.3
24.8, 41.3
24.8, 41.3
6.89
6.89
6.89
3.44
3.44
Nitrogen Flow, std ft3/min
Out
let
Pre
ssur
e, p
sig
Out
let
Pre
ssur
e, b
ar
Nitrogen Flow, std L/minDetail A
A

68 Pressure-Reducing Regulator Flow Curves
KPP Series Medium- to High-Pressure Pressure-Reducing Regulators Gas Flow
Flow CurvesThe flow curves assume an initial set flow rate of 0.035 std ft3/min (1 std L/min) and an initial temperature of 70°F (20°C).
Pressure Control Range
0 to 2000 psig (0 to 137 bar)
Flow Coefficient 0.02, Pressure Control Range 0 to 2000 psig (0 to 137 bar)
0
500
1000
2000
0 5.0 10 15 2520 30
0
20
40
60
120
0 200 600 800400
0
0 5,0 10 15 20 3025
0 0 100 200 300 500 600 700 800400
USA
JPN
100 300 500 700
1500100
EURO
80
20
40
60
120
100
80
500
1000
2000
1500
0 0 100 200 300 500 600 700 800400
2.0
4.0
6.0
12
10
8.0
J
J L P, R, W
3000 (206)
3600 (248), 6000 (413)
3600 (248), 6000 (413)
3000 (206)
3000 (206)
3600 (248), 6000 (413)
3000 (206),3600 (248), 6000 (413)
1000 (68.9)
1000 (68.9)
1000 (68.9)500 (34.4)
500 (34.4)
206 (3000)
248 (3600), 413 (6000)
248 (3600), 413 (6000)
248 (3600), 413 (6000)
206 (3000)
206 (3000)206 (3000), 248 (3600), 413 (6000)
68.9 (1000)
68.9 (1000)
68.9 (1000)34.4 (500)
34.4 (500)
24.8, 41.3
20.6
20.6
20.6
24.8, 41.3
24.8, 41.3
6.89
6.89
6.893.443.44
Nitrogen Flow, std ft3/min
Out
let
Pre
ssur
e, p
sig
Out
let
Pre
ssur
e, b
ar
Nitrogen Flow, std L/min
0
500
1000
2000
0 100
20
40
60
120
0
0
0
0 0
USA
JPN
1500100
EURO
80
20
40
60
120
100
80
500
1000
2000
1500
2.0 4.0 6.0 8.0
160 28012040 80 240200
102,0 4,0 6,0 8,0
160 28012040 80 240200
0 0
2.0
4.0
6.0
12
10
8.0
160 28012040 80 240200LJ
3000 (206), 3600 (248), 6000 (413)
3000 (206), 3600 (248), 6000 (413)
3000 (206), 3600 (248), 6000 (413)
3000 (206), 3600 (248), 6000 (413)
1000 (68.9)
1000 (68.9)
1000 (68.9)500 (34.4)500 (34.4)
206 (3000), 248 (3600), 413 (6000)
206 (3000), 248 (3600), 413 (6000)
206 (3000), 248 (3600), 413 (6000)
206 (3000), 248 (3600), 413 (6000)
68.9 (1000)
68.9 (1000)
68.9 (1000)34.4 (500)34.4 (500)
20.6, 24.8, 41.3
20.6, 24.8, 41.3
20.6, 24.8, 41.3
20.6, 24.8, 41.3
6.89
6.893.443.44 6.89
Nitrogen Flow, std ft3/min
Out
let
Pre
ssur
e, p
sig
Out
let
Pre
ssur
e, b
ar
Nitrogen Flow, std L/minDetail A
A

Pressure-Reducing Regulator Flow Curves 69
KPP Series Medium- to High-Pressure Pressure-Reducing Regulators Gas Flow
Flow CurvesThe flow curves assume an initial set flow rate of 0.035 std ft3/min (1 std L/min) and an initial temperature of 70°F (20°C).
Pressure Control Range
0 to 3600 psig (0 to 248 bar)
0 to 3000 psig (0 to 206 bar)
Flow Coefficient 0.02, Pressure Control Ranges 0 to 3600 psig (0 to 248 bar) and 0 to 3000 psig (0 to 206 bar)
0
0 5.0 10 15 20 3025 35 40
0
0 200 600 800400
0
0 5,0 10 15 20 3025 35 40
0 0 200 400 600 800 1000
JPN
500
1000
1500
2000
2500
4000
3000
3500
EURO
500
1000
1500
2000
2500
4000
3000
3500
50
150
200
250
100
USA
1000
50
150
200
250
100
0 0 200 400 600 800 1000
5.0
15
20
25
10
3600 (248), 6000 (413)
3600 (248), 6000 (413)
3600 (248), 6000 (413)
3600 (248), 6000 (413)
3600 (248), 6000 (413)
3000 (206)
3000 (206)
3000 (206)
1000 (68.9)
1000 (68.9)
3600 (248), 6000 (413)500 (34.4)
248 (3600), 413 (6000)
248 (3600), 413 (6000)
248 (3600), 413 (6000)
248 (3600), 413 (6000)
248 (3600), 413 (6000)
206 (3000)
206 (3000)
206 (3000)68.9 (1000)
68.9 (1000)
248 (3600), 413 (6000)34.4 (500)
24.8, 41.3
24.8, 41.3
24.8, 41.3
24.8, 41.3
24.8, 41.3
20.6
20.6
20.66.89
6.8924.8, 41.3
3.44
Nitrogen Flow, std ft3/min
Out
let
Pre
ssur
e, p
sig
Out
let
Pre
ssur
e, b
ar
Nitrogen Flow, std L/min
0
500
1000
1500
2000
2500
4000
00
50
100
150
250
0
0
0
0
50
150
200
250
0
USA
JPN
3000
3500
200
500
1000
1500
2000
2500
3000
3500
100
EURO
4000
2.0 4.0 6.0 8.0 10
160 28012040 80 240200
2,0 4,0 6,0 8,0 10
160 28012040 80 240200
0
5.0
15
20
25
0
10
160 28012040 80 240200
3600 (248), 6000 (413)
3000 (206), 3600 (248), 6000 (413)
3000 (206), 3600 (248), 6000 (413)
3000 (206), 3600 (248), 6000 (413)
3600 (248), 6000 (413)
500 (34.4)
1000 (68.9)
1000 (68.9)
3000 (206), 3600 (248), 6000 (413)
248 (3600), 413 (6000)
206 (3000), 248 (3600), 413 (6000)
206 (3000), 248 (3600), 413 (6000)
206 (3000), 248 (3600), 413 (6000)
206 (3000), 248 (3600), 413 (6000)
248 (3600), 413 (6000)68.9 (1000)
68.9 (1000)34.4 (500)
24.8, 41.3
20.6, 24.8, 41.3
20.6, 24.8, 41.3
20.6, 24.8, 41.3
20.6, 24.8, 41.3
24.8, 41.3
6.89
6.893.44
Nitrogen Flow, std ft3/min
Out
let
Pre
ssur
e, p
sig
Out
let
Pre
ssur
e, b
ar
Nitrogen Flow, std L/minDetail A
A
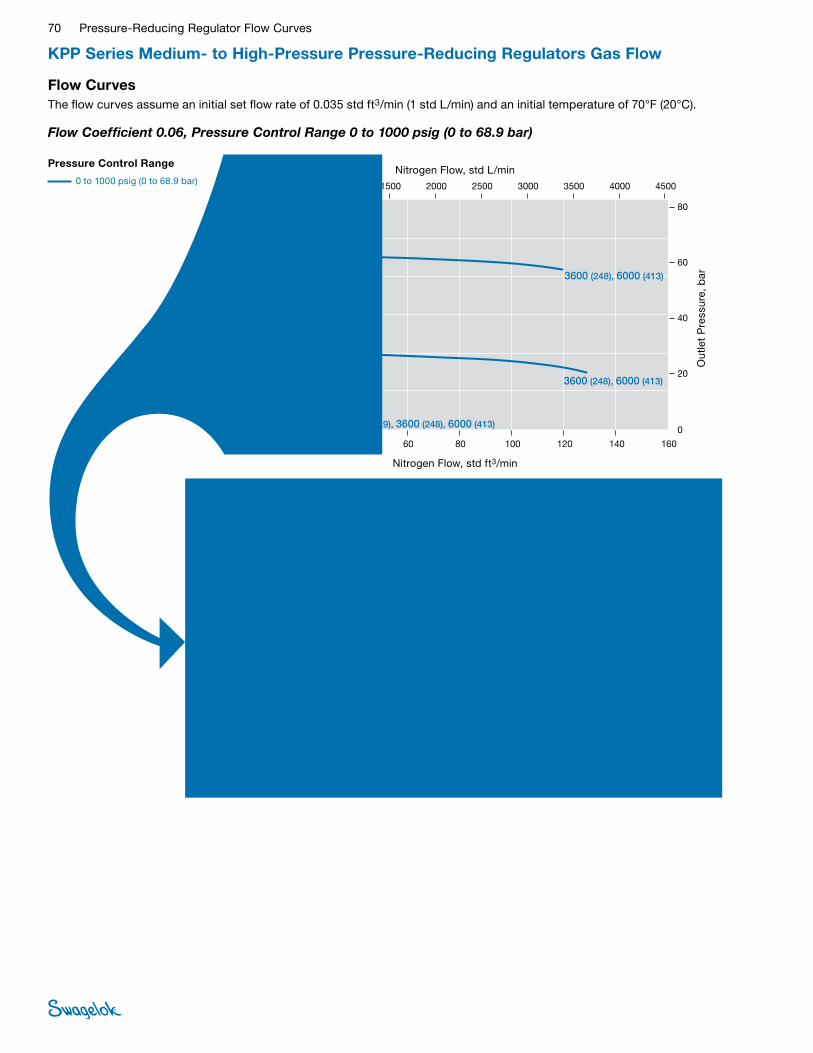
70 Pressure-Reducing Regulator Flow Curves
KPP Series Medium- to High-Pressure Pressure-Reducing Regulators Gas Flow
Flow CurvesThe flow curves assume an initial set flow rate of 0.035 std ft3/min (1 std L/min) and an initial temperature of 70°F (20°C).
Pressure Control Range
0 to 1000 psig (0 to 68.9 bar)
Flow Coefficient 0.06, Pressure Control Range 0 to 1000 psig (0 to 68.9 bar)
0
200
400
600
800
1000
1200
0 20 40 60 80 120100 140 160
0
20
40
60
80
0 500 1000 1500 2500 3000 3500 4000 45002000
0
200
400
600
800
1000
1200
0 20 40 60 80 120100 140 160
0
20
40
60
80
0 500 1000 1500 2500 3000 3500 4000 45002000
0
2.0
4.0
6.0
8.0
0 500 1000 1500 2500 3000 3500 4000 45002000
USA
EURO
JPN
3600 (248), 6000 (413)
3600 (248), 6000 (413)
1000 (68.9)
1000 (68.9)
500 (34.4), 1000 (68.9), 3600 (248), 6000 (413)
34.4 (500), 68.9 (1000), 248 (3600), 413 (6000)
248 (3600), 413 (6000)
248 (3600), 413 (6000)
68.9 (1000)
68.9 (1000)
24.8, 41.3
24.8, 41.3
3.44, 6.89, 24.8, 41.3
6.89
6.89
Nitrogen Flow, std ft3/min
Out
let
Pre
ssur
e, p
sig
Out
let
Pre
ssur
e, b
ar
Nitrogen Flow, std L/min
0
200
400
600
800
1000
1200
0 10 20 30 40 50
0
20
40
60
80
0 800 1400600
0
200
400
600
800
1000
0 10 20 30 40 50
0
20
40
60
80
0
USA
EURO
JPN
200 400 12001000
1200
800 1400600200 400 12001000
0
2.0
4.0
6.0
8.0
0 800 1400600200 400 12001000
1000 (68.9)
1000 (68.9) 3600 (248), 6000 (413)
3600 (248), 6000 (413)
500 (34.4), 1000 (68.9), 3600 (248), 6000 (413)
34.4 (500), 68.9 (1000), 248 (3600), 413 (6000)
68.9 (1000)
68.9 (1000)
248 (3600), 413 (6000)
248 (3600), 413 (6000)
3.44, 6.89, 24.8, 41.3
6.89
6.89
24.8, 41.3
24.8, 41.3
Nitrogen Flow, std ft3/min
Out
let
Pre
ssur
e, p
sig
Out
let
Pre
ssur
e, b
ar
Nitrogen Flow, std L/minDetail A
A
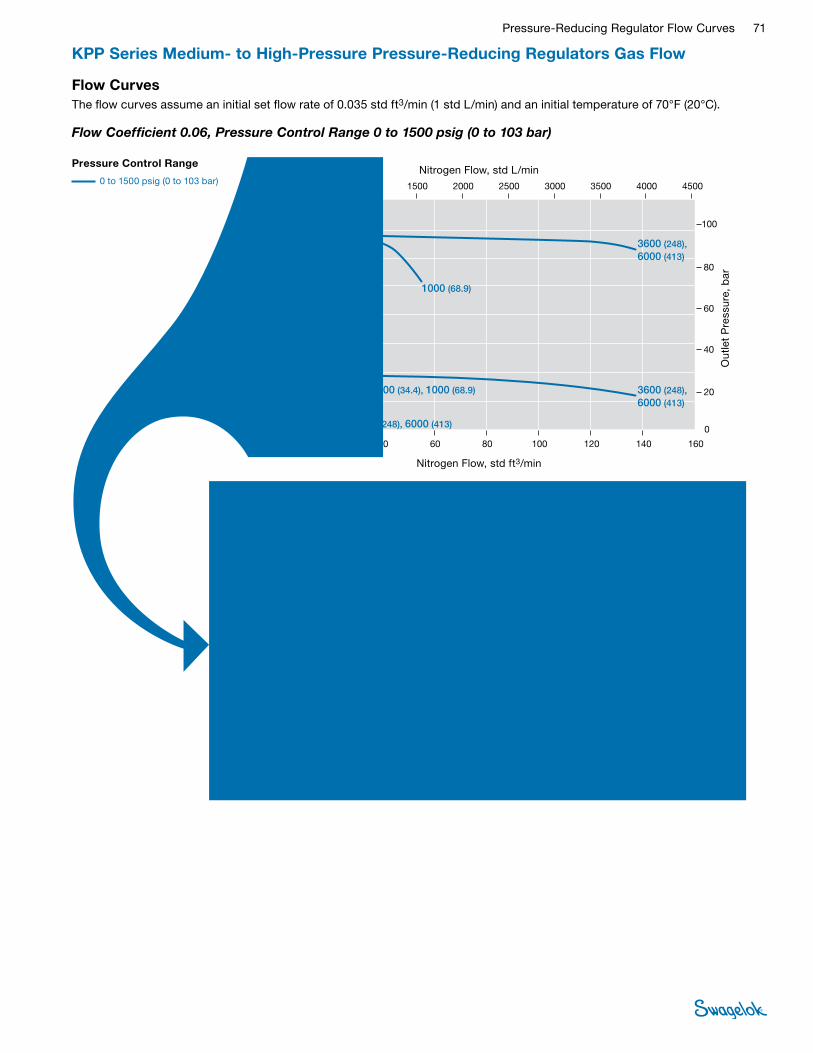
Pressure-Reducing Regulator Flow Curves 71
KPP Series Medium- to High-Pressure Pressure-Reducing Regulators Gas Flow
Flow CurvesThe flow curves assume an initial set flow rate of 0.035 std ft3/min (1 std L/min) and an initial temperature of 70°F (20°C).
Pressure Control Range
0 to 1500 psig (0 to 103 bar)
Flow Coefficient 0.06, Pressure Control Range 0 to 1500 psig (0 to 103 bar)
0
0 20 40 60 80 120100 140 160
0
0 500 1000 1500 2500 3000 3500 4000 45002000
0
0 20 40 60 80 120100 140 160
0 0 500 1000 1500 2500 3000 3500 4000 45002000
JPN
200
400
600
800
1000
1600
1200
1400
EURO
20
40
60
100
80
200
400
600
800
1000
1600
1200
1400
20
60
80
100
40
0 0 500 1000 1500 2500 3000 3500 4000 45002000
2.0
4.0
6.0
10
8.0
USA
1000 (68.9)
3600 (248), 6000 (413)
3600 (248), 6000 (413)
500 (34.4), 1000 (68.9)500 (34.4), 1000 (68.9)
3600 (248), 6000 (413)
34.4 (500), 68.9 (1000)
68.9 (1000)
34.4 (500), 68.9 (1000)
248 (3600), 413 (6000)
248 (3600), 413 (6000)
248 (3600), 413 (6000)
6.89
3.44, 6.893.44, 6.89
24.8, 41.3
24.8, 41.3
24.8, 41.3
Nitrogen Flow, std ft3/min
Out
let
Pre
ssur
e, p
sig
Out
let
Pre
ssur
e, b
ar
Nitrogen Flow, std L/min
0
0 10 20 30 40
0
0 200 400 600 800 1000
0
0
0 0
JPN
200
400
600
800
1000
1600
1200
1400
EURO
20
40
60
100
80
200
400
600
800
1000
1600
1200
1400
20
60
80
100
40
USA
10 20 30 40
200 400 600 800 1000
0 0
2.0
4.0
6.0
10
8.0
200 400 600 800 1000
1000 (68.9), 3600 (248), 6000 (413)
3600 (248), 6000 (413)
500 (34.4), 1000 (68.9)
3600 (248), 6000 (413)
500 (34.4), 1000 (68.9)
68.9 (1000), 248 (3600), 413 (6000)
248 (3600), 413 (6000)
248 (3600), 413 (6000)
34.4 (500), 68.9 (1000)34.4 (500), 68.9 (1000)
6.89, 24.8, 41.3
3.44, 6.89 3.44, 6.89
24.8, 41.3
24.8, 41.3
Nitrogen Flow, std ft3/min
Out
let
Pre
ssur
e, p
sig
Out
let
Pre
ssur
e, b
ar
Nitrogen Flow, std L/minDetail A
A

72 Pressure-Reducing Regulator Flow Curves
KPP Series Medium- to High-Pressure Pressure-Reducing Regulators Gas Flow
Flow CurvesThe flow curves assume an initial set flow rate of 0.035 std ft3/min (1 std L/min) and an initial temperature of 70°F (20°C).
Pressure Control Range
0 to 3600 psig (0 to 248 bar)
0 to 3000 psig (0 to 206 bar)
0 to 2000 psig (0 to 137 bar)
Flow Coefficient 0.06, Pressure Control Ranges 0 to 3600 psig (0 to 248 bar), 0 to 3000 psig (0 to 206 bar), and 0 to 2000 psig (0 to 137 bar)
0
0 20 40 60 80 120100 140 160
0
0 500 1000 1500 2500 3000 3500 4000 45002000
0
0 20 40 60 80 120100 140 160
0 0 500 1000 1500 2500 3000 3500 4000 45002000
JPN
500
1000
1500
2000
2500
4000
3000
3500
EURO
50
100
150
250
200
500
1000
1500
2000
2500
4000
3000
3500
50
150
200
250
100
0 0 500 1000 1500 2500 3000 3500 4000 45002000
5.0
10
15
25
20
USA
R, W
3600 (248), 6000 (413)
3600 (248), 6000 (413)
3000 (206)
3000 (206) 3600 (248), 6000 (413)
3000 (206), 3600 (248), , 6000 (413)
3000 (206), 3600 (248), , 6000 (413)1000 (68.9)
500 (34.4), 1000 (68.9)
3600 (248), 6000 (413)
248 (3600), 413 (6000)
248 (3600), 413 (6000)
248 (3600), 413 (6000)
206 (3000)
206 (3000)
206 (3000), 248 (3600), 413 (6000)
206 (3000), 248 (3600), 413 (6000)68.9 (1000)
248 (3600), 413 (6000)
34.4 (500), 68.9 (1000)
24.8, 41.3
24.8, 41.3
24.8, 41.320.6
20.6
20.6, 24.8, 41.3
20.6, 24.8, 41.3
6.89
24.8, 41.3
3.44, 6.89
Nitrogen Flow, std ft3/min
Out
let
Pre
ssur
e, p
sig
Out
let
Pre
ssur
e, b
ar
Nitrogen Flow, std L/min
0
0
0
0
0
0
0
0
JPN
500
1000
1500
2000
2500
4000
3000
3500
EURO
50
100
150
250
200
500
1000
1500
2000
2500
4000
3000
3500
50
150
200
250
100
USA
10 20 30 40 50
800 1400600200 400 12001000
10 20 30 40 50
800 1400600200 400 12001000
0 0
5.0
10
15
25
20
800 1400600200 400 12001000
3600 (248), 6000 (413)
3600 (248), 6000 (413)
3600 (248), 6000 (413)
3600 (248), 6000 (413)
3600 (248), 6000 (413)
1000 (68.9)
500 (34.4), 1000 (68.9)
3600 (248), 6000 (413)
248 (3600), 413 (6000)
248 (3600), 413 (6000)
248 (3600), 413 (6000)
248 (3600), 413 (6000)
248 (3600), 413 (6000)
68.9 (1000)
34.4 (500), 68.9 (1000)
248 (3600), 413 (6000)
24.8, 41.3
24.8, 41.3
24.8, 41.3
24.8, 41.3
24.8, 41.3
6.89
3.44, 6.8924.8, 41.3
Nitrogen Flow, std ft3/min
Out
let
Pre
ssur
e, p
sig
Out
let
Pre
ssur
e, b
ar
Nitrogen Flow, std L/minDetail A
A

Pressure-Reducing Regulator Flow Curves 73
KPF Series High-Flow Pressure-Reducing Regulators Gas Flow
Flow CurvesThe flow curves assume an initial set flow rate of 0.035 std ft3/min (1 std L/min) and an initial temperature of 70°F (20°C).
The KPF series provides minimum droop across the flow range with high accuracy of outlet pressure.)
For features, additional technical data, materials of construction, and ordering information, see the Swagelok Pressure Regulators catalog, MS-02-230.
Pressure Control Range
0 to 1000 psig (0 to 68.9 bar)
Flow Coefficient 1.0, Pressure Control Range 0 to 1000 psig (0 to 68.9 bar)
0
200
400
600
800
1000
1200
0 100 200 300 400 500
0
20
40
60
80
0 8000 14 0006000
0
200
400
600
800
1000
0 100 200 300 400 500
0
20
40
60
80
0
USA
EURO
JPN
2000 4000 12 00010 000
1200
8000 14 00060002000 4000 12 00010 000
0
2.0
4.0
6.0
8.0
0 8000 14 00060002000 4000 12 00010 000
3600 (248), 6000 (413)
3600 (248), 6000 (413)
500 (34.4)1000 (68.9)
1000 (68.9)
248 (3600), 413 (6000)
248 (3600), 413 (6000)
68.9 (1000)
68.9 (1000)
34.4 (500)
24.8, 41.3
24.8, 41.3
6.89
6.893.44
Nitrogen Flow, std ft3/min
Out
let
Pre
ssur
e, p
sig
Out
let
Pre
ssur
e, b
ar
Nitrogen Flow, std L/min
0
200
400
600
800
1000
1200
0 10 20 30 40 50
0
20
40
60
80
0 800 1400600
0
200
400
600
800
1000
0 10 20 30 40 50
0
20
40
60
80
0
USA
EURO
JPN
200 400 12001000
1200
800 1400600200 400 12001000
0
2.0
4.0
6.0
8.0
0 800 1400600200 400 12001000
3600 (248), 6000 (413)
1000 (68.9)
500 (34.4)
1000 (68.9), 3600 (248), 6000 (413)
68.9 (1000), 248 (3600), 413 (6000)
34.4 (500)
68.9 (1000)
248 (3600), 413 (6000)
6.89, 24.8, 41.3
3.44
6.89
24.8, 41.3
Nitrogen Flow, std ft3/min
Out
let
Pre
ssur
e, p
sig
Out
let
Pre
ssur
e, b
ar
Nitrogen Flow, std L/min
Supply-Pressure Effect
Flow Coefficient
(Cv )
Supply Pressure Effect, %
1.0 5.3
Detail A
A
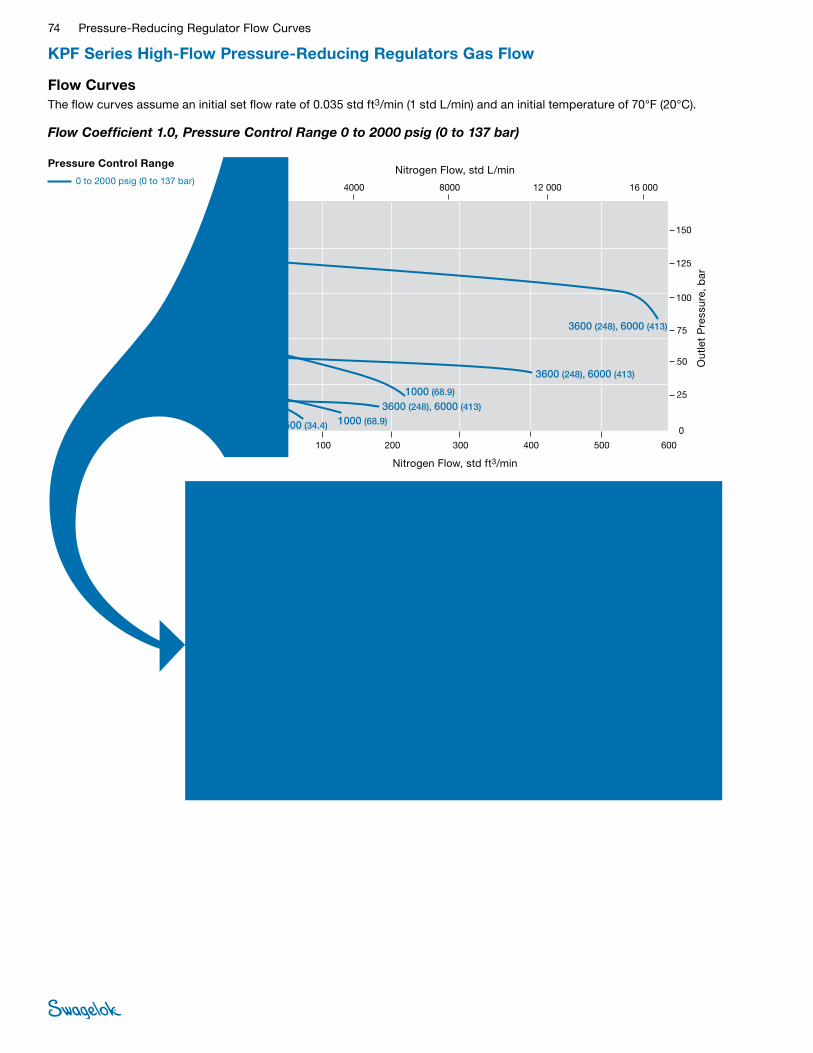
74 Pressure-Reducing Regulator Flow Curves
KPF Series High-Flow Pressure-Reducing Regulators Gas Flow
Flow CurvesThe flow curves assume an initial set flow rate of 0.035 std ft3/min (1 std L/min) and an initial temperature of 70°F (20°C).
Pressure Control Range
0 to 2000 psig (0 to 137 bar)
Flow Coefficient 1.0, Pressure Control Range 0 to 2000 psig (0 to 137 bar)
0
500
1000
1500
2000
2500
0 100 200 300 500400 600
0
0 4000 12 000 16 0008000
0
0 100 200 300 400 600500
0 0 4000 12 000 16 0008000
USA
JPN
EURO
500
1000
1500
2000
2500
25
75
100
125
50
150
25
75
100
125
50
150
0 0 4000 12 000 16 0008000
2.5
7.5
10.0
12.5
5.0
15.0
3600 (248), 6000 (413)
3600 (248), 6000 (413)
1000 (68.9)
1000 (68.9)
3600 (248), 6000 (413)
500 (34.4)
248 (3600), 413 (6000)
248 (3600), 413 (6000)
68.9 (1000)
68.9 (1000)248 (3600), 413 (6000)
34.4 (500)
3.44 6.89
6.89
24.8, 41.3
24.8, 41.3
24.8, 41.3
Nitrogen Flow, std ft3/min
Out
let
Pre
ssur
e, p
sig
Out
let
Pre
ssur
e, b
ar
Nitrogen Flow, std L/min
0
0
0
0
0
0
0 0
JPN
EURO
25
75
100
125
50
USA
10 20 30 40 50
800 1400600200 400 12001000
10 20 30 40 50
800 1400600200 400 12001000
500
1000
1500
2500
2000
150
25
75
100
125
50
150
500
1000
1500
2500
2000
0 0 800 1400600200 400 12001000
2.5
7.5
10.0
12.5
5.0
15.0
3600 (248), 6000 (413)
1000 (68.9)
3600 (248), 6000 (413)
3600 (248), 6000 (413)
1000 (68.9)
500 (34.4)
248 (3600), 413 (6000)
248 (3600), 413 (6000)
248 (3600), 413 (6000) 34.4 (500)
68.9 (1000)
68.9 (1000)
24.8, 41.3
24.8, 41.3
24.8, 41.3 3.44
6.89
6.89
Nitrogen Flow, std ft3/min
Out
let
Pre
ssur
e, p
sig
Out
let
Pre
ssur
e, b
ar
Nitrogen Flow, std L/minDetail A
A
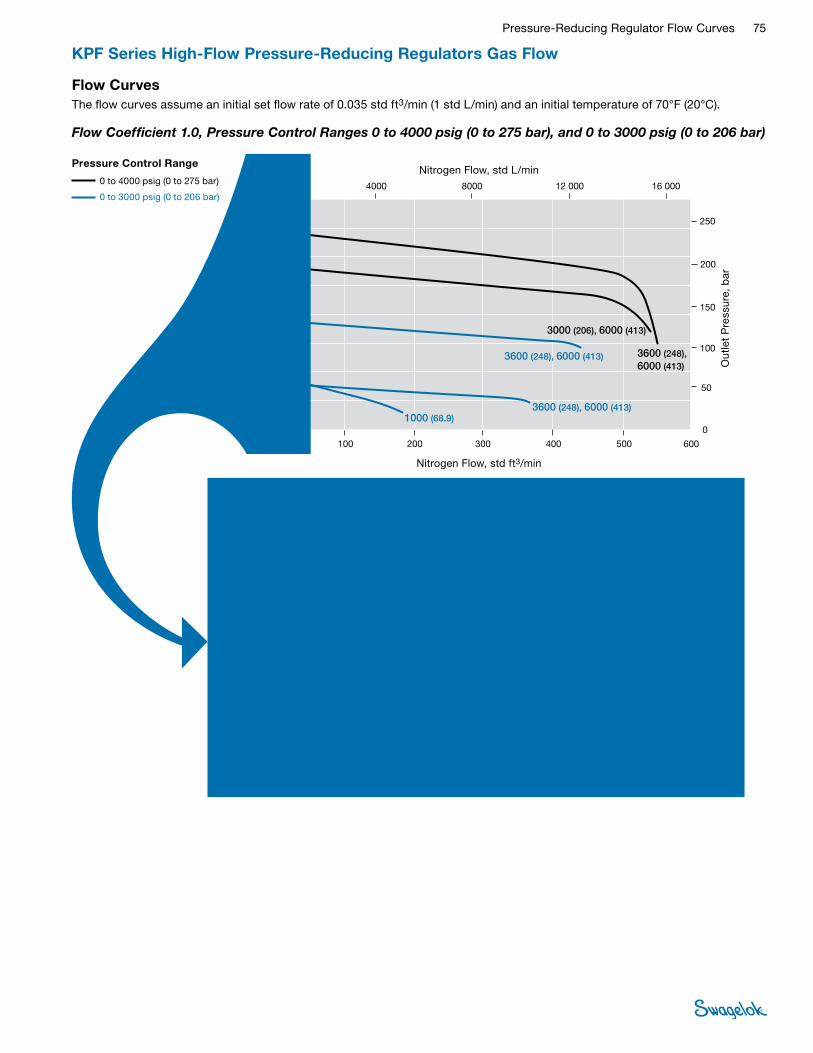
Pressure-Reducing Regulator Flow Curves 75
KPF Series High-Flow Pressure-Reducing Regulators Gas Flow
Flow CurvesThe flow curves assume an initial set flow rate of 0.035 std ft3/min (1 std L/min) and an initial temperature of 70°F (20°C).
Pressure Control Range
0 to 4000 psig (0 to 275 bar)
0 to 3000 psig (0 to 206 bar)
Flow Coefficient 1.0, Pressure Control Ranges 0 to 4000 psig (0 to 275 bar), and 0 to 3000 psig (0 to 206 bar)
0
500
1000
1500
2000
2500
4000
0 100 200 300 500400 600
0
50
100
150
250
0 4000 12 000 16 0008000
0
0 100 200 300 400 600500
0
50
150
200
250
0 4000 12 000 16 0008000
USA
JPN
3000
3500
200
500
1000
1500
2000
2500
3000
3500
100
0
5.0
15
20
25
0 4000 12 000 16 0008000
10
EURO
4000
3600 (248), 6000 (413)
3000 (206), 6000 (413)
3600 (248), 6000 (413)
3600 (248), 6000 (413)1000 (68.9)
206 (3000), 413 (6000)
248 (3600), 413 (6000) 248 (3600),413 (6000)
248 (3600), 413 (6000)68.9 (1000)
6.8924.8, 41.3
24.8, 41.3 24.8, 41.3
20.6, 41.3
Nitrogen Flow, std ft3/min
Out
let
Pre
ssur
e, p
sig
Out
let
Pre
ssur
e, b
ar
Nitrogen Flow, std L/min
0
0
0
0
0
0
0 0
JPN
500
1000
1500
2000
2500
4000
3000
3500
EURO
50
100
150
250
200
50
150
200
250
100
USA
10 20 30 40 50
800 1400600200 400 12001000
10 20 30 40 50
800 1400600200 400 12001000
0 0
5.0
10
15
25
20
800 1400600200 400 12001000
500
1000
1500
2000
2500
4000
3000
3500
3600 (248), 6000 (413)
3600 (248), 6000 (413)
3600 (248), 6000 (413)
1000 (68.9)
3000 (206), 6000 (413)
248 (3600), 413 (6000)
248 (3600), 413 (6000)
248 (3600), 413 (6000)
68.9 (1000)
206 (3000), 413 (6000)
24.8, 41.3
24.8, 41.3
24.8, 41.3
6.89
20.6, 41.3
Nitrogen Flow, std ft3/min
Out
let
Pre
ssur
e, p
sig
Out
let
Pre
ssur
e, b
ar
Nitrogen Flow, std L/minDetail A
A
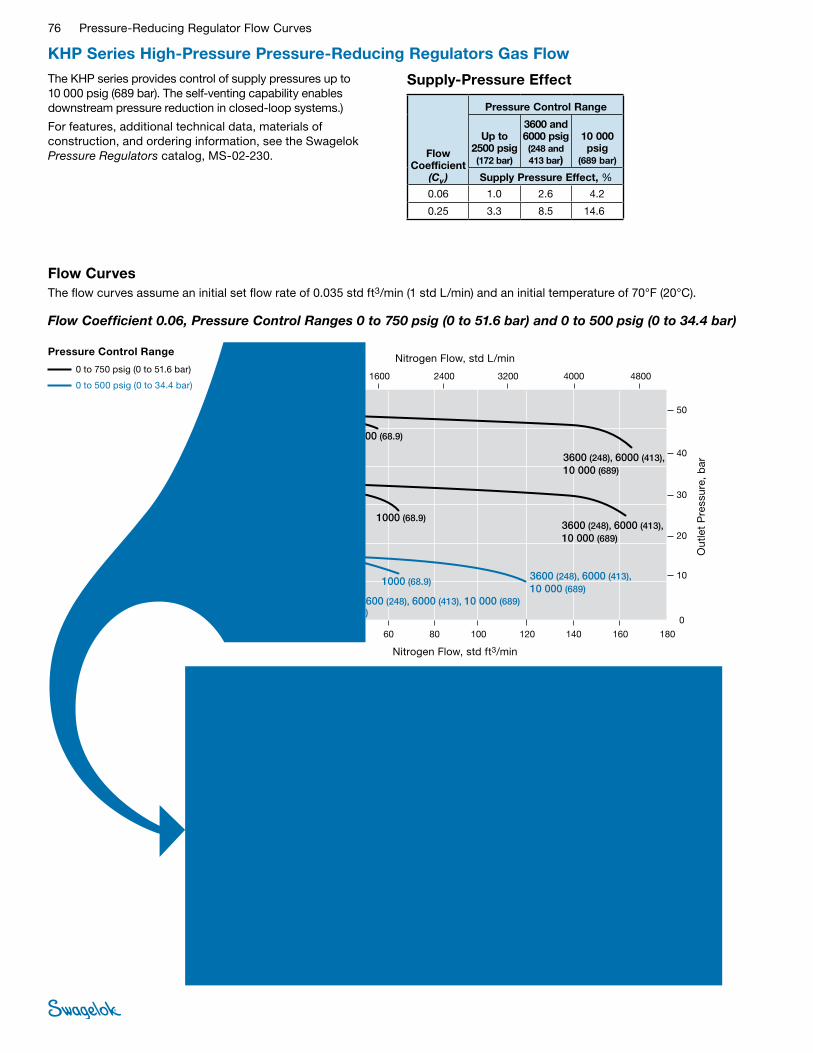
76 Pressure-Reducing Regulator Flow Curves
KHP Series High-Pressure Pressure-Reducing Regulators Gas Flow
Flow CurvesThe flow curves assume an initial set flow rate of 0.035 std ft3/min (1 std L/min) and an initial temperature of 70°F (20°C).
The KHP series provides control of supply pressures up to 10 000 psig (689 bar). The self-venting capability enables downstream pressure reduction in closed-loop systems.)
For features, additional technical data, materials of construction, and ordering information, see the Swagelok Pressure Regulators catalog, MS-02-230.
Pressure Control Range
0 to 750 psig (0 to 51.6 bar)
0 to 500 psig (0 to 34.4 bar)
Flow Coefficient 0.06, Pressure Control Ranges 0 to 750 psig (0 to 51.6 bar) and 0 to 500 psig (0 to 34.4 bar)
0
0 40 80 140 180
0
0 32002400
0 40 60 100 140 180
0 0
USA
EURO
JPN
800 1600 48004000
1601201006020
20 16012080
32002400800 1600 480040000
100
200
300
400
500
800
600
700
100
200
300
400
500
800
600
700
10
20
30
50
40
10
20
30
50
40
0 0 32002400800 1600 48004000
1.0
2.0
3.0
5.0
4.0
3600 (248), 6000 (413), 10 000 (689)
3600 (248), 6000 (413), 10 000 (689)
3600 (248), 6000 (413), 10 000 (689)
3600 (248), 6000 (413), 10 000 (689)500 (34.4)
500 (34.4)
500 (34.4)
1000 (68.9)
1000 (68.9)
1000 (68.9)
1000 (68.9)
248 (3600), 413 (6000), 689 (10 000)
248 (3600), 413 (6000), 689 (10 000)
248 (3600), 413 (6000), 689 (10 000)
248 (3600), 413 (6000), 689 (10 000)
500 (34.4)
500 (34.4)
500 (34.4)
68.9 (1000)
68.9 (1000)
68.9 (1000)
68.9 (1000)
24.8, 41.3, 68.9
24.8, 41.3, 68.9
24.8, 41.3, 68.9
24.8, 41.3, 68.9
6.89
6.89
6.89
6.89
3.44
3.44
3.44
Nitrogen Flow, std ft3/min
Out
let
Pre
ssur
e, p
sig
Out
let
Pre
ssur
e, b
ar
Nitrogen Flow, std L/min
0
100
200
300
400
500
800
0 10 20 30 40 50
0
0 800 1400600
0
0 10 20 30 40 50
0 0
USA
EURO
JPN
200 400 12001000
800 1400600200 400 12001000
453525155.0
155,0 453525
600
700
10
20
30
50
40
10
20
30
50
40
100
200
300
400
500
800
600
700
0 0 800 1400600200 400 12001000
1.0
2.0
3.0
5.0
4.0
1000 (68.9), 3600 (248), 6000 (413), 10 000 (689)
1000 (68.9), 3600 (248), 6000 (413), 10 000 (689)
1000 (68.9), 3600 (248), 6000 (413), 10 000 (689)
3600 (248), 6000 (413), 10 000 (689)
500 (34.4)
500 (34.4) 1000 (68.9)
500 (34.4)
68.9 (1000), 248 (3600), 413 (6000), 689 (10 000)
68.9 (1000), 248 (3600), 413 (6000), 689 (10 000)
68.9 (1000), 248 (3600), 413 (6000), 689 (10 000)
34.4 (500)
34.4 (500)
34.4 (500) 68.9 (1000)
248 (3600), 413 (6000), 689 (10 000)
6.89, 24.8, 41.3, 68.9
6.89, 24.8, 41.3, 68.9
6.89, 24.8, 41.3, 68.9
24.8, 41.3, 68.96.893.44
3.44
3.44
Nitrogen Flow, std ft3/min
Out
let
Pre
ssur
e, p
sig
Out
let
Pre
ssur
e, b
ar
Nitrogen Flow, std L/min
Supply-Pressure Effect
Flow Coefficient
(Cv )
Pressure Control Range
Up to 2500 psig (172 bar)
3600 and 6000 psig (248 and 413 bar)
10 000 psig
(689 bar)
Supply Pressure Effect, %
0.06 1.0 2.6 4.2
0.25 3.3 8.5 14.6
Detail A
A

Pressure-Reducing Regulator Flow Curves 77
KHP Series High-Pressure Pressure-Reducing Regulators Gas Flow
Flow CurvesThe flow curves assume an initial set flow rate of 0.035 std ft3/min (1 std L/min) and an initial temperature of 70°F (20°C).
Pressure Control Range
15 to 2500 psig (1.0 to 172 bar)
10 to 1500 psig (0.68 to 103 bar)
Flow Coefficient 0.06, Pressure Control Ranges 15 to 2500 psig (1.0 to 172 bar) and 10 to 1500 psig (0.68 to 103 bar)
0
500
1000
1500
2000
2500
3000
0 50 100 150 250200 300
0
50
100
150
200
0 2000 6000 80004000
0
500
1000
1500
2000
2500
0 50 100 150 200 300250
0
50
100
150
200
0 2000 6000 80004000
USA
JPN
EURO
3000
0
5.0
10
15
20
0 2000 6000 80004000
3600 (248), 6000 (413), 10 000 (689)
3600 (248), 6000 (413), 10 000 (689)
3600 (248), 6000 (413), 10 000 (689)
3600 (248), 6000 (413), 10 000 (689)
500 (34.4)1000 (68.9)
1000 (68.9)
248 (3600), 413 (6000),689 (10 000)
248 (3600), 413 (6000),689 (10 000)
248 (3600), 413 (6000),689 (10 000)
248 (3600), 413 (6000),689 (10 000)
34.4 (500)
68.9 (1000)
68.9 (1000)
24.8, 41.3, 68.9
24.8, 41.3, 68.9
24.8, 41.3, 68.9
24.8, 41.3, 68.93.44
68.9
68.9
Nitrogen Flow, std ft3/min
Out
let
Pre
ssur
e, p
sig
Out
let
Pre
ssur
e, b
ar
Nitrogen Flow, std L/min
0
500
1000
1500
2000
2500
3000
0 10 20 30 40 50
0
50
100
150
200
0 800 1400600
0
500
1000
1500
2000
2500
0 10 20 30 40 50
0
50
100
150
200
0
USA
EURO
JPN
200 400 12001000
800 1400600200 400 12001000
0
5.0
10
15
20
0 800 1400600200 400 12001000
3000
3600 (248), 6000 (413), 10 000 (689)
3600 (248), 6000 (413), 10 000 (689)
1000 (68.9), 3600 (248), 6000 (413), 10 000 (689)
1000 (68.9), 3600 (248), 6000 (413), 10 000 (689)
500 (34.4)
68.9 (1000), 248 (3600), 413 (6000), 689 (10 000)
248 (3600), 413 (6000), 689 (10 000)
248 (3600), 413 (6000), 689 (10 000)
68.9 (1000), 248 (3600), 413 (6000), 689 (10 000)
34.4 (500)
24.8, 41.3, 68.9
6.89, 24.8, 41.3, 68.9
6.89, 24.8, 41.3, 68.9
24.8, 41.3, 68.9
3.44
Nitrogen Flow, std ft3/min
Out
let
Pre
ssur
e, p
sig
Out
let
Pre
ssur
e, b
ar
Nitrogen Flow, std L/minDetail A
A

78 Pressure-Reducing Regulator Flow Curves
KHP Series High-Pressure Pressure-Reducing Regulators Gas Flow
Flow CurvesThe flow curves assume an initial set flow rate of 0.035 std ft3/min (1 std L/min) and an initial temperature of 70°F (20°C).
Pressure Control Range
50 to 6000 psig (3.4 to 413 bar)
25 to 3600 psig (1.7 to 248 bar)
Flow Coefficient 0.06, Pressure Control Ranges 50 to 6000 psig (3.4 to 413 bar) and 25 to 3600 psig (1.7 to 248 bar)
0
500
1000
1500
2000
2500
4000
0 50 100 150 250200 300
0
50
100
150
250
0 2000 6000 80004000
0
0 50 100 150 200 300250
0
50
150
200
250
0 2000 6000 80004000
USA
JPN
3000
3500
200
500
1000
1500
2000
2500
3000
3500
100
0
5.0
15
20
25
0 2000 6000 80004000
10
EURO
4000
3600 (248), 6000 (413), 10 000 (689)
3600 (248), 6000 (413), 10 000 (689)3600 (248),
6000 (413), 10 000 (689)
248 (3600), 413 (6000), 689 (10 000)
248 (3600), 413 (6000), 689 (10 000)248 (3600),
413 (6000), 689 (10 000)
24.8, 41.3, 68.9
24.8, 41.3, 68.9
24.8, 41.3, 68.9
Nitrogen Flow, std ft3/min
Out
let
Pre
ssur
e, p
sig
Out
let
Pre
ssur
e, b
ar
Nitrogen Flow, std L/min
0
0
0
0
0
0
0 0
JPN
500
1000
1500
2000
2500
4000
3000
3500
EURO
50
100
150
250
200
50
150
200
250
100
USA
10 20 30 40 50
800 1400600200 400 12001000
10 20 30 40 50
800 1400600200 400 12001000
0 0
5.0
10
15
25
20
800 1400600200 400 12001000
500
1000
1500
2000
2500
4000
3000
3500
3600 (248), 6000 (413), 10 000 (689)
3600 (248), 6000 (413), 10 000 (689)
3600 (248), 6000 (413), 10 000 (689)
248 (3600), 413 (6000), 689 (10 000)
248 (3600), 413 (6000), 689 (10 000)
248 (3600), 413 (6000), 689 (10 000)
24.8, 41.3, 68.9
24.8, 41.3, 68.9
24.8, 41.3, 68.9
Nitrogen Flow, std ft3/min
Out
let
Pre
ssur
e, p
sig
Out
let
Pre
ssur
e, b
ar
Nitrogen Flow, std L/minDetail A
A

Pressure-Reducing Regulator Flow Curves 79
KHP Series High-Pressure Pressure-Reducing Regulators Gas Flow
Flow CurvesThe flow curves assume an initial set flow rate of 0.035 std ft3/min (1 std L/min) and an initial temperature of 70°F (20°C).
Pressure Control Range
100 to 10 000 psig (6.8 to 689 bar)
Flow Coefficient 0.06, Pressure Control Range 100 to 10 000 psig (6.8 to 689 bar)
0
500
1000
1500
2000
2500
4000
0 50 100 150 250200 300
0
50
100
150
250
0 2000 6000 80004000
0
0 50 100 150 200 300250
0
50
150
200
250
0 2000 6000 80004000
USA
JPN
3000
3500
200
500
1000
1500
2000
2500
3000
3500
100
0
5.0
15
20
25
0 2000 6000 80004000
10
EURO
4000
3600 (248), 6000 (413), 10 000 (689)
3600 (248), 6000 (413), 10 000 (689)
248 (3600), 413 (6000), 689 (10 000)
248 (3600), 413 (6000), 689 (10 000)
24.8, 41.3, 68.9
24.8, 41.3, 68.9
Nitrogen Flow, std ft3/min
Out
let
Pre
ssur
e, p
sig
Out
let
Pre
ssur
e, b
ar
Nitrogen Flow, std L/min
0
0
0
0
0
0
0 0
JPN
500
1000
1500
2000
2500
4000
3000
3500
EURO
50
100
150
250
200
50
150
200
250
100
USA
10 20 30 40 50
800 1400600200 400 12001000
10 20 30 40 50
800 1400600200 400 12001000
0 0
5.0
10
15
25
20
800 1400600200 400 12001000
500
1000
1500
2000
2500
4000
3000
3500
3600 (248), 6000 (413), 10 000 (689)
3600 (248), 6000 (413), 10 000 (689)
248 (3600), 413 (6000), 689 (10 000)
248 (3600), 413 (6000), 689 (10 000)
24.8, 41.3, 68.9
24.8, 41.3, 68.9
Nitrogen Flow, std ft3/min
Out
let
Pre
ssur
e, p
sig
Out
let
Pre
ssur
e, b
ar
Nitrogen Flow, std L/minDetail A
A
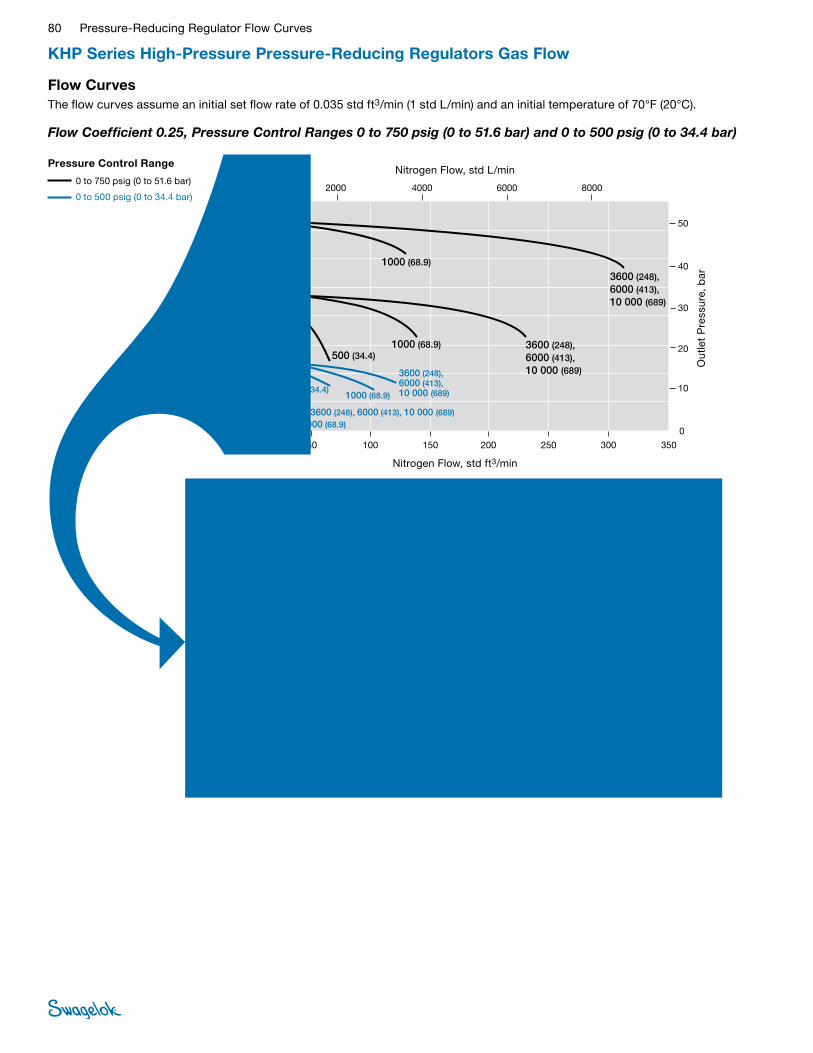
80 Pressure-Reducing Regulator Flow Curves
KHP Series High-Pressure Pressure-Reducing Regulators Gas Flow
Flow CurvesThe flow curves assume an initial set flow rate of 0.035 std ft3/min (1 std L/min) and an initial temperature of 70°F (20°C).
Pressure Control Range
0 to 750 psig (0 to 51.6 bar)
0 to 500 psig (0 to 34.4 bar)
Flow Coefficient 0.25, Pressure Control Ranges 0 to 750 psig (0 to 51.6 bar) and 0 to 500 psig (0 to 34.4 bar)
0
0 50 100 150 250200 350
0
0 2000 6000 80004000
0
0 0
USA
JPN
EURO
300
50 100 150 250200 350300
2000 6000 80004000
100
200
300
400
500
800
600
700
0
100
200
300
400
500
800
600
700
10
20
30
50
40
10
20
30
50
40
0 0 2000 6000 80004000
1.0
2.0
3.0
5.0
4.0
1000 (68.9)
3600 (248), 6000 (413), 10 000 (689)
3600 (248), 6000 (413), 10 000 (689)3600 (248),
6000 (413), 10 000 (689)
1000 (68.9)
1000 (68.9)500 (34.4)
500 (34.4)
500 (34.4), 1000 (68.9)3600 (248), 6000 (413), 10 000 (689)
68.9 (1000)
68.9 (1000)
248 (3600), 413 (6000),689 (10 000)
248 (3600), 413 (6000),689 (10 000)
248 (3600), 413 (6000),689 (10 000)68.9 (1000)
34.4 (500)
34.4 (500)
34.4 (500), 68.9 (1000)248 (3600), 413 (6000), 689 (10 000)
6.89
6.89
6.89
3.44
3.44
24.8, 41.3, 68.9
24.8, 41.3, 68.9
24.8, 41.3, 68.9
24.8, 41.3, 68.93.44, 6.89
Nitrogen Flow, std ft3/min
Out
let
Pre
ssur
e, p
sig
Out
let
Pre
ssur
e, b
ar
Nitrogen Flow, std L/min
0
100
200
300
400
500
800
0 10 20 30 40 50
0
0 800 1400600
0
0 10 20 30 40 50
0 0
USA
EURO
JPN
200 400 12001000
800 1400600200 400 12001000
600
700
10
20
30
50
40
10
20
30
50
40
100
200
300
400
500
800
600
700
0 0 800 1400600200 400 12001000
1.0
2.0
3.0
5.0
4.0
3600 (248), 6000 (413), 10 000 (689)
3600 (248), 6000 (413), 10 000 (689)
1000 (68.9)
1000 (68.9), 3600 (248), 6000 (413), 10 000 (689)
500 (34.4)3600 (248), 6000 (413), 10 000 (689)
500 (34.4), 1000 (68.9)
248 (3600), 413 (6000), 689 (10 000)
248 (3600), 413 (6000), 689 (10 000)
68.9 (1000)
68.9 (1000), 248 (3600), 413 (6000), 689 (10 000)
248 (3600), 413 (6000), 689 (10 000) 34.4 (500)
34.4 (500), 68.9 (1000)
24.8, 41.3, 68.9
24.8, 41.3, 68.9
6.89
6.89, 24.8, 41.3, 68.9
24.8, 41.3, 68.9
3.44, 6.89
Nitrogen Flow, std ft3/min
Out
let
Pre
ssur
e, p
sig
Out
let
Pre
ssur
e, b
ar
Nitrogen Flow, std L/minDetail A
A

Pressure-Reducing Regulator Flow Curves 81
KHP Series High-Pressure Pressure-Reducing Regulators Gas Flow
Flow CurvesThe flow curves assume an initial set flow rate of 0.035 std ft3/min (1 std L/min) and an initial temperature of 70°F (20°C).
Pressure Control Range
15 to 2500 psig (1.0 to 172 bar)
10 to 1500 psig (0.68 to 103 bar)
Flow Coefficient 0.25, Pressure Control Ranges 15 to 2500 psig (1.0 to 172 bar) and 10 to 1500 psig (0.68 to 103 bar)
0
0 50 100 150 200 300250 350 400
0
0 2000 6000 80004000
0
0 50 100 150 200 300250 350 400
0 0 2000 4000 6000 8000 10000
JPN
EURO
USA
10000
500
1000
1500
2000
2500
3000
500
1000
1500
2000
2500
3000
50
100
150
200
50
100
150
200
0 0 2000 4000 6000 8000 10000
5.0
10
15
20
3600 (248), 6000 (413), 10 000 (689)
3600 (248), 6000 (413), 10 000 (689)
3600 (248), 6000 (413), 10 000 (689)
3600 (248), 6000 (413), 10 000 (689)1000 (68.9)1000 (68.9)500 (34.4)
248 (3600), 413 (6000), 689 (10 000)
248 (3600), 413 (6000), 689 (10 000)
248 (3600), 413 (6000), 689 (10 000)
248 (3600), 413 (6000), 689 (10 000)
68.9 (1000) 68.9 (1000)34.4 (500)
24.8, 41.3, 68.9
24.8, 41.3, 68.9
24.8, 41.3, 68.924.8, 41.3, 68.96.896.893.44
Nitrogen Flow, std ft3/min
Out
let
Pre
ssur
e, p
sig
Out
let
Pre
ssur
e, b
ar
Nitrogen Flow, std L/min
0
0 20 40 60 80 100
0
0 1600 28001200
0
0 20 40 60 80 100
0 0
USA
EURO
JPN
400 800 24002000
1600 28001200400 800 24002000
9070503510
3010 907050
500
1000
1500
2000
2500
3000
500
1000
1500
2000
2500
3000
50
100
150
200
50
100
150
200
0 0 1600 28001200400 800 24002000
5.0
10
15
20
3600 (248), 6000 (413), 10 000 (689)
3600 (248), 6000 (413), 10 000 (689)
3600 (248), 6000 (413), 10 000 (689)
1000 (68.9), 3600 (248), 6000 (413), 10 000 (689)
1000 (68.9)
500 (34.4)
34.4 (500)
248 (3600), 413 (6000), 689 (10 000)
248 (3600), 413 (6000), 689 (10 000)
248 (3600), 413 (6000), 689 (10 000)
68.9 (1000), 248 (3600), 413 (6000), 689 (10 000)
68.9 (1000)
24.8, 41.3, 68.9
24.8, 41.3, 68.9
24.8, 41.3, 68.9
6.89, 24.8, 41.3, 68.96.89
3.44
Nitrogen Flow, std ft3/min
Out
let
Pre
ssur
e, p
sig
Out
let
Pre
ssur
e, b
ar
Nitrogen Flow, std L/minDetail A
A

82 Pressure-Reducing Regulator Flow Curves
KHP Series High-Pressure Pressure-Reducing Regulators Gas Flow
Flow CurvesThe flow curves assume an initial set flow rate of 0.035 std ft3/min (1 std L/min) and an initial temperature of 70°F (20°C).
Pressure Control Range
50 to 6000 psig (3.4 to 413 bar)
25 to 3600 psig (1.7 to 248 bar)
Flow Coefficient 0.25, Pressure Control Ranges 50 to 6000 psig (3.4 to 413 bar) and 25 to 3600 psig (1.7 to 248 bar)
0
500
1000
1500
2000
2500
4000
0 100 200 300 500400 600
0
50
100
150
250
0 4000 12000 160008000
0
0 100 200 300 400 600500
0
50
150
200
250
0 4000 12000 160008000
USA
JPN
3000
3500
200
500
1000
1500
2000
2500
3000
3500
100
0
5.0
15
20
25
0 4000 12000 160008000
10
EURO
4000
3600 (248), 6000 (413), 10 000 (689)
3600 (248), 6000 (413), 10 000 (689)
3600 (248), 6000 (413), 10 000 (689)
248 (3600), 413 (6000), 689 (10 000)
248 (3600), 413 (6000), 689 (10 000)
248 (3600), 413 (6000), 689 (10 000)
24.8, 41.3, 68.9
24.8, 41.3, 68.9
24.8, 41.3, 68.9
Nitrogen Flow, std ft3/min
Out
let
Pre
ssur
e, p
sig
Out
let
Pre
ssur
e, b
ar
Nitrogen Flow, std L/min
0
0
0
0
0
0
0 0
JPN
500
1000
1500
2000
2500
4000
3000
3500
EURO
50
100
150
250
200
50
150
200
250
100
USA
10 20 30 40 50
800 1400600200 400 12001000
10 20 30 40 50
800 1400600200 400 12001000
0 0
5.0
10
15
25
20
800 1400600200 400 12001000
500
1000
1500
2000
2500
4000
3000
3500
3600 (248), 6000 (413), 10 000 (689)
3600 (248), 6000 (413), 10 000 (689)
3600 (248), 6000 (413), 10 000 (689)
248 (3600), 413 (6000), 689 (10 000)
248 (3600), 413 (6000), 689 (10 000)
248 (3600), 413 (6000), 689 (10 000)
24.8, 41.3, 68.9
24.8, 41.3, 68.9
24.8, 41.3, 68.9
Nitrogen Flow, std ft3/min
Out
let
Pre
ssur
e, p
sig
Out
let
Pre
ssur
e, b
ar
Nitrogen Flow, std L/minDetail A
A

Pressure-Reducing Regulator Flow Curves 83
KHP Series High-Pressure Pressure-Reducing Regulators Gas Flow
Flow CurvesThe flow curves assume an initial set flow rate of 0.035 std ft3/min (1 std L/min) and an initial temperature of 70°F (20°C).
Pressure Control Range
10 to 10 000 psig (0.68 to 689 bar)
Flow Coefficient 0.25, Pressure Control Range 10 to 10 000 psig (0.68 to 689 bar)
0
0
0
0
0
0
0 0
JPN
500
1000
1500
2000
2500
4000
3000
3500
EURO
50
100
150
250
200
50
150
200
250
100
USA
100 200 300 400 500
8000 14 00060002000 4000 12 00010 000
100 200 300 400 500
8000 14 00060002000 4000 12 00010 000
0 0
5.0
10
15
25
20
8000 14 00060002000 4000 12 00010 000
500
1000
1500
2000
2500
4000
3000
3500
3600 (248), 6000 (413), 10 000 (689)
3600 (248), 6000 (413), 10 000 (689)
248 (3600), 413 (6000), 689 (10 000)
248 (3600), 413 (6000), 689 (10 000)
24.8, 41.3, 68.9
24.8, 41.3, 68.9
Nitrogen Flow, std ft3/min
Out
let
Pre
ssur
e, p
sig
Out
let
Pre
ssur
e, b
ar
Nitrogen Flow, std L/min
0
0
0
0
0
0
0 0
JPN
500
1000
1500
2000
2500
4000
3000
3500
EURO
50
100
150
250
200
50
150
200
250
100
USA
10 20 30 40 50
800 1400600200 400 12001000
10 20 30 40 50
800 1400600200 400 12001000
0 0
5.0
10
15
25
20
800 1400600200 400 12001000
500
1000
1500
2000
2500
4000
3000
3500
3600 (248), 6000 (413), 10 000 (689)
3600 (248), 6000 (413), 10 000 (689)
248 (3600), 413 (6000), 689 (10 000)
248 (3600), 413 (6000), 689 (10 000)
24.8, 41.3, 68.9
24.8, 41.3, 68.9
Nitrogen Flow, std ft3/min
Out
let
Pre
ssur
e, p
sig
Out
let
Pre
ssur
e, b
ar
Nitrogen Flow, std L/minDetail A
A
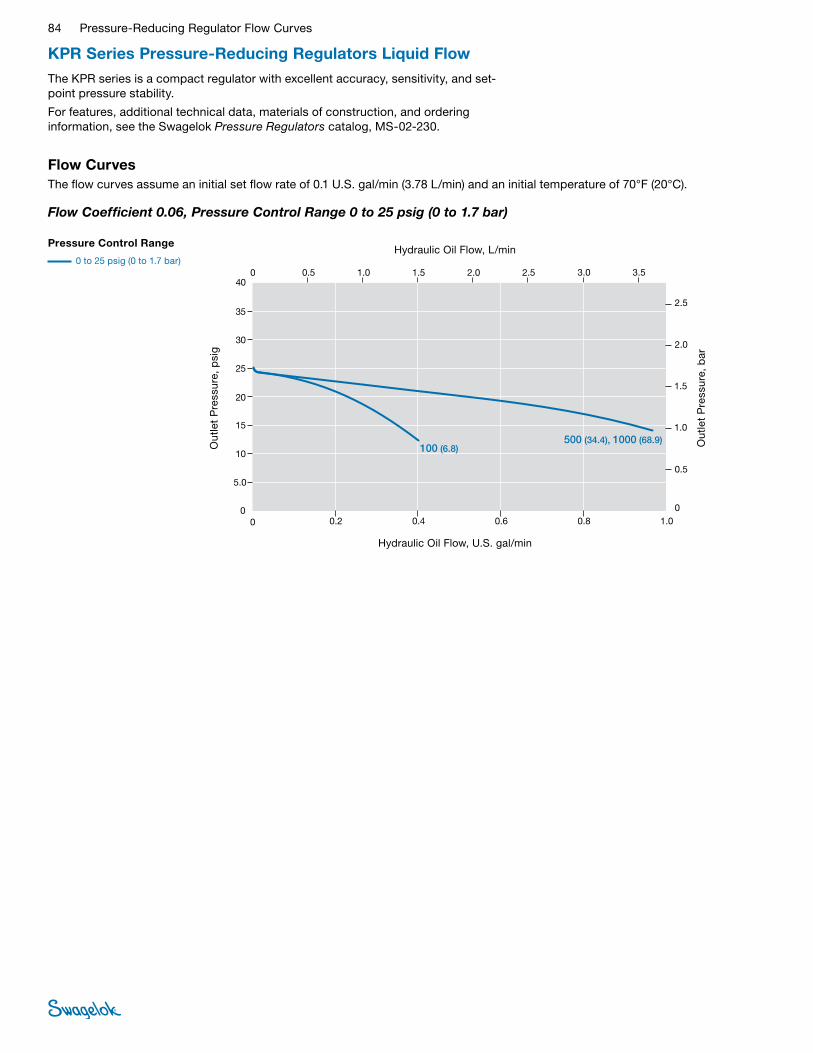
84 Pressure-Reducing Regulator Flow Curves
KPR Series Pressure-Reducing Regulators Liquid Flow
Flow CurvesThe flow curves assume an initial set flow rate of 0.1 U.S. gal/min (3.78 L/min) and an initial temperature of 70°F (20°C).
Pressure Control Range
0 to 25 psig (0 to 1.7 bar)
Flow Coefficient 0.06, Pressure Control Range 0 to 25 psig (0 to 1.7 bar)
00 0.2
0 0.5
15
20
25
30
35
40
2.5
0.80.60.4
JPN
EURO
USA
1.0
3.02.01.51.0 3.52.5
10
5.0
2.0
0.5
1.0
1.5
0
00
0,20
0,5
15
20
25
30
35
40
2,5
0,80,60,4 1,0
3,02,01,51,0 3,52,5
10
5,0
2,0
0,5
1,0
1,5
00 0.5
0.25
3.02.01.51.0 3.52.5
0.20
0.05
0.10
0.15
0
500 (34.4), 1000 (68.9)100 (6.8)
34.4 (500), 68.9 (1000)6.8 (100)
3.44, 6.890.68
Hydraulic Oil Flow, U.S. gal/min
Out
let
Pre
ssur
e, p
sig
Out
let
Pre
ssur
e, b
ar
Hydraulic Oil Flow, L/min
The KPR series is a compact regulator with excellent accuracy, sensitivity, and set-point pressure stability.
For features, additional technical data, materials of construction, and ordering information, see the Swagelok Pressure Regulators catalog, MS-02-230.

Pressure-Reducing Regulator Flow Curves 85
KPR Series Pressure-Reducing Regulators Liquid Flow Flow
Flow CurvesThe flow curves assume an initial set flow rate of 0.1 U.S. gal/min (3.78 L/min) and an initial temperature of 70°F (20°C).
Flow Coefficient 0.06, Pressure Control Ranges 0 to 100 psig (0 to 6.8 bar) and 0 to 50 psig (0 to 3.4 bar)
7,5
00 0.5
0 1.5
20
40
60
80
100
120
2.0
4.0
6.0
8.0
2.01.51.0
JPN
EURO
USA
2.50
7.56.04.53.0 9.0
0
0 0,5
0 1,5
20
40
60
80
100
120
2,0
4,0
6,0
8,0
2,01,51,0 2,5
06,04,53,0 9,0
7.50 1.5
0.2
0.4
0.6
0.8
06.04.53.0 9.0
100 (6.8)
100 (6.8)
500 (34.4)
500 (34.4) 1000 (68.9)1000 (68.9)
500 (34.4)
1000 (68.9)
34.4 (500)
68.9 (1000)6.8 (100)
6.8 (100)
34.4 (500)
34.4 (500) 68.9 (1000)68.9 (1000)
3.44
6.890.68
0.68
3.44
3.44 6.896.89
Hydraulic Oil Flow, U.S. gal/min
Out
let
Pre
ssur
e, p
sig
Out
let
Pre
ssur
e, b
ar
Hydraulic Oil Flow, L/min
00 0.2
0 0.5
20
40
60
80
100
120
2.0
4.0
6.0
8.0
0.80.60.4
JPN
EURO
USA
1.00
3.02.01.51.0 3.52.5
0
0 0,2
0 0,5
20
40
60
80
100
120
2,0
4,0
6,0
8,0
0,80,60,4 1,0
03,02,01,51,0 3,52,5
0 0.5
0.2
0.4
0.6
0.8
03.02.01.51.0 3.52.5
500 (34.4), 1000 (68.9)
500 (34.4), 1000 (68.9)
500 (34.4), 1000 (68.9)100 (6.8)
100 (6.8)
34.4 (500), 68.9 (1000)
34.4 (500), 68.9 (1000)
34.4 (500), 68.9 (1000)
6.8 (100)
6.8 (100)
3.44, 6.89
3.44, 6.89
3.44, 6.89
0.68
0.68
Hydraulic Oil Flow, U.S. gal/min
Out
let
Pre
ssur
e, p
sig
Out
let
Pre
ssur
e, b
ar
Hydraulic Oil Flow, L/min
Pressure Control Range
0 to 100 psig (0 to 6.8 bar)
0 to 50 psig (0 to 3.4 bar)
Detail A
A

86 Pressure-Reducing Regulator Flow Curves
Flow CurvesThe flow curves assume an initial set flow rate of 0.1 U.S. gal/min (3.78 L/min) and an initial temperature of 70°F (20°C).
Pressure Control Range
0 to 500 psig (0 to 34.4 bar)
0 to 250 psig (0 to 17.2 bar)
Flow Coefficient 0.06, Pressure Control Ranges 0 to 500 psig (0 to 34.4 bar) and 0 to 250 psig (0 to 17.2 bar)
7,5
00 0.5
0 1.5
100
200
300
400
500
600
10
20
30
40
2.01.51.0
JPN
EURO
USA
2.50
7.56.04.53.0 9.0
0
0 0,5
0 1,5
100
200
300
400
500
600
10
20
30
40
2,01,51,0 2,5
06,04,53,0 9,0
7.50 1.5
1.0
2.0
3.0
4.0
06.04.53.0 9.0
500 (34.4)1000 (68.9)
1000 (68.9)
1000 (68.9)
500 (34.4)
500 (34.4)
34.4 (500)
34.4 (500)
34.4 (500) 68.9 (1000)
68.9 (1000)
68.9 (1000)
3.44
3.44
3.44
6.89
6.89
6.89
Hydraulic Oil Flow, U.S. gal/min
Out
let
Pre
ssur
e, p
sig
Out
let
Pre
ssur
e, b
ar
Hydraulic Oil Flow, L/min
00 0.2
0 0.5
100
200
300
400
500
600
10
20
30
40
0.80.60.4
JPN
EURO
USA
1.00
3.02.01.51.0 3.52.5
0
0 0,2
0 0,5
100
200
300
400
500
600
10
20
30
40
0,80,60,4 1,0
03,02,01,51,0 3,52,5
0 0.5
1.0
2.0
3.0
4.0
03.02.01.51.0 3.52.5
500 (34.4)
500 (34.4)
1000 (68.9)
1000 (68.9)
500 (34.4), 1000 (68.9)
68.9 (1000)
68.9 (1000)
34.4 (500)
34.4 (500)
34.4 (500), 68.9 (1000)
3.44
3.44
6.89
6.89
3.44, 6.89
Hydraulic Oil Flow, U.S. gal/min
Out
let
Pre
ssur
e, p
sig
Out
let
Pre
ssur
e, b
ar
Hydraulic Oil Flow, L/min
KPR Series Pressure-Reducing Regulators Liquid Flow
Detail A
A
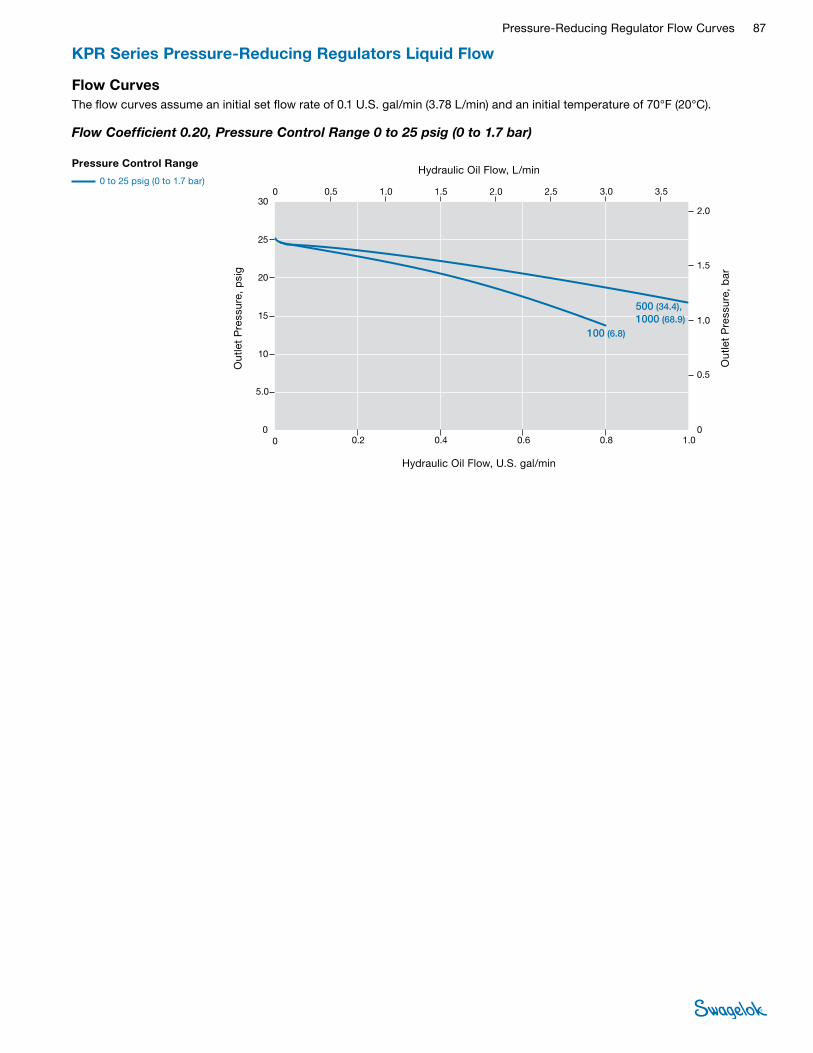
Pressure-Reducing Regulator Flow Curves 87
KPR Series Pressure-Reducing Regulators Liquid Flow
Flow CurvesThe flow curves assume an initial set flow rate of 0.1 U.S. gal/min (3.78 L/min) and an initial temperature of 70°F (20°C).
Flow Coefficient 0.20, Pressure Control Range 0 to 25 psig (0 to 1.7 bar)
00 0.2
0 0.5
5.0
10
15
20
25
30
0.5
1.0
1.5
2.0
0.80.60.4
JPN
EURO
USA
1.00
3.02.01.51.0 3.52.5
0
0 0,2
0 0,5
5,0
10
15
20
25
30
0,5
1,0
1,5
2,0
0,80,60,4 1,0
03,02,01,51,0 3,52,5
0 0.5
0.05
0.10
0.15
0.20
03.02.01.51.0 3.52.5
500 (34.4), 1000 (68.9)
100 (6.8)
34.4 (500), 68.9 (1000)
6.8 (100)
3.44, 6.89
0.68
Hydraulic Oil Flow, U.S. gal/min
Out
let
Pre
ssur
e, p
sig
Out
let
Pre
ssur
e, b
ar
Hydraulic Oil Flow, L/minPressure Control Range
0 to 25 psig (0 to 1.7 bar)

88 Pressure-Reducing Regulator Flow Curves
Flow CurvesThe flow curves assume an initial set flow rate of 0.1 U.S. gal/min (3.78 L/min) and an initial temperature of 70°F (20°C).
Pressure Control Range
0 to 100 psig (0 to 6.8 bar)
0 to 50 psig (0 to 3.4 bar))
Flow Coefficient 0.20, Pressure Control Ranges 0 to 100 psig (0 to 6.8 bar) and 0 to 50 psig (0 to 3.4 bar)
7,5
00 0.5
0 1.5
20
40
60
80
100
120
2.0
4.0
6.0
8.0
2.01.51.0
JPN
EURO
USA
2.50
7.56.04.53.0 9.0
0
0 0,5
0 1,5
20
40
60
80
100
120
2,0
4,0
6,0
8,0
2,01,51,0 2,5
06,04,53,0 9,0
7.50 1.5
0.2
0.4
0.6
0.8
06.04.53.0 9.0
100 (6.8)
100 (6.8)
100 (6.8)
500 (34.4), 1000 (68.9)
500 (34.4), 1000 (68.9)
500 (34.4), 1000 (68.9)
6.8 (100)
6.8 (100)6.8 (100)
34.4 (500), 68.9 (1000)
34.4 (500), 68.9 (1000)
34.4 (500), 68.9 (1000)
0.68
0.680.68
3.44, 6.89
3.44, 6.89
3.44, 6.89
Hydraulic Oil Flow, U.S. gal/min
Out
let
Pre
ssur
e, p
sig
Out
let
Pre
ssur
e, b
ar
Hydraulic Oil Flow, L/min
00 0.2
0 0.5
20
40
60
80
100
120
2.0
4.0
6.0
8.0
0.80.60.4
JPN
EURO
USA
1.00
3.02.01.51.0 3.52.5
0
0 0,2
0 0,5
20
40
60
80
100
120
2,0
4,0
6,0
8,0
0,80,60,4 1,0
03,02,01,51,0 3,52,5
0 0.5
0.2
0.4
0.6
0.8
03.02.01.51.0 3.52.5
100 (6.8), 500 (34.4), 1000 (68.9)
100 (6.8), 500 (34.4), 1000 (68.9)100 (6.8), 500 (34.4), 1000 (68.9)
6.8 (100), 34.4 (500), 68.9 (1000)
6.8 (100), 34.4 (500), 68.9 (1000)
6.8 (100), 34.4 (500), 68.9 (1000)
0.68, 3.44, 6.89
0.68, 3.44, 6.890.68, 3.44, 6.89
Hydraulic Oil Flow, U.S. gal/min
Out
let
Pre
ssur
e, p
sig
Out
let
Pre
ssur
e, b
ar
Hydraulic Oil Flow, L/min
KPR Series Pressure-Reducing Regulators Liquid Flow
Detail A
A
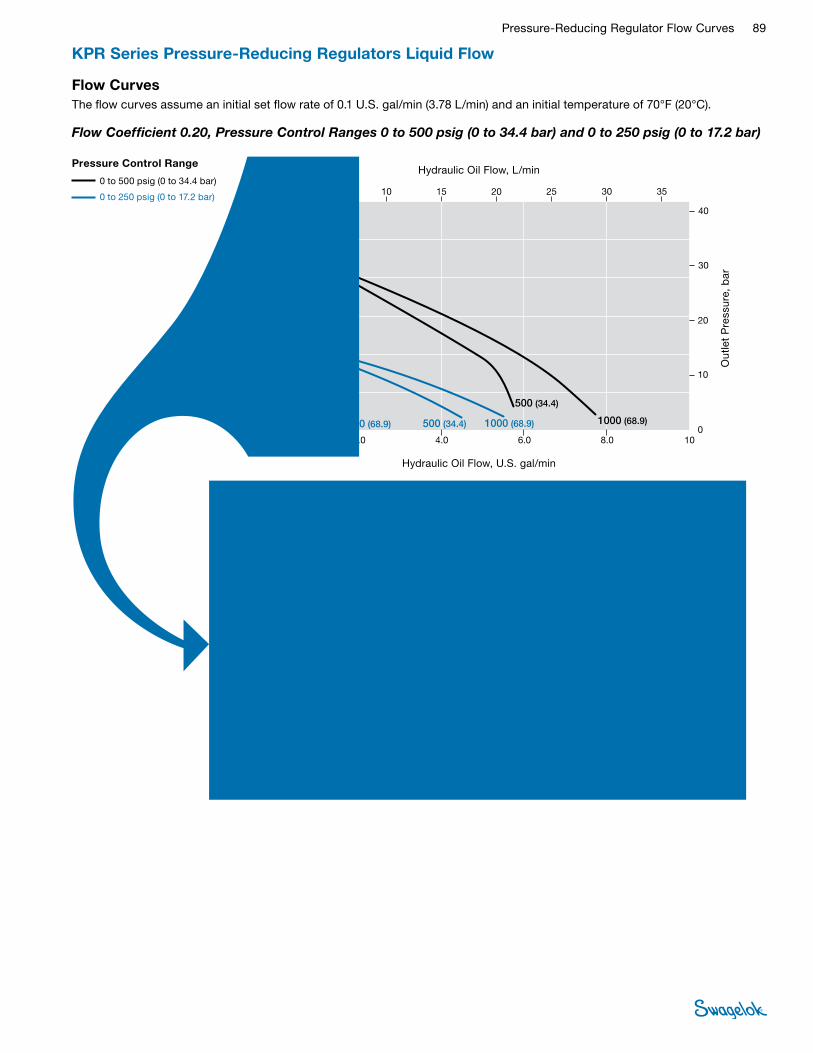
Pressure-Reducing Regulator Flow Curves 89
Flow CurvesThe flow curves assume an initial set flow rate of 0.1 U.S. gal/min (3.78 L/min) and an initial temperature of 70°F (20°C).
Pressure Control Range
0 to 500 psig (0 to 34.4 bar)
0 to 250 psig (0 to 17.2 bar)
Flow Coefficient 0.20, Pressure Control Ranges 0 to 500 psig (0 to 34.4 bar) and 0 to 250 psig (0 to 17.2 bar)
00 2.0
0 5.0
100
200
300
400
500
600
10
20
30
40
8.06.04.0
JPN
EURO
USA
100
30201510 3525
0
0 2,0
0 5,0
100
200
300
400
500
600
10
20
30
40
8,06,04,0 10
030201510 3525
0 5.0
1.0
2.0
3.0
4.0
030201510 3525
500 (34.4)
500 (34.4) 1000 (68.9) 1000 (68.9)500 (34.4), 1000 (68.9)
34.4 (500)
34.4 (500) 68.9 (1000) 68.9 (1000)34.4 (500), 68.9 (1000)
3.44
3.44 6.89 6.893.44, 6.89
Hydraulic Oil Flow, U.S. gal/min
Out
let
Pre
ssur
e, p
sig
Out
let
Pre
ssur
e, b
ar
Hydraulic Oil Flow, L/min
00 0.5
0 1.0
100
200
300
400
500
600
10
20
30
40
1.51.0
JPN
EURO
USA
2.00
6.04.03.02.0 7.05.0
00 1,0
100
200
300
400
500
600
10
20
30
40
06,04,03,02,0 7,05,0
0 1.0
1.0
2.0
3.0
4.0
06.04.03.02.0 7.05.0
0 0,5 1,51,0 2,0
500 (34.4), 1000 (68.9)
500 (34.4), 1000 (68.9)
500 (34.4), 1000 (68.9)
34.4 (500), 68.9 (1000)
34.4 (500), 68.9 (1000)
34.4 (500), 68.9 (1000)
3.44, 6.89
3.44, 6.89
3.44, 6.89
Hydraulic Oil Flow, U.S. gal/min
Out
let
Pre
ssur
e, p
sig
Out
let
Pre
ssur
e, b
ar
Hydraulic Oil Flow, L/min
KPR Series Pressure-Reducing Regulators Liquid Flow
Detail A
A
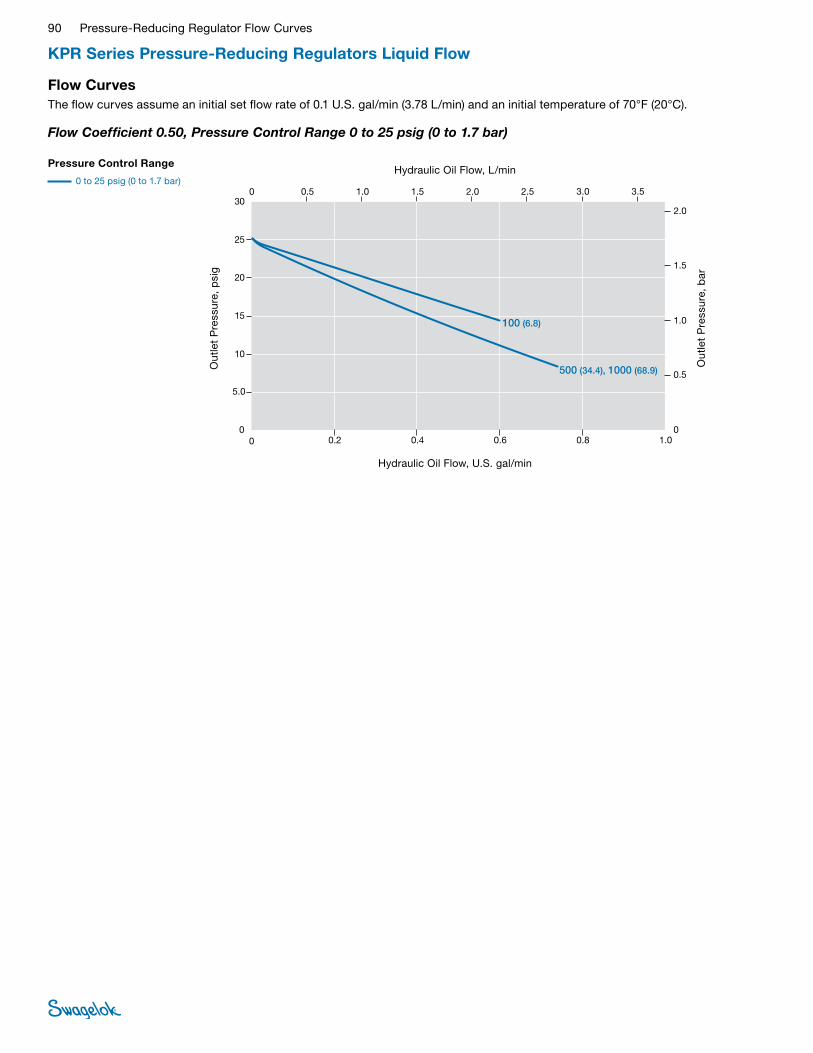
90 Pressure-Reducing Regulator Flow Curves
KPR Series Pressure-Reducing Regulators Liquid Flow
Flow CurvesThe flow curves assume an initial set flow rate of 0.1 U.S. gal/min (3.78 L/min) and an initial temperature of 70°F (20°C).
Flow Coefficient 0.50, Pressure Control Range 0 to 25 psig (0 to 1.7 bar)
00 0.2
0 0.5
5.0
10
15
20
25
30
0.5
1.0
1.5
2.0
0.80.60.4
JPN
EURO
USA
1.00
3.02.01.51.0 3.52.5
0
0 0,2
0 0,5
5,0
10
15
20
25
30
0,5
1,0
1,5
2,0
0,80,60,4 1,0
03,02,01,51,0 3,52,5
0 0.5
0.05
0.10
0.15
0.20
03.02.01.51.0 3.52.5
100 (6.8)
500 (34.4), 1000 (68.9)
6.8 (100)
34.4 (500), 68.9 (1000)
0.68
3.44, 6.89
Hydraulic Oil Flow, U.S. gal/min
Out
let
Pre
ssur
e, p
sig
Out
let
Pre
ssur
e, b
ar
Hydraulic Oil Flow, L/minPressure Control Range
0 to 25 psig (0 to 1.7 bar)

Pressure-Reducing Regulator Flow Curves 91
Flow CurvesThe flow curves assume an initial set flow rate of 0.1 U.S. gal/min (3.78 L/min) and an initial temperature of 70°F (20°C).
Pressure Control Range
0 to 100 psig (0 to 6.8 bar)
0 to 50 psig (0 to 3.4 bar))
Flow Coefficient 0.50, Pressure Control Ranges 0 to 100 psig (0 to 6.8 bar) and 0 to 50 psig (0 to 3.4 bar)
7,5
00 0.5
0 1.5
20
40
60
80
100
120
2.0
4.0
6.0
8.0
2.01.51.0
JPN
EURO
USA
2.50
7.56.04.53.0 9.0
0
0 0,5
0 1,5
20
40
60
80
100
120
2,0
4,0
6,0
8,0
2,01,51,0 2,5
06,04,53,0 9,0
7.50 1.5
0.2
0.4
0.6
0.8
06.04.53.0 9.0
6.8 (100), 34.4 (500), 68.9 (1000)
0.68, 3.44, 6.89
100 (6.8)500 (34.4)
1000 (68.9)100 (6.8), 500 (34.4), 1000 (68.9)
100 (6.8), 500 (34.4)
1000 (68.9)
34.4 (500)6.8 (100)
68.9 (1000)
6.8 (100), 34.4 (500)68.9 (1000)
0.683.44
6.89
0.68, 3.446.89
Hydraulic Oil Flow, U.S. gal/min
Out
let
Pre
ssur
e, p
sig
Out
let
Pre
ssur
e, b
ar
Hydraulic Oil Flow, L/min
00 0.2
0 0.5
20
40
60
80
100
120
2.0
4.0
6.0
8.0
0.80.60.4
JPN
EURO
USA
1.00
3.02.01.51.0 3.52.5
0
0 0,2
0 0,5
20
40
60
80
100
120
2,0
4,0
6,0
8,0
0,80,60,4 1,0
03,02,01,51,0 3,52,5
0 0.5
0.2
0.4
0.6
0.8
03.02.01.51.0 3.52.5
100 (6.8), 500 (34.4), 1000 (68.9)
6.8 (100), 34.4 (500), 68.9 (1000)
0.68, 3.44, 6.89
100 (6.8), 500 (34.4), 1000 (68.9)
100 (6.8), 500 (34.4), 1000 (68.9)
6.8 (100), 34.4 (500), 68.9 (1000)
6.8 (100), 34.4 (500), 68.9 (1000)
0.68, 3.44, 6.890.68, 3.44, 6.89
Hydraulic Oil Flow, U.S. gal/min
Out
let
Pre
ssur
e, p
sig
Out
let
Pre
ssur
e, b
ar
Hydraulic Oil Flow, L/min
KPR Series Pressure-Reducing Regulators Liquid Flow
Detail A
A

92 Pressure-Reducing Regulator Flow Curves
Flow CurvesThe flow curves assume an initial set flow rate of 0.1 U.S. gal/min (3.78 L/min) and an initial temperature of 70°F (20°C).
Pressure Control Range
0 to 500 psig (0 to 34.4 bar)
0 to 250 psig (0 to 17.2 bar)
Flow Coefficient 0.50, Pressure Control Ranges 0 to 500 psig (0 to 34.4 bar) and 0 to 250 psig (0 to 17.2 bar)
00 2.0
0 5.0
100
200
300
400
500
600
10
20
30
40
8.06.04.0
JPN
EURO
USA
100
30201510 3525
0
0 2,0
0 5,0
100
200
300
400
500
600
10
20
30
40
8,06,04,0 10
030201510 3525
0 5.0
1.0
2.0
3.0
4.0
030201510 3525
500 (34.4), 1000 (68.9)
500 (34.4), 1000 (68.9)
500 (34.4), 1000 (68.9)
34.4 (500), 68.9 (1000)
34.4 (500), 68.9 (1000) 34.4 (500), 68.9 (1000)
3.44, 6.89
3.44, 6.89
3.44, 6.89
Hydraulic Oil Flow, U.S. gal/min
Out
let
Pre
ssur
e, p
sig
Out
let
Pre
ssur
e, b
ar
Hydraulic Oil Flow, L/min
00 0.5
0 1.0
100
200
300
400
500
600
10
20
30
40
1.51.0
JPN
EURO
USA
2.00
6.04.03.02.0 7.05.0
00 1,0
100
200
300
400
500
600
10
20
30
40
06,04,03,02,0 7,05,0
0 1.0
1.0
2.0
3.0
4.0
06.04.03.02.0 7.05.0
0 0,5 1,51,0 2,0
500 (34.4), 1000 (68.9)
500 (34.4), 1000 (68.9)
500 (34.4), 1000 (68.9)
34.4 (500), 68.9 (1000)
34.4 (500), 68.9 (1000)
34.4 (500), 68.9 (1000)
3.44, 6.89
3.44, 6.89
3.44, 6.89
Hydraulic Oil Flow, U.S. gal/min
Out
let
Pre
ssur
e, p
sig
Out
let
Pre
ssur
e, b
ar
Hydraulic Oil Flow, L/min
KPR Series Pressure-Reducing Regulators Liquid Flow
Detail A
A

Pressure-Reducing Regulator Flow Curves 93
KCY Series Two-Stage Pressure-Reducing Regulators Liquid Flow
Flow CurvesThe flow curves assume an initial set flow rate of 0.1 U.S. gal/min (3.78 L/min) and an initial temperature of 70°F (20°C).
Pressure Control Range
0 to 25 psig (0 to 1.7 bar)
Flow Coefficient 0.06, Pressure Control Range 0 to 25 psig (0 to 1.7 bar)
Flow Coefficient 0.06, Pressure Control Ranges 0 to 100 psig (0 to 6.8 bar) and 0 to 50 psig (0 to 3.4 bar)
00 0.2
0 0.5
5.0
10
15
20
25
30
0.5
1.0
1.5
2.0
0.80.60.4
JPN
EURO
USA
1.00
3.02.01.51.0 3.52.5
0
0 0,2
0 0,5
5,0
10
15
20
25
30
0,5
1,0
1,5
2,0
0,80,60,4 1,0
03,02,01,51,0 3,52,5
0 0.5
0.05
0.10
0.15
0.20
03.02.01.51.0 3.52.5
750 (51.6)
51.6 (750)
5.16
Hydraulic Oil Flow, U.S. gal/min
Out
let
Pre
ssur
e, p
sig
Out
let
Pre
ssur
e, b
ar
Hydraulic Oil Flow, L/min
00 0.5
0 1.0
20
40
60
80
100
120
2.0
4.0
6.0
8.0
1.51.0
JPN
EURO
USA
2.00
6.04.03.02.0 7.05.0
00 1,0
20
40
60
80
100
120
2,0
4,0
6,0
8,0
06,04,03,02,0 7,05,0
0 1.0
0.2
0.4
0.6
0.8
06.04.03.02.0 7.05.0
0 0,5 1,51,0 2,0
750 (51.6)
750 (51.6)
750 (51.6)
51.6 (750)
51.6 (750)
51.6 (750)
5.16
5.16
5.16
Hydraulic Oil Flow, U.S. gal/min
Out
let
Pre
ssur
e, p
sig
Out
let
Pre
ssur
e, b
ar
Hydraulic Oil Flow, L/minPressure Control Range
0 to 100 psig (0 to 6.8 bar)
0 to 50 psig (0 to 3.4 bar))
The KCY series is designed for use in applications requiring constant outlet pressure even with wide variations in inlet pressure. This two-stage regulator is comparable to two single-stage regulators connected in series. The first stage is factory set to reduce the inlet pressure to 500 psig (34.4 bar). The second stage can be adjusted with the handle to achieve the required outlet pressure.
For features, additional technical data, materials of construction, and ordering information, see the Swagelok Pressure Regulators catalog, MS-02-230.
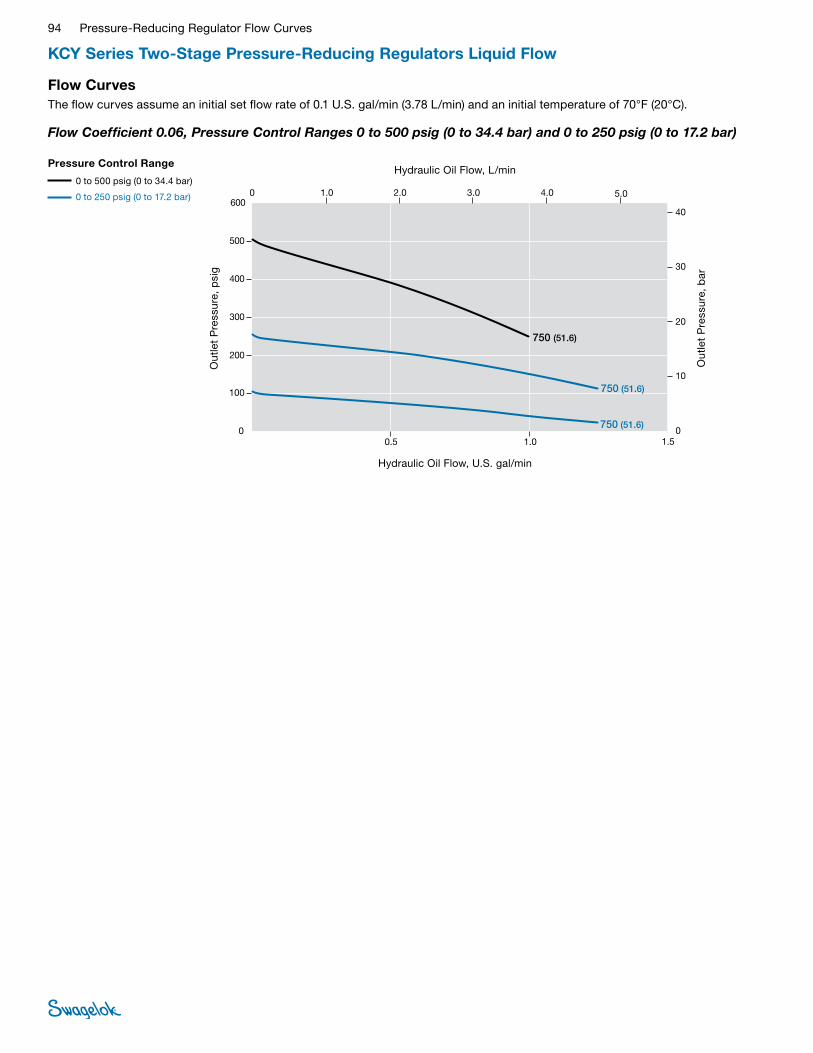
94 Pressure-Reducing Regulator Flow Curves
KCY Series Two-Stage Pressure-Reducing Regulators Liquid Flow
Flow CurvesThe flow curves assume an initial set flow rate of 0.1 U.S. gal/min (3.78 L/min) and an initial temperature of 70°F (20°C).
Flow Coefficient 0.06, Pressure Control Ranges 0 to 500 psig (0 to 34.4 bar) and 0 to 250 psig (0 to 17.2 bar)
0
0,5
0 1.0
100
200
300
400
500
600
10
20
30
40
1,0
JPN
USA
1,5
0
5.03.02.0 4.0
0
0
0
100
200
300
400
500
600
10
20
30
40
0
0.5 1.0 1.5
1,0 4,0 5,02,0 3,0
0
1.0
2.0
3.0
4.0
01.0 4.0 5.02.0 3.0
EURO
0
750 (51.6)
750 (51.6)
750 (51.6)
51.6 (750)
51.6 (750)
51.6 (750)
5.16
5.16
5.16
Hydraulic Oil Flow, U.S. gal/min
Out
let
Pre
ssur
e, p
sig
Out
let
Pre
ssur
e, b
ar
Hydraulic Oil Flow, L/minPressure Control Range
0 to 500 psig (0 to 34.4 bar)
0 to 250 psig (0 to 17.2 bar)

Pressure-Reducing Regulator Flow Curves 95
KCY Series Two-Stage Pressure-Reducing Regulators Liquid Flow
Flow CurvesThe flow curves assume an initial set flow rate of 0.1 U.S. gal/min (3.78 L/min) and an initial temperature of 70°F (20°C).
Flow Coefficient 0.20, Pressure Control Range 0 to 25 psig (0 to 1.7 bar)
00 0.2
0 0.5
20
30
40
2.5
0.80.60.4
JPN
EURO
USA
1.0
3.02.01.51.0 3.52.5
10
2.0
0.5
1.0
1.5
0
00
0,20
0,5
20
30
40
2,5
0,80,60,4 1,0
3,02,01,51,0 3,52,5
10
2,0
0,5
1,0
1,5
00 0.5
0.25
3.02.01.51.0 3.52.5
0.20
0.05
0.10
0.15
0
750 (51.6)
51.6 (750)
5.16
Hydraulic Oil Flow, U.S. gal/min
Out
let
Pre
ssur
e, p
sig
Out
let
Pre
ssur
e, b
ar
Hydraulic Oil Flow, L/minPressure Control Range
0 to 25 psig (0 to 1.7 bar)
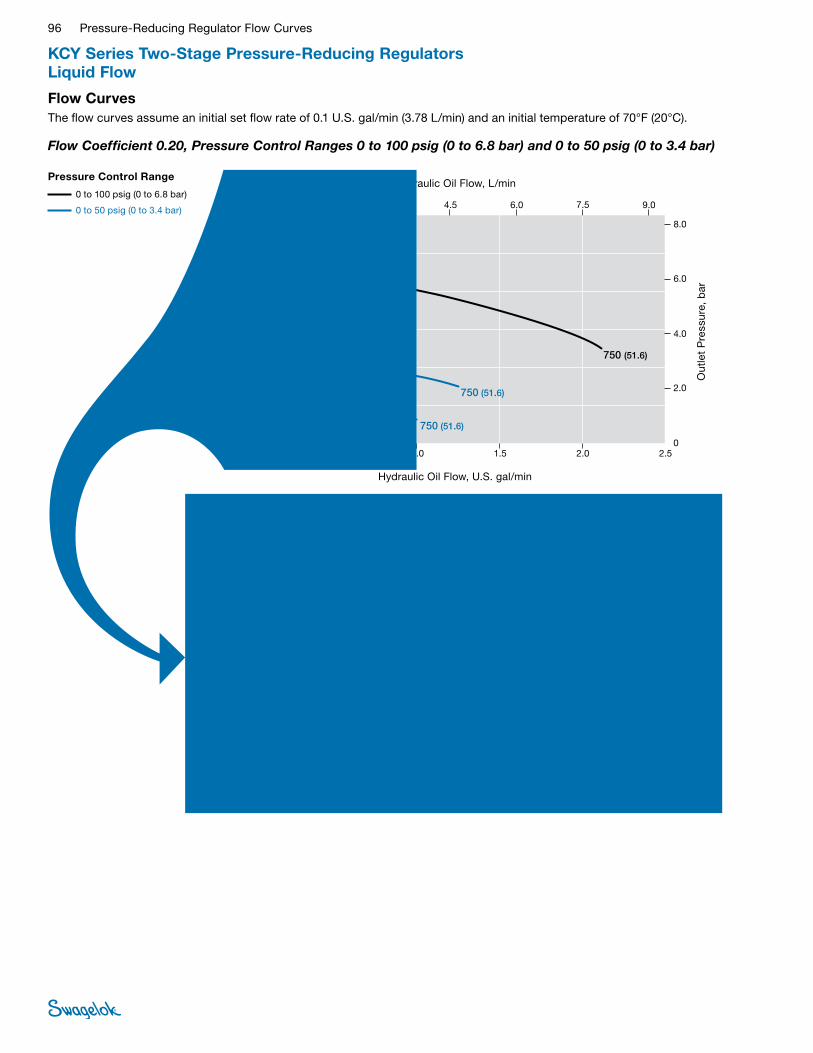
96 Pressure-Reducing Regulator Flow Curves
KCY Series Two-Stage Pressure-Reducing Regulators Liquid Flow
Flow CurvesThe flow curves assume an initial set flow rate of 0.1 U.S. gal/min (3.78 L/min) and an initial temperature of 70°F (20°C).
Pressure Control Range
0 to 100 psig (0 to 6.8 bar)
0 to 50 psig (0 to 3.4 bar)
Flow Coefficient 0.20, Pressure Control Ranges 0 to 100 psig (0 to 6.8 bar) and 0 to 50 psig (0 to 3.4 bar)
7,5
00 0.5
0 1.5
20
40
60
80
100
120
2.0
4.0
6.0
8.0
2.01.51.0
JPN
EURO
USA
2.50
7.56.04.53.0 9.0
0
0 0,5
0 1,5
20
40
60
80
100
120
2,0
4,0
6,0
8,0
2,01,51,0 2,5
06,04,53,0 9,0
7.50 1.5
0.2
0.4
0.6
0.8
06.04.53.0 9.0
750 (51.6)
750 (51.6)
750 (51.6)
51.6 (750)
51.6 (750)
51.6 (750)
5.16
5.16
5.16
Hydraulic Oil Flow, U.S. gal/min
Out
let
Pre
ssur
e, p
sig
Out
let
Pre
ssur
e, b
ar
Hydraulic Oil Flow, L/min
00 0.2
0 0.5
20
40
60
80
100
120
2.0
4.0
6.0
8.0
0.80.60.4
JPN
EURO
USA
1.00
3.02.01.51.0 3.52.5
0
0 0,2
0 0,5
20
40
60
80
100
120
2,0
4,0
6,0
8,0
0,80,60,4 1,0
03,02,01,51,0 3,52,5
0 0.5
0.2
0.4
0.6
0.8
03.02.01.51.0 3.52.5
750 (51.6)
750 (51.6)
750 (51.6)
51.6 (750)
51.6 (750)
51.6 (750)
5.16
5.16
5.16
Hydraulic Oil Flow, U.S. gal/min
Out
let
Pre
ssur
e, p
sig
Out
let
Pre
ssur
e, b
ar
Hydraulic Oil Flow, L/minDetail A
A
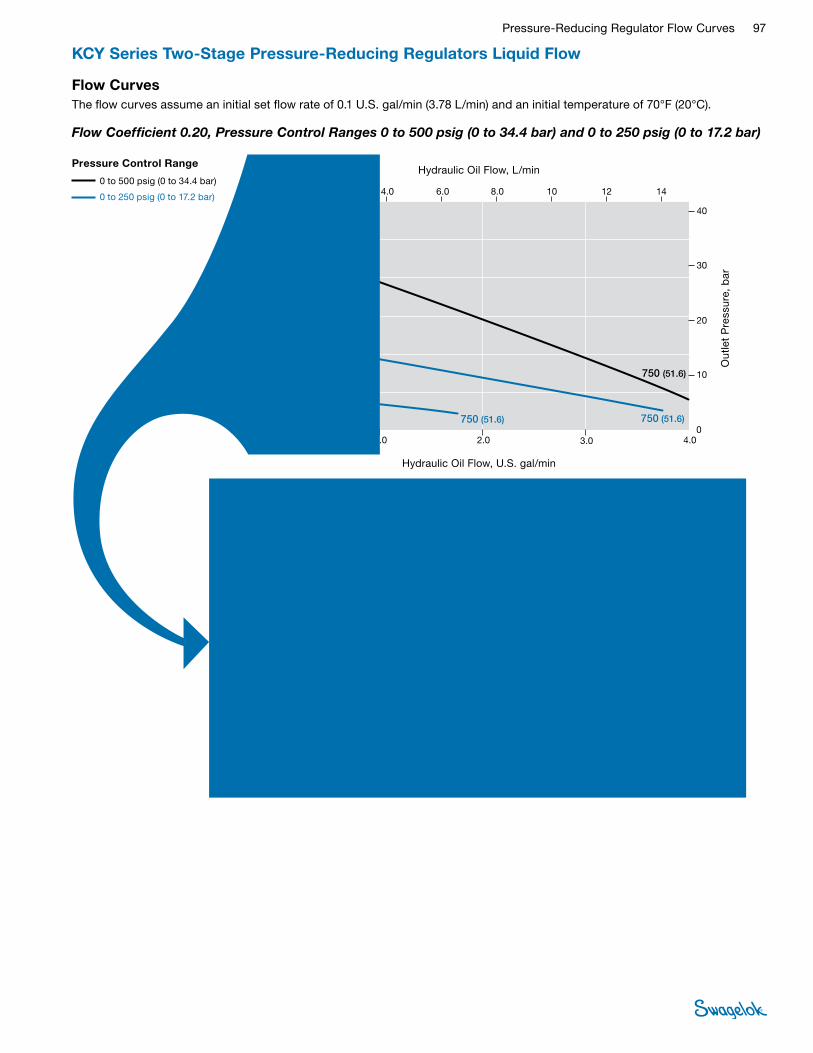
Pressure-Reducing Regulator Flow Curves 97
KCY Series Two-Stage Pressure-Reducing Regulators Liquid Flow
Flow CurvesThe flow curves assume an initial set flow rate of 0.1 U.S. gal/min (3.78 L/min) and an initial temperature of 70°F (20°C).
Pressure Control Range
0 to 500 psig (0 to 34.4 bar)
0 to 250 psig (0 to 17.2 bar)
Flow Coefficient 0.20, Pressure Control Ranges 0 to 500 psig (0 to 34.4 bar) and 0 to 250 psig (0 to 17.2 bar)
00 1.0
0 2.0
100
200
300
400
500
600
10
20
30
40
3.02.0
JPN
EURO
USA
4.00
128.06.04.0 1410
00 2,0
100
200
300
400
500
600
10
20
30
40
0128,06,04,0 1410
0 2.0
1.0
2.0
3.0
4.0
0128.06.04.0 1410
0 1,0 3,02,0 4,0
750 (51.6)
750 (51.6)
750 (51.6)
51.6 (750)
51.6 (750)
51.6 (750)
5.16
5.16
5.16
Hydraulic Oil Flow, U.S. gal/min
Out
let
Pre
ssur
e, p
sig
Out
let
Pre
ssur
e, b
ar
Hydraulic Oil Flow, L/min
00 0.2
0 0.5
100
200
300
400
500
600
10
20
30
40
0.80.60.4
JPN
EURO
USA
1.00
3.02.01.51.0 3.52.5
0
0 0,2
0 0,5
100
200
300
400
500
600
10
20
30
40
0,80,60,4 1,0
03,02,01,51,0 3,52,5
0 0.5
1.0
2.0
3.0
4.0
03.02.01.51.0 3.52.5
750 (51.6)
750 (51.6)
750 (51.6)
51.6 (750)
51.6 (750)
51.6 (750)
5.16
5.16
5.16
Hydraulic Oil Flow, U.S. gal/min
Out
let
Pre
ssur
e, p
sig
Out
let
Pre
ssur
e, b
ar
Hydraulic Oil Flow, L/minDetail A
A

98 Pressure-Reducing Regulator Flow Curves
KCY Series Two-Stage Pressure-Reducing Regulators Liquid Flow
Flow CurvesThe flow curves assume an initial set flow rate of 0.1 U.S. gal/min (3.78 L/min) and an initial temperature of 70°F (20°C).
Flow Coefficient 0.50, Pressure Control Range 0 to 25 psig (0 to 1.7 bar)
00 0.2
0 0.5
5.0
10
15
20
25
30
0.5
1.0
1.5
2.0
0.80.60.4
JPN
EURO
USA
1.00
3.02.01.51.0 3.52.5
0
0 0,2
0 0,5
5,0
10
15
20
25
30
0,5
1,0
1,5
2,0
0,80,60,4 1,0
03,02,01,51,0 3,52,5
0 0.5
0.05
0.10
0.15
0.20
03.02.01.51.0 3.52.5
750 (51.6)
51.6 (750)
5.16
Hydraulic Oil Flow, U.S. gal/min
Out
let
Pre
ssur
e, p
sig
Out
let
Pre
ssur
e, b
ar
Hydraulic Oil Flow, L/minPressure Control Range
0 to 25 psig (0 to 1.7 bar)

Pressure-Reducing Regulator Flow Curves 99
Flow CurvesThe flow curves assume an initial set flow rate of 0.1 U.S. gal/min (3.78 L/min) and an initial temperature of 70°F (20°C).
Pressure Control Range
0 to 100 psig (0 to 6.8 bar)
0 to 50 psig (0 to 3.4 bar)
Flow Coefficient 0.50, Pressure Control Ranges 0 to 100 psig (0 to 6.8 bar) and 0 to 50 psig (0 to 3.4 bar)
7,5
00 0.5
0 1.5
20
40
60
80
100
120
2.0
4.0
6.0
8.0
2.01.51.0
JPN
EURO
USA
2.50
7.56.04.53.0 9.0
0
0 0,5
0 1,5
20
40
60
80
100
120
2,0
4,0
6,0
8,0
2,01,51,0 2,5
06,04,53,0 9,0
7.50 1.5
0.2
0.4
0.6
0.8
06.04.53.0 9.0
750 (51.6)
750 (51.6)
750 (51.6)
51.6 (750)
51.6 (750)
51.6 (750)
5.16
5.16
5.16
Hydraulic Oil Flow, U.S. gal/min
Out
let
Pre
ssur
e, p
sig
Out
let
Pre
ssur
e, b
ar
Hydraulic Oil Flow, L/min
00 0.2
0 0.5
20
40
60
80
100
120
2.0
4.0
6.0
8.0
0.80.60.4
JPN
EURO
USA
1.00
3.02.01.51.0 3.52.5
0
0 0,2
0 0,5
20
40
60
80
100
120
2,0
4,0
6,0
8,0
0,80,60,4 1,0
03,02,01,51,0 3,52,5
0 0.5
0.2
0.4
0.6
0.8
03.02.01.51.0 3.52.5
750 (51.6)
750 (51.6)
750 (51.6)
51.6 (750)
51.6 (750)
51.6 (750)
5.16
5.16
5.16
Hydraulic Oil Flow, U.S. gal/min
Out
let
Pre
ssur
e, p
sig
Out
let
Pre
ssur
e, b
ar
Hydraulic Oil Flow, L/min
KCY Series Two-Stage Pressure-Reducing Regulators Liquid Flow
Detail A
A

100 Pressure-Reducing Regulator Flow Curves
KCY Series Two-Stage Pressure-Reducing Regulators Liquid Flow
Flow CurvesThe flow curves assume an initial set flow rate of 0.1 U.S. gal/min (3.78 L/min) and an initial temperature of 70°F (20°C).
Pressure Control Range
0 to 500 psig (0 to 34.4 bar)
0 to 250 psig (0 to 17.2 bar)
Flow Coefficient 0.50, Pressure Control Ranges 0 to 500 psig (0 to 34.4 bar) and 0 to 250 psig (0 to 17.2 bar)
15
00 1.0
0 3.0
100
200
300
400
500
600
10
20
30
40
4.03.02.0
JPN
EURO
USA
5.00
15129.06.0 18
0
0 1,0
0 3,0
100
200
300
400
500
600
10
20
30
40
4,03,02,0 5,0
0129,06,0 18
150 3.0
1.0
2.0
3.0
4.0
0129.06.0 18
750 (51.6)
750 (51.6)
750 (51.6)
51.6 (750)
51.6 (750)
51.6 (750)
5.165.16
5.16
Hydraulic Oil Flow, U.S. gal/min
Out
let
Pre
ssur
e, p
sig
Out
let
Pre
ssur
e, b
ar
Hydraulic Oil Flow, L/min
00 0.2
0 0.5
100
200
300
400
500
600
10
20
30
40
0.80.60.4
JPN
EURO
USA
1.00
3.02.01.51.0 3.52.5
0
0 0,2
0 0,5
100
200
300
400
500
600
10
20
30
40
0,80,60,4 1,0
03,02,01,51,0 3,52,5
0 0.5
1.0
2.0
3.0
4.0
03.02.01.51.0 3.52.5
750 (51.6)
750 (51.6)
750 (51.6)
51.6 (750)
51.6 (750)
51.6 (750)
5.16
5.16
5.16
Hydraulic Oil Flow, U.S. gal/min
Out
let
Pre
ssur
e, p
sig
Out
let
Pre
ssur
e, b
ar
Hydraulic Oil Flow, L/minDetail A
A

Pressure-Reducing Regulator Flow Curves 101
KLF Series High-Sensitivity Pressure-Reducing Regulators Liquid Flow
Flow CurvesThe flow curves assume an initial set flow rate of 0.1 U.S. gal/min (3.78 L/min) and an initial temperature of 70°F (20°C).
Pressure Control Range
0 to 10 psig (0 to 0.68 bar)
Flow Coefficient 0.06, Pressure Control Range 0 to 10 psig (0 to 0.68 bar)
Flow Coefficient 0.06, Pressure Control Ranges 0 to 50 psig (0 to 3.4 bar) and 0 to 25 psig (0 to 1.7 bar)
00 0.2
0 0.5
5.0
10
15
0.25
0.50
0.75
1.00
0.80.60.4
JPN
EURO
USA
1.00
3.02.01.51.0 3.52.5
0
0 0,2
0 0,5
5,0
10
15
0,25
0,50
0,75
1,00
0,80,60,4 1,0
03,02,01,51,0 3,52,5
0 0.5
0.025
0.050
0.075
0.100
03.02.01.51.0 3.52.5
100 (6.8)
500 (34.4), 1000 (68.9)
6.8 (100)
34.4 (500), 68.9 (1000)
0.68
3.44, 6.89
Hydraulic Oil Flow, U.S. gal/min
Out
let
Pre
ssur
e, p
sig
Out
let
Pre
ssur
e, b
ar
Hydraulic Oil Flow, L/min
0
0,5
0 1.0
10
20
30
40
50
60
1.0
2.0
3.0
4.0
1,0
JPN
USA
1,5
0
5.03.02.0 4.0
0
0
0
10
20
30
40
50
60
1,0
2,0
3,0
4,0
0
0.5 1.0 1.5
1,0 4,0 5,02,0 3,0
0
0.1
0.2
0.3
0.4
01.0 4.0 5.02.0 3.0
EURO
100 (6.8) 500 (34.4), 1000 (68.9)
500 (34.4), 1000 (68.9)100 (6.8)
6.8 (100) 34.4 (500), 68.9 (1000)
34.4 (500), 68.9 (1000)6.8 (100)
0.68 3.44, 6.89
0.68 3.44, 6.89
Hydraulic Oil Flow, U.S. gal/min
Out
let
Pre
ssur
e, p
sig
Out
let
Pre
ssur
e, b
ar
Hydraulic Oil Flow, L/minPressure Control Range
0 to 50 psig (0 to 3.4 bar)
0 to 25 psig (0 to 1.7 bar)
The KLF series provides high-sensitivity pressure control of gases or liquids with minimum droop in both low-flow and low-pressure applications.
For features, additional technical data, materials of construction, and ordering information, see the Swagelok Pressure Regulators catalog, MS-02-230.

102 Pressure-Reducing Regulator Flow Curves
KLF Series High-Sensitivity Pressure-Reducing Regulators Liquid Flow
Flow CurvesThe flow curves assume an initial set flow rate of 0.1 U.S. gal/min (3.78 L/min) and an initial temperature of 70°F (20°C).
Pressure Control Range
0 to 100 psig (0 to 6.8 bar)
Flow Coefficient 0.06, Pressure Control Range 0 to 100 psig (0 to 6.8 bar)
Flow Coefficient 0.06, Pressure Control Range 0 to 250 psig (0 to 17.2 bar)
0
0,5
0 1.0
20
40
60
80
100
120
2.0
4.0
6.0
8.0
1,0
JPN
USA
1,5
0
5.03.02.0 4.0
0
0
0
20
40
60
80
100
120
2,0
4,0
6,0
8,0
0
0.5 1.0 1.5
1,0 4,0 5,02,0 3,0
0
0.2
0.4
0.6
0.8
01.0 4.0 5.02.0 3.0
EURO
500 (34.4)
500 (34.4)
500 (34.4)
1000 (68.9)
1000 (68.9)
1000 (68.9)
34.4 (500)
34.4 (500)
34.4 (500)
68.9 (1000)
68.9 (1000)
68.9 (1000)
3.44
3.44
3.44
6.89
6.89
6.89
Hydraulic Oil Flow, U.S. gal/min
Out
let
Pre
ssur
e, p
sig
Out
let
Pre
ssur
e, b
ar
Hydraulic Oil Flow, L/min
0
0,5
0 1.0
50
100
150
200
250
300
5.0
10
15
20
1,0
JPN
USA
1,5
0
5.03.02.0 4.0
0
0
0
50
100
150
200
250
300
5,0
10
15
20
0
0.5 1.0 1.5
1,0 4,0 5,02,0 3,0
0
0.5
1.0
1.5
2.0
01.0 4.0 5.02.0 3.0
EURO
500 (34.4)
500 (34.4)
500 (34.4)
1000 (68.9)
1000 (68.9)
1000 (68.9)
34.4 (500)
34.4 (500)
34.4 (500)
68.9 (1000)
68.9 (1000)
68.9 (1000)
3.44
3.44
3.44
6.89
6.89
6.89
Hydraulic Oil Flow, U.S. gal/min
Out
let
Pre
ssur
e, p
sig
Out
let
Pre
ssur
e, b
ar
Hydraulic Oil Flow, L/minPressure Control Range
0 to 250 psig (0 to 17.2 bar)
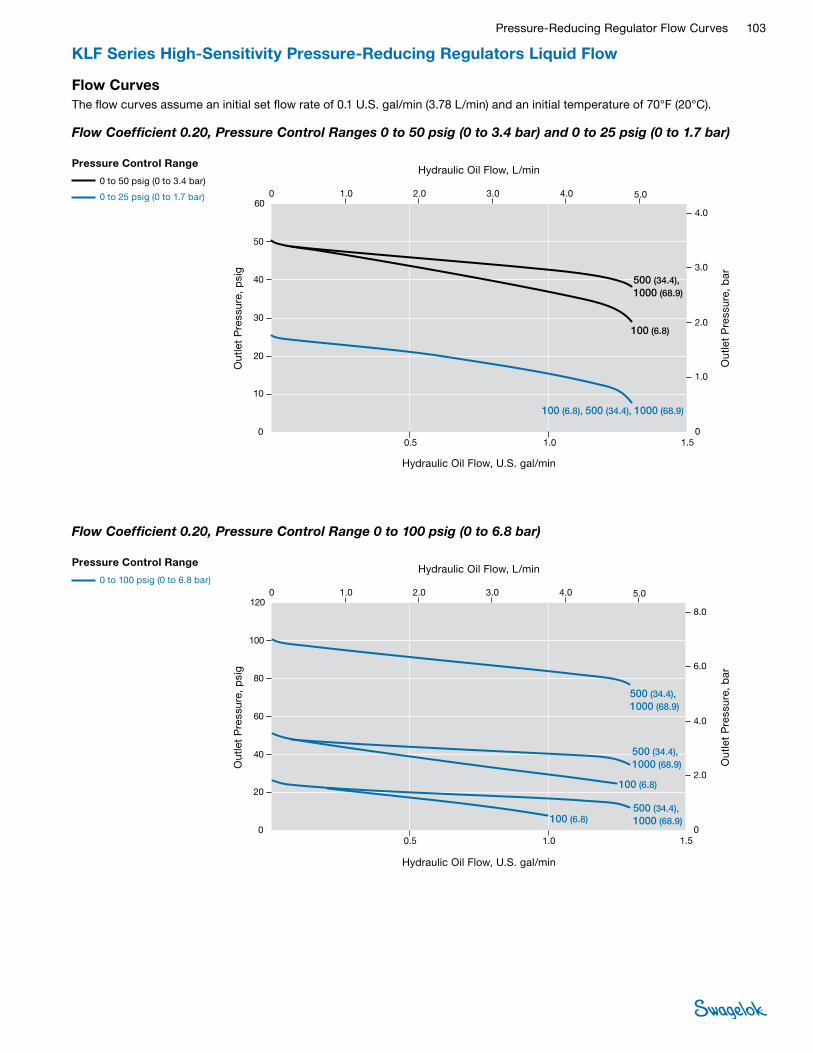
Pressure-Reducing Regulator Flow Curves 103
KLF Series High-Sensitivity Pressure-Reducing Regulators Liquid Flow
Flow CurvesThe flow curves assume an initial set flow rate of 0.1 U.S. gal/min (3.78 L/min) and an initial temperature of 70°F (20°C).
Flow Coefficient 0.20, Pressure Control Ranges 0 to 50 psig (0 to 3.4 bar) and 0 to 25 psig (0 to 1.7 bar)
Flow Coefficient 0.20, Pressure Control Range 0 to 100 psig (0 to 6.8 bar)
0
0,5
0 1.0
10
20
30
40
50
60
1.0
2.0
3.0
4.0
1,0
JPN
USA
1,5
0
5.03.02.0 4.0
0
0
0
10
20
30
40
50
60
1,0
2,0
3,0
4,0
0
0.5 1.0 1.5
1,0 4,0 5,02,0 3,0
0
0.1
0.2
0.3
0.4
01.0 4.0 5.02.0 3.0
EURO
100 (6.8), 500 (34.4), 1000 (68.9)
6.8 (100), 34.4 (500), 68.9 (1000)
0.68, 3.44, 6.89
500 (34.4), 1000 (68.9)
100 (6.8)
34.4 (500), 68.9 (1000)
6.8 (100)
3.44, 6.89
0.68
Hydraulic Oil Flow, U.S. gal/min
Out
let
Pre
ssur
e, p
sig
Out
let
Pre
ssur
e, b
ar
Hydraulic Oil Flow, L/min
0
0,5
0 1.0
20
40
60
80
100
120
2.0
4.0
6.0
8.0
1,0
JPN
USA
1,5
0
5.03.02.0 4.0
0
0
0
20
40
60
80
100
120
2,0
4,0
6,0
8,0
0
0.5 1.0 1.5
1,0 4,0 5,02,0 3,0
0
0.2
0.4
0.6
0.8
01.0 4.0 5.02.0 3.0
EURO
500 (34.4), 1000 (68.9)
500 (34.4), 1000 (68.9)
500 (34.4), 1000 (68.9)100 (6.8)
100 (6.8)
34.4 (500), 68.9 (1000)
34.4 (500), 68.9 (1000)
34.4 (500), 68.9 (1000)
6.8 (100)
6.8 (100)
3.44, 6.89
3.44, 6.89
3.44, 6.89
0.68
0.68
Hydraulic Oil Flow, U.S. gal/min
Out
let
Pre
ssur
e, p
sig
Out
let
Pre
ssur
e, b
ar
Hydraulic Oil Flow, L/minPressure Control Range
0 to 100 psig (0 to 6.8 bar)
Pressure Control Range
0 to 50 psig (0 to 3.4 bar)
0 to 25 psig (0 to 1.7 bar)
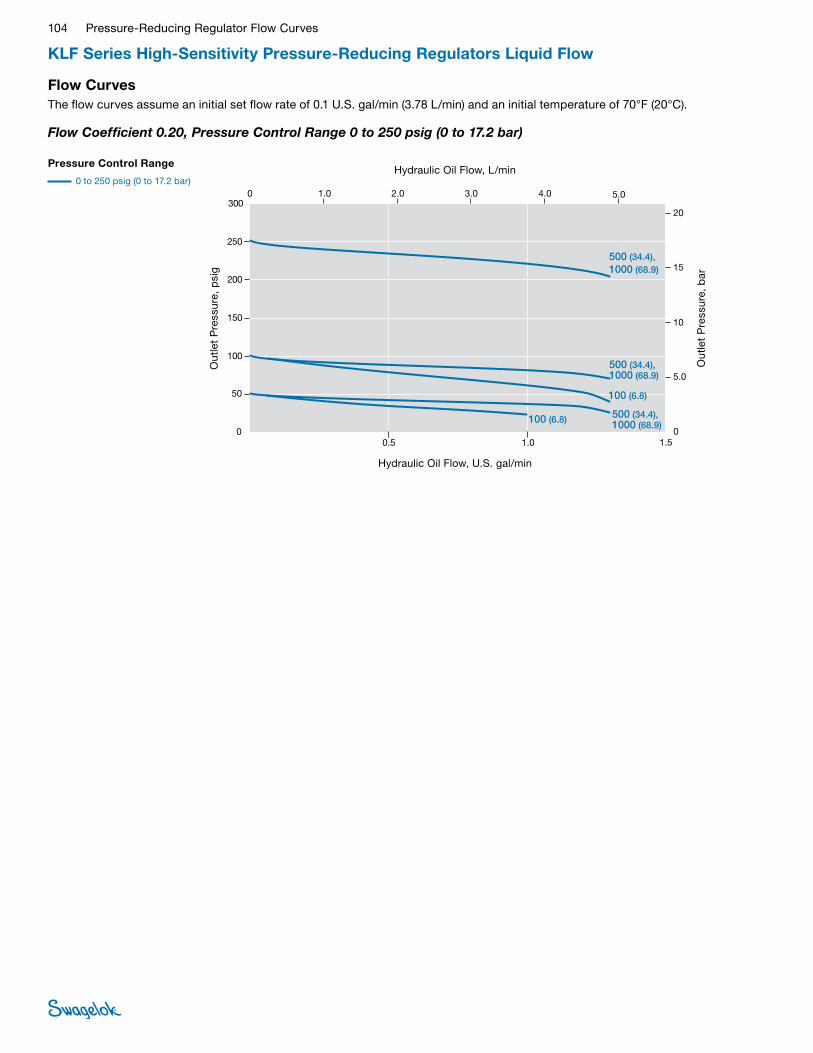
104 Pressure-Reducing Regulator Flow Curves
KLF Series High-Sensitivity Pressure-Reducing Regulators Liquid Flow
Flow CurvesThe flow curves assume an initial set flow rate of 0.1 U.S. gal/min (3.78 L/min) and an initial temperature of 70°F (20°C).
Pressure Control Range
0 to 250 psig (0 to 17.2 bar)
Flow Coefficient 0.20, Pressure Control Range 0 to 250 psig (0 to 17.2 bar)
0
0,5
0 1.0
50
100
150
200
250
300
5.0
10
15
20
1,0
JPN
USA
1,5
0
5.03.02.0 4.0
0
0
0
50
100
150
200
250
300
5,0
10
15
20
0
0.5 1.0 1.5
1,0 4,0 5,02,0 3,0
0
0.5
1.0
1.5
2.0
01.0 4.0 5.02.0 3.0
EURO
500 (34.4), 1000 (68.9)
500 (34.4), 1000 (68.9)
500 (34.4), 1000 (68.9)
100 (6.8)
100 (6.8)
34.4 (500), 68.9 (1000)
34.4 (500), 68.9 (1000)
34.4 (500), 68.9 (1000)
6.8 (100)
6.8 (100)
3.44, 6.89
3.44, 6.89
3.44, 6.890.68
0.68
Hydraulic Oil Flow, U.S. gal/min
Out
let
Pre
ssur
e, p
sig
Out
let
Pre
ssur
e, b
ar
Hydraulic Oil Flow, L/min
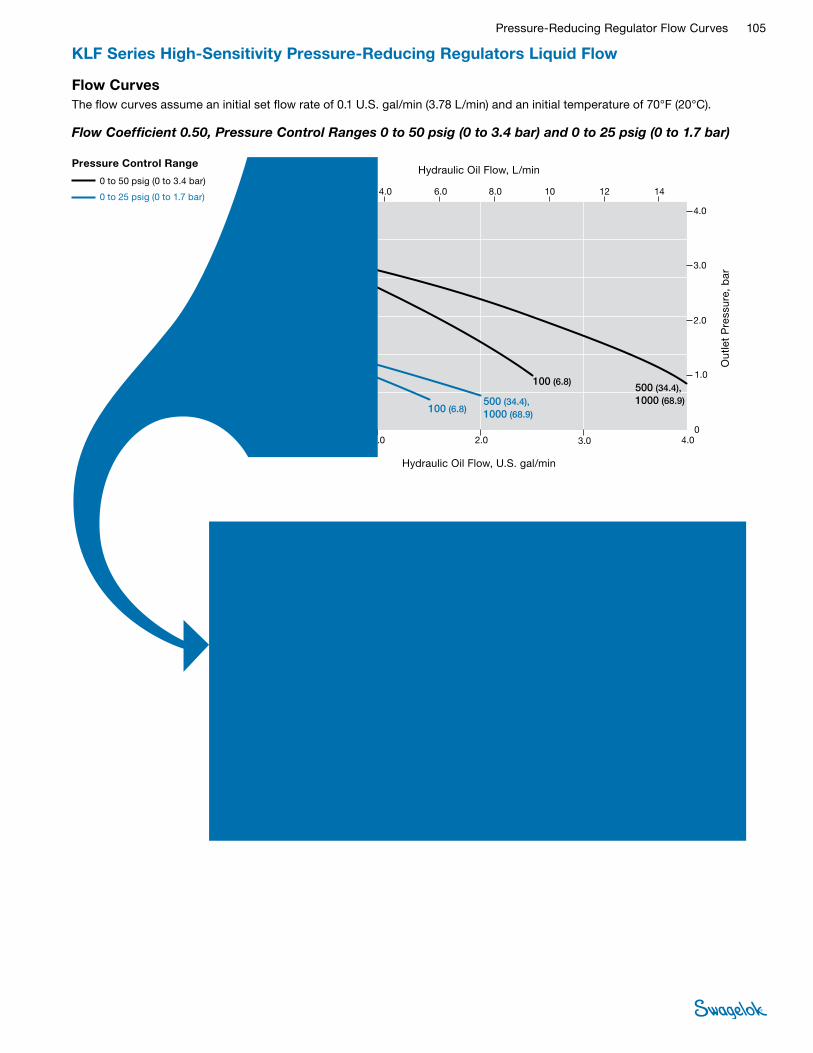
Pressure-Reducing Regulator Flow Curves 105
KLF Series High-Sensitivity Pressure-Reducing Regulators Liquid Flow
Flow CurvesThe flow curves assume an initial set flow rate of 0.1 U.S. gal/min (3.78 L/min) and an initial temperature of 70°F (20°C).
Pressure Control Range
0 to 50 psig (0 to 3.4 bar)
0 to 25 psig (0 to 1.7 bar)
Flow Coefficient 0.50, Pressure Control Ranges 0 to 50 psig (0 to 3.4 bar) and 0 to 25 psig (0 to 1.7 bar)
00 1.0
0 2.0
10
20
30
40
50
60
1.0
2.0
3.0
4.0
3.02.0
JPN
EURO
USA
4.00
128.06.04.0 1410
00 2,0
10
20
30
40
50
60
1,0
2,0
3,0
4,0
0128,06,04,0 1410
0 2.0
0.1
0.2
0.3
0.4
0128.06.04.0 1410
0 1,0 3,02,0 4,0
100 (6.8)
100 (6.8)500 (34.4), 1000 (68.9)500 (34.4),
1000 (68.9)
6.8 (100)
6.8 (100)34.4 (500), 68.9 (1000)
34.4 (500), 68.9 (1000)
3.44, 6.890.68
0.68 3.44, 6.89
Hydraulic Oil Flow, U.S. gal/min
Out
let
Pre
ssur
e, p
sig
Out
let
Pre
ssur
e, b
ar
Hydraulic Oil Flow, L/min
00 0.2
0 0.5
10
20
30
40
50
60
1.0
2.0
3.0
4.0
0.80.60.4
JPN
EURO
USA
1.00
3.02.01.51.0 3.52.5
0
0 0,2
0 0,5
10
20
30
40
50
60
1,0
2,0
3,0
4,0
0,80,60,4 1,0
03,02,01,51,0 3,52,5
0 0.5
0.1
0.2
0.3
0.4
03.02.01.51.0 3.52.5
100 (6.8)
100 (6.8)
500 (34.4), 1000 (68.9)
500 (34.4), 1000 (68.9)
34.4 (500), 68.9 (1000)
6.8 (100)
6.8 (100)
34.4 (500), 68.9 (1000)
0.68
0.68
3.44, 6.89
3.44, 6.89
Hydraulic Oil Flow, U.S. gal/min
Out
let
Pre
ssur
e, p
sig
Out
let
Pre
ssur
e, b
ar
Hydraulic Oil Flow, L/minDetail A
A

106 Pressure-Reducing Regulator Flow Curves
KLF Series High-Sensitivity Pressure-Reducing Regulators Liquid Flow
Flow CurvesThe flow curves assume an initial set flow rate of 0.1 U.S. gal/min (3.78 L/min) and an initial temperature of 70°F (20°C).
00 0.2
0 0.5
20
40
60
80
100
120
2.0
4.0
6.0
8.0
0.80.60.4
JPN
EURO
USA
1.00
3.02.01.51.0 3.52.5
0
0 0,2
0 0,5
20
40
60
80
100
120
2,0
4,0
6,0
8,0
0,80,60,4 1,0
03,02,01,51,0 3,52,5
0 0.5
0.2
0.4
0.6
0.8
03.02.01.51.0 3.52.5
500 (34.4), 1000 (68.9)
500 (34.4), 1000 (68.9)
500 (34.4), 1000 (68.9)
100 (6.8)
100 (6.8)
34.4 (500), 68.9 (1000)
34.4 (500), 68.9 (1000)
34.4 (500), 68.9 (1000)
6.8 (100)
6.8 (100)
3.44, 6.89
3.44, 6.89
3.44, 6.89
0.68
0.68
Hydraulic Oil Flow, U.S. gal/min
Out
let
Pre
ssur
e, p
sig
Out
let
Pre
ssur
e, b
ar
Hydraulic Oil Flow, L/min
Flow Coefficient 0.50, Pressure Control Range 0 to 100 psig (0 to 6.8 bar)
00 1.0
0 4.0
20
40
60
80
100
120
2.0
4.0
6.0
8.0
4.03.02.0
JPN
EURO
USA
5.00
16128.0 20
6.0
0
0 1,0
0 4,0
20
40
60
80
100
120
2,0
4,0
6,0
8,0
4,03,02,0 5,0
016128,0 20
6,0
0 4.0
0.2
0.4
0.6
0.8
016128.0 20
100 (6.8)
100 (6.8)
500 (34.4)
500 (34.4)
500 (34.4), 1000 (68.9)1000 (68.9)
1000 (68.9)
6.8 (100)
6.8 (100) 34.4 (500)68.9 (1000)
68.9 (1000)
34.4 (500)
34.4 (500), 68.9 (1000)
0.68
0.68 3.44 6.89
6.893.44
3.44, 6.89
Hydraulic Oil Flow, U.S. gal/min
Out
let
Pre
ssur
e, p
sig
Out
let
Pre
ssur
e, b
ar
Hydraulic Oil Flow, L/minPressure Control Range
0 to 100 psig (0 to 6.8 bar)
Detail A
A

Pressure-Reducing Regulator Flow Curves 107
KLF Series High-Sensitivity Pressure-Reducing Regulators Liquid Flow
Flow CurvesThe flow curves assume an initial set flow rate of 0.1 U.S. gal/min (3.78 L/min) and an initial temperature of 70°F (20°C).
Pressure Control Range
0 to 250 psig (0 to 17.2 bar)
Flow Coefficient 0.50, Pressure Control Range 0 to 250 psig (0 to 17.2 bar)
00 2.0
0 5.0
50
100
150
200
250
300
5.0
10
15
20
8.06.04.0
JPN
EURO
USA
100
30201510 3525
0
0 2,0
0 5,0
50
100
150
200
250
300
5,0
10
15
20
8,06,04,0 10
030201510 3525
0 5.0
0.5
1.0
1.5
2.0
030201510 3525
100 (6.8) 500 (34.4) 500 (34.4)1000 (68.9)
1000 (68.9)
1000 (68.9)
500 (34.4)
68.9 (1000)
68.9 (1000)68.9 (1000) 34.4 (500)34.4 (500) 34.4 (500)6.8 (100)
0.68 3.443.443.44 6.89 6.896.89
Hydraulic Oil Flow, U.S. gal/min
Out
let
Pre
ssur
e, p
sig
Out
let
Pre
ssur
e, b
ar
Hydraulic Oil Flow, L/min
00 0.5
0 1.0
50
100
150
200
250
300
5.0
10
15
20
1.51.0
JPN
EURO
USA
2.00
6.04.03.02.0 7.05.0
00 1,0
50
100
150
200
250
300
5,0
10
15
20
06,04,03,02,0 7,05,0
0 1.0
0.5
1.0
1.5
2.0
06.04.03.02.0 7.05.0
0 0,5 1,51,0 2,0
1000 (68.9)
500 (34.4)
100 (6.8)
500 (34.4), 1000 (68.9)
500 (34.4), 1000 (68.9)
6.8 (100)
68.9 (1000)
34.4 (500)
34.4 (500), 68.9 (1000)
34.4 (500), 68.9 (1000)
0.68
6.89
3.44
3.44, 6.89
3.44, 6.89
Hydraulic Oil Flow, U.S. gal/min
Out
let
Pre
ssur
e, p
sig
Out
let
Pre
ssur
e, b
ar
Hydraulic Oil Flow, L/minDetail A
A
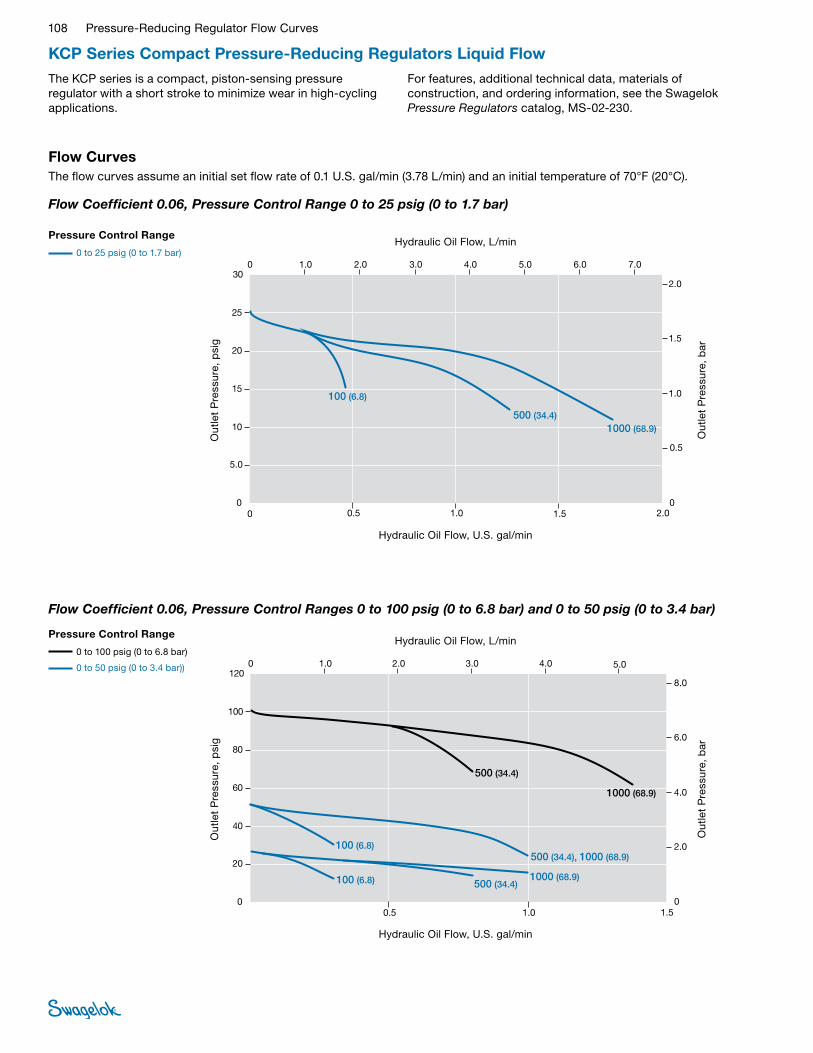
108 Pressure-Reducing Regulator Flow Curves
KCP Series Compact Pressure-Reducing Regulators Liquid Flow
Flow CurvesThe flow curves assume an initial set flow rate of 0.1 U.S. gal/min (3.78 L/min) and an initial temperature of 70°F (20°C).
Pressure Control Range
0 to 25 psig (0 to 1.7 bar)
Flow Coefficient 0.06, Pressure Control Range 0 to 25 psig (0 to 1.7 bar)
Flow Coefficient 0.06, Pressure Control Ranges 0 to 100 psig (0 to 6.8 bar) and 0 to 50 psig (0 to 3.4 bar)
00 0.5
0 1.0
5.0
10
15
20
25
30
0.5
1.0
1.5
2.0
1.51.0
JPN
EURO
USA
2.00
6.04.03.02.0 7.05.0
00 1,0
5,0
10
15
20
25
30
0,5
1,0
1,5
2,0
06,04,03,02,0 7,05,0
0 1.0
0.05
0.10
0.15
0.20
06.04.03.02.0 7.05.0
0 0.5 1.51.0 2.0
100 (6.8)
500 (34.4)1000 (68.9)
6.8 (100)
34.4 (500)68.9 (1000)
0.68
3.446.89
Hydraulic Oil Flow, U.S. gal/min
Out
let
Pre
ssur
e, p
sig
Out
let
Pre
ssur
e, b
ar
Hydraulic Oil Flow, L/min
0
0,5
0 1.0
20
40
60
80
100
120
2.0
4.0
6.0
8.0
1,0
JPN
USA
1,5
0
5.03.02.0 4.0
0
0
0
20
40
60
80
100
120
2,0
4,0
6,0
8,0
0
0.5 1.0 1.5
1,0 4,0 5,02,0 3,0
0
0.2
0.4
0.6
0.8
01.0 4.0 5.02.0 3.0
EURO
100 (6.8)
100 (6.8) 500 (34.4)
500 (34.4)
1000 (68.9)
1000 (68.9)
500 (34.4), 1000 (68.9)
6.8 (100)
6.8 (100) 34.4 (500)
34.4 (500)
68.9 (1000)
68.9 (1000)
34.4 (500), 68.9 (1000)
3.446.89
0.68
0.68 3.44 6.89
3.44, 6.89
Hydraulic Oil Flow, U.S. gal/min
Out
let
Pre
ssur
e, p
sig
Out
let
Pre
ssur
e, b
ar
Hydraulic Oil Flow, L/minPressure Control Range
0 to 100 psig (0 to 6.8 bar)
0 to 50 psig (0 to 3.4 bar))
The KCP series is a compact, piston-sensing pressure regulator with a short stroke to minimize wear in high-cycling applications.
For features, additional technical data, materials of construction, and ordering information, see the Swagelok Pressure Regulators catalog, MS-02-230.
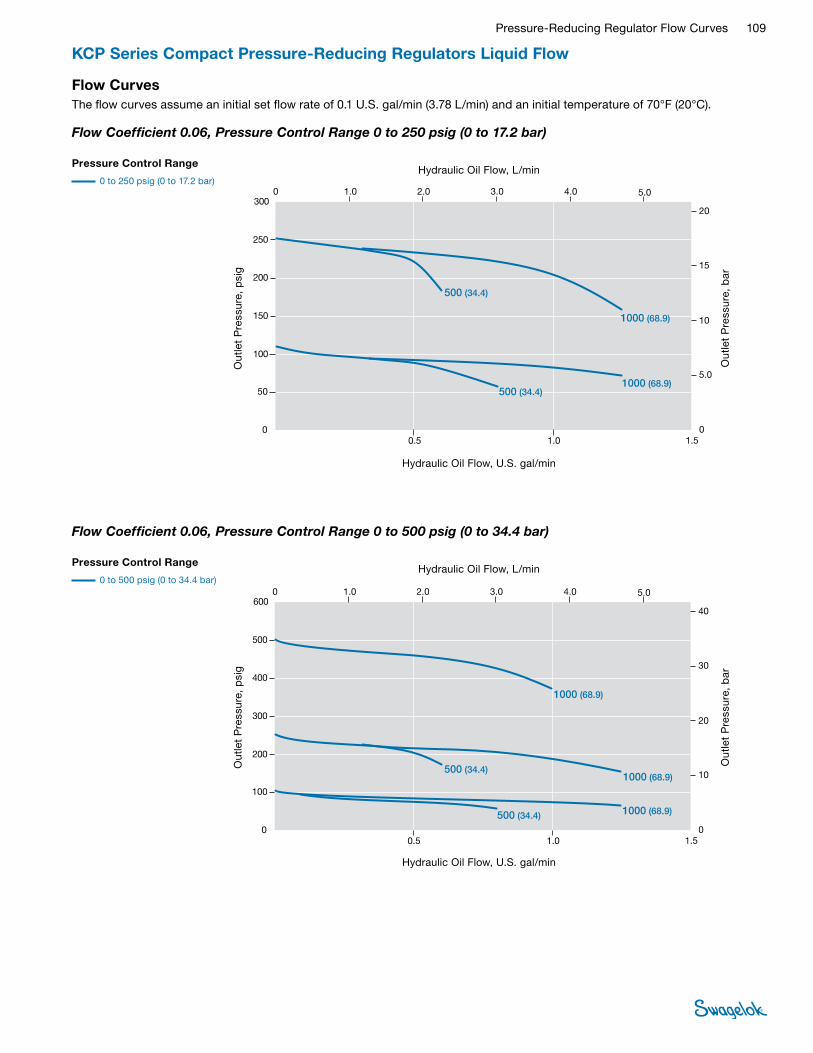
Pressure-Reducing Regulator Flow Curves 109
Flow CurvesThe flow curves assume an initial set flow rate of 0.1 U.S. gal/min (3.78 L/min) and an initial temperature of 70°F (20°C).
Pressure Control Range
0 to 250 psig (0 to 17.2 bar)
Flow Coefficient 0.06, Pressure Control Range 0 to 250 psig (0 to 17.2 bar)
0
0,5
0 1.0
50
100
150
200
250
300
5.0
10
15
20
1,0
JPN
USA
1,5
0
5.03.02.0 4.0
0
0
0
50
100
150
200
250
300
5,0
10
15
20
0
0.5 1.0 1.5
1,0 4,0 5,02,0 3,0
0
0.5
1.0
1.5
2.0
01.0 4.0 5.02.0 3.0
EURO
0
500 (34.4)
500 (34.4)
1000 (68.9)
1000 (68.9)
34.4 (500)
34.4 (500)
68.9 (1000)
68.9 (1000)
3.44
3.44
6.89
6.89
Hydraulic Oil Flow, U.S. gal/min
Out
let
Pre
ssur
e, p
sig
Out
let
Pre
ssur
e, b
ar
Hydraulic Oil Flow, L/min
KCP Series Compact Pressure-Reducing Regulators Liquid Flow
Flow Coefficient 0.06, Pressure Control Range 0 to 500 psig (0 to 34.4 bar)
0
0,5
0 1.0
100
200
300
400
500
600
10
20
30
40
1,0
JPN
USA
1,5
0
5.03.02.0 4.0
0
0
0
100
200
300
400
500
600
10
20
30
40
0
0.5 1.0 1.5
1,0 4,0 5,02,0 3,0
0
1.0
2.0
3.0
4.0
01.0 4.0 5.02.0 3.0
EURO
0
500 (34.4)
500 (34.4)
1000 (68.9)
1000 (68.9)
1000 (68.9)
34.4 (500)
34.4 (500)
68.9 (1000)
68.9 (1000)
68.9 (1000)
3.44
3.44
6.89
6.89
6.89
Hydraulic Oil Flow, U.S. gal/min
Out
let
Pre
ssur
e, p
sig
Out
let
Pre
ssur
e, b
ar
Hydraulic Oil Flow, L/minPressure Control Range
0 to 500 psig (0 to 34.4 bar)
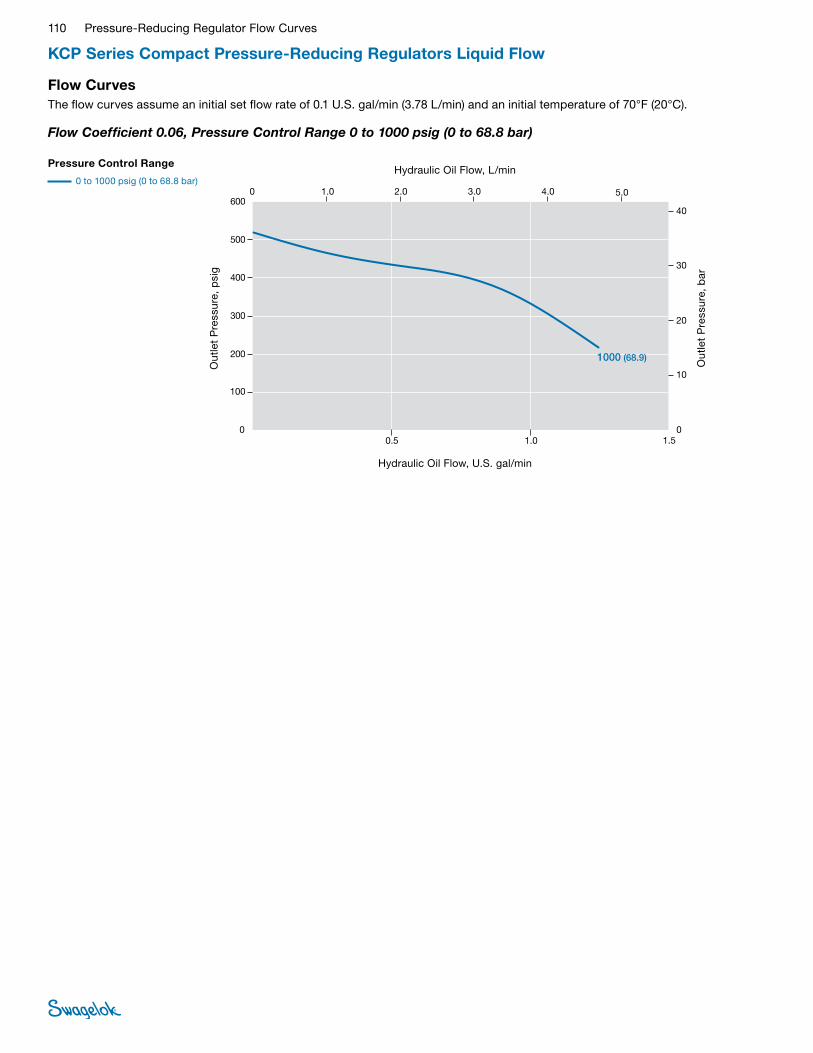
110 Pressure-Reducing Regulator Flow Curves
Flow CurvesThe flow curves assume an initial set flow rate of 0.1 U.S. gal/min (3.78 L/min) and an initial temperature of 70°F (20°C).
Pressure Control Range
0 to 1000 psig (0 to 68.8 bar)
Flow Coefficient 0.06, Pressure Control Range 0 to 1000 psig (0 to 68.8 bar)
0
0,5
0 1.0
100
200
300
400
500
600
10
20
30
40
1,0
JPN
USA
1,5
0
5.03.02.0 4.0
0
0
0
100
200
300
400
500
600
10
20
30
40
0
0.5 1.0 1.5
1,0 4,0 5,02,0 3,0
0
1.0
2.0
3.0
4.0
01.0 4.0 5.02.0 3.0
EURO
1000 (68.9)
68.9 (1000)
6.89
Hydraulic Oil Flow, U.S. gal/min
Out
let
Pre
ssur
e, p
sig
Out
let
Pre
ssur
e, b
ar
Hydraulic Oil Flow, L/min
KCP Series Compact Pressure-Reducing Regulators Liquid Flow

Pressure-Reducing Regulator Flow Curves 111
KCP Series Compact Pressure-Reducing Regulators Liquid Flow
Flow CurvesThe flow curves assume an initial set flow rate of 0.1 U.S. gal/min (3.78 L/min) and an initial temperature of 70°F (20°C).
Pressure Control Range
0 to 25 psig (0 to 1.7 bar)
Flow Coefficient 0.20, Pressure Control Range 0 to 25 psig (0 to 1.7 bar)
Flow Coefficient 0.20, Pressure Control Ranges 0 to 100 psig (0 to 6.8 bar) and 0 to 50 psig (0 to 3.4 bar)
00 0.5
0 1.0
5.0
10
15
20
25
30
0.5
1.0
1.5
2.0
1.51.0
JPN
EURO
USA
2.00
6.04.03.02.0 7.05.0
00 1,0
5,0
10
15
20
25
30
0,5
1,0
1,5
2,0
06,04,03,02,0 7,05,0
0 1.0
0.05
0.10
0.15
0.20
06.04.03.02.0 7.05.0
0 0.5 1.51.0 2.0
100 (6.8)
500 (34.4)1000 (68.9)
6.8 (100)
34.4 (500)68.9 (1000)
0.68
3.446.89
Hydraulic Oil Flow, U.S. gal/min
Out
let
Pre
ssur
e, p
sig
Out
let
Pre
ssur
e, b
ar
Hydraulic Oil Flow, L/min
00 0.5
0 1.0
10
20
30
40
50
60
1.0
2.0
3.0
4.0
1.51.0
JPN
EURO
USA
2.00
6.04.03.02.0 7.05.0
00 1,0
10
20
30
40
50
60
1,0
2,0
3,0
4,0
06,04,03,02,0 7,05,0
0 1.0
0.1
0.2
0.3
0.4
06.04.03.02.0 7.05.0
0 0,5 1,51,0 2,0
100 (6.8)
500 (34.4)1000 (68.9)
100 (6.8)500 (34.4) 1000 (68.9)
6.8 (100)
34.4 (500)68.9 (1000)
6.8 (100) 34.4 (500) 68.9 (1000)
0.68
3.446.89
0.68 3.44 6.89
Hydraulic Oil Flow, U.S. gal/min
Out
let
Pre
ssur
e, p
sig
Out
let
Pre
ssur
e, b
ar
Hydraulic Oil Flow, L/minPressure Control Range
0 to 100 psig (0 to 6.8 bar)
0 to 50 psig (0 to 3.4 bar))

112 Pressure-Reducing Regulator Flow Curves
Flow CurvesThe flow curves assume an initial set flow rate of 0.1 U.S. gal/min (3.78 L/min) and an initial temperature of 70°F (20°C).
Pressure Control Range
0 to 250 psig (0 to 17.2 bar)
Flow Coefficient 0.20, Pressure Control Range 0 to 250 psig (0 to 17.2 bar)
00 0.5
0 1.0
50
100
150
200
250
300
5.0
10
15
20
1.51.0
JPN
EURO
USA
2.00
6.04.03.02.0 7.05.0
00 1,0
50
100
150
200
250
300
5,0
10
15
20
06,04,03,02,0 7,05,0
0 1.0
0.5
1.0
1.5
2.0
06.04.03.02.0 7.05.0
0 0,5 1,51,0 2,0
500 (34.4)
500 (34.4)
1000 (68.9)
1000 (68.9)
34.4 (500)
34.4 (500)
68.9 (1000)
68.9 (1000)
3.44
3.44
6.89
6.89
Hydraulic Oil Flow, U.S. gal/min
Out
let
Pre
ssur
e, p
sig
Out
let
Pre
ssur
e, b
ar
Hydraulic Oil Flow, L/min
KCP Series Compact Pressure-Reducing Regulators Liquid Flow
Flow Coefficient 0.20, Pressure Control Range 0 to 500 psig (0 to 34.4 bar)
00 0.5
0 1.0
100
200
300
400
500
600
10
20
30
40
1.51.0
JPN
EURO
USA
2.00
6.04.03.02.0 7.05.0
00 1,0
100
200
300
400
500
600
10
20
30
40
06,04,03,02,0 7,05,0
0 1.0
1.0
2.0
3.0
4.0
06.04.03.02.0 7.05.0
0 0,5 1,51,0 2,0
500 (34.4)
500 (34.4)
1000 (68.9)
1000 (68.9)
1000 (68.9)
34.4 (500)
34.4 (500)
68.9 (1000)
68.9 (1000)
68.9 (1000)
3.44
3.44
6.89
6.89
6.89
Hydraulic Oil Flow, U.S. gal/min
Out
let
Pre
ssur
e, p
sig
Out
let
Pre
ssur
e, b
ar
Hydraulic Oil Flow, L/minPressure Control Range
0 to 500 psig (0 to 34.4 bar)
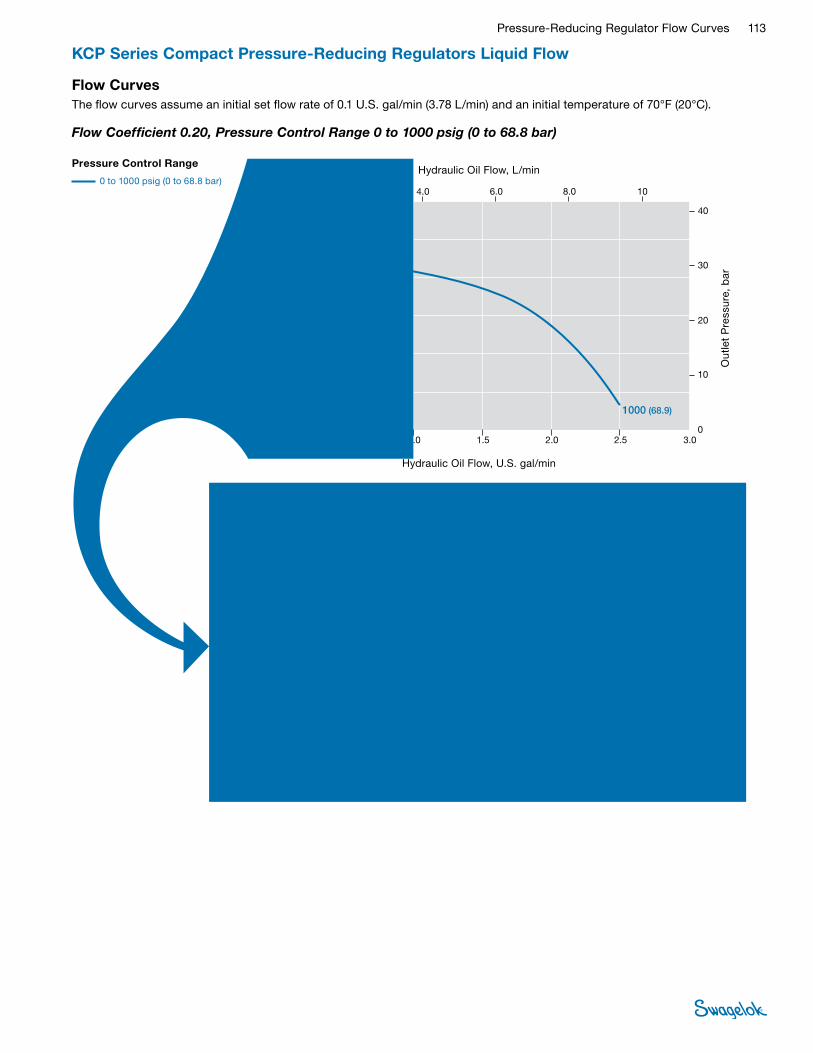
Pressure-Reducing Regulator Flow Curves 113
Flow CurvesThe flow curves assume an initial set flow rate of 0.1 U.S. gal/min (3.78 L/min) and an initial temperature of 70°F (20°C).
Pressure Control Range
0 to 1000 psig (0 to 68.8 bar)
Flow Coefficient 0.20, Pressure Control Range 0 to 1000 psig (0 to 68.8 bar)
00 0.5
0 2.0
100
200
300
400
500
600
10
20
30
40
2.01.51.0
JPN
EURO
USA
2.50
8.06.04.0 10
3.0
0
0 0,5
0 2,0
100
200
300
400
500
600
10
20
30
40
2,01,51,0 2,5
08,06,04,0 10
3,0
0 2.0
1.0
2.0
3.0
4.0
08.06.04.0 10
1000 (68.9)
68.9 (1000)
6.89
Hydraulic Oil Flow, U.S. gal/min
Out
let
Pre
ssur
e, p
sig
Out
let
Pre
ssur
e, b
ar
Hydraulic Oil Flow, L/min
00 0.2
0 0.5
100
200
300
400
500
600
10
20
30
40
0.80.60.4
JPN
EURO
USA
1.00
3.02.01.51.0 3.52.5
0
0 0,2
0 0,5
100
200
300
400
500
600
10
20
30
40
0,80,60,4 1,0
03,02,01,51,0 3,52,5
0 0.5
1.0
2.0
3.0
4.0
03.02.01.51.0 3.52.5
1000 (68.9)
68.9 (1000)
6.89
Hydraulic Oil Flow, U.S. gal/min
Out
let
Pre
ssur
e, p
sig
Out
let
Pre
ssur
e, b
ar
Hydraulic Oil Flow, L/min
KCP Series Compact Pressure-Reducing Regulators Liquid Flow
Detail A
A

114 Pressure-Reducing Regulator Flow Curves
KCP Series Compact Pressure-Reducing Regulators Liquid Flow
Flow CurvesThe flow curves assume an initial set flow rate of 0.1 U.S. gal/min (3.78 L/min) and an initial temperature of 70°F (20°C).
Pressure Control Range
0 to 25 psig (0 to 1.7 bar)
Flow Coefficient 0.50, Pressure Control Range 0 to 25 psig (0 to 1.7 bar)
7,5
00 0.5
0 1.5
5.0
10
15
20
25
30
0.5
1.0
1.5
2.0
2.01.51.0
JPN
EURO
USA
2.50
7.56.04.53.0 9.0
0
0 0,5
0 1,5
5,0
10
15
20
25
30
0,5
1,0
1,5
2,0
2,01,51,0 2,5
06,04,53,0 9,0
7.50 1.5
0.05
0.10
0.15
0.20
06.04.53.0 9.0
100 (6.8)
500 (34.4) 1000 (68.9)
34.4 (500) 68.9 (1000)
6.8 (100)
3.44
0.68
6.89
Hydraulic Oil Flow, U.S. gal/min
Out
let
Pre
ssur
e, p
sig
Out
let
Pre
ssur
e, b
ar
Hydraulic Oil Flow, L/min
00 0.2
0 0.5
5.0
10
15
20
25
30
0.5
1.0
1.5
2.0
0.80.60.4
JPN
EURO
USA
1.00
3.02.01.51.0 3.52.5
0
0 0,2
0 0,5
5,0
10
15
20
25
30
0,5
1,0
1,5
2,0
0,80,60,4 1,0
03,02,01,51,0 3,52,5
0 0.5
0.05
0.10
0.15
0.20
03.02.01.51.0 3.52.5
100 (6.8)500 (34.4), 1000 (68.9)
6.8 (100)34.4 (500), 68.9 (1000)
0.683.44, 6.89
Hydraulic Oil Flow, U.S. gal/min
Out
let
Pre
ssur
e, p
sig
Out
let
Pre
ssur
e, b
ar
Hydraulic Oil Flow, L/minDetail A
A
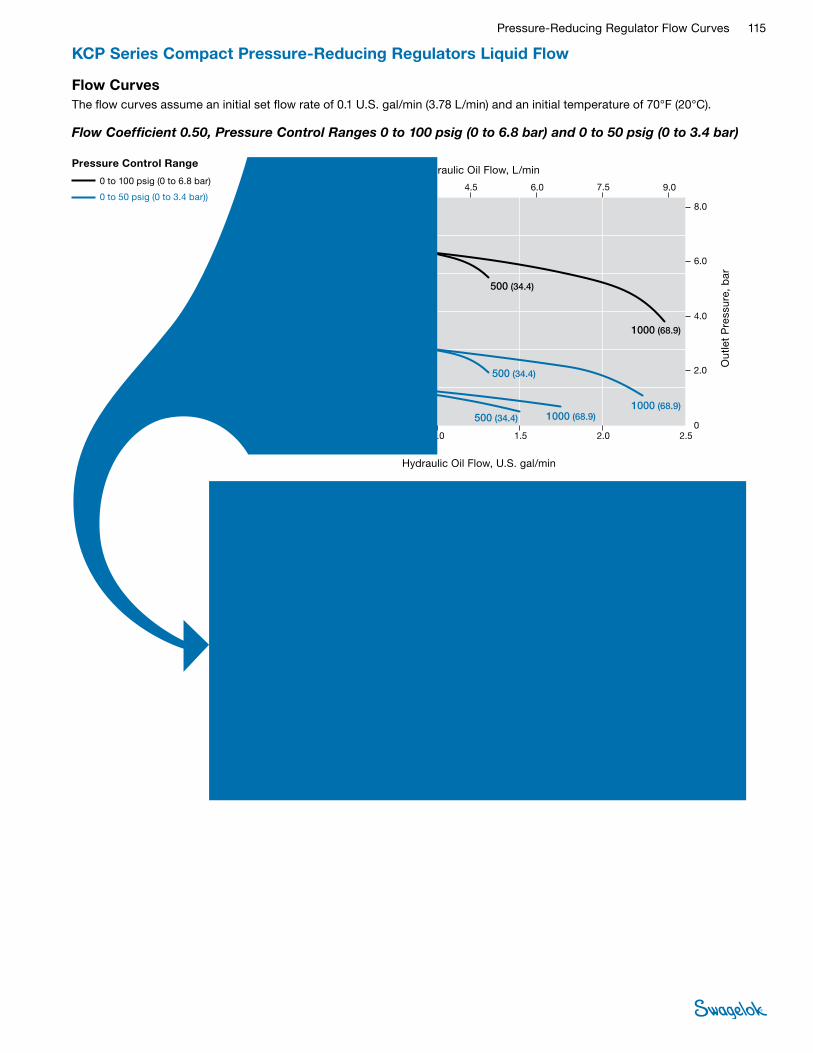
Pressure-Reducing Regulator Flow Curves 115
00 0.2
0 0.5
20
40
60
80
100
120
2.0
4.0
6.0
8.0
0.80.60.4
JPN
EURO
USA
1.00
3.02.01.51.0 3.52.5
0
0 0,2
0 0,5
20
40
60
80
100
120
2,0
4,0
6,0
8,0
0,80,60,4 1,0
03,02,01,51,0 3,52,5
0 0.5
0.2
0.4
0.6
0.8
03.02.01.51.0 3.52.5
500 (34.4), 1000 (68.9)
500 (34.4), 1000 (68.9)
500 (34.4), 1000 (68.9)
100 (6.8)
100 (6.8)
34.4 (500), 68.9 (1000)
34.4 (500), 68.9 (1000)
34.4 (500), 68.9 (1000)
6.8 (100)
6.8 (100)
3.44, 6.89
3.44, 6.89
3.44, 6.89
0.68
0.68
Hydraulic Oil Flow, U.S. gal/min
Out
let
Pre
ssur
e, p
sig
Out
let
Pre
ssur
e, b
ar
Hydraulic Oil Flow, L/min
Flow Coefficient 0.50, Pressure Control Ranges 0 to 100 psig (0 to 6.8 bar) and 0 to 50 psig (0 to 3.4 bar)
7,5
00 0.5
0 1.5
20
40
60
80
100
120
2.0
4.0
6.0
8.0
2.01.51.0
JPN
EURO
USA
2.50
7.56.04.53.0 9.0
0
0 0,5
0 1,5
20
40
60
80
100
120
2,0
4,0
6,0
8,0
2,01,51,0 2,5
06,04,53,0 9,0
7.50 1.5
0.2
0.4
0.6
0.8
06.04.53.0 9.0
500 (34.4)100 (6.8)
1000 (68.9)500 (34.4)
100 (6.8) 1000 (68.9)
1000 (68.9)
500 (34.4)
34.4 (500)
68.9 (1000)
34.4 (500)
68.9 (1000)
6.8 (100)
34.4 (500) 68.9 (1000)6.8 (100)
3.44
6.89
3.440.68
6.893.440.68 6.89
Hydraulic Oil Flow, U.S. gal/min
Out
let
Pre
ssur
e, p
sig
Out
let
Pre
ssur
e, b
ar
Hydraulic Oil Flow, L/min
KCP Series Compact Pressure-Reducing Regulators Liquid Flow
Pressure Control Range
0 to 100 psig (0 to 6.8 bar)
0 to 50 psig (0 to 3.4 bar))
Flow CurvesThe flow curves assume an initial set flow rate of 0.1 U.S. gal/min (3.78 L/min) and an initial temperature of 70°F (20°C).
Detail A
A
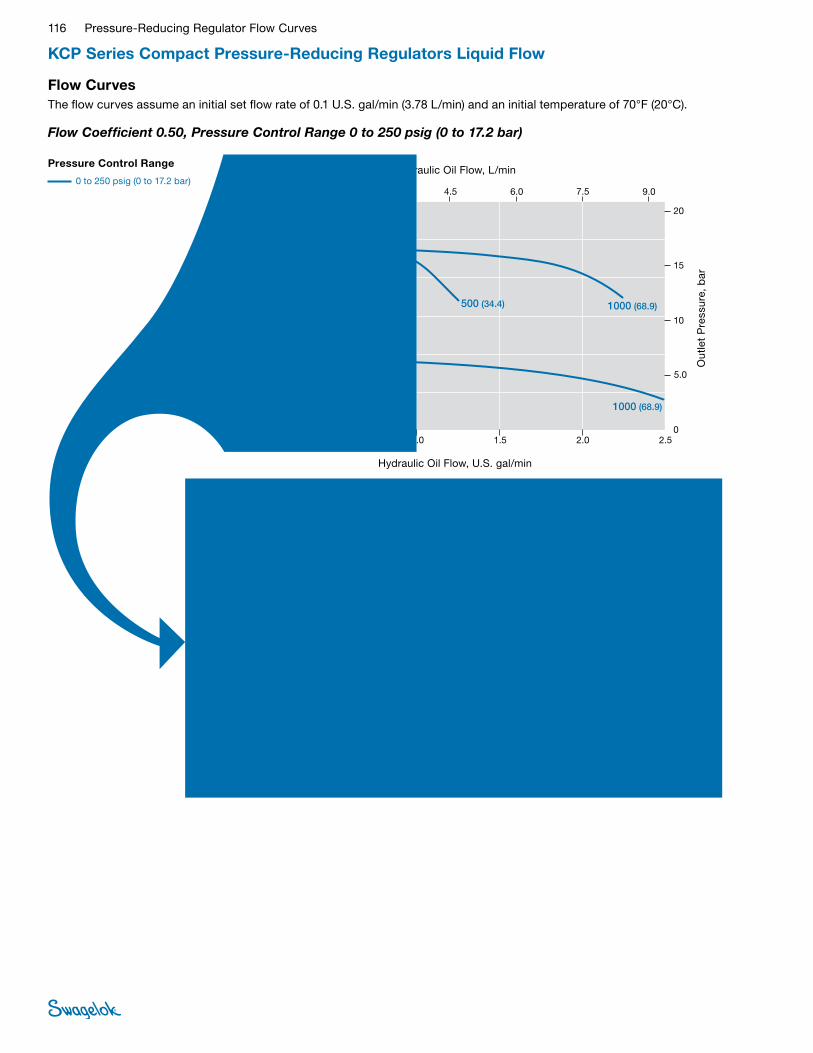
116 Pressure-Reducing Regulator Flow Curves
KCP Series Compact Pressure-Reducing Regulators Liquid Flow
Flow CurvesThe flow curves assume an initial set flow rate of 0.1 U.S. gal/min (3.78 L/min) and an initial temperature of 70°F (20°C).
Pressure Control Range
0 to 250 psig (0 to 17.2 bar)
Flow Coefficient 0.50, Pressure Control Range 0 to 250 psig (0 to 17.2 bar)
7,5
00 0.5
0 1.5
50
100
150
200
250
300
5.0
10
15
20
2.01.51.0
JPN
EURO
USA
2.50
7.56.04.53.0 9.0
0
0 0,5
0 1,5
50
100
150
200
250
300
5,0
10
15
20
2,01,51,0 2,5
06,04,53,0 9,0
7.50 1.5
0.5
1.0
1.5
2.0
06.04.53.0 9.0
500 (34.4) 1000 (68.9)
1000 (68.9)
34.4 (500) 68.9 (1000)
68.9 (1000)
3.44 6.89
6.89
Hydraulic Oil Flow, U.S. gal/min
Out
let
Pre
ssur
e, p
sig
Out
let
Pre
ssur
e, b
ar
Hydraulic Oil Flow, L/min
00 0.2
0 0.5
50
100
150
200
250
300
5.0
10
15
20
0.80.60.4
JPN
EURO
USA
1.00
3.02.01.51.0 3.52.5
0
0 0,2
0 0,5
50
100
150
200
250
300
5,0
10
15
20
0,80,60,4 1,0
03,02,01,51,0 3,52,5
0 0.5
0.5
1.0
1.5
2.0
03.02.01.51.0 3.52.5
500 (34.4)
1000 (68.9)
1000 (68.9)
34.4 (500)
68.9 (1000)
68.9 (1000)
3.44
6.89
6.89
Hydraulic Oil Flow, U.S. gal/min
Out
let
Pre
ssur
e, p
sig
Out
let
Pre
ssur
e, b
ar
Hydraulic Oil Flow, L/minDetail A
A

Pressure-Reducing Regulator Flow Curves 117
Flow Coefficient 0.50, Pressure Control Range 0 to 500 psig (0 to 34.4 bar)
7,5
00 0.5
0 1.5
100
200
300
400
500
600
10
20
30
40
2.01.51.0
JPN
EURO
USA
2.50
7.56.04.53.0 9.0
0
0 0,5
0 1,5
100
200
300
400
500
600
10
20
30
40
2,01,51,0 2,5
06,04,53,0 9,0
7.50 1.5
1.0
2.0
3.0
4.0
06.04.53.0 9.0
500 (34.4)
1000 (68.9)
500 (34.4) 1000 (68.9)
1000 (68.9)
34.4 (500)
68.9 (1000)
34.4 (500)
68.9 (1000)
68.9 (1000)
3.44
6.89
3.44
6.89
6.89
Hydraulic Oil Flow, U.S. gal/min
Out
let
Pre
ssur
e, p
sig
Out
let
Pre
ssur
e, b
ar
Hydraulic Oil Flow, L/min
00 0.2
0 0.5
100
200
300
400
500
600
10
20
30
40
0.80.60.4
JPN
EURO
USA
1.00
3.02.01.51.0 3.52.5
0
0 0,2
0 0,5
100
200
300
400
500
600
10
20
30
40
0,80,60,4 1,0
03,02,01,51,0 3,52,5
0 0.5
1.0
2.0
3.0
4.0
03.02.01.51.0 3.52.5
500 (34.4)
1000 (68.9)
1000 (68.9)
500 (34.4), 1000 (68.9)
34.4 (500)
68.9 (1000)
34.4 (500), 68.9 (1000)
68.9 (1000)
3.44
6.89
3.44, 6.89
6.89
Hydraulic Oil Flow, U.S. gal/min
Out
let
Pre
ssur
e, p
sig
Out
let
Pre
ssur
e, b
ar
Hydraulic Oil Flow, L/min
Pressure Control Range
0 to 500 psig (0 to 34.4 bar)
KCP Series Compact Pressure-Reducing Regulators Liquid Flow
Flow CurvesThe flow curves assume an initial set flow rate of 0.1 U.S. gal/min (3.78 L/min) and an initial temperature of 70°F (20°C).
Detail A
A
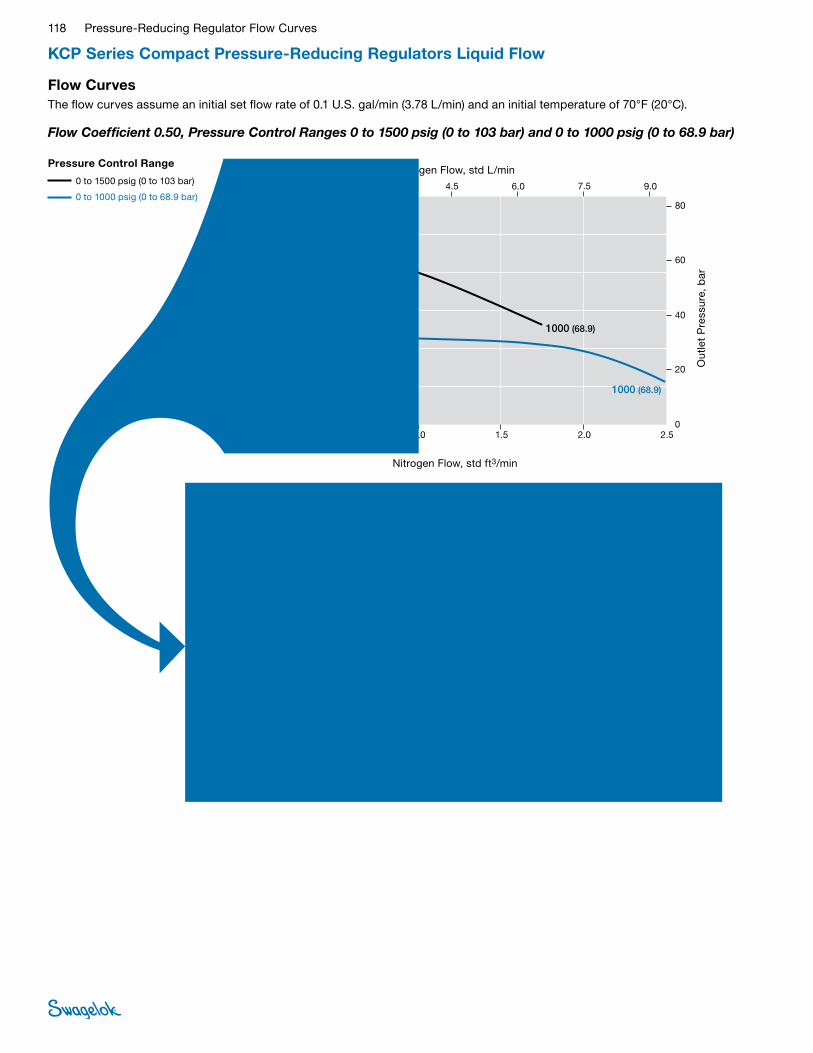
118 Pressure-Reducing Regulator Flow Curves
KCP Series Compact Pressure-Reducing Regulators Liquid Flow
Flow CurvesThe flow curves assume an initial set flow rate of 0.1 U.S. gal/min (3.78 L/min) and an initial temperature of 70°F (20°C).
Flow Coefficient 0.50, Pressure Control Ranges 0 to 1500 psig (0 to 103 bar) and 0 to 1000 psig (0 to 68.9 bar)
7,5
00 0.5
0 1.5
200
400
600
800
1000
1200
20
40
60
80
2.01.51.0
JPN
EURO
USA
2.50
7.56.04.53.0 9.0
0
0 0,5
0 1,5
200
400
600
800
1000
1200
20
40
60
80
2,01,51,0 2,5
06,04,53,0 9,0
7.50 1.5
2.0
4.0
6.0
8.0
06.04.53.0 9.0
1000 (68.9)
1000 (68.9)
68.9 (1000)
68.9 (1000)
6.89
6.89
Nitrogen Flow, std ft3/min
Out
let
Pre
ssur
e, p
sig
Out
let
Pre
ssur
e, b
ar
Nitrogen Flow, std L/min
00 0.2
0 0.5
200
400
600
800
1000
1200
20
40
60
80
0.80.60.4
JPN
EURO
USA
1.00
3.02.01.51.0 3.52.5
0
0 0,2
0 0,5
200
400
600
800
1000
1200
20
40
60
80
0,80,60,4 1,0
03,02,01,51,0 3,52,5
0 0.5
2.0
4.0
6.0
8.0
03.02.01.51.0 3.52.5
1000 (68.9)
1000 (68.9)
68.9 (1000)
68.9 (1000)
6.89
6.89
Nitrogen Flow, std ft3/min
Out
let
Pre
ssur
e, p
sig
Out
let
Pre
ssur
e, b
ar
Nitrogen Flow, std L/min
Pressure Control Range
0 to 1500 psig (0 to 103 bar)
0 to 1000 psig (0 to 68.9 bar)
Detail A
A
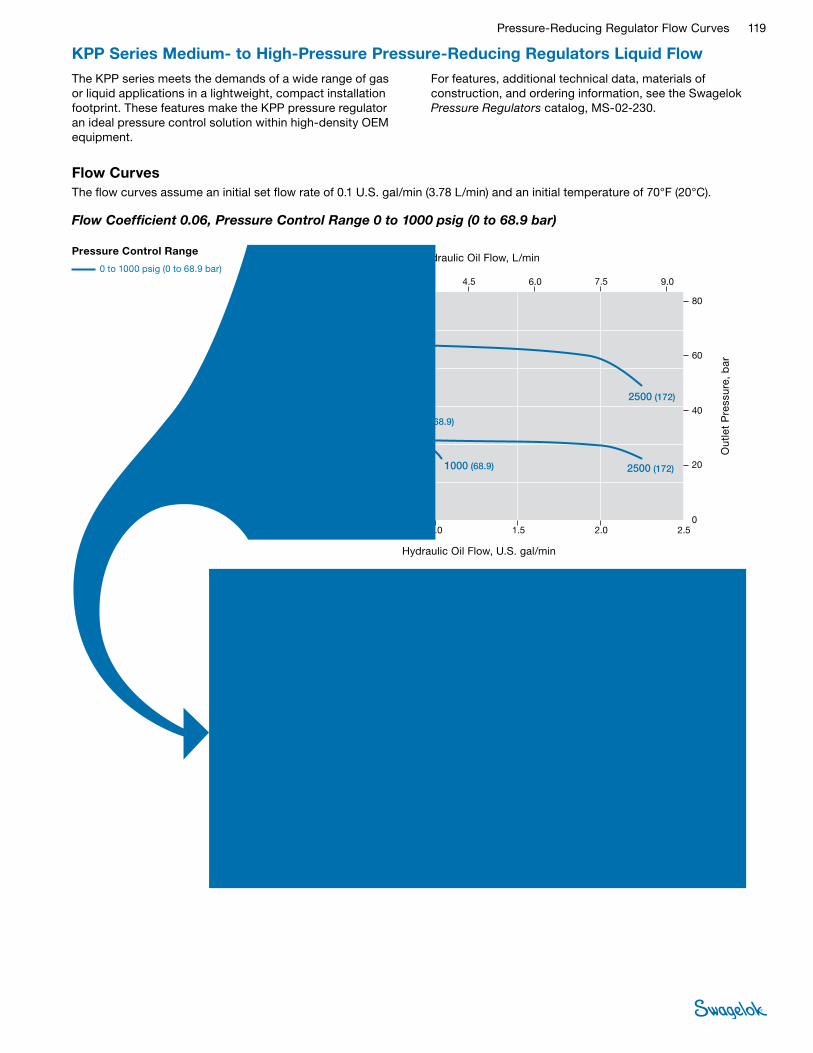
Pressure-Reducing Regulator Flow Curves 119
KPP Series Medium- to High-Pressure Pressure-Reducing Regulators Liquid Flow
Flow CurvesThe flow curves assume an initial set flow rate of 0.1 U.S. gal/min (3.78 L/min) and an initial temperature of 70°F (20°C).
Pressure Control Range
0 to 1000 psig (0 to 68.9 bar)
Flow Coefficient 0.06, Pressure Control Range 0 to 1000 psig (0 to 68.9 bar)
7,5
00 0.5
0 1.5
200
400
600
800
1000
1200
20
40
60
80
2.01.51.0
JPN
EURO
USA
2.50
7.56.04.53.0 9.0
0
0 0,5
0 1,5
200
400
600
800
1000
1200
20
40
60
80
2,01,51,0 2,5
06,04,53,0 9,0
7.50 1.5
2.0
4.0
6.0
8.0
06.04.53.0 9.0
2500 (172)
2500 (172)1000 (68.9)
1000 (68.9)
500 (34.4)
68.9 (1000)
68.9 (1000)
172 (2500)
172 (2500)
34.4 (500)
3.44
6.89
6.89
17.2
17.2
Hydraulic Oil Flow, U.S. gal/min
Out
let
Pre
ssur
e, p
sig
Out
let
Pre
ssur
e, b
ar
Hydraulic Oil Flow, L/min
00 0.2
0 0.5
200
400
600
800
1000
1200
20
40
60
80
0.80.60.4
JPN
EURO
USA
1.00
3.02.01.51.0 3.52.5
0
0 0,2
0 0,5
200
400
600
800
1000
1200
20
40
60
80
0,80,60,4 1,0
03,02,01,51,0 3,52,5
0 0.5
2.0
4.0
6.0
8.0
03.02.01.51.0 3.52.5
500 (34.4)
1000 (68.9)
2500 (172)
1000 (68.9)
2500 (172)
34.4 (500)
68.9 (1000)
172 (2500)
68.9 (1000)
172 (2500)
3.44
6.89
17.2
6.89
17.2
Hydraulic Oil Flow, U.S. gal/min
Out
let
Pre
ssur
e, p
sig
Out
let
Pre
ssur
e, b
ar
Hydraulic Oil Flow, L/min
The KPP series meets the demands of a wide range of gas or liquid applications in a lightweight, compact installation footprint. These features make the KPP pressure regulator an ideal pressure control solution within high-density OEM equipment.
For features, additional technical data, materials of construction, and ordering information, see the Swagelok Pressure Regulators catalog, MS-02-230.
Detail A
A
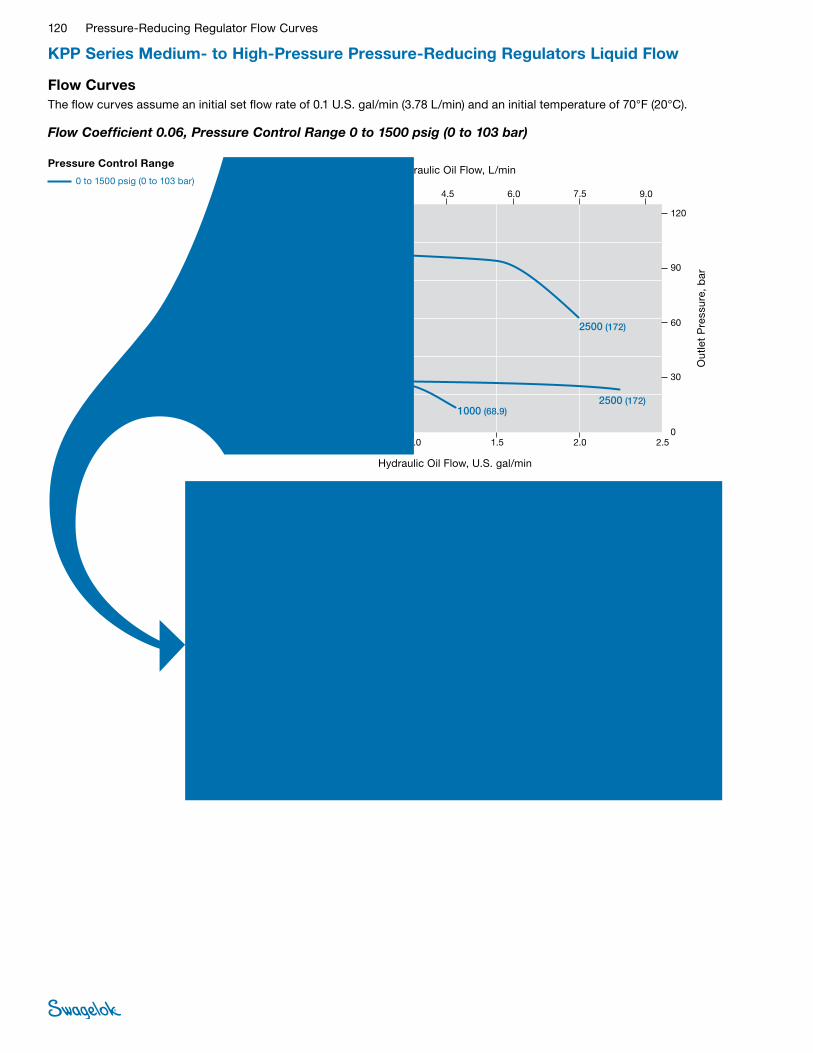
120 Pressure-Reducing Regulator Flow Curves
KPP Series Medium- to High-Pressure Pressure-Reducing Regulators Liquid Flow
Flow CurvesThe flow curves assume an initial set flow rate of 0.1 U.S. gal/min (3.78 L/min) and an initial temperature of 70°F (20°C).
7,5
00 0.5
0 1.5
300
600
900
1200
1500
1800
30
60
90
120
2.01.51.0
JPN
EURO
USA
2.50
7.56.04.53.0 9.0
0
0 0,5
0 1,5
300
600
900
1200
1500
1800
30
60
90
120
2,01,51,0 2,5
06,04,53,0 9,0
7.50 1.5
3.0
6.0
9.0
12
06.04.53.0 9.0
1000 (68.9)2500 (172)
2500 (172)
68.9 (1000)
172 (2500)
172 (2500)
6.89
17.2
17.2
Hydraulic Oil Flow, U.S. gal/min
Out
let
Pre
ssur
e, p
sig
Out
let
Pre
ssur
e, b
ar
Hydraulic Oil Flow, L/min
00 0.2
0 0.5
300
600
900
1200
1500
1800
30
60
90
120
0.80.60.4
JPN
EURO
USA
1.00
3.02.01.51.0 3.52.5
0
0 0,2
0 0,5
300
600
900
1200
1500
1800
30
60
90
120
0,80,60,4 1,0
03,02,01,51,0 3,52,5
0 0.5
3.0
6.0
9.0
12
03.02.01.51.0 3.52.5
2500 (172)
1000 (68.9), 2500 (172)
172 (2500)
68.9 (1000), 172 (2500)
17.2
6.89, 17.2
Hydraulic Oil Flow, U.S. gal/min
Out
let
Pre
ssur
e, p
sig
Out
let
Pre
ssur
e, b
ar
Hydraulic Oil Flow, L/min
Pressure Control Range
0 to 1500 psig (0 to 103 bar)
Flow Coefficient 0.06, Pressure Control Range 0 to 1500 psig (0 to 103 bar)
Detail A
A
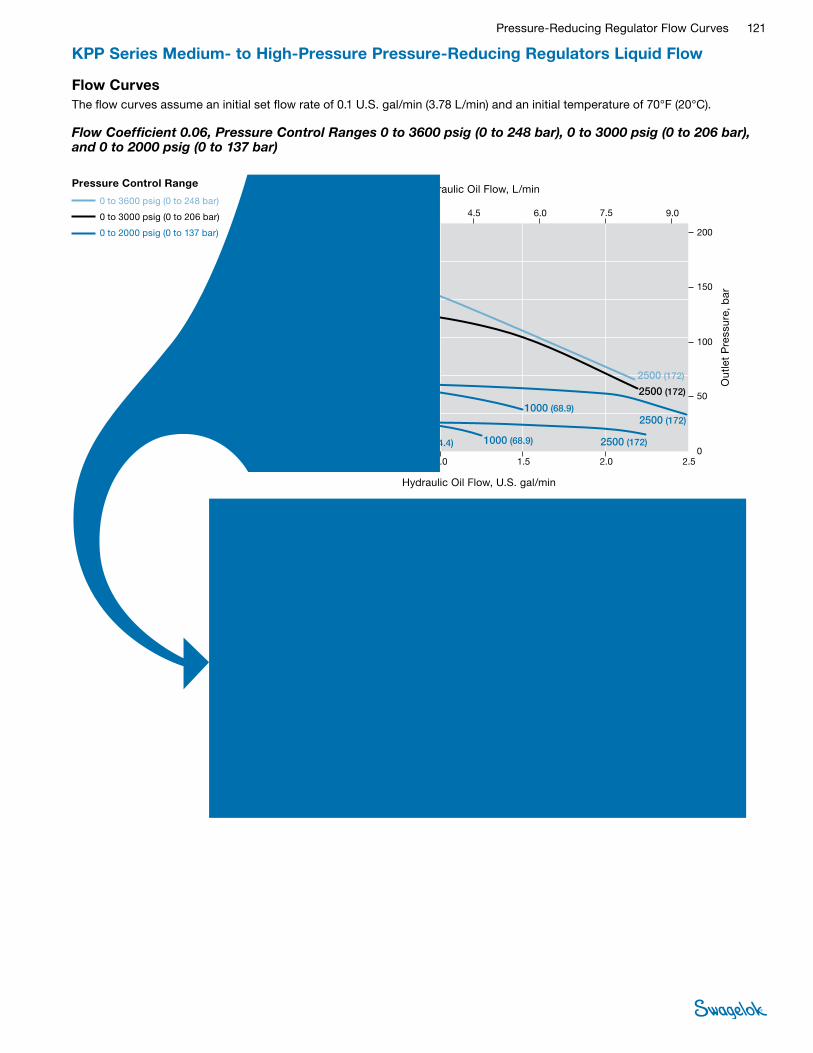
Pressure-Reducing Regulator Flow Curves 121
Pressure Control Range
0 to 3600 psig (0 to 248 bar)
0 to 3000 psig (0 to 206 bar)
0 to 2000 psig (0 to 137 bar)
Flow Coefficient 0.06, Pressure Control Ranges 0 to 3600 psig (0 to 248 bar), 0 to 3000 psig (0 to 206 bar), and 0 to 2000 psig (0 to 137 bar)
KPP Series Medium- to High-Pressure Pressure-Reducing Regulators Liquid Flow
Flow CurvesThe flow curves assume an initial set flow rate of 0.1 U.S. gal/min (3.78 L/min) and an initial temperature of 70°F (20°C).
7,5
00 0.5
0 1.5
500
1000
1500
2000
2500
3000
50
100
150
200
2.01.51.0
JPN
EURO
USA
2.50
7.56.04.53.0 9.0
0
0 0,5
0 1,5
500
1000
1500
2000
2500
3000
50
100
150
200
2,01,51,0 2,5
06,04,53,0 9,0
7.50 1.5
5.0
10
15
20
06.04.53.0 9.0
2500 (172)
2500 (172)
2500 (172)
2500 (172)
1000 (68.9)
1000 (68.9)500 (34.4)
172 (2500)172 (2500)
172 (2500)
172 (2500)
68.9 (1000)
68.9 (1000)34.4 (500)
17.217.2
17.2
17.26.89
6.893.44
Hydraulic Oil Flow, U.S. gal/min
Out
let
Pre
ssur
e, p
sig
Out
let
Pre
ssur
e, b
ar
Hydraulic Oil Flow, L/min
00 0.2
0 0.5
500
1000
1500
2000
2500
3000
50
100
150
200
0.80.60.4
JPN
EURO
USA
1.00
3.02.01.51.0 3.52.5
0
0 0,2
0 0,5
500
1000
1500
2000
2500
3000
50
100
150
200
0,80,60,4 1,0
03,02,01,51,0 3,52,5
0 0.5
5.0
10
15
20
03.02.01.51.0 3.52.5
2500 (172)
2500 (172)
500 (34.4)
1000 (68.9), 2500 (172)
1000 (68.9), 2500 (172)
172 (2500)
172 (2500)
34.4 (500)
68.9 (1000), 172 (2500)
68.9 (1000), 172 (2500)
17.2
17.2
3.44
6.89, 17.2
6.89, 17.2
Hydraulic Oil Flow, U.S. gal/min
Out
let
Pre
ssur
e, p
sig
Out
let
Pre
ssur
e, b
ar
Hydraulic Oil Flow, L/minDetail A
A
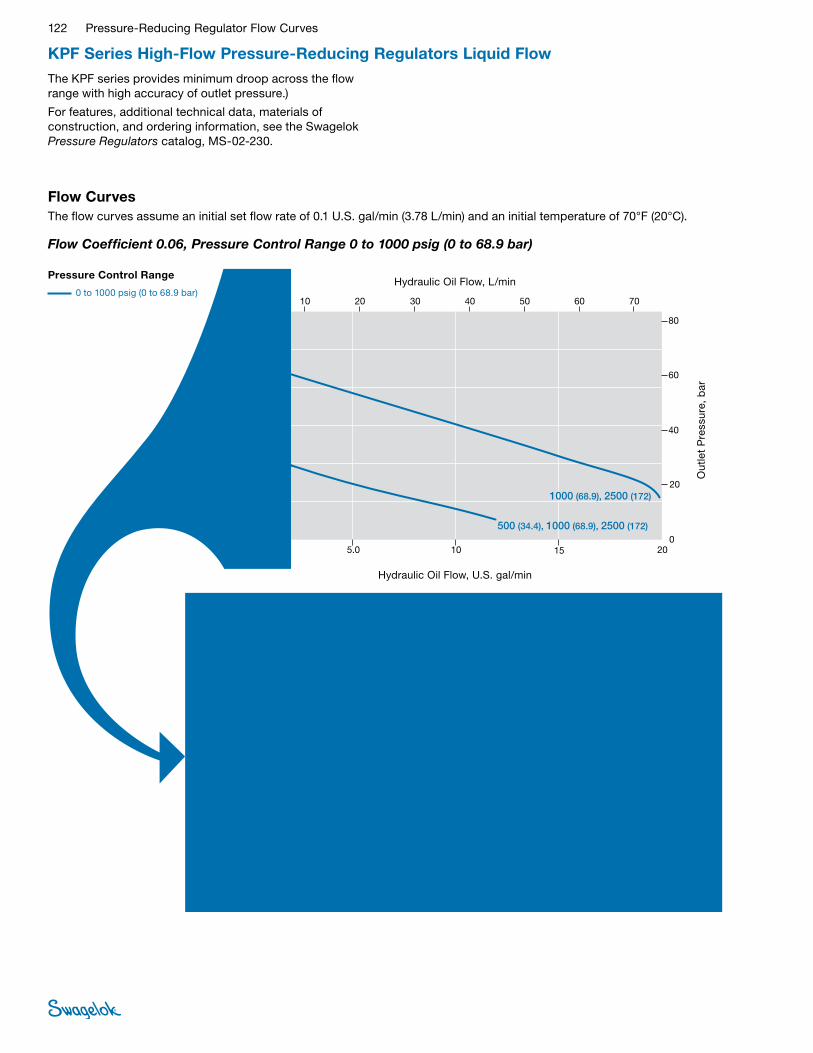
122 Pressure-Reducing Regulator Flow Curves
Flow CurvesThe flow curves assume an initial set flow rate of 0.1 U.S. gal/min (3.78 L/min) and an initial temperature of 70°F (20°C).
KPF Series High-Flow Pressure-Reducing Regulators Liquid Flow
Pressure Control Range
0 to 1000 psig (0 to 68.9 bar)
Flow Coefficient 0.06, Pressure Control Range 0 to 1000 psig (0 to 68.9 bar)
00 5.0
0 10
200
400
600
800
1000
1200
20
40
60
80
1510
JPN
EURO
USA
200
60403020 7050
00 10
200
400
600
800
1000
1200
20
40
60
80
060403020 7050
0 10
2.0
4.0
6.0
8.0
060403020 7050
0 5,0 1510 20
500 (34.4), 1000 (68.9), 2500 (172)
1000 (68.9), 2500 (172)
34.4 (500), 68.9 (1000), 172 (2500)
68.9 (1000), 172 (2500)
3.44, 6.89, 17.2
6.89, 17.2
Hydraulic Oil Flow, U.S. gal/min
Out
let
Pre
ssur
e, p
sig
Out
let
Pre
ssur
e, b
ar
Hydraulic Oil Flow, L/min
00 0.5
0 1.0
200
400
600
800
1000
1200
20
40
60
80
1.51.0
JPN
EURO
USA
2.00
6.04.03.02.0 7.05.0
00 1,0
200
400
600
800
1000
1200
20
40
60
80
06,04,03,02,0 7,05,0
0 1.0
2.0
4.0
6.0
8.0
06.04.03.02.0 7.05.0
0 0,5 1,51,0 2,0
500 (34.4), 1000 (68.9), 2500 (172)
1000 (68.9), 2500 (172)
34.4 (500), 68.9 (1000), 172 (2500)
68.9 (1000), 172 (2500)
3.44, 6.89, 17.2
6.89, 17.2
Hydraulic Oil Flow, U.S. gal/min
Out
let
Pre
ssur
e, p
sig
Out
let
Pre
ssur
e, b
ar
Hydraulic Oil Flow, L/min
The KPF series provides minimum droop across the flow range with high accuracy of outlet pressure.)
For features, additional technical data, materials of construction, and ordering information, see the Swagelok Pressure Regulators catalog, MS-02-230.
Detail A
A

Pressure-Reducing Regulator Flow Curves 123
Pressure Control Range
0 to 2000 psig (0 to 137 bar)
Flow Coefficient 1.0, Pressure Control Range 0 to 2000 psig (0 to 137 bar)
Flow CurvesThe flow curves assume an initial set flow rate of 0.1 U.S. gal/min (3.78 L/min) and an initial temperature of 70°F (20°C).
KPF Series High-Flow Pressure-Reducing Regulators Liquid Flow
00 5.0
0 15
500
1000
1500
2000
2500
50
100
150
201510
JPN
EURO
USA
250
75604530 90
00
0
500
1000
1500
2000
2500
50
100
150
750
5,0
15
201510 25
604530 90
00
500
1000
1500
2000
2500
50
100
150
750
15 604530 90
2500 (172)
1000 (68.9), 2500 (172)500 (34.4), 1000 (68.9), 2500 (172)
172 (2500)
68.9 (1000), 172 (2500)34.4 (500), 68.9 (1000), 172 (2500)
17.2
6.89, 17.23.44, 6.89, 17.2
Hydraulic Oil Flow, U.S. gal/min
Out
let
Pre
ssur
e, p
sig
Out
let
Pre
ssur
e, b
ar
Hydraulic Oil Flow, L/min
00 1.0
0 3.0
500
1000
1500
2000
2500
50
100
150
4.03.02.0
JPN
EURO
USA
5.00
15129.06.0 18
00
0
500
1000
1500
2000
2500
50
100
150
150
1,0
3,0
4,03,02,0 5,0
129,06,0 18
00
5.0
10
15
153.0 129.06.0 18
2500 (172)
1000 (68.9), 2500 (172)
500 (34.4), 1000 (68.9), 2500 (172)
172 (2500)
68.9 (1000), 172 (2500)
34.4 (500), 68.9 (1000), 172 (2500)
17.2
3.44, 6.89, 17.2
6.89, 17.2
Hydraulic Oil Flow, U.S. gal/min
Out
let
Pre
ssur
e, p
sig
Out
let
Pre
ssur
e, b
ar
Hydraulic Oil Flow, L/minDetail A
A
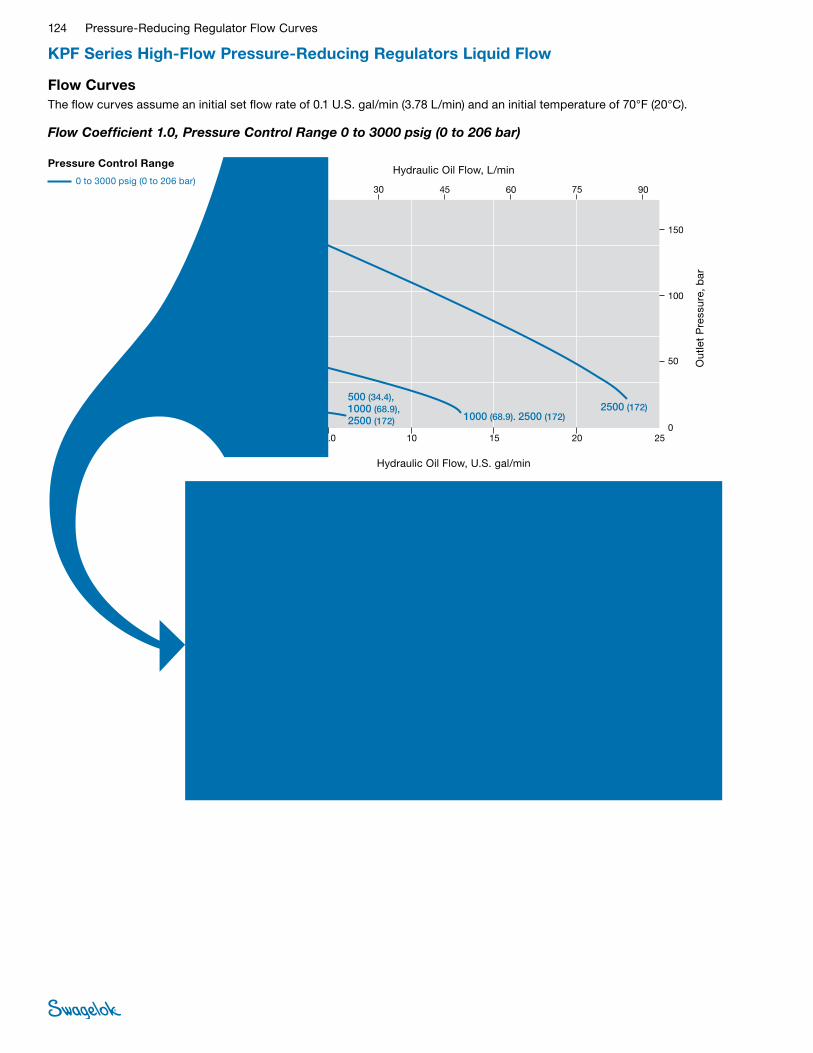
124 Pressure-Reducing Regulator Flow Curves
Pressure Control Range
0 to 3000 psig (0 to 206 bar)
Flow Coefficient 1.0, Pressure Control Range 0 to 3000 psig (0 to 206 bar)
Flow CurvesThe flow curves assume an initial set flow rate of 0.1 U.S. gal/min (3.78 L/min) and an initial temperature of 70°F (20°C).
KPF Series High-Flow Pressure-Reducing Regulators Liquid Flow
00 5.0
0 15
500
1000
1500
2000
2500
50
100
150
201510
JPN
EURO
USA
250
75604530 90
00
0
500
1000
1500
2000
2500
50
100
150
750
5,0
15
201510 25
604530 90
00
5.0
10
15
7515 604530 90
2500 (172)1000 (68.9). 2500 (172)
500 (34.4), 1000 (68.9), 2500 (172)
172 (2500)68.9 (1000), 172 (2500)
34.4 (500), 68.9 (1000), 172 (2500)
17.26.89, 17.23.44, 6.89, 17.2
Hydraulic Oil Flow, U.S. gal/min
Out
let
Pre
ssur
e, p
sig
Out
let
Pre
ssur
e, b
ar
Hydraulic Oil Flow, L/min
00 1.0
0 3.0
500
1000
1500
2000
2500
50
100
150
4.03.02.0
JPN
EURO
USA
5.00
15129.06.0 18
00
0
500
1000
1500
2000
2500
50
100
150
150
1,0
3,0
4,03,02,0 5,0
129,06,0 18
00
5.0
10
15
153.0 129.06.0 18
2500 (172)
500 (34.4), 1000 (68.9), 2500 (172)
1000 (68.9), 2500 (172)
172 (2500)
34.4 (500), 68.9 (1000), 172 (2500)
68.9 (1000), 172 (2500)
17.2
3.44, 6.89, 17.2
6.89, 17.2
Hydraulic Oil Flow, U.S. gal/min
Out
let
Pre
ssur
e, p
sig
Out
let
Pre
ssur
e, b
ar
Hydraulic Oil Flow, L/minDetail A
A
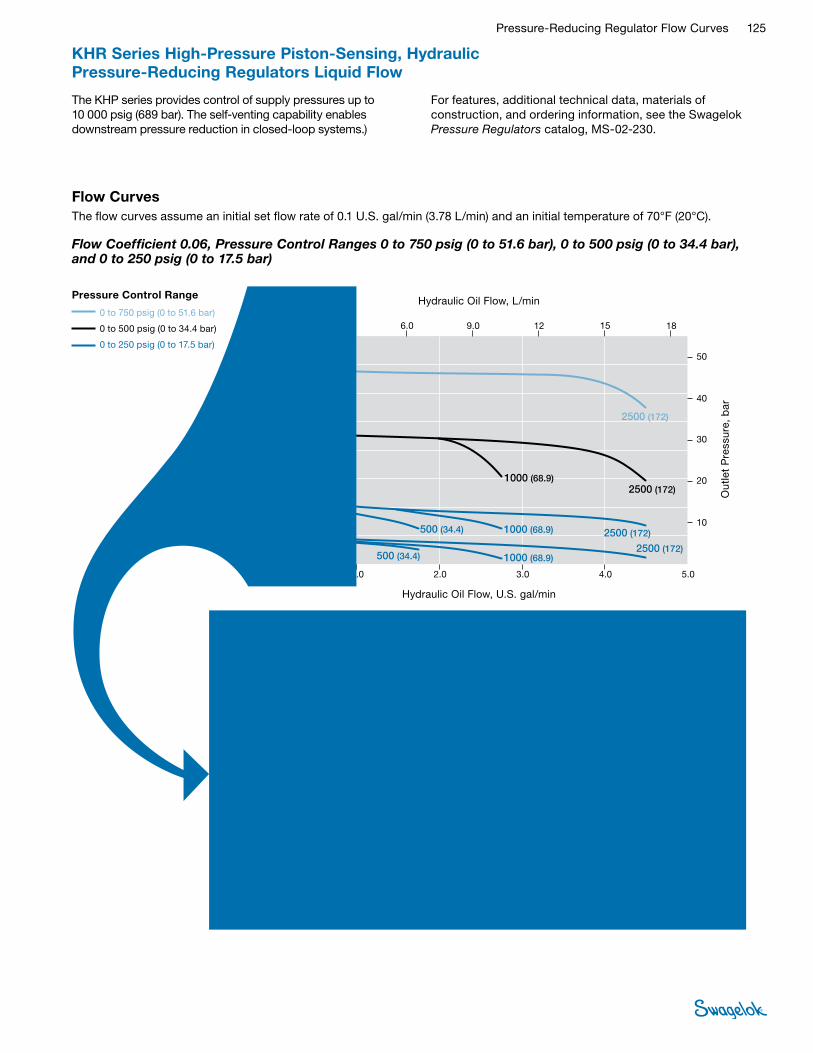
Pressure-Reducing Regulator Flow Curves 125
Pressure Control Range
0 to 750 psig (0 to 51.6 bar)
0 to 500 psig (0 to 34.4 bar)
0 to 250 psig (0 to 17.5 bar)
Flow Coefficient 0.06, Pressure Control Ranges 0 to 750 psig (0 to 51.6 bar), 0 to 500 psig (0 to 34.4 bar), and 0 to 250 psig (0 to 17.5 bar)
KHR Series High-Pressure Piston-Sensing, Hydraulic Pressure-Reducing Regulators Liquid Flow
Flow CurvesThe flow curves assume an initial set flow rate of 0.1 U.S. gal/min (3.78 L/min) and an initial temperature of 70°F (20°C).
0
300
400
500
600
700
800
50
JPN
EURO
USA
200
100
40
10
20
30
0
300
400
500
600
700
800
50
200
100
40
10
20
30
0
5.0
4.0
1.0
2.0
3.0
0
0 1.0
0 3.0
4.03.02.0 5.0
15129.06.0 18
15
0 1,0
0 3,0
4,03,02,0 5,0
129,06,0 18
150 3.0 129.06.0 18
500 (34.4)
500 (34.4)
1000 (68.9)
1000 (68.9)
1000 (68.9)
2500 (172)
2500 (172)
2500 (172)
2500 (172)
172 (2500)
172 (2500)68.9 (1000)
34.4 (500)
34.4 (500)
68.9 (1000)
68.9 (1000)
172 (2500)
172 (2500)
17.2
6.8917.2
3.44
3.44
6.89
6.89
17.2
17.2
Hydraulic Oil Flow, U.S. gal/min
Out
let
Pre
ssur
e, p
sig
Out
let
Pre
ssur
e, b
ar
Hydraulic Oil Flow, L/min
00 0.2
0 0.5
300
400
500
600
700
800
50
0.80.60.4
JPN
EURO
USA
1.0
3.02.01.51.0 3.52.5
200
100
40
10
20
30
0
00
0,20
0,5
300
400
500
600
700
800
50
0,80,60,4 1,0
3,02,01,51,0 3,52,5
200
100
40
10
20
30
00 0.5
5.0
3.02.01.51.0 3.52.5
4.0
1.0
2.0
3.0
0
2500 (172)
1000 (68.9), 2500 (172)
500 (34.4), 1000 (68.9), 2500 (172)
500 (34.4), 1000 (68.9), 2500 (172)
172 (2500)
68.9 (1000), 172 (2500)
34.4 (500), 68.9 (1000), 172 (2500)
34.4 (500), 68.9 (1000), 172 (2500)
17.2
6.89, 17.2
3.44, 6.89, 17.2
3.44, 6.89, 17.2
Hydraulic Oil Flow, U.S. gal/min
Out
let
Pre
ssur
e, p
sig
Out
let
Pre
ssur
e, b
ar
Hydraulic Oil Flow, L/min
The KHP series provides control of supply pressures up to 10 000 psig (689 bar). The self-venting capability enables downstream pressure reduction in closed-loop systems.)
For features, additional technical data, materials of construction, and ordering information, see the Swagelok Pressure Regulators catalog, MS-02-230.
Detail A
A

126 Pressure-Reducing Regulator Flow Curves
Pressure Control Range
0 to 2500 psig (0 to 172 bar)
0 to 1500 psig (0 to 103 bar)
Flow Coefficient 0.06, Pressure Control Ranges 0 to 2500 psig (0 to 172 bar) and 0 to 1500 psig (0 to 103 bar)
KHR Series High-Pressure Piston-Sensing, Hydraulic Pressure-Reducing Regulators Liquid Flow
Flow CurvesThe flow curves assume an initial set flow rate of 0.1 U.S. gal/min (3.78 L/min) and an initial temperature of 70°F (20°C).
15
00 1.0
0 3.0
500
1000
1500
2000
2500
3000
50
100
150
200
4.03.02.0
JPN
EURO
USA
5.00
15129.06.0 18
0
0 1,0
0 3,0
500
1000
1500
2000
2500
3000
50
100
150
200
4,03,02,0 5,0
0129,06,0 18
150 3.0
5.0
10
15
20
0129.06.0 18
2500 (172)
2500 (172)
2500 (172)1000 (68.9)
1000 (68.9)
2500 (172)
172 (2500)
172 (2500)
172 (2500)172 (2500)
68.9 (1000)
68.9 (1000)
17.2
17.2
17.217.2
6.89
6.89
Hydraulic Oil Flow, U.S. gal/min
Out
let
Pre
ssur
e, p
sig
Out
let
Pre
ssur
e, b
ar
Hydraulic Oil Flow, L/min
00 0.2
0 0.5
500
1000
1500
2000
2500
3000
50
100
150
200
0.80.60.4
JPN
EURO
USA
1.00
3.02.01.51.0 3.52.5
0
0 0,2
0 0,5
500
1000
1500
2000
2500
3000
50
100
150
200
0,80,60,4 1,0
03,02,01,51,0 3,52,5
0 0.5
5.0
10
15
20
03.02.01.51.0 3.52.5
2500 (172)
2500 (172)
1000 (68.9), 2500 (172)
1000 (68.9), 2500 (172)
172 (2500)
172 (2500)
68.9 (1000), 172 (2500)
68.9 (1000), 172 (2500)
17.2
17.2
6.89, 17.2
6.89, 17.2
Hydraulic Oil Flow, U.S. gal/min
Out
let
Pre
ssur
e, p
sig
Out
let
Pre
ssur
e, b
ar
Hydraulic Oil Flow, L/minDetail A
A

Pressure-Reducing Regulator Flow Curves 127
Pressure Control Range
0 to 6000 psig (0 to 413 bar) and 0 to 3600 psig (0 to 248 bar)
Flow Coefficient 0.06, Pressure Control Ranges 0 to 6000 psig (0 to 413 bar) and 0 to 3600 psig (0 to 248 bar)
KHR Series High-Pressure Piston-Sensing, Hydraulic Pressure-Reducing Regulators Liquid Flow
Flow CurvesThe flow curves assume an initial set flow rate of 0.1 U.S. gal/min (3.78 L/min) and an initial temperature of 70°F (20°C).
15
00 1.0
0 3.0
500
1000
1500
2000
2500
3000
50
100
150
200
4.03.02.0
JPN
EURO
USA
5.00
15129.06.0 18
0
0 1,0
0 3,0
500
1000
1500
2000
2500
3000
50
100
150
200
4,03,02,0 5,0
0129,06,0 18
150 3.0
5.0
10
15
20
0129.06.0 18
2500 (172)
2500 (172)
2500 (172)1000 (68.9)
172 (2500)172 (2500)
172 (2500)68.9 (1000)
17.217.2
17.26.89
Hydraulic Oil Flow, U.S. gal/min
Out
let
Pre
ssur
e, p
sig
Out
let
Pre
ssur
e, b
ar
Hydraulic Oil Flow, L/min
00 0.2
0 0.5
500
1000
1500
2000
2500
3000
50
100
150
200
0.80.60.4
JPN
EURO
USA
1.00
3.02.01.51.0 3.52.5
0
0 0,2
0 0,5
500
1000
1500
2000
2500
3000
50
100
150
200
0,80,60,4 1,0
03,02,01,51,0 3,52,5
0 0.5
5.0
10
15
20
03.02.01.51.0 3.52.5
2500 (172)
2500 (172)
1000 (68.9), 2500 (172)
172 (2500)
172 (2500)
68.9 (1000), 172 (2500)
17.2
17.2
6.89, 17.2
Hydraulic Oil Flow, U.S. gal/min
Out
let
Pre
ssur
e, p
sig
Out
let
Pre
ssur
e, b
ar
Hydraulic Oil Flow, L/minDetail A
A
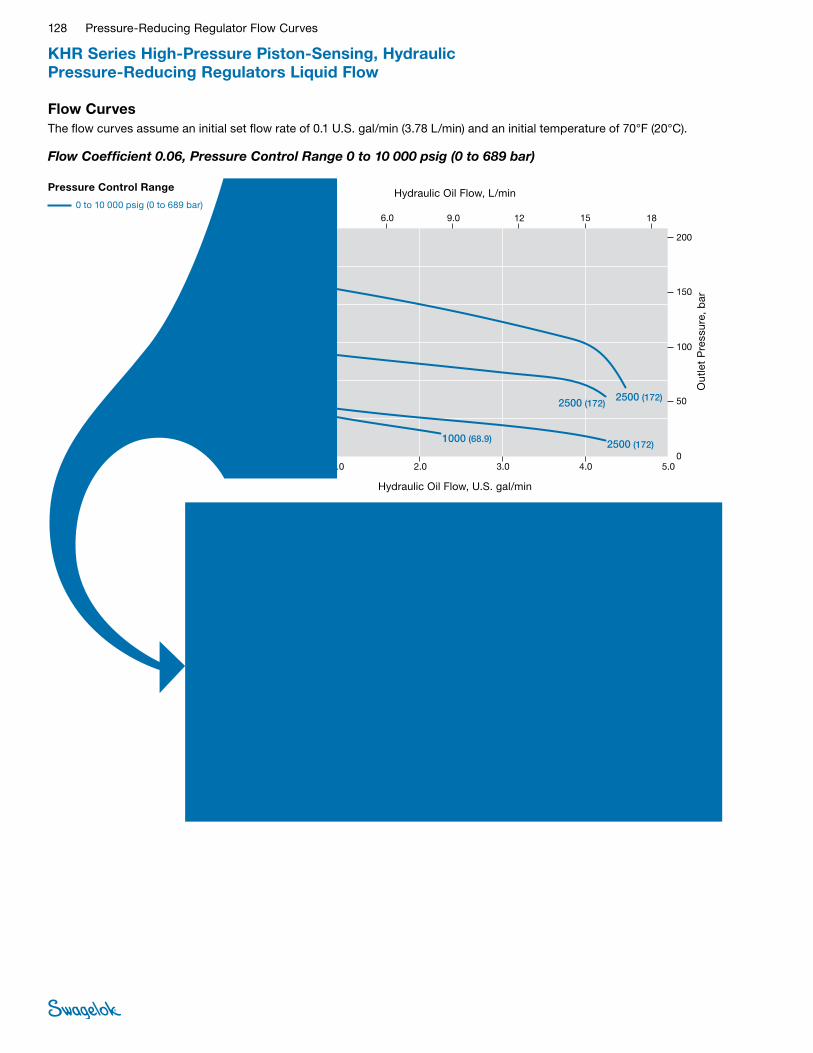
128 Pressure-Reducing Regulator Flow Curves
Pressure Control Range
0 to 10 000 psig (0 to 689 bar)
Flow Coefficient 0.06, Pressure Control Range 0 to 10 000 psig (0 to 689 bar)
KHR Series High-Pressure Piston-Sensing, Hydraulic Pressure-Reducing Regulators Liquid Flow
Flow CurvesThe flow curves assume an initial set flow rate of 0.1 U.S. gal/min (3.78 L/min) and an initial temperature of 70°F (20°C).
15
00 1.0
0 3.0
500
1000
1500
2000
2500
3000
50
100
150
200
4.03.02.0
JPN
EURO
USA
5.00
15129.06.0 18
0
0 1,0
0 3,0
500
1000
1500
2000
2500
3000
50
100
150
200
4,03,02,0 5,0
0129,06,0 18
150 3.0
5.0
10
15
20
0129.06.0 18
2500 (172)2500 (172)
2500 (172)1000 (68.9)
172 (2500)172 (2500)
172 (2500)68.9 (1000)
17.217.2
17.26.89
Hydraulic Oil Flow, U.S. gal/min
Out
let
Pre
ssur
e, p
sig
Out
let
Pre
ssur
e, b
ar
Hydraulic Oil Flow, L/min
00 0.2
0 0.5
500
1000
1500
2000
2500
3000
50
100
150
200
0.80.60.4
JPN
EURO
USA
1.00
3.02.01.51.0 3.52.5
0
0 0,2
0 0,5
500
1000
1500
2000
2500
3000
50
100
150
200
0,80,60,4 1,0
03,02,01,51,0 3,52,5
0 0.5
5.0
10
15
20
03.02.01.51.0 3.52.5
2500 (172)
2500 (172)
2500 (172)
1000 (68.9)
172 (2500)
172 (2500)
172 (2500)
68.9 (1000)
17.2
17.2
17.2
6.89
Hydraulic Oil Flow, U.S. gal/min
Out
let
Pre
ssur
e, p
sig
Out
let
Pre
ssur
e, b
ar
Hydraulic Oil Flow, L/minDetail A
A

Pressure-Reducing Regulator Flow Curves 129
Pressure Control Range
0 to 750 psig (0 to 51.6 bar)
0 to 500 psig (0 to 34.4 bar)
0 to 250 psig (0 to 17.5 bar)
Flow Coefficient 0.25, Pressure Control Ranges 0 to 750 psig (0 to 51.6 bar), 0 to 500 psig (0 to 34.4 bar), and 0 to 250 psig (0 to 17.5 bar)
KHR Series High-Pressure Piston-Sensing, Hydraulic Pressure-Reducing Regulators Liquid Flow
Flow CurvesThe flow curves assume an initial set flow rate of 0.1 U.S. gal/min (3.78 L/min) and an initial temperature of 70°F (20°C).
0
300
400
500
600
700
800
50
JPN
EURO
USA
200
100
40
10
20
30
0
0
300
400
500
600
700
800
50
200
100
40
10
20
30
0
5.0
4.0
1.0
2.0
3.0
0
0 2.0
0 10
8.06.04.0 10
403020 50
12 14
0
2,00
10
8,06,04,0 10
403020 50
12 14
0 10 403020 50
2500 (172)
2500 (172)
2500 (172)1000 (68.9)
1000 (68.9)
1000 (68.9)
500 (34.4)
500 (34.4)
172 (2500)
172 (2500)
172 (2500)68.9 (1000)
68.9 (1000)
68.9 (1000)
34.4 (500)
34.4 (500)
17.2
17.2
17.2
6.89
6.89
6.89
3.44
3.44
Hydraulic Oil Flow, U.S. gal/min
Out
let
Pre
ssur
e, p
sig
Out
let
Pre
ssur
e, b
ar
Hydraulic Oil Flow, L/min
0
300
400
500
600
700
800
50
JPN
EURO
USA
200
100
40
10
20
30
0
0
300
400
500
600
700
800
50
200
100
40
10
20
30
0
5.0
4.0
1.0
2.0
3.0
0
0 0.5
0 1.0
1.51.0 2.0
6.04.03.02.0 7.05.0
0 1,0 6,04,03,02,0 7,05,0
0 0,5 1,51,0 2,0
0 1.0 6.04.03.02.0 7.05.0
2500 (172)
1000 (68.9), 2500 (172)
500 (34.4), 1000 (68.9), 2500 (172)
500 (34.4), 1000 (68.9)
172 (2500)
68.9 (1000), 172 (2500)
34.4 (500), 68.9 (1000), 172 (2500)
34.4 (500), 68.9 (1000)
17.2
6.89, 17.2
3.44, 6.89, 17.2
3.44, 6.89
Hydraulic Oil Flow, U.S. gal/min
Out
let
Pre
ssur
e, p
sig
Out
let
Pre
ssur
e, b
ar
Hydraulic Oil Flow, L/minDetail A
A

130 Pressure-Reducing Regulator Flow Curves
Pressure Control Range
0 to 2500 psig (0 to 172 bar)
0 to 1500 psig (0 to 103 bar)
Flow Coefficient 0.25, Pressure Control Ranges 0 to 2500 psig (0 to 172 bar) and 0 to 1500 psig (0 to 103 bar)
KHR Series High-Pressure Piston-Sensing, Hydraulic Pressure-Reducing Regulators Liquid Flow
Flow CurvesThe flow curves assume an initial set flow rate of 0.1 U.S. gal/min (3.78 L/min) and an initial temperature of 70°F (20°C).
00 2.0
0 10
500
1000
1500
2000
2500
3000
50
100
150
200
8.06.04.0
JPN
EURO
USA
100
403020 50
12 14
00
2,00
10
500
1000
1500
2000
2500
3000
50
100
150
200
8,06,04,0 10
0403020 50
12 14
00 10
5.0
10
15
20
403020 50
2500 (172)
2500 (172)
2500 (172)
2500 (172)1000 (68.9)500 (34.4)
1000 (68.9)
172 (2500)
172 (2500)
172 (2500)
172 (2500)
68.9 (1000)
68.9 (1000)34.4 (500)
17.2
17.2
17.217.2
6.89
6.893.44
Hydraulic Oil Flow, U.S. gal/min
Out
let
Pre
ssur
e, p
sig
Out
let
Pre
ssur
e, b
ar
Hydraulic Oil Flow, L/min
00 0.5
0 1.0
500
1000
1500
2000
2500
3000
50
100
150
200
1.51.0
JPN
EURO
USA
2.00
6.04.03.02.0 7.05.0
00 1,0
500
1000
1500
2000
2500
3000
50
100
150
200
06,04,03,02,0 7,05,0
0 1.0
5.0
10
15
20
06.04.03.02.0 7.05.0
0 0,5 1,51,0 2,0
2500 (172)
2500 (172)
1000 (68.9), 2500 (172)
500 (34.4), 1000 (68.9), 2500 (172)
172 (2500)
172 (2500)
68.9 (1000), 172 (2500)
34.4 (500), 68.9 (1000), 172 (2500)
17.2
17.2
3.44, 6.89, 17.2
6.89, 17.2
Hydraulic Oil Flow, U.S. gal/min
Out
let
Pre
ssur
e, p
sig
Out
let
Pre
ssur
e, b
ar
Hydraulic Oil Flow, L/minDetail A
A
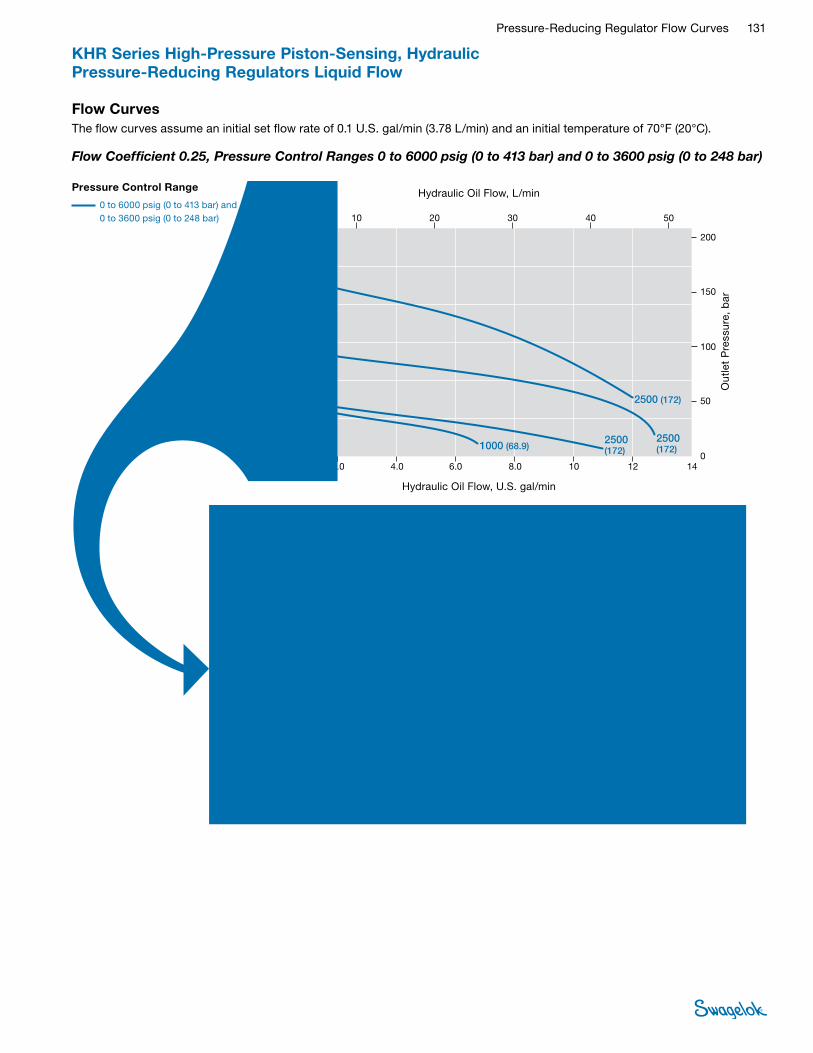
Pressure-Reducing Regulator Flow Curves 131
Pressure Control Range
0 to 6000 psig (0 to 413 bar) and 0 to 3600 psig (0 to 248 bar)
Flow Coefficient 0.25, Pressure Control Ranges 0 to 6000 psig (0 to 413 bar) and 0 to 3600 psig (0 to 248 bar)
KHR Series High-Pressure Piston-Sensing, Hydraulic Pressure-Reducing Regulators Liquid Flow
Flow CurvesThe flow curves assume an initial set flow rate of 0.1 U.S. gal/min (3.78 L/min) and an initial temperature of 70°F (20°C).
00 2.0
0 10
500
1000
1500
2000
2500
3000
50
100
150
200
8.06.04.0
JPN
EURO
USA
100
403020 50
12 14
00
2,00
10
500
1000
1500
2000
2500
3000
50
100
150
200
8,06,04,0 10
0403020 50
12 14
00 10
5.0
10
15
20
403020 50
2500 (172)
2500 (172)1000 (68.9)
2500 (172)
172 (2500)
172 (2500)
172 (2500)68.9 (1000)
17.2
17.217.26.89
Hydraulic Oil Flow, U.S. gal/min
Out
let
Pre
ssur
e, p
sig
Out
let
Pre
ssur
e, b
ar
Hydraulic Oil Flow, L/min
00 0.5
0 1.0
500
1000
1500
2000
2500
3000
50
100
150
200
1.51.0
JPN
EURO
USA
2.00
6.04.03.02.0 7.05.0
00 1,0
500
1000
1500
2000
2500
3000
50
100
150
200
06,04,03,02,0 7,05,0
0 1.0
5.0
10
15
20
06.04.03.02.0 7.05.0
0 0,5 1,51,0 2,0
1000 (68.9), 2500 (172)
2500 (172)
2500 (172)
172 (2500)
172 (2500)
68.9 (1000), 172 (2500)
6.89, 17.2
17.2
17.2
Hydraulic Oil Flow, U.S. gal/min
Out
let
Pre
ssur
e, p
sig
Out
let
Pre
ssur
e, b
ar
Hydraulic Oil Flow, L/minDetail A
A

132 Pressure-Reducing Regulator Flow Curves
Pressure Control Range
0 to 10 000 psig (0 to 689 bar)
Flow Coefficient 0.25, Pressure Control Range 0 to 10 000 psig (0 to 689 bar)
KHR Series High-Pressure Piston-Sensing, Hydraulic Pressure-Reducing Regulators Liquid Flow
Flow CurvesThe flow curves assume an initial set flow rate of 0.1 U.S. gal/min (3.78 L/min) and an initial temperature of 70°F (20°C).
00 2.0
0 10
500
1000
1500
2000
2500
3000
50
100
150
200
8.06.04.0
JPN
EURO
USA
100
403020 50
12 14
00
2,00
10
500
1000
1500
2000
2500
3000
50
100
150
200
8,06,04,0 10
0403020 50
12 14
00 10
5.0
10
15
20
403020 50
2500 (172)
2500 (172)2500 (172)1000 (68.9)
172 (2500)
172 (2500)172 (2500)68.9 (1000)
17.2
17.217.26.89
Hydraulic Oil Flow, U.S. gal/min
Out
let
Pre
ssur
e, p
sig
Out
let
Pre
ssur
e, b
ar
Hydraulic Oil Flow, L/min
00 0.5
0 1.0
500
1000
1500
2000
2500
3000
50
100
150
200
1.51.0
JPN
EURO
USA
2.00
6.04.03.02.0 7.05.0
00 1,0
500
1000
1500
2000
2500
3000
50
100
150
200
06,04,03,02,0 7,05,0
0 1.0
5.0
10
15
20
06.04.03.02.0 7.05.0
0 0,5 1,51,0 2,0
2500 (172)
2500 (172)
1000 (68.9), 2500 (172)
172 (2500)
172 (2500)
68.9 (1000), 172 (2500)
17.2
17.2
6.89, 17.2
Hydraulic Oil Flow, U.S. gal/min
Out
let
Pre
ssur
e, p
sig
Out
let
Pre
ssur
e, b
ar
Hydraulic Oil Flow, L/minDetail A
A

Pressure-Reducing Regulator Flow Curves 133
Compact, General Purpose, Spring-Loaded Pressure-Reducing Regulators RS(H)2 SeriesFeatures■Bottom mounting
■Sealed spring housing
■Low-friction piston for better control
For options, additional technical data, materials of construction, and ordering information, see the Swagelok Pressure Regulators, RHPS Series catalog, MS-02-430.
■Cartridge poppet assembly with 25 μm filter for ease of service
■Self-venting
■Threaded vent below panel for safety
Flow Coefficient 0.05, Pressure Control Ranges 0 to 145 psig (0 to 10.0 bar) and 0 to 362 psig (0 to 25.0 bar)
Flow DataThe graphs illustrate the change or “droop” in outlet pressures as the flow rate increases.
For more flow curve information, contact your authorized Swagelok representative.
Pressure Control Range:
0 to 145 psig (0 to 10.0 bar)
JPN
EURO
USA
0 15
0 20
604530 75
806040 100
0 15 604530 75
0 300 15001200900600 1800 2100
0 20 806040 100
30
60
90
120
150
2.5
5.0
7.5
10
00
0
30
60
90
120
150
2,5
5,0
7,5
10
0
0.50
0.75
1.00
0
0.25
580 (40.0)
1015 (70.0)
2900 (200),5800 (400)
2900 (200),5800 (400)
1015 (70.0)580 (40.0)
40,0 (580)
70,0 (1015)
200 (2900),400 (5800)
200 (2900),400 (5800)
40,0 (580)
4.0
7.0
20.0, 40.0
20.0, 40.0
7.04.0
70,0 (1015)
Nitrogen Flow, std ft3/min
Out
let
Pre
ssur
e, p
sig
Out
let
Pre
ssur
e, b
ar
Nitrogen Flow, Nm3/h
Inlet Pressure, psig (bar)
Pressure Control Range:
0 to 362 psig (0 to 25.0 bar)
JPN
EURO
USA
0 50 150100 200
0 30 1209060 150 180
0 30 1209060 150 180
250
1000 30002000 4000 5000
0
0
50 150100 200 250
0
150
200
250
300
350
400
25
100
50
20
5.0
10
15
0
0
150
200
250
300
350
400
25
100
50
20
5,0
10
15
0
0
2.5
2.0
0.5
1.0
1.5
580(40.0) 1015
(70.0)
2900(200)
5800(400)
725(50.0)
1015(70.0)
2900(200)
5800(400)
50,0(725)
40,0(580)
70,0(1015)
70,0(1015)
400(5800)
400(5800)
200(2900)
200(2900)
4.040.0
40.020.0
20.07.0
7.05.0
Nitrogen Flow, std ft3/min
Out
let
Pre
ssur
e, p
sig
Out
let
Pre
ssur
e, b
ar
Nitrogen Flow, Nm3/h
Inlet Pressure, psig (bar)

134 Pressure-Reducing Regulator Flow Curves
Compact, General Purpose, Spring-Loaded Pressure-Reducing Regulators RS(H)2 Series
For options, additional technical data, materials of construction, and ordering information, see the Swagelok Pressure Regulators, RHPS Series catalog, MS-02-430.
Flow Coefficient 0.05, Pressure Control Ranges 0 to 1450 psig (0 to 100 bar) and 0 to 2537 psig (0 to 175 bar)
Flow DataThe graphs illustrate the change or “droop” in outlet pressures as the flow rate increases.
For more flow curve information, contact your authorized Swagelok representative.
Pressure Control Range:
0 to 1450 psig (0 to 100 bar)
JPN
EURO
USA
0 50 200150100 250 300
0 50 200150100 250 300
0
1500 45003000 6000 7500
0 75 225150 300 375
0 75 225150 300 375
450
450
300
600
900
1200
1500
25
50
75
100
00
0
300
600
900
1200
1500
25
50
75
100
0
5.0
7.5
10
0
2.5
2900 (200) 5800 (400)
5800 (400)2900 (200)
1015 (70.0)
1015 (70.0) 2900 (200) 5800 (400)580
(40.0)
70,0 (1015)
70,0 (1015)40,0(580)
200 (2900)
200 (2900)
200 (2900) 400 (5800)
400 (5800)
400 (5800)
40.0
4.0
40.0
40.0
20.0
20.0
20.0
7.0
7.0
Nitrogen Flow, std ft3/min
Out
let
Pre
ssur
e, p
sig
Out
let
Pre
ssur
e, b
ar
Nitrogen Flow, Nm3/h
Inlet Pressure, psig (bar)
Pressure Control Range:
0 to 2537 psig (0 to 175 bar)
JPN
EURO
USA
0 75 225150 300
0 60 180120 240 300
0 60 180120 240 300
375
2000 4000 6000 8000
0
0
75 225150 300 450
0
1200
1800
2400
3000
180
600
150
30
90
120
0
0
1200
1800
2400
3000
180
600
150
60
90
120
0
0
450
375
60
30
18
15
6.0
9.0
12
3.0
2900 (200) 5800 (400)
5800 (400)2900 (200)
200 (2900) 400 (5800)
400 (5800)200 (2900)
20.0 40.0
40.0 20.0
0
Nitrogen Flow, std ft3/min
Out
let
Pre
ssur
e, p
sig
Out
let
Pre
ssur
e, b
ar
Nitrogen Flow, Nm3/h
Inlet Pressure, psig (bar)

Pressure-Reducing Regulator Flow Curves 135
Compact, General Purpose, Spring-Loaded Pressure-Reducing Regulators RS(H)2 Series
For options, additional technical data, materials of construction, and ordering information, see the Swagelok Pressure Regulators, RHPS Series catalog, MS-02-430.
Flow Coefficient 0.05, Pressure Control Ranges 0 to 5075 psig (0 to 350 bar) and 0 to 10 150 psig (0 to 700 bar)
Flow DataThe graphs illustrate the change or “droop” in outlet pressures as the flow rate increases.
For more flow curve information, contact your authorized Swagelok representative.
Pressure Control Range:
0 to 5075 psig (0 to 350 bar)
JPN
EURO
USA
0 75 225150 300
0 60 180120 240 300
0 60 180120 240 300
375
2000 4000 6000 8000
0
0
75 225150 300 450
0
2400
3600
4800
6000
360
1200
300
60
180
240
0
0
2400
3600
4800
6000
360
1200
300
120
180
240
0
0
450
375
120
60
36
30
12
18
24
6.0
5800 (400)
2900 (200) 5800 (400)
400 (5800)
200 (2900) 400 (5800)
40.0
20.0 40.0
0
Nitrogen Flow, std ft3/min
Out
let
Pre
ssur
e, p
sig
Out
let
Pre
ssur
e, b
ar
Nitrogen Flow, Nm3/h
Inlet Pressure, psig (bar)
Pressure Control Range:
0 to 10 150 psig (0 to 700 bar)
0
4000
6000
8000
10 000
2000
0 200100 600400 500300 700
700 0 100 300200 400 500 600
0 200 400 600 800 1000
390
520
650
130
0
260
650
520
390
260
0
130
0
4000
6000
8000
10 000
2000
0 200 400 600 800 1000
200 400 600 800 10000
65
52
26
39
13
0
Nitrogen Flow, std ft3/min
Out
let
Pre
ssur
e, p
sig
Out
let
Pre
ssur
e, b
arO
utle
t P
ress
ure,
psi
g
Out
let
Pre
ssur
e, b
arO
utle
t P
ress
ure,
MP
a
Nitrogen Flow, std ft3/min
Nitrogen Flow, Nm3/h
Nitrogen Flow, Nm3/h
Nitrogen Flow, Nm3/h
10 150 (700)
10 150 (700)
10 150 (700)
700 (10 150)
700 (10 150)
700 (10 150)
70.0
70.0
70.0
Pressure Control Range
0 to 10 150 psig (0 to 700 bar)
RSH2 Series
USA
EURO
JPN
Flow Coef�cient:0.05Maximum Inlet Pressure: RSH2—10 150 psig (700 bar)Outlet Pressure Control Range: 0 to 10 150 psig (0 to 700 bar)
Nitrogen Flow, std ft3/min
Out
let
Pre
ssur
e, p
sig
Out
let
Pre
ssur
e, b
ar
Nitrogen Flow, Nm3/h
Inlet Pressure, psig (bar)

136 Pressure-Reducing Regulator Flow Curves
General-Purpose, Spring-Loaded Pressure-Reducing Regulators RS(H)4 SeriesFeatures■Balanced poppet design
■Diaphragm or piston sensing
For options, additional technical data, materials of construction, and ordering information, see the Swagelok Pressure Regulators, RHPS Series catalog, MS-02-430.
JPN
EURO
USA
0 75 300225150 375 450
0 75 300225150 375 450
0
100
200
300
400
4.0
16
20
24
0
0
100
200
300
400
4,0
16
20
24
0
4000 80006000 10 0000
12 000
0 100 300200 500 600
0 100 400200 500 600
2000
12
8.0
12
8,0
0.4
1.6
2.0
2.4
1.2
0.8
400 700
300 700
1015 (70.0)
580 (40.0)
1015 (70.0)
580 (40.0)
1015 (70.0)580 (40.0)
218 (15.0)
1015 (70.0)580 (40.0)218 (15.0)1015 (70.0)
580 (40.0)218 (15.0)
70,0 (1015)
40,0 (580)
70,0 (1015)
40,0 (580)
70,0 (1015)40,0 (580)
15,0 (218)
70,0 (1015)40,0 (580)15,0 (218)70,0 (1015)
40,0 (580)15,0 (218)
7.0
4.0
7.0
4.0
7.04.0
1.5
7.04.01.57.0
4.01.5
0
Nitrogen Flow, std ft3/min
Out
let
Pre
ssur
e, p
sig
Out
let
Pre
ssur
e, b
ar
Nitrogen Flow, Nm3/h
Inlet Pressure, psig (bar)
Pressure Control Range
0 to 406 psig (0 to 28.0 bar)
0 to 203 psig (0 to 14.0 bar)
0 to 101 psig (0 to 7.0 bar)
0 to 43 psig (0 to 3.0 bar)
Flow Coefficient 1.84, Pressure Control Ranges 0 to 43 psig (0 to 3.0 bar), 0 to 101 psig (0 to 7.0 bar), 0 to 203 psig (0 to 14.0 bar), and 0 to 406 psig (0 to 28.0 bar)
RS4 Series
Flow DataThe graphs illustrate the change or “droop” in outlet pressures as the flow rate increases.
For more flow curve information, contact your authorized Swagelok representative.
RS(H)4 Series
JPN
EURO
USA
0 200
0 300
800600400 1200
1200900600 1500
0 200 800600400 1200
0 5000 25 00020 00015 00010 000 30 000
0 300 1200900600 1500
200
400
600
800
1000
30
40
50
60
00
0
200
400
600
800
1000
30
40
50
60
0
0
1800
1800
0
1000
1000
20
10
20
10
3.0
4.0
5.0
6.0
2.0
1.0
1015 (70.0)
580 (40.0)
580 (40.0)
1015 (70.0)1015 (70.0)
1015 (70.0)
70,0 (1015)
40,0 (580)
40,0 (580)
70,0 (1015)
70,0 (1015)
7.0
4.0
4.0
7.07.0
7.0
70,0 (1015)
Nitrogen Flow, std ft3/min
Out
let
Pre
ssur
e, p
sig
Out
let
Pre
ssur
e, b
ar
Nitrogen Flow, Nm3/h
Inlet Pressure, psig (bar)
Pressure Control Range
0 to 1160 psig (0 to 80.0 bar)
0 to 580 psig (0 to 40.0 bar)
0 to 406 psig (0 to 28.0 bar)
Flow Coefficient 1.84, Pressure Control Ranges 0 to 406 psig (0 to 28.0 bar), 0 to 580 psig (0 to 40.0 bar), and 0 to 1160 psig (0 to 80.0 bar)
■Threaded vent to monitor sensing seal integrity

Pressure-Reducing Regulator Flow Curves 137
For options, additional technical data, materials of construction, and ordering information, see the Swagelok Pressure Regulators, RHPS Series catalog, MS-02-430.
Flow Coefficient 1.84, Pressure Control Ranges 0 to 2175 psig (0 to 150 bar), 0 to 4060 psig (0 to 280 bar), and 0 to 5800 psig (0 to 400 bar)
RSH4 Series
Flow DataThe graphs illustrate the change or “droop” in outlet pressures as the flow rate increases.
For more flow curve information, contact your authorized Swagelok representative.
Pressure Control Range:
0 to 5800 psig (0 to 400 bar)
0 to 4060 psig (0 to 280 bar)
0 to 2175 psig (0 to 150 bar)
0
2000
3000
4000
5000
6000
1000
0 2000 60004000 8000 10 000
0 2000 60004000 8000 10 000
0 3000 6000 9000 12 000 15 000
240
300
360
60
180
0
120
360
300
60
240
180
0
120
0
2000
3000
4000
5000
6000
1000
0 3000 6000 9000 12 000 15 000
3000 6000 9000 12 000 15 0000
36
30
12
18
24
6.0
0
Nitrogen Flow, std ft3/min
Out
let
Pre
ssur
e, p
sig
Out
let
Pre
ssur
e, b
arO
utle
t P
ress
ure,
psi
g
Out
let
Pre
ssur
e, b
arO
utle
t P
ress
ure,
MP
a
Nitrogen Flow, std ft3/min
Nitrogen Flow, Nm3/h
Nitrogen Flow, Nm3/h
Nitrogen Flow, Nm3/h
5800 (400)
5800 (400)
400 (5800)
400 (5800)
40.0
40.0
2900 (200)
5800 (400)
200 (2900)
400 (5800)
40.0
20.0
Pressure Control Range
0 to 2175 psig (0 to 150 bar)
0 to 4060 psig (0 to 280 bar)
0 to 5800 psig (0 to 400 bar)
RSH4 Series
USA
EURO
JPN
Flow Coef�cient: 1.84Maximum Inlet Pressure: RSH4—5800 psig (400 bar)Outlet Pressure Control Range: 0 to 5800 psig (0 to 400 bar)
Nitrogen Flow, std ft3/min
Out
let
Pre
ssur
e, p
sig
Out
let
Pre
ssur
e, b
ar
Nitrogen Flow, Nm3/h
Inlet Pressure, psig (bar)
General-Purpose, Spring-Loaded Pressure-Reducing Regulators RS(H)4 Series

138 Pressure-Reducing Regulator Flow Curves
General-Purpose, Spring-Loaded Pressure-Reducing Regulators RS(H)6 Series
For options, additional technical data, materials of construction, and ordering information, see the Swagelok Pressure Regulators, RHPS Series catalog, MS-02-430.
Flow DataThe graphs illustrate the change or “droop” in outlet pressures as the flow rate increases.
For more flow curve information, contact your authorized Swagelok representative.
Flow Coefficient 1.95, Pressure Control Ranges 0 to 43 psig (0 to 3.0 bar), 0 to 101 psig (0 to 7.0 bar), 0 to 203 psig (0 to 14.0 bar), and 0 to 406 psig (0 to 28.0 bar)
RS6 Series
RS(H)6 Series
Flow Coefficient 1.95, Pressure Control Ranges 0 to 406 psig (0 to 28.0 bar), 0 to 580 psig (0 to 40.0 bar), and 0 to 1160 psig (0 to 80.0 bar)
Nitrogen Flow, std ft3/min
Out
let
Pre
ssur
e, p
sig
Out
let
Pre
ssur
e, b
ar
Nitrogen Flow, Nm3/h
JPN
EURO
USA
0 200 600400 800
0100
0
8.0
0
400
12
0
1000
4000 16 00080000
20 000
200 300 400 500 600 800
0 100 200 300 400 500 600 800
0 200 600400 800 1000
100
200
300
400
12
16
20
0
100
200
300
16
20
24
24
8,0
12 000
1200
4.0
700
1200
4,0
700
1.2
1.6
2.0
2.4
0.8
0.4
1015 (70.0)
580 (40.0)
218 (15.0)
1015 (70.0)
580 (40.0)1015 (70.0)
580 (40.0)
218 (15.0)
218 (15.0)580 (40.0)1015 (70.0)
580 (40.0)1015 (70.0)
70,0 (1015)
40,0 (580)
15,0 (218)
70,0 (1015)
40,0 (580)70,0 (1015)40,0 (580)
15,0 (218)
15,0 (218)40,0 (580)70,0 (1015)
40,0 (580)70,0 (1015)
7.0
4.0
1.5
7.04.0
7.04.0
1.5
1.54.07.0
4.07.0
Inlet Pressure, psig (bar)
Pressure Control Range
0 to 406 psig (0 to 28.0 bar)
0 to 203 psig (0 to 14.0 bar)
0 to 101 psig (0 to 7.0 bar)
0 to 43 psig (0 to 3.0 bar)
JPN
EURO
USA
0 200
0 300
800600400 1200
1200900600 1500
0 200 800600400 1200
0 5000 25 00020 00015 00010 000 30 000
0 300 1200900600 1500
200
400
600
800
1000
30
40
50
60
00
0
200
400
600
800
1000
30
40
50
60
0
0
1800
1800
0
1000
1000
20
10
20
10
3.0
4.0
5.0
6.0
2.0
1.0
1015 (70.0)
1015 (70.0)1015 (70.0)
1015 (70.0)580 (40.0)
580 (40.0)
70,0 (1015)
70,0 (1015)70,0 (1015)
70,0 (1015)40,0 (580)
40,0 (580)
7.0
7.07.0
7.04.0
4.0
Nitrogen Flow, std ft3/min
Out
let
Pre
ssur
e, p
sig
Out
let
Pre
ssur
e, b
ar
Nitrogen Flow, Nm3/h
Inlet Pressure, psig (bar)
Pressure Control Range
0 to 1160 psig (0 to 80.0 bar)
0 to 580 psig (0 to 40.0 bar)
0 to 406 psig (0 to 28.0 bar)

Pressure-Reducing Regulator Flow Curves 139
General-Purpose, Spring-Loaded Pressure-Reducing Regulators RS(H)6 Series
For options, additional technical data, materials of construction, and ordering information, see the Swagelok Pressure Regulators, RHPS Series catalog, MS-02-430.
Flow DataThe graphs illustrate the change or “droop” in outlet pressures as the flow rate increases.
For more flow curve information, contact your authorized Swagelok representative.
Flow Coefficient 1.95, Pressure Control Ranges 0 to 2175 psig (0 to 150 bar), 0 to 4060 psig (0 to 280 bar), and 0 to 5800 psig (0 to 400 bar)
RSH6 Series
Pressure Control Range:
0 to 5800 psig (0 to 400 bar)
0 to 4060 psig (0 to 280 bar)
0 to 2175 psig (0 to 150 bar)
0
2000
3000
4000
5000
6000
1000
0 2000 60004000 8000 10 000
0 2000 60004000 8000 10 000
0 3000 6000 9000 12 000 15 000
240
300
360
60
180
0
120
360
300
60
240
180
0
120
0
2000
3000
4000
5000
6000
1000
0 3000 6000 9000 12 000 15 000
3000 6000 9000 12 000 15 0000
36
30
12
18
24
6.0
0
Nitrogen Flow, std ft3/min
Out
let
Pre
ssur
e, p
sig
Out
let
Pre
ssur
e, b
arO
utle
t P
ress
ure,
psi
g
Out
let
Pre
ssur
e, b
arO
utle
t P
ress
ure,
MP
a
Nitrogen Flow, std ft3/min
Nitrogen Flow, Nm3/h
Nitrogen Flow, Nm3/h
Nitrogen Flow, Nm3/h
5800 (400)
5800 (400)
400 (5800)
400 (5800)
40.0
40.0
2900 (200) 5800 (400)
200 (2900) 400 (5800)
40.020.0
Pressure Control Range
0 to 2175 psig (0 to 150 bar)
0 to 4060 psig (0 to 280 bar)
0 to 5800 psig (0 to 400 bar)
RSH6 Series
USA
EURO
JPN
Flow Coef�cient: 1.95Maximum Inlet Pressure: RSH6—5800 psig (400 bar)Outlet Pressure Control Range: 0 to 5800 psig (0 to 400 bar)
Nitrogen Flow, std ft3/min
Out
let
Pre
ssur
e, p
sig
Out
let
Pre
ssur
e, b
ar
Nitrogen Flow, Nm3/h
Inlet Pressure, psig (bar)
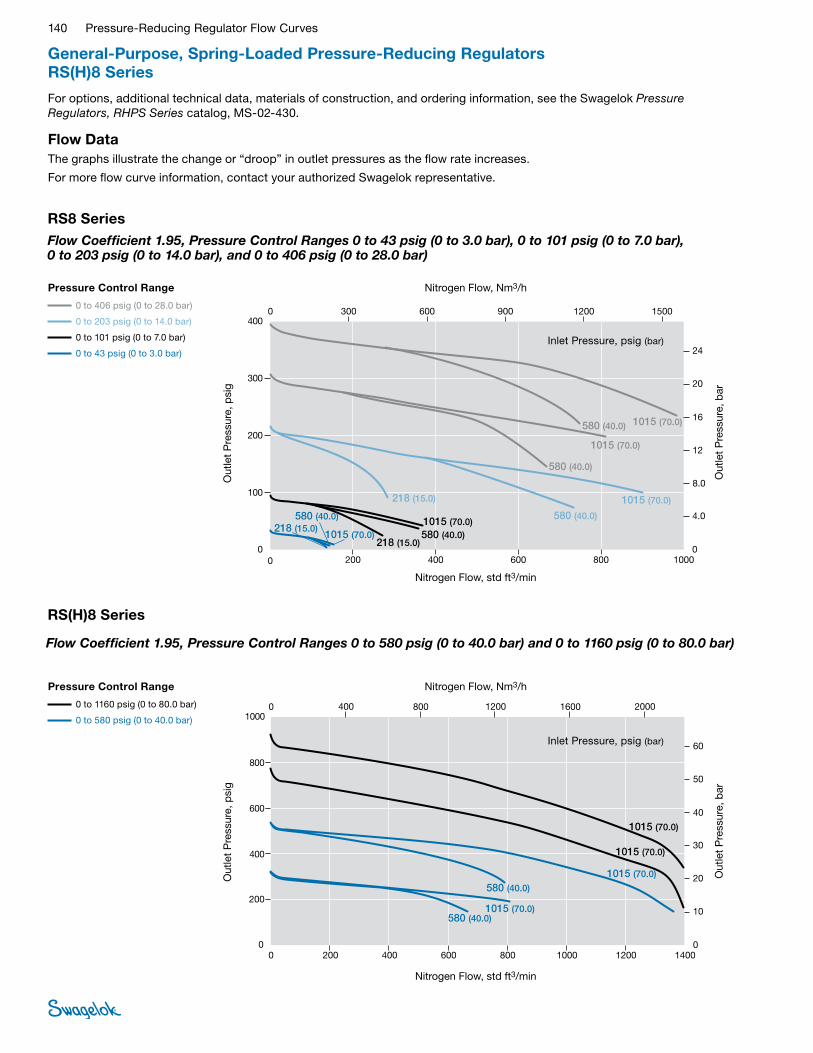
140 Pressure-Reducing Regulator Flow Curves
General-Purpose, Spring-Loaded Pressure-Reducing Regulators RS(H)8 Series
For options, additional technical data, materials of construction, and ordering information, see the Swagelok Pressure Regulators, RHPS Series catalog, MS-02-430.
Flow DataThe graphs illustrate the change or “droop” in outlet pressures as the flow rate increases.
For more flow curve information, contact your authorized Swagelok representative.
Flow Coefficient 1.95, Pressure Control Ranges 0 to 43 psig (0 to 3.0 bar), 0 to 101 psig (0 to 7.0 bar), 0 to 203 psig (0 to 14.0 bar), and 0 to 406 psig (0 to 28.0 bar)
RS8 Series
RS(H)8 Series
Flow Coefficient 1.95, Pressure Control Ranges 0 to 580 psig (0 to 40.0 bar) and 0 to 1160 psig (0 to 80.0 bar)
JPN
EURO
USA
0 200 600400 800 1000
0 200 600400 800 1000
0
100
200
300
400
4.0
16
20
24
0
0
100
200
300
400
4,0
16
20
24
0
12 0004000 20 0000
28 000
0 300 900600 1200
0 300 900600 1200
1500
1500
12
8.0
12
8,0
0.4
1.6
2.4
1.2
0.8
2.0
8000 16 000 24 000
1015 (70.0)580 (40.0)
1015 (70.0)
580 (40.0)
1015 (70.0)
580 (40.0)
218 (15.0)
1015 (70.0)580 (40.0)
218 (15.0)
580 (40.0)
1015 (70.0)218 (15.0)
70,0 (1015)40,0 (580)
70,0 (1015)
40,0 (580)
70,0 (1015)
40,0 (580)
15,0 (218)
70,0 (1015)40,0 (580)
15,0 (218)
40,0 (580)
70,0 (1015)15,0 (218)
7.04.07.0
4.0
7.04.0
1.5
7.04.01.5
4.07.0
1.5
0
Nitrogen Flow, std ft3/min
Out
let
Pre
ssur
e, p
sig
Out
let
Pre
ssur
e, b
ar
Nitrogen Flow, Nm3/h
Inlet Pressure, psig (bar)
Pressure Control Range
0 to 406 psig (0 to 28.0 bar)
0 to 203 psig (0 to 14.0 bar)
0 to 101 psig (0 to 7.0 bar)
0 to 43 psig (0 to 3.0 bar)
JPN
EURO
USA
0 200
0 400
800600400 1400
16001200800 2000
0 200 800600400 1400
0 5000 25 00020 00015 00010 000 30 000
0 400 16001200800
200
400
600
800
1000
30
40
50
60
00
0
200
400
600
800
1000
30
40
50
60
0
0
2000
0
1000
1000
20
10
20
10
3.0
4.0
5.0
6.0
2.0
1.0
1200
1200
35 000
1015 (70.0)
1015 (70.0)
1015 (70.0)
1015 (70.0)
580 (40.0)
580 (40.0)
70,0 (1015)
70,0 (1015)
70,0 (1015)
70,0 (1015)
40,0 (580)
40,0 (580)
7.0
7.0
7.07.0
4.0
4.0
Nitrogen Flow, std ft3/min
Out
let
Pre
ssur
e, p
sig
Out
let
Pre
ssur
e, b
ar
Nitrogen Flow, Nm3/h
Inlet Pressure, psig (bar)
Pressure Control Range
0 to 1160 psig (0 to 80.0 bar)
0 to 580 psig (0 to 40.0 bar)

Pressure-Reducing Regulator Flow Curves 141
General-Purpose, Spring-Loaded Pressure-Reducing Regulators RS(H)8 Series
For options, additional technical data, materials of construction, and ordering information, see the Swagelok Pressure Regulators, RHPS Series catalog, MS-02-430.
Flow DataThe graphs illustrate the change or “droop” in outlet pressures as the flow rate increases.
For more flow curve information, contact your authorized Swagelok representative.
RSH8 Series
Pressure Control Range:
0 to 5800 psig (0 to 400 bar)
0 to 4060 psig (0 to 280 bar)
0 to 2175 psig (0 to 150 bar)
Flow Coefficient 1.95, Pressure Control Ranges 0 to 2175 psig (0 to 150 bar), 0 to 4060 psig (0 to 280 bar), and 0 to 5800 psig (0 to 400 bar)
0
2000
3000
4000
5000
6000
1000
0 2000 60004000 8000 10 000
0 2000 60004000 8000 10 000
0 3000 6000 9000 12 000 15 000
240
300
360
60
180
0
120
360
300
60
240
180
0
120
0
2000
3000
4000
5000
6000
1000
0 3000 6000 9000 12 000 15 000
3000 6000 9000 12 000 15 0000
36
30
12
18
24
6.0
0
Nitrogen Flow, std ft3/min
Out
let
Pre
ssur
e, p
sig
Out
let
Pre
ssur
e, b
arO
utle
t P
ress
ure,
psi
g
Out
let
Pre
ssur
e, b
arO
utle
t P
ress
ure,
MP
a
Nitrogen Flow, std ft3/min
Nitrogen Flow, Nm3/h
Nitrogen Flow, Nm3/h
Nitrogen Flow, Nm3/h
5800 (400)
5800 (400)
400 (5800)
400 (5800)
40.0
40.0
2900 (200) 5800 (400)
200 (2900) 400 (5800)
40.020.0
Pressure Control Range
0 to 2175 psig (0 to 150 bar)
0 to 4060 psig (0 to 280 bar)
0 to 5800 psig (0 to 400 bar)
RSH8 Series
USA
EURO
JPN
Flow Coef�cient: 2.07Maximum Inlet Pressure: RSH8—5800 psig (400 bar)Outlet Pressure Control Range: 0 to 5800 psig (0 to 400 bar)
Nitrogen Flow, std ft3/min
Out
let
Pre
ssur
e, p
sig
Out
let
Pre
ssur
e, b
ar
Nitrogen Flow, Nm3/h
Inlet Pressure, psig (bar)

142 Pressure-Reducing Regulator Flow Curves
General-Purpose, Spring-Loaded Pressure-Reducing Regulators RS(H)10, RS(H)15, and RS(H)20 Series
For options, additional technical data, materials of construction, and ordering information, see the Swagelok Pressure Regulators, RHPS Series catalog, MS-02-430.
Features■Balanced poppet design
■RS(H)10 and RS(H)15—diaphragm or piston sensing RS(H)20—diaphragm sensing only
Flow DataThe graphs illustrate the change or “droop” in outlet pressures as the flow rate increases.
For more flow curve information, contact your authorized Swagelok representative.
Flow Coefficient 3.79, Pressure Control Ranges 0 to 1450 psig (0 to 100 bar), 0 to 2610 psig (0 to 180 bar), and 0 to 3625 psig (0 to 350 bar)
RSH10 Series
Pressure Control Range:
0 to 3625 psig (0 to 350 bar)
0 to 2610 psig (0 to 180 bar)
0 to 1450 psig (0 to 100 bar)
0
1000
1500
2000
2500
3000
3500
4000
500
0 2000 60004000 8000 10 000 12 000 14 000
0 2000 60004000 8000 10 000 14 00012 000
0 4000 8000 12 000 16 000 20 000
200
240
80
40
160
0
120
240
200
160
120
0
40
80
0
2000
2500
3000
3500
4000
1500
1000
500
0 4000 8000 12 000 16 000 20 000
4000 8000 12 000 16 000 20 0000
24
20
12
16
4.0
8.0
0
Nitrogen Flow, std ft3/min
Out
let
Pre
ssur
e, p
sig
Out
let
Pre
ssur
e, b
arO
utle
t P
ress
ure,
psi
g
Out
let
Pre
ssur
e, b
arO
utle
t P
ress
ure,
MP
a
Nitrogen Flow, std ft3/min
Nitrogen Flow, Nm3/h
Nitrogen Flow, Nm3/h
Nitrogen Flow, Nm3/h
5800 (400)2900 (200)
5800 (400)
400 (5800)200 (2900)
400 (5800)
40.020.0
40.0
2900 (200) 5800 (400)
200 (2900) 400 (5800)
40.020.0
Pressure Control Range
0 to 1450psig (0 to 100 bar)
0 to 2610 psig (0 to 180 bar)
0 to 3625 psig (0 to 250 bar)
RSH10 Series
USA
EURO
JPN
Flow Coef�cient: 3.79Maximum Inlet Pressure: RSH10—5800 psig (400 bar)Outlet Pressure Control Range: 0 to 3625 psig (0 to 250 bar)
Nitrogen Flow, std ft3/min
Out
let
Pre
ssur
e, p
sig
Out
let
Pre
ssur
e, b
ar
Nitrogen Flow, Nm3/h
Inlet Pressure, psig (bar)
Flow Coefficient 3.79, Pressure Control Ranges 0 to 43 psig (0 to 3.0 bar), 0 to 145 psig (0 to 10.0 bar), 0 to 290 psig (0 to 20.0 bar), and 0 to 580 psig (0 to 40.0 bar)
RS10 Series
Nitrogen Flow, std ft3/min
Out
let
Pre
ssur
e, p
sig
Out
let
Pre
ssur
e, b
ar
Nitrogen Flow, Nm3/h
JPN
EURO
USA
0 200 800600400 1000 1200
0 200 800600400 1000 1200
0
50
100
150
200
250
300
5.0
10
15
20
0
0
50
100
150
200
250
300
5,0
10
15
20
0
20 0005000 25 000
0.5
1.0
1.5
2.0
030 000
0 300 900600 1200 1500
0 300 900600 1200 1500
1800
1800
15 00010 000
1015 (70.0)
218 (15.0)1015 (70.0)
1015 (70.0)
1015 (70.0)
1015 (70.0)
218 (15.0)
218 (15.0)
218 (15.0)
580 (40.0)
580 (40.0)
580 (40.0)
580 (40.0)
580 (40.0)
70,0 (1015)
15,0 (218)70,0 (1015)
70,0 (1015)
70,0 (1015)
70,0 (1015)
15,0 (218)
15,0 (218)
15,0 (218)
40,0 (580)
40,0 (580)
40,0 (580)
40,0 (580)
40,0 (580)
7.0
1.5 7.0
7.0
7.0
7.0
1.5
1.5
1.5
4.0
4.0
4.0
4.0
4.0
Inlet Pressure, psig (bar)
Pressure Control Range
0 to 580 psig (0 to 40.0 bar)
0 to 290 psig (0 to 20.0 bar)
0 to 145 psig (0 to 10.0 bar)
0 to 43 psig (0 to 3.0 bar)

Pressure-Reducing Regulator Flow Curves 143
General-Purpose, Spring-Loaded Pressure-Reducing Regulators RS(H)15 Series
Flow Coefficient 7.30, Pressure Control Ranges 0 to 43 psig (0 to 3.0 bar), 0 to 72 psig (0 to 5.0 bar), and 0 to 145 psig (0 to 10.0 bar)
RS15 Series
For options, additional technical data, materials of construction, and ordering information, see the Swagelok Pressure Regulators, RHPS Series catalog, MS-02-430.
Flow DataThe graphs illustrate the change or “droop” in outlet pressures as the flow rate increases.
For more flow curve information, contact your authorized Swagelok representative.
Pressure Control Range
0 to 72 psig (0 to 5.0 bar)
0 to 43 psig (0 to 3.0 bar)
Nitrogen Flow, std ft3/min
Out
let
Pre
ssur
e, p
sig
Out
let
Pre
ssur
e, b
ar
Nitrogen Flow, Nm3/h
0
45
90
75
15
30
60
0 200 600400 800 1000
0 200 600400 800 1000
0 300 600 900 1200 1500
6.0
2.0
1.0
3.0
5.0
0
4.0
6.0
2.0
1.0
5.0
4.0
0
3.0
0
30
45
60
90
75
15
0 300 600 900 1200 1500
0.6
0.2
0.1
0.5
0.4
0
0.3
0 300 600 900 1200 1500
Nitrogen Flow, std ft3/min
Out
let
Pre
ssur
e, p
sig
Out
let
Pre
ssur
e, b
arO
utle
t P
ress
ure,
psi
g
Out
let
Pre
ssur
e, b
arO
utle
t P
ress
ure,
MP
a
Nitrogen Flow, std ft3/min
Nitrogen Flow, Nm3/h
Nitrogen Flow, Nm3/h
Nitrogen Flow, Nm3/h
218 (15.0)
580 (40.0) 218 (15.0)
1015 (70.0)
40.0 (580)
40.0 (580)
15.0 (218)
15.0 (218)
70.0 (1015)
4.0
4.0
1.5
1.5
7.0
580 (40.0)1015 (70.0)
Pressure Control Range
0 to 43 psig (0 to 3.0 bar)
0 to 72 psig (0 to 5.0 bar)
RS15 Series
USA
EURO
JPN
Flow Coef�cient: 7.30Maximum Inlet Pressure: RS15—1015 psig (70.0 bar)Outlet Pressure Control Range: 0 to 72 psig (0 to 5.0 bar)
70.0 (1015)
7.0
Inlet Pressure, psig (bar)
Nitrogen Flow, std ft3/min
Out
let
Pre
ssur
e, p
sig
Out
let
Pre
ssur
e, b
ar
Nitrogen Flow, Nm3/h
0
90
180
150
30
60
120
0 400 1200800 1600 2000
0 400 1200800 1600 2000
0 500 1000 1500 2000 2500 3000
12
4.0
2.0
6.0
10
0
8.0
12
4.0
2.0
10
8.0
0
6.0
0
60
90
120
180
150
30
0 1000500 1500 2000 2500 3000
1.2
0.4
0.2
1.0
0.8
0
0.6
0 1000500 1500 2000 2500 3000
Nitrogen Flow, std ft3/min
Out
let
Pre
ssur
e, p
sig
Out
let
Pre
ssur
e, b
arO
utle
t P
ress
ure,
psi
g
Out
let
Pre
ssur
e, b
arO
utle
t P
ress
ure,
MP
a
Nitrogen Flow, std ft3/min
Nitrogen Flow, Nm3/h
Nitrogen Flow, Nm3/h
Nitrogen Flow, Nm3/h
218 (15.0)
580 (40.0), 1015 (70.0)
15.0 (218)
40.0 (580), 70.0 (1015)
1.5
4.0, 7.0
Pressure Control Range
0 to 145 psig (0 to 10.0 bar)
RS15 Series
USA
EURO
JPN
Flow Coef�cient: 7.30Maximum Inlet Pressure: RS15—1015 psig (70.0 bar)Outlet Pressure Control Range: 0 to 145 psig (0 to 10.0 bar)
Inlet Pressure, psig (bar)
Pressure Control Range
0 to 145 psig (0 to 10.0 bar)
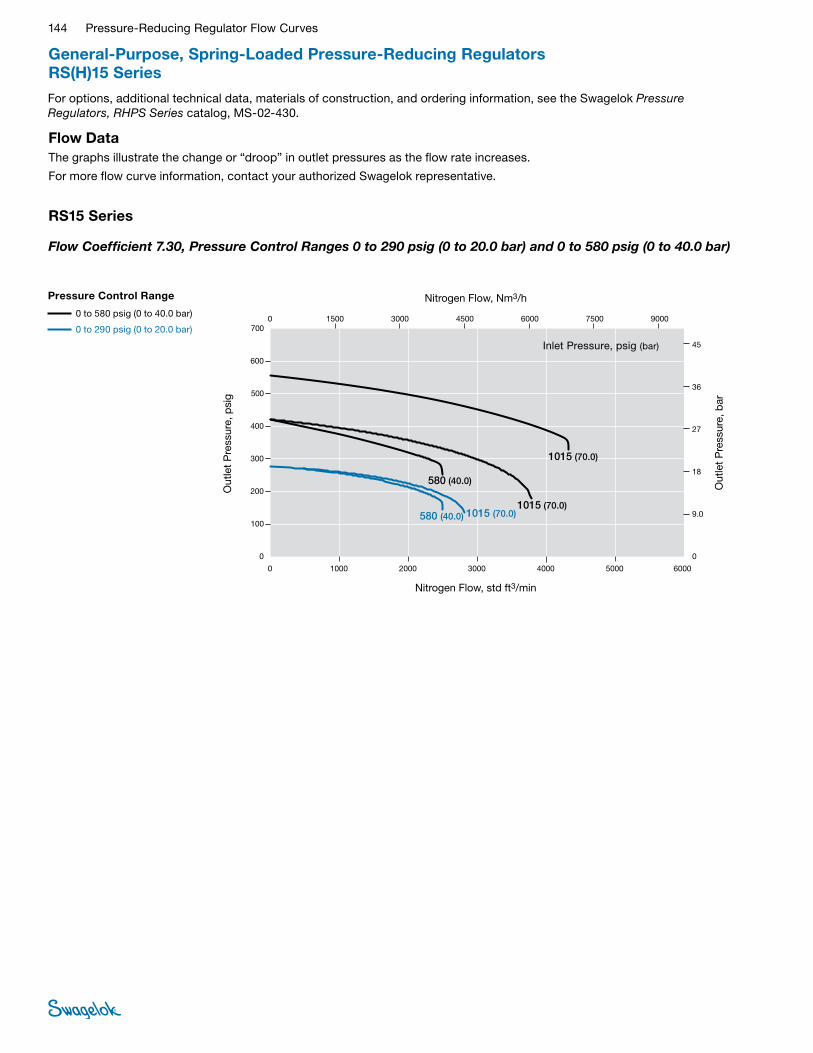
144 Pressure-Reducing Regulator Flow Curves
General-Purpose, Spring-Loaded Pressure-Reducing Regulators RS(H)15 Series
Flow Coefficient 7.30, Pressure Control Ranges 0 to 290 psig (0 to 20.0 bar) and 0 to 580 psig (0 to 40.0 bar)
RS15 Series
For options, additional technical data, materials of construction, and ordering information, see the Swagelok Pressure Regulators, RHPS Series catalog, MS-02-430.
Flow DataThe graphs illustrate the change or “droop” in outlet pressures as the flow rate increases.
For more flow curve information, contact your authorized Swagelok representative.
Pressure Control Range
0 to 580 psig (0 to 40.0 bar)
0 to 290 psig (0 to 20.0 bar)
Nitrogen Flow, std ft3/min
Out
let
Pre
ssur
e, p
sig
Out
let
Pre
ssur
e, b
ar
Nitrogen Flow, Nm3/h
0
500
700
200
300
100
400
600
0 20001000 40003000 5000 6000
0 1000 30002000 50004000 6000
0 30001500 4500 6000 7500 9000
45
9.0
18
36
0
27
45
9.0
36
27
0
18
0
200
300
500
600
400
700
100
0 1500 3000 4500 6000 7500 9000
4.5
0.9
3.6
2.7
0
1.8
0 1500 3000 4500 6000 7500 9000
Nitrogen Flow, std ft3/min
Out
let
Pre
ssur
e, p
sig
Out
let
Pre
ssur
e, b
arO
utle
t P
ress
ure,
psi
g
Out
let
Pre
ssur
e, b
arO
utle
t P
ress
ure,
MP
a
Nitrogen Flow, std ft3/min
Nitrogen Flow, Nm3/h
Nitrogen Flow, Nm3/h
Nitrogen Flow, Nm3/h
1015 (70.0)
580 (40.0)
40.0 (580) 70.0 (1015)
580 (40.0)
1015 (70.0)
1015 (70.0)
Pressure Control Range
0 to 290 psig (0 to 20.0 bar)
0 to 580 psig (0 to 40.0 bar)
RS15 Series
USA
EURO
JPN
Flow Coef�cient: 7.30Maximum Inlet Pressure: RS15—1015 psig (70.0 bar)Outlet Pressure Control Range: 0 to 580 psig (0 to 40.0 bar)
40.0 (580)
70.0 (1015)
70.0 (1015)
4.0 7.0
4.0
7.0
7.0
Inlet Pressure, psig (bar)
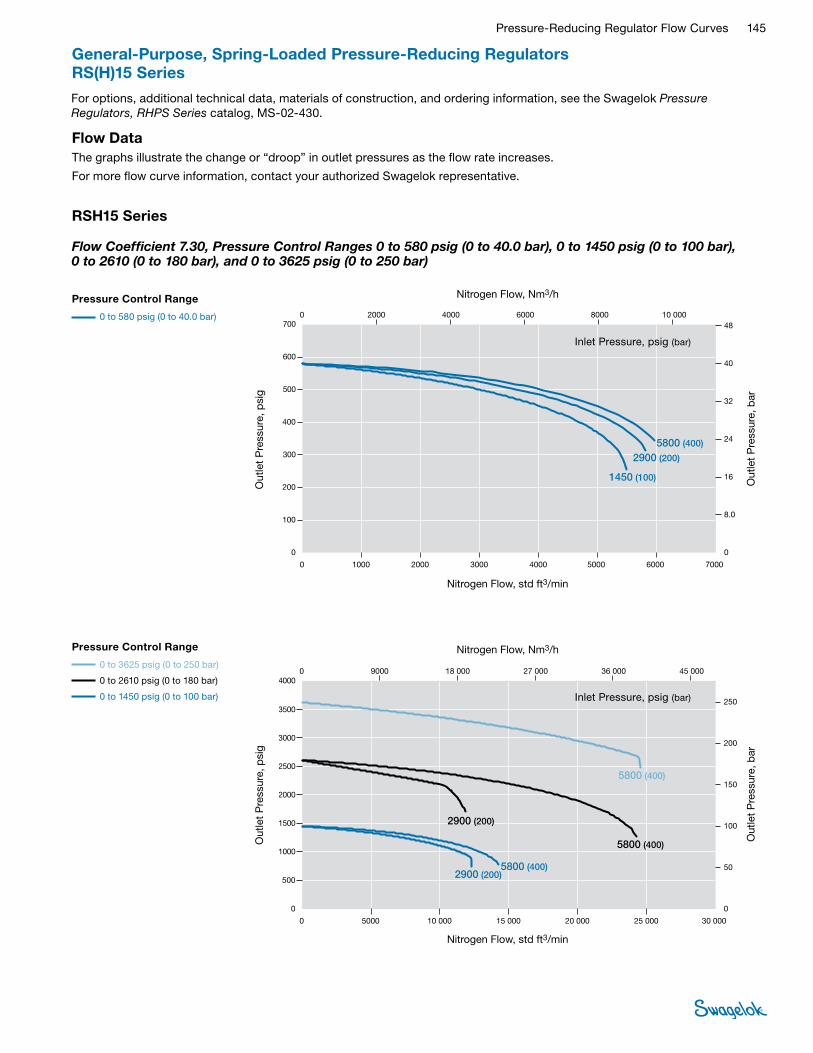
Pressure-Reducing Regulator Flow Curves 145
General-Purpose, Spring-Loaded Pressure-Reducing Regulators RS(H)15 Series
Flow Coefficient 7.30, Pressure Control Ranges 0 to 580 psig (0 to 40.0 bar), 0 to 1450 psig (0 to 100 bar), 0 to 2610 (0 to 180 bar), and 0 to 3625 psig (0 to 250 bar)
RSH15 Series
For options, additional technical data, materials of construction, and ordering information, see the Swagelok Pressure Regulators, RHPS Series catalog, MS-02-430.
Pressure Control Range
0 to 580 psig (0 to 40.0 bar)
Nitrogen Flow, std ft3/min
Out
let
Pre
ssur
e, p
sig
Out
let
Pre
ssur
e, b
ar
Nitrogen Flow, Nm3/h
0
300
500
600
700
100
200
400
0 1000 30002000 4000 7000 6000 5000
0 1000 30002000 4000 700060005000
0 2000 4000 6000 8000 10 00048
8.0
16
32
40
0
24
40
48
8.0
32
24
0
16
0
400
500
600
700
300
200
100
0 2000 4000 6000 8000 10 000
4.0
4.8
0.8
3.2
2.4
0
1.6
0 2000 4000 6000 8000 10 000
Nitrogen Flow, std ft3/min
Out
let
Pre
ssur
e, p
sig
Out
let
Pre
ssur
e, b
arO
utle
t P
ress
ure,
psi
g
Out
let
Pre
ssur
e, b
arO
utle
t P
ress
ure,
MP
a
Nitrogen Flow, std ft3/min
Nitrogen Flow, Nm3/h
Nitrogen Flow, Nm3/h
Nitrogen Flow, Nm3/h
5800 (400)
2900 (200)
1450 (100)
Pressure Control Range
0 to 580 psig (0 to 40.0 bar)
RSH15 Series
USA
EURO
JPN
Flow Coef�cient: 7.30Maximum Inlet Pressure: RSH15- 5800 psig (400 bar)Outlet Pressure Control Range: 0 to 580 psig (0 to 40.0 bar)
400 (5800)
200 (2900)
100 (1450)
40.020.0
10.0
Inlet Pressure, psig (bar)
Nitrogen Flow, std ft3/min
Out
let
Pre
ssur
e, p
sig
Out
let
Pre
ssur
e, b
ar
Nitrogen Flow, Nm3/h
0
1500
1000
2000
2500
3500
3000
4000
500
0 5000 15 000 20 00010 000 25 000 30 000
0 5000 15 00010 000 20 000 25 000 30 000
0 9000 18 000 27 000 36 000 45 000
150
200
250
100
0
50
250
200
150
0
100
50
0
1500
2000
2500
3000
3500
4000
500
1000
0 9000 18 000 27 000 36 000 45 000
25
20
15
0
10
5.0
0 9000 18 000 27 000 36 000 45 000
Nitrogen Flow, std ft3/min
Out
let
Pre
ssur
e, p
sig
Out
let
Pre
ssur
e, b
arO
utle
t P
ress
ure,
psi
g
Out
let
Pre
ssur
e, b
arO
utle
t P
ress
ure,
MP
a
Nitrogen Flow, std ft3/min
Nitrogen Flow, Nm3/h
Nitrogen Flow, Nm3/h
Nitrogen Flow, Nm3/h
5800 (400)
5800 (400)
2900 (200)
2900 (200)
5800 (400)
200 (2900)
400 (5800)200 (2900)
400 (5800)
400 (5800)
40.020.0
40.0
20.0
40.0
Pressure Control Range
0 to 1450 psig (0 to 100 bar)
0 to 3625 psig (0 to 250 bar)
0 to 2610 psig (0 to 180 bar)
RSH15 Series
USA
EURO
JPN
Flow Coef�cient: 7.30 Maximum Inlet Pressure: RSH15—5800psig (400 bar)Outlet Pressure Control Range: 0 to 3625 psig (0 to 250 bar)
Inlet Pressure, psig (bar)
Pressure Control Range
0 to 3625 psig (0 to 250 bar)
0 to 2610 psig (0 to 180 bar)
0 to 1450 psig (0 to 100 bar)
Flow DataThe graphs illustrate the change or “droop” in outlet pressures as the flow rate increases.
For more flow curve information, contact your authorized Swagelok representative.
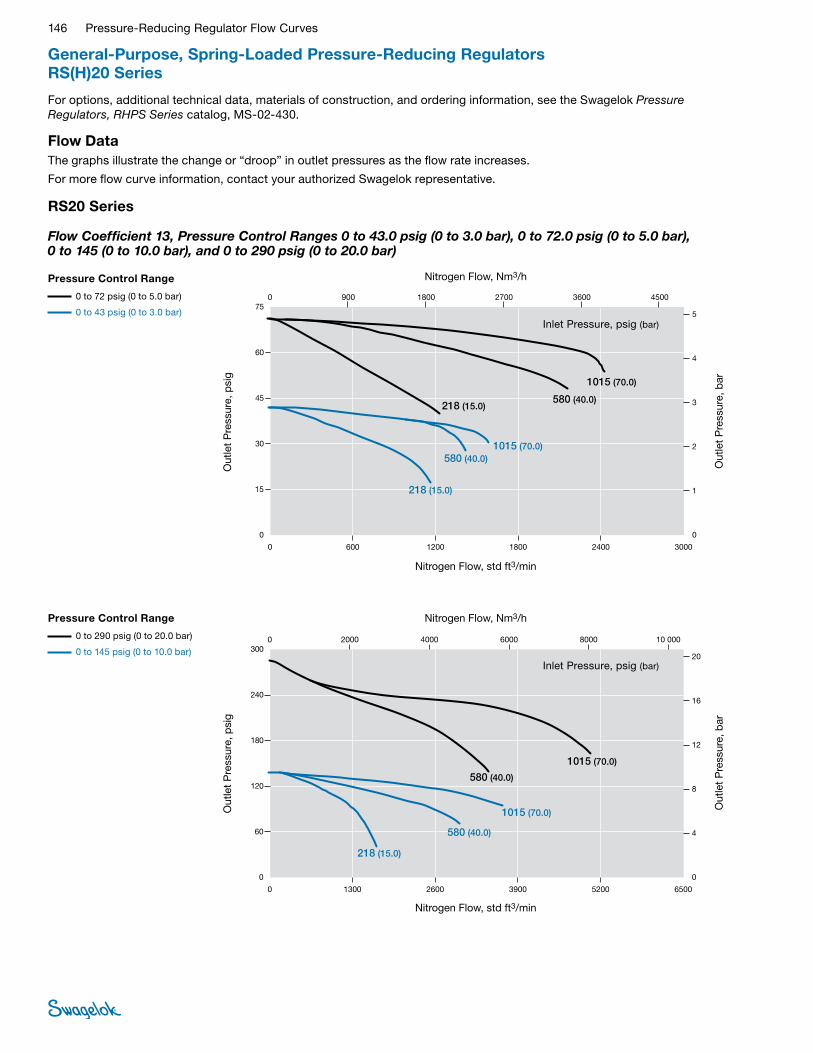
146 Pressure-Reducing Regulator Flow Curves
General-Purpose, Spring-Loaded Pressure-Reducing Regulators RS(H)20 Series
Flow Coefficient 13, Pressure Control Ranges 0 to 43.0 psig (0 to 3.0 bar), 0 to 72.0 psig (0 to 5.0 bar), 0 to 145 (0 to 10.0 bar), and 0 to 290 psig (0 to 20.0 bar)
RS20 Series
For options, additional technical data, materials of construction, and ordering information, see the Swagelok Pressure Regulators, RHPS Series catalog, MS-02-430.
Flow DataThe graphs illustrate the change or “droop” in outlet pressures as the flow rate increases.
For more flow curve information, contact your authorized Swagelok representative.
Nitrogen Flow, std ft3/min
Out
let
Pre
ssur
e, p
sig
Out
let
Pre
ssur
e, b
ar
Nitrogen Flow, Nm3/h
0
120
180
240
300
60
0 1300 39002600 5200 6500
0 1300 39002600 5200 6500
0 2000 4000 6000 8000 10 000
16
20
4
12
0
8
20
16
12
8
0
4
0
120
180
240
300
60
0 2000 4000 6000 8000 10 000
2.0
1.6
1.2
0.8
0
0.4
0 2000 4000 6000 8000 10 000
Nitrogen Flow, std ft3/min
Out
let
Pre
ssur
e, p
sig
Out
let
Pre
ssur
e, b
arO
utle
t P
ress
ure,
psi
g
Out
let
Pre
ssur
e, b
arO
utle
t P
ress
ure,
MP
a
Nitrogen Flow, std ft3/min
Nitrogen Flow, Nm3/h
Nitrogen Flow, Nm3/h
Nitrogen Flow, Nm3/h
218 (15.0)
Pressure Control Range
0 to 145 psig (0 to 10.0 bar)
0 to 290 psig (0 to 20.0 bar)
RS20 Series
USA
EURO
JPN
Flow Coef�cient: 13Maximum Inlet Pressure: RS20—1015 psig (70.0 bar)Outlet Pressure Control Range: 0 to 290 psig (0 to 20.0 bar)
580 (40.0)
580 (40.0)
1015 (70.0)
1015 (70.0)
15.0 (218)
40.0 (580)
70.0 (1015)
40.0 (580)
70.0 (1015)
1.5
4.0
7.0
4.0
7.0
Inlet Pressure, psig (bar)
Pressure Control Range
0 to 290 psig (0 to 20.0 bar)
0 to 145 psig (0 to 10.0 bar)
Nitrogen Flow, std ft3/min
Out
let
Pre
ssur
e, p
sig
Out
let
Pre
ssur
e, b
ar
Nitrogen Flow, Nm3/h
0
30
45
60
75
15
0 600 18001200 2400 3000
0 600 18001200 2400 3000
0 900 1800 2700 3600 4500
4
5
1
3
0
2
5
4
3
2
0
1
0
30
45
60
75
15
0 900 1800 2700 3600 4500
0.5
0.4
0.3
0.2
0
0.1
0 900 1800 2700 3600 4500
Nitrogen Flow, std ft3/min
Out
let
Pre
ssur
e, p
sig
Out
let
Pre
ssur
e, b
arO
utle
t P
ress
ure,
psi
g
Out
let
Pre
ssur
e, b
arO
utle
t P
ress
ure,
MP
a
Nitrogen Flow, std ft3/min
Nitrogen Flow, Nm3/h
Nitrogen Flow, Nm3/h
Nitrogen Flow, Nm3/h
218 (15.0)
Pressure Control Range
0 to 43 psig (0 to 3.0 bar)
0 to 72 psig (0 to 5.0 bar)
RS20 Series
USA
EURO
JPN
Flow Coef�cient: 13Maximum Inlet Pressure: RS20—1015 psig (70.0 bar)Outlet Pressure Control Range: 0 to 72 psig (0 to 5.0 bar)
580 (40.0)
580 (40.0)
1015 (70.0)
1015 (70.0)
218 (15.0)
15.0 (218)
40.0 (580)
70.0 (1015)
15.0 (218)40.0 (580)
70.0 (1015)
1.5
4.07.0
1.54.0
7.0
Inlet Pressure, psig (bar)
Pressure Control Range
0 to 72 psig (0 to 5.0 bar)
0 to 43 psig (0 to 3.0 bar)

Pressure-Reducing Regulator Flow Curves 147
Features■Diaphragm sensing
■Large diaphragm for higher accuracy
■Diaphragm materials: PTFE and 316L SS for most pressure control ranges
■Bottom mounting
High-Sensitivity, Spring-Loaded Pressure-Reducing Regulators— LRS(H)4 Series
Flow DataThe graphs illustrate the change or “droop” in outlet pressures as the flow rate increases.
For more flow curve information, contact your authorized Swagelok representative.
For options, additional technical data, materials of construction, and ordering information, see the Swagelok Pressure Regulators, RHPS Series catalog, MS-02-430.
JPN
EURO
USA
0 50 200150100 250 300
0 50 200150100 250 300
0
50
100
150
200
250
300
5.0
10
15
20
0
0
50
100
150
200
250
300
5,0
10
15
20
0
40002000 6000
0.5
1.0
1.5
2.0
08000
0 75 225150 300 375
0 75 225150 300 375
450
450
507 (35.0)218 (15.0)
507 (35.0)
218 (15.0)362 (25.0)
507 (35.0)
362 (25.0)130 (9.0)
507 (35.0)
362 (25.0)
130 (9.0)507 (35.0)
35,0 (507)15,0 (218)
35,0 (507)
15,0 (218)25,0 (362)
35,0 (507)
25,0 (362)9,0 (130)
35,0 (507)
25,0 (362)
9,0 (130)35,0 (507)
3.51.5
3.51.5
2.5
3.5
2.50.9
3.5
2.5
0.93.5
0
Nitrogen Flow, std ft3/min
Out
let
Pre
ssur
e, p
sig
Out
let
Pre
ssur
e, b
ar
Nitrogen Flow, Nm3/h
Inlet Pressure, psig (bar)
Pressure Control Range
0 to 290 psig (0 to 20.0 bar)
0 to 145 psig (0 to 10.0 bar)
0 to 43 psig (0 to 3.0 bar)
Flow Coefficient 0.73, Pressure Control Ranges 0 to 43 psig (0 to 3.0 bar), 0 to 145 psig (0 to 10.0 bar), and 0 to 290 psig (0 to 20.0 bar)
LRS4 Series
■Low torque minimizes stem wear
■Nonventing
■Cartridge poppet assembly in LRSH4 for ease of service
■Panel mounting—no disassembly required

148 Pressure-Reducing Regulator Flow Curves
High-Sensitivity, Spring-Loaded Pressure-Reducing Regulators— LRS(H)4 Series
For options, additional technical data, materials of construction, and ordering information, see the Swagelok Pressure Regulators, RHPS Series catalog, MS-02-430.
Flow DataThe graphs illustrate the change or “droop” in outlet pressures as the flow rate increases.
For more flow curve information, contact your authorized Swagelok representative.
Flow Coefficient 0.73, Pressure Control Range 0 to 290 psig (0 to 20.0 bar)
LRS4 Series with Optional External Feedback
JPN
EURO
USA
0 15 604530 75 90
0 15 604530 75 90
0
5.0
10
15
20
25
30
0.5
1.0
1.5
2.0
0
0
5,0
10
15
20
25
30
0,5
1,0
1,5
2,0
0
1200400 2000
0.05
0.10
0.15
0.20
02400
0 20 6040 80 100
0 20 6040 80 100
140
140
120
120
800 1600
362 (25.0)
130 (9.0)
43 (3.0)
362 (25.0)130 (9.0)
43 (3.0)
362 (25.0)
130 (9.0)43 (3.0)
362 (25.0)130 (9.0)
43 (3.0)
25,0 (362)
9,0 (130)
3,0 (43)
25,0 (362)9,0 (130)
3,0 (43)
25,0 (362)
9,0 (130)3,0 (43)
25,0 (362)9,0 (130)
3,0 (43)
2.5
0.9
0.3
2.50.9
0.3
2.5
0.90.3
2.50.9
0.3
0
Nitrogen Flow, std ft3/min
Out
let
Pre
ssur
e, p
sig
Out
let
Pre
ssur
e, b
ar
Nitrogen Flow, Nm3/h
Inlet Pressure, psig (bar)
Comparative Flow
Standard
External Feedback
Flow Coefficient 0.73, Pressure Control Range 0 to 290 psig (0 to 20.0 bar)
LRS4 Series with Optional 316L SS Diaphragm
JPN
EURO
USA
0 15 604530 75 90
0 15 604530 75 90
0
5.0
10
15
20
25
30
0.5
1.0
1.5
2.0
0
0
5,0
10
15
20
25
30
0,5
1,0
1,5
2,0
0
1200400 2000
0.05
0.10
0.15
0.20
02400
0 20 6040 80 100
0 20 6040 80 100
140
140
120
120
800 1600
362 (25.0)
362 (25.0)
362 (25.0)362 (25.0)
130 (9.0)130 (9.0)
130 (9.0)130 (9.0)
43 (3.0)43 (3.0)
43 (3.0)
43 (3.0)
9,0 (103)
2.5
2.5
2.52.5
0.90.9
0.90.9
0.30.3
0.3
0.3
25,0 (362)9,0 (130)
3,0 (43) 25,0 (362)
9,0 (130)
3,0 (43)
25,0 (362)9,0 (130)
3,0 (43)25,0 (362)
3,0 (43)
0
Nitrogen Flow, std ft3/min
Out
let
Pre
ssur
e, p
sig
Out
let
Pre
ssur
e, b
ar
Nitrogen Flow, Nm3/h
Inlet Pressure, psig (bar)
Comparative Flow
Standard
316L SS Diaphragm

Pressure-Reducing Regulator Flow Curves 149
High-Sensitivity, Spring-Loaded Pressure-Reducing Regulators— LRS(H)4 Series
For options, additional technical data, materials of construction, and ordering information, see the Swagelok Pressure Regulators, RHPS Series catalog, MS-02-430.
Flow DataThe graphs illustrate the change or “droop” in outlet pressures as the flow rate increases.
For more flow curve information, contact your authorized Swagelok representative.
Flow Coefficient 0.73, Pressure Control Ranges 0 to 130 psig (0 to 9.0 bar) and 0 to 290 psig (0 to 20.0 bar)
LRSH4 Series
Nitrogen Flow, std ft3/min
Out
let
Pre
ssur
e, p
sig
Out
let
Pre
ssur
e, b
ar
Nitrogen Flow, Nm3/h
JPN
EURO
USA
0 5025
0 40
10075 125
25 75 125
150
16012080 200
0 50 100 150
0 1000 30002000 4000
0 40 16012080 200
50
100
150
200
250
4.0
8.0
12
16
00
0
50
100
150
200
250
4,0
8,0
12
16
0
0
0.4
0.8
1.2
1.6
0
2900 (200)1450 (100)
2900 (200)
1450 (100)
2900 (200)1450 (100)
2900 (200)1450 (100)
200 (2900)100 (1450)
200 (2900)
100 (1450)
200 (2900)100 (1450)
200 (2900)100 (1450)
20.010.0
20.0
10.0
20.010.0
20.010.0
Inlet Pressure, psig (bar)
Pressure Control Range
0 to 290 psig (0 to 20.0 bar)
0 to 130 psig (0 to 9.0 bar)
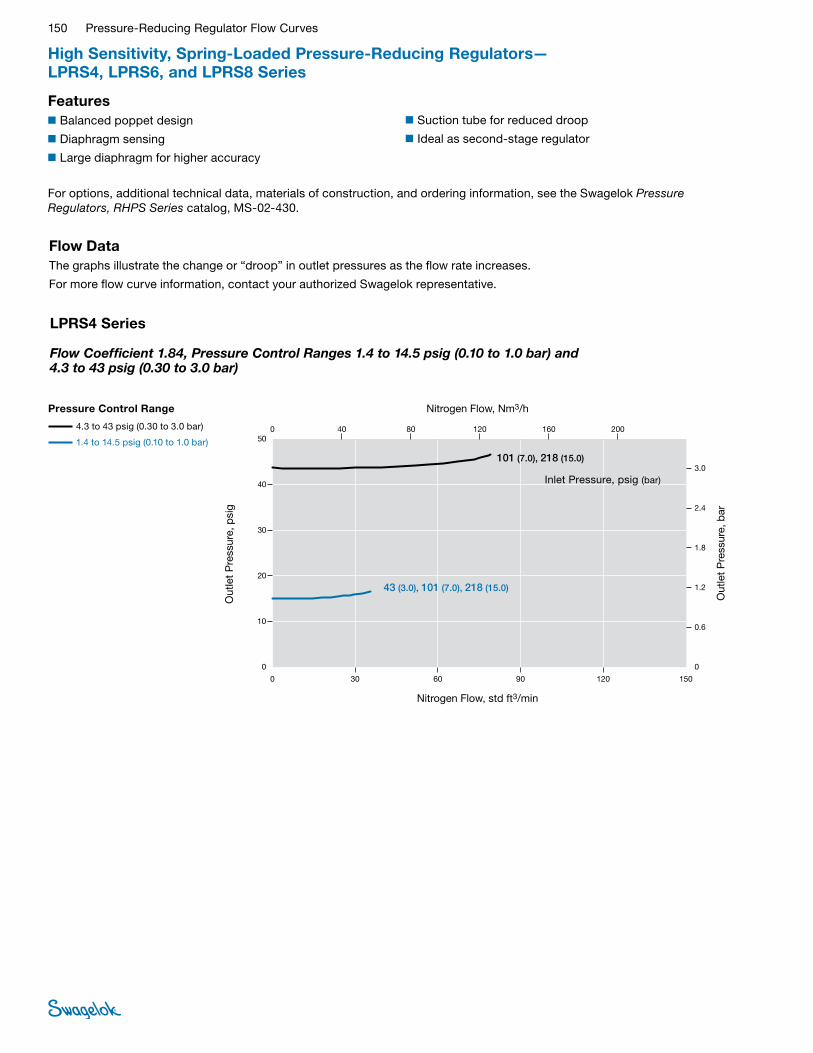
150 Pressure-Reducing Regulator Flow Curves
Features■Balanced poppet design
■Diaphragm sensing
■Large diaphragm for higher accuracy
High Sensitivity, Spring-Loaded Pressure-Reducing Regulators— LPRS4, LPRS6, and LPRS8 Series
For options, additional technical data, materials of construction, and ordering information, see the Swagelok Pressure Regulators, RHPS Series catalog, MS-02-430.
Flow DataThe graphs illustrate the change or “droop” in outlet pressures as the flow rate increases.
For more flow curve information, contact your authorized Swagelok representative.
Flow Coefficient 1.84, Pressure Control Ranges 1.4 to 14.5 psig (0.10 to 1.0 bar) and 4.3 to 43 psig (0.30 to 3.0 bar)
LPRS4 Series
0
20
30
40
50
10
0 30 9060 120 150
0 30 9060 120 150
0 40 80 120 160 200
2.4
3.0
0.6
1.8
0
1.2
3.0
0.6
2.4
1.8
0
1.2
0
20
30
40
50
10
0 40 80 120 160 200
0.30
0.06
0.24
0.18
0
0.12
0 40 80 120 160 200
Nitrogen Flow, std ft3/min
Out
let
Pre
ssur
e, p
sig
Out
let
Pre
ssur
e, b
arO
utle
t P
ress
ure,
psi
g
Out
let
Pre
ssur
e, b
arO
utle
t P
ress
ure,
MP
a
Nitrogen Flow, std ft3/min
Nitrogen Flow, Nm3/h
Nitrogen Flow, Nm3/h
Nitrogen Flow, Nm3/h
101 (7.0), 218 (15.0)
43 (3.0), 101 (7.0), 218 (15.0)
7.0 (101), 15.0 (218)
3.0 (43), 7.0 (101), 15.0 (218)
0.7, 1.5
0.3, 0.7, 1.5
Pressure Control Range
1.4 to 14.5 psig (0.10 to 1.0 bar)
4.3 to 43 psig (0.30 to 3.0 bar)
LPRS4 Series
USA
EURO
JPN
Flow Coef�cient: 1.84Maximum Inlet Pressure: LPRS4—218 psig (15.0 bar)Outlet Pressure Control Range: 1.4 to 43 psig (0.10 to 3.0 bar)
Nitrogen Flow, std ft3/min
Out
let
Pre
ssur
e, p
sig
Out
let
Pre
ssur
e, b
ar
Nitrogen Flow, Nm3/h
Inlet Pressure, psig (bar)
Pressure Control Range
4.3 to 43 psig (0.30 to 3.0 bar)
1.4 to 14.5 psig (0.10 to 1.0 bar)
■Suction tube for reduced droop
■Ideal as second-stage regulator
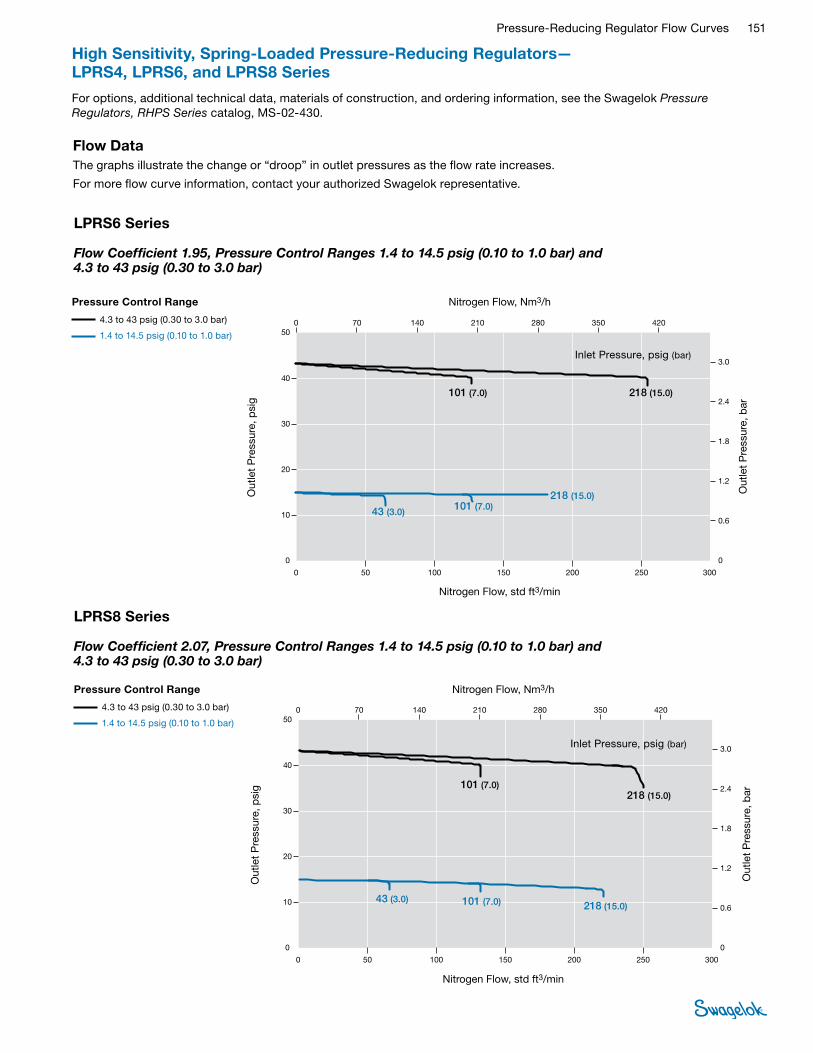
Pressure-Reducing Regulator Flow Curves 151
High Sensitivity, Spring-Loaded Pressure-Reducing Regulators— LPRS4, LPRS6, and LPRS8 Series
For options, additional technical data, materials of construction, and ordering information, see the Swagelok Pressure Regulators, RHPS Series catalog, MS-02-430.
Flow DataThe graphs illustrate the change or “droop” in outlet pressures as the flow rate increases.
For more flow curve information, contact your authorized Swagelok representative.
Flow Coefficient 1.95, Pressure Control Ranges 1.4 to 14.5 psig (0.10 to 1.0 bar) and 4.3 to 43 psig (0.30 to 3.0 bar)
LPRS6 Series
0
10
20
30
40
50
0 50 150100 200 300
0 50 150100 200 300
0 70 140 210 280 350
1.8
2.4
3.0
1.2
0
0.6
3.0
0.6
2.4
1.8
0
1.2
0
20
30
40
50
10
0 70 140 210 280 350
0.30
0.06
0.24
0.18
0
0.12
0
250
420
420
70 140 210 280 350 420
250
Nitrogen Flow, std ft3/min
Out
let
Pre
ssur
e, p
sig
Out
let
Pre
ssur
e, b
arO
utle
t P
ress
ure,
psi
g
Out
let
Pre
ssur
e, b
arO
utle
t P
ress
ure,
MP
a
Nitrogen Flow, std ft3/min
Nitrogen Flow, Nm3/h
Nitrogen Flow, Nm3/h
Nitrogen Flow, Nm3/h
101 (7.0)
7.0 (101)
43 (3.0)101 (7.0)
7.0 (101)15.0 (218)
Pressure Control Range
1.4 to 14.5 psig (0.10 to 1.0 bar)
4.3 to 43 psig (0.3 to 3.0 bar)
LPRS6 Series
USA
EURO
JPN
Flow Coef�cient: 1.95Maximum Inlet Pressure: LPRS6—218 psig (15.0 bar)Outlet Pressure Control Range: 1.4 to 43 psig (0.10 to 3.0 bar)
218 (15.0)
218 (15.0)
3.0 (43)
15.0 (218)
0.3 0.71.5
0.7 1.5
Nitrogen Flow, std ft3/min
Out
let
Pre
ssur
e, p
sig
Out
let
Pre
ssur
e, b
ar
Nitrogen Flow, Nm3/h
Inlet Pressure, psig (bar)
Pressure Control Range
4.3 to 43 psig (0.30 to 3.0 bar)
1.4 to 14.5 psig (0.10 to 1.0 bar)
0
20
30
40
50
10
0 50 150100 200 300
0 50 150100 200 300
0 70 140 280 350 420
2.4
3.0
0.6
1.8
0
1.2
3.0
0.6
2.4
1.8
0
1.2
0
20
30
40
50
10
0 70 140 210 280 350
250
210
420
250
0.30
0.06
0.24
0.18
0
0.12
0 70 140 210 280 350 420
Nitrogen Flow, std ft3/min
Out
let
Pre
ssur
e, p
sig
Out
let
Pre
ssur
e, b
arO
utle
t P
ress
ure,
psi
g
Out
let
Pre
ssur
e, b
arO
utle
t P
ress
ure,
MP
a
Nitrogen Flow, std ft3/min
Nitrogen Flow, Nm3/h
Nitrogen Flow, Nm3/h
Nitrogen Flow, Nm3/h
218 (15.0)43 (3.0) 101 (7.0)
Pressure Control Range
1.4 to 14.5 psig (0.1 to 1.0 bar)
4.3 to 43 psig (0.3 to 3.0 bar)
LPRS8 Series
USA
EURO
JPN
Flow Coef�cient: 2.07Maximum Inlet Pressure: LPRS8—218 psig (15.0 bar)Outlet Pressure Control Range: 1.4 to 43 psig (0.1 to 1.0 bar)
101 (7.0)218 (15.0)
15.0 (218)3.0 (43) 7.0 (101)
7.0 (101)15.0 (218)
1.50.3 0.7
0.71.5
Nitrogen Flow, std ft3/min
Out
let
Pre
ssur
e, p
sig
Out
let
Pre
ssur
e, b
ar
Nitrogen Flow, Nm3/h
Inlet Pressure, psig (bar)
Pressure Control Range
4.3 to 43 psig (0.30 to 3.0 bar)
1.4 to 14.5 psig (0.10 to 1.0 bar)
Flow Coefficient 2.07, Pressure Control Ranges 1.4 to 14.5 psig (0.10 to 1.0 bar) and 4.3 to 43 psig (0.30 to 3.0 bar)
LPRS8 Series
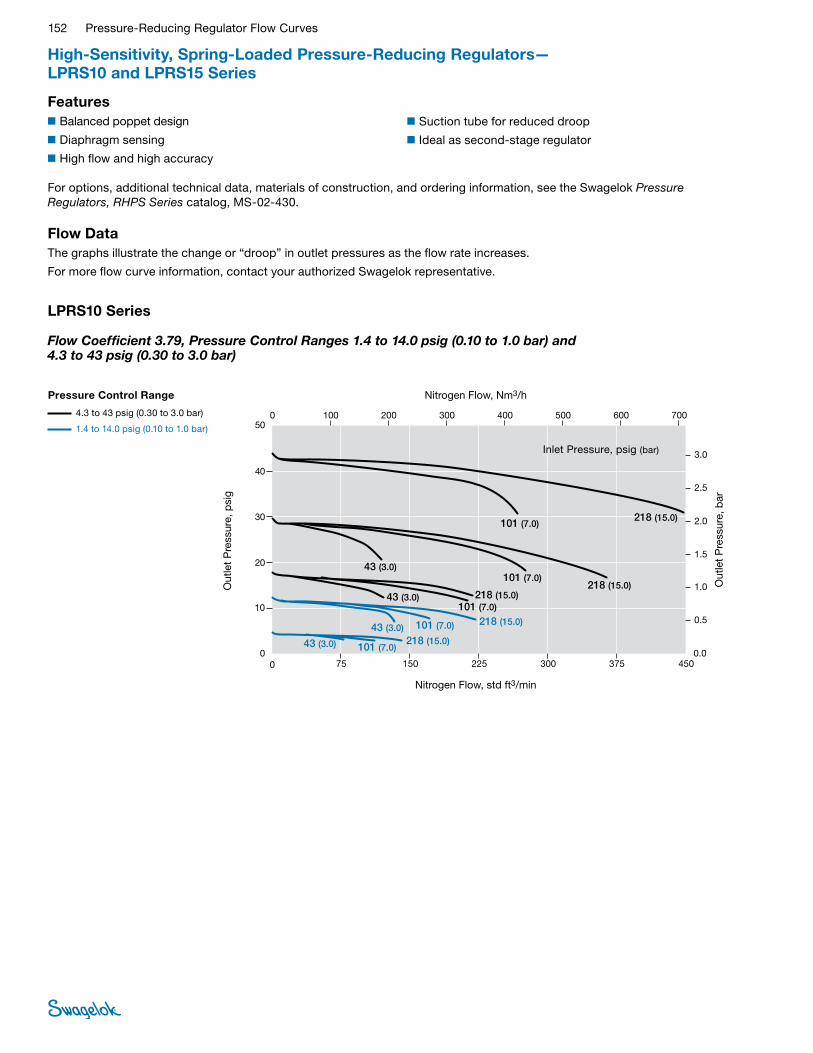
152 Pressure-Reducing Regulator Flow Curves
Features■Balanced poppet design
■Diaphragm sensing
■High flow and high accuracy
High-Sensitivity, Spring-Loaded Pressure-Reducing Regulators— LPRS10 and LPRS15 Series
For options, additional technical data, materials of construction, and ordering information, see the Swagelok Pressure Regulators, RHPS Series catalog, MS-02-430.
Flow DataThe graphs illustrate the change or “droop” in outlet pressures as the flow rate increases.
For more flow curve information, contact your authorized Swagelok representative.
Flow Coefficient 3.79, Pressure Control Ranges 1.4 to 14.0 psig (0.10 to 1.0 bar) and 4.3 to 43 psig (0.30 to 3.0 bar)
LPRS10 Series
JPN
EURO
USA
0 75 300225150 375 450
0 75 300225150 375 450
0
10
20
30
40
50
0.5
1.5
2.5
3.0
0.0
0
10
20
30
40
50
0,5
1,5
2,5
3,0
0
2000 80004000 10 000 12 000
0 100 300200 500 600
0 100 300200 500 600
400 700
1.0
2.0
400 700
1,0
2,0
0.05
0.15
0.25
0.30
0.10
0.20
00 6000
101 (7.0)
101 (7.0)
43 (3.0)
43 (3.0)218 (15.0)
7,0 (101)3,0 (43) 15,0 (218)
7.0 3.0 15.0
7.0 3.0 15.0
7.0 3.0 15.0
7.0 3.0
15.0
7.0 15.0
7,0 (101)3,0 (43) 15,0 (218)
7,0 (101)3,0 (43) 15,0 (218)
7,0 (101)3,0 (43)
15,0 (218)
7,0 (101) 15,0 (218)
218 (15.0)
101 (7.0)43 (3.0) 218 (15.0)
101 (7.0)43 (3.0)
218 (15.0)
101 (7.0)218 (15.0)
Nitrogen Flow, std ft3/min
Out
let
Pre
ssur
e, p
sig
Out
let
Pre
ssur
e, b
ar
Nitrogen Flow, Nm3/h
Inlet Pressure, psig (bar)
Pressure Control Range
4.3 to 43 psig (0.30 to 3.0 bar)
1.4 to 14.0 psig (0.10 to 1.0 bar)
■Suction tube for reduced droop
■Ideal as second-stage regulator

Pressure-Reducing Regulator Flow Curves 153
JPN
EURO
USA
0 200 600400 800
0 1000
0.5
0
50
1,5
0
1000
3000 12 0006000 15 0000
18 000
200 300 400 500 600 700
0 100 200 300 400 500 600 700
0 200 600400 800 1000
10
20
30
40
50
1.0
2.0
2.5
0.0
10
20
30
40
2,0
2,5
3,0
3.0
1,0
9000
1.5
0,5
0.15
0.20
0.25
0.30
0.10
0.05
0
101 (7.0)43 (3.0)218 (15.0)
101 (7.0)43 (3.0)
218 (15.0)101 (7.0)43 (3.0)
218 (15.0)
101 (7.0)43 (3.0)
218 (15.0)
101 (7.0)
218 (15.0)
7,0 (101)3,0 (43)15,0 (218)
7,0 (101)3,0 (43)
15,0 (218)7,0 (101)3,0 (43)
15,0 (218)
7,0 (101)3,0 (43)
15,0 (218)
7,0 (101)
15,0 (218)
7.0 3.015.0
7.0 3.0
15.07.0 3.0
15.0
7.0
3.0
15.07.0
15.0
Nitrogen Flow, std ft3/min
Out
let
Pre
ssur
e, p
sig
Out
let
Pre
ssur
e, b
ar
Nitrogen Flow, Nm3/h
Inlet Pressure, psig (bar)
Pressure Control Range
4.3 to 43 psig (0.30 to 3.0 bar)
1.4 to 14.0 psig (0.10 to 1.0 bar)
High-Sensitivity, Spring-Loaded Pressure-Reducing Regulators— LPRS10 and LPRS15 Series
For options, additional technical data, materials of construction, and ordering information, see the Swagelok Pressure Regulators, RHPS Series catalog, MS-02-430.
Flow DataThe graphs illustrate the change or “droop” in outlet pressures as the flow rate increases.
For more flow curve information, contact your authorized Swagelok representative.
Flow Coefficient 7.3, Pressure Control Ranges 1.4 to 14.0 psig (0.10 to 1.0 bar) and 4.3 to 43 psig (0.30 to 3.0 bar)
LPRS15 Series
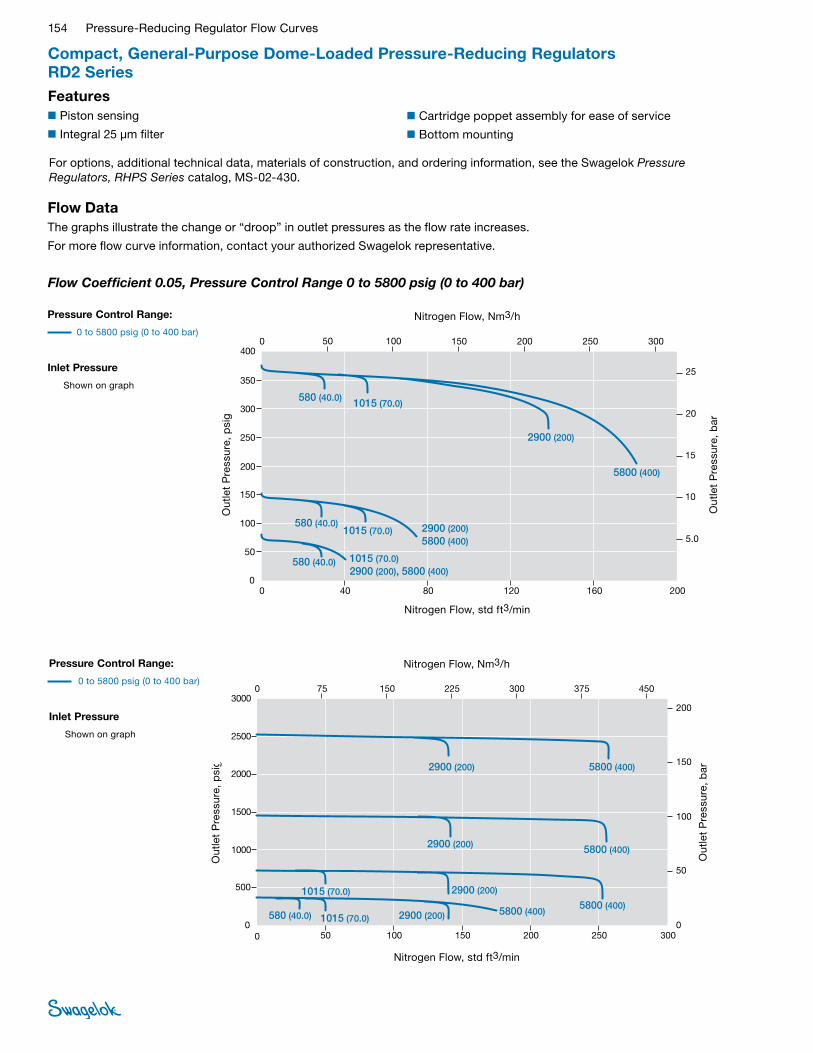
154 Pressure-Reducing Regulator Flow Curves
Compact, General-Purpose Dome-Loaded Pressure-Reducing Regulators RD2 SeriesFeatures■Piston sensing
■Integral 25 μm filter
For options, additional technical data, materials of construction, and ordering information, see the Swagelok Pressure Regulators, RHPS Series catalog, MS-02-430.
■Cartridge poppet assembly for ease of service
■Bottom mounting
0
150
200
250
300
350
400
25
JPN
EURO
USA
100
50
20
5.0
10
15
0
150
200
250
300
350
400
25
100
50
20
5,0
10
15
0
0 40
0 50
16012080 200
200150100 250
0 40 16012080 200
0
2.5
2.0
0.5
1.0
1.5
0 1000 400030002000 5000
0
300
50 200150100 250 300
580 (40.0) 1015 (70.0)
2900 (200)
5800 (400)
580 (40.0)1015 (70.0) 2900 (200)
5800 (400)
580 (40.0) 1015 (70.0)2900 (200), 5800 (400)
40,0 (580) 70,0 (1015)
200 (2900)
400 (5800)
200 (2900)400 (5800)
70,0 (1015)200 (2900), 400 (5800)
40,0 (580)
40,0 (580) 70,0 (1015)
4.0 7.0
20.0
40.0
20.0, 40.07.04.0
4.0 7.0, 20.0, 40.0
Nitrogen Flow, std ft3/min
Out
let
Pre
ssur
e, p
sig
Out
let
Pre
ssur
e, b
ar
Nitrogen Flow, Nm3/hPressure Control Range:
0 to 5800 psig (0 to 400 bar)
Inlet Pressure
Shown on graph
JPN
EURO
USA
0 50 200150100 250 300
0 50 200150100 250 300
0
500
1000
1500
2000
2500
3000
50
100
150
200
0
0
500
1000
1500
2000
2500
3000
50
100
150
200
0
1500 45003000 6000
5.0
10
15
20
07500
0 75 225150 300 375
0 75 225150 300 375
450
450
5800 (400)
5800 (400)
5800 (400)2900 (200)
2900 (200)
2900 (200)
2900 (200) 5800 (400)580 (40.0)
1015 (70.0)
1015 (70.0)
40,0 (580) 70,0 (1015)
70,0 (1015) 200 (2900)
200 (2900)
200 (2900)
200 (2900)
400 (5800) 400 (5800)
400 (5800)
400 (5800)
20.0
20.0
20.0
20.0
4.040.0
40.0
40.0
40.0
7.0
7.0
Nitrogen Flow, std ft3/min
Out
let
Pre
ssur
e, p
sig
Out
let
Pre
ssur
e, b
ar
Nitrogen Flow, Nm3/hPressure Control Range:
0 to 5800 psig (0 to 400 bar)
Inlet Pressure
Shown on graph
Flow DataThe graphs illustrate the change or “droop” in outlet pressures as the flow rate increases.
For more flow curve information, contact your authorized Swagelok representative.
Flow Coefficient 0.05, Pressure Control Range 0 to 5800 psig (0 to 400 bar)
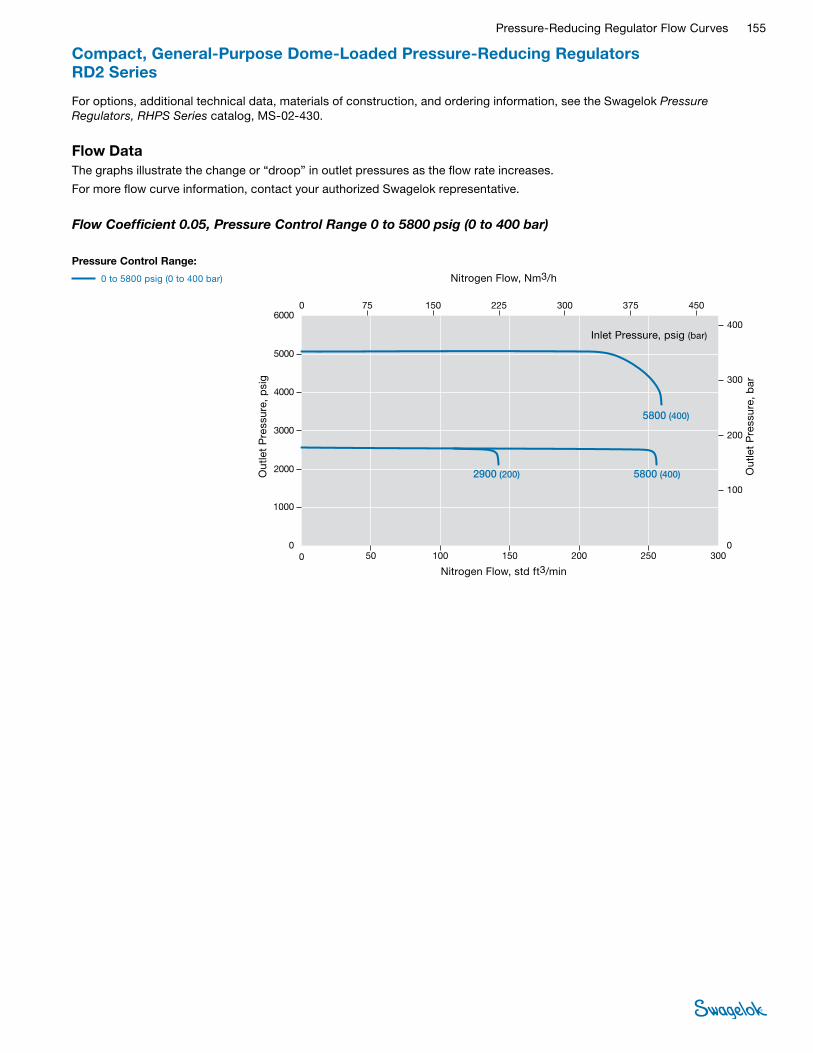
Pressure-Reducing Regulator Flow Curves 155
Compact, General-Purpose Dome-Loaded Pressure-Reducing Regulators RD2 Series
For options, additional technical data, materials of construction, and ordering information, see the Swagelok Pressure Regulators, RHPS Series catalog, MS-02-430.
Flow DataThe graphs illustrate the change or “droop” in outlet pressures as the flow rate increases.
For more flow curve information, contact your authorized Swagelok representative.
Flow Coefficient 0.05, Pressure Control Range 0 to 5800 psig (0 to 400 bar)
Pressure Control Range:
0 to 5800 psig (0 to 400 bar)
JPN
EURO
USA
0 50 200150100 250 300
0 50 200150100 250 300
0
1000
2000
3000
4000
5000
6000
100
200
300
400
0
0
1000
2000
3000
4000
5000
6000
100
200
300
400
0
1500 45003000 6000
10
20
30
40
07500
0 75 225150 300 375
0 75 225150 300 375
450
450
5800 (400)
5800 (400)2900 (200)
400 (5800)
400 (5800)200 (2900)
40.0
40.020.0
Nitrogen Flow, std ft3/min
Out
let
Pre
ssur
e, p
sig
Out
let
Pre
ssur
e, b
ar
Nitrogen Flow, Nm3/h
Inlet Pressure, psig (bar)
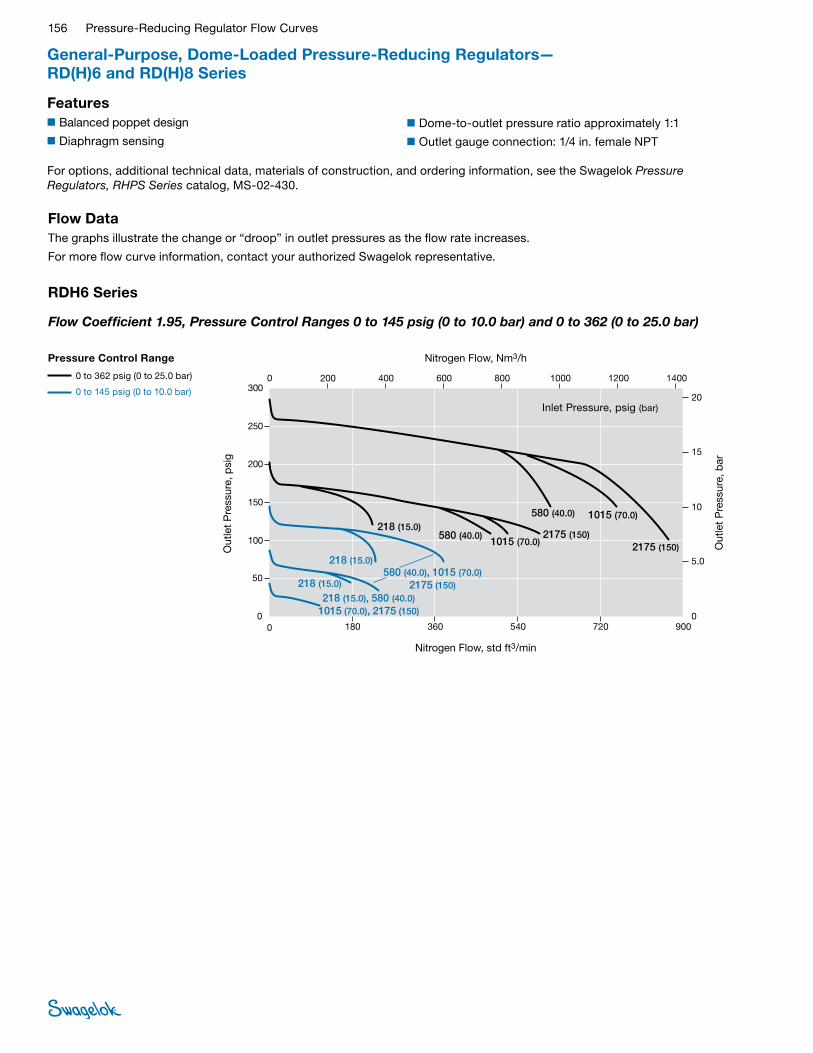
156 Pressure-Reducing Regulator Flow Curves
Features■Balanced poppet design
■Diaphragm sensing
General-Purpose, Dome-Loaded Pressure-Reducing Regulators— RD(H)6 and RD(H)8 Series
For options, additional technical data, materials of construction, and ordering information, see the Swagelok Pressure Regulators, RHPS Series catalog, MS-02-430.
Flow DataThe graphs illustrate the change or “droop” in outlet pressures as the flow rate increases.
For more flow curve information, contact your authorized Swagelok representative.
■Dome-to-outlet pressure ratio approximately 1:1
■Outlet gauge connection: 1/4 in. female NPT
JPN
EURO
USA
0 180 540360 720 900
0 180 540360 720 900
0
50
100
150
200
250
300
5.0
10
15
20
0
0
50
100
150
200
250
300
5,0
10
15
20
0
80004000 12 000
0.5
1.0
1.5
2.0
020 000
0 200 600400 1000800 1200
0 200 600400 800 1000
16 000
1400
1200 1400
24 000
218 (15.0), 580 (40.0)1015 (70.0), 2175 (150)
218 (15.0)580 (40.0), 1015 (70.0)
2175 (150)
218 (15.0)580 (40.0)
1015 (70.0)2175 (150)
580 (40.0) 1015 (70.0)
2175 (150)218 (15.0)
15,0 (218), 40,0 (580)70,0 (1015), 150 (2175)
15,0 (218)40,0 (580), 70,0 (1015)
150 (2175)
40,0 (580) 70,0 (1015)150 (2175)
40,0 (580) 70,0 (1015)
150 (2175)15,0 (218)
15,0 (218)
1.5, 4.0 7.0 , 15.0
1.5 4.0, 7.015.0
4.0 7.0 15.0
4.0 7.0
15.0
1.5
1.5
4.0, 7.015.0
Nitrogen Flow, std ft3/min
Out
let
Pre
ssur
e, p
sig
Out
let
Pre
ssur
e, b
ar
Nitrogen Flow, Nm3/h
Inlet Pressure, psig (bar)
Pressure Control Range
0 to 362 psig (0 to 25.0 bar)
0 to 145 psig (0 to 10.0 bar)
RDH6 Series
Flow Coefficient 1.95, Pressure Control Ranges 0 to 145 psig (0 to 10.0 bar) and 0 to 362 (0 to 25.0 bar)

Pressure-Reducing Regulator Flow Curves 157
General-Purpose, Dome-Loaded Pressure-Reducing Regulators— RD(H)6 and RD(H)8 SeriesFor options, additional technical data, materials of construction, and ordering information, see the Swagelok Pressure Regulators, RHPS Series catalog, MS-02-430.
Flow DataThe graphs illustrate the change or “droop” in outlet pressures as the flow rate increases.
For more flow curve information, contact your authorized Swagelok representative.
RDH6 Series
Flow Coefficient 1.95, Pressure Control Ranges 0 to 362 psig (0 to 25.0 bar), 0 to 1450 (0 to 100 bar), and 0 to 2539 psig (0 to 175 bar)
Nitrogen Flow, std ft3/min
Out
let
Pre
ssur
e, p
sig
Out
let
Pre
ssur
e, b
ar
Nitrogen Flow, Nm3/h
JPN
EURO
USA
0 500 15001000 2000
0 400 1200800 1600 2000
0 400 1200800 1600 2000
2500
10 000 40 000
0
0
500 15001000 2000 3000
0
480
720
960
120080
240
60
40
0
0
480
720
960
120080
240
40
60
0
0
3000
2500
20
20
8.0
6.0
2.0
4.0
50 00030 00020 0000
580 (40.0) 1015 (70.0) 2175 (150)
580 (40.0)
1015 (70.0)
2175 (150)
1015 (70.0) 2175 (150)
2175 (150)
40,0 (580) 70,0 (1015) 150 (2175)
40,0 (580)
70,0 (1015)150 (2175)
70,0 (1015) 150 (2175)
150 (2175)
4.0 7.0 15.0
4.0 7.0
15.0
7.0 15.0
15.0
Inlet Pressure, psig (bar)
Pressure Control Range
0 to 1450 psig (0 to 100 bar)
0 to 362 psig (0 to 25.0 bar)
Nitrogen Flow, std ft3/min
Out
let
Pre
ssur
e, p
sig
Out
let
Pre
ssur
e, b
ar
Nitrogen Flow, Nm3/h
0
1000
1500
2000
2500
3000
500
0 1000 30002000 4000 5000
0 1000 30002000 4000 5000
0 1500 3000 4500 6000 7500
120
150
180
30
90
0
60
180
150
30
120
90
0
60
0
1000
1500
2000
2500
3000
500
0 1500 3000 4500 6000 7500
18.0
15.0
3.0
12.0
9.0
0
6.0
0 1500 3000 4500 6000 7500
Nitrogen Flow, std ft3/min
Out
let
Pre
ssur
e, p
sig
Out
let
Pre
ssur
e, b
arO
utle
t P
ress
ure,
psi
g
Out
let
Pre
ssur
e, b
arO
utle
t P
ress
ure,
MP
a
Nitrogen Flow, std ft3/min
Nitrogen Flow, Nm3/h
Nitrogen Flow, Nm3/h
Nitrogen Flow, Nm3/h
2900 (200)
3990 (275)
200 (2900)
275 (3990)
20.0
27.5
Pressure Control Range
0 to 2539 psig (0 to 175 bar)
RDH6 Series
USA
EURO
JPN
Flow Coef�cient: 1.95Maximum Inlet Pressure: RDH6—3990 psig (275 bar)Outlet Pressure Control Range: 0 to 2539 psig (0 to 175 bar)
Inlet Pressure, psig (bar)
Pressure Control Range
0 to 2539 psig (0 to 175 bar)
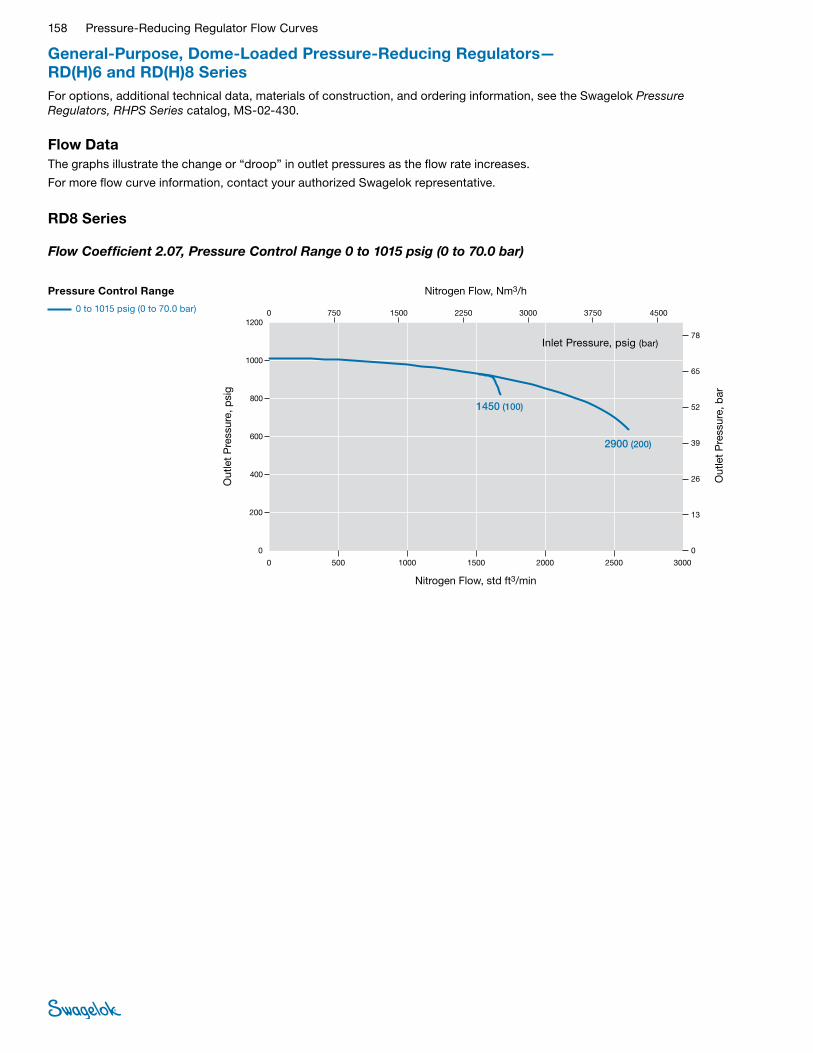
158 Pressure-Reducing Regulator Flow Curves
Nitrogen Flow, std ft3/min
Out
let
Pre
ssur
e, p
sig
Out
let
Pre
ssur
e, b
ar
Nitrogen Flow, Nm3/h
0
400
600
800
1000
1200
200
0 500 15001000 2000 3000
0 500 15001000 2000 3000
0 750 1500 2250 3000 4500
52
65
78
13
39
0
26
78
65
13
52
39
0
26
0
400
600
800
1000
1200
200
0 750 1500 2250 3000 4500
2500
3750
3750
2500
7.8
6.5
1.3
5.2
3.9
0
2.6
0 750 1500 2250 3000 45003750
Nitrogen Flow, std ft3/min
Out
let
Pre
ssur
e, p
sig
Out
let
Pre
ssur
e, b
arO
utle
t P
ress
ure,
psi
g
Out
let
Pre
ssur
e, b
arO
utle
t P
ress
ure,
MP
a
Nitrogen Flow, std ft3/min
Nitrogen Flow, Nm3/h
Nitrogen Flow, Nm3/h
Nitrogen Flow, Nm3/h
1450 (100)
2900 (200)
100 (1450)
200 (2900)
10.0
20.0
Pressure Control Range
0 to 1015 psig (0 to 70.0 bar)
RD8 Series
USA
EURO
JPN
Flow Coef�cient: 2.07Maximum Inlet Pressure: RD8—2900 psig (200 bar)Outlet Pressure Control Range: 0 to 1015 psig (0 to 70.0 bar)
Inlet Pressure, psig (bar)
Pressure Control Range
0 to 1015 psig (0 to 70.0 bar)
General-Purpose, Dome-Loaded Pressure-Reducing Regulators— RD(H)6 and RD(H)8 SeriesFor options, additional technical data, materials of construction, and ordering information, see the Swagelok Pressure Regulators, RHPS Series catalog, MS-02-430.
Flow DataThe graphs illustrate the change or “droop” in outlet pressures as the flow rate increases.
For more flow curve information, contact your authorized Swagelok representative.
RD8 Series
Flow Coefficient 2.07, Pressure Control Range 0 to 1015 psig (0 to 70.0 bar)
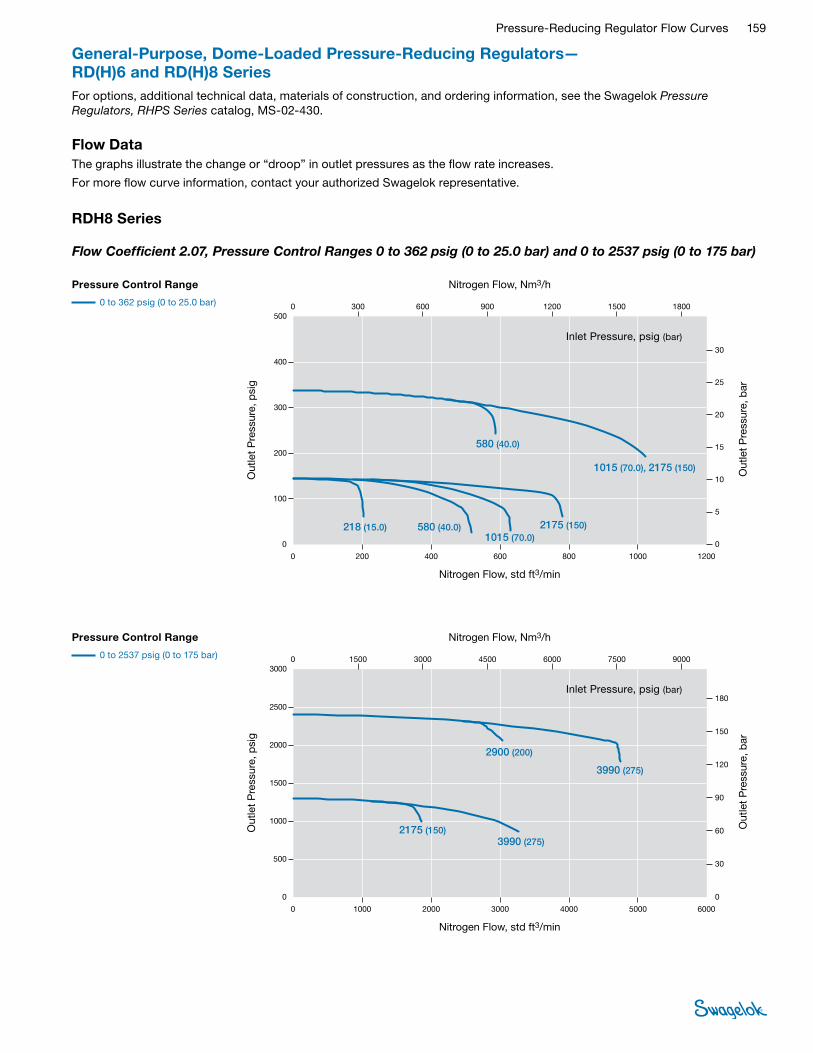
Pressure-Reducing Regulator Flow Curves 159
General-Purpose, Dome-Loaded Pressure-Reducing Regulators— RD(H)6 and RD(H)8 SeriesFor options, additional technical data, materials of construction, and ordering information, see the Swagelok Pressure Regulators, RHPS Series catalog, MS-02-430.
Flow DataThe graphs illustrate the change or “droop” in outlet pressures as the flow rate increases.
For more flow curve information, contact your authorized Swagelok representative.
RDH8 Series
Flow Coefficient 2.07, Pressure Control Ranges 0 to 362 psig (0 to 25.0 bar) and 0 to 2537 psig (0 to 175 bar)
Nitrogen Flow, std ft3/min
Out
let
Pre
ssur
e, p
sig
Out
let
Pre
ssur
e, b
ar
Nitrogen Flow, Nm3/h
0
1000
1500
2000
3000
500
0 1000 30002000 4000 6000
0 1000 30002000 5000 6000
0 1500 3000 4500 6000 9000
150
180
30
120
0
90
180
30
120
90
0
60
0
1000
1500
2000
2500
3000
500
0 1500 3000 4500 6000 7500
5000
7500
2500
9000
4000
60
150
18.0
3.0
12.0
9.0
0
6.0
0 1500 3000 4500 6000 7500 9000
15.0
Nitrogen Flow, std ft3/min
Out
let
Pre
ssur
e, p
sig
Out
let
Pre
ssur
e, b
arO
utle
t P
ress
ure,
psi
g
Out
let
Pre
ssur
e, b
arO
utle
t P
ress
ure,
MP
a
Nitrogen Flow, std ft3/min
Nitrogen Flow, Nm3/h
Nitrogen Flow, Nm3/h
Nitrogen Flow, Nm3/h
2175 (150)
2900 (200)
Pressure Control Range
0 to 2537 psig (0 to 175 bar)
RDH8 Series
USA
EURO
JPN
Flow Coef�cient: 2.07Maximum Inlet Pressure: RDH8—3990 psig (275 bar)Outlet Pressure Control Range: 0 to 2537 psig (0 to 175 bar)
3990 (275)
3990 (275)
150 (2175)
200 (2900)
275 (3990)
275 (3990)
15.0
20.0
27.5
27.5
Inlet Pressure, psig (bar)
Pressure Control Range
0 to 2537 psig (0 to 175 bar)
Nitrogen Flow, std ft3/min
Out
let
Pre
ssur
e, p
sig
Out
let
Pre
ssur
e, b
ar
Nitrogen Flow, Nm3/h
0
200
300
400
500
100
0 200 600400 800 1200
0 200 600400 800 1200
0 300 600 900 1200 1800
25
20
30
5
15
0
10
30
20
25
15
10
0
5
0
100
200
300
400
500
0 300 600 900 1200 1500
1000
1500
1800
1000
3.0
2.5
1.5
2.0
1.0
0
0.5
0 300 600 900 1200 1500 1800
Nitrogen Flow, std ft3/min
Out
let
Pre
ssur
e, p
sig
Out
let
Pre
ssur
e, b
arO
utle
t P
ress
ure,
psi
g
Out
let
Pre
ssur
e, b
arO
utle
t P
ress
ure,
MP
a
Nitrogen Flow, std ft3/min
Nitrogen Flow, Nm3/h
Nitrogen Flow, Nm3/h
Nitrogen Flow, Nm3/h
218 (15.0)
580 (40.0)
Pressure Control Range
0 to 362 psig (0 to 25.0 bar)
RDH8 Series
USA
EURO
JPN
Flow Coef�cient: 2.07Maximum Inlet Pressure: RDH8—2175 psig (150 bar)Outlet Pressure Control Range: 0 to 362 psig (0 to 25.0 bar)
2175 (150)
1015 (70.0), 2175 (150)
580 (40.0)1015 (70.0)
15.0 (218)
40.0 (580)
150 (2175)
70.0 (1015), 150 (2175)
40.0 (580)70.0 (1015)
1.5
4.0
15.0
7.0, 15.0
4.07.0
Inlet Pressure, psig (bar)
Pressure Control Range
0 to 362 psig (0 to 25.0 bar)

160 Pressure-Reducing Regulator Flow Curves
Features■Balanced poppet design
■Diaphragm sensing
Differential Pressure, Dome-Loaded Pressure Reducing Regulators— RD(H)6DP Series
For options, additional technical data, materials of construction, and ordering information, see the Swagelok Pressure Regulators, RHPS Series catalog, MS-02-430.
Flow DataThe graphs illustrate the change or “droop” in outlet pressures as the flow rate increases.
For more flow curve information, contact your authorized Swagelok representative.
RD6DP Series
Flow Coefficient 1.95, Pressure Control Range 0 to 1015 psig (0 to 70.0 bar)
Nitrogen Flow, std ft3/min
Out
let
Pre
ssur
e, p
sig
Out
let
Pre
ssur
e, b
ar
Nitrogen Flow, Nm3/h
0
300
450
600
750
150
0 300 900600 1200 1500
0 300 900600 1200 1500
0 450 900 1350 1800 2250
30
40
50
10
20
0
50
40
30
20
0
10
0
150
300
450
600
750
0 450 900 1350 1800 2250
5.0
4.0
3.0
2.0
0
1.0
0 450 900 1350 1800 2250
Nitrogen Flow, std ft3/min
Out
let
Pre
ssur
e, p
sig
Out
let
Pre
ssur
e, b
arO
utle
t P
ress
ure,
psi
g
Out
let
Pre
ssur
e, b
arO
utle
t P
ress
ure,
MP
a
Nitrogen Flow, std ft3/min
Nitrogen Flow, Nm3/h
Nitrogen Flow, Nm3/h
Nitrogen Flow, Nm3/h
580 (40.0)
580 (40.0), 1015 (70.0)
Pressure Control Range
0 to 1015 psig (0 to 70.0 bar)All Curves 29 psig (2 bar) Bias
RDN6 Series
USA
EURO
JPN
Flow Coef�cient: 1.95Maximum Inlet Pressure: RDN6—1015 psig (70.0 bar)Outlet Pressure Control Range: 0 to 1015 psig (0 to 70.0 bar)All Curves 29 psig (2 bar) Bias
1015 (70.0)
1015 (70.0)
40.0 (580)
40.0 (580), 70.0 (1015)
70.0 (1015)
70.0 (1015)
4.0
4.0, 7.07.0
7.0
Inlet Pressure, psig (bar)
Pressure Control Range
0 to 1015 psig (0 to 70.0 bar) All curves 29 psig (2.0 bar) bias
Nitrogen Flow, std ft3/min
Out
let
Pre
ssur
e, p
sig
Out
let
Pre
ssur
e, b
ar
Nitrogen Flow, Nm3/h
0
160
240
320
400
80
0 200 600400 800 1200
0 200 600400 800 1200
0 300 600 900 1200 1800
20
25
5
15
0
10
25
20
15
10
0
5
0
160
240
320
400
80
0 300 600 900 1200 1500
1000
1500
1800
1000
2.5
2.0
1.5
1.0
0
0.5
0 300 600 900 1200 1500 1800
Nitrogen Flow, std ft3/min
Out
let
Pre
ssur
e, p
sig
Out
let
Pre
ssur
e, b
arO
utle
t P
ress
ure,
psi
g
Out
let
Pre
ssur
e, b
arO
utle
t P
ress
ure,
MP
a
Nitrogen Flow, std ft3/min
Nitrogen Flow, Nm3/h
Nitrogen Flow, Nm3/h
Nitrogen Flow, Nm3/h
Pressure Control Range
RDN6 Series
0 to 1015 psig (0 to 70.0 bar)All Curves 116 psig (8 bar) Bias
USA
EURO
JPN
Flow Coef�cient: 1.95Maximum Inlet Pressure: RDN6—1015 psig (70.0 bar)Outlet Pressure Control Range: 0 to 1015 psig (0 to 70.0 bar)All Curves 116 psig (8 bar) Bias
580 (40.0)
1015 (70.0)
40.0 (580)
70.0 (1015)
4.0
7.0
Inlet Pressure, psig (bar)
Pressure Control Range
0 to 1015 psig (0 to 70.0 bar) All curves 116 psig (8.0 bar) bias
■Adjustable bias
■Dome-to-outlet pressure ratio approximately 1:1
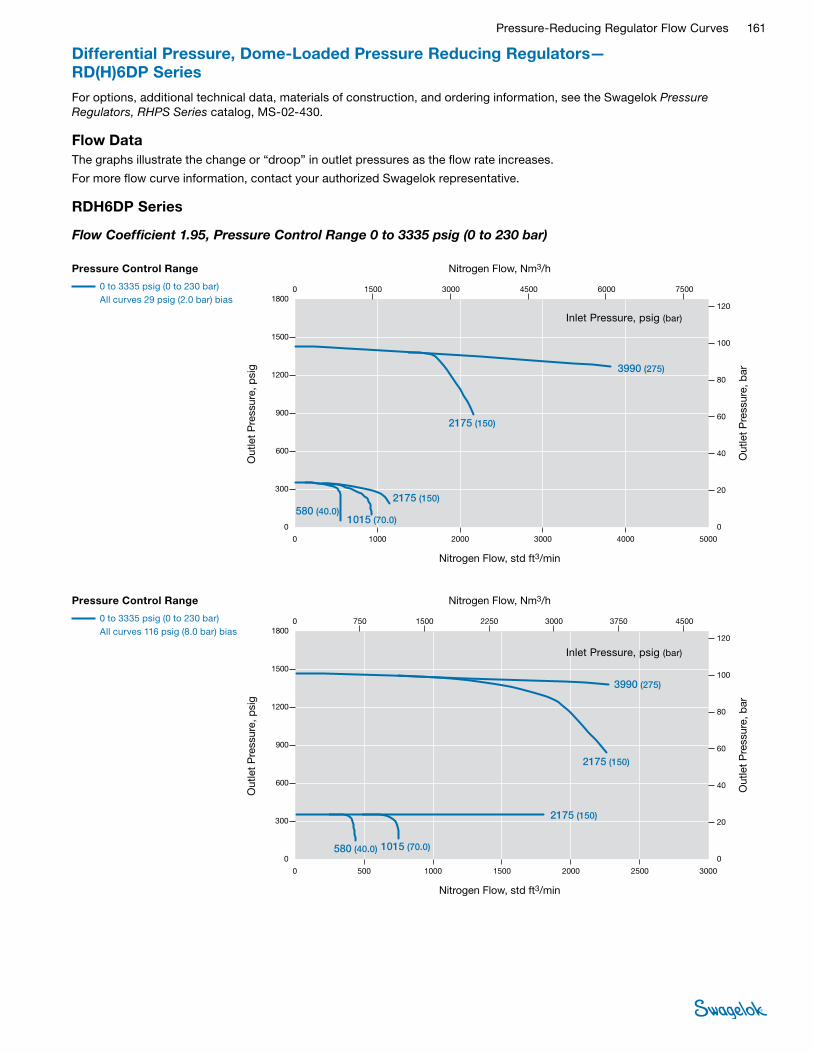
Pressure-Reducing Regulator Flow Curves 161
Differential Pressure, Dome-Loaded Pressure Reducing Regulators— RD(H)6DP Series
For options, additional technical data, materials of construction, and ordering information, see the Swagelok Pressure Regulators, RHPS Series catalog, MS-02-430.
Flow DataThe graphs illustrate the change or “droop” in outlet pressures as the flow rate increases.
For more flow curve information, contact your authorized Swagelok representative.
RDH6DP Series
Flow Coefficient 1.95, Pressure Control Range 0 to 3335 psig (0 to 230 bar)
Nitrogen Flow, std ft3/min
Out
let
Pre
ssur
e, p
sig
Out
let
Pre
ssur
e, b
ar
Nitrogen Flow, Nm3/h
0
600
900
1200
1500
1800
300
0 1000 30002000 4000 5000
0 1000 30002000 4000 5000
0 1500 3000 4500 6000 7500
80
100
120
20
60
0
40
120
100
20
80
60
0
40
0
600
900
1200
1500
1800
300
0 1500 3000 4500 6000 7500
12.0
10.0
2.0
8.0
6.0
0
4.0
0 3000 6000 9000 12 000 15 000
Nitrogen Flow, std ft3/min
Out
let
Pre
ssur
e, p
sig
Out
let
Pre
ssur
e, b
arO
utle
t P
ress
ure,
psi
g
Out
let
Pre
ssur
e, b
arO
utle
t P
ress
ure,
MP
a
Nitrogen Flow, std ft3/min
Nitrogen Flow, Nm3/h
Nitrogen Flow, Nm3/h
Nitrogen Flow, Nm3/h
580 (40.0)1015 (70.0)
Pressure Control Range
RDHN6 Series
0 to 3335 psig (0 to 230 bar)All Curves 29 psig (2 bar) Bias
USA
EURO
JPN
Flow Coef�cient: 1.95Maximum Inlet Pressure: RDHN6—3990 psig (275 bar)Outlet Pressure Control Range: 0 to 3335 psig (0 to 230 bar)All Curves 29 psig (2 bar) Bias
2175 (150)
2175 (150)
3990 (275)
40.0 (580)70.0 (1015)
150 (2175)
275 (3990)
150 (2175)
4.07.0
15.0
27.5
15.0
Inlet Pressure, psig (bar)
Pressure Control Range
0 to 3335 psig (0 to 230 bar) All curves 29 psig (2.0 bar) bias
Nitrogen Flow, std ft3/min
Out
let
Pre
ssur
e, p
sig
Out
let
Pre
ssur
e, b
ar
Nitrogen Flow, Nm3/h
0
600
900
1200
1500
1800
300
0 500 15001000 2000 3000
0 500 15001000 2000 3000
0 750 1500 2250 3000 4500
80
100
120
20
60
0
40
120
100
20
80
60
0
40
0
600
900
1200
1500
1800
300
0 750 1500 2250 3000 4500
2500
3750
2500
3750
120
100
20
80
60
0
40
0 750 1500 2250 3000 45003750
Nitrogen Flow, std ft3/min
Out
let
Pre
ssur
e, p
sig
Out
let
Pre
ssur
e, b
arO
utle
t P
ress
ure,
psi
g
Out
let
Pre
ssur
e, b
arO
utle
t P
ress
ure,
MP
a
Nitrogen Flow, std ft3/min
Nitrogen Flow, Nm3/h
Nitrogen Flow, Nm3/h
Nitrogen Flow, Nm3/h
580 (40.0) 1015 (70.0)
Pressure Control Range
RDHN6 Series
0 to 3335 psig (0 to 230 bar)All Curves 116 psig (8 bar) Bias
USA
EURO
JPN
Flow Coef�cient: 1.95Maximum Inlet Pressure: RDHN6—3990 psig (275 bar)Outlet Pressure Control Range: 0 to 3335 psig (0 to 230 bar) All Curves 116 psig (8 bar) Bias
2175 (150)
2175 (150)
3990 (275)
40.0 (580) 70.0 (1015)
150 (2175)
150 (2175)
275 (3990)
4.0 7.0
15.0
15.0
27.5
Inlet Pressure, psig (bar)
Pressure Control Range
0 to 3335 psig (0 to 230 bar) All curves 116 psig (8.0 bar) bias
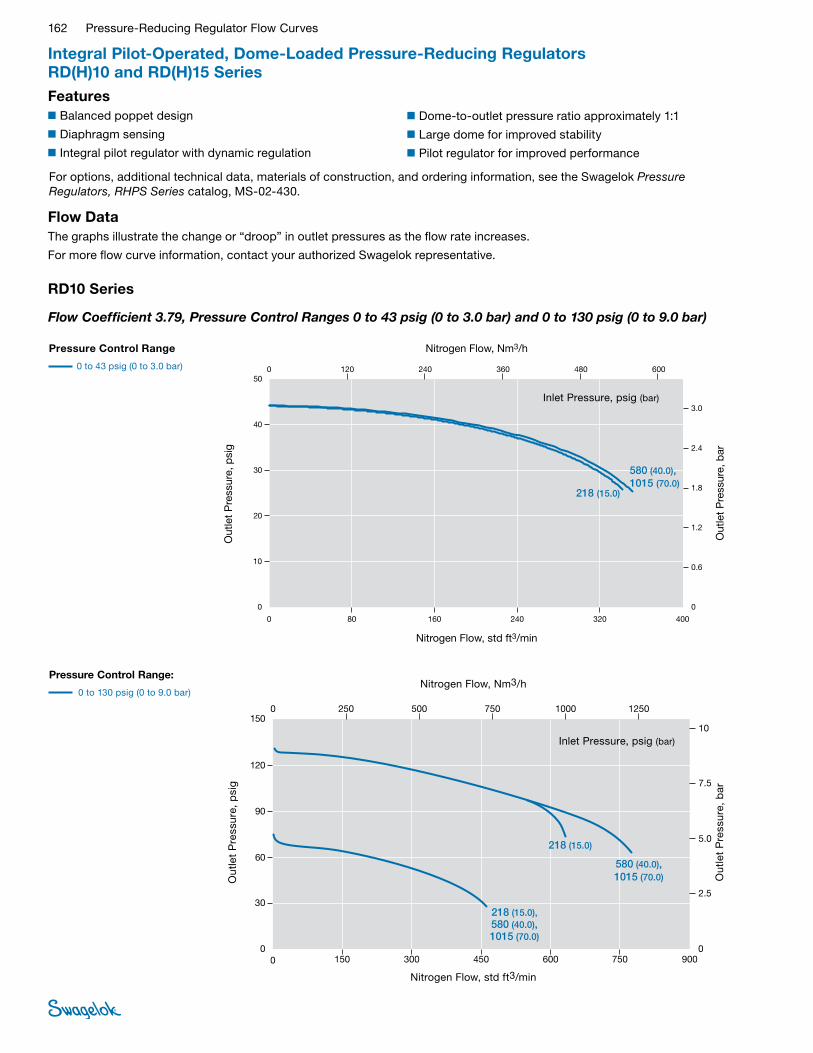
162 Pressure-Reducing Regulator Flow Curves
Integral Pilot-Operated, Dome-Loaded Pressure-Reducing Regulators RD(H)10 and RD(H)15 SeriesFeatures■Balanced poppet design
■Diaphragm sensing
■Integral pilot regulator with dynamic regulation
For options, additional technical data, materials of construction, and ordering information, see the Swagelok Pressure Regulators, RHPS Series catalog, MS-02-430.
■Dome-to-outlet pressure ratio approximately 1:1
■Large dome for improved stability
■Pilot regulator for improved performance
Flow DataThe graphs illustrate the change or “droop” in outlet pressures as the flow rate increases.
For more flow curve information, contact your authorized Swagelok representative.
RD10 Series
Flow Coefficient 3.79, Pressure Control Ranges 0 to 43 psig (0 to 3.0 bar) and 0 to 130 psig (0 to 9.0 bar)
Nitrogen Flow, std ft3/min
Out
let
Pre
ssur
e, p
sig
Out
let
Pre
ssur
e, b
ar
Nitrogen Flow, Nm3/h
0
20
30
40
50
10
0 80 240160 320 400
0 80 240160 320 400
0 120 240 360 480 600
2.4
3.0
0.6
1.8
0
1.2
3.0
0.6
2.4
1.8
0
1.2
0
20
30
40
50
10
0 120 240 360 480 600
0.30
0.06
0.24
0.18
0
0.12
0 120 240 360 480 600
Nitrogen Flow, std ft3/min
Out
let
Pre
ssur
e, p
sig
Out
let
Pre
ssur
e, b
arO
utle
t P
ress
ure,
psi
g
Out
let
Pre
ssur
e, b
arO
utle
t P
ress
ure,
MP
a
Nitrogen Flow, std ft3/min
Nitrogen Flow, Nm3/h
Nitrogen Flow, Nm3/h
Nitrogen Flow, Nm3/h
580 (40.0),1015 (70.0)
Pressure Control Range
0 to 43 psig (0 to 3.0 bar)
RD10 Series
USA
EURO
JPN
Flow Coef�cient: 3.79Maximum Inlet Pressure: RD10—1015 psig (70.0 bar)Outlet Pressure Control Range: 0 to 43 psig (0 to 3.0 bar)
218 (15.0)
40.0 (580),70.0 (1015)
15.0 (218)
40.0,70.015.0
Inlet Pressure, psig (bar)
Pressure Control Range
0 to 43 psig (0 to 3.0 bar)
Pressure Control Range:
0 to 130 psig (0 to 9.0 bar)
JPN
EURO
USA
0 150 600450300 750 900
0 150 600450300 750 900
0
30
60
90
120
150
2.5
5.0
7.5
10
0
0
30
60
90
120
150
2,5
5,0
7,5
10
0
5000 15 00010 000 20 000
0.25
0.50
0.75
1.00
025 000
0 250 750500 1000 1250
0 250 750500 1000 1250
218 (15.0)
580 (40.0),1015 (70.0)
218 (15.0),580 (40.0),1015 (70.0)
15,0 (218)
40,0 (580),70,0 (1015)
15,0 (218),40,0 (580),70,0 (1015)
4.0, 7.0
1.5
1.5, 4.0, 7.0
Nitrogen Flow, std ft3/min
Out
let
Pre
ssur
e, p
sig
Out
let
Pre
ssur
e, b
ar
Nitrogen Flow, Nm3/h
Inlet Pressure, psig (bar)

Pressure-Reducing Regulator Flow Curves 163
Integral Pilot-Operated, Dome-Loaded Pressure-Reducing Regulators RD(H)10 Series
For options, additional technical data, materials of construction, and ordering information, see the Swagelok Pressure Regulators, RHPS Series catalog, MS-02-430.
Flow DataThe graphs illustrate the change or “droop” in outlet pressures as the flow rate increases.
For more flow curve information, contact your authorized Swagelok representative.
RD10 Series
Flow Coefficient 3.79, Pressure Control Ranges 0 to 290 psig (0 to 20.0 bar) and 0 to 1015 psig (0 to 70.0 bar)
Pressure Control Range:
0 to 290 psig (0 to 20.0 bar)
JPN
EURO
USA
0 500 15001000 2000
0 300 1200900600 1500 1800
0 300 1200900600 1500 1800
0
60
120
180
240
300
360
8.0
12
16
24
0
0
60
120
180
240
300
360
4,0
12
20
24
0
2500
20
4.0
16
8,0
10 000 30 00020 000 40 000
0.4
1.2
2.0
2.4
050 000
1.6
0.8
0
0
500 15001000 2000 2500
218 (15.0) 580 (40.0),1015 (70.0)
580 (40.0)
1015 (70.0)
15,0 (218) 40,0 (580),70,0 (1015)
40,0 (580)
70,0 (1015)
1.5
4.0
4.0, 7.0
7.0
Nitrogen Flow, std ft3/min
Out
let
Pre
ssur
e, p
sig
Out
let
Pre
ssur
e, b
ar
Nitrogen Flow, Nm3/h
Inlet Pressure, psig (bar)
Pressure Control Range:
0 to 1015 psig (0 to 70.0 bar)
0
300
400
500
600
700
800
50
JPN
EURO
USA
200
100
40
10
20
30
0
300
400
500
600
700
800
50
200
100
40
10
20
30
0
0 500
0 500
200015001000 2500
15001000
0 500 200015001000 2500
0
5.0
4.0
1.0
2.0
3.0
0 10 000 50 00040 00030 00020 000 60 000 70 000
0 500 30001000 3500
2000 2500 3000 3500
250020001500
580 (40.0), 1015 (70.0)
1015 (70.0)
70,0 (1015)
40,0 (580), 70,0 (1015)
7.0
4.0, 7.0
Nitrogen Flow, std ft3/min
Out
let
Pre
ssur
e, p
sig
Out
let
Pre
ssur
e, b
ar
Nitrogen Flow, Nm3/h
Inlet Pressure, psig (bar)
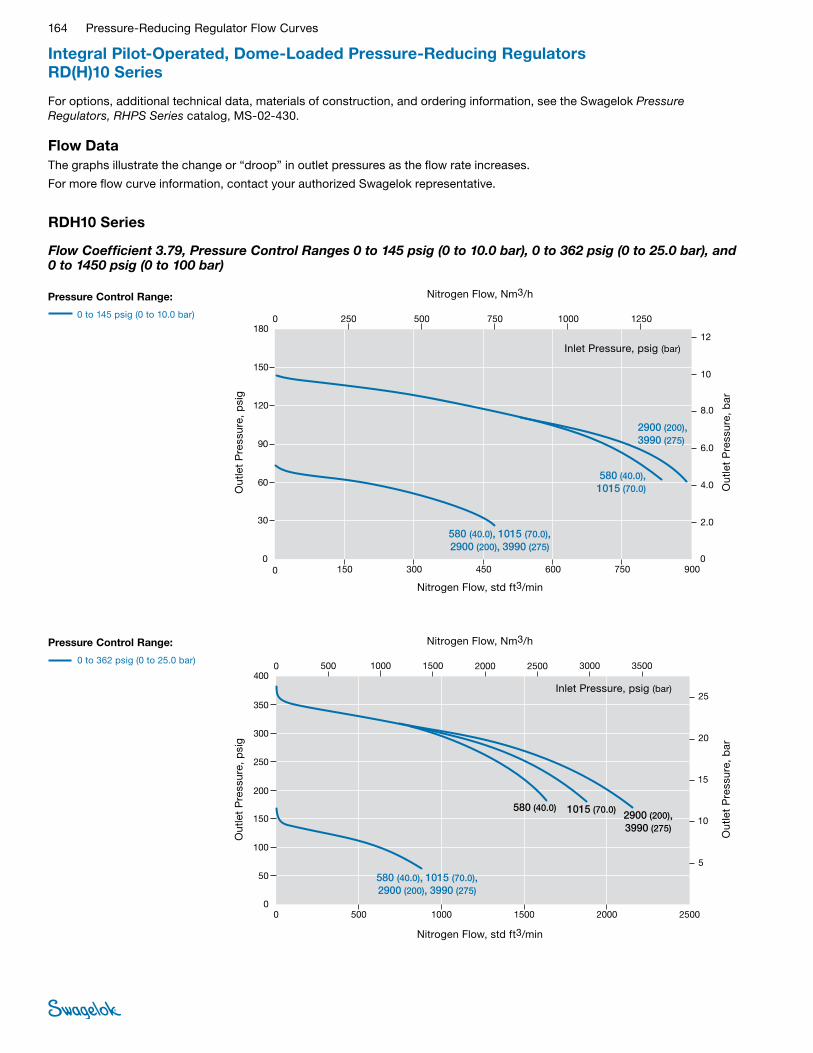
164 Pressure-Reducing Regulator Flow Curves
RDH10 Series
Flow Coefficient 3.79, Pressure Control Ranges 0 to 145 psig (0 to 10.0 bar), 0 to 362 psig (0 to 25.0 bar), and 0 to 1450 psig (0 to 100 bar)
Integral Pilot-Operated, Dome-Loaded Pressure-Reducing Regulators RD(H)10 Series
For options, additional technical data, materials of construction, and ordering information, see the Swagelok Pressure Regulators, RHPS Series catalog, MS-02-430.
Flow DataThe graphs illustrate the change or “droop” in outlet pressures as the flow rate increases.
For more flow curve information, contact your authorized Swagelok representative.
Pressure Control Range:
0 to 145 psig (0 to 10.0 bar)
JPN
EURO
USA
0 250 750500 1000
0 150 600450300 750 900
0 150 600450300 750 900
0
30
60
90
120
150
180
4.0
6.0
8.0
12
0
0
30
60
90
120
150
180
2,0
6,0
10
12
0
1250
10
2.0
8,0
4,0
5000 15 00010 000 20 000
0.2
0.6
1.0
1.2
025 000
0.8
0.4
0
0
250 750500 1000 1250
580 (40.0),1015 (70.0)
2900 (200),3990 (275)
580 (40.0), 1015 (70.0),2900 (200), 3990 (275)
40,0 (580),70,0 (1015)
40,0 (580), 70,0 (1015),200 (2900), 275 (3900)
200 (2900),275 (3900)
4.0, 7.0
20.0, 27.5
4.0, 7.0, 20.0, 27.5
Nitrogen Flow, std ft3/min
Out
let
Pre
ssur
e, p
sig
Out
let
Pre
ssur
e, b
ar
Nitrogen Flow, Nm3/h
Inlet Pressure, psig (bar)
Pressure Control Range:
0 to 362 psig (0 to 25.0 bar)
0
150
200
250
300
350
400
25
JPN
EURO
USA
100
50
20
5
10
15
0
150
200
250
300
350
400
25
100
50
20
5
10
15
0
0 500
0 500
200015001000 2500
15001000
0 500 200015001000 2500
0
2.5
2.0
0.5
1.0
1.5
0 10 000 50 00040 00030 00020 000 60 000 70 000
0 500 30001000 3500
2000 2500 3000 3500
250020001500
580 (40.0), 1015 (70.0),2900 (200), 3990 (275)
2900 (200),3990 (275)
1015 (70.0)580 (40.0)
40,0 (580), 70,0 (1015),200 (2900), 275 (3900)
40,0 (580) 70,0 (1015)200 (2900),275 (3900)
4.0, 7.0, 20.0, 27.5
4.0 7.0 20.0, 27.5
Nitrogen Flow, std ft3/min
Out
let
Pre
ssur
e, p
sig
Out
let
Pre
ssur
e, b
ar
Nitrogen Flow, Nm3/h
Inlet Pressure, psig (bar)

Pressure-Reducing Regulator Flow Curves 165
Integral Pilot-Operated, Dome-Loaded Pressure-Reducing Regulators RD(H)10 Series
For options, additional technical data, materials of construction, and ordering information, see the Swagelok Pressure Regulators, RHPS Series catalog, MS-02-430.
Flow DataThe graphs illustrate the change or “droop” in outlet pressures as the flow rate increases.
For more flow curve information, contact your authorized Swagelok representative.
RDH10 Series
Flow Coefficient 3.79, Pressure Control Ranges 0 to 1450 psig (0 to 100 bar) and 0 to 2537 psig (0 to 175 bar)
Pressure Control Range:
0 to 1450 psig (0 to 100 bar)
JPN
EURO
USA
0 1500 600045003000 7500 9000
0 1500 600045003000 7500 9000
0
300
600
900
1200
1500
25
50
75
100
0
0
300
600
900
1200
1500
25
50
75
100
0
50 000 150 000100 000 200 000
2.5
5.0
7.5
10
0250 000
0 2500 75005000 10 000 12 500
0 2500 75005000 10 000 12 500
2900 (200) 3990 (275)
3990 (275)
2900 (200)1015 (70.0)
2900 (200),3990 (275)1015
(70.0)
580 (40.0)
275 (3900)200 (2900)
275 (3900)
200 (2900)70,0 (1015)
200 (2900),275 (3900)70,0
(1015)
40,0 (580)
27.520.0
7.020.0
27.5
4.0 7.020.0, 27.5
Nitrogen Flow, std ft3/min
Out
let
Pre
ssur
e, p
sig
Out
let
Pre
ssur
e, b
ar
Nitrogen Flow, Nm3/h
Inlet Pressure, psig (bar)
Pressure Control Range:
0 to 2537 psig (0 to 175 bar)
JPN
EURO
USA
0 1500 600045003000 7500 9000
0 1500 600045003000 7500 9000
0
500
1000
1500
2000
2500
3000
50
100
150
200
0
0
50
100
150
200
250
300
50
100
150
200
0
50 000 150 000100 000 200 000
5.0
10
15
20
0250 000
0 2500 75005000 10 000 12 500
0 2500 75005000 10 000 12 500
2900 (200) 3990 (275)
3990 (275)2900 (200)
275 (3900)200 (2900)
200 (2900) 275 (3900)
27.520.0
20.0 27.5
Nitrogen Flow, std ft3/min
Out
let
Pre
ssur
e, p
sig
Out
let
Pre
ssur
e, b
ar
Nitrogen Flow, Nm3/h
Inlet Pressure, psig (bar)

166 Pressure-Reducing Regulator Flow Curves
Integral Pilot-Operated, Dome-Loaded Pressure-Reducing Regulators RD(H)10 Series
For options, additional technical data, materials of construction, and ordering information, see the Swagelok Pressure Regulators, RHPS Series catalog, MS-02-430.
Flow DataThe graphs illustrate the change or “droop” in outlet pressures as the flow rate increases.
For more flow curve information, contact your authorized Swagelok representative.
RDH10 Series
Flow Coefficient 3.79, Pressure Control Range 0 to 3625 (0 to 250 bar)
0
1500
2000
2500
3000
3500
4000
250
JPN
EURO
USA
1000
500
200
50
100
150
0
1500
2000
2500
3000
3500
4000
250
1000
500
200
50
100
150
0
0 1500
0 2000
600045003000 7500
800060004000 10 000
0 1500 600045003000 7500
0
25
20
5.0
10
15
0 30 000 150 000120 00090 00060 000 180 000 210 000
0 2000 800060004000 10 000
3990 (275)
3990(275)
2900(200)
200(2900)
275 (3900)
275(3900)
27.520.0
27.5
Nitrogen Flow, std ft3/min
Out
let
Pre
ssur
e, p
sig
Out
let
Pre
ssur
e, b
ar
Nitrogen Flow, Nm3/h
Inlet Pressure, psig (bar)
Pressure Control Range
0 to 3625 psig (0 to 250 bar)
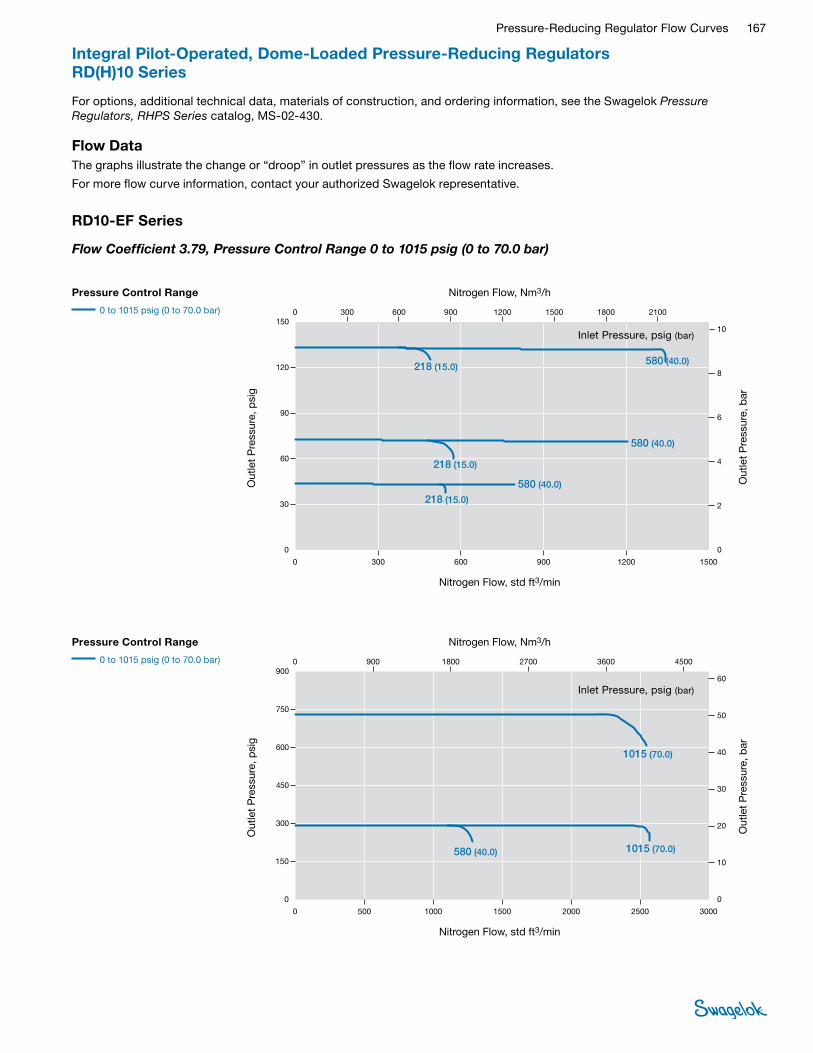
Pressure-Reducing Regulator Flow Curves 167
Integral Pilot-Operated, Dome-Loaded Pressure-Reducing Regulators RD(H)10 Series
For options, additional technical data, materials of construction, and ordering information, see the Swagelok Pressure Regulators, RHPS Series catalog, MS-02-430.
Flow DataThe graphs illustrate the change or “droop” in outlet pressures as the flow rate increases.
For more flow curve information, contact your authorized Swagelok representative.
RD10-EF Series
Flow Coefficient 3.79, Pressure Control Range 0 to 1015 psig (0 to 70.0 bar)
0
60
90
120
150
30
0 600300 900 1500
0 600300 900 1500
0 300 600 900 1200 1800 2100
8
10
2
6
0
4
10
2
8
6
0
4
0
60
90
120
150
30
0 300 900600 1200 1500 1800
1200
1500
2100
1200
1.0
0.2
0.8
0.6
0
0.4
0 300 600 900 1200 1500 21001800
Nitrogen Flow, std ft3/min
Out
let
Pre
ssur
e, p
sig
Out
let
Pre
ssur
e, b
arO
utle
t P
ress
ure,
psi
g
Out
let
Pre
ssur
e, b
arO
utle
t P
ress
ure,
MP
a
Nitrogen Flow, std ft3/min
Nitrogen Flow, Nm3/h
Nitrogen Flow, Nm3/h
Nitrogen Flow, Nm3/h
218 (15.0)
218 (15.0)
218 (15.0)
580 (40.0)
Pressure Control Range
0 to 1015 psig (0 to 70.0 bar)
RD10-EF Series
USA
EURO
JPN
Flow Coef�cient: 3.79Maximum Inlet Pressure: RD10-EF—580 psig (40.0 bar)Outlet Pressure Control Range: 0 to 1015 psig (0 to 70.0 bar)
580 (40.0)
580 (40.0)
15.0 (218)
15.0 (218)
40.0 (580)
40.0 (580)
40.0 (580)15.0 (218)
4.01.5
1.5
1.5
4.0
4.0
Nitrogen Flow, std ft3/min
Out
let
Pre
ssur
e, p
sig
Out
let
Pre
ssur
e, b
ar
Nitrogen Flow, Nm3/h
Inlet Pressure, psig (bar)
Pressure Control Range
0 to 1015 psig (0 to 70.0 bar)
0
300
450
600
900
150
0 500 15001000 2000 2500 3000
0 500 15001000 2000 30002500
0 900 1800 2700 3600 4500
40
60
10
30
0
20
60
10
40
30
0
20
0
300
450
600
900
150
0 900 1800 2700 3600 4500
75050
50750
6.0
1.0
4.0
3.0
0
2.0
0 900 1800 2700 3600 4500
5.0
Nitrogen Flow, std ft3/min
Out
let
Pre
ssur
e, p
sig
Out
let
Pre
ssur
e, b
arO
utle
t P
ress
ure,
psi
g
Out
let
Pre
ssur
e, b
arO
utle
t P
ress
ure,
MP
a
Nitrogen Flow, std ft3/min
Nitrogen Flow, Nm3/h
Nitrogen Flow, Nm3/h
Nitrogen Flow, Nm3/h
580 (40.0) 1015 (70.0)
Pressure Control Range
0 to 1015 psig (0 to 70.0 bar)
RD10-EF Series
USA
EURO
JPN
Flow Coef�cient: 3.79Maximum Inlet Pressure: RD10-EF—1015 psig (70.0 bar)Outlet Pressure Control Range: 0 to 1015 psig (0 to 70.0 bar)
1015 (70.0)
40.0 (580)
70.0 (1015)
70.0 (1015)
4.0
7.0
7.0
Nitrogen Flow, std ft3/min
Out
let
Pre
ssur
e, p
sig
Out
let
Pre
ssur
e, b
ar
Nitrogen Flow, Nm3/h
Inlet Pressure, psig (bar)
Pressure Control Range
0 to 1015 psig (0 to 70.0 bar)

168 Pressure-Reducing Regulator Flow Curves
Integral Pilot-Operated, Dome-Loaded Pressure-Reducing Regulators RD(H)10 Series
For options, additional technical data, materials of construction, and ordering information, see the Swagelok Pressure Regulators, RHPS Series catalog, MS-02-430.
Flow DataThe graphs illustrate the change or “droop” in outlet pressures as the flow rate increases.
For more flow curve information, contact your authorized Swagelok representative.
RDH10-EF Series
Flow Coefficient 3.79, Pressure Control Ranges 0 to 145 psig (0 to 10.0 bar), 0 to 362 psig (0 to 25.0 bar) and 0 to 1450 psig (0 to 100 bar)
0
60
90
120
180
30
0 500 15001000 2000 3000
0 500 15001000 2500 3000
0 750 1500 2250 3000 4500
10
12
2
8
0
6
12
2
8
6
0
4
0
60
90
120
150
180
30
0 750 1500 2250 3000 3750
2500
3750
150
4500
2000
4
10
1.2
0.2
0.8
0.6
0
0.4
0 750 1500 2250 3000 3750 4500
1.0
Nitrogen Flow, std ft3/min
Out
let
Pre
ssur
e, p
sig
Out
let
Pre
ssur
e, b
arO
utle
t P
ress
ure,
psi
g
Out
let
Pre
ssur
e, b
arO
utle
t P
ress
ure,
MP
a
Nitrogen Flow, std ft3/min
Nitrogen Flow, Nm3/h
Nitrogen Flow, Nm3/h
Nitrogen Flow, Nm3/h
580 (40.0)
Pressure Control Range
0 to 145 psig (0 to 10.0 bar)
RDH10-EF Series
USA
EURO
JPN
Flow Coef�cient: 3.79Maximum Inlet Pressure: RDH10-EF—5800 psig (400 bar)Outlet Pressure Control Range: 0 to 145 psig (0 to 10.0 bar)
1015 (70.0), 2900 (200), 3990 (275), 5800 (400)
580 (40.0)
1015 (70.0), 2900 (200), 3990 (275), 5800 (400)
40.0 (580)
70.0 (1015), 200 (2900), 275 (3990), 400 (5800)
40.0 (580)
70.0 (1015), 200 (2900), 275 (3990), 400 (5800)
4.0
7.0, 20.0, 27.5, 40.0
4.0
7.0, 20.0, 27.5, 40.0
Nitrogen Flow, std ft3/min
Out
let
Pre
ssur
e, p
sig
Out
let
Pre
ssur
e, b
ar
Nitrogen Flow, Nm3/h
Inlet Pressure, psig (bar)
Pressure Control Range
0 to 145 psig (0 to 10.0 bar)
Pressure Control Range
0 to 1450 psig (0 to 100 bar)
0 to 362 psig (0 to 25.0 bar)
0
300
450
600
750
900
150
0 2000 60004000 8000 10 000
0 2000 60004000 8000 10 000
0 3000 6000 9000 12 000 15 000
40
50
60
10
30
0
20
60
50
10
40
30
0
20
0
300
450
600
750
900
150
0 3000 6000 9000 12 000 15 000
6.0
5.0
1.0
4.0
3.0
0
2.0
0 3000 6000 9000 12 000 15 000
Nitrogen Flow, std ft3/min
Out
let
Pre
ssur
e, p
sig
Out
let
Pre
ssur
e, b
arO
utle
t P
ress
ure,
psi
g
Out
let
Pre
ssur
e, b
arO
utle
t P
ress
ure,
MP
a
Nitrogen Flow, std ft3/min
Nitrogen Flow, Nm3/h
Nitrogen Flow, Nm3/h
Nitrogen Flow, Nm3/h
580 (40.0) 1015 (70.0)
Pressure Control Range
0 to 1450 psig (0 to 100 bar)
RDH10-EF Series
0 to 362 psig (0 to 25.0 bar)
USA
EURO
JPN
Flow Coef�cient: 3.79Maximum Inlet Pressure: RDH10-EF—5800 psig (400 bar)Outlet Pressure Control Range: 0 to 1450 psig (0 to 100 bar)
2900 (200), 3990 (275), 5800 (400)
2900 (200)1015 (70.0)5800 (400)
40.0 (580) 70.0 (1015)
200 (2900), 275 (3990), 400 (5800)
200 (2900)70.0 (1015)400 (5800)
4.0 7.0
20.0, 27.5, 40.0
20.07.0
40.0
3990 (275)
275 (3990)
27.5
Nitrogen Flow, std ft3/min
Out
let
Pre
ssur
e, p
sig
Out
let
Pre
ssur
e, b
ar
Nitrogen Flow, Nm3/h
Inlet Pressure, psig (bar)
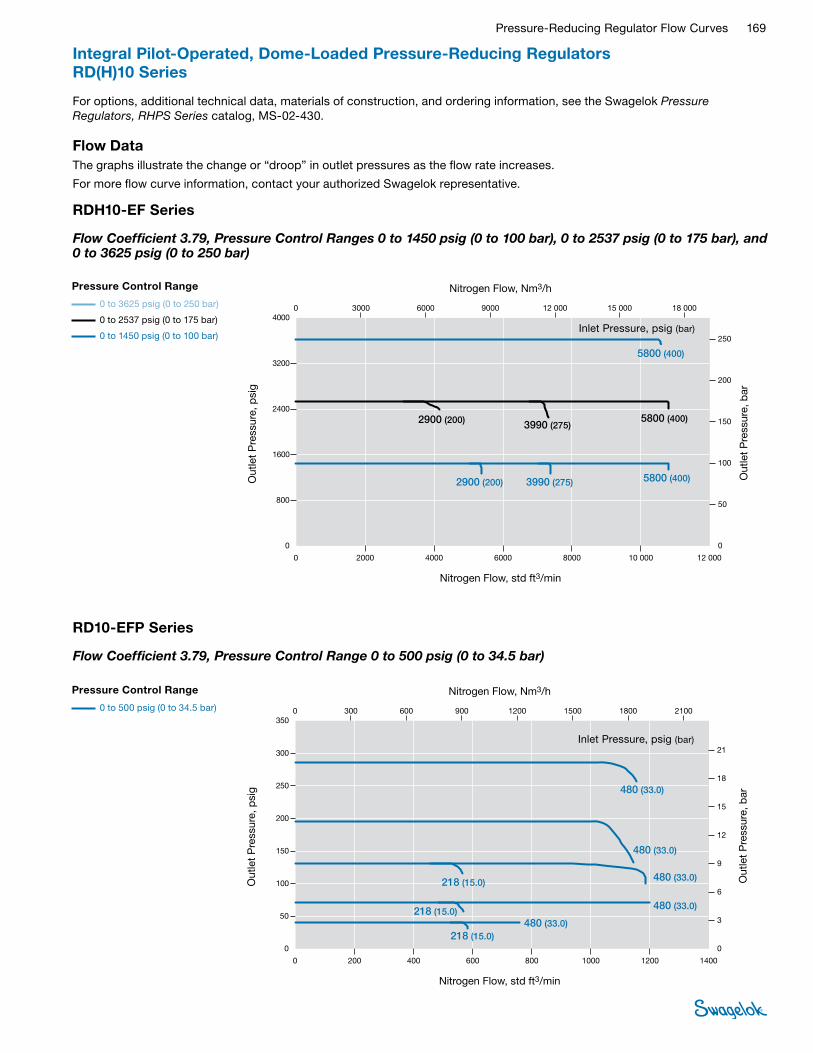
Pressure-Reducing Regulator Flow Curves 169
Integral Pilot-Operated, Dome-Loaded Pressure-Reducing Regulators RD(H)10 Series
For options, additional technical data, materials of construction, and ordering information, see the Swagelok Pressure Regulators, RHPS Series catalog, MS-02-430.
Flow DataThe graphs illustrate the change or “droop” in outlet pressures as the flow rate increases.
For more flow curve information, contact your authorized Swagelok representative.
RDH10-EF Series
Flow Coefficient 3.79, Pressure Control Ranges 0 to 1450 psig (0 to 100 bar), 0 to 2537 psig (0 to 175 bar), and 0 to 3625 psig (0 to 250 bar)
Pressure Control Range
0 to 500 psig (0 to 34.5 bar)
0
100
150
200
350
50
0 200 600400 800 1400
0 600 800 1400
0 300 600 900 1200 2100
18
21
3
9
0
6
21
3
12
9
0
6
0
200
250
300
350
150
0 300 600 900 1200 1500
250
300
12
15
200 400
15
18
100
50
1000 1200
1500 1800
1800 2100
1000 1200
2.1
0.3
1.2
0.9
0
0.6
0 300 600 900 1200 1500
1.5
1.8
1800 2100
Nitrogen Flow, std ft3/min
Out
let
Pre
ssur
e, p
sig
Out
let
Pre
ssur
e, b
arO
utle
t P
ress
ure,
psi
g
Out
let
Pre
ssur
e, b
arO
utle
t P
ress
ure,
MP
a
Nitrogen Flow, std ft3/min
Nitrogen Flow, Nm3/h
Nitrogen Flow, Nm3/h
Nitrogen Flow, Nm3/h
218 (15.0)
218 (15.0)
Pressure Control Range
0 to 500 psig (0 to 34.5 bar)
RD10-EFP Series
USA
EURO
JPN
Flow Coef�cient: 3.79Maximum Inlet Pressure: RD10-EFP—218 psig (15.0 bar)Outlet Pressure Control Range: 0 to 500 psig (0 to 34.5 bar)
480 (33.0)218 (15.0)480 (33.0)
480 (33.0)
480 (33.0)
480 (33.0)
15.0 (218)
33.0 (480)15.0 (218)
15.0 (218)
33.0 (480)
33.0 (480)
33.0 (480)
33.0 (480)
1.5
3.3
3.3
3.3
3.3
3.3
1.5
1.5
Nitrogen Flow, std ft3/min
Out
let
Pre
ssur
e, p
sig
Out
let
Pre
ssur
e, b
ar
Nitrogen Flow, Nm3/h
Inlet Pressure, psig (bar)
RD10-EFP Series
Flow Coefficient 3.79, Pressure Control Range 0 to 500 psig (0 to 34.5 bar)
Pressure Control Range
0 to 3625 psig (0 to 250 bar)
0 to 2537 psig (0 to 175 bar)
0 to 1450 psig (0 to 100 bar)
0
1600
2400
3200
4000
800
0 2000 60004000 8000 12 000
0 2000 60004000 8000 12 000
0 3000 6000 9000 12 000 18 000
200
250
50
150
0
100
250
200
150
100
0
50
0
1600
2400
3200
4000
800
0 3000 6000 9000 12 000 15 000
10 000
15 000
18 000
10 000
25.0
20.0
15.0
10.0
0
5.0
0 3000 6000 9000 12 000 15 000 18 000
Nitrogen Flow, std ft3/min
Out
let
Pre
ssur
e, p
sig
Out
let
Pre
ssur
e, b
arO
utle
t P
ress
ure,
psi
g
Out
let
Pre
ssur
e, b
arO
utle
t P
ress
ure,
MP
a
Nitrogen Flow, std ft3/min
Nitrogen Flow, Nm3/h
Nitrogen Flow, Nm3/h
Nitrogen Flow, Nm3/h
Pressure Control Range
0 to 3625 psig (0 to 250 bar)
RDH10-EF Series
0 to 2537 psig (0 to 175 bar)
0 to 1450 psig (0 to 100 bar)
USA
EURO
JPN
Flow Coef�cient: 3.79Maximum Inlet Pressure: RDH10-EF—5800 psig (400 bar)Outlet Pressure Control Range: 0 to 3625 psig (0 to 250 bar)
2900 (200) 5800 (400)
2900 (200) 3990 (275)5800 (400)
5800 (400)
200 (2900) 400 (5800)
200 (2900)275 (3990)
400 (5800)
400 (5800)
20.0 40.0
20.027.5
40.0
40.0
3990 (275)
275 (3990)
27.5
Nitrogen Flow, std ft3/min
Out
let
Pre
ssur
e, p
sig
Out
let
Pre
ssur
e, b
ar
Nitrogen Flow, Nm3/h
Inlet Pressure, psig (bar)
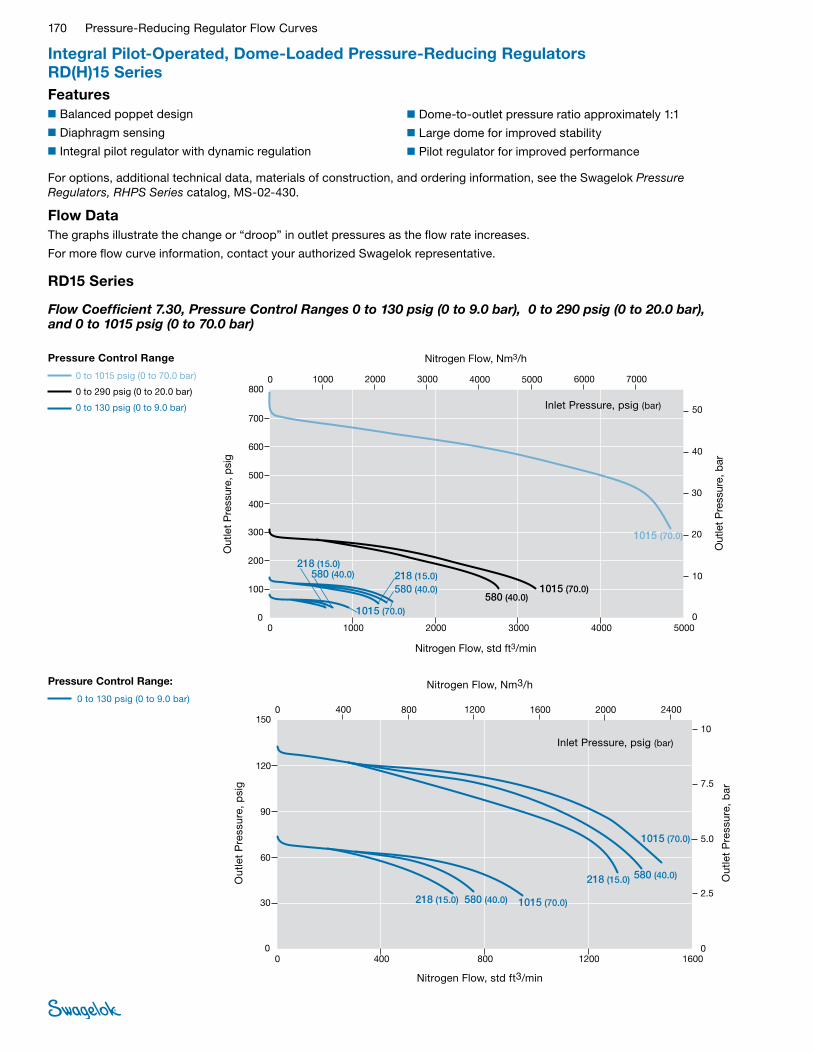
170 Pressure-Reducing Regulator Flow Curves
Integral Pilot-Operated, Dome-Loaded Pressure-Reducing Regulators RD(H)15 Series
For options, additional technical data, materials of construction, and ordering information, see the Swagelok Pressure Regulators, RHPS Series catalog, MS-02-430.
Flow DataThe graphs illustrate the change or “droop” in outlet pressures as the flow rate increases.
For more flow curve information, contact your authorized Swagelok representative.
RD15 Series
Flow Coefficient 7.30, Pressure Control Ranges 0 to 130 psig (0 to 9.0 bar), 0 to 290 psig (0 to 20.0 bar), and 0 to 1015 psig (0 to 70.0 bar)
Features■Balanced poppet design
■Diaphragm sensing
■Integral pilot regulator with dynamic regulation
■Dome-to-outlet pressure ratio approximately 1:1
■Large dome for improved stability
■Pilot regulator for improved performance
Pressure Control Range:
0 to 130 psig (0 to 9.0 bar)
JPN
EURO
USA
0 400
0 400
1200800 1600
16001200800 2000
0 400 1200800 1600
0 7500 30 00022 50015 000 37 500 45 000
0 400 16001200800 2000
30
60
90
120
150
2.5
5.0
7.5
10
00
0
30
60
90
120
150
2,5
5,0
7,5
10
0
0.50
0.75
1.00
0
0.25
2400
2400
1015 (70.0)
580 (40.0)218 (15.0)
1015 (70.0)580 (40.0)218 (15.0)
70,0 (1015)
40,0 (580)15,0 (218)
70,0 (1015)40,0 (580)15,0 (218)
7.04.01.5
7.04.01.5
Nitrogen Flow, std ft3/min
Out
let
Pre
ssur
e, p
sig
Out
let
Pre
ssur
e, b
ar
Nitrogen Flow, Nm3/h
Inlet Pressure, psig (bar)
Nitrogen Flow, std ft3/min
Out
let
Pre
ssur
e, p
sig
Out
let
Pre
ssur
e, b
ar
Nitrogen Flow, Nm3/h
0
300
400
500
600
700
800
50
JPN
EURO
USA
200
100
40
10
20
30
0
300
400
500
600
700
800
50
200
100
40
10
20
30
0
0 1000
0 1000
400030002000 5000
30002000
0 1000 400030002000 5000
0
5.0
4.0
1.0
2.0
3.0
0 20 000 100 00080 00060 00040 000 120 000 140 000
0 1000 60002000 7000
4000 5000 6000 7000
500040003000
0
580 (40.0)218 (15.0)
1015 (70.0)
580 (40.0)218 (15.0)
1015 (70.0)580 (40.0)
1015 (70.0)
40,0 (580)15,0 (218)
70,0 (1015)
40,0 (580)15,0 (218)
70,0 (1015)40,0 (580)
70,0 (1015)
4.01.57.04.01.5
7.04.0
7.0
7.0
Inlet Pressure, psig (bar)
Pressure Control Range
0 to 1015 psig (0 to 70.0 bar)
0 to 290 psig (0 to 20.0 bar)
0 to 130 psig (0 to 9.0 bar)

Pressure-Reducing Regulator Flow Curves 171
Integral Pilot-Operated, Dome-Loaded Pressure-Reducing Regulators RD(H)15 Series
For options, additional technical data, materials of construction, and ordering information, see the Swagelok Pressure Regulators, RHPS Series catalog, MS-02-430.
Flow DataThe graphs illustrate the change or “droop” in outlet pressures as the flow rate increases.
For more flow curve information, contact your authorized Swagelok representative.
RD15 Series
Flow Coefficient 7.30, Pressure Control Ranges 0 to 290 psig (0 to 20.0 bar), and 0 to 1015 psig (0 to 70.0 bar)
Pressure Control Range:
0 to 290 psig (0 to 20.0 bar)
JPN
EURO
USA
0 1000 30002000 4000
0 5000
4.0
0
350
12
0
5000
15 000 60 00030 000 75 0000
90 000
1000 1500 2000 2500 3000 3500
0 500 1000 1500 2000 2500 3000 3500
0 1000 30002000 4000 5000
70
140
210
280
350
12
16
20
0
70
140
210
280
16
20
24
24
8,0
45 000
8.0
4,0
1.2
1.6
2.0
2.4
0.8
0.4
1015 (70.0)580 (40.0)
218 (15.0)580 (40.0), 1015 (70.0)
15,0 (218)
70,0 (1015)40,0 (580)
40,0 (580), 70,0 (1015)
7.04.0
1.5 4.0, 7.0
Nitrogen Flow, std ft3/min
Out
let
Pre
ssur
e, p
sig
Out
let
Pre
ssur
e, b
ar
Nitrogen Flow, Nm3/h
Inlet Pressure, psig (bar)
Pressure Control Range:
0 to 1015 psig (0 to 70.0 bar)
0
300
400
500
600
700
800
50
JPN
EURO
USA
200
100
40
10
20
30
0
300
400
500
600
700
800
50
200
100
40
10
20
30
0
0 1000
0 1000
400030002000 5000
30002000
0 1000 400030002000 5000
0
5.0
4.0
1.0
2.0
3.0
0 20 000 100 00080 00060 00040 000 120 000 140 000
0 1000 60002000 7000
4000 5000 6000 7000
500040003000
1015 (70.0)
1015 (70.0)580 (40.0)
70,0 (1015)
40,0 (580)70,0 (1015)
7.0
4.0 7.0
Nitrogen Flow, std ft3/min
Out
let
Pre
ssur
e, p
sig
Out
let
Pre
ssur
e, b
ar
Nitrogen Flow, Nm3/h
Inlet Pressure, psig (bar)
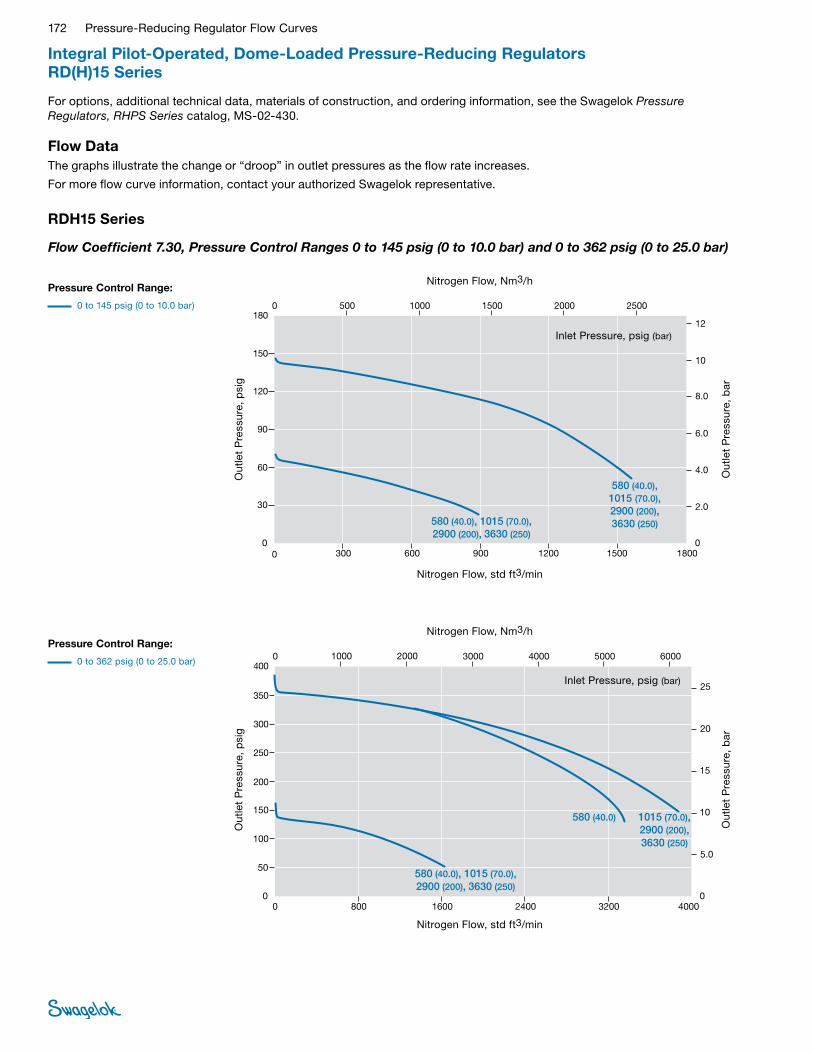
172 Pressure-Reducing Regulator Flow Curves
Integral Pilot-Operated, Dome-Loaded Pressure-Reducing Regulators RD(H)15 Series
For options, additional technical data, materials of construction, and ordering information, see the Swagelok Pressure Regulators, RHPS Series catalog, MS-02-430.
Flow DataThe graphs illustrate the change or “droop” in outlet pressures as the flow rate increases.
For more flow curve information, contact your authorized Swagelok representative.
RDH15 Series
Flow Coefficient 7.30, Pressure Control Ranges 0 to 145 psig (0 to 10.0 bar) and 0 to 362 psig (0 to 25.0 bar)
Pressure Control Range:
0 to 145 psig (0 to 10.0 bar)
JPN
EURO
USA
0 500 15001000 2000
0 300 1200900600 1500 1800
0 300 1200900600 1500 1800
0
30
60
90
120
150
180
4.0
6.0
8.0
12
0
0
30
60
90
120
150
180
2,0
6,0
10
12
0
2500
10
2.0
8,0
4,0
10 000 30 00020 000 40 000
0.2
0.6
1.0
1.2
050 000
0.8
0.4
0
0
500 15001000 2000 2500
0
580 (40.0),1015 (70.0),2900 (200),3630 (250)580 (40.0), 1015 (70.0),
2900 (200), 3630 (250)
40,0 (580), 70,0 (1015),200 (2900), 250 (3630)
40,0 (580), 70,0 (1015),200 (2900), 250 (3630)
4.0, 7.0,20.0, 25.0
4.0, 7.0,20.0, 25.0
Nitrogen Flow, std ft3/min
Out
let
Pre
ssur
e, p
sig
Out
let
Pre
ssur
e, b
ar
Nitrogen Flow, Nm3/h
Inlet Pressure, psig (bar)
Pressure Control Range:
0 to 362 psig (0 to 25.0 bar)
0
150
200
250
300
350
400
25
JPN
EURO
USA
100
50
20
5.0
10
15
0
150
200
250
300
350
400
25
100
50
20
5,0
10
15
0
0 800
0 1000
320024001600 4000
400030002000 5000
0 800 320024001600 4000
0
2.5
2.0
0.5
1.0
1.5
0 20 000 80 00060 00040 000 100 000
0
6000
1000 400030002000 5000 6000
1015 (70.0),2900 (200),3630 (250)
580 (40.0)
580 (40.0), 1015 (70.0),2900 (200), 3630 (250)
40,0 (580), 70,0 (1015),200 (2900), 250 (3630)
70,0 (1015),200 (2900),250 (3630)
40,0 (580)
7.0, 20.0,25.0
4.0
4.0, 7.0,20.0, 25.0
0
Nitrogen Flow, std ft3/min
Out
let
Pre
ssur
e, p
sig
Out
let
Pre
ssur
e, b
ar
Nitrogen Flow, Nm3/h
Inlet Pressure, psig (bar)
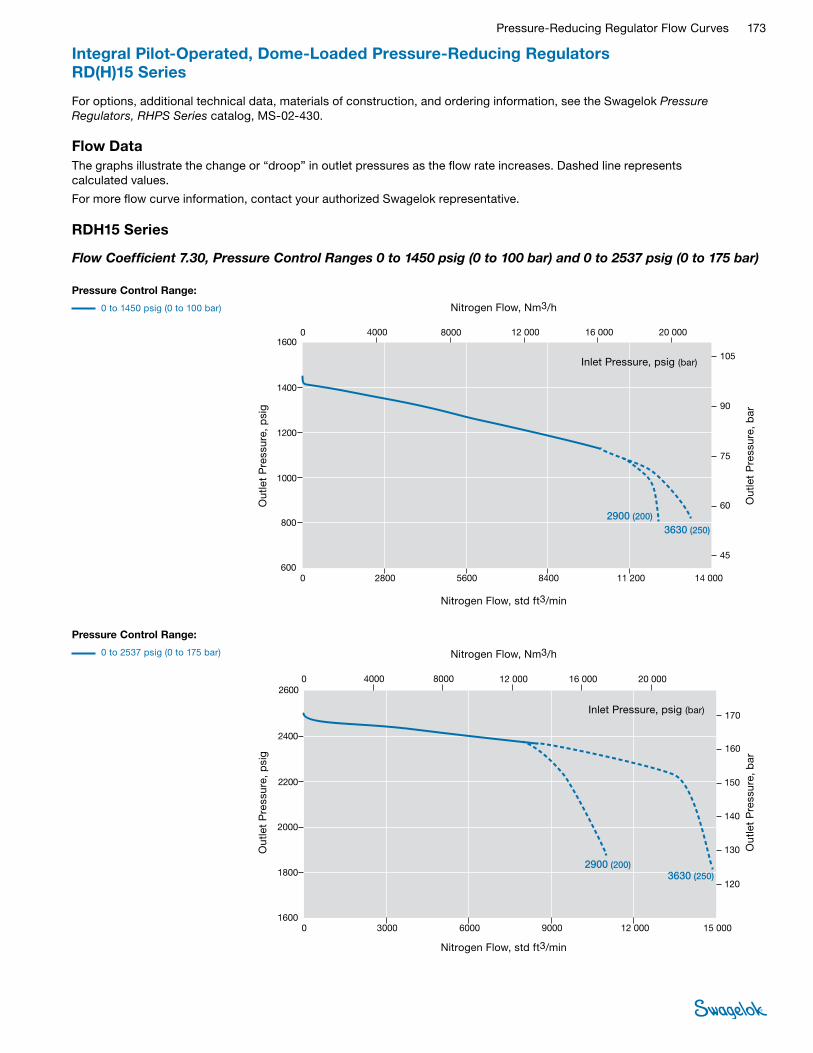
Pressure-Reducing Regulator Flow Curves 173
Integral Pilot-Operated, Dome-Loaded Pressure-Reducing Regulators RD(H)15 Series
For options, additional technical data, materials of construction, and ordering information, see the Swagelok Pressure Regulators, RHPS Series catalog, MS-02-430.
Flow DataThe graphs illustrate the change or “droop” in outlet pressures as the flow rate increases. Dashed line represents calculated values.
For more flow curve information, contact your authorized Swagelok representative.
RDH15 Series
Flow Coefficient 7.30, Pressure Control Ranges 0 to 1450 psig (0 to 100 bar) and 0 to 2537 psig (0 to 175 bar)
Pressure Control Range:
0 to 1450 psig (0 to 100 bar)
JPN
EURO
USA
0 2800
0 4000
11 20084005600 14 000
16 00012 0008000 20 000
0 2800 11 20084005600 14 000
0 60 000 240 000180 000120 000 300 000 360 000
0 4000 16 00012 0008000 20 000
800
1000
1200
1400
1600
60
75
90
105
600
600
800
1000
1200
1400
1600
60
75
90
105
45
45
6.0
7.5
9.0
10.5
4.5
3630 (250)
2900 (200)
250 (3630)200 (2900)
25.020.0
Nitrogen Flow, std ft3/min
Out
let
Pre
ssur
e, p
sig
Out
let
Pre
ssur
e, b
ar
Nitrogen Flow, Nm3/h
Inlet Pressure, psig (bar)
Pressure Control Range:
0 to 2537 psig (0 to 175 bar)
1600
2000
2200
2400
2600
170
JPN
EURO
USA
1800
160
120
130
150
0 3000 12 00090006000 15 000
0 3000 12 00090006000 15 000
0 100 000 300 000200 000 400 000
0 4000 16 00012 0008000 20 000
140
170
160
120
130
150
140
1600
2000
2200
2400
2600
1800
17
16
12
13
15
14
0 4000 16 00012 0008000 20 000
3630 (250)2900 (200)
250 (3630)200 (2900)
25.020.0
Nitrogen Flow, std ft3/min
Out
let
Pre
ssur
e, p
sig
Out
let
Pre
ssur
e, b
ar
Nitrogen Flow, Nm3/h
Inlet Pressure, psig (bar)
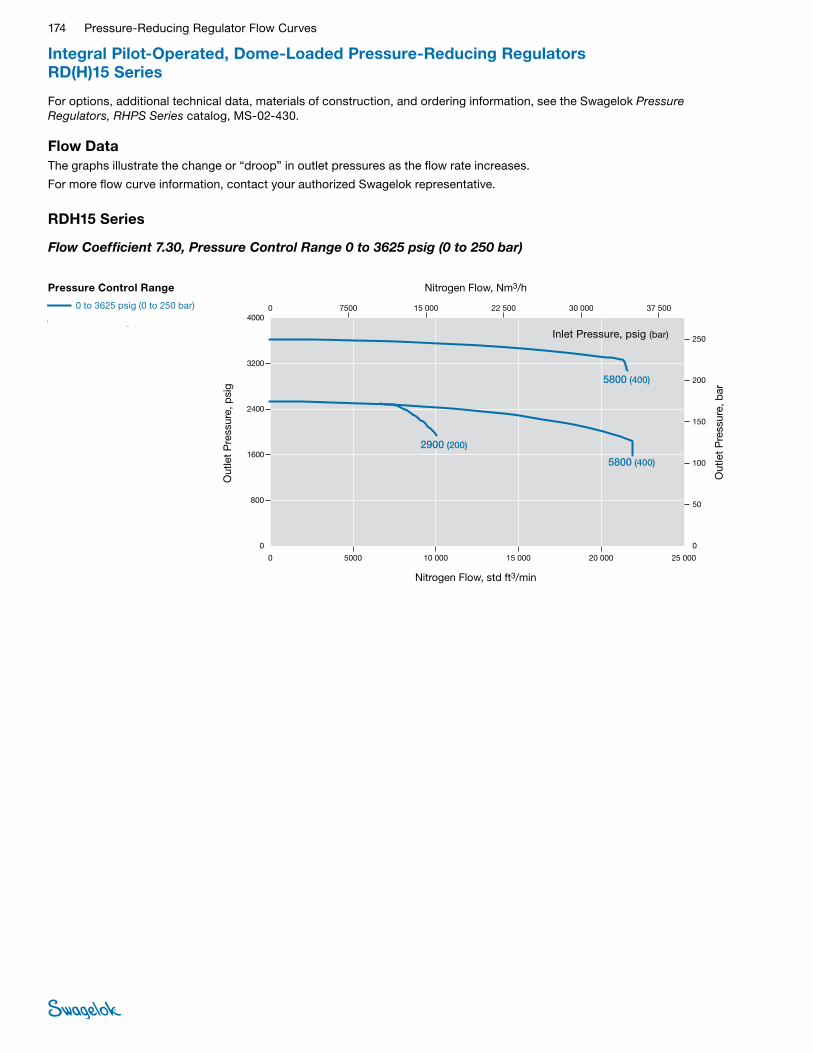
174 Pressure-Reducing Regulator Flow Curves
Integral Pilot-Operated, Dome-Loaded Pressure-Reducing Regulators RD(H)15 Series
For options, additional technical data, materials of construction, and ordering information, see the Swagelok Pressure Regulators, RHPS Series catalog, MS-02-430.
Flow DataThe graphs illustrate the change or “droop” in outlet pressures as the flow rate increases.
For more flow curve information, contact your authorized Swagelok representative.
RDH15 Series
Flow Coefficient 7.30, Pressure Control Range 0 to 3625 psig (0 to 250 bar)
0
1600
2400
3200
4000
800
0 5000 15 00010 000 20 000 25 000
0 5000 15 00010 000 20 000 25 000
0 7500 15 000 22 500 30 000 37 500
200
250
50
150
0
100
250
200
150
100
0
50
0
1600
2400
3200
4000
800
0 7500 15 000 22 500 30 000 37 500
25.0
20.0
15.0
10.0
0
5.0
0 7500 15 000 22 500 30 000 37 500
Nitrogen Flow, std ft3/min
Out
let
Pre
ssur
e, p
sig
Out
let
Pre
ssur
e, b
arO
utle
t P
ress
ure,
psi
g
Out
let
Pre
ssur
e, b
arO
utle
t P
ress
ure,
MP
a
Nitrogen Flow, std ft3/min
Nitrogen Flow, Nm3/h
Nitrogen Flow, Nm3/h
Nitrogen Flow, Nm3/h
2900 (200)
Pressure Control Range
0 to 3625 psig (0 to 250 bar)
RDH15 Series
USA
EURO
JPN
Flow Coef�cient: 7.30Maximum Inlet Pressure: RDH15—5800 psig (400 bar)Outlet Pressure Control Range: 0 to 3625 psig (0 to 250 bar)
5800 (400)
5800 (400)
200 (2900)
400 (5800)
400 (5800)
20.0
40.0
40.0
Nitrogen Flow, std ft3/min
Out
let
Pre
ssur
e, p
sig
Out
let
Pre
ssur
e, b
ar
Nitrogen Flow, Nm3/h
Inlet Pressure, psig (bar)
Pressure Control Range
0 to 362 psig (0 to 25.0 bar)
0 to 145 psig (0 to 100 bar)
Pressure Control Range
0 to 3625 psig (0 to 250 bar)
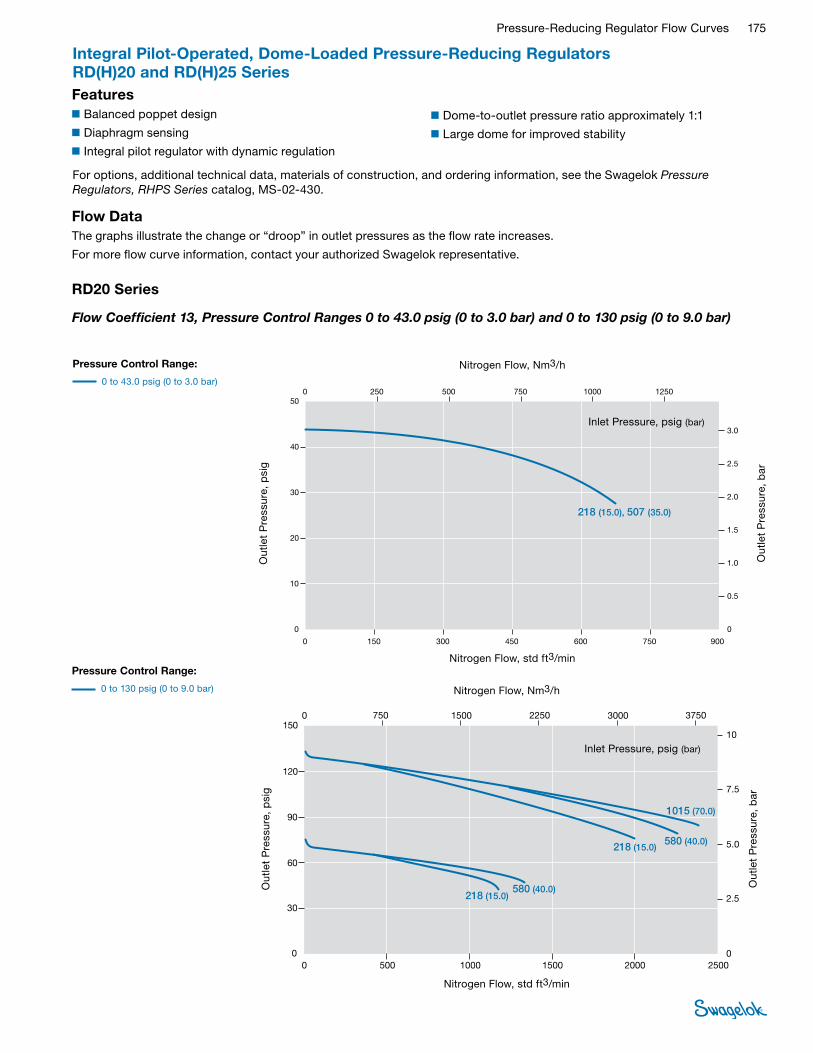
Pressure-Reducing Regulator Flow Curves 175
Integral Pilot-Operated, Dome-Loaded Pressure-Reducing Regulators RD(H)20 and RD(H)25 Series
For options, additional technical data, materials of construction, and ordering information, see the Swagelok Pressure Regulators, RHPS Series catalog, MS-02-430.
Flow DataThe graphs illustrate the change or “droop” in outlet pressures as the flow rate increases.
For more flow curve information, contact your authorized Swagelok representative.
RD20 Series
Flow Coefficient 13, Pressure Control Ranges 0 to 43.0 psig (0 to 3.0 bar) and 0 to 130 psig (0 to 9.0 bar)
Features■Balanced poppet design
■Diaphragm sensing
■Integral pilot regulator with dynamic regulation
■Dome-to-outlet pressure ratio approximately 1:1
■Large dome for improved stability
Pressure Control Range:
0 to 43.0 psig (0 to 3.0 bar)
0
20
30
40
50
10
0 150 300 600450 750 900
0 150 450300 600 750 900
0 250 500 750 1000 1250
2.0
2.5
3.0
0.5
1.5
0
1.0
3.0
2.5
0.5
2.0
1.5
0
1.0
0
10
20
30
40
50
0 250 500 750 1000 1250
0.3
0.25
0.05
0.2
0.15
0
0.1
0 250 500 750 1000 1250
Nitrogen Flow, std ft3/min
Out
let
Pre
ssur
e, p
sig
Out
let
Pre
ssur
e, b
arO
utle
t P
ress
ure,
psi
g
Out
let
Pre
ssur
e, b
arO
utle
t P
ress
ure,
MP
a
Nitrogen Flow, std ft3/min
Nitrogen Flow, Nm3/h
Nitrogen Flow, Nm3/h
Nitrogen Flow, Nm3/h
218 (15.0), 507 (35.0)
15.0 (218), 35.0 (507)
1.5, 3.5
Pressure Control Range
0 to 43 psig (0 to 3.0 bar)
RD20 Series
USA
EURO
JPN
Flow Coef�cient: 13Maximum Inlet Pressure: RD20—507 psig (35.0 bar)Outlet Pressure Control Range: 0 to 43 psig (0 to 3.0 bar)
Nitrogen Flow, std ft3/min
Out
let
Pre
ssur
e, p
sig
Out
let
Pre
ssur
e, b
ar
Nitrogen Flow, Nm3/h
Inlet Pressure, psig (bar)
Pressure Control Range:
0 to 130 psig (0 to 9.0 bar)
JPN
EURO
USA
0 500
0 750
200015001000 2500
300022501500 3750
0 1500 600045003000 7500
0 10 000 50 00040 00030 00020 000 60 000 70 000
30
60
90
120
150
2.5
5.0
7.5
10
00
0
30
60
90
120
150
2,5
5,0
7,5
10
0
0.50
0.75
1.00
0
0.25
0 750 300022501500 3750
218 (15.0)580 (40.0)
580 (40.0)218 (15.0)
1015 (70.0)
40,0 (580)15,0 (218)
15,0 (218)40,0 (580)
70,0 (1015)
4.01.5
1.54.0 7.0
Nitrogen Flow, std ft3/min
Out
let
Pre
ssur
e, p
sig
Out
let
Pre
ssur
e, b
ar
Nitrogen Flow, Nm3/h
Inlet Pressure, psig (bar)

176 Pressure-Reducing Regulator Flow Curves
Integral Pilot-Operated, Dome-Loaded Pressure-Reducing Regulators RD(H)20 Series
For options, additional technical data, materials of construction, and ordering information, see the Swagelok Pressure Regulators, RHPS Series catalog, MS-02-430.
Flow DataThe graphs illustrate the change or “droop” in outlet pressures as the flow rate increases.
For more flow curve information, contact your authorized Swagelok representative.
RD20 Series
Flow Coefficient 13, Pressure Control Ranges 0 to 145 psig (0 to 10.0 bar) and 0 to 290 psig (0 to 20.0 bar)
Pressure Control Range:
0 to 145 psig (0 to 10.0 bar)
JPN
EURO
USA
0 1000 2000 3000
0 400 16001200800 2000 2800
0 400 200016001200 2400 2800
4000
15 000 45 00030 000 60 000 75 000
0
0
1000 2000 3000 4000
0
60
80
100
120
140
160
10
40
20
8.0
2.0
4.0
6.0
0
0
60
80
100
120
140
160
10
40
20
8.0
2.0
4.0
6.0
0
0
1.0
0.8
0.2
0.4
0.6
800
2400
0
3630 (250), 2900 (200),1015 (70.0), 580 (40.0)
250 (3630), 200 (2900),70,0 (1015), 40,0 (580)
25.0, 20.0, 7.0, 4.0
3630 (250), 2900 (200),1015 (70.0), 580 (40.0)
250 (3630), 200 (2900),70,0 (1015), 40,0 (580)
25.0, 20.0, 7.0, 4.0
Nitrogen Flow, std ft3/min
Out
let
Pre
ssur
e, p
sig
Out
let
Pre
ssur
e, b
ar
Nitrogen Flow, Nm3/h
Inlet Pressure, psig (bar)
Pressure Control Range:
0 to 290 psig (0 to 20.0 bar)
JPN
EURO
USA
0 1000 400030002000 5000
0 1000 400030002000 5000
0 20 000 10 00080 00060 00040 000 12 000 14 000
0 15 000 60 00045 00030 000 75 000
5,0
10
15
20
0
1.0
1.5
2.0
0
0.5
0 15 000 60 00045 00030 000 75 000
0
50
100
150
200
250
3000
5.0
10
15
20
0
0
50
100
150
200
250
300
580 (40.0)218 (15.0)
1015 (70.0)
580 (40.0)
1015 (70.0)
15,0 (218) 40,0 (580)
70,0 (1015)
40,0 (580)
70,0 (1015)
1.54.0
7.0
4.0
7.0
Nitrogen Flow, std ft3/min
Out
let
Pre
ssur
e, p
sig
Out
let
Pre
ssur
e, b
ar
Nitrogen Flow, Nm3/h
Inlet Pressure, psig (bar)

Pressure-Reducing Regulator Flow Curves 177
Integral Pilot-Operated, Dome-Loaded Pressure-Reducing Regulators RD(H)20 Series
For options, additional technical data, materials of construction, and ordering information, see the Swagelok Pressure Regulators, RHPS Series catalog, MS-02-430.
Flow DataThe graphs illustrate the change or “droop” in outlet pressures as the flow rate increases.
For more flow curve information, contact your authorized Swagelok representative.
RD20 Series
Flow Coefficient 13, Pressure Control Ranges 0 to 130 psig (0 to 9.0 bar), 0 to 290 psig (0 to 20.0 bar), and 0 to 1015 psig (0 to 70.0 bar)
0
300
400
500
600
700
800
50
JPN
EURO
USA
200
100
40
10
20
30
0
300
400
500
600
700
800
50
200
100
40
10
20
30
0
0 1600
0 2000
640048003200 8000
800060004000 10 000
0 1600 640048003200 8000
0
5.0
4.0
1.0
2.0
3.0
0 40 000 160 000120 00080 000 200 000
0
12 000
2000 800060004000 10 000 12 000
0
1015 (70.0)
218 (15.0) 580 (40.0)
1015 (70.0)
580 (40.0)580 (40.0)1015 (70.0)
218 (15.0)
70,0 (1015)
15,0 (218) 40,0 (580)
70,0 (1015)
40,0 (580)40,0 (580)70,0 (1015)
15,0 (218)
7.0
1.54.0
7.04.0
4.07.0
1.5
Nitrogen Flow, std ft3/min
Out
let
Pre
ssur
e, p
sig
Out
let
Pre
ssur
e, b
ar
Nitrogen Flow, Nm3/h
Inlet Pressure, psig (bar)
Pressure Control Range
0 to 1015 psig (0 to 70.0 bar)
0 to 290 psig (0 to 20.0 bar)
0 to 130 psig (0 to 9.0 bar)
Pressure Control Range:
0 to 1015 psig (0 to 70.0 bar)
JPN
EURO
USA
0 2500 75005000 10 000
0 1500 600045003000 7500 9000
0 1500 600045003000 7500 9000
12 500
80 000 160 000120 000 200 000 240 000
0
0
2500 75005000 10 000 12 500
0
300
400
500
600
700
800
50
200
100
40
10
20
30
0
0
300
400
500
600
700
800
50
200
100
40
10
20
30
0
0
5.0
4.0
1.0
2.0
3.0
40 000
1015 (70.0)
1015 (70.0)580 (40.0)
70,0 (1015)
70,0 (1015)40,0 (580)
7.0
7.0 4.0
0
Nitrogen Flow, std ft3/min
Out
let
Pre
ssur
e, p
sig
Out
let
Pre
ssur
e, b
ar
Nitrogen Flow, Nm3/h
Inlet Pressure, psig (bar)
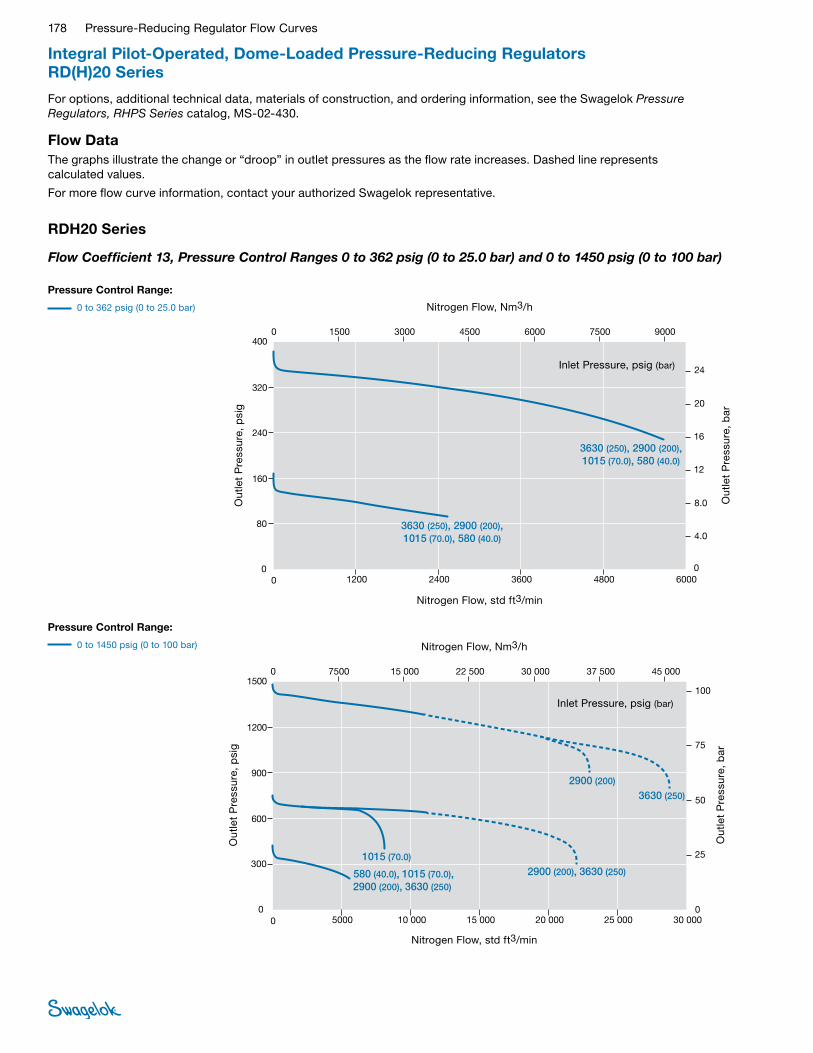
178 Pressure-Reducing Regulator Flow Curves
Integral Pilot-Operated, Dome-Loaded Pressure-Reducing Regulators RD(H)20 Series
For options, additional technical data, materials of construction, and ordering information, see the Swagelok Pressure Regulators, RHPS Series catalog, MS-02-430.
Flow DataThe graphs illustrate the change or “droop” in outlet pressures as the flow rate increases. Dashed line represents calculated values.
For more flow curve information, contact your authorized Swagelok representative.
RDH20 Series
Flow Coefficient 13, Pressure Control Ranges 0 to 362 psig (0 to 25.0 bar) and 0 to 1450 psig (0 to 100 bar)
Pressure Control Range:
0 to 362 psig (0 to 25.0 bar)
JPN
EURO
USA
0 1500 45003000 6000
0 1200 36002400 4800 6000
0 1200 36002400 4800 6000
7500
40 000 80 000 120 000 160 000
0
0
1500 45003000 6000 9000
0
160
240
320
400
24
80
20
4.0
12
16
0
0
160
240
320
400
24
80
20
8.0
12
16
0
0
9000
7500
8.0
4.0
2.4
2.0
0.8
1.2
1.6
0.4
3630 (250), 2900 (200),1015 (70.0), 580 (40.0)
3630 (250), 2900 (200),1015 (70.0), 580 (40.0)
250 (3630), 200 (2900),70,0 (1015), 40,0 (580)
250 (3630), 200 (2900),70,0 (1015), 40,0 (580)
25.0, 20.0, 7.0, 4.0
25.0, 20.0, 7.0, 4.0
0
Nitrogen Flow, std ft3/min
Out
let
Pre
ssur
e, p
sig
Out
let
Pre
ssur
e, b
ar
Nitrogen Flow, Nm3/h
Inlet Pressure, psig (bar)
Pressure Control Range:
0 to 1450 psig (0 to 100 bar)
JPN
EURO
USA
0 5000 20 00015 00010 000 25 000 30 000
0 5000 20 00015 00010 000 25 000 30 000
0
150 000 450 000300 000 600 000 750 000
0 7500 22 50015 000 30 000 37 500
0 7500 22 50015 000 30 000 37 500
45 000
45 000
300
600
900
1200
1500
25
50
75
100
00
0
300
600
900
1200
1500
25
50
75
100
0
5.0
7.5
10
0
2.5
2900 (200)
3630 (250)
2900 (200), 3630 (250)
1015 (70.0)
580 (40.0), 1015 (70.0), 2900 (200), 3630 (250)
200 (2900)
250 (3630)
200 (2900), 250 (3630)
70,0 (1015)
40,0 (580), 70,0 (1015), 200 (2900), 250 (3630)
20.0
25.0
20.0, 25.0
7.0
4.0, 7.0, 20.0, 25.0
0
Nitrogen Flow, std ft3/min
Out
let
Pre
ssur
e, p
sig
Out
let
Pre
ssur
e, b
ar
Nitrogen Flow, Nm3/h
Inlet Pressure, psig (bar)

Pressure-Reducing Regulator Flow Curves 179
Integral Pilot-Operated, Dome-Loaded Pressure-Reducing Regulators RD(H)20 Series
For options, additional technical data, materials of construction, and ordering information, see the Swagelok Pressure Regulators, RHPS Series catalog, MS-02-430.
Flow DataThe graphs illustrate the change or “droop” in outlet pressures as the flow rate increases. Dashed line represents calculated values.
For more flow curve information, contact your authorized Swagelok representative.
RDH20 Series
Flow Coefficient 13, Pressure Control Ranges 0 to 2537 psig (0 to 175 bar) and 0 to 2900 psig (0 to 200 bar)
0
1500
1000
2000
2500
3000
3500
500
0 5000 15 00010 000 20 000 30 000
0 5000 15 00010 000 20 000 30 000
0 7500 15 000 22 500 30 000 45 000
120
160
200
240
60
80
0
40
240
200
40
160
120
0
80
2.4
2.0
0.4
1.6
1.2
0.8
0
1500
2000
2500
3000
3500
1000
500
0 7500 15 000 22 500 30 000 37 500
25 000
37 500
45 000
25 000
00 7500 15 000 22 500 30 000 37 500 45 000
Nitrogen Flow, std ft3/min
Inle
t P
ress
ure,
psi
g
Inle
t P
ress
ure,
bar
Inle
t P
ress
ure,
psi
g
Inle
t P
ress
ure,
bar
Inle
t P
ress
ure,
MP
a
Nitrogen Flow, std ft3/min
Nitrogen Flow, Nm3/h
Nitrogen Flow, Nm3/h
Nitrogen Flow, Nm3/h
2900 (200)3630 (250)
3630 (250)
200 (2900)250 (3630)
250 (3630)
25.0
20.025.0
Pressure Control Range
0 to 2900 psig (0 to 200 bar)
0 to 2540 psig (0 to 175 bar)
RDH20 Series
USA
EURO
JPN
Flow Coef�cient: 13Maximum Inlet Pressure: RDH20—5800 psig (400 bar)Outlet Pressure Control Range: 0 to 2900 psig (0 to 200 bar)
Nitrogen Flow, std ft3/min
Out
let
Pre
ssur
e, p
sig
Out
let
Pre
ssur
e, b
ar
Nitrogen Flow, Nm3/h
Inlet Pressure, psig (bar)
Pressure Control Range:
0 to 2900 psig (0 to 200 bar)
0 to 2540 psig (0 to 175 bar)

180 Pressure-Reducing Regulator Flow Curves
Integral Pilot-Operated, Dome-Loaded Pressure-Reducing Regulators RD(H)20 Series
For options, additional technical data, materials of construction, and ordering information, see the Swagelok Pressure Regulators, RHPS Series catalog, MS-02-430.
Flow DataThe graphs illustrate the change or “droop” in outlet pressures as the flow rate increases.
For more flow curve information, contact your authorized Swagelok representative.
RD20-EF Series
Flow Coefficient 13, Pressure Control Ranges 0 to 43.0 psig (0 to 3.0 bar), 0 to 130 psig (0 to 9.0 bar), 0 to 145 psig (0 to 10.0 bar), 0 to 290 psig (0 to 20.0 bar), and 0 to 362 psig (0 to 25.0 bar)
Pressure Control Range:
0 to 290 psig (0 to 20.0 bar)
0 to 130 psig (0 to 9.0 bar)
0 to 43.0 psig (0 to 3.0 bar)
0
100
150
200
300
350
50
0 400020001000 5000
0 1000 30002000 4000 5000
0 30001500 4500 6000 7500
16
20
4.0
12
0
8.0
24
20
4.0
16
12
0
8.0
0
100
150
200
250
350
300
50
0 30001500 4500 6000 7500
1500 45003000 6000 75000
2.0
2.4
1.6
0.8
1.2
0.4
0
250
3000
24
Nitrogen Flow, std ft3/min
Out
let
Pre
ssur
e, p
sig
Out
let
Pre
ssur
e, b
arO
utle
t P
ress
ure,
psi
g
Out
let
Pre
ssur
e, b
arO
utle
t P
ress
ure,
MP
a
Nitrogen Flow, std ft3/min
Nitrogen Flow, Nm3/h
Nitrogen Flow, Nm3/h
Nitrogen Flow, Nm3/h
507 (35.0)
507 (35.0)
218 (15.0)
15.0 (218)
15.0 (218)
218 (15.0)
507 (35.0)
35.0 (507)
35.0 (507)
35.0 (507)
3.5
3.51.5
1.5
3.5
218 (15.0), 507 (35.0)
15.0 (218), 35.0 (507)
1.5, 3.5
Pressure Control Range
0 to 43.0 psig (0 to 3.0 bar)
0 to 130 psig (0 to 9.0 bar)
0 to 290 psig (0 to 20.0 bar)
RD20-EF Series
USA
EURO
JPN
Flow Coef�cient: 13Maximum Inlet Pressure: RD20-EF— 507psig (35.0 bar)Outlet Pressure Control Range: 0 to 290 psig (0 to 20.0 bar)
Nitrogen Flow, std ft3/min
Out
let
Pre
ssur
e, p
sig
Out
let
Pre
ssur
e, b
ar
Nitrogen Flow, Nm3/h
Inlet Pressure, psig (bar)
Pressure Control Range:
0 to 362 psig (0 to 25.0 bar)
0 to 145 psig (0 to 10.0 bar)
0
300
500
100
200
400
0 4000 12 0008000 16 000 20 000
0 4000 12 0008000 16 000 20 000
0 6000 12 000 18 000 24 000 30 000
30
10
5.0
15
25
0
20
30
10
5.0
25
20
0
15
0
200
300
400
500
100
0 6000 12 000 18 000 24 000 30 000
3.0
1.0
0.5
2.5
2.0
0
1.5
0 6000 12 000 18 000 24 000 30 000
Nitrogen Flow, std ft3/min
Out
let
Pre
ssur
e, p
sig
Out
let
Pre
ssur
e, b
arO
utle
t P
ress
ure,
psi
g
Out
let
Pre
ssur
e, b
arO
utle
t P
ress
ure,
MP
a
Nitrogen Flow, std ft3/min
Nitrogen Flow, Nm3/h
Nitrogen Flow, Nm3/h
Nitrogen Flow, Nm3/h
2900 (200), 5800 (400)
580 (40.0), 1015 (70.0),2900 (200), 5800 (400)
40.0 (580), 70.0 (1015), 200 (2900), 400 (5800)
580 (40.0) 1015 (70.0)
Pressure Control Range
0 to 145 psig (0 to 10.0 bar)
0 to 362 psig (0 to 25.0 bar)
RDH20-EF Series
USA
EURO
JPN
Flow Coef�cient: 13Maximum Inlet Pressure: RDH20-EF—5800 psig (400 bar)Outlet Pressure Control Range: 0 to 362 psig (0 to 25.0 bar)
40.0 (580) 70.0 (1015)
200 (2900), 400 (5800)
4.0, 7.0, 20.0, 40.0
4.0 7.0
20.0, 40.0
580 (40.0), 1015 (70.0),2900 (200), 5800 (400)
40.0 (580), 70.0 (1015), 200 (2900), 400 (5800)
4.0, 7.0, 20.0, 40.0
Nitrogen Flow, std ft3/min
Out
let
Pre
ssur
e, p
sig
Out
let
Pre
ssur
e, b
ar
Nitrogen Flow, Nm3/h
Inlet Pressure, psig (bar)

Pressure-Reducing Regulator Flow Curves 181
Pressure Control Range:
0 to 1015 psig (0 to 70.0 bar)
0
300
500
600
700
800
100
200
400
0 2000 60004000 8000 10 000
0 2000 60004000 8000 10 000
0 3000 6000 9000 12 000 15 000
40
50
10
30
0
20
50
10
40
30
0
20
0
400
500
600
700
800
300
200
100
0 3000 6000 9000 12 000 15 000
3000 6000 9000 12 000 15 0000
5.0
2.0
3.0
4.0
1.0
0
Nitrogen Flow, std ft3/min
Out
let
Pre
ssur
e, p
sig
Out
let
Pre
ssur
e, b
arO
utle
t P
ress
ure,
psi
g
Out
let
Pre
ssur
e, b
arO
utle
t P
ress
ure,
MP
a
Nitrogen Flow, std ft3/min
Nitrogen Flow, Nm3/h
Nitrogen Flow, Nm3/h
Nitrogen Flow, Nm3/h
1015 (70.0)1015 (70.0)
70.0 (1015)
7.0
70.0 (1015)
7.0
Pressure Control Range
0 to 1015 psig (0 to 70.0 bar)
RD20-EF Series
USA
EURO
JPN
Flow Coef�cient: 13Maximum Inlet Pressure: RD20-EF—1015 psig (70.0 bar)Outlet Pressure Control Range: 0 to 1015 psig (0 to 70.0 bar)
Nitrogen Flow, std ft3/min
Out
let
Pre
ssur
e, p
sig
Out
let
Pre
ssur
e, b
ar
Nitrogen Flow, Nm3/h
Inlet Pressure, psig (bar)
Integral Pilot-Operated, Dome-Loaded Pressure-Reducing Regulators RD(H)20 Series
For options, additional technical data, materials of construction, and ordering information, see the Swagelok Pressure Regulators, RHPS Series catalog, MS-02-430.
Flow DataThe graphs illustrate the change or “droop” in outlet pressures as the flow rate increases.
For more flow curve information, contact your authorized Swagelok representative.
RDH20-EF Series
Flow Coefficient 13, Pressure Control Ranges 0 to 1015 psig (0 to 70.0 bar) and 0 to 1450 psig (0 to 100 bar)
Pressure Control Range:
0 to 1450 psig (0 to 100 bar)
0
600
1000
1200
1400
1600
200
400
800
0 10 000 30 00020 000 40 000 50 000
0 10 000 30 00020 000 40 000 50 000
0 15 000 30 000 45 000 60 000 75 000
100
20
40
80
0
60
100
20
80
60
0
40
0
800
1000
1200
1400
1600
600
400
200
0 15 000 30 000 45 000 60 000 75 000
15 000 30 000 45 000 60 000 75 0000
10
4.0
6.0
8.0
2.0
0
Nitrogen Flow, std ft3/min
Out
let
Pre
ssur
e, p
sig
Out
let
Pre
ssur
e, b
arO
utle
t P
ress
ure,
psi
g
Out
let
Pre
ssur
e, b
arO
utle
t P
ress
ure,
MP
a
Nitrogen Flow, std ft3/min
Nitrogen Flow, Nm3/h
Nitrogen Flow, Nm3/h
Nitrogen Flow, Nm3/h
1015 (70.0)
5800 (400)
5800 (400)
2900 (200)
2900 (200)
Pressure Control Range
0 to 1450 psig (0 to 100 bar)
RDH20-EF Series
USA
EURO
JPN
Flow Coef�cient: 13Maximum Inlet Pressure: RDH20-EF—5800 psig (400 bar)Outlet Pressure Control Range: 0 to 1450 psig (0 to 100 bar)
70.0 (1015)200 (2900)
400 (5800)
400 (5800)
200 (2900)
7.020.0
40.0
40.0
20.0
Nitrogen Flow, std ft3/min
Out
let
Pre
ssur
e, p
sig
Out
let
Pre
ssur
e, b
ar
Nitrogen Flow, Nm3/h
Inlet Pressure, psig (bar)
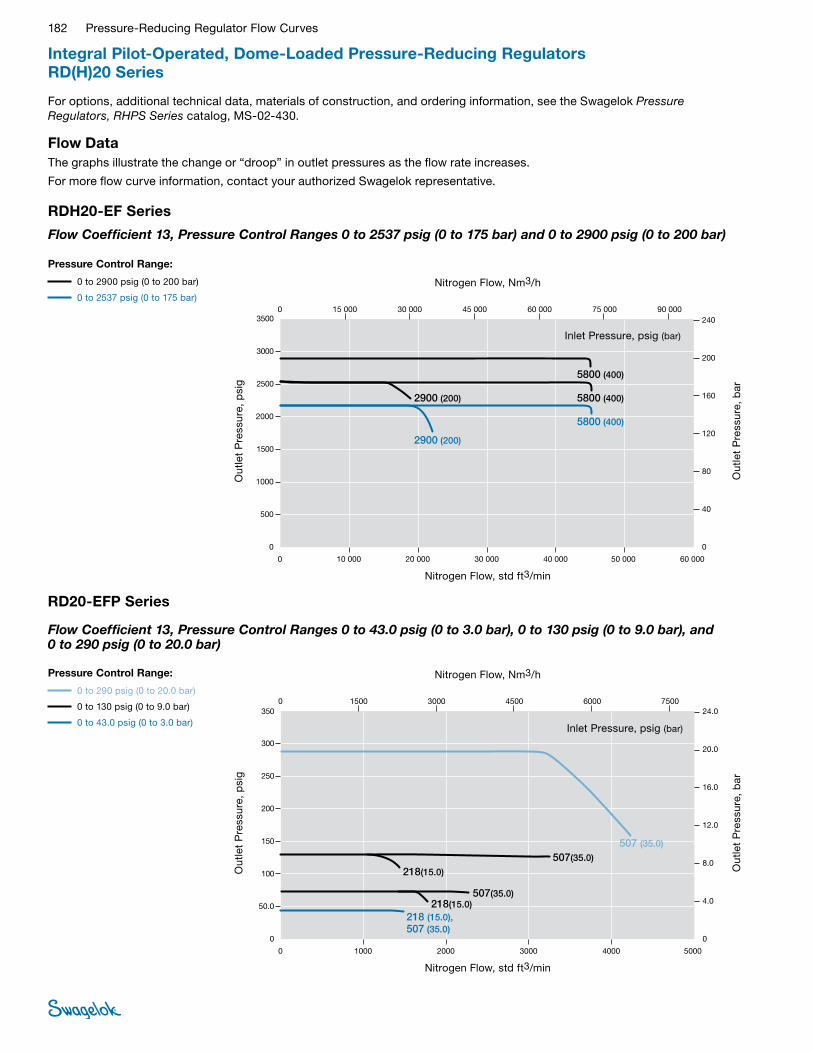
182 Pressure-Reducing Regulator Flow Curves
Integral Pilot-Operated, Dome-Loaded Pressure-Reducing Regulators RD(H)20 Series
For options, additional technical data, materials of construction, and ordering information, see the Swagelok Pressure Regulators, RHPS Series catalog, MS-02-430.
Flow DataThe graphs illustrate the change or “droop” in outlet pressures as the flow rate increases.
For more flow curve information, contact your authorized Swagelok representative.
RDH20-EF Series
Flow Coefficient 13, Pressure Control Ranges 0 to 2537 psig (0 to 175 bar) and 0 to 2900 psig (0 to 200 bar)
RD20-EFP Series
Flow Coefficient 13, Pressure Control Ranges 0 to 43.0 psig (0 to 3.0 bar), 0 to 130 psig (0 to 9.0 bar), and 0 to 290 psig (0 to 20.0 bar)
Pressure Control Range:
0 to 2900 psig (0 to 200 bar)
0 to 2537 psig (0 to 175 bar)
0
1500
2500
3000
3500
500
1000
2000
0 10 000 30 00020 000 40 000 60 000 50 000
0 10 000 30 00020 000 40 000 60 00050 000
0 15 000 30 000 45 000 60 000 90 00075 000240
40
80
160
200
0
120
200
240
40
160
120
0
80
0
2000
2500
3000
3500
1500
1000
500
0 15 000 30 000 45 000 60 000 90 00075 000
20
24
4.0
16
12
0
8.0
0 15 000 30 000 45 000 60 000 90 00075 000
Nitrogen Flow, std ft3/min
Out
let
Pre
ssur
e, p
sig
Out
let
Pre
ssur
e, b
arO
utle
t P
ress
ure,
psi
g
Out
let
Pre
ssur
e, b
arO
utle
t P
ress
ure,
MP
a
Nitrogen Flow, std ft3/min
Nitrogen Flow, Nm3/h
Nitrogen Flow, Nm3/h
Nitrogen Flow, Nm3/h
5800 (400)
2900 (200)
5800 (400)
5800 (400)2900 (200)
Pressure Control Range
0 to 2537 psig (0 to 175 bar)
0 to 2900 psig (0 to 200 bar)
RDH20-EF Series
USA
EURO
JPN
Flow Coef�cient: 13Maximum Inlet Pressure: RDH20-EF—5800 psig (400 bar)Outlet Pressure Control Range: 0 to 2900 psig (0 to 200 bar)
400 (5800)
200 (2900)
400 (5800)
400 (5800)200 (2900)
40.0
20.0
40.0
40.020.0
Nitrogen Flow, std ft3/min
Out
let
Pre
ssur
e, p
sig
Out
let
Pre
ssur
e, b
ar
Nitrogen Flow, Nm3/h
Inlet Pressure, psig (bar)
Pressure Control Range:
0 to 290 psig (0 to 20.0 bar)
0 to 130 psig (0 to 9.0 bar)
0 to 43.0 psig (0 to 3.0 bar)
0
100
150
200
250
300
350
50.0
0 1000 30002000 4000 5000
0 1000 30002000 4000 5000
0 1500 3000 4500 6000 7500
16.0
20.0
24.0
4.0
12.0
0
8.0
24.0
20.0
4.0
16.0
12.0
0
8.0
0
100
150
250
200
300
350
50.0
0 1500 3000 4500 6000 7500
1500 3000 4500 6000 75000
2.4
2.0
0.8
1.2
1.6
0.4
0
Nitrogen Flow, std ft3/min
Out
let
Pre
ssur
e, p
sig
Out
let
Pre
ssur
e, b
arO
utle
t P
ress
ure,
psi
g
Out
let
Pre
ssur
e, b
arO
utle
t P
ress
ure,
MP
a
Nitrogen Flow, std ft3/min
Nitrogen Flow, Nm3/h
Nitrogen Flow, Nm3/h
Nitrogen Flow, Nm3/h
507(35.0)
35.0 (507)
3.5
218(15.0)
15.0 (218)
1.5
507(35.0)
35.0 (507)
3.5
218(15.0)
15.0 (218)
1.5
507 (35.0)
35.0 (507)
3.5
218 (15.0),507 (35.0)
15.0 (218),35.0 (507)
1.5, 3.5
Pressure Control Range
0 to 43.0 psig (0 to 3.0 bar)
0 to 130 psig (0 to 9.0 bar)
0 to 290 psig (0 to 20.0 bar)
RD20-EFP Series
USA
EURO
JPN
Flow Coef�cient: 13Maximum Inlet Pressure: RD20-EFP—507psig (35.0 bar)Outlet Pressure Control Range: 0 to 290 psig (0 to 20.0 bar)
Nitrogen Flow, std ft3/min
Out
let
Pre
ssur
e, p
sig
Out
let
Pre
ssur
e, b
ar
Nitrogen Flow, Nm3/h
Inlet Pressure, psig (bar)

Pressure-Reducing Regulator Flow Curves 183
Integral Pilot-Operated, Dome-Loaded Pressure-Reducing Regulators RD(H)25 Series
For options, additional technical data, materials of construction, and ordering information, see the Swagelok Pressure Regulators, RHPS Series catalog, MS-02-430.
Flow DataThe graphs illustrate the change or “droop” in outlet pressures as the flow rate increases.
For more flow curve information, contact your authorized Swagelok representative.
RD25 Series
Flow Coefficient 21, Pressure Control Ranges 0 to 43.0 psig (0 to 3.0 bar), 0 to 290 psig (0 to 20.0 bar), 0 to 130 psig (0 to 9.0 bar), and 0 to 1015 psig (0 to 70.0 bar)
Features■Balanced poppet design
■Diaphragm sensing
■Integral pilot regulator with dynamic regulation
■Dome-to-outlet pressure ratio approximately 1:1
■Large dome for improved stability
Pressure Control Range:
0 to 130 psig (0 to 9.0 bar)
0 to 43.0 psig (0 to 3.0 bar)
0
60
100
120
140
20
40
80
0 1500 45003000 6000 7500
0 1500 45003000 6000 7500
0 2000 4000 6000 8000 10 000
7.5
1.5
9.0
3.0
6.0
0
4.5
9.0
1.5
6.0
7.5
4.5
0
3.0
0
60
80
100
120
140
40
20
0 2000 4000 6000 8000 10 000
0.90
0.15
0.60
0.75
0.45
0
0.30
0 2000 4000 6000 8000 10 000
Nitrogen Flow, std ft3/min
Out
let
Pre
ssur
e, p
sig
Out
let
Pre
ssur
e, b
arO
utle
t P
ress
ure,
psi
g
Out
let
Pre
ssur
e, b
arO
utle
t P
ress
ure,
MP
a
Nitrogen Flow, std ft3/min
Nitrogen Flow, Nm3/h
Nitrogen Flow, Nm3/h
Nitrogen Flow, Nm3/h
218 (15.0)
218 (15.0)
507 (35.0)
218 (15.0)
Pressure Control Range
0 to 43.0 psig (0 to 3.0 bar)
0 to 130 psig (0 to 9.0 bar)
RD25 Series
USA
EURO
JPN
Flow Coef�cient: 21Maximum Inlet Pressure: RD25—507 psig (35.0 bar)Outlet Pressure Control Range: 0 to 130 psig (0 to 9.0 bar)
507 (35.0)
507 (35.0)
15.0 (218)
15.0 (218)
35.0 (507)
15.0 (218)35.0 (507)
35.0 (507)
1.5
1.5
3.5
1.53.5
3.5
Nitrogen Flow, std ft3/min
Out
let
Pre
ssur
e, p
sig
Out
let
Pre
ssur
e, b
ar
Nitrogen Flow, Nm3/h
Inlet Pressure, psig (bar)
Pressure Control Range:
0 to 1015 psig (0 to 70.0 bar)
0 to 290 psig (0 to 20.0 bar)
0
300
500
600
700
800
100
200
400
0 3000 90006000 12 000 15 000
0 3000 90006000 12 000 15 000
0 4000 8000 12 000 16 000 20 000
40
50
10
30
0
20
50
10
40
30
0
20
0
400
500
600
700
800
300
200
100
0 4000 8000 12 000 16 000 20 000
4000 8000 12 000 16 000 20 0000
5.0
2.0
3.0
4.0
1.0
0
Nitrogen Flow, std ft3/min
Out
let
Pre
ssur
e, p
sig
Out
let
Pre
ssur
e, b
arO
utle
t P
ress
ure,
psi
g
Out
let
Pre
ssur
e, b
arO
utle
t P
ress
ure,
MP
a
Nitrogen Flow, std ft3/min
Nitrogen Flow, Nm3/h
Nitrogen Flow, Nm3/h
Nitrogen Flow, Nm3/h
580 (40.0)
1015 (70.0)
1015 (70.0)507 (35.0)
40.0 (580)
4.0
70.0 (1015)
7.0
70.0 (1015)
7.0
35.0 (507)
3.5
Pressure Control Range
0 to 290 psig (0 to 20.0 bar)
0 to 1015 psig (0 to 70.0 bar)
RD25 Series
USA
EURO
JPN
Flow Coef�cient: 21Maximum Inlet Pressure: RD25—1015 psig (70.0 bar)Outlet Pressure Control Range: 0 to 1015 psig (0 to 70.0 bar)
Nitrogen Flow, std ft3/min
Out
let
Pre
ssur
e, p
sig
Out
let
Pre
ssur
e, b
ar
Nitrogen Flow, Nm3/h
Inlet Pressure, psig (bar)

184 Pressure-Reducing Regulator Flow Curves
Integral Pilot-Operated, Dome-Loaded Pressure-Reducing Regulators RD(H)25 SeriesFor options, additional technical data, materials of construction, and ordering information, see the Swagelok Pressure Regulators, RHPS Series catalog, MS-02-430.
Flow DataThe graphs illustrate the change or “droop” in outlet pressures as the flow rate increases.
For more flow curve information, contact your authorized Swagelok representative.
RDH25 Series
Flow Coefficient 21, Pressure Control Ranges 0 to 145 psig (0 to 10.0 bar), 0 to 362 psig (0 to 25.0 bar), 0 to 1450 psig (0 to 100 bar), 0 to 2537 psig (0 to 175 bar), and 0 to 2900 psig (0 to 200 bar)
Pressure Control Range:
0 to 362 psig (0 to 25.0 bar)
0 to 145 psig (0 to 10.0 bar)
0
160
240
320
400
80
0 4000 12 0008000 16 000 20 000
0 4000 12 0008000 16 000 20 000
0 6000 12 000 18 000 24 000 30 000
15
20
25
10
0
5.0
25
5.0
20
15
0
10
2.5
0.5
2.0
1.5
0
1.0
0
80
160
240
320
400
0 6000 12 000 18 000 24 000 30 000
6000 12 000 18 000 24 000 30 000
0
0
Nitrogen Flow, std ft3/min
Out
let
Pre
ssur
e, p
sig
Out
let
Pre
ssur
e, b
arO
utle
t P
ress
ure,
psi
g
Out
let
Pre
ssur
e, b
arO
utle
t P
ress
ure,
MP
a
Nitrogen Flow, std ft3/min
Nitrogen Flow, Nm3/h
Nitrogen Flow, Nm3/h
Nitrogen Flow, Nm3/h
2900 (200), 4060 (280)
1015 (70.0)580 (40.0)
580 (40.0), 1015 (70.0), 2900 (200), 4060 (280)
580 (40.0)1015 (70.0), 2900 (200),
4060 (280)
200 (2900), 280 (4060)
70.0 (1015)40.0 (580)
40.0 (580), 70.0 (1015), 200 (2900), 280 (4060)
40.0 (580)70.0 (1015), 200 (2900),
280 (4060)
20.0, 28.0
7.04.0
4.0, 7.0,20.0, 28.0
4.0 7.0, 20.0, 28.0
Pressure Control Range
0 to 145 psig (0 to 10.0 bar)
0 to 362 psig (0 to 25.0 bar)
RDH25 Series
USA
EURO
JPN
Flow Coef�cient: 21Maximum Inlet Pressure: RDH25—4060 psig (280 bar)Outlet Pressure Control Range: 0 to 362 psig (0 to 25.0 bar)
Nitrogen Flow, std ft3/min
Out
let
Pre
ssur
e, p
sig
Out
let
Pre
ssur
e, b
ar
Nitrogen Flow, Nm3/h
Inlet Pressure, psig (bar)
Pressure Control Range:
0 to 2900 psig (0 to 200 bar)
0 to 2537 psig (0 to 175 bar)
0 to 1450 psig (0 to 100 bar)
0
1000
1500
2000
3000
3500
500
0 40 00020 00010 000 50 000
0 10 000 30 00020 000 40 000 50 000
0 30 00015 000 45 000 60 000 75 000
160
200
40
120
0
80
240
200
40
160
120
0
80
0
1000
1500
2000
2500
3500
3000
500
0 30 00015 000 45 000 60 000 75 000
15 000 45 00030 000 60 000 75 0000
20
24
16
8.0
12
4.0
0
2500
30 000
240
Nitrogen Flow, std ft3/min
Out
let
Pre
ssur
e, p
sig
Out
let
Pre
ssur
e, b
arO
utle
t P
ress
ure,
psi
g
Out
let
Pre
ssur
e, b
arO
utle
t P
ress
ure,
MP
a
Nitrogen Flow, std ft3/min
Nitrogen Flow, Nm3/h
Nitrogen Flow, Nm3/h
Nitrogen Flow, Nm3/h
2900 (200)
4060 (280)
2900 (200)
2900 (200)
4060 (280)
4060 (280)
4060 (280)
1015 (70.0)
200 (2900)
280 (4060)
200 (2900)
200 (2900)
280 (4060)
280 (4060)
280 (4060)
70.0 (1015)
20.0
28.0
20.0
20.0
28.0
28.0
28.0
7.0
Pressure Control Range
0 to 2537 psig (0 to 175 bar)
0 to 2900 psig (0 to 200 bar)
0 to 1450 psig (0 to 100 bar)
RDH25 Series
USA
EURO
JPN
Flow Coef�cient: 21Maximum Inlet Pressure: RDH25— 4060psig (280 bar)Outlet Pressure Control Range: 0 to 2900 psig (0 to 200 bar)
Nitrogen Flow, std ft3/min
Out
let
Pre
ssur
e, p
sig
Out
let
Pre
ssur
e, b
ar
Nitrogen Flow, Nm3/h
Inlet Pressure, psig (bar)
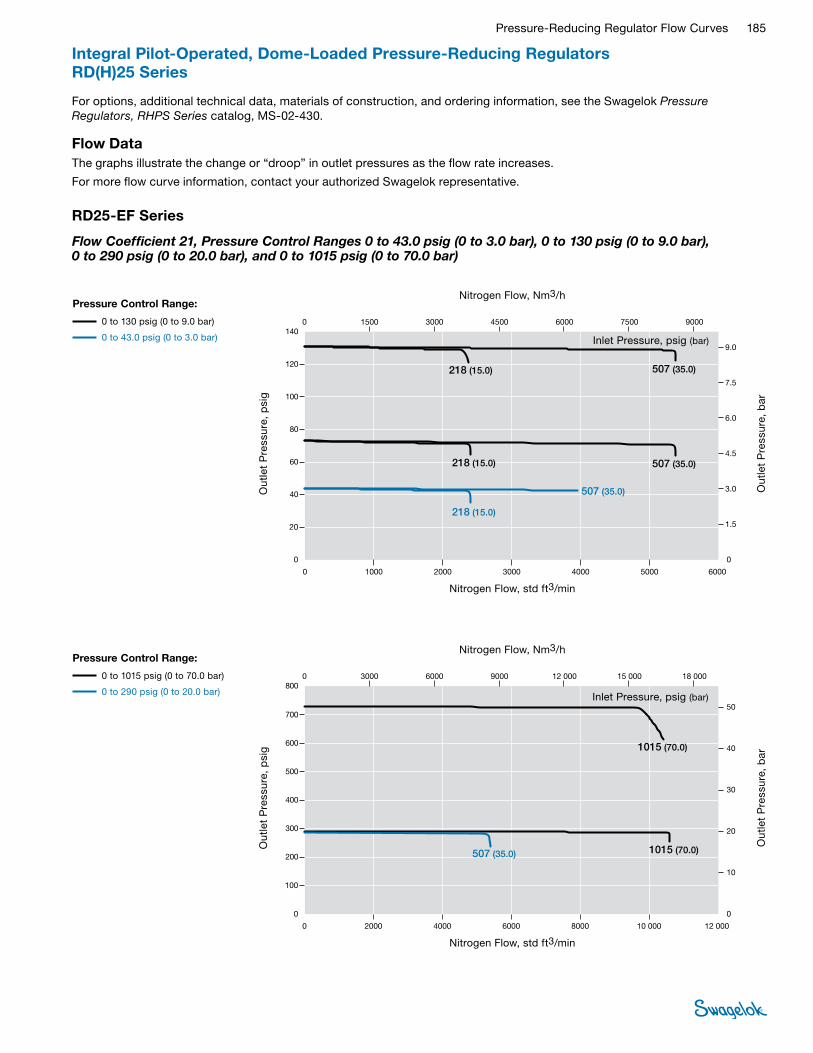
Pressure-Reducing Regulator Flow Curves 185
Pressure Control Range:
0 to 130 psig (0 to 9.0 bar)
0 to 43.0 psig (0 to 3.0 bar)
Integral Pilot-Operated, Dome-Loaded Pressure-Reducing Regulators RD(H)25 Series
For options, additional technical data, materials of construction, and ordering information, see the Swagelok Pressure Regulators, RHPS Series catalog, MS-02-430.
Flow DataThe graphs illustrate the change or “droop” in outlet pressures as the flow rate increases.
For more flow curve information, contact your authorized Swagelok representative.
RD25-EF Series
Flow Coefficient 21, Pressure Control Ranges 0 to 43.0 psig (0 to 3.0 bar), 0 to 130 psig (0 to 9.0 bar), 0 to 290 psig (0 to 20.0 bar), and 0 to 1015 psig (0 to 70.0 bar)
0
60
40
80
100
120
140
20
0 1000 3000 40002000 5000 6000
0 1000 30002000 4000 5000 6000
0 1500 3000 4500 6000 7500 9000
4.5
6.0
7.5
9.0
3.0
0
1.5
9.0
6.0
7.5
4.5
0
3.0
1.5
0
40
60
80
100
120
140
20
0 1500 3000 4500 6000 90007500
0.90
0.60
0.75
0.45
0
0.30
0.15
0 1500 3000 4500 6000 90007500
Nitrogen Flow, std ft3/min
Out
let
Pre
ssur
e, p
sig
Out
let
Pre
ssur
e, b
arO
utle
t P
ress
ure,
psi
g
Out
let
Pre
ssur
e, b
arO
utle
t P
ress
ure,
MP
a
Nitrogen Flow, std ft3/min
Nitrogen Flow, Nm3/h
Nitrogen Flow, Nm3/h
Nitrogen Flow, Nm3/h
507 (35.0)
218 (15.0)
218 (15.0)
218 (15.0)
507 (35.0)
507 (35.0)
35.0 (507)
15.0 (218)
35.0 (507)
3.5
35.0 (507)
15.0 (218)
1.5
1.5 3.5
15.0 (218)
1.5
3.5
Pressure Control Range
0 to 43.0 psig (0 to 3.0 bar)
0 to 130 psig (0 to 9.0 bar)
RD25-EF Series
USA
EURO
JPN
Flow Coef�cient: 21Maximum Inlet Pressure: RD25-EF—507 psig (35.0 bar)Outlet Pressure Control Range: 0 to 130 psig (0 to 9.0 bar)
Nitrogen Flow, std ft3/min
Out
let
Pre
ssur
e, p
sig
Out
let
Pre
ssur
e, b
ar
Nitrogen Flow, Nm3/h
Inlet Pressure, psig (bar)
Pressure Control Range:
0 to 1015 psig (0 to 70.0 bar)
0 to 290 psig (0 to 20.0 bar)
0
300
200
400
500
700
600
800
100
0 2000 6000 80004000 10 000 12 000
0 2000 60004000 8000 10 000 12 000
0 3000 6000 9000 12 000 15 000 18 000
30
40
50
20
0
10
50
40
30
0
20
10
0
300
400
500
600
700
800
100
200
0 3000 6000 9000 12 000 18 00015 000
5.0
4.0
3.0
0
2.0
1.0
0 3000 6000 9000 12 000 18 00015 000
Nitrogen Flow, std ft3/min
Out
let
Pre
ssur
e, p
sig
Out
let
Pre
ssur
e, b
arO
utle
t P
ress
ure,
psi
g
Out
let
Pre
ssur
e, b
arO
utle
t P
ress
ure,
MP
a
Nitrogen Flow, std ft3/min
Nitrogen Flow, Nm3/h
Nitrogen Flow, Nm3/h
Nitrogen Flow, Nm3/h
507 (35.0) 1015 (70.0)
1015 (70.0)
35.0 (507) 70.0 (1015)
70.0 (1015)
3.5 7.0
7.0
Pressure Control Range
0 to 290 psig (0 to 20.0 bar)
0 to 1015 psig (0 to 70.0 bar)
RD25-EF Series
USA
EURO
JPN
Flow Coef�cient: 21Maximum Inlet Pressure: RD25-EF—1015 psig (70.0 bar)Outlet Pressure Control Range: 0 to 1015 psig (0 to 70.0 bar)
Nitrogen Flow, std ft3/min
Out
let
Pre
ssur
e, p
sig
Out
let
Pre
ssur
e, b
ar
Nitrogen Flow, Nm3/h
Inlet Pressure, psig (bar)

186 Pressure-Reducing Regulator Flow Curves
Integral Pilot-Operated, Dome-Loaded Pressure-Reducing Regulators RD(H)25 Series
For options, additional technical data, materials of construction, and ordering information, see the Swagelok Pressure Regulators, RHPS Series catalog, MS-02-430.
Flow DataThe graphs illustrate the change or “droop” in outlet pressures as the flow rate increases.
For more flow curve information, contact your authorized Swagelok representative.
RDH25-EF Series
Flow Coefficient 21, Pressure Control Ranges 0 to 145 psig (0 to 10.0 bar), 0 to 362 psig (0 to 25.0 bar), 0 to 1450 psig (0 to 100 bar), 0 to 2537 psig (0 to 175 bar), and 0 to 2900 psig (0 to 200 bar)
Pressure Control Range:
0 to 362 psig (0 to 25.0 bar)
0 to 145 psig (0 to 10.0 bar)
0
160
240
320
400
80
0 6000 18 00012 000 24 000 30 000
0 6000 18 00012 000 24 000 30 000
0 9000 18 000 27 000 36 000 45 000
15
20
25
10
0
5.0
25
5.0
20
15
0
10
2.5
0.5
2.0
1.5
0
1.0
0
80
160
240
320
400
0 9000 18 000 27 000 36 000 45 000
9000 18 000 27 000 36 000 45 000
0
0
Nitrogen Flow, std ft3/min
Out
let
Pre
ssur
e, p
sig
Out
let
Pre
ssur
e, b
arO
utle
t P
ress
ure,
psi
g
Out
let
Pre
ssur
e, b
arO
utle
t P
ress
ure,
MP
a
Nitrogen Flow, std ft3/min
Nitrogen Flow, Nm3/h
Nitrogen Flow, Nm3/h
Nitrogen Flow, Nm3/h
2900 (200), 4060 (280)1015 (70.0)580 (40.0)
580 (40.0)
2900 (200), 4060 (280)
200 (2900), 280 (4060)70.0 (1015)40.0 (580)
40.0 (580), 70.0 (1015), 200 (2900), 280 (4060)
40.0 (580)
200 (2900), 280 (4060)
20.0, 28.0
7.04.0
4.0, 7.0,20.0, 28.0
4.0 20.0, 28.0
Pressure Control Range
0 to 145 psig (0 to 10.0 bar)
0 to 362 psig (0 to 25.0 bar)
RDH25-EF Series
USA
EURO
JPN
Flow Coef�cient: 21Maximum Inlet Pressure: RDH25-EF—4060 psig (280 bar)Outlet Pressure Control Range: 0 to 362 psig (0 to 25.0 bar)
580 (40.0), 1015 (70.0), 2900 (200), 4060 (280)
1015 (70.0)
70.0 (1015)
7.0
Nitrogen Flow, std ft3/min
Out
let
Pre
ssur
e, p
sig
Out
let
Pre
ssur
e, b
ar
Nitrogen Flow, Nm3/h
Inlet Pressure, psig (bar)
Pressure Control Range:
0 to 2900 psig (0 to 200 bar)
0 to 2537 psig (0 to 175 bar)
0 to 1450 psig (0 to 100 bar)
Nitrogen Flow, std ft3/min
Out
let
Pre
ssur
e, b
ar
Nitrogen Flow, Nm3/h
0
1000
1500
2000
3000
3500
500
0 40 00020 00010 000 50 000
0 10 000 30 00020 000 40 000 50 000
0 30 00015 000 45 000 60 000 75 000
160
200
40
120
0
80
240
200
40
160
120
0
80
0
1000
1500
2000
2500
3500
3000
500
0 30 00015 000 45 000 60 000 75 000
15 000 45 00030 000 60 000 75 0000
20
24
16
8.0
12
4.0
0
2500
30 000
240
Nitrogen Flow, std ft3/min
Out
let
Pre
ssur
e, p
sig
Out
let
Pre
ssur
e, b
arO
utle
t P
ress
ure,
psi
g
Out
let
Pre
ssur
e, b
arO
utle
t P
ress
ure,
MP
a
Nitrogen Flow, std ft3/min
Nitrogen Flow, Nm3/h
Nitrogen Flow, Nm3/h
Nitrogen Flow, Nm3/h
2900 (200)
4060 (280)
2900 (200)
2900 (200)
4060 (280)
4060 (280)
4060 (280)
1015 (70.0)
200 (2900)
280 (4060)
200 (2900)
200 (2900)
280 (4060)
280 (4060)
280 (4060)
70.0 (1015)
20.0
28.0
20.0
20.0
28.0
28.0
28.0
7.0
Pressure Control Range
0 to 2537 psig (0 to 175 bar)
0 to 2900 psig (0 to 200 bar)
0 to 1450 psig (0 to 100 bar)
RDH25-EF Series
USA
EURO
JPN
Flow Coef�cient: 21Maximum Inlet Pressure: RDH25-EF— 4060psig (280 bar)Outlet Pressure Control Range: 0 to 2900 psig (0 to 200 bar)
Out
let
Pre
ssur
e, p
sig
Inlet Pressure, psig (bar)

Pressure-Reducing Regulator Flow Curves 187
Integral Pilot-Operated, Dome-Loaded Pressure-Reducing Regulators RD(H)25 Series
For options, additional technical data, materials of construction, and ordering information, see the Swagelok Pressure Regulators, RHPS Series catalog, MS-02-430.
Flow DataThe graphs illustrate the change or “droop” in outlet pressures as the flow rate increases.
For more flow curve information, contact your authorized Swagelok representative.
RD25-EFP Series
Flow Coefficient 21, Pressure Control Ranges 0 to 43.0 psig (0 to 3.0 bar), 0 to 130 psig (0 to 9.0 bar), and 0 to 290 psig (0 to 20.0 bar)
Pressure Control Range:
0 to 290 psig (0 to 20.0 bar)
0 to 130 psig (0 to 9.0 bar)
0 to 43.0 psig (0 to 3.0 bar)
0
100
150
200
300
350
50.0
0 400020001000 5000 6000
0 1000 30002000 4000 5000 6000
0 30001500 4500 6000 7500 9000
16.0
20.0
4.0
12.0
0
8.0
24.0
20.0
4.0
16.0
12.0
0
8.0
0
100
150
200
250
350
300
50.0
0 30001500 4500 6000 7500 9000
1500 45003000 6000 7500 90000
2.0
2.4
1.6
0.8
1.2
0.4
0
250
3000
24.0
Nitrogen Flow, std ft3/min
Out
let
Pre
ssur
e, p
sig
Out
let
Pre
ssur
e, b
arO
utle
t P
ress
ure,
psi
g
Out
let
Pre
ssur
e, b
arO
utle
t P
ress
ure,
MP
a
Nitrogen Flow, std ft3/min
Nitrogen Flow, Nm3/h
Nitrogen Flow, Nm3/h
Nitrogen Flow, Nm3/h
507 (35.0)
507 (35.0)
218 (15.0)
15.0 (218)
15.0 (218)
218 (15.0)
507 (35.0)
35.0 (507)
35.0 (507)
35.0 (507)
3.5
3.51.5
1.5
3.5
218 (15.0)
507 (35.0)
15.0 (218)
35.0 (507)
3.5
1.5
Pressure Control Range
0 to 43.0 psig (0 to 3.0 bar)
0 to 130 psig (0 to 9.0 bar)
0 to 290 psig (0 to 20.0 bar)
RD25-EFP Series
USA
EURO
JPN
Flow Coef�cient: 21Maximum Inlet Pressure: RD25-EFP— 507psig (35.0 bar)Outlet Pressure Control Range: 0 to 290 psig (0 to 20.0 bar)
Nitrogen Flow, std ft3/min
Out
let
Pre
ssur
e, p
sig
Out
let
Pre
ssur
e, b
ar
Nitrogen Flow, Nm3/h
Inlet Pressure, psig (bar)
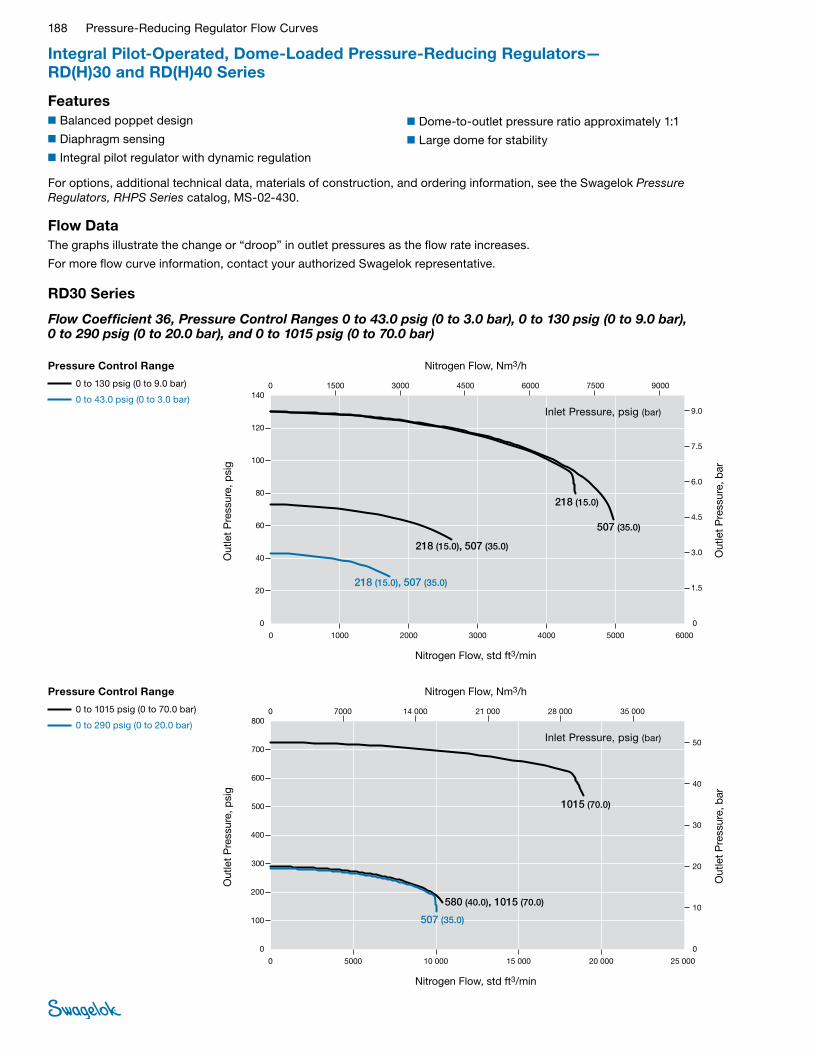
188 Pressure-Reducing Regulator Flow Curves
Features■Balanced poppet design
■Diaphragm sensing
■Integral pilot regulator with dynamic regulation
Integral Pilot-Operated, Dome-Loaded Pressure-Reducing Regulators— RD(H)30 and RD(H)40 Series
For options, additional technical data, materials of construction, and ordering information, see the Swagelok Pressure Regulators, RHPS Series catalog, MS-02-430.
Flow DataThe graphs illustrate the change or “droop” in outlet pressures as the flow rate increases.
For more flow curve information, contact your authorized Swagelok representative.
RD30 Series
Flow Coefficient 36, Pressure Control Ranges 0 to 43.0 psig (0 to 3.0 bar), 0 to 130 psig (0 to 9.0 bar), 0 to 290 psig (0 to 20.0 bar), and 0 to 1015 psig (0 to 70.0 bar)
■Dome-to-outlet pressure ratio approximately 1:1
■Large dome for stability
0
300
500
600
700
800
100
200
400
0 5000 15 00010 000 20 000 25 000
0 5000 15 00010 000 20 000 25 000
0 7000 14 000 21 000 28 000 35 000
40
50
10
30
0
20
50
10
40
30
0
20
0
400
500
600
700
800
300
200
100
0 7000 14 000 21 000 28 000 35 000
7000 14 000 21 000 28 000 35 0000
5.0
2.0
3.0
4.0
1.0
0
Nitrogen Flow, std ft3/min
Out
let
Pre
ssur
e, p
sig
Out
let
Pre
ssur
e, b
arO
utle
t P
ress
ure,
psi
g
Out
let
Pre
ssur
e, b
arO
utle
t P
ress
ure,
MP
a
Nitrogen Flow, std ft3/min
Nitrogen Flow, Nm3/h
Nitrogen Flow, Nm3/h
Nitrogen Flow, Nm3/h
1015 (70.0)
580 (40.0), 1015 (70.0)
507 (35.0)
70.0 (1015)
4.0, 7.0
40.0 (580), 70.0 (1015)
7.0
35.0 (507)
3.5
Pressure Control Range
0 to 290 psig (0 to 20.0 bar)
0 to 1015 psig (0 to 70.0 bar)
RD30 Series
USA
EURO
JPN
Flow Coef�cient: 36Maximum Inlet Pressure: RD30—1015 psig (70.0 bar)Outlet Pressure Control Range: 0 to 1015 psig (0 to 70.0 bar)
Nitrogen Flow, std ft3/min
Out
let
Pre
ssur
e, p
sig
Out
let
Pre
ssur
e, b
ar
Nitrogen Flow, Nm3/h
Inlet Pressure, psig (bar)
Pressure Control Range
0 to 1015 psig (0 to 70.0 bar)
0 to 290 psig (0 to 20.0 bar)
0
60
40
80
100
120
140
20
0 1000 3000 40002000 5000 6000
0 1000 30002000 4000 5000 6000
0 1500 3000 4500 6000 7500 9000
4.5
6.0
7.5
9.0
3.0
0
1.5
9.0
6.0
7.5
4.5
0
3.0
1.5
0
40
60
80
100
120
140
20
0 1500 3000 4500 6000 90007500
0.90
0.60
0.75
0.45
0
0.30
0.15
0 1500 3000 4500 6000 90007500
Nitrogen Flow, std ft3/min
Out
let
Pre
ssur
e, p
sig
Out
let
Pre
ssur
e, b
arO
utle
t P
ress
ure,
psi
g
Out
let
Pre
ssur
e, b
arO
utle
t P
ress
ure,
MP
a
Nitrogen Flow, std ft3/min
Nitrogen Flow, Nm3/h
Nitrogen Flow, Nm3/h
Nitrogen Flow, Nm3/h
218 (15.0), 507 (35.0)
218 (15.0)
218 (15.0), 507 (35.0)
507 (35.0)
15.0 (218), 35.0 (507)
35.0 (507)
15.0 (218)
1.5
1.5, 3.5
3.5
15.0 (218), 35.0 (507)
1.5, 3.5
Pressure Control Range
0 to 43.0 psig (0 to 3.0 bar)
0 to 130 psig (0 to 9.0 bar)
RD30 Series
USA
EURO
JPN
Flow Coef�cient: 36Maximum Inlet Pressure: RD30—507 psig (35.0 bar)Outlet Pressure Control Range: 0 to 130 psig (0 to 9.0 bar)
Nitrogen Flow, std ft3/min
Out
let
Pre
ssur
e, p
sig
Out
let
Pre
ssur
e, b
ar
Nitrogen Flow, Nm3/h
Inlet Pressure, psig (bar)
Pressure Control Range
0 to 130 psig (0 to 9.0 bar)
0 to 43.0 psig (0 to 3.0 bar)

Pressure-Reducing Regulator Flow Curves 189
0
600
400
800
1000
1400
1200
1600
200
0 10 000 30 000 40 00020 000 50 000 60 000
0 10 000 30 00020 000 40 000 50 000 60 000
0 15 000 30 000 45 000 60 000 75 000 90 000
60
80
100
40
0
20
100
80
60
0
40
20
0
600
800
1000
1200
1400
1600
200
400
0 15 000 30 000 45 000 60 000 90 00075 000
10
8.0
6.0
0
4.0
2.0
0 15 000 30 000 45 000 60 000 90 00075 000
Nitrogen Flow, std ft3/min
Out
let
Pre
ssur
e, p
sig
Out
let
Pre
ssur
e, b
arO
utle
t P
ress
ure,
psi
g
Out
let
Pre
ssur
e, b
arO
utle
t P
ress
ure,
MP
a
Nitrogen Flow, std ft3/min
Nitrogen Flow, Nm3/h
Nitrogen Flow, Nm3/h
Nitrogen Flow, Nm3/h
2900 (200), 4060 (280)
2900 (200), 4060 (280)
200 (2900), 280 (4060)
20.0, 28.0
7.0
20.0, 28.0
200 (2900), 280 (4060)
Pressure Control Range
0 to 1450 psig (0 to 100 bar)
RDH30 Series
USA
EURO
JPN
Flow Coef�cient: 36Maximum Inlet Pressure: RDH30—4060 psig (280 bar)Outlet Pressure Control Range: 0 to 1450 psig (0 to 100 bar)
1015 (70.0)
70.0 (1015)
Nitrogen Flow, std ft3/min
Out
let
Pre
ssur
e, p
sig
Out
let
Pre
ssur
e, b
ar
Nitrogen Flow, Nm3/h
Inlet Pressure, psig (bar)
Pressure Control Range
0 to 1450 psig (0 to 100 bar)
Integral Pilot-Operated, Dome-Loaded Pressure-Reducing Regulators— RD(H)30 Series
For options, additional technical data, materials of construction, and ordering information, see the Swagelok Pressure Regulators, RHPS Series catalog, MS-02-430.
Flow DataThe graphs illustrate the change or “droop” in outlet pressures as the flow rate increases.
For more flow curve information, contact your authorized Swagelok representative.
RDH30 Series
Flow Coefficient 36, Pressure Control Ranges 0 to 145 psig (0 to 10.0 bar), 0 to 362 psig (0 to 25.0 bar), and 0 to 1450 psig (0 to 100 bar)
0
150
250
300
350
400
50
100
200
0 4000 60002000 10 0008000 12 000 14 000
0 40002000 6000 10 0008000 12 000 14 000
0 4000 8000 12 000 16 000 20 000
20
25
5.0
15
0
10
25
5.0
20
15
0
10
0
200
250
300
350
400
150
100
50
0 4000 8000 12 000 16 000 20 000
4000 8000 12 000 16 000 20 0000
2.5
1.0
1.5
2.0
0.5
0
Nitrogen Flow, std ft3/min
Out
let
Pre
ssur
e, p
sig
Out
let
Pre
ssur
e, b
arO
utle
t P
ress
ure,
psi
g
Out
let
Pre
ssur
e, b
arO
utle
t P
ress
ure,
MP
a
Nitrogen Flow, std ft3/min
Nitrogen Flow, Nm3/h
Nitrogen Flow, Nm3/h
Nitrogen Flow, Nm3/h
580 (40.0)
70.0 (1015), 200 (2900), 280 (4060)
7.0, 20.0, 28.0
40.0 (580)
4.0
Pressure Control Range
0 to 145 psig (0 to 10.0 bar)
0 to 362 psig (0 to 25.0 bar)
RDH30 Series
USA
EURO
JPN
Flow Coef�cient: 36Maximum Inlet Pressure: RDH30—4060 psig (280 bar)Outlet Pressure Control Range: 0 to 362 psig (0 to 25.0 bar)
580 (40.0), 1015 (70.0), 2900 (200), 4060 (280)
580 (40.0), 1015 (70.0), 2900 (200), 4060 (280)
1015 (70.0), 2900 (200), 4060 (280)
40.0 (580), 70.0 (1015), 200 (2900), 280 (4060)
40.0 (580), 70.0 (1015), 200 (2900), 280 (4060)
4.0, 7.0, 20.0, 28.0
4.0, 7.0, 20.0, 28.0
Nitrogen Flow, std ft3/min
Out
let
Pre
ssur
e, p
sig
Out
let
Pre
ssur
e, b
ar
Nitrogen Flow, Nm3/h
Inlet Pressure, psig (bar)
Pressure Control Range
0 to 362 psig (0 to 25.0 bar)
0 to 145 psig (0 to 10.0 bar)

190 Pressure-Reducing Regulator Flow Curves
0
1000
1500
2000
3000
3500
500
0 80 00040 00020 000 100 000
0 20 000 60 00040 000 80 000 100 000
0 60 00030 000 90 000 120 000 150 000
160
200
40
120
0
80
240
200
40
160
120
0
80
0
1000
1500
2000
2500
3500
3000
500
0 60 00030 000 90 000 120 000 150 000
30 000 90 00060 000 120 000 150 0000
20
24
16
8.0
12
4.0
0
2500
60 000
240
Nitrogen Flow, std ft3/min
Out
let
Pre
ssur
e, p
sig
Out
let
Pre
ssur
e, b
arO
utle
t P
ress
ure,
psi
g
Out
let
Pre
ssur
e, b
arO
utle
t P
ress
ure,
MP
a
Nitrogen Flow, std ft3/min
Nitrogen Flow, Nm3/h
Nitrogen Flow, Nm3/h
Nitrogen Flow, Nm3/h
4060 (280)
2900 (200)
4060 (280)
280 (4060)
200 (2900)
280 (4060)
28.0
20.0
28.0
Pressure Control Range
0 to 2537 psig (0 to 175 bar)
0 to 2900 psig (0 to 200 bar)
RDH30 Series
USA
EURO
JPN
Flow Coef�cient: 36Maximum Inlet Pressure: RDH30—4060 psig (280 bar)Outlet Pressure Control Range: 0 to 2900 psig (0 to 200 bar)
Nitrogen Flow, std ft3/min
Out
let
Pre
ssur
e, p
sig
Out
let
Pre
ssur
e, b
ar
Nitrogen Flow, Nm3/h
Inlet Pressure, psig (bar)
Pressure Control Range
0 to 2900 psig (0 to 200 bar)
0 to 2537 psig (0 to 175 bar)
Integral Pilot-Operated, Dome-Loaded Pressure-Reducing Regulators— RD(H)30 Series
For options, additional technical data, materials of construction, and ordering information, see the Swagelok Pressure Regulators, RHPS Series catalog, MS-02-430.
Flow DataThe graphs illustrate the change or “droop” in outlet pressures as the flow rate increases.
For more flow curve information, contact your authorized Swagelok representative.
RDH30 Series
Flow Coefficient 36, Pressure Control Ranges 0 to 2537 psig (0 to 175 bar) and 0 to 2900 psig (0 to 200 bar)
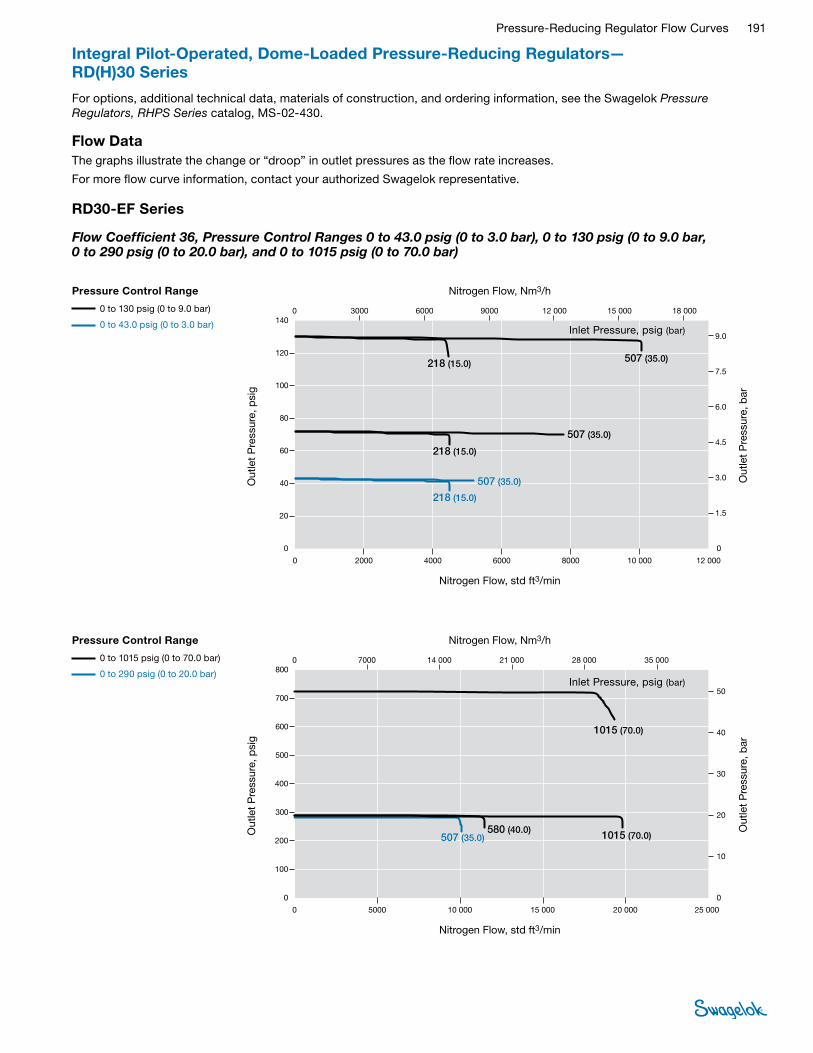
Pressure-Reducing Regulator Flow Curves 191
Integral Pilot-Operated, Dome-Loaded Pressure-Reducing Regulators— RD(H)30 Series
For options, additional technical data, materials of construction, and ordering information, see the Swagelok Pressure Regulators, RHPS Series catalog, MS-02-430.
Flow DataThe graphs illustrate the change or “droop” in outlet pressures as the flow rate increases.
For more flow curve information, contact your authorized Swagelok representative.
RD30-EF Series
Flow Coefficient 36, Pressure Control Ranges 0 to 43.0 psig (0 to 3.0 bar), 0 to 130 psig (0 to 9.0 bar, 0 to 290 psig (0 to 20.0 bar), and 0 to 1015 psig (0 to 70.0 bar)
0
300
500
600
700
800
100
200
400
0 5000 15 00010 000 20 000 25 000
0 5000 15 00010 000 20 000 25 000
0 7000 14 000 21 000 28 000 35 000
40
50
10
30
0
20
50
10
40
30
0
20
0
400
500
600
700
800
300
200
100
0 7000 14 000 21 000 28 000 35 000
7000 14 000 21 000 28 000 35 0000
5.0
2.0
3.0
4.0
1.0
0
Nitrogen Flow, std ft3/min
Out
let
Pre
ssur
e, p
sig
Out
let
Pre
ssur
e, b
arO
utle
t P
ress
ure,
psi
g
Out
let
Pre
ssur
e, b
arO
utle
t P
ress
ure,
MP
a
Nitrogen Flow, std ft3/min
Nitrogen Flow, Nm3/h
Nitrogen Flow, Nm3/h
Nitrogen Flow, Nm3/h
1015 (70.0)
1015 (70.0)580 (40.0)
507 (35.0)
70.0 (1015)
70.0 (1015)
4.0
40.0 (580)
7.0
7.0
35.0 (507)
3.5
Pressure Control Range
0 to 290 psig (0 to 20.0 bar)
0 to 1015 psig (0 to 70.0 bar)
RD30-EF Series
USA
EURO
JPN
Flow Coef�cient: 36Maximum Inlet Pressure: RD30-EF—1015 psig (70.0 bar)Outlet Pressure Control Range: 0 to 1015 psig (0 to 70.0 bar)
Nitrogen Flow, std ft3/min
Out
let
Pre
ssur
e, p
sig
Out
let
Pre
ssur
e, b
ar
Nitrogen Flow, Nm3/h
Inlet Pressure, psig (bar)
Pressure Control Range
0 to 1015 psig (0 to 70.0 bar)
0 to 290 psig (0 to 20.0 bar)
0
60
40
80
100
120
140
20
0 2000 6000 80004000 10 000 12 000
0 2000 60004000 8000 10 000 12 000
0 3000 6000 9000 12 000 15 000 18 000
4.5
6.0
7.5
9.0
3.0
0
1.5
9.0
6.0
7.5
4.5
0
3.0
1.5
0
40
60
80
100
120
140
20
0 3000 6000 9000 12 000 18 00015 000
0.90
0.60
0.75
0.45
0
0.30
0.15
0 3000 6000 9000 12 000 18 00015 000
Nitrogen Flow, std ft3/min
Out
let
Pre
ssur
e, p
sig
Out
let
Pre
ssur
e, b
arO
utle
t P
ress
ure,
psi
g
Out
let
Pre
ssur
e, b
arO
utle
t P
ress
ure,
MP
a
Nitrogen Flow, std ft3/min
Nitrogen Flow, Nm3/h
Nitrogen Flow, Nm3/h
Nitrogen Flow, Nm3/h
218 (15.0)
218 (15.0)
218 (15.0)
507 (35.0)
507 (35.0)
15.0 (218)
35.0 (507)
35.0 (507)
15.0 (218)
15.0 (218)
1.5
1.5
1.5
3.5
3.5
3.5
Pressure Control Range
0 to 43.0 psig (0 to 3.0 bar)
0 to 130 psig (0 to 9.0 bar)
RD30-EF Series
USA
EURO
JPN
Flow Coef�cient: 36Maximum Inlet Pressure: RD30-EF—507 psig (35.0 bar)Outlet Pressure Control Range: 0 to 130 psig (0 to 9.0 bar)
507 (35.0)
35.0 (507)
Nitrogen Flow, std ft3/min
Out
let
Pre
ssur
e, p
sig
Out
let
Pre
ssur
e, b
ar
Nitrogen Flow, Nm3/h
Inlet Pressure, psig (bar)
Pressure Control Range
0 to 130 psig (0 to 9.0 bar)
0 to 43.0 psig (0 to 3.0 bar)
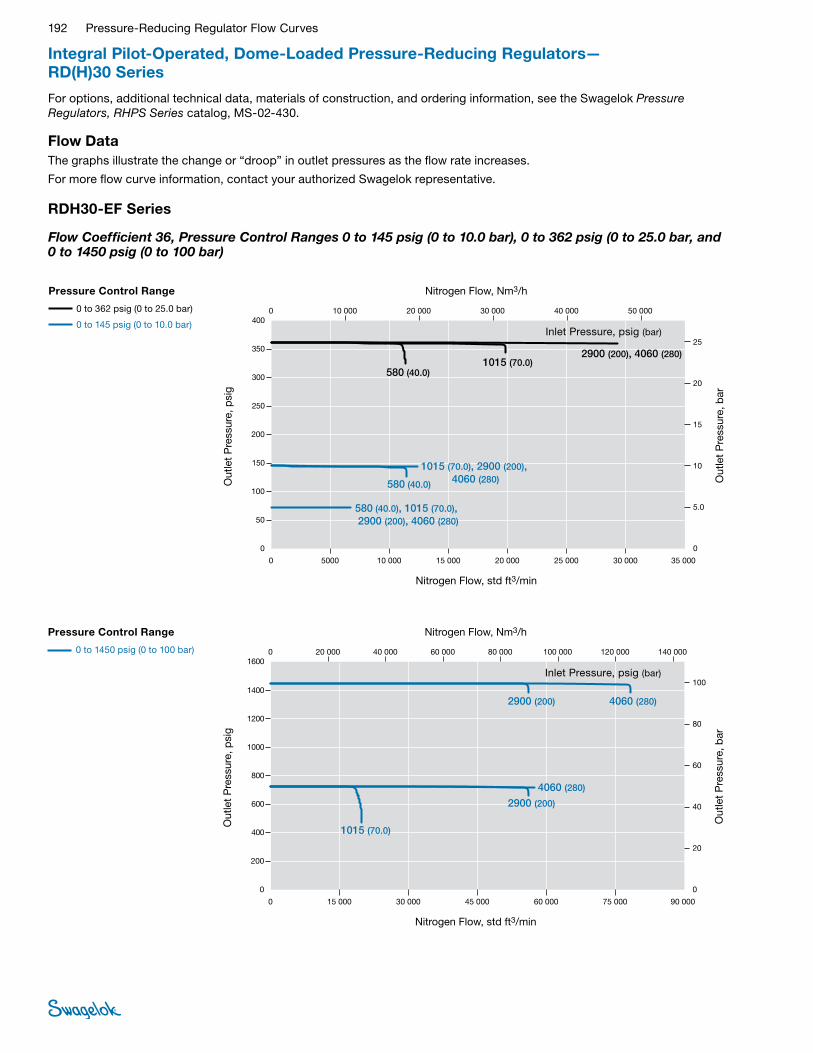
192 Pressure-Reducing Regulator Flow Curves
Integral Pilot-Operated, Dome-Loaded Pressure-Reducing Regulators— RD(H)30 Series
For options, additional technical data, materials of construction, and ordering information, see the Swagelok Pressure Regulators, RHPS Series catalog, MS-02-430.
Flow DataThe graphs illustrate the change or “droop” in outlet pressures as the flow rate increases.
For more flow curve information, contact your authorized Swagelok representative.
RDH30-EF Series
Flow Coefficient 36, Pressure Control Ranges 0 to 145 psig (0 to 10.0 bar), 0 to 362 psig (0 to 25.0 bar, and 0 to 1450 psig (0 to 100 bar)
0
600
400
800
1000
1400
1200
1600
200
0 15 000 45 000 60 00030 000 75 000 90 000
0 15 000 45 00030 000 60 000 75 000 90 000
0 20 000 40 000 60 000 80 000 100 000 140 000120 000
60
80
100
40
0
20
100
80
60
0
40
20
0
600
800
1000
1200
1400
1600
200
400
0 20 000 40 000 60 000 80 000 120 000 140 000100 000
10
8.0
6.0
0
4.0
2.0
0 20 000 40 000 60 000 80 000 120 000 140 000100 000
Nitrogen Flow, std ft3/min
Out
let
Pre
ssur
e, p
sig
Out
let
Pre
ssur
e, b
arO
utle
t P
ress
ure,
psi
g
Out
let
Pre
ssur
e, b
arO
utle
t P
ress
ure,
MP
a
Nitrogen Flow, std ft3/min
Nitrogen Flow, Nm3/h
Nitrogen Flow, Nm3/h
Nitrogen Flow, Nm3/h
4060 (280) 2900 (200)
4060 (280)
2900 (200)
200 (2900)
200 (2900)
7.0
28.0
28.0
20.0
20.0
280 (4060)
280 (4060)
Pressure Control Range
0 to 1450 psig (0 to 100 bar)
RDH30-EF Series
USA
EURO
JPN
Flow Coef�cient: 36Maximum Inlet Pressure: RDH30-EF—4060 psig (280 bar)Outlet Pressure Control Range: 0 to 1450 psig (0 to 100 bar)
1015 (70.0)
70.0 (1015)
Nitrogen Flow, std ft3/min
Out
let
Pre
ssur
e, p
sig
Out
let
Pre
ssur
e, b
ar
Nitrogen Flow, Nm3/h
Inlet Pressure, psig (bar)
Pressure Control Range
0 to 1450 psig (0 to 100 bar)
0
150
250
300
350
400
50
100
200
0 10 000 15 0005000 25 00020 000 30 000 35 000
0 10 0005000 15 000 25 00020 000 30 000 35 000
0 10 000 20 000 30 000 40 000 50 000
20
25
5.0
15
0
10
25
5.0
20
15
0
10
0
200
250
300
350
400
150
100
50
0 10 000 20 000 30 000 40 000 50 000
10 000 20 000 30 000 40 000 50 0000
2.5
1.0
1.5
2.0
0.5
0
Nitrogen Flow, std ft3/min
Out
let
Pre
ssur
e, p
sig
Out
let
Pre
ssur
e, b
arO
utle
t P
ress
ure,
psi
g
Out
let
Pre
ssur
e, b
arO
utle
t P
ress
ure,
MP
a
Nitrogen Flow, std ft3/min
Nitrogen Flow, Nm3/h
Nitrogen Flow, Nm3/h
Nitrogen Flow, Nm3/h
580 (40.0)
200 (2900), 280 (4060)
20.0, 28.0
40.0 (580)
4.0
Pressure Control Range
0 to 145 psig (0 to 10.0 bar)
0 to 362 psig (0 to 25.0 bar)
RDH30-EF Series
USA
EURO
JPN
Flow Coef�cient: 36Maximum Inlet Pressure: RDH30-EF—4060 psig (280 bar)Outlet Pressure Control Range: 0 to 362 psig (0 to 25.0 bar)
580 (40.0), 1015 (70.0), 2900 (200), 4060 (280)
1015 (70.0), 2900 (200), 4060 (280)
2900 (200), 4060 (280)
70.0 (1015), 200 (2900), 280 (4060)
40.0 (580), 70.0 (1015), 200 (2900), 280 (4060)
7.0, 20.0, 28.0
4.0, 7.0, 20.0, 28.0
1015 (70.0)
580 (40.0)
70.0 (1015)
40.0 (580)
7.0
4.0
Nitrogen Flow, std ft3/min
Out
let
Pre
ssur
e, p
sig
Out
let
Pre
ssur
e, b
ar
Nitrogen Flow, Nm3/h
Inlet Pressure, psig (bar)
Pressure Control Range
0 to 362 psig (0 to 25.0 bar)
0 to 145 psig (0 to 10.0 bar)
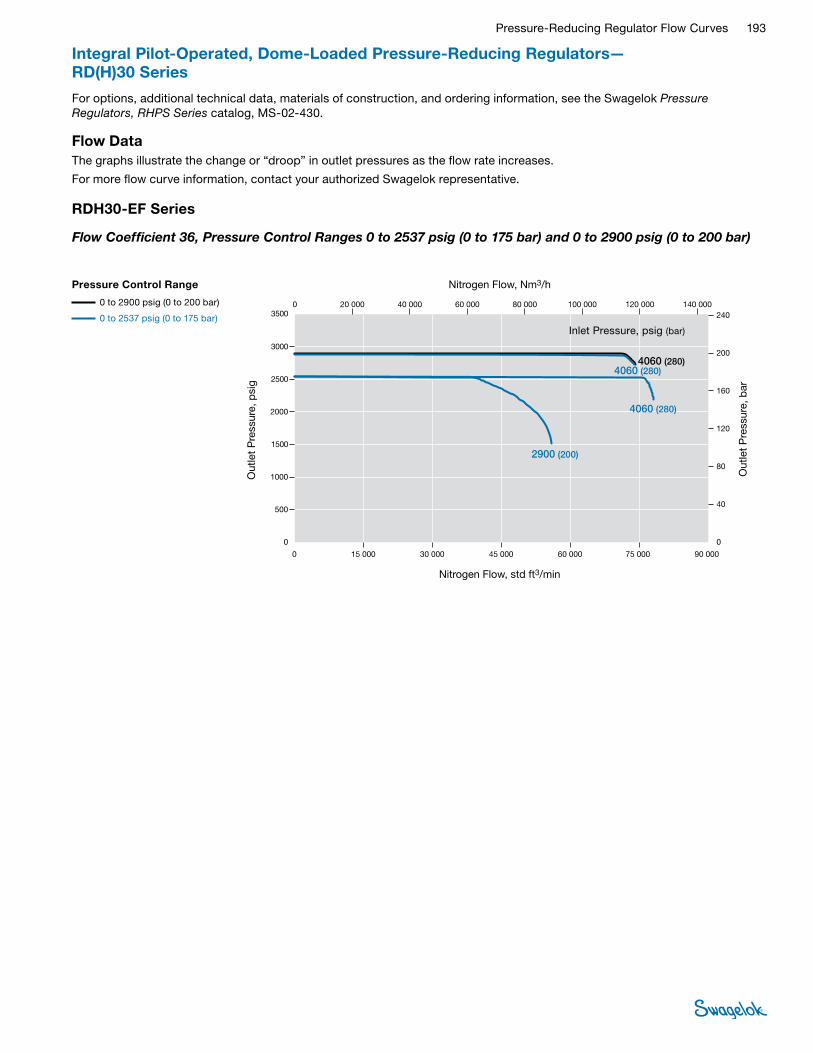
Pressure-Reducing Regulator Flow Curves 193
Integral Pilot-Operated, Dome-Loaded Pressure-Reducing Regulators— RD(H)30 Series
For options, additional technical data, materials of construction, and ordering information, see the Swagelok Pressure Regulators, RHPS Series catalog, MS-02-430.
Flow DataThe graphs illustrate the change or “droop” in outlet pressures as the flow rate increases.
For more flow curve information, contact your authorized Swagelok representative.
RDH30-EF Series
Flow Coefficient 36, Pressure Control Ranges 0 to 2537 psig (0 to 175 bar) and 0 to 2900 psig (0 to 200 bar)
0
1500
2500
3000
3500
500
1000
2000
0 15 000 45 00030 000 60 000 90 000 75 000
0 15 000 45 00030 000 60 000 90 00075 000
0 40 00020 000 60 000 80 000 100 000 140 000120 000240
40
80
160
200
0
120
200
240
40
160
120
0
80
0
2000
2500
3000
3500
1500
1000
500
0 20 000 40 000 60 000 80 000 140 000120 000100 000
20 000 40 000 60 000 80 000 140 000120 000100 000
20
24
4.0
16
12
0
8.0
0
4060 (280)4060 (280)
4060 (280)
2900 (200)
Nitrogen Flow, std ft3/min
Out
let
Pre
ssur
e, p
sig
Out
let
Pre
ssur
e, b
arO
utle
t P
ress
ure,
psi
g
Out
let
Pre
ssur
e, b
arO
utle
t P
ress
ure,
MP
a
Nitrogen Flow, std ft3/min
Nitrogen Flow, Nm3/h
Nitrogen Flow, Nm3/h
Nitrogen Flow, Nm3/h
Pressure Control Range
0 to 2900 psig (0 to 200 bar)
0 to 2537 psig (0 to 175 bar)
RDH30-EF Series
USA
EURO
JPN
Flow Coef�cient: 36Maximum Inlet Pressure: RDH30-EF—4060 psig (280 bar)Outlet Pressure Control Range: 0 to 2900 psig (0 to 200 bar)
280 (4060)
280 (4060)
280 (4060)
200 (2900)
28.028.0
28.0
20.0
Nitrogen Flow, std ft3/min
Out
let
Pre
ssur
e, p
sig
Out
let
Pre
ssur
e, b
ar
Nitrogen Flow, Nm3/h
Inlet Pressure, psig (bar)
Pressure Control Range
0 to 2900 psig (0 to 200 bar)
0 to 2537 psig (0 to 175 bar)
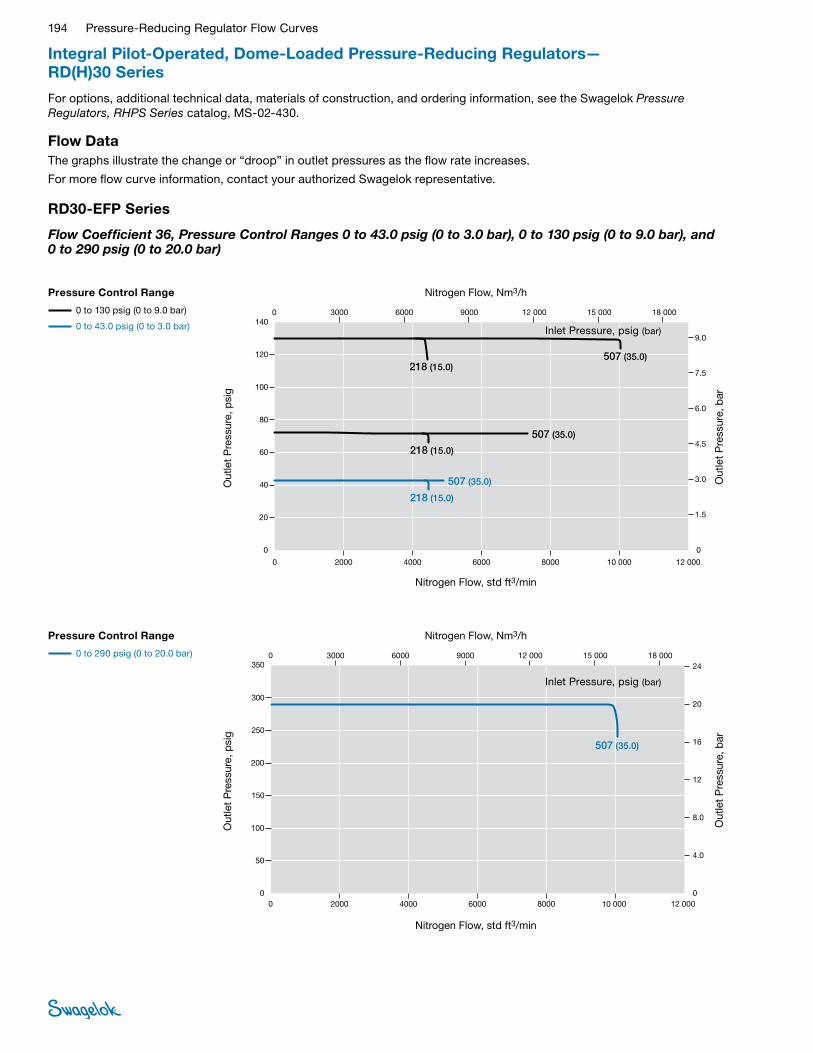
194 Pressure-Reducing Regulator Flow Curves
Integral Pilot-Operated, Dome-Loaded Pressure-Reducing Regulators— RD(H)30 Series
For options, additional technical data, materials of construction, and ordering information, see the Swagelok Pressure Regulators, RHPS Series catalog, MS-02-430.
Flow DataThe graphs illustrate the change or “droop” in outlet pressures as the flow rate increases.
For more flow curve information, contact your authorized Swagelok representative.
RD30-EFP Series
Flow Coefficient 36, Pressure Control Ranges 0 to 43.0 psig (0 to 3.0 bar), 0 to 130 psig (0 to 9.0 bar), and 0 to 290 psig (0 to 20.0 bar)
0
150
250
300
350
50
100
200
0 2000 60004000 8000 12 000 10 000
0 2000 60004000 8000 12 00010 000
0 3000 6000 9000 12 000 18 00015 00024
4.0
8.0
16
20
0
12
20
24
4.0
16
12
0
8.0
0
200
250
300
350
150
100
50
0 3000 6000 9000 12 000 18 00015 000
2.0
2.4
0.4
1.6
1.2
0
0.8
0 3000 6000 9000 12 000 18 00015 000
Nitrogen Flow, std ft3/min
Out
let
Pre
ssur
e, p
sig
Out
let
Pre
ssur
e, b
arO
utle
t P
ress
ure,
psi
g
Out
let
Pre
ssur
e, b
arO
utle
t P
ress
ure,
MP
a
Nitrogen Flow, std ft3/min
Nitrogen Flow, Nm3/h
Nitrogen Flow, Nm3/h
Nitrogen Flow, Nm3/h
507 (35.0)
Pressure Control Range
0 to 290 psig (0 to 20.0 bar)
RD30-EFP Series
USA
EURO
JPN
Flow Coef�cient: 36Maximum Inlet Pressure: RD30-EFP—507 psig (35.0 bar)Outlet Pressure Control Range: 0 to 290 psig (0 to 20.0 bar)
35.0 (507)
3.5
Nitrogen Flow, std ft3/min
Out
let
Pre
ssur
e, p
sig
Out
let
Pre
ssur
e, b
ar
Nitrogen Flow, Nm3/h
Inlet Pressure, psig (bar)
Pressure Control Range
0 to 290 psig (0 to 20.0 bar)
0
60
40
80
100
120
140
20
0 2000 6000 80004000 10 000 12 000
0 2000 60004000 8000 10 000 12 000
0 3000 6000 9000 12 000 15 000 18 000
4.5
6.0
7.5
9.0
3.0
0
1.5
9.0
6.0
7.5
4.5
0
3.0
1.5
0
40
60
80
100
120
140
20
0 3000 6000 9000 12 000 18 00015 000
0.90
0.60
0.75
0.45
0
0.30
0.15
0 3000 6000 9000 12 000 18 00015 000
Nitrogen Flow, std ft3/min
Out
let
Pre
ssur
e, p
sig
Out
let
Pre
ssur
e, b
arO
utle
t P
ress
ure,
psi
g
Out
let
Pre
ssur
e, b
arO
utle
t P
ress
ure,
MP
a
Nitrogen Flow, std ft3/min
Nitrogen Flow, Nm3/h
Nitrogen Flow, Nm3/h
Nitrogen Flow, Nm3/h
218 (15.0)
218 (15.0)
218 (15.0)
507 (35.0)
507 (35.0)
15.0 (218)
35.0 (507)
35.0 (507)
15.0 (218)
15.0 (218)
1.5
1.5
1.5
3.5
3.5
3.5
Pressure Control Range
0 to 43.0 psig (0 to 3.0 bar)
0 to 130 psig (0 to 9.0 bar)
RD30-EFP Series
USA
EURO
JPN
Flow Coef�cient: 36Maximum Inlet Pressure: RD30-EFP—507 psig (35.0 bar)Outlet Pressure Control Range: 0 to 130 psig (0 to 9.0 bar)
507 (35.0)
35.0 (507)
Nitrogen Flow, std ft3/min
Out
let
Pre
ssur
e, p
sig
Out
let
Pre
ssur
e, b
ar
Nitrogen Flow, Nm3/h
Inlet Pressure, psig (bar)
Pressure Control Range
0 to 130 psig (0 to 9.0 bar)
0 to 43.0 psig (0 to 3.0 bar)

Pressure-Reducing Regulator Flow Curves 195
Features■Balanced poppet design
■Diaphragm sensing
■Integral pilot regulator with dynamic regulation
Integral Pilot-Operated, Dome-Loaded Pressure-Reducing Regulators— RD(H)40 Series
For options, additional technical data, materials of construction, and ordering information, see the Swagelok Pressure Regulators, RHPS Series catalog, MS-02-430.
Flow DataThe graphs illustrate the change or “droop” in outlet pressures as the flow rate increases.
For more flow curve information, contact your authorized Swagelok representative.
RD40 Series
Flow Coefficient 36, Pressure Control Ranges 0 to 43.0 psig (0 to 3.0 bar), 0 to 130 psig (0 to 9.0 bar), 0 to 290 psig (0 to 20.0 bar), and 0 to 1015 psig (0 to 70.0 bar)
■Dome-to-outlet pressure ratio approximately 1:1
■Large dome for stability
0
300
500
600
700
800
100
200
400
0 12 000 18 0006000 30 00024 000 36 000 42 000
0 12 0006000 18 000 30 00024 000 36 000 42 000
0 10 000 20 000 30 000 40 000 60 00050 000
40
50
10
30
0
20
50
10
40
30
0
20
0
400
500
600
700
800
300
200
100
0 10 000 20 000 30 000 40 000 60 00050 000
10 000 20 000 30 000 40 000 60 00050 0000
5.0
2.0
3.0
4.0
1.0
0
Nitrogen Flow, std ft3/min
Out
let
Pre
ssur
e, p
sig
Out
let
Pre
ssur
e, b
arO
utle
t P
ress
ure,
psi
g
Out
let
Pre
ssur
e, b
arO
utle
t P
ress
ure,
MP
a
Nitrogen Flow, std ft3/min
Nitrogen Flow, Nm3/h
Nitrogen Flow, Nm3/h
Nitrogen Flow, Nm3/h
Pressure Control Range
0 to 290 psig (0 to 20.0 bar)
0 to 1015 psig (0 to 70.0 bar)
RD40 Series
USA
EURO
JPN
Flow Coef�cient: 73Maximum Inlet Pressure: RD40—1015 psig (70.0 bar)Outlet Pressure Control Range: 0 to 1015 psig (0 to 70.0 bar)
580 (40.0), 1015 (70.0)
40.0 (580), 70.0 (1015)
4.0, 7.0
1015 (70.0)
507 (35.0)
70.0 (1015)
35.0 (507)
7.0
3.5
Nitrogen Flow, std ft3/min
Out
let
Pre
ssur
e, p
sig
Out
let
Pre
ssur
e, b
ar
Nitrogen Flow, Nm3/h
Inlet Pressure, psig (bar)
Pressure Control Range
0 to 1015 psig (0 to 70.0 bar)
0 to 290 psig (0 to 20.5 bar)
Pressure Control Range
0 to 130 psig (0 to 9.0 bar)
0 to 43.0 psig (0 to 3.0 bar)
0
40
60
80
120
140
20
0 800040002000 10 000
0 2000 60004000 8000 10 000
0 60003000 9000 12 000 15 000
6.0
7.5
1.5
4.5
0
3.0
9.0
7.5
1.5
6.0
4.5
0
3.0
0
40
60
80
100
140
120
20
0 60003000 9000 12 000 15 000
100
6000
9.0
0.90
0.75
0.15
0.60
0.45
0
0.30
0 60003000 9000 12 000 15 000
Nitrogen Flow, std ft3/min
Out
let
Pre
ssur
e, p
sig
Out
let
Pre
ssur
e, b
arO
utle
t P
ress
ure,
psi
g
Out
let
Pre
ssur
e, b
arO
utle
t P
ress
ure,
MP
a
Nitrogen Flow, std ft3/min
Nitrogen Flow, Nm3/h
Nitrogen Flow, Nm3/h
Nitrogen Flow, Nm3/h
218 (15.0), 507 (35.0)
218 (15.0), 507 (35.0)
218 (15.0), 507 (35.0)
15.0 (218), 35.0 (507)
15.0 (218), 35.0 (507)
15.0 (218), 35.0 (507)
1.5, 3.5
1.5, 3.5
1.5, 3.5
Pressure Control Range
0 to 43.0 psig (0 to 3.0 bar)
0 to 130 psig (0 to 9.0 bar)
RD40 Series
USA
EURO
JPN
Flow Coef�cient: 73Maximum Inlet Pressure: RD40—507 psig (35.0 bar)Outlet Pressure Control Range: 0 to 130 psig (0 to 9.0 bar)
Nitrogen Flow, std ft3/min
Out
let
Pre
ssur
e, p
sig
Out
let
Pre
ssur
e, b
ar
Nitrogen Flow, Nm3/h
Inlet Pressure, psig (bar)

196 Pressure-Reducing Regulator Flow Curves
Integral Pilot-Operated, Dome-Loaded Pressure-Reducing Regulators— RD(H)40 Series
For options, additional technical data, materials of construction, and ordering information, see the Swagelok Pressure Regulators, RHPS Series catalog, MS-02-430.
Flow DataThe graphs illustrate the change or “droop” in outlet pressures as the flow rate increases.
For more flow curve information, contact your authorized Swagelok representative.
RDH40 Series
Flow Coefficient 36, Pressure Control Ranges 0 to 145 psig (0 to 10.0 bar), 0 to 362 psig (0 to 25.0 bar), and 0 to 1450 psig (0 to 100 bar)
Pressure Control Range
0 to 1450 psig (0 to 100 bar)
0
600
1000
1200
1400
1600
200
400
800
0 16 000 48 00032 000 64 000 80 000
0 16 000 48 00032 000 64 000 80 000
0 24 000 48 000 72 000 96 000 120 000
100
20
40
80
0
60
100
20
80
60
0
40
0
800
1000
1200
1400
1600
600
400
200
0 24 000 48 000 72 000 96 000 120 000
24 000 48 000 72 000 96 000 120 0000
10
4.0
6.0
8.0
2.0
0
Nitrogen Flow, std ft3/min
Out
let
Pre
ssur
e, p
sig
Out
let
Pre
ssur
e, b
arO
utle
t P
ress
ure,
psi
g
Out
let
Pre
ssur
e, b
arO
utle
t P
ress
ure,
MP
a
Nitrogen Flow, std ft3/min
Nitrogen Flow, Nm3/h
Nitrogen Flow, Nm3/h
Nitrogen Flow, Nm3/h
1015 (70.0)
Pressure Control Range
0 to 1450 psig (0 to 100 bar)
RDH40 Series
USA
EURO
JPN
Flow Coef�cient: 73Maximum Inlet Pressure: RDH40—4060 psig (280 bar)Outlet Pressure Control Range: 0 to 1450 psig (0 to 100 bar)
2900 (200), 4060 (280)
2900 (200), 4060 (280)
70.0 (1015)
200 (2900), 280 (4060)
200 (2900), 280 (4060)
7.0
20.0, 28.0
20.0, 28.0
Nitrogen Flow, std ft3/min
Out
let
Pre
ssur
e, p
sig
Out
let
Pre
ssur
e, b
ar
Nitrogen Flow, Nm3/h
Inlet Pressure, psig (bar)
0
150
250
300
350
400
50
100
200
0 4000 12 0008000 16 000 20 000
0 4000 12 0008000 16 000 20 000
0 5000 10 000 15 000 20 000 25 000 30 000
20
25
5.0
15
0
10
25
5.0
20
15
0
10
0
200
250
300
350
400
150
100
50
0 5000 10 000 15 000 20 000 25 000 30 000
5000 10 000 15 000 20 000 25 000 30 0000
2.5
1.0
1.5
2.0
0.5
0
Nitrogen Flow, std ft3/min
Out
let
Pre
ssur
e, p
sig
Out
let
Pre
ssur
e, b
arO
utle
t P
ress
ure,
psi
g
Out
let
Pre
ssur
e, b
arO
utle
t P
ress
ure,
MP
a
Nitrogen Flow, std ft3/min
Nitrogen Flow, Nm3/h
Nitrogen Flow, Nm3/h
Nitrogen Flow, Nm3/h
Pressure Control Range
0 to 362 psig (0 to 25.0 bar)
0 to 145 psig (0 to 10.0 bar)
RDH40 Series
USA
EURO
JPN
Flow Coef�cient: 73Maximum Inlet Pressure: RDH40—4060 psig (280 bar)Outlet Pressure Control Range: 0 to 362 psig (0 to 25.0 bar)
580 (40.0), 1015 (70.0), 2900 (200), 4060 (280)
580 (40.0), 1015 (70.0), 2900 (200), 4060 (280)
580 (40.0), 1015 (70.0), 2900 (200), 4060 (280)
40.0 (580), 70.0 (1015), 200 (2900), 280 (4060)
40.0 (580), 70.0 (1015), 200 (2900), 280 (4060)
40.0 (580), 70.0 (1015), 200 (2900), 280 (4060)
4.0, 7.0, 20.0, 28.0
4.0, 7.0, 20.0, 28.0
4.0, 7.0, 20.0, 28.0
Nitrogen Flow, std ft3/min
Out
let
Pre
ssur
e, p
sig
Out
let
Pre
ssur
e, b
ar
Nitrogen Flow, Nm3/h
Inlet Pressure, psig (bar)
Pressure Control Range
0 to 362 psig (0 to 25.0 bar)
0 to 145 psig (0 to 10.0 bar)

Pressure-Reducing Regulator Flow Curves 197
Integral Pilot-Operated, Dome-Loaded Pressure-Reducing Regulators— RD(H)40 Series
For options, additional technical data, materials of construction, and ordering information, see the Swagelok Pressure Regulators, RHPS Series catalog, MS-02-430.
Flow DataThe graphs illustrate the change or “droop” in outlet pressures as the flow rate increases.
For more flow curve information, contact your authorized Swagelok representative.
RDH40 Series
Flow Coefficient 36, Pressure Control Ranges 0 to 2537 psig (0 to 175 bar) and 0 to 2900 psig (0 to 200 bar)
0
40
60
80
120
140
20
0 16 00080004000 20 000
0 4000 12 0008000 16 000 20 000
0 10 0005000 15 000 20 000 25 000 30 000
6.0
7.5
1.5
4.5
0
3.0
9.0
7.5
1.5
6.0
4.5
0
3.0
0
40
60
80
100
140
120
20
0 15 00010 0005000 20 000 25 000 30 000
100
12 000
9.0
0.90
0.75
0.15
0.60
0.45
0
0.30
0 15 00010 0005000 20 000 25 000 30 000
Nitrogen Flow, std ft3/min
Out
let
Pre
ssur
e, p
sig
Out
let
Pre
ssur
e, b
arO
utle
t P
ress
ure,
psi
g
Out
let
Pre
ssur
e, b
arO
utle
t P
ress
ure,
MP
a
Nitrogen Flow, std ft3/min
Nitrogen Flow, Nm3/h
Nitrogen Flow, Nm3/h
Nitrogen Flow, Nm3/h
507 (35.0)
507 (35.0)
218 (15.0)
218 (15.0)
218 (15.0)
507 (35.0)
35.0 (507)
35.0 (507)
35.0 (507)
15.0 (218)
15.0 (218)
15.0 (218)
3.5
3.5
1.5
1.5
1.53.5
Pressure Control Range
0 to 43.0 psig (0 to 3.0 bar)
0 to 130 psig (0 to 9.0 bar)
RD40-EF Series
USA
EURO
JPN
Flow Coef�cient: 73Maximum Inlet Pressure: RD40-EF—507 psig (35.0 bar)Outlet Pressure Control Range: 0 to 130 psig (0 to 9.0 bar)
Nitrogen Flow, std ft3/min
Out
let
Pre
ssur
e, p
sig
Out
let
Pre
ssur
e, b
ar
Nitrogen Flow, Nm3/h
Inlet Pressure, psig (bar)
Pressure Control Range
0 to 130 psig (0 to 9.0 bar)
0 to 43.0 psig (0 to 3.0 bar)
RD40-EF Series
Flow Coefficient 36, Pressure Control Ranges 0 to 43.0 psig (0 to 3.0 bar) and 0 to 130 psig (0 to 9.0 bar)
0
1000
1500
2000
3000
3500
500
0 120 00060 00030 000 150 000
0 30 000 90 00060 000 120 000 150 000
0 80 00040 000 120 000 160 000 200 000
160
200
40
120
0
80
240
200
40
160
120
0
80
0
1000
1500
2000
2500
3500
3000
500
0 80 00040 000 120 000 160 000 200 000
40 000 120 00080 000 160 000 200 0000
20
24
16
8.0
12
4.0
0
2500
90 000
240
Nitrogen Flow, std ft3/min
Out
let
Pre
ssur
e, p
sig
Out
let
Pre
ssur
e, b
arO
utle
t P
ress
ure,
psi
g
Out
let
Pre
ssur
e, b
arO
utle
t P
ress
ure,
MP
a
Nitrogen Flow, std ft3/min
Nitrogen Flow, Nm3/h
Nitrogen Flow, Nm3/h
Nitrogen Flow, Nm3/h
4060 (280)2900 (200)
4060 (280)
280 (4060)200 (2900)
280 (4060)
28.020.0
28.0
Pressure Control Range
0 to 2900 psig (0 to 200 bar)
0 to 2537 psig (0 to 175 bar)
RDH40 Series
USA
EURO
JPN
Flow Coef�cient: 73Maximum Inlet Pressure: RDH40— 4060psig (280 bar)Outlet Pressure Control Range: 0 to 2900 psig (0 to 200 bar)
Nitrogen Flow, std ft3/min
Out
let
Pre
ssur
e, p
sig
Out
let
Pre
ssur
e, b
ar
Nitrogen Flow, Nm3/h
Inlet Pressure, psig (bar)
Pressure Control Range
0 to 2900 psig (0 to 200 bar)
0 to 2537 psig (0 to 175 bar)
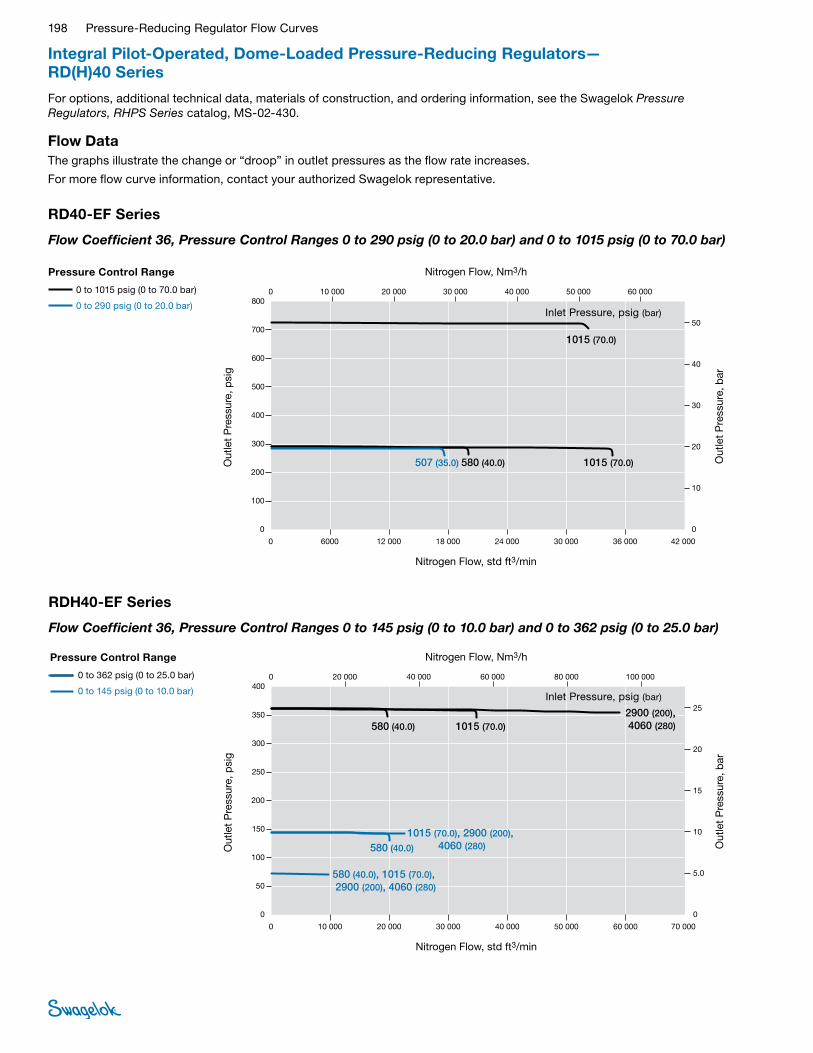
198 Pressure-Reducing Regulator Flow Curves
Pressure Control Range
0 to 1015 psig (0 to 70.0 bar)
0 to 290 psig (0 to 20.0 bar)
0
300
500
600
700
800
100
200
400
0 12 000 18 0006000 30 00024 000 36 000 42 000
0 12 0006000 18 000 30 00024 000 36 000 42 000
0 10 000 20 000 30 000 40 000 60 00050 000
40
50
10
30
0
20
50
10
40
30
0
20
0
400
500
600
700
800
300
200
100
0 10 000 20 000 30 000 40 000 60 00050 000
10 000 20 000 30 000 40 000 60 00050 0000
5.0
2.0
3.0
4.0
1.0
0
Nitrogen Flow, std ft3/min
Out
let
Pre
ssur
e, p
sig
Out
let
Pre
ssur
e, b
arO
utle
t P
ress
ure,
psi
g
Out
let
Pre
ssur
e, b
arO
utle
t P
ress
ure,
MP
a
Nitrogen Flow, std ft3/min
Nitrogen Flow, Nm3/h
Nitrogen Flow, Nm3/h
Nitrogen Flow, Nm3/h
Pressure Control Range
0 to 290 psig (0 to 20.0 bar)
0 to 1015 psig (0 to 70.0 bar)
RD40-EF Series
USA
EURO
JPN
Flow Coef�cient: 73Maximum Inlet Pressure: RD40-EF—1015 psig (70.0 bar)Outlet Pressure Control Range: 0 to 1015 psig (0 to 70.0 bar)
580 (40.0)
40.0 (580)
4.0
1015 (70.0)
1015 (70.0)507 (35.0)
70.0 (1015)
70.0 (1015)35.0 (507)
7.0
7.03.5
Nitrogen Flow, std ft3/min
Out
let
Pre
ssur
e, p
sig
Out
let
Pre
ssur
e, b
ar
Nitrogen Flow, Nm3/h
Inlet Pressure, psig (bar)
RD40-EF Series
Flow Coefficient 36, Pressure Control Ranges 0 to 290 psig (0 to 20.0 bar) and 0 to 1015 psig (0 to 70.0 bar)
Integral Pilot-Operated, Dome-Loaded Pressure-Reducing Regulators— RD(H)40 Series
For options, additional technical data, materials of construction, and ordering information, see the Swagelok Pressure Regulators, RHPS Series catalog, MS-02-430.
Flow DataThe graphs illustrate the change or “droop” in outlet pressures as the flow rate increases.
For more flow curve information, contact your authorized Swagelok representative.
RDH40-EF Series
Flow Coefficient 36, Pressure Control Ranges 0 to 145 psig (0 to 10.0 bar) and 0 to 362 psig (0 to 25.0 bar)
Pressure Control Range
0 to 362 psig (0 to 25.0 bar)
0 to 145 psig (0 to 10.0 bar)
0
150
250
300
350
400
50
100
200
0 20 000 30 00010 000 50 00040 000 60 000 70 000
0 20 00010 000 30 000 50 00040 000 60 000 70 000
0 20 000 40 000 60 000 80 000 100 000
20
25
5.0
15
0
10
25
5.0
20
15
0
10
0
200
250
300
350
400
150
100
50
0 20 000 40 000 60 000 80 000 100 000
20 000 40 000 60 000 80 000 100 0000
2.5
1.0
1.5
2.0
0.5
0
Nitrogen Flow, std ft3/min
Out
let
Pre
ssur
e, p
sig
Out
let
Pre
ssur
e, b
arO
utle
t P
ress
ure,
psi
g
Out
let
Pre
ssur
e, b
arO
utle
t P
ress
ure,
MP
a
Nitrogen Flow, std ft3/min
Nitrogen Flow, Nm3/h
Nitrogen Flow, Nm3/h
Nitrogen Flow, Nm3/h
580 (40.0)
200 (2900), 280 (4060)
20.0, 28.0
40.0 (580)
4.0 7.0
Pressure Control Range
0 to 145 psig (0 to 10.0 bar)
0 to 362 psig (0 to 25.0 bar)
RDH40-EF Series
USA
EURO
JPN
Flow Coef�cient: 73Maximum Inlet Pressure: RDH40-EF—4060 psig (280 bar)Outlet Pressure Control Range: 0 to 362 psig (0 to 25.0 bar)
580 (40.0), 1015 (70.0), 2900 (200), 4060 (280)
1015 (70.0), 2900 (200), 4060 (280)
2900 (200), 4060 (280)
70.0 (1015), 200 (2900), 280 (4060)
40.0 (580), 70.0 (1015), 200 (2900), 280 (4060)
7.0, 20.0, 28.0
4.0, 7.0, 20.0, 28.0
1015 (70.0)
580 (40.0)
4.0
70.0 (1015)
40.0 (580)
Nitrogen Flow, std ft3/min
Out
let
Pre
ssur
e, p
sig
Out
let
Pre
ssur
e, b
ar
Nitrogen Flow, Nm3/h
Inlet Pressure, psig (bar)
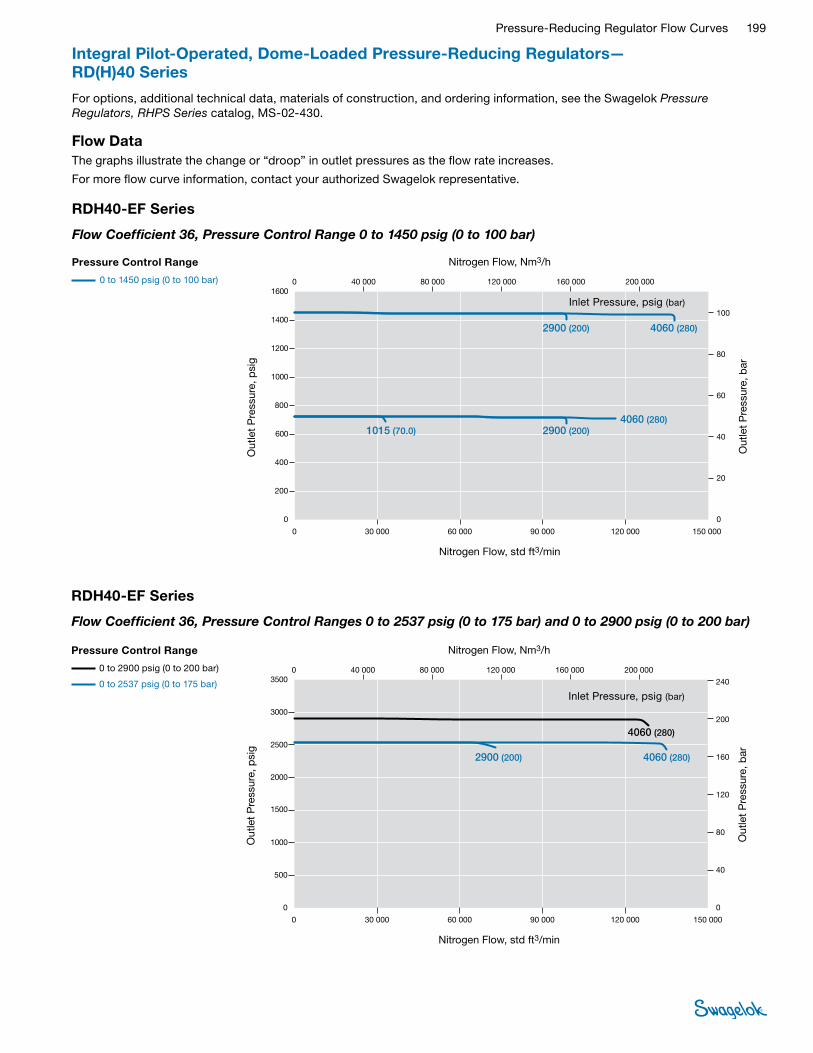
Pressure-Reducing Regulator Flow Curves 199
Integral Pilot-Operated, Dome-Loaded Pressure-Reducing Regulators— RD(H)40 Series
For options, additional technical data, materials of construction, and ordering information, see the Swagelok Pressure Regulators, RHPS Series catalog, MS-02-430.
Flow DataThe graphs illustrate the change or “droop” in outlet pressures as the flow rate increases.
For more flow curve information, contact your authorized Swagelok representative.
RDH40-EF Series
Flow Coefficient 36, Pressure Control Range 0 to 1450 psig (0 to 100 bar)
Pressure Control Range
0 to 1450 psig (0 to 100 bar)
0
600
1000
1200
1400
1600
200
400
800
0 30 000 90 00060 000 120 000 150 000
0 30 000 90 00060 000 120 000 150 000
0 40 000 80 000 120 000 160 000 200 000
80
100
20
60
0
40
100
20
80
60
0
40
0
800
1000
1200
1400
1600
600
400
200
0 40 000 80 000 120 000 160 000 200 000
40 000 80 000 120 000 160 000 200 0000
10
4.0
6.0
8.0
2.0
0
Nitrogen Flow, std ft3/min
Out
let
Pre
ssur
e, p
sig
Out
let
Pre
ssur
e, b
arO
utle
t P
ress
ure,
psi
g
Out
let
Pre
ssur
e, b
arO
utle
t P
ress
ure,
MP
a
Nitrogen Flow, std ft3/min
Nitrogen Flow, Nm3/h
Nitrogen Flow, Nm3/h
Nitrogen Flow, Nm3/h
4060 (280)
4060 (280)
2900 (200)
2900 (200)1015 (70.0)
280 (4060)
280 (4060)
200 (2900)
200 (2900)70.0 (1015)
28.0
28.0
20.0
20.07.0
Pressure Control Range
0 to 1450 psig (0 to 100 bar)
RDH40-EF Series
USA
EURO
JPN
Flow Coef�cient: 73Maximum Inlet Pressure: RDH40-EF—4060 psig (280 bar)Outlet Pressure Control Range: 0 to 1450 psig (0 to 100 bar)
Nitrogen Flow, std ft3/min
Out
let
Pre
ssur
e, p
sig
Out
let
Pre
ssur
e, b
ar
Nitrogen Flow, Nm3/h
Inlet Pressure, psig (bar)
Pressure Control Range
0 to 2900 psig (0 to 200 bar)
0 to 2537 psig (0 to 175 bar)
0
1000
1500
2000
3000
3500
500
0 120 00060 00030 000 150 000
0 30 000 90 00060 000 120 000 150 000
0 80 00040 000 120 000 160 000 200 000
160
200
40
120
0
80
240
200
40
160
120
0
80
0
1000
1500
2000
2500
3500
3000
500
0 80 00040 000 120 000 160 000 200 000
40 000 120 00080 000 160 000 200 0000
20
24
16
8.0
12
4.0
0
2500
90 000
240
Nitrogen Flow, std ft3/min
Out
let
Pre
ssur
e, p
sig
Out
let
Pre
ssur
e, b
arO
utle
t P
ress
ure,
psi
g
Out
let
Pre
ssur
e, b
arO
utle
t P
ress
ure,
MP
a
Nitrogen Flow, std ft3/min
Nitrogen Flow, Nm3/h
Nitrogen Flow, Nm3/h
Nitrogen Flow, Nm3/h
4060 (280)
2900 (200) 4060 (280)
280 (4060)
200 (2900) 280 (4060)
28.0
20.0 28.0
Pressure Control Range
0 to 2537 psig (0 to 175 bar)
0 to 2900 psig (0 to 200 bar)
RDH40-EF Series
USA
EURO
JPN
Flow Coef�cient: 73Maximum Inlet Pressure: RDH40-EF—4060 psig (280 bar)Outlet Pressure Control Range: 0 to 2900 psig (0 to 200 bar)
Nitrogen Flow, std ft3/min
Out
let
Pre
ssur
e, p
sig
Out
let
Pre
ssur
e, b
ar
Nitrogen Flow, Nm3/h
Inlet Pressure, psig (bar)
RDH40-EF Series
Flow Coefficient 36, Pressure Control Ranges 0 to 2537 psig (0 to 175 bar) and 0 to 2900 psig (0 to 200 bar)
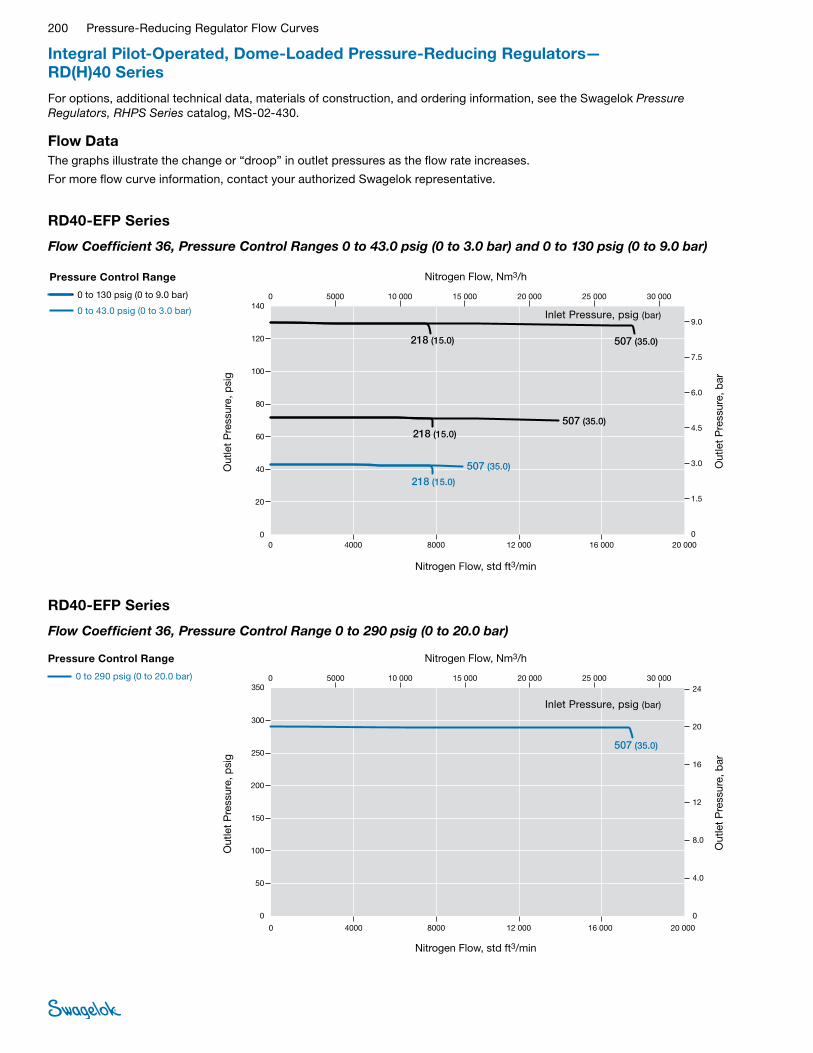
200 Pressure-Reducing Regulator Flow Curves
Integral Pilot-Operated, Dome-Loaded Pressure-Reducing Regulators— RD(H)40 Series
For options, additional technical data, materials of construction, and ordering information, see the Swagelok Pressure Regulators, RHPS Series catalog, MS-02-430.
Flow DataThe graphs illustrate the change or “droop” in outlet pressures as the flow rate increases.
For more flow curve information, contact your authorized Swagelok representative.
RD40-EFP Series
Flow Coefficient 36, Pressure Control Range 0 to 290 psig (0 to 20.0 bar)
Pressure Control Range
0 to 290 psig (0 to 20.0 bar)
0
150
250
300
350
50
100
200
0 80004000 12 000 20 000 16 000
0 80004000 12 000 20 00016 000
0 5000 10 000 15 000 20 000 30 00025 00024
4.0
8.0
16
20
0
12
20
24
4.0
16
12
0
8.0
0
200
250
300
350
150
100
50
0 5000 10 000 15 000 20 000 30 00025 000
2.0
2.4
0.4
1.6
1.2
0
0.8
0 5000 10 000 15 000 20 000 30 00025 000
Nitrogen Flow, std ft3/min
Out
let
Pre
ssur
e, p
sig
Out
let
Pre
ssur
e, b
arO
utle
t P
ress
ure,
psi
g
Out
let
Pre
ssur
e, b
arO
utle
t P
ress
ure,
MP
a
Nitrogen Flow, std ft3/min
Nitrogen Flow, Nm3/h
Nitrogen Flow, Nm3/h
Nitrogen Flow, Nm3/h
507 (35.0)
Pressure Control Range
0 to 290 psig (0 to 20.0 bar)
RD40-EFP Series
USA
EURO
JPN
Flow Coef�cient: 73Maximum Inlet Pressure: RD40-EFP—507 psig (35.0 bar)Outlet Pressure Control Range: 0 to 290 psig (0 to 20.0 bar)
35.0 (507)
3.5
Nitrogen Flow, std ft3/min
Out
let
Pre
ssur
e, p
sig
Out
let
Pre
ssur
e, b
ar
Nitrogen Flow, Nm3/h
Inlet Pressure, psig (bar)
RD40-EFP Series
Flow Coefficient 36, Pressure Control Ranges 0 to 43.0 psig (0 to 3.0 bar) and 0 to 130 psig (0 to 9.0 bar)
Pressure Control Range
0 to 130 psig (0 to 9.0 bar)
0 to 43.0 psig (0 to 3.0 bar)
0
40
60
80
120
140
20
0 16 00080004000 20 000
0 4000 12 0008000 16 000 20 000
0 10 0005000 15 000 20 000 25 000 30 000
6.0
7.5
1.5
4.5
0
3.0
9.0
7.5
1.5
6.0
4.5
0
3.0
0
40
60
80
100
140
120
20
0 15 00010 0005000 20 000 25 000 30 000
100
12 000
9.0
0.90
0.75
0.15
0.60
0.45
0
0.30
0 15 00010 0005000 20 000 25 000 30 000
Nitrogen Flow, std ft3/min
Out
let
Pre
ssur
e, p
sig
Out
let
Pre
ssur
e, b
arO
utle
t P
ress
ure,
psi
g
Out
let
Pre
ssur
e, b
arO
utle
t P
ress
ure,
MP
a
Nitrogen Flow, std ft3/min
Nitrogen Flow, Nm3/h
Nitrogen Flow, Nm3/h
Nitrogen Flow, Nm3/h
218 (15.0)
218 (15.0)
507 (35.0)
507 (35.0)
218 (15.0)
507 (35.0)
15.0 (218)
15.0 (218)
35.0 (507)
35.0 (507)
15.0 (218)
35.0 (507)
1.5
1.5
3.5
3.5
1.53.5
Pressure Control Range
0 to 43.0 psig (0 to 3.0 bar)
0 to 130 psig (0 to 9.0 bar)
RD40-EFP Series
USA
EURO
JPN
Flow Coef�cient: 73 Maximum Inlet Pressure: RD40-EFP—507 psig (35.0 bar)Outlet Pressure Control Range: 0 to 130 psig (0 to 9.0 bar)
Nitrogen Flow, std ft3/min
Out
let
Pre
ssur
e, p
sig
Out
let
Pre
ssur
e, b
ar
Nitrogen Flow, Nm3/h
Inlet Pressure, psig (bar)

Pressure-Reducing Regulator Flow Curves 201
Features■Balanced poppet design
■Diaphragm sensing
■Air-loaded pressure control with a choice of pilot-to-outlet pressure ratios.
■Remote control
Air-Loaded, Pressure-Reducing Regulators— RA Series
■Captured self-vent
■Choice of dome-to outlet pressure ratios: 1:15, 1:40, or 1:70
■Pneumatic actuation by spring-loaded regulator or proportional regulator
For options, additional technical data, materials of construction, and ordering information, see the Swagelok Pressure Regulators, RHPS Series catalog, MS-02-430.
Flow DataThe graphs illustrate the change or “droop” in outlet pressures as the flow rate increases.
For more flow curve information, contact your authorized Swagelok representative.
RA4 SeriesFlow Coefficient 1.84 Pressure Ratio 1:15, 1:40, 1:70
0
160
240
320
400
80
0 200 600400 800 1200
0 200 600400 800 1200
0 300 600 900 1200 1800
20
25
5
15
0
10
25
20
5
15
10
0 0
80
160
240
320
400
0 300 600 900 1200 1800
1000
1500
1500
1000
2.5
2.0
0.5
1.5
1.0
00 300 600 900 1200 18001500
Nitrogen Flow, std ft3/min
Out
let
Pre
ssur
e, p
sig
Out
let
Pre
ssur
e, b
arO
utle
t P
ress
ure,
psi
g
Out
let
Pre
ssur
e, b
arO
utle
t P
ress
ure,
MP
a
Nitrogen Flow, std ft3/min
Nitrogen Flow, Nm3/h
Nitrogen Flow, Nm3/h
Nitrogen Flow, Nm3/h
218 (15.0), 580 (40.0), 1015 (70.0), 2175 (150)
580 (40.0)
Pressure Ratio
1:15, 1:40, 1:70
RA4 Series
USA
EURO
JPN
Flow Coef�cient: 1.84Maximum Inlet Pressure: RA4—5800 psig (400 bar)Outlet Pressure Ratio: 1:15, 1:40, 1:70
1015 (70.0), 2175 (150)
15.0 (218), 40.0 (580), 70.0 (1015), 150 (2175)
40.0 (580)
70.0 (1015), 150 (2175)
1.5, 4.0, 7.0, 15.0
4.0
7.0, 15.0
Nitrogen Flow, std ft3/min
Out
let
Pre
ssur
e, p
sig
Out
let
Pre
ssur
e, b
ar
Nitrogen Flow, Nm3/h
Inlet Pressure, psig (bar)
Pressure Ratio
1:15, 1:40, 1:70
0
600
900
1200
1500
300
0 700 21001400 2800 3500
0 700 21001400 2800 3500
0 1100 2200 3300 4400 5500
80
100
20
60
0
40
100
80
20
60
40
0 0
300
600
900
1200
1500
0 1100 2200 3300 4400 5500
2.5
2.0
0.5
1.5
1.0
00 300 600 900 1200 18001500
Nitrogen Flow, std ft3/min
Out
let
Pre
ssur
e, p
sig
Out
let
Pre
ssur
e, b
arO
utle
t P
ress
ure,
psi
g
Out
let
Pre
ssur
e, b
arO
utle
t P
ress
ure,
MP
a
Nitrogen Flow, std ft3/min
Nitrogen Flow, Nm3/h
Nitrogen Flow, Nm3/h
Nitrogen Flow, Nm3/h
1450 (100)
Pressure Ratio
1:15, 1:40, 1:70
RA4 Series
USA
EURO
JPN
Flow Coef�cient: 1.84Maximum Inlet Pressure: RA4—5800 psig (400 bar)Outlet Pressure Ratio: 1:15, 1:40, 1:70
2900 (200)
2175 (150)
3990 (275)
100 (1450)
200 (2900)
150 (2175)
275 (3990)
10.0
20.0
15.0
27.5
Nitrogen Flow, std ft3/min
Out
let
Pre
ssur
e, p
sig
Out
let
Pre
ssur
e, b
ar
Nitrogen Flow, Nm3/h
Inlet Pressure, psig (bar)
Pressure Ratio
1:15, 1:40, 1:70

202 Pressure-Reducing Regulator Flow Curves
Air-Loaded, Pressure-Reducing Regulators— RA Series
For options, additional technical data, materials of construction, and ordering information, see the Swagelok Pressure Regulators, RHPS Series catalog, MS-02-430.
Flow DataThe graphs illustrate the change or “droop” in outlet pressures as the flow rate increases.
For more flow curve information, contact your authorized Swagelok representative.
RA4 Series
Flow Coefficient 1.84 Pressure Ratio 1:40, 1:70
0
1500
2000
2500
3000
1000
0 800 24001600 3200 4000
0 800 24001600 3200 4000
0 900 1800 2700 3600 4500
200
240
40
160
0
80
240
200
80
160
120
0 0
500
1000
1500
2000
3000
0 900 1800 2700 3600 4500
500
120
40
2500
24.0
20.0
8.0
16.0
12.0
00 900 1800 2700 3600 4500
4.0
Nitrogen Flow, std ft3/min
Out
let
Pre
ssur
e, p
sig
Out
let
Pre
ssur
e, b
arO
utle
t P
ress
ure,
psi
g
Out
let
Pre
ssur
e, b
arO
utle
t P
ress
ure,
MP
a
Nitrogen Flow, std ft3/min
Nitrogen Flow, Nm3/h
Nitrogen Flow, Nm3/h
Nitrogen Flow, Nm3/h
Pressure Ratio
1:40, 1:70
RA4 Series
USA
EURO
JPN
Flow Coef�cient: 1.84Maximum Inlet Pressure: RA4—5800 psig (400 bar)Outlet Pressure Ratio: 1:40, 1:70
2900 (200) 3990 (275)
200 (2900) 275 (3990)
20.027.5
Nitrogen Flow, std ft3/min
Out
let
Pre
ssur
e, p
sig
Out
let
Pre
ssur
e, b
ar
Nitrogen Flow, Nm3/h
Inlet Pressure, psig (bar)
Pressure Ratio
1:40, 1:70
RA6 and RA8 Series
Flow Coefficient 1.84 Pressure Ratio 1:15, 1:40, 1:70
0
160
240
320
400
80
0 160 480320 640 800
0 160 480320 640 800
0 240 480 720 960 1200
20
25
5
15
0
10
25
20
15
10
0
5
0
160
240
320
400
80
0 240 480 720 960 1200
2.5
2.0
1.5
1.0
0
0.5
0 240 480 720 960 1200
Nitrogen Flow, std ft3/min
Out
let
Pre
ssur
e, p
sig
Out
let
Pre
ssur
e, b
arO
utle
t P
ress
ure,
psi
g
Out
let
Pre
ssur
e, b
arO
utle
t P
ress
ure,
MP
a
Nitrogen Flow, std ft3/min
Nitrogen Flow, Nm3/h
Nitrogen Flow, Nm3/h
Nitrogen Flow, Nm3/h
580 (40.0)
218 (15.0)580 (40.0), 1015 (70.0), 2175 (150)
RA6&8 Series
Pressure Ratio
1:15,1:40,1:70
USA
EURO
JPN
Flow Coef�cient: 1.84Maximum Inlet Pressure: RA6&8—5800 psig (400 bar)Outlet Pressure Ratio 1:15,1:40,1:70
1015 (70.0), 2175 (150)
40.0 (580)
15.0 (218)40.0 (580), 70.0 (1015), 150 (2175)
70.0 (1015), 150 (2175)
4.0
1.5 4.0, 7.0, 15.0
7.0, 15.0
Nitrogen Flow, std ft3/min
Out
let
Pre
ssur
e, p
sig
Out
let
Pre
ssur
e, b
ar
Nitrogen Flow, Nm3/h
Inlet Pressure, psig (bar)
Pressure Ratio
1:15, 1:40, 1:70
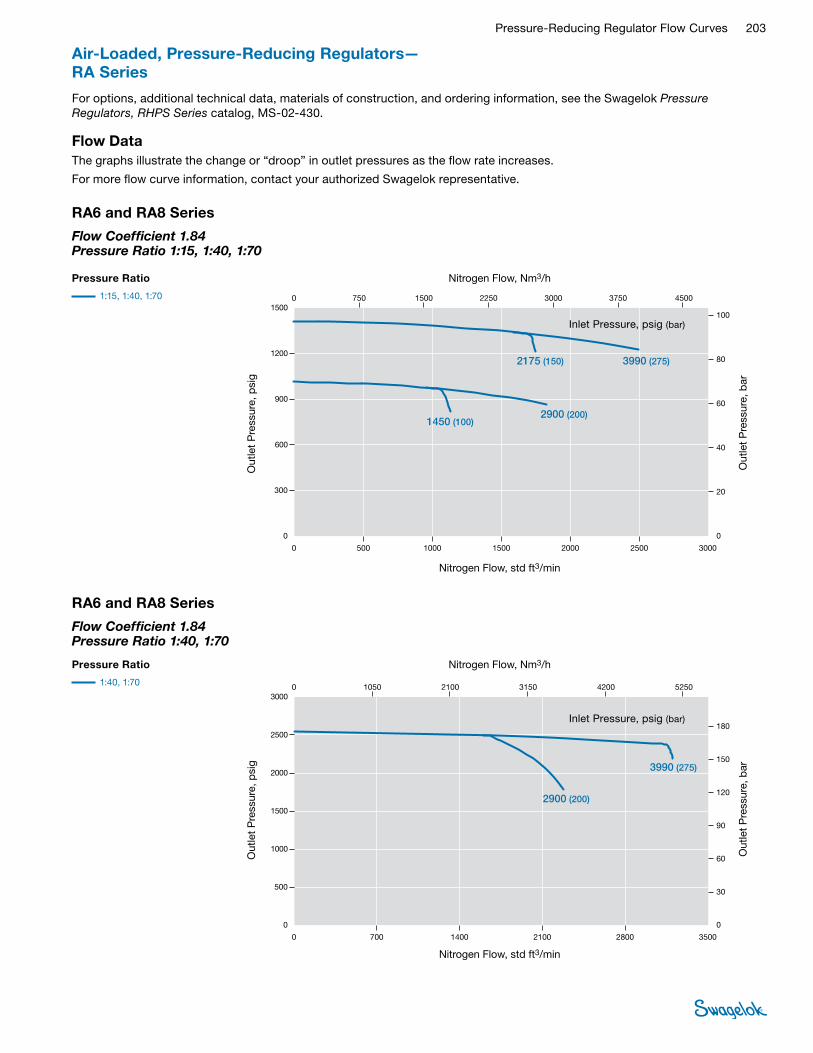
Pressure-Reducing Regulator Flow Curves 203
Air-Loaded, Pressure-Reducing Regulators— RA Series
For options, additional technical data, materials of construction, and ordering information, see the Swagelok Pressure Regulators, RHPS Series catalog, MS-02-430.
Flow DataThe graphs illustrate the change or “droop” in outlet pressures as the flow rate increases.
For more flow curve information, contact your authorized Swagelok representative.
RA6 and RA8 Series
Flow Coefficient 1.84 Pressure Ratio 1:15, 1:40, 1:70
0
600
900
1200
1500
300
0 1000 20001500 2500 3000
0 500 15001000 2000 3000
0 750 1500 2250 3000 4500
80
100
20
60
0
40
100
80
60
40
0
20
0
600
900
1200
1500
300
0 750 1500 2250 3000 3750
500
3750
4500
2500
10.0
8.0
6.0
4.0
0
2.0
0 750 1500 2250 3000 3750 4500
Nitrogen Flow, std ft3/min
Out
let
Pre
ssur
e, p
sig
Out
let
Pre
ssur
e, b
arO
utle
t P
ress
ure,
psi
g
Out
let
Pre
ssur
e, b
arO
utle
t P
ress
ure,
MP
a
Nitrogen Flow, std ft3/min
Nitrogen Flow, Nm3/h
Nitrogen Flow, Nm3/h
Nitrogen Flow, Nm3/h
2175 (150)
1450 (100)2900 (200)
RA6&8 Series
Pressure Ratio
1:15,1:40,1:70
USA
EURO
JPN
Flow Coef�cient: 1.84Maximum Inlet Pressure: RA6&8—5800 psig (400 bar)Outlet Pressure Ratio 1:15,1:40,1:70
3990 (275)
150 (2175)
100 (1450)200 (2900)
275 (3990)
15.0
10.020.0
27.5
Nitrogen Flow, std ft3/min
Out
let
Pre
ssur
e, p
sig
Out
let
Pre
ssur
e, b
ar
Nitrogen Flow, Nm3/h
Inlet Pressure, psig (bar)
Pressure Ratio
1:15, 1:40, 1:70
RA6 and RA8 Series
Flow Coefficient 1.84 Pressure Ratio 1:40, 1:70
0
1000
1500
2000
3000
500
0 700 21001400 2800 3500
0 700 21001400 2800 3500
0 1050 2100 3150 4200 5250
120
180
30
90
0
60
180
120
90
60
0
30
0
1000
1500
2000
3000
500
0 1050 2100 3150 4200 5250
2500
150
150
2500
18.0
12.0
9.0
6.0
0
3.0
0 1050 2100 3150 4200 5250
15.0
Nitrogen Flow, std ft3/min
Out
let
Pre
ssur
e, p
sig
Out
let
Pre
ssur
e, b
arO
utle
t P
ress
ure,
psi
g
Out
let
Pre
ssur
e, b
arO
utle
t P
ress
ure,
MP
a
Nitrogen Flow, std ft3/min
Nitrogen Flow, Nm3/h
Nitrogen Flow, Nm3/h
Nitrogen Flow, Nm3/h
2900 (200)
RA6&8 Series
Pressure Ratio
1:40,1:70
USA
EURO
JPN
Flow Coef�cient: 1.84Maximum Inlet Pressure: RA6&8—5800 psig (400 bar)Outlet Pressure Ratio 1:40,1:70
3990 (275)
200 (2900)
275 (3990)
20.0
27.5
Nitrogen Flow, std ft3/min
Out
let
Pre
ssur
e, p
sig
Out
let
Pre
ssur
e, b
ar
Nitrogen Flow, Nm3/h
Inlet Pressure, psig (bar)
Pressure Ratio
1:40, 1:70

204 Pressure-Reducing Regulator Flow Curves
Compact, General-Purpose, Spring-Loaded Back-Pressure Regulators BS(H)2 SeriesFeatures■Piston sensing
■Bottom mounting
■Low-friction piston for better control
For options, additional technical data, materials of construction, and ordering information, see the Swagelok Pressure Regulators, RHPS Series catalog, MS-02-430.
Pressure Control Range:
0 to 145 psig (0 to 10.0 bar)
JPN
EURO
USA
0 5.0 201510 25 30
0 5,0 201510 25 30
0
400200 600 800
0 10 20 30 40
0 10 20 30 40
50
100
150
200
250
4.0
8.0
12
16
00
0
50
100
150
200
250
4,0
8,0
12
16
0
0
0.4
0.8
1.2
1.6
0
Nitrogen Flow, std ft3/min
Inle
t P
ress
ure,
psi
g
Inle
t P
ress
ure,
bar
Nitrogen Flow, Nm3/h
JPN
EURO
USA
0 10 403020 50 60
0 10 403020 50 60
0
900300 1200 1500
0 20 40 60 80
0 10 20 30 40
100
200
300
400
500
8.0
16
24
32
00
0
100
200
300
400
500
8,0
16
24
32
0
0
0.8
1.6
2.4
3.2
6000
Nitrogen Flow, std ft3/min
Inle
t P
ress
ure,
psi
g
Inle
t P
ress
ure,
bar
Nitrogen Flow, Nm3/h
Pressure Control Range:
0 to 362 psig (0 to 25.0 bar)
Flow Coefficient 0.10 Pressure Control Ranges 0 to 145 psig (0 to 10.0 bar) and 0 to 362 psig (0 to 25.0 bar)
Flow DataThe graphs illustrate the change or “droop” in outlet pressures as the flow rate increases.
For more flow curve information, contact your authorized Swagelok representative.

Pressure-Reducing Regulator Flow Curves 205
Compact, General-Purpose, Spring-Loaded Back-Pressure Regulators BS(H)2 Series
For options, additional technical data, materials of construction, and ordering information, see the Swagelok Pressure Regulators, RHPS Series catalog, MS-02-430.
Pressure Control Range:
0 to 1450 psig (0 to 100 bar)
JPN
EURO
USA
0 50 150100 200
0 40 12080 160 200
0 40 12080 160 200
250
1000 30002000 4000 5000
0
0
50 150100 200 300
0
800
1200
1600
2000
120
400
100
20
60
80
0
0
800
1200
1600
2000
120
400
100
40
60
80
0
0
300
250
40
20
12
10
4.0
6.0
8.0
2.0
0
Nitrogen Flow, std ft3/min
Inle
t P
ress
ure,
psi
g
Inle
t P
ress
ure,
bar
Nitrogen Flow, Nm3/h
JPN
EURO
USA
0 100 300200 400
0 80 240160 320 400
0 80 240160 320 400
500
2000 60004000 8000 10 000
0
0
100 300200 400 600
0
1600
2400
3200
4000
240
800
200
40
120
160
0
0
1600
2400
3200
4000
240
800
200
80
120
160
0
0
600
500
80
40
24
20
8.0
12
16
4.0
0
Nitrogen Flow, std ft3/min
Inle
t P
ress
ure,
psi
g
Inle
t P
ress
ure,
bar
Nitrogen Flow, Nm3/h
Pressure Control Range:
0 to 2537 psig (0 to 175 bar)
Flow Coefficient 0.10, Pressure Control Ranges 0 to 1450 psig (0 to 100 bar) and 0 to 2537 psig (0 to 175 bar)
Flow DataThe graphs illustrate the change or “droop” in outlet pressures as the flow rate increases.
For more flow curve information, contact your authorized Swagelok representative.
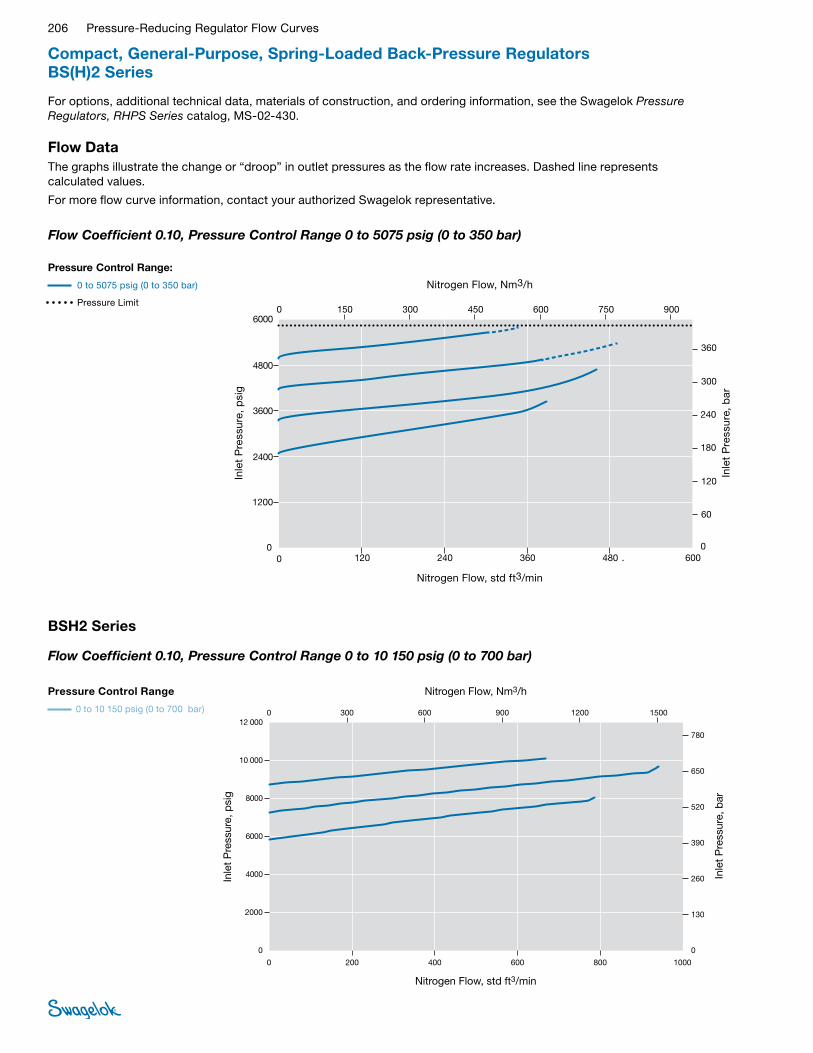
206 Pressure-Reducing Regulator Flow Curves
Compact, General-Purpose, Spring-Loaded Back-Pressure Regulators BS(H)2 Series
For options, additional technical data, materials of construction, and ordering information, see the Swagelok Pressure Regulators, RHPS Series catalog, MS-02-430.
JPN
EURO
USA
0 150 450300 600
0 120 360240 480 600
0 120 360240 480 600
750
3000 90006000 12 000 15 000
0
0
150 450300 600 900
0
2400
3600
4800
6000
360
1200
300
60
180
240
0
0
2400
3600
4800
6000
360
1200
300
120
180
240
0
0
900
750
120
60
36
30
12
18
24
6.0
0
Nitrogen Flow, std ft3/min
Inle
t P
ress
ure,
psi
g
Inle
t P
ress
ure,
bar
Nitrogen Flow, Nm3/h
Pressure Control Range:
0 to 5075 psig (0 to 350 bar)
Pressure Limit
Flow Coefficient 0.10, Pressure Control Range 0 to 5075 psig (0 to 350 bar)
Flow DataThe graphs illustrate the change or “droop” in outlet pressures as the flow rate increases. Dashed line represents calculated values.
For more flow curve information, contact your authorized Swagelok representative.
Nitrogen Flow, std ft3/min
Inle
t P
ress
ure,
psi
g
Inle
t P
ress
ure,
bar
Nitrogen Flow, Nm3/h
0
4000
6000
8000
10 000
12 000
2000
0 200 600400 800 1000
0 200 600400 800 1000
0 300 600 900 1200 1500
520
650
780
130
390
0
260
780
650
130
520
390
0
260
0
4000
6000
8000
10 000
12 000
2000
0 300 600 900 1200 1500
78.0
65.0
13.0
52.0
39.0
0
26.0
0 300 600 900 1200 1500
Nitrogen Flow, std ft3/min
Inle
t P
ress
ure,
psi
g
Inle
t P
ress
ure,
bar
Inle
t P
ress
ure,
psi
g
Inle
t P
ress
ure,
bar
Inle
t P
ress
ure,
MP
a
Nitrogen Flow, std ft3/min
Nitrogen Flow, Nm3/h
Nitrogen Flow, Nm3/h
Nitrogen Flow, Nm3/h
Pressure Control Range
0 to 10150 psig (0 to 700 bar)
BSH2 Series
USA
EURO
JPN
Flow Coef�cient: 0.10Maximum Inlet Pressure: BSH2—10150 psig (700 bar)Inlet Pressure Control Range: 0 to 10150 psig (0 to 700 bar)
BSH2 Series
Pressure Control Range
0 to 10 150 psig (0 to 700 bar)
Flow Coefficient 0.10, Pressure Control Range 0 to 10 150 psig (0 to 700 bar)

Pressure-Reducing Regulator Flow Curves 207
For options, additional technical data, materials of construction, and ordering information, see the Swagelok Pressure Regulators, RHPS Series catalog, MS-02-430.
Flow DataThe graphs illustrate the change or “droop” in outlet pressures as the flow rate increases.
For more flow curve information, contact your authorized Swagelok representative.
Features■Diaphragm sensing: 0 to 406 psig (0 to 28.0 bar)
■Piston sensing: 0 to 5220 psig (0 to 360 bar)
■Threaded vent to monitor seal integrity
General-Purpose, Spring-Loaded Back-Pressure Regulators— BS(H)4, BS(H)6, and BS(H)8 Series
Flow Coefficient 1.84
BS(H)4 Series
Nitrogen Flow, std ft3/min
Inle
t P
ress
ure,
psi
g
Inle
t P
ress
ure,
bar
Nitrogen Flow, Nm3/h
JPN
EURO
USA
0 200
0 300
800600400 1200
1200900600 1500
0 200 800600400 1200
0 5000 25 00020 00015 00010 000 30 000
0 300 1200900600 1500
500
1000
1500
2000
2500
40
80
120
160
00
0
500
1000
1500
2000
2500
40
80
120
160
0
0
1800
1800
4.0
8.0
12
16
0
1000
1000
101 (7.0)203 (14.0)
406 (28.0)
580 (40.0)580 (40.0)
1160 (80.0)1160 (80.0)
1160 (80.0)
2175 (150)
2175 (150)
2175 (150)
7,0 (101)14,0 (203)
28,0 (406)
40,0 (580)40,0 (580)
80,0 (1160)80,0 (1160)
80,0 (1160)
150 (2175)
150 (2175)
150 (2175)
0.71.4
2.8
4.04.0
8.08.0
8.0
15.0
15.0
15.0
Regulator Series
BSH4 only
BS4 and BSH4
Nitrogen Flow, std ft3/min
Inle
t P
ress
ure,
psi
g
Inle
t P
ress
ure,
bar
Nitrogen Flow, Nm3/h
0
2000
3000
4000
5000
6000
1000
0 500 15001000 2000 3000
0 500 15001000 2000 3000
0 750 1500 2250 3000 4500
240
300
360
60
180
0
120
360
300
60
240
180
0
120
0
2000
3000
4000
5000
6000
1000
0 750 1500 2250 3000 3750
2500
3750
4500
2500
36.0
30.0
6.0
24.0
18.0
0
12.0
0 750 1500 2250 3000 3750 4500
Nitrogen Flow, std ft3/min
Inle
t P
ress
ure,
psi
g
Inle
t P
ress
ure,
bar
Inle
t P
ress
ure,
psi
g
Inle
t P
ress
ure,
bar
Inle
t P
ress
ure,
MP
a
Nitrogen Flow, std ft3/min
Nitrogen Flow, Nm3/h
Nitrogen Flow, Nm3/h
Nitrogen Flow, Nm3/h
Pressure Control Range
0 to 5220 psig (0 to 360 bar)
BSH4 Series
USA
EURO
JPN
Flow Coef�cient: 0.49Maximum Inlet Pressure: BSH4—5800 psig (400 bar)Inlet Pressure Control Range: 0 to 5220 psig (0 to 360 bar)
Pressure Control Range
0 to 5220 psig (360 bar)
Flow Coefficient 1.84, Pressure Control Range 0 to 5220 psig (0 to 360 bar)
BSH4 Series
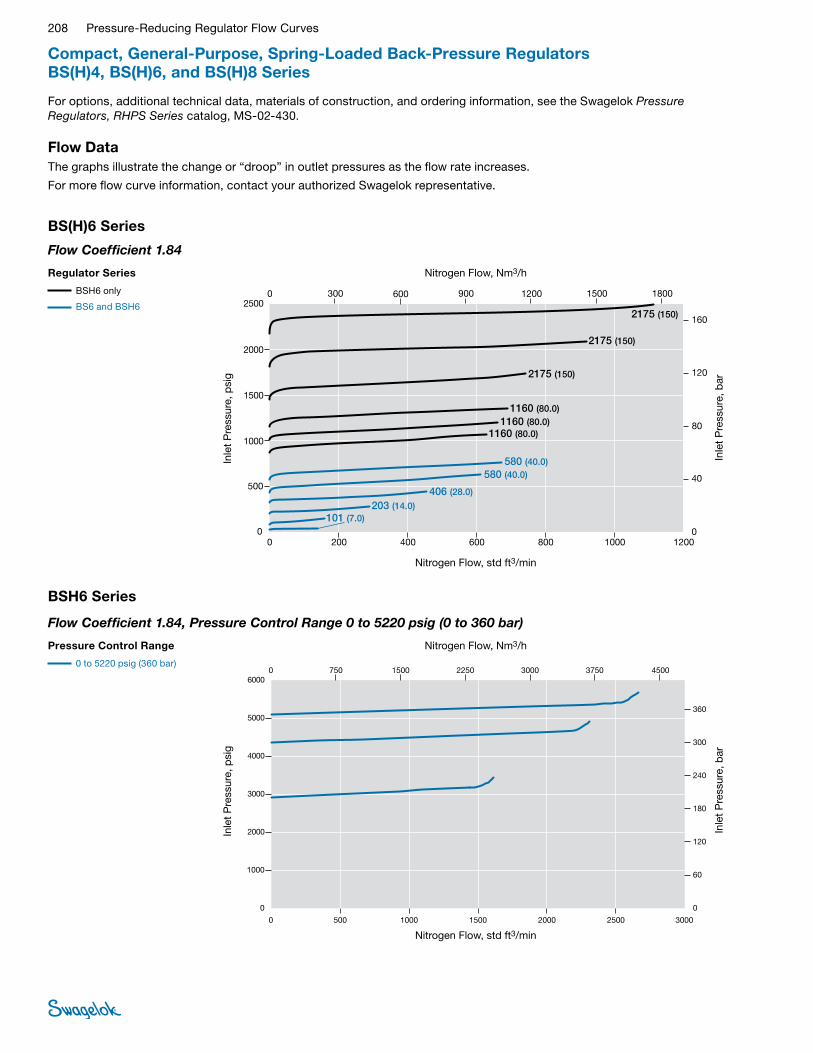
208 Pressure-Reducing Regulator Flow Curves
Compact, General-Purpose, Spring-Loaded Back-Pressure Regulators BS(H)4, BS(H)6, and BS(H)8 Series
For options, additional technical data, materials of construction, and ordering information, see the Swagelok Pressure Regulators, RHPS Series catalog, MS-02-430.
Flow DataThe graphs illustrate the change or “droop” in outlet pressures as the flow rate increases.
For more flow curve information, contact your authorized Swagelok representative.
Flow Coefficient 1.84
BS(H)6 Series
Nitrogen Flow, std ft3/min
Inle
t P
ress
ure,
psi
g
Inle
t P
ress
ure,
bar
Nitrogen Flow, Nm3/h
JPN
EURO
USA
0 200
0 300
800600400 1200
1200900600 1500
0 200 800600400 1200
0 5000 25 00020 00015 00010 000 30 000
0 300 1200900600 1500
500
1000
1500
2000
2500
40
80
120
160
00
0
500
1000
1500
2000
2500
40
80
120
160
0
0
1800
1800
4.0
8.0
12
16
0
1000
1000
101 (7.0)203 (14.0)
406 (28.0)
580 (40.0)580 (40.0)
1160 (80.0)1160 (80.0)
1160 (80.0)
2175 (150)
2175 (150)
2175 (150)
7,0 (101)14,0 (203)
28,0 (406)
40,0 (580)40,0 (580)
80,0 (1160)80,0 (1160)
80,0 (1160)
150 (2175)
150 (2175)
150 (2175)
0.71.4
2.8
4.04.0
8.08.0
8.0
15.0
15.0
15.0
Regulator Series
BSH6 only
BS6 and BSH6
Nitrogen Flow, std ft3/min
Inle
t P
ress
ure,
psi
g
Inle
t P
ress
ure,
bar
Nitrogen Flow, Nm3/h
0
2000
3000
4000
5000
6000
1000
0 500 15001000 2000 3000
0 500 15001000 2000 3000
0 750 1500 2250 3000 4500
240
300
360
60
180
0
120
360
300
60
240
180
0
120
0
2000
3000
4000
5000
6000
1000
0 750 1500 2250 3000 3750
2500
3750
4500
2500
36.0
30.0
6.0
24.0
18.0
0
12.0
0 750 1500 2250 3000 3750 4500
Nitrogen Flow, std ft3/min
Inle
t P
ress
ure,
psi
g
Inle
t P
ress
ure,
bar
Inle
t P
ress
ure,
psi
g
Inle
t P
ress
ure,
bar
Inle
t P
ress
ure,
MP
a
Nitrogen Flow, std ft3/min
Nitrogen Flow, Nm3/h
Nitrogen Flow, Nm3/h
Nitrogen Flow, Nm3/h
Pressure Control Range
0 to 5220 psig (0 to 360 bar)
BSH6 Series
USA
EURO
JPN
Flow Coef�cient: 0.49Maximum Inlet Pressure: BSH6—5800 psig (400 bar)Inlet Pressure Control Range: 0 to 5220 psig (0 to 360 bar)
Pressure Control Range
0 to 5220 psig (360 bar)
Flow Coefficient 1.84, Pressure Control Range 0 to 5220 psig (0 to 360 bar)
BSH6 Series

Pressure-Reducing Regulator Flow Curves 209
Compact, General-Purpose, Spring-Loaded Back-Pressure Regulators BS(H)4, BS(H)6, and BS(H)8 Series
For options, additional technical data, materials of construction, and ordering information, see the Swagelok Pressure Regulators, RHPS Series catalog, MS-02-430.
Flow DataThe graphs illustrate the change or “droop” in outlet pressures as the flow rate increases.
For more flow curve information, contact your authorized Swagelok representative.
Flow Coefficient 1.84
BS(H)8 Series
Nitrogen Flow, std ft3/min
Inle
t P
ress
ure,
psi
g
Inle
t P
ress
ure,
bar
Nitrogen Flow, Nm3/h
JPN
EURO
USA
0 200
0 300
800600400 1200
1200900600 1500
0 200 800600400 1200
0 5000 25 00020 00015 00010 000 30 000
0 300 1200900600 1500
500
1000
1500
2000
2500
40
80
120
160
00
0
500
1000
1500
2000
2500
40
80
120
160
0
0
1800
1800
4.0
8.0
12
16
0
1000
1000
101 (7.0)203 (14.0)
406 (28.0)
580 (40.0)580 (40.0)
1160 (80.0)1160 (80.0)
1160 (80.0)
2175 (150)
2175 (150)
2175 (150)
7,0 (101)14,0 (203)
28,0 (406)
40,0 (580)40,0 (580)
80,0 (1160)80,0 (1160)
80,0 (1160)
150 (2175)
150 (2175)
150 (2175)
0.71.4
2.8
4.04.0
8.08.0
8.0
15.0
15.0
15.0
Regulator Series
BSH8 only
BS8 and BSH8
Nitrogen Flow, std ft3/min
Inle
t P
ress
ure,
psi
g
Inle
t P
ress
ure,
bar
Nitrogen Flow, Nm3/h
0
2000
3000
4000
5000
6000
1000
0 500 15001000 2000 3000
0 500 15001000 2000 3000
0 750 1500 2250 3000 4500
240
300
360
60
180
0
120
360
300
60
240
180
0
120
0
2000
3000
4000
5000
6000
1000
0 750 1500 2250 3000 3750
2500
3750
4500
2500
36.0
30.0
6.0
24.0
18.0
0
12.0
0 750 1500 2250 3000 3750 4500
Nitrogen Flow, std ft3/min
Inle
t P
ress
ure,
psi
g
Inle
t P
ress
ure,
bar
Inle
t P
ress
ure,
psi
g
Inle
t P
ress
ure,
bar
Inle
t P
ress
ure,
MP
a
Nitrogen Flow, std ft3/min
Nitrogen Flow, Nm3/h
Nitrogen Flow, Nm3/h
Nitrogen Flow, Nm3/h
Pressure Control Range
0 to 5220 psig (0 to 360 bar)
BSH8 Series
USA
EURO
JPN
Flow Coef�cient: 0.49Maximum Inlet Pressure: BSH8—5800 psig (400 bar)Inlet Pressure Control Range: 0 to 5220 psig (0 to 360 bar)
Pressure Control Range
0 to 5220 psig (360 bar)
Flow Coefficient 1.84, Pressure Control Range 0 to 5220 psig (0 to 360 bar)
BSH8 Series
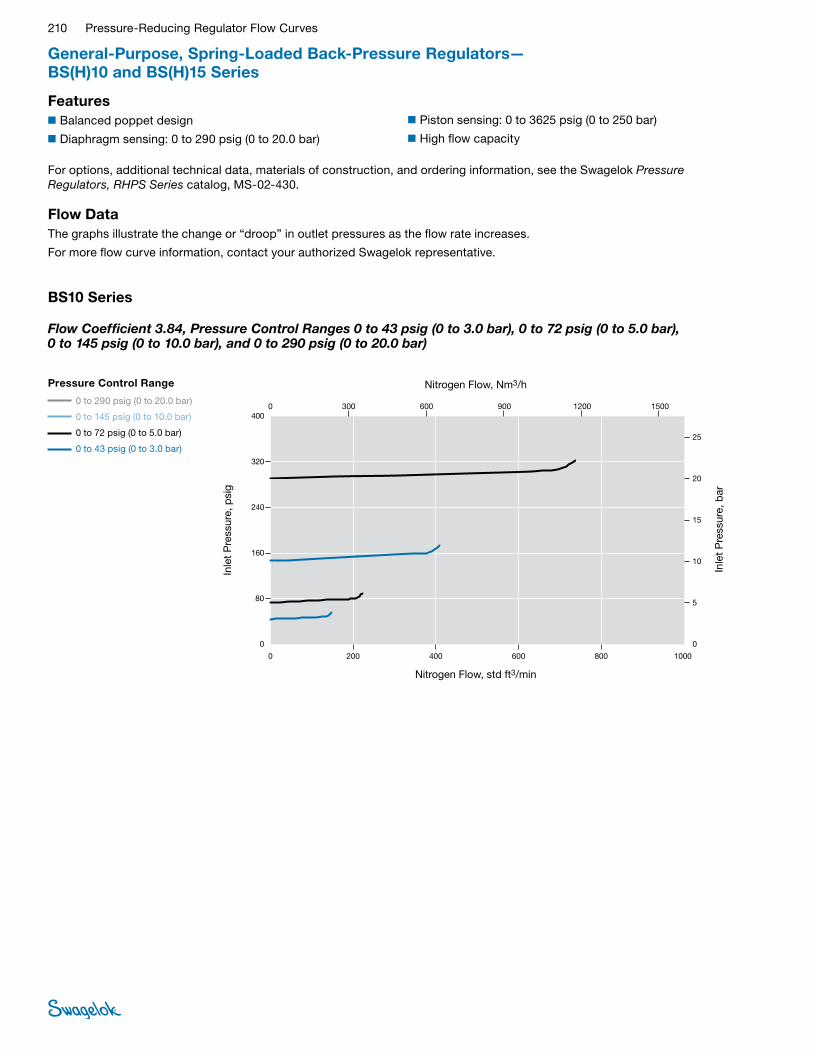
210 Pressure-Reducing Regulator Flow Curves
Features■Balanced poppet design
■Diaphragm sensing: 0 to 290 psig (0 to 20.0 bar)
General-Purpose, Spring-Loaded Back-Pressure Regulators— BS(H)10 and BS(H)15 Series
For options, additional technical data, materials of construction, and ordering information, see the Swagelok Pressure Regulators, RHPS Series catalog, MS-02-430.
Flow DataThe graphs illustrate the change or “droop” in outlet pressures as the flow rate increases.
For more flow curve information, contact your authorized Swagelok representative.
■Piston sensing: 0 to 3625 psig (0 to 250 bar)
■High flow capacity
BS10 Series
Pressure Control Range
0 to 290 psig (0 to 20.0 bar)
0 to 145 psig (0 to 10.0 bar)
0 to 72 psig (0 to 5.0 bar)
0 to 43 psig (0 to 3.0 bar)
Nitrogen Flow, std ft3/min
Inle
t P
ress
ure,
psi
g
Inle
t P
ress
ure,
bar
Nitrogen Flow, Nm3/h
0
160
240
320
400
80
0 200 600400 800 1000
0 200 600400 800 1000
0 300 600 900 1200 1500
15
20
25
10
0
5
25
20
15
10
0
5
0
80
160
240
320
400
0 300 600 900 1200 1500
2.5
2.0
1.5
1.0
0
0.5
0 300 600 900 1200 1500
Nitrogen Flow, std ft3/min
Inle
t P
ress
ure,
psi
g
Inle
t P
ress
ure,
bar
Inle
t P
ress
ure,
psi
gIn
let
Pre
ssur
e, p
sig
Inle
t P
ress
ure,
bar
Nitrogen Flow, std ft3/min
Nitrogen Flow, Nm3/h
Nitrogen Flow, Nm3/h
Nitrogen Flow, Nm3/h
Pressure Control Range
0 to 72 psig (0 to 5.0 bar)
0 to 145 psig (0 to 10.0 bar)
0 to 290 psig (0 to 20.0 bar)
BS10 Series
0 to 43 psig (0 to 3.0 bar) USA
EURO
JPN
Flow Coef�cient: 3.84Maximum Inlet Pressure: BS10—1015 psig (70 bar)Inlet Pressure Control Range: 0 to 290 psig (0 to 20.0 bar)
Flow Coefficient 3.84, Pressure Control Ranges 0 to 43 psig (0 to 3.0 bar), 0 to 72 psig (0 to 5.0 bar), 0 to 145 psig (0 to 10.0 bar), and 0 to 290 psig (0 to 20.0 bar)
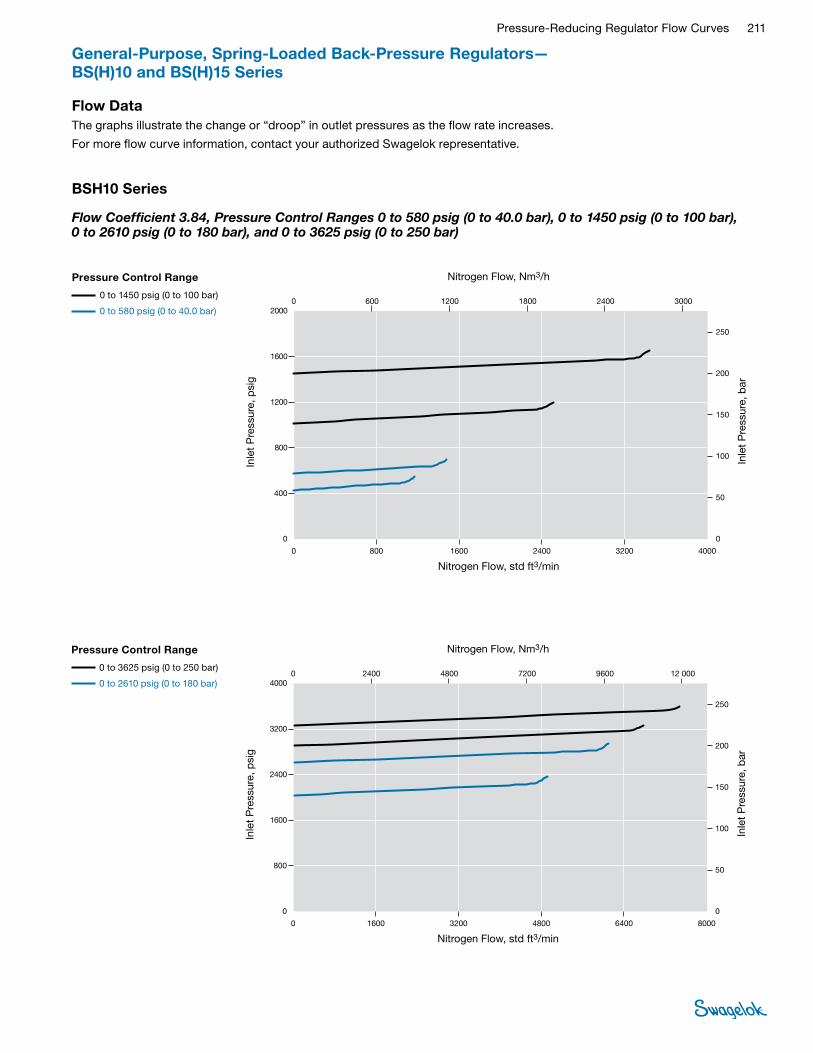
Pressure-Reducing Regulator Flow Curves 211
General-Purpose, Spring-Loaded Back-Pressure Regulators— BS(H)10 and BS(H)15 Series
Flow DataThe graphs illustrate the change or “droop” in outlet pressures as the flow rate increases.
For more flow curve information, contact your authorized Swagelok representative.
BSH10 Series
Flow Coefficient 3.84, Pressure Control Ranges 0 to 580 psig (0 to 40.0 bar), 0 to 1450 psig (0 to 100 bar), 0 to 2610 psig (0 to 180 bar), and 0 to 3625 psig (0 to 250 bar)
Nitrogen Flow, std ft3/min
Inle
t P
ress
ure,
psi
g
Inle
t P
ress
ure,
bar
Nitrogen Flow, Nm3/h
0
800
1200
1600
2000
400
0 800 24001600 3200 4000
0 800 24001600 3200 4000
0 600 1200 1800 2400 3000
150
200
250
100
0
50
250
200
150
100
0
50
0
400
800
1200
1600
2000
0 600 1200 1800 2400 3000
25.0
20.0
15.0
10.0
0
5.0
0 600 1200 1800 2400 3000
Nitrogen Flow, std ft3/min
Inle
t P
ress
ure,
psi
g
Inle
t P
ress
ure,
bar
Inle
t P
ress
ure,
psi
gIn
let
Pre
ssur
e, p
sig
Inle
t P
ress
ure,
bar
Nitrogen Flow, std ft3/min
Nitrogen Flow, Nm3/h
Nitrogen Flow, Nm3/h
Nitrogen Flow, Nm3/h
Pressure Control Range
0 to 1450 psig (0 to 100 bar)
BSH10 Series
0 to 580 psig (0 to 40.0 bar)
USA
EURO
JPN
Flow Coef�cient: 3.84Maximum Inlet Pressure: BSH10—3625 psig (250 bar)Inlet Pressure Control Range: 0 to 1450 psig (0 to 100 bar)
Pressure Control Range
0 to 1450 psig (0 to 100 bar)
0 to 580 psig (0 to 40.0 bar)
Nitrogen Flow, std ft3/min
Inle
t P
ress
ure,
psi
g
Inle
t P
ress
ure,
bar
Nitrogen Flow, Nm3/h
0
1600
2400
3200
4000
800
0 1600 48003200 6400 8000
0 1600 48003200 6400 8000
0 2400 4800 7200 9600 12 000
150
200
250
100
0
50
250
200
150
100
0
50
0
800
1600
2400
3200
4000
0 2400 4800 7200 9600 12 000
25.0
20.0
15.0
10.0
0
5.0
0 2400 4800 7200 9600 12 000
Nitrogen Flow, std ft3/min
Inle
t P
ress
ure,
psi
g
Inle
t P
ress
ure,
bar
Inle
t P
ress
ure,
psi
gIn
let
Pre
ssur
e, p
sig
Inle
t P
ress
ure,
bar
Nitrogen Flow, std ft3/min
Nitrogen Flow, Nm3/h
Nitrogen Flow, Nm3/h
Nitrogen Flow, Nm3/h
Pressure Control Range
0 to 3625 psig (0 to 250 bar)
BSH10 Series
0 to 2610 psig (0 to 180 bar)
USA
EURO
JPN
Flow Coef�cient: 3.84Maximum Inlet Pressure: BSH10—3625 psig (250 bar)Inlet Pressure Control Range: 0 to 3625 psig (0 to 250 bar)
Pressure Control Range
0 to 3625 psig (0 to 250 bar)
0 to 2610 psig (0 to 180 bar)

212 Pressure-Reducing Regulator Flow Curves
General-Purpose, Spring-Loaded Back-Pressure Regulators— BS(H)10 and BS(H)15 Series
Flow DataThe graphs illustrate the change or “droop” in outlet pressures as the flow rate increases.
For more flow curve information, contact your authorized Swagelok representative.
BS15 Series
Flow Coefficient 7.3, Pressure Control Ranges 0 to 43 psig (0 to 3.0 bar), 0 to 72 psig (0 to 5.0 bar), 0 to 145 psig (0 to 10.0 bar), and 0 to 290 psig (0 to 20.0 bar)
Pressure Control Range
0 to 290 psig (0 to 20.0 bar)
0 to 145 psig (0 to 10.0 bar)
0 to 72 psig (0 to 5.0 bar)
0 to 43 psig (0 to 3.0 bar)
Nitrogen Flow, std ft3/min
Inle
t P
ress
ure,
psi
g
Inle
t P
ress
ure,
bar
Nitrogen Flow, Nm3/h
0
90
180
270
360
450
0 500 15001000 2000 3000
0 500 15001000 2000 3000
0 750 1500 2250 3000 4500
24
30
6
18
0
12
30
24
6
18
12
0 0
180
270
360
450
90
0 750 1500 2250 3000 3750
2500
3750
4500
2500
3.0
2.4
0.6
1.8
1.2
00 750 1500 2250 3000 3750 4500
Nitrogen Flow, std ft3/min
Inle
t P
ress
ure,
psi
g
Inle
t P
ress
ure,
bar
Inle
t P
ress
ure,
psi
g
Inle
t P
ress
ure,
bar
Inle
t P
ress
ure,
MP
a
Nitrogen Flow, std ft3/min
Nitrogen Flow, Nm3/h
Nitrogen Flow, Nm3/h
Nitrogen Flow, Nm3/h
Pressure Control Range
0 to 290 psig (0 to 20.0 bar)
BS15 Series
0 to 43 psig (0 to 3.0 bar)
0 to 72 psig (0 to 5.0 bar)
0 to 145 psig (0 to 10.0 bar)
USA
EURO
JPN
Flow Coef�cient: 7.3Maximum Inlet Pressure: BS15—1015 psig (70 bar)Inlet Pressure Control Range: 0 to 290 psig (0 to 20.0 bar)

Pressure-Reducing Regulator Flow Curves 213
General-Purpose, Spring-Loaded Back-Pressure Regulators— BS(H)10 and BS(H)15 Series
Flow DataThe graphs illustrate the change or “droop” in outlet pressures as the flow rate increases.
For more flow curve information, contact your authorized Swagelok representative.
BSH15 Series
Flow Coefficient 7.3, Pressure Control Ranges 0 to 580 psig (0 to 40.0 bar), 0 to 1450 psig (0 to 100 bar), 0 to 2610 psig (0 to 180 bar), and 0 to 3625 psig (0 to 250 bar)
Nitrogen Flow, std ft3/min
Inle
t P
ress
ure,
psi
g
Inle
t P
ress
ure,
bar
Nitrogen Flow, Nm3/h
0
1600
2400
3200
4000
800
0 4000 12 0008000 16 000 20 000
0 4000 12 0008000 16 000 20 000
0 6000 12 000 18 000 24 000 30 000
150
200
250
100
0
50
250
200
150
100
0
50
0
800
1600
2400
3200
4000
0 6000 12 000 18 000 24000 30 000
25.0
20.0
15.0
10.0
0
5.0
0 6000 12 000 18 000 24000 30 000
Nitrogen Flow, std ft3/min
Inle
t P
ress
ure,
psi
g
Inle
t P
ress
ure,
bar
Inle
t P
ress
ure,
psi
gIn
let
Pre
ssur
e, p
sig
Inle
t P
ress
ure,
bar
Nitrogen Flow, std ft3/min
Nitrogen Flow, Nm3/h
Nitrogen Flow, Nm3/h
Nitrogen Flow, Nm3/h
Pressure Control Range
0 to 3625 psig (0 to 250 bar)
BSH15 Series
0 to 2610 psig (0 to 180 bar)
USA
EURO
JPN
Flow Coef�cient: 7.3Maximum Inlet Pressure: BSH15—3625 psig (250 bar)Inlet Pressure Control Range: 0 to 3625 psig (0 to 250 bar)
Pressure Control Range
0 to 3625 psig (0 to 250 bar)
0 to 2610 psig (0 to 180 bar)
Nitrogen Flow, std ft3/min
Inle
t P
ress
ure,
psi
g
Inle
t P
ress
ure,
bar
Nitrogen Flow, Nm3/h
0
800
1200
1600
2000
400
0 2000 60004000 8000 10 000
0 2000 60004000 8000 10 000
0 3000 6000 9000 12 000 15 000
75
100
125
50
0
25
125
100
75
50
0
25
0
400
800
1200
1600
2000
0 3000 6000 9000 12 000 15 000
12.5
10.0
7.5
5.0
0
2.5
0 3000 6000 9000 12 000 15 000
Nitrogen Flow, std ft3/min
Inle
t P
ress
ure,
psi
g
Inle
t P
ress
ure,
bar
Inle
t P
ress
ure,
psi
gIn
let
Pre
ssur
e, p
sig
Inle
t P
ress
ure,
bar
Nitrogen Flow, std ft3/min
Nitrogen Flow, Nm3/h
Nitrogen Flow, Nm3/h
Nitrogen Flow, Nm3/h
Pressure Control Range
0 to 1450 psig (0 to 100 bar)
BSH15 Series
0 to 580 psig (0 to 40.0 bar)
USA
EURO
JPN
Flow Coef�cient: 7.3Maximum Inlet Pressure: BSH15—3625 psig (250 bar)Inlet Pressure Control Range: 0 to 1450 psig (0 to 100 bar)
Pressure Control Range
0 to 1450 psig (0 to 100 bar)
0 to 580 psig (0 to 40.0 bar)
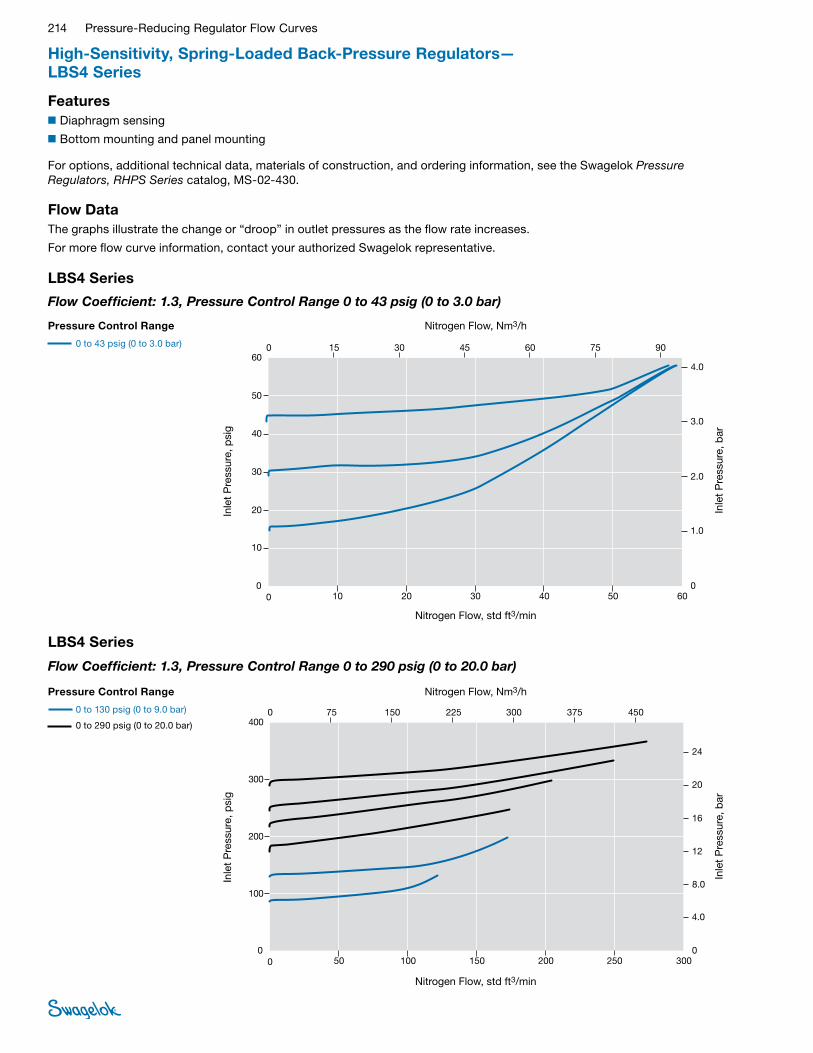
214 Pressure-Reducing Regulator Flow Curves
For options, additional technical data, materials of construction, and ordering information, see the Swagelok Pressure Regulators, RHPS Series catalog, MS-02-430.
Flow DataThe graphs illustrate the change or “droop” in outlet pressures as the flow rate increases.
For more flow curve information, contact your authorized Swagelok representative.
Features■Diaphragm sensing
■Bottom mounting and panel mounting
High-Sensitivity, Spring-Loaded Back-Pressure Regulators— LBS4 Series
LBS4 Series
JPN
EURO
USA
0 10 403020 50 60
0 10 403020 50 60
0
10
20
30
40
50
60
1.0
2.0
3.0
4.0
0
0
10
20
30
40
50
60
1,0
2,0
3,0
4,0
0
800400 1200
0.1
0.2
0.3
0.4
01600
0 15 4530 60 75
0 15 4530 60 75
90
90
0
Nitrogen Flow, std ft3/min
Inle
t P
ress
ure,
psi
g
Inle
t P
ress
ure,
bar
Nitrogen Flow, Nm3/h Pressure Control Range
0 to 43 psig (0 to 3.0 bar)
Flow Coefficient: 1.3, Pressure Control Range 0 to 43 psig (0 to 3.0 bar)
LBS4 Series
Nitrogen Flow, std ft3/min
Inle
t P
ress
ure,
psi
g
Inle
t P
ress
ure,
bar
Nitrogen Flow, Nm3/h
JPN
EURO
USA
0 50 200150100 250 300
0 50 200150100 250 300
0
100
200
300
400
4.0
16
20
24
0
0
100
200
300
400
4,0
16
20
24
0
40002000 60000
8000
0 75 225150 300 375
0 75 225150 300 375
450
450
12
8.0
12
8,0
0.4
1.6
2.4
1.2
0.8
2.0
0
Pressure Control Range
0 to 130 psig (0 to 9.0 bar)
0 to 290 psig (0 to 20.0 bar)
Flow Coefficient: 1.3, Pressure Control Range 0 to 290 psig (0 to 20.0 bar)

Pressure-Reducing Regulator Flow Curves 215
For options, additional technical data, materials of construction, and ordering information, see the Swagelok Pressure Regulators, RHPS Series catalog, MS-02-430.
High-Sensitivity, Spring-Loaded Back-Pressure Regulators— LBS4 Series
Flow DataThe graphs illustrate the change or “droop” in outlet pressures as the flow rate increases.
For more flow curve information, contact your authorized Swagelok representative.
LBS4 Series
Flow Coefficient: 1.3, Pressure Control Range 0 to 43 psig (0 to 3.0 bar)
LBS4 Series
Flow Coefficient: 1.3, Pressure Control Range 0 to 130 psig (0 to 9.0 bar)
0
40
60
80
100
120
20
0 10 3020 40 50
0 10 3020 40 50
0 15 30 45 60 75
4.8
6.0
7.2
1.2
3.6
0
2.4
7.2
6.0
1.2
4.8
3.6
0
2.4
0
40
60
80
100
120
20
0 15 30 45 60 75
0.72
0.60
0.12
0.48
0.36
0
0.24
0 15 30 45 60 75
Nitrogen Flow, std ft3/min
Inle
t P
ress
ure,
psi
g
Inle
t P
ress
ure,
bar
Inle
t P
ress
ure,
psi
g
Inle
t P
ress
ure,
bar
Inle
t P
ress
ure,
MP
a
Nitrogen Flow, std ft3/min
Nitrogen Flow, Nm3/h
Nitrogen Flow, Nm3/h
Nitrogen Flow, Nm3/h
Pressure Control Range
0 to 43 psig (0 to 3 bar)
LBS4 with Metal Diaphragm
USA
EURO
JPN
Flow Coef�cient: 1.3Maximum Inlet Pressure: LBS4—507 psig (35.0 bar)Inlet Pressure Control Range: 0 to 43 psig (0 to 3.0 bar)
Nitrogen Flow, std ft3/min
Inle
t P
ress
ure,
psi
g
Inle
t P
ress
ure,
bar
Nitrogen Flow, Nm3/h Pressure Control Range
0 to 43 psig (0 to 3.0 bar)
Nitrogen Flow, std ft3/min
Inle
t P
ress
ure,
psi
g
Inle
t P
ress
ure,
bar
Nitrogen Flow, Nm3/h
0
100
150
200
250
300
50
0 20 6040 80 120
0 20 6040 80 120
0 30 60 90 120 180
12
15
18
3
9
0
6
18
15
3
12
9
0
6
0
100
150
200
250
300
50
0 30 60 90 120 150
100
150
180
100
1.8
1.5
0.3
1.2
0.9
0
0.6
0 30 60 90 120 150 180
Nitrogen Flow, std ft3/min
Inle
t P
ress
ure,
psi
g
Inle
t P
ress
ure,
bar
Inle
t P
ress
ure,
psi
g
Inle
t P
ress
ure,
bar
Inle
t P
ress
ure,
MP
a
Nitrogen Flow, std ft3/min
Nitrogen Flow, Nm3/h
Nitrogen Flow, Nm3/h
Nitrogen Flow, Nm3/h
Pressure Control Range
0 to 130 psig (0 to 9 bar)
LBS4 with Metal Diaphragm
USA
EURO
JPN
Flow Coef�cient: 1.3Maximum Inlet Pressure: LBS4—507 psig (35.0 bar)Inlet Pressure Control Range: 0 to 130 psig (0 to 9 bar)
Pressure Control Range
0 to 130 psig (0 to 9.0 bar)
Optional 316L SS Diapragmh
Optional 316L SS Diapragmh

Safe Product SelectionWhen selecting a product, the total system design must be considered to ensure safe, trouble-free performance. Function, material compatibility, adequate ratings, proper installation, operation, and maintenance are the responsibilities of the system designer and user.
Caution: Do not mix or interchange parts with those of other manufacturers.
Warranty InformationSwagelok products are backed by The Swagelok Limited Lifetime Warranty. For a copy, visit swagelok.com or contact your authorized Swagelok representative.
Swagelok—TM Swagelok Company© 2013–2017 Swagelok CompanyPrinted in U.S.A., AGSAugust 2017, RevEMS-06-114
Top Related