


Languages
Pages
Legal


presented by
Harry S. Dent, Jr.
(1993) (2011)
Aging Baby BoomersTheir Impact on the Economy and Financial Services Industry

Shocked by the Financial Meltdown

Be at Peace with Change

2,200,000
2,700,000
3,200,000
3,700,000
4,200,000
4,700,000
5,200,000
1956 1966 1976 1986 1996 2006 2016 2026 2036 2046 2056
1,000
4,000
7,000
10,000
13,000
16,000
Immigration-adjusted Births
Lagged for Peak Spending
Dow Adjusted for
Inflation
The Spending WaveBirths Lagged for Peak Spending
Data Source: HS Dent Research, U.S. Census Bureau, Bloomberg, 2011

Average Annual Family Spending by Age (5-year age groups)
$0
$5,000
$10,000
$15,000
$20,000
$25,000
$30,000
$35,000
$40,000
Sp
en
din
g
46-50
20 30 8060 705040
Age

Labor Force Growth, Actual and Forecast
(20-Year-Olds Minus 63-Year-Olds)
100000
600000
1100000
1600000
2100000
2600000
3100000
3600000
1950
1955
1960
1965
1970
1975
1980
1985
1990
1995
2000
2005
2010
2015
2020
2025
2030
-0.01
0
0.01
0.02
0.03
0.04
0.0520 year olds minus 63 year olds Labor Force Growth
Data Source: Bureau of Labor Statistics, HS Dent, 2011
20-6
3 Y
ear
Old
sL
abo
r Fo
rce Gro
wth
Rate

Source: U.S. Census Bureau and U.S. Bureau of Labor and Statistics
20 Year-Oldson a 3-Year Lag
Minus 63 Year-Olds
Inflation
Inflation ForecastA
nn
ual
Lab
or
Fo
rce
Gro
wth
An
nu
al I
nfl
atio
n (
%)

-0.50%
0.00%
0.50%
1.00%
1.50%
2.00%
2.50%
3.00%
3.50%
Apr-53
Apr-55
Apr-57
Apr-59
Apr-61
Apr-63
Apr-65
Apr-67
Apr-69
Apr-71
Apr-73
Apr-75
Apr-77
Apr-79
Apr-81
Apr-83
Apr-85
Apr-87
Apr-89
Apr-91
Apr-93
Apr-95
Apr-97
Apr-99
Apr-01
Apr-03
Apr-05
Apr-07
Apr-09
Apr-11
Apr-13
-6.00%
-1.00%
4.00%
9.00%
14.00%
Inflation Indicator
Data Source: Bureau of Labor Statistics, HS Dent, 2011
LABOR FORCE GROWTH2.5-YR LAG INFLATION (CPI)

Demographics
What You Must Understand Now

Demographics
Debt
What You Must Understand Now

Demographics
Debt
Deflation
What You Must Understand Now

Part One: Demographics
Projecting Trends, not Years, but Decades in Advance
People Do Predictable Things as They Age

10
100
1000
10000
1904
1909
1914
1919
1924
1929
1934
1939
1944
1949
1954
1959
1964
1969
1974
1979
1984
1989
1994
1999
2004
2009
S&P 500 Adjusted for Inflation 1900-2009, Log Scale

10
100
1000
10000
1904
1909
1914
1919
1924
1929
1934
1939
1944
1949
1954
1959
1964
1969
1974
1979
1984
1989
1994
1999
2004
2009
1929
1968
2007
39-40 Year Generation CycleS&P 500 Adjusted for Inflation

Babies Are The Key to The Future

The Immigration Adjusted Birth Index
2,500,000
3,000,000
3,500,000
4,000,000
4,500,000
5,000,000
5,500,000
1909
1919
1929
1939
1949
1959
1969
1979
1989
1999
2009
Imm
igra
tio
n A
dju
sted
Bir
ths

This Is What You See
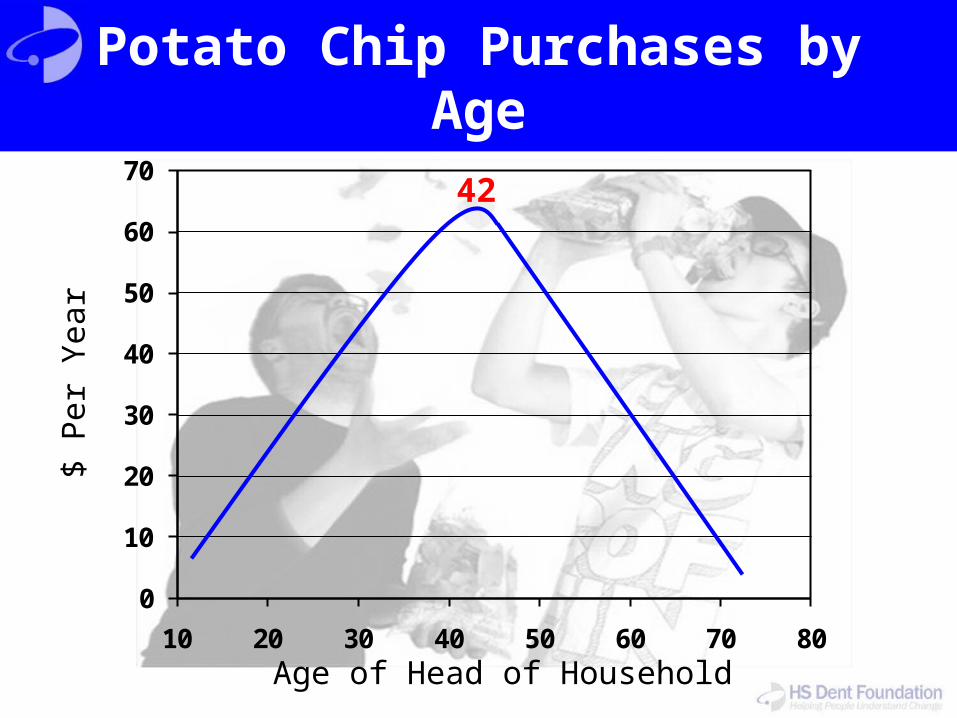
Potato Chip Purchases by Age
0
10
20
30
40
50
60
70
10 20 30 40 50 60 70 80Age of Head of Household
$ P
er Y
ear
42

Motorcycle Sales by Age
0
10
20
30
40
50
20 25 30 35 40 45 50 55 60 65 70
Age of Head of Household
$ P
er Y
ear
45-49

What Would Grow As Baby Boomers Age?

Spending on Prescription Drugs by Age
0
20
40
60
80
100
120
140
160
180
20 25 30 35 40 45 50 55 60 65 70 75 80
Age of Head of Household
$ P
er
Ye
ar
81

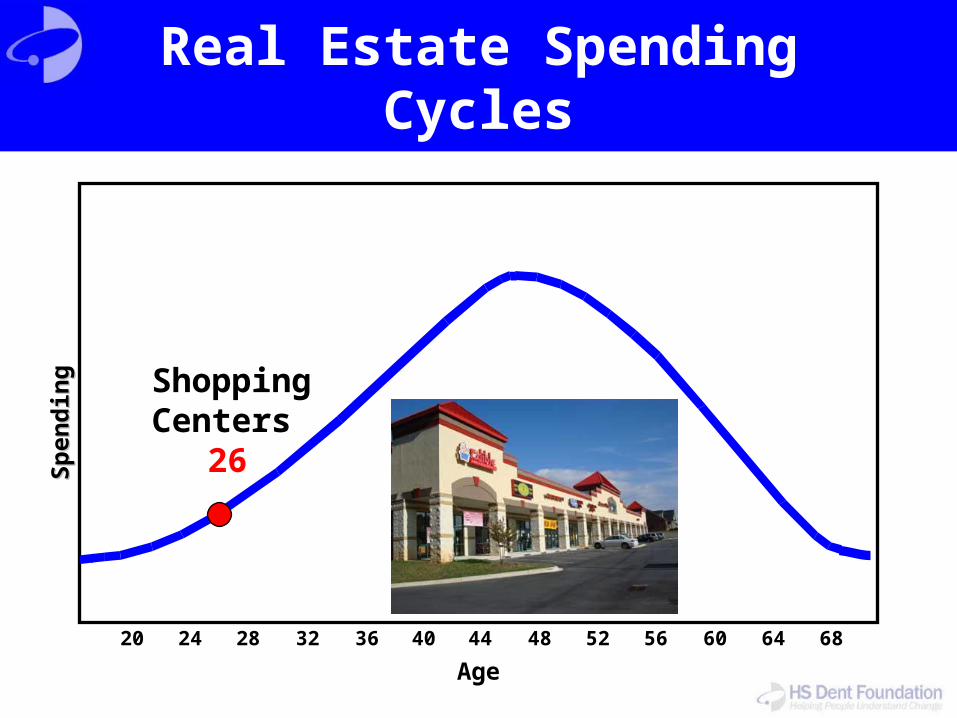
Real Estate Spending CyclesS
pen
din
gS
pen
din
g
20
Age
24 28 32 36 40 44 48 52 56 60 64 68
18Colleges

Real Estate Spending CyclesS
pen
din
gS
pen
din
g
20
Age
24 28 32 36 40 44 48 52 56 60 64 68
21
Offices

Real Estate Spending CyclesS
pen
din
gS
pen
din
g
20
Age
24 28 32 36 40 44 48 52 56 60 64 68
26Apartments
Real Estate Spending CyclesS
pen
din
gS
pen
din
g
20
Age
24 28 32 36 40 44 48 52 56 60 64 68
26
Shopping Centers

Real Estate Spending CyclesS
pen
din
gS
pen
din
g
20
Age
24 28 32 36 40 44 48 52 56 60 64 68
29-33
Starter Homes

Real Estate Spending CyclesS
pen
din
gS
pen
din
g
20
Age
24 28 32 36 40 44 48 52 56 60 64 68
37- 42
Trade-Up Homes

Real Estate Spending CyclesS
pen
din
gS
pen
din
g
20
Age
24 28 32 36 40 44 48 52 56 60 64 68
46-48Vacation Homes

Real Estate Spending CyclesS
pen
din
gS
pen
din
g
20
Age
24 28 32 36 40 44 48 52 56 60 64 68
Resorts54
Real Estate Spending CyclesS
pen
din
gS
pen
din
g
20
Age
24 28 32 36 40 44 48 52 56 60 64 68
Vacation / Retirement Homes
63-65

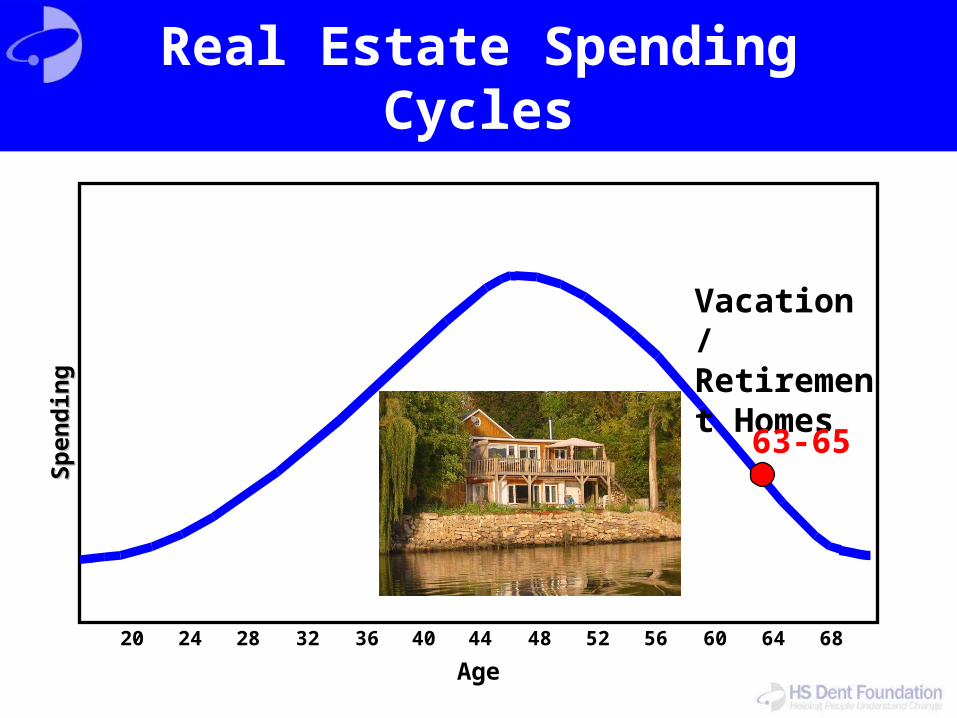
Real Estate Spending CyclesS
pen
din
gS
pen
din
g
20
Age
24 28 32 36 40 44 48 52 56 60 64 68
Vacation / Retirement Homes
63-65
Resorts54
46-50Vacation Homes
37- 42Trade-Up Homes
29-33
Starter Homes26
Apartments / Shopping Centers21
Offices
18
Colleges

Mortgage Interest by Age Average of Annual Numbers 1999-2009

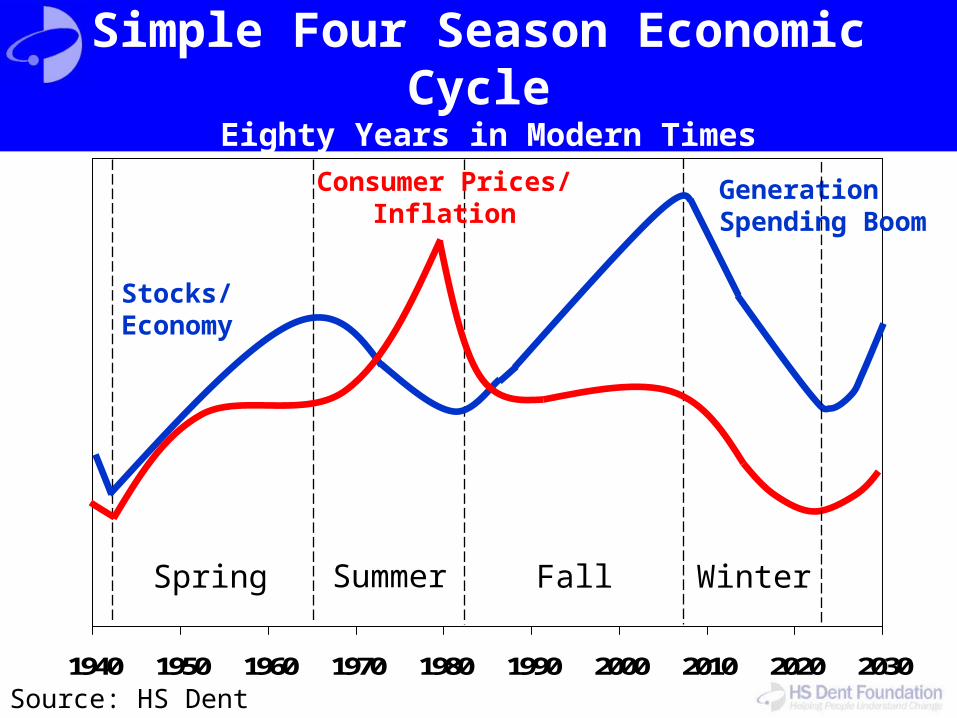
1940 1950 1960 1970 1980 1990 2000 2010 2020 2030
Spring Summer Fall Winter
Stocks/ Economy
Generation Spending Boom
Consumer Prices/ Inflation
Simple Four Season Economic Cycle Eighty Years in Modern Times
Source: HS Dent

Past Forecasts
“For the 1990s and Early 2000s – Our Greatest Boom: Dow Rises to 10,000.”
Our Power to Predict, back cover (1989)
“After those enormous deficits into 1992, the government will likely be in a balanced budget or surplus by 1998-2000.”
The Great Boom Ahead, pg 62 (1994)
“The next great depression will be from 2008-2023.”The Great Boom Ahead, pg 16 (1994)
"No amount of government stimulus will prevent it…" The Great Boom Ahead, pg 35 (1994)
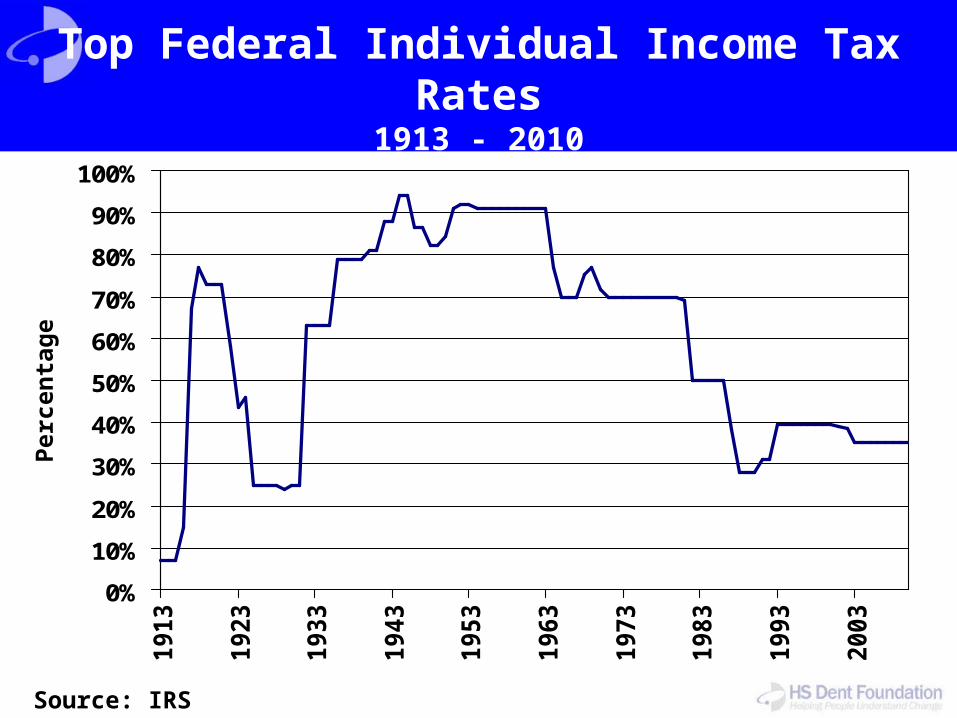
Top Federal Individual Income Tax Rates1913 - 2010
0%
10%
20%
30%
40%
50%
60%
70%
80%
90%
100%1913
1923
1933
1943
1953
1963
1973
1983
1993
2003
Source: IRS
Per
cen
tag
e

Part Two: Debt
The Greatest Credit Bubble in History
The Great Real Estate Bubble
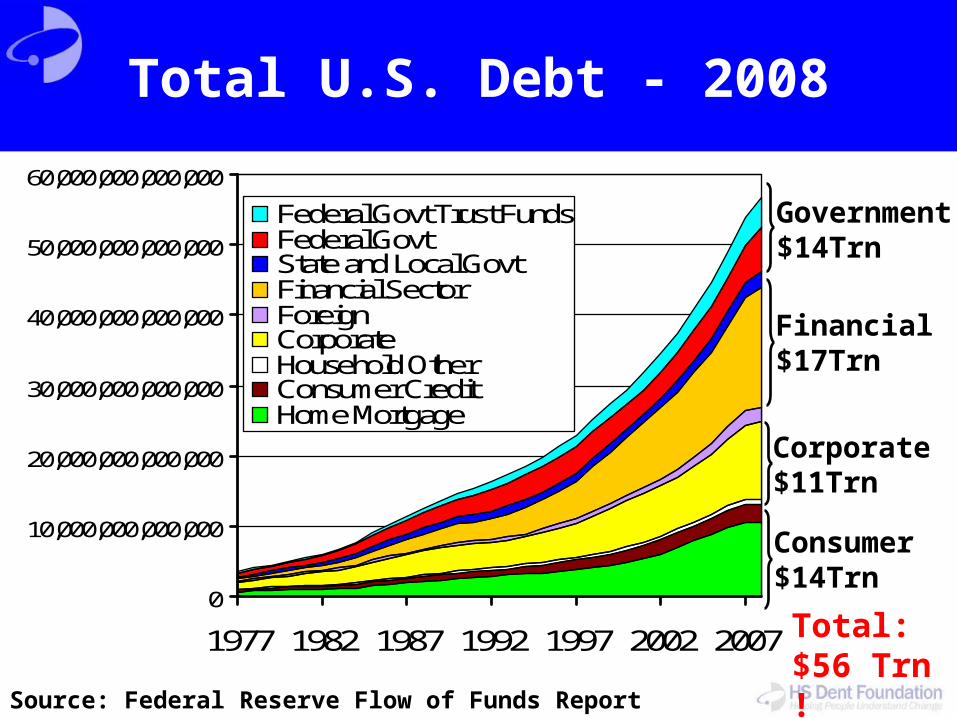
0
10,000,000,000,000
20,000,000,000,000
30,000,000,000,000
40,000,000,000,000
50,000,000,000,000
60,000,000,000,000
1977 1982 1987 1992 1997 2002 2007
Federal Govt Trust FundsFederal GovtState and Local GovtFinancial SectorForeignCorporateHousehold OtherConsumer CreditHome Mortgage
Government$14Trn
Financial$17Trn
Corporate$11Trn
Consumer$14Trn
Total:$56 Trn !
Source: Federal Reserve Flow of Funds Report
Total U.S. Debt - 2008

Unfunded Entitlement Obligations In $Trillions
10
20
30
40
50
2000 2001 2002 2003 2004 2005 2006 2007 2008 2009Source: The White House, US Treasury
Addition of Medicare Part D
Includes Social Security and Medicare
$46 trillion

Unfunded Entitlement (Medicare + Social Security) + UnderfundedEntitlement Expenditures (Medicaid) = Among Largest Long-Term
Liabilities on USA Inc.'s Balance Sheet
Source: Kleiner, Perkins, Caufield & Byers - www.kpcb.com, USA Inc. February 2011

Total US Debt
Total Debt Obligations
7 x GDP !!!
$56 trn
+
Unfunded Federal Liabilities $46 trn
=
$102 trn
Total US Debt Obligations

Projected Federal Deficit for 2020 at Varying Revenue Levels ($ Billions)
CBO HS Dent Optimistic
HS Dent Realistic
Total Revenues $4,416 $3,029 $2,524
Mandatory Expenditures $3,267 $3,267 $3,267
Discretionary Expenditures $1,487 $1,487 $1,487
Net Interest $916 $916 $916
Total Expenditures $5,670 $5,670 $5,670
Deficit ($1,254) ($2,641) ($3,146)Source: Congressional Budget Office Presidential Budget, HS Dent

Long Term House Prices vs. Inflation
Source: Robert J. Shiller, Irrational Exuberance, 2nd Edition, Princeton University Press, 2005.
0
50
100
150
200
250
1880 1900 1920 1940 1960 1980 2000 2020
Home Prices

0
50
100
150
200
250
1955 1960 1965 1970 1975 1980 1985 1990 1995 2000 2005 2010
Source: Japan Statistics Bureau
Prices rose 2.6 times in 5 years
Japan Residential Land Price National Index

Japan Residential Land Price National Index
0
50
100
150
200
250
1955 1960 1965 1970 1975 1980 1985 1990 1995 2000 2005 2010
Source: Japan Statistics Bureau
Bubbles tend to go back to where they started

Source: Amherst Securities
Pre-Tax Income Borrowing Power
2.8 times
Borrowing Power of a Typical Home Purchaser

0
50
100
150
200
250
1994 1996 1998 2000 2002 2004 2006 2008 2010
-55%-65%
-33%
Average US Home PricesCase-Shiller 10 City HPI: Jan 1994 – Mar 2011
Source: Standard & Poor’s Case-Shiller US 10-City Home Price Index
Sea
son
ally
Ad
just
ed
In T
ho
usa
nd
s
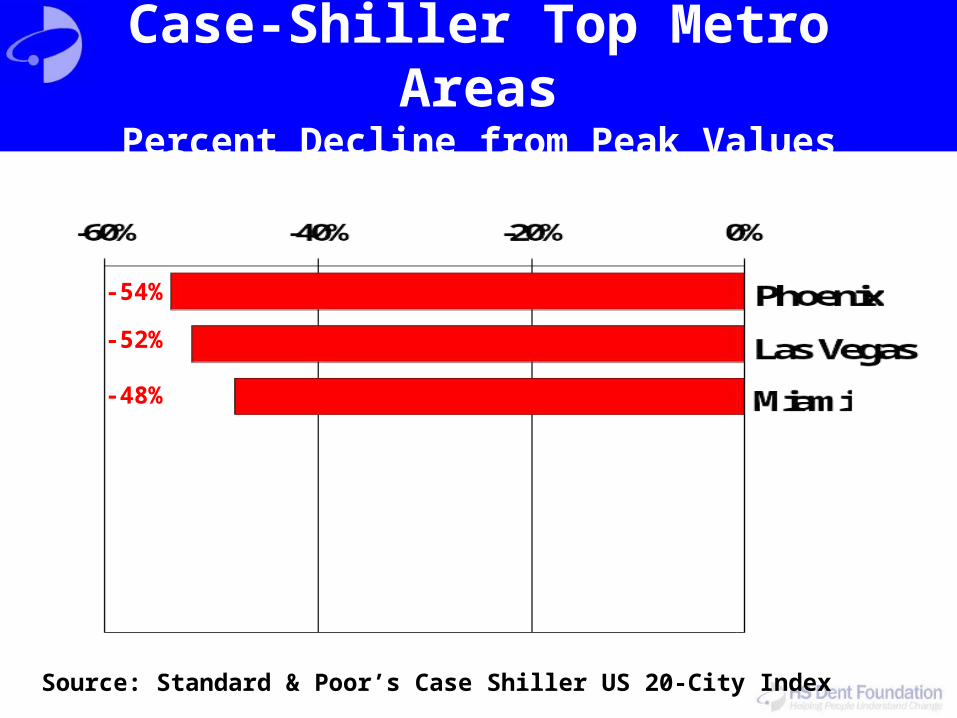
Case-Shiller Top Metro AreasPercent Decline from Peak Values
-54%
-52%
-48%
Source: Standard & Poor’s Case Shiller US 20-City Index
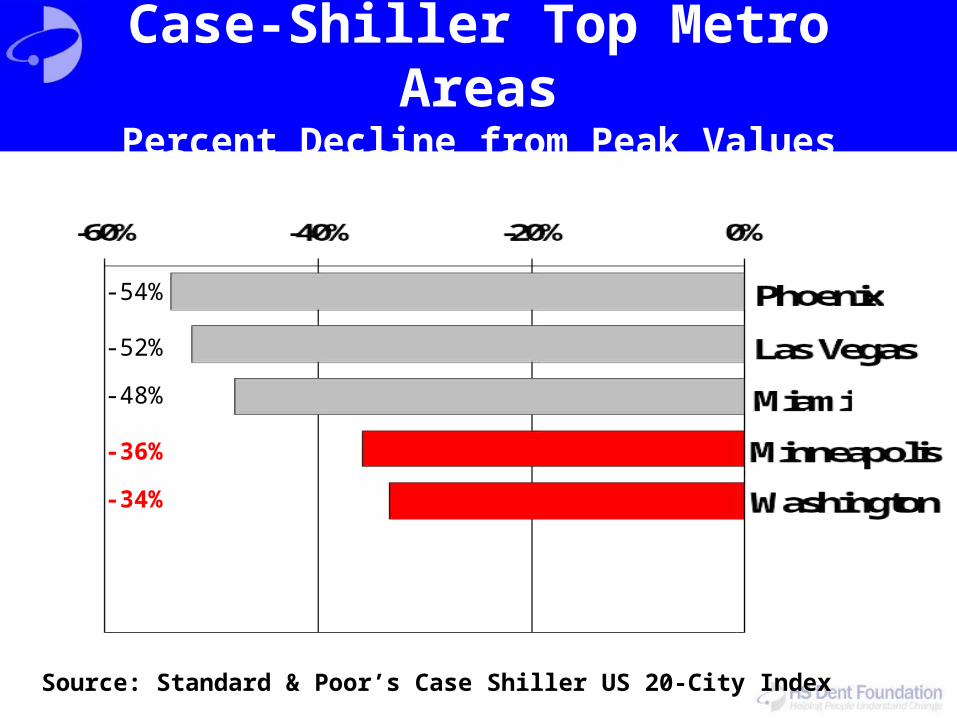
Case-Shiller Top Metro AreasPercent Decline from Peak Values
-54%
-52%
-48%
-36%
-34%
Source: Standard & Poor’s Case Shiller US 20-City Index

Case-Shiller Top Metro AreasPercent Decline from Peak Values
-54%
-52%
-48%
-36%
-34%
-11%
- 8%
Source: Standard & Poor’s Case Shiller US 20-City Index

Miami

Dallas

The Ticking Time Bomb

Total 90-Plus Delinquencies and Foreclosures
Source: Information provided by LPS Applied Analytics
Inventory is 50X Monthly Sales

Part Three: Deflation
The Restructuring of Massive Private Credit will Outweigh Government Stimulus and Rising Debt
The Deleveraging of Credit Bubbles always Leads to Deflation, not Inflation
1940 1950 1960 1970 1980 1990 2000 2010 2020 2030
Spring Summer Fall Winter
Stocks/ Economy
Generation Spending Boom
Consumer Prices/ Inflation
Simple Four Season Economic Cycle Eighty Years in Modern Times
Source: HS Dent

Monetary BaseYear/Year Percentage Change
Source: Hays Advisory
This must lead to inflation!

The Velocity of MoneyGDP to Adjusted Monetary Base
5
10
15
20
25
1960 1970 1980 1990 2000 2010
Source: St. Louis Fed, US BEA

Household Net Worth
30,000,000
35,000,000
40,000,000
45,000,000
50,000,000
55,000,000
60,000,000
65,000,000
70,000,000
2002 2003 2004 2005 2006 2007 2008 2009
Source: Federal Reserve
-$26 trn +
-$18 trn

Source: © The Economist Newspaper Limited, “Repent at Leisure,” June 4, 2010
GDP per $ of Debt
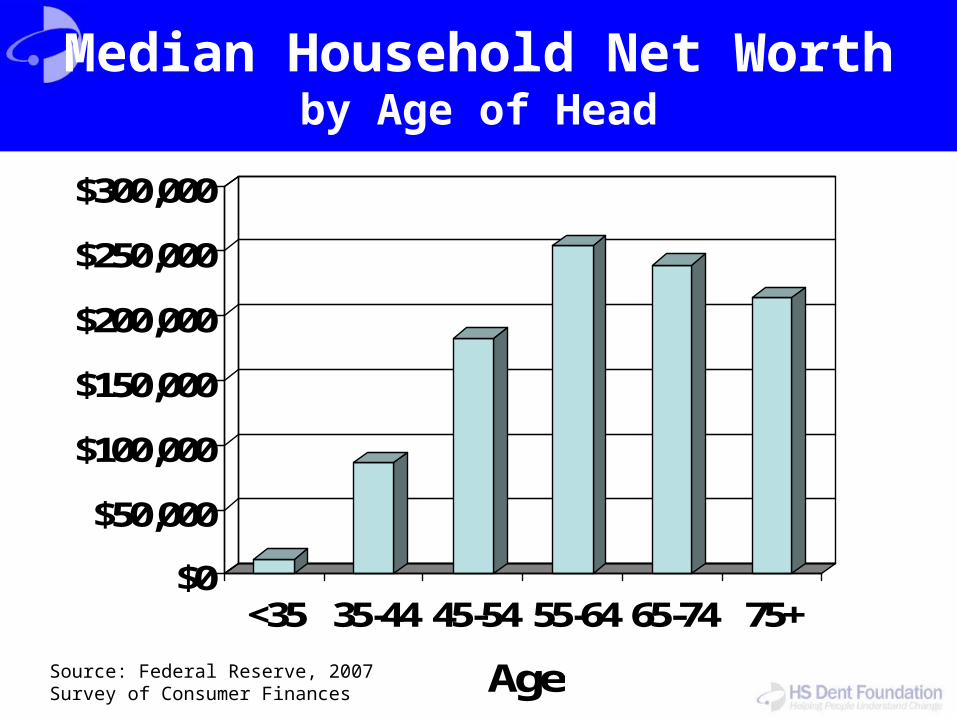
Median Household Net Worthby Age of Head
$0
$50,000
$100,000
$150,000
$200,000
$250,000
$300,000
<35 35-44 45-54 55-64 65-74 75+
AgeSource: Federal Reserve, 2007 Survey of Consumer Finances

15%
20%
25%
30%
35%
40%
45%
50%
1922 1932 1942 1952 1962 1972 1982 1992 2002 2012
1929 Stock Market Peak
Source: Edward Wolff, as printed in Wealth and Democracy and New York University, 2010
Net Worth of Top 1% of U.S. Households1922-2007

35%
40%
45%
50%
1983 1988 1993 1998 2003 2008
Source: Edward Wolff, as printed in Wealth and Democracy and New York University, 2010
Financial Assets of Top 1% of U.S. Households
1922-2007

Source: New America Foundation
Income of Top 1% of Households 1920 - 2010

For More Informationwww.hsdent.com
Top Related