


Languages
Pages
Legal


PRESENTATION TO ANALYSTS 2014


1
4 Industry conditions
10 Financial results
32 Dividend
36 Strategy and focus
45 Reviewed Interim Report for Santam Ltd and its subsidiaries for the six months ended 30 June 2014
TAbLE Of CONTENTS
P R E S E N T A T I O N T O A N A L Y S T S S A N T A m L T d A N d I T S S u b S I d I A R I E S Reviewed Interim Report for the six months ended 30 June 2014

2
CONTENT
• Industry conditions
• Financial results
• Dividend
• Strategy and focus
FINANCIAL RESULTS: FOR THE SIX MONTHS ENDED 30 JUNE 2014 PRESENTED BY: IAN KIRK AND LIZET MURRAY 28 and 29 August 2014

3

4
GENE
Outlook
• Economic recovery in advanced markets should boost growth in insurance premiums. • Growth in emerging markets should remain robust, boosted by the economic outlook and increasing
insurance penetration. • The global non-life industry is therefore expected to improve in 2014 supported by moderate price
increases and economic growth. • However, the profitability of non-life insurers will remain under pressure due to slowing price increases and
smaller reserve releases. • Investment returns will remain depressed due to sustained low interest rates; how will insurers handle
normalisation of interest rates?
Non-life GWP growth forecasts* Africa 2014: 9.5% 2015: 10.6% SE Asia 2014: 10.0% 2015: 9.2%
India 2014: 15.5% 2015: 14.9%
Source: BMI*; Swiss Re Sigma
2013 real premium growth
Non-life (general insurance)
South Africa 3.3% Advanced markets 1.1% Emerging markets 8.3%
World 2.3%
THE GENERAL INSURANCE LANDSCAPE
INDUSTRY CONDITIONS

5
6
GENE 0
5
10
15
20
25
2004 2005 2006 2007 2008 2009 2010 2011 2012 2013 Q12014
Q22014
NET WRITTEN PREMIUM GROWTH
Typical insurers NWP GDP + CPI Santam NWP (excl. cells & ART QS)
Industry: 8% Santam: 10%
TYPICAL INSURERS: Q1 2014 (LATEST AVAILABLE INFORMATION)* • A moderate net premium growth of 8% (y-o-y) compared to 7% in Q4 2013; premium rates finally moving. • An underwriting margin of 4% consistent with Q4 2013. • Claims ratio: 67% (66% in Q4 2013). • A total of 14 out of 31 typical insurers reported an underwriting loss, compared to the 13 out of 31 typical insurers
reported in Q4 2013. *Q2 data unavailable at date of compilation.
SOUTH AFRICAN ECONOMIC CONTEXT
GENE
2013 non-life GWP growth: 9.7%
Penetration: 2.7%
Average GDP* (2015 – 2017): 3%?
2013 non-life GWP growth: 8.2%
Penetration: 1.1%
Average GDP* (2015 – 2017): 5.4%
2013 non-life GWP growth: 12.6%
(incl. China & India)
Penetration: 1.6%
Average GDP* (2015 – 2017): 5.2%
Source: BMI* (Asia = selected countries only), FSB (South Africa)
South Africa • Demand for insurance: growing but constrained • Tough economic conditions
(weak rand, inflation, pressure on consumers etc.) • Strong competition • High regulatory pressure
Rest of Africa • Demand for insurance: growing • Continent with the youngest population and some
of the fastest growing economies • Many countries have reached middle income status • Insurance is among the fastest growing sectors • Outlook dependent on country’s stability
Asia • Demand for insurance: growing • World’s largest and most populous continent • The ‘rich’ middle class phenomenon • Insurance is among the fastest growing sectors • Emerging Asia presents opportunities
THE GENERAL INSURANCE LANDSCAPE

7

8
INDUSTRY CHALLENGES – SOUTH AFRICA
• Subdued outlook for economic growth. • The impact of climate change on claims frequency and severity. • Increased level of competition - continued competitive rates. • A myriad of regulation (particularly SAM and TCF). • Increased efficiencies and improvements in assessing risks - stable insurance rates need to continue
for well-managed risks.
INSURERS NEED TO: • Adapt by embracing client centricity and technology. • Manage the costs of complying with increased regulation. • Price risks accurately to remain profitable in a fiercely competitive industry. • Drive innovation to achieve sustainable growth and operating efficiency.
GENE
SANTAM VS. SA SHORT-TERM INSURANCE INDUSTRY NET UNDERWRITING MARGIN %
-5
0
5
10
15
20
Perc
enta
ge
Santam Industry
4%
4%
Santam Southern Africa excluding cells. Industry (typical insurers); includes direct and bancassurance.
Source: Santam and FSB
2.8%
Industry: 4% Santam: 7.4%

9

10
FINANCIAL RESULTS
SANTAM H1 2014: KEY FACTS
• Gross written premium growth: 7%; excluding cells 10% - very acceptable. • Underwriting margin of 7.4% - an outlier for the intermediated insurers. • Underwriting result significantly impacted by crop insurance turnaround - margin excluding
crop of 5.0% (2013: 2.7%), but all four business units positive compared to 2013. • Investment income 76% more than 2013:
– Positively impacted by SEM revaluation of R63m. – Negatively impacted by equities hedge of R93m.
• Solvency at 44%, close to the top-end of our target range. • HEPS of 799 cps, up 119% on the 365 cps for 2013. • ROC of 29.6% • Cash generation significantly improved. • Interim dividend of 262 cents per share, up 8.3%.

11

12
GENE
RETURN ON CAPITAL NET INCOME EXPRESSED AS % OF WEIGHTED AVERAGE SHAREHOLDERS’ FUNDS
20.5 13.9 11.4 8.6
22.5 15.5
23.3 19.9 14.0 11.0
19.2
16.5 20.3 21.3
8.0
-4.4
11.1
13.8
5.1 8.6
9.0
10.4
-10-505
10152025303540
2004 2005 2006 2007 2008 2009 2010 2011 2012adj*
2013 Jun-14
Perc
enta
ge
Insurance ROC Investment ROC
*Tax adjusted for STC (R96 million) and CGT inclusion rate change (R80 million).
20.0
29.6
37.0 34.2 32.7
16.6 18.1
26.6
37.1
25.0 22.6
GENE
MAIN VARIANCES
628
222
413
1 245
292
911 911
102 195
244
515
93
405 416
0
200
400
600
800
1 000
1 200
1 400
U/Writing Float income Investmentincome
Incomebefore tax
Tax Earnings Headline
R m
illion
Jun-14 Jun-13
2014 VS. 2013

13

14
GENE
NET INSURANCE RESULT
June 2014
% of NEP
June 2013
% of NEP
2014/ 2013
5Y ave %
10Y ave %
Gross written premium 10,525 9,858 7% 8 9
Net earned premium 8,459 100.0 8,096 100.0 5% 7 9
Claims incurred 5,448 64.4 5,715 70.6 (5%) 67.3 66.4
Acquisition costs 2,383 28.2 2,279 28.1 5% 27.3 26.6
Underwriting surplus 628 7.4 102 1.3 516% 5.4 7.0
Interest on insurance funds 222 2.6 195 2.4 14% 2.7 2.9
Net insurance result 850 10.0 297 3.7 186% 8.1 9.9
Combined ratio 92.6 98.7 94.6 93.0
GENE
SOLVENCY
June 2014
Dec 2013
Net asset value (NAV) R’m 6,569 6,132
Subordinated debt R’m 989 997 Regulatory equity* R’m 7,558 7,129 NAV per share cps 5,729 5,373 Net written premium** R’m 17,191 16,899 Group solvency % 44 42
*Includes fair value of subordinated debt. **Rolling 12 months.

15
16
GENE
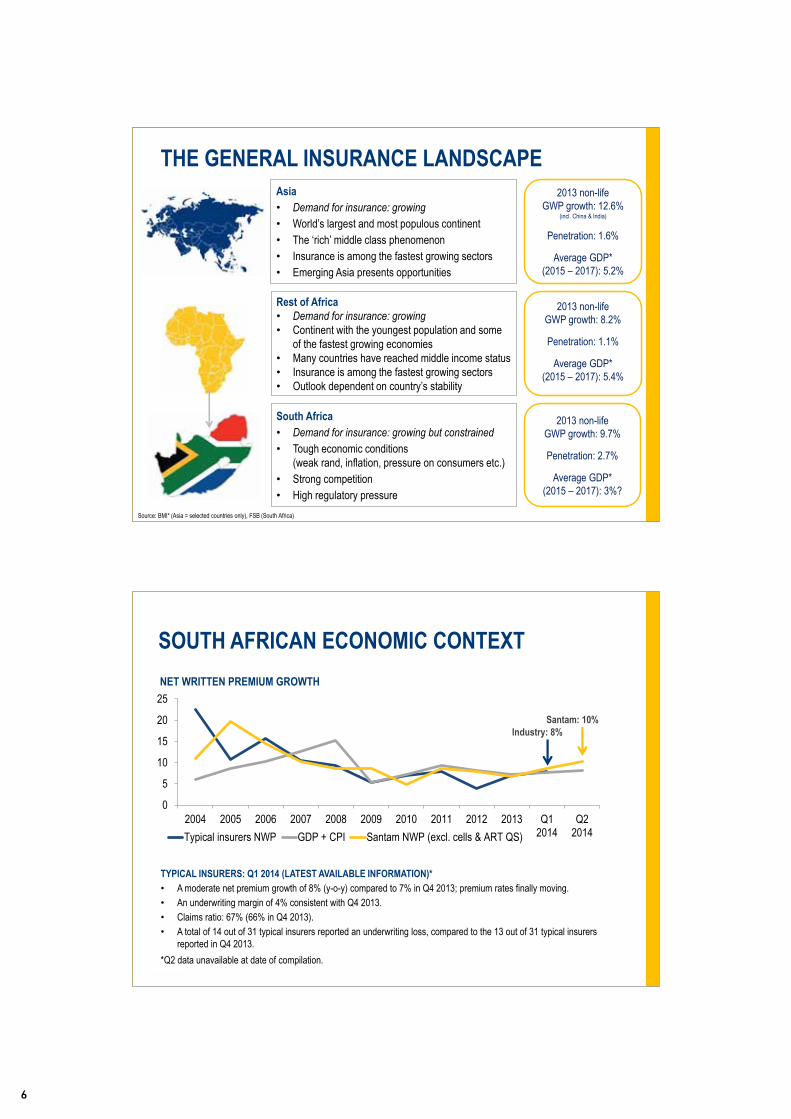
NET UNDERWRITING SURPLUS
31
-8
-112
59
4
67
1
60
-16
16
-3
-13
187
69
2
119
1
199
36
31
-150 -100 -50 0 50 100 150 200 250
Accident and health
Alternative risk
Crop
Engineering
Guarantee
Liability
Miscellaneous
Motor
Property
Transportation Jun-14 Jun-13
PER INSURANCE CLASS (R MILLION)
GENE
GROSS WRITTEN PREMIUM PER INSURANCE CLASS (R MILLION)
151
1 153
55
529
26
552 15
4 329
2 776
272
160
992
70
538
14
544
26 4 715
3 103
363
0 1 000 2 000 3 000 4 000 5 000
Accident and health
Alternative risk
Crop
Engineering
Guarantee
Liability
Miscellaneous
Motor
Property
TransportationJun-14 Jun-13

17

18
GENE
SEGMENTAL ANALYSIS
59
582
-13
17
-9
119
-8
18
-100
0
100
200
300
400
500
600
700
Personal Commercial ART ART profit before tax
R m
illion
Jun-14 Jun-13
NET UNDERWRITING RESULT ― PERSONAL, COMMERCIAL AND ART
GENE
SEGMENTAL ANALYSIS
4 214
5 319
992
3 951
4 754
1 153
0
1 000
2 000
3 000
4 000
5 000
6 000
Personal Commercial ART
R m
illion
Jun-14 Jun-13
6.7%
11.9%
-13.9%
GROSS WRITTEN PREMIUM ― PERSONAL, COMMERCIAL AND ART

19

20
GENE
INVESTMENT RETURN
284 227 443
353
92
654
-93 -204
76
58
51
15
62
92
-400
-200
-
200
400
600
800
1 000
1 200
1 400
Jun-14 Jun-13 FY 2013
R m
illion
Interest and dividends MV movements Fence SEM Forex gains and losses
635
1,036
439
GENE
NET INSURANCE RESULT
6.1 6.3 3.6
8.6 8.1
4.0 2.8
7.4
2.9 4.6
3.3
2.9 2.6
2.6 2.2
2.6
0
2
4
6
8
10
12
14
16
18
20
2007 2008 2009 2010 2011 2012 2013 Jun-14
Perc
enta
ge
Underwriting Float income
6.6
10.0
AS % OF NET EARNED PREMIUM
9.0 10.9
6.9
11.5 10.7
5.0

21

22
GENE
43.5 49.2 31.0
5.9 26.2
3.8
1.5
52.7 50.8
95.3
69.0
22.2
43.7
1.2
0.5
4.7
46.6
18.7 9.7
3.8 14.4 5.6
-10%
10%
30%
50%
70%
90%
110%
Float Centriq float Cell owners Sub debt SH funds TotalCash and MM Sanlam Alt. Inc. Fund Fixed int. bearing Preference sharesEquities SEM Intangible assets
ASSET / LIABILITY MATCHING GROUP CONSOLIDATED ASSETS AT 30 JUNE 2014
GENE
STRATEGIC DIVERSIFICATION
As at 30 June 2014 Effective % Holding
Investment Dividend Income
R million R million
Pacific & Orient Insurance Co. 15% 319 13
Shriram General Insurance Co. 7% 245
BIHL Sure 20% 7
NICO subsidiaries 22% 43
Oasis Insurance 9% 22
Total 635 13
GROUP INVESTMENT TO DATE

23
24
GENE
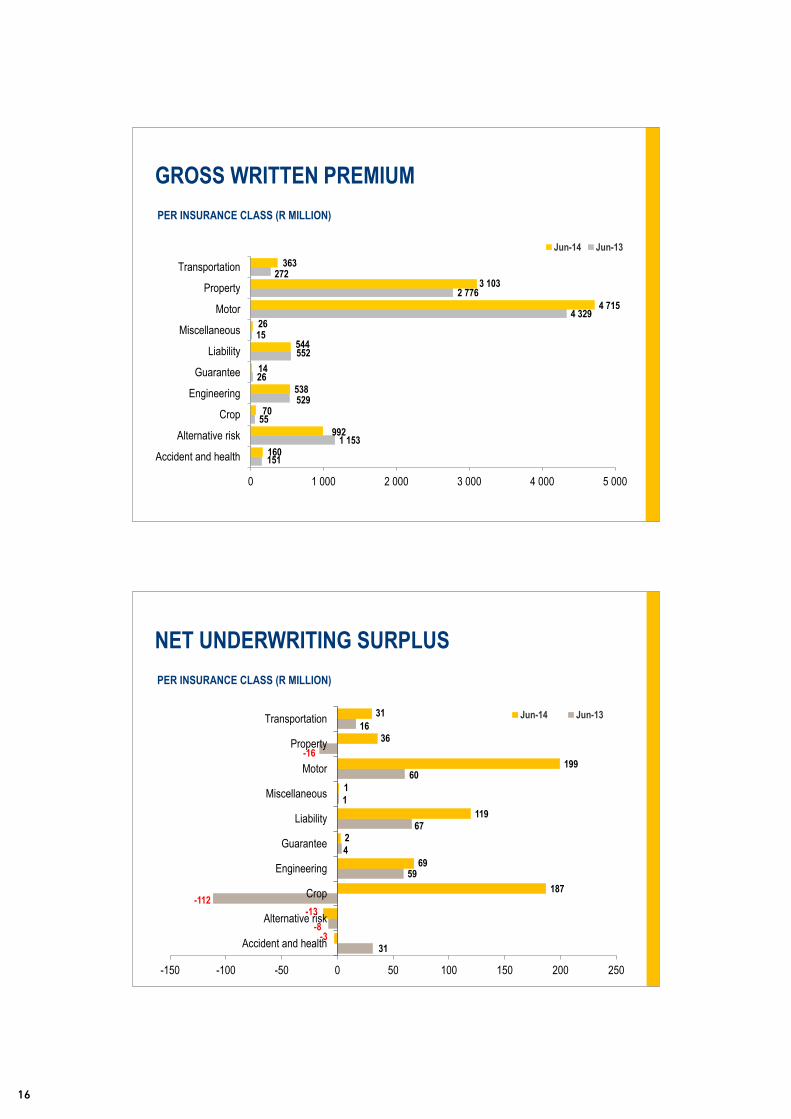
CASH GENERATED FROM OPERATIONS
930 516
1 616
0
400
800
1 200
1 600
2 000
2 400
Jun-14 Jun-13 Dec-13
R m
illion
GENE
ASSET ALLOCATION
Santam SA Centriq International Group total
Equities 23% - 88%* 21%
Strategic investments 8% 1% 6%
Preference shares 3% 1% - 3%
Fixed interest-bearing 42% 68% - 45%
Cash and money market 24% 30% 12% 25%
Total 100% 100% 100% 100%
* Consists of Santam’s share in international run-off (R309 million), 100% underpinned by cash.
GROUP CONSOLIDATED INVESTMENTS AT 30 JUNE 2014 (IFRS VIEW)

25

26
GENE
FLOAT AS % OF GEP
32.7 35.6
40.0 35.9 37.1
35.4 33.6
Dec-08 Dec-09 Dec-10 Dec-11 Dec-12 Dec-13 Jun-14
Perc
enta
ge
GENE
SIZE OF FLOAT
3 994 4 634
5 515 5 483 6 266 6 449 6 462
0
1 000
2 000
3 000
4 000
5 000
6 000
7 000
Dec '08 Dec-09 Dec-10 Dec-11 Dec-12 Dec-13 Jun-14
R m
illion

27
28
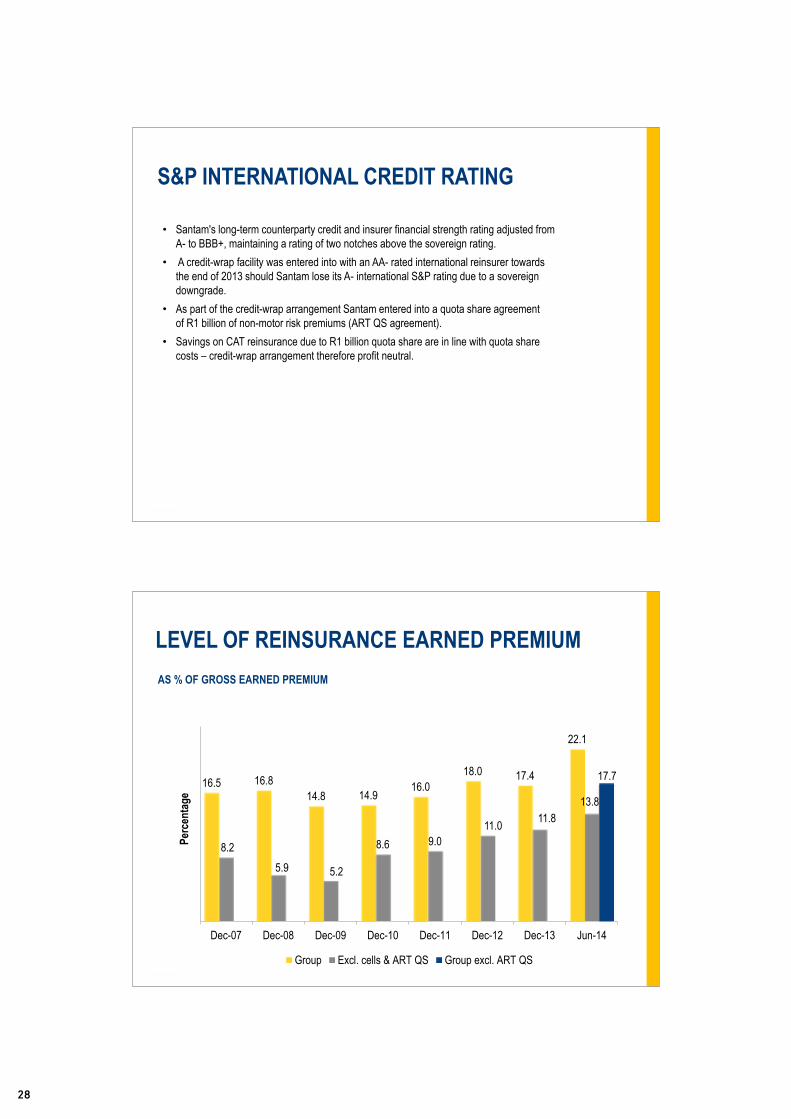
GENE
LEVEL OF REINSURANCE EARNED PREMIUM
16.5 16.8 14.8 14.9
16.0 18.0 17.4
22.1
8.2 5.9 5.2
8.6 9.0 11.0 11.8
13.8
17.7
Dec-07 Dec-08 Dec-09 Dec-10 Dec-11 Dec-12 Dec-13 Jun-14
Perc
enta
ge
Group Excl. cells & ART QS Group excl. ART QS
AS % OF GROSS EARNED PREMIUM
GENE
S&P INTERNATIONAL CREDIT RATING
• Santam's long-term counterparty credit and insurer financial strength rating adjusted from A- to BBB+, maintaining a rating of two notches above the sovereign rating.
• A credit-wrap facility was entered into with an AA- rated international reinsurer towards the end of 2013 should Santam lose its A- international S&P rating due to a sovereign downgrade.
• As part of the credit-wrap arrangement Santam entered into a quota share agreement of R1 billion of non-motor risk premiums (ART QS agreement).
• Savings on CAT reinsurance due to R1 billion quota share are in line with quota share costs – credit-wrap arrangement therefore profit neutral.

29

30
GENE
MIWAY
June 2014 June 2013 Change
Gross written premium (R’m) 714 628 +14%
Gross underwriting result (R’m) 52 40 +30%
Gross claims ratio, net of CAT recoveries 58.3% 59.3%
Gross acquisition cost ratio* 34.4% 34.3%
New policies added** 59 626 55 805 +7%
Number of clients** 217 533 180 204 +21%
* Excluding deferred bonus scheme relating to compensation of the 10% interest previously held by management. ** Includes value added products.
GENE
ACQUISITION COST RATIO
12.7 10.8 11.9
13.7 16.4 15.5
1.8 1.0 1.0
0
5
10
15
20
25
30
Jun-13 Jun-14 Jun-14 (excl. ART QS)
Perc
enta
ge
Commission Management expenses Strategic projects
AS % OF NET EARNED PREMIUM
28.2 28.2 28.4

31

32
DIVIDEND
GENE
SANTAM RE
• Countries where Santam Re secured business include, but are not limited to China, South Korea, South East Asia, India and the Indian subcontinent. Programmes in Africa include Botswana, Kenya and Nigeria.
• Gross written premium from third parties of R326 million was on par with June 2013 following the cancellation of a loss-making South African book of business.
• International reinsurance gross written premium of R215 million increased by 155% from the R84 million in June 2013; gross written premium from South African sources of R111 million compared to the R242 million reported in June 2013.
• Underwriting results improved following lower retrocession costs and corrective action on the South African portfolio.

33

34
GENE
CAPITAL MANAGEMENT
• Capital efficiency remains a priority for Santam.
• Target solvency range of 35% - 45%: no change; equivalent to a capital coverage ratio
of 135% to 175%.
• Economic capital based on internal model June 2014: 26.1% of NWP.
• FSB interim capital requirements June 2014: 28% of NWP.
• Internal model capital coverage ratio for the Group at June 2014: 170%
• Group solvency as at 30 June 2014 of 44% (June 2013: 40%).
• SAM implementation date 1 January 2016.
GENE
262 242 242
433
0
100
200
300
400
500
600
700
800
Jun-14 Jun-13 2013
Cent
s per
shar
e
Interim Final
675
+8.3%
DIVIDEND PER SHARE

35

36
GENE
FUTURE A leading emerging market general insurance group in Africa and selected Asian markets.
NOW The leading general insurance group in South Africa.
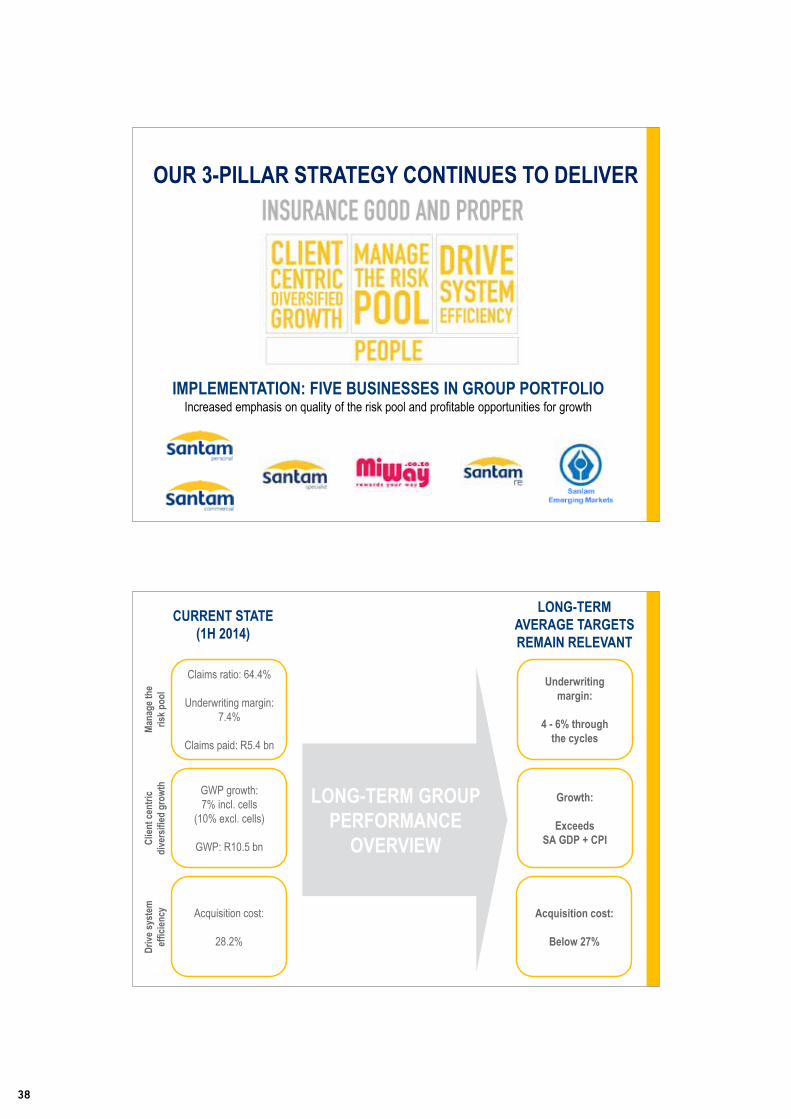
OUR 3-PILLAR STRATEGY CONTINUES TO DELIVER
STRATEGY AND FOCUS

37
38
Clien
t cen
tric
dive
rsifi
ed g
rowt
h Ma
nage
the
risk p
ool
Drive
syst
em
effic
iency
CURRENT STATE (1H 2014)
LONG-TERM AVERAGE TARGETS REMAIN RELEVANT
LONG-TERM GROUP PERFORMANCE
OVERVIEW
Claims ratio: 64.4%
Underwriting margin: 7.4%
Claims paid: R5.4 bn
GWP growth: 7% incl. cells
(10% excl. cells)
GWP: R10.5 bn
Acquisition cost:
28.2%
Underwriting margin:
4 - 6% through
the cycles
Growth:
Exceeds SA GDP + CPI
Acquisition cost:
Below 27%
GENE
OUR 3-PILLAR STRATEGY CONTINUES TO DELIVER
IMPLEMENTATION: FIVE BUSINESSES IN GROUP PORTFOLIO Increased emphasis on quality of the risk pool and profitable opportunities for growth

39

40
SANTAM COMMERCIAL AND PERSONAL (C&P)
• Get close to and in contact with the customers – new segments in particular
• Grow share in intermediary space profitably and take advantage of competitors’ positioning
• Address broker outsource business model challenges
• Implementation of strategic project investment – policy administration, contact centre automation and e-business
SANTAM SPECIALIST BUSINESS
• Grow African footprint and get distance between us and competitors (local and international) over the next three to five years: – Corporate property – Engineering – Liability – Agri – Marine
• Get closer to our corporate customers
from a risk management perspective
• Address the internationals in Africa challenge and opportunity (insurers and intermediaries)
• Centriq to transform – profitable growth in Risk Finance and UMA support
BUSINESS UNITS’ STRATEGIC PRIORITIES
GENE CLIENT CENTRIC DIVERSIFIED GROWTH
• Increase focus on our clients and new segments
• SA: achieve full multi-channel capability and ensure profitable growth through focused activities
• Avail of opportunities in SA intermediated space
• Successfully expand outside of South Africa (SEM, Specialist Business and Santam Re)
• Develop strategic partnerships (local and global)
DRIVE SYSTEM EFFICIENCY • Data and technology investment promises value
in 2015 and 2016 • Leverage scale and efficiency as a Group - we
consider disciplined execution and operational efficiency as BAU
MANAGE THE RISK POOL • Maintain risk assessment capability • Focus on risk management • Continue focus on real exposure as we globalise • Build on our systemic risk management
influence and benefits
PEOPLE • Continue to retain key skills, develop people and
transform
GROUP’S STRATEGIC PRIORITIES

41

42
MIWAY
• Acquire volume for personal business in SA – new segments
• Launch SMME offering • Launch Life offering • Consider international footprint in the
medium to long term
SANLAM EMERGING MARKETS
• Maximise general insurance investment opportunity with Sanlam – high-growth low-penetration countries
• Gear up and deliver on technical partnership for mutual value
• Leverage the Santam Specialist and Santam Re opportunities
SANTAM RE
• Pursue profitable growth with a “follow market acting like a lead” strategy and build this start-up judiciously for group diversification and long-term value
• Create shared value from international partnerships
BUSINESS UNITS’ STRATEGIC PRIORITIES

43

44

REvIEwEd INTERIm REPORTSantam ltd and itS SubSidiarieS
FOr tHe Six mOntHS ended
30 june 2014

46
47 Salient features
48 Financial review
50 Independent auditor’s review report
51 Consolidated statement of financial position
52 Consolidated statement of comprehensive income
53 Consolidated statement of changes in equity
54 Consolidated statement of cash flows
55 Notes to the interim financial information
TAbLE Of CONTENTS

47
Gross written premium growth:
– including cell captive
insurance 7%
– excluding cell captive
insurance 10%
Underwriting margin of 7.4%
Positive contribution from
international strategic
diversification
Group solvency ratio
of 44%
Significantly improved cash
generation
Return on shareholders' funds
of 29.6%
Interim dividend of 262 cents per share, up 8.3%

48
f I N A N C I A L R E v I E w
The Santam group reported considerably improved underwriting results for the six months ended June 2014 compared to the corresponding period in 2013, influenced by a substantial turnaround in the crop insurance business and an improved contribution from all major business units. Satisfactory gross written premium growth of 10%, excluding cell captive insurance business, was achieved in the context of a difficult economic environment.
Investment returns improved compared to the corresponding period following positive market movements and an increase in interest rates in January 2014. Headline earnings per share increased by 119%, while a return on capital of 29.6% was achieved compared to the 14.9% of the comparative period. The solvency margin of 44% is at the upper end of the target range of 35% to 45%.
The net underwriting margin of 7.4%, which is above the long-term target range of 4% to 6%, was positively impacted by the turnaround in the crop insurance business from a loss of R112 million for the six months to June 2013 to a profit of R187 million in the corresponding 2014 period.
The Santam Commercial and Personal intermediated business benefited from the impact of corrective actions and segmented premium increases implemented since the first quarter of 2013. The Santam Specialist division delivered strong underwriting results in various business classes including liability, property and transportation. The accident and health class reported a loss due to a softening in market conditions. MiWay improved on its 2013 performance with a claims ratio of 58.3%, while the Santam Re underwriting results improved following lower retrocession costs and corrective action on the South African portfolio.
The group achieved satisfactory gross written premium growth of 10% excluding cell insurance business and 7% inclusive of cells. The growth of cell captive insurance business in Centriq was under pressure following the cancellation of a significant book of business in 2013. The Specialist insurance classes had mixed fortunes with the engineering class achieving 2% growth in competitive market conditions and the liability class showing negative growth following the decision to reduce risk exposure to medical malpractice and underrated liability business. In contrast, the corporate property business and the transportation business achieved good growth. MiWay increased gross written premiums by 14% to R714 million. Santam Re’s growth from third-party business was negatively impacted by the cancellation of an unprofitable South African book of business. The international business of Santam Re more than doubled to R174 million.
Following South Africa’s credit downgrade by global ratings agency Standard & Poor’s (S&P) on 13 June 2014, Santam’s international long-term counterparty credit and insurer financial strength rating has been adjusted from A- to BBB+, maintaining a rating of two notches above the sovereign rating. At the same time, S&P affirmed the ‘zaAA+’ South Africa national scale rating of Santam, leaving our local policyholders and noteholders unaffected. Alternative arrangements to support growth in territories outside South Africa, in situations where this is dependent on Santam’s S&P international scale rating, were put in place towards the end of 2013. In terms of these arrangements, Santam has facilitated the use of an international insurer’s AA-rated licence for such business, if required. As part of the arrangement with the international insurer, Santam entered into an alternative risk transfer (ART) quota share agreement effective 1 January 2014, which reduced net earned premiums by R500 million during this reporting period, reducing growth in net earned premiums to 4%. The agreement will generate dollar-denominated collateral to support Santam’s use of the international insurer’s AA-rated licence. The agreement also reduces Santam’s net catastrophe exposure, resulting in lower catastrophe reinsurance premiums.
The net acquisition cost ratio of 28.2% is in line with the June 2013 ratio. On a comparable basis, excluding the impact of the reinsurance quota share agreement, the management expense ratio increased by 1.1%. Higher levels of binder fees payable to intermediaries following changes in regulations in 2013 contributed to this increase. The provision for incentives exceeding that of the comparable period following the significant improvement in underwriting performance and a once-off provision for cost associated with the planned relocation of the Johannesburg office also impacted management expenses. Strategic project cost amounted to 1% of net earned premium. Development costs of R41 million relating to the strategic project to develop a new administration, underwriting and product management technology for the traditional Santam intermediated business was capitalised. It is pleasing to report that the project is progressing according to plan.
The net commission ratio reduced by 0.8% on a comparable basis. The decrease was mainly due to the growth in MiWay, where no commission expenses are incurred, as well as reinsurance profit commissions received on specialist and crop insurance business.
Investment returns on insurance funds of R222 million were 14% higher than the R195 million achieved in 2013, following good investment performance and the increase in interest rates in January 2014.
The combined effect of insurance activities resulted in a net insurance income of R850 million compared to R297 million in 2013.
The group’s investment performance was in line with the market, other than the negative impact of the hedge over R2 billion of equities, which expired in May 2014. A loss of R93 million was incurred on this hedge during the six months to 30 June 2014. The hedge was not renewed after the final tranche expired in May 2014. Positive fair value movements to the value of R63 million in Santam’s interest in the Sanlam Emerging Markets (SEM) general insurance businesses in Africa, India and Southeast Asia enhanced the investment performance. The group invested a further R40 million in the SEM general insurance businesses by increasing its economic participation in the NICO Holdings general insurance businesses in Malawi, Uganda and Zambia to 22% and acquiring a 9% economic participation in Oasis Insurance in Nigeria.

49
f I N A N C I A L R E v I E w
Net earnings from associated companies of R17 million decreased from R34 million in 2013, mainly due to the key contributor, Credit Guarantee Insurance Corporation of Africa Ltd, reporting lower earnings compared to 2013.
Cash generated from operations of R930 million increased from R516 million in 2013, mainly due to the improved underwriting results.
The board would like to express its gratitude to Santam’s management, staff, intermediaries and other business partners for their efforts and contributions during the past six months.
ProspectsTrading conditions in the South African insurance industry remain tough despite some hardening of insurance premium rates following the poor underwriting results reported by industry participants in 2012 and 2013. Difficult economic conditions with low gross domestic product (GDP) growth and higher interest rates are expected to have a negative impact on consumers.
Santam continues to manage premium increases selectively through our market and risk segmentation approach on policy renewal. We will also continue focusing on the implementation of various underwriting practices and risk management approaches to improve the underwriting margin in the traditional Santam intermediated business. We continue with our growth initiatives with a specific focus to achieve further international diversification in the Santam Specialist division and Santam Re.
Nominal interest rates are expected to increase further towards the end of the year, positively impacting return on insurance funds. The investment market is likely to remain uncertain.
Events after the reporting periodThere have been no material changes in the affairs or financial position of the company and its subsidiaries since the reporting date.
Declaration of dividend (Number 121)Notice is hereby given that the board has declared an interim dividend of 262 cents per share (2013: 242 cents). Shareholders are advised that the last day to trade cum dividend will be Friday, 12 September 2014. The shares will trade ex dividend from the commencement of business on Monday, 15 September 2014. The record date will be Friday, 19 September 2014, and the payment date will be Monday, 22 September 2014. Certificated shareholders may not dematerialise or rematerialise their shares between 15 September 2014 and 19 September 2014, both dates inclusive.
The dividend has been declared from income reserves and will be subject to dividends tax that was introduced with effect from 1 April 2012. There are R4 646 765.90793 secondary tax on companies (STC) credits available for utilisation. Accordingly the STC credit available is 3.89351 per share. The amount per share subject to the withholding of dividends tax at a maximum rate of 15% is therefore 258.10649 cents per share. A net dividend of 223.28403 cents per share will apply to shareholders liable for dividends tax at a rate of 15% and 262.00000 cents per share for shareholders that qualify for complete exemption therefrom. The issued ordinary share capital as at 27 August 2014 is 119 346 417 shares. The company’s income tax reference number is 9475/144/71/4.
In terms of the dividends tax legislation, the dividends tax amount due will be withheld and paid over to the South African Revenue Service (SARS) by a nominee company, stockbroker or Central Security Depository Participant (CSDP) (collectively “Regulated Intermediary”) on behalf of shareholders. However, all shareholders should declare their status to their Regulated Intermediary, as they may qualify for a reduced dividends tax rate or they may even be exempt from dividends tax.
Preparation and presentation of the financial statementsThe preparation of the reviewed interim financial statements was supervised by the chief financial officer of Santam Ltd, HD Nel.
On behalf of the board
GG Gelink IM KirkChairman Chief Executive Officer
27 August 2014

50
I N d E P E N d E N T A u d I T O R ’ S R E v I E w R E P O R T
TO THE SHAREHOLDERS OF SANTAM LTD
We have reviewed the condensed consolidated interim financial statements of Santam Ltd, set out on pages 51 to 69, in the accompanying interim report, which comprise the condensed consolidated statement of financial position as at 30 June 2014 and the related condensed consolidated statements of comprehensive income, changes in equity and cash flows for the six months then ended, and selected explanatory notes.
Directors’ responsibility for the interim financial statementsThe directors are responsible for the preparation and presentation of these interim financial statements in accordance with the International Financial Reporting Standard, (IAS) 34 Interim Financial Reporting, the SAICA Financial Reporting Guides as issued by the Accounting Practices Committee and Financial Pronouncements as issued by the Financial Reporting Standards Council and the requirements of the Companies Act of South Africa, and for such internal control as the directors determine is necessary to enable the preparation of interim financial statements that are free from material misstatement, whether due to fraud or error.
Auditor’s responsibilityOur responsibility is to express a conclusion on these interim financial statements. We conducted our review in accordance with International Standard on Review Engagements 2410, Review of Interim Financial Information Performed by the Independent Auditor of the Entity. ISRE 2410 requires us to conclude whether anything has come to our attention that causes us to believe that the interim financial statements are not prepared in all material respects in accordance with the applicable financial reporting framework. This standard also requires us to comply with relevant ethical requirements.
A review of interim financial statements in accordance with ISRE 2410 is a limited assurance engagement. We perform procedures, primarily consisting of making inquiries of management and others within the entity, as appropriate, and applying analytical procedures, and evaluate the evidence obtained.
The procedures in a review are substantially less than and differ in nature from those performed in an audit conducted in accordance with International Standards on Auditing. Accordingly, we do not express an audit opinion on these interim financial statements.
ConclusionBased on our review, nothing has come to our attention that causes us to believe that the accompanying condensed consolidated interim financial statements of Santam Ltd for the six months ended 30 June 2014 are not prepared, in all material respects, in accordance with the International Financial Reporting Standard, (IAS) 34 Interim Financial Reporting, the SAICA Financial Reporting Guides as issued by the Accounting Practices Committee and Financial Pronouncements as issued by the Financial Reporting Standards Council and the requirements of the Companies Act of South Africa.
PricewaterhouseCoopers Inc.Director: C van den HeeverRegistered AuditorCape Town
27 August 2014

51
C O N S O L I d A T E d S T A T E m E N T O f f I N A N C I A L P O S I T I O N
Notes
ReviewedAt
30 June 2014R million
ReviewedAt
30 June 2013R million
AuditedAt
31 Dec 2013R million
ASSETSNon-current assets
Property and equipment 88 97 95 Intangible assets 1 098 1 082 1 072 Deferred income tax 181 227 188 Investment in associates 327 277 318 Financial assets – at fair value through income
Equity securities 6 3 752 3 274 4 011 Debt securities 6 7 538 7 243 7 306 Derivatives 6 – 1 1
Cell owners’ interest – 17 – Reinsurance assets 7 140 126 117
Current assetsCell owners' interest 16 – 15 Financial assets – at fair value through incomeDerivatives 6 – 10 –
Short-term money market instruments 6 1 758 1 174 1 424 Reinsurance assets 7 2 372 1 936 2 227 Deferred acquisition costs 330 305 369 Loans and receivables including insurance receivables 6 2 079 2 045 2 684 Income tax assets 43 17 31 Cash and cash equivalents 2 292 2 333 2 343 Non-current assets held for sale 8 429 – 415
Total assets 22 443 20 164 22 616
EQUITYCapital and reserves attributable to the company’s equity holders
Share capital 107 107 107 Treasury shares (499) (526) (520)Other reserves 239 157 224 Distributable reserves 6 722 5 829 6 321
6 569 5 567 6 132 Non-controlling interest 411 99 400 Total equity 6 980 5 666 6 532
LIABILITIESNon-current liabilities
Deferred income tax 336 276 315 Financial liabilities – at fair value through income
Debt securities 6 989 998 997 Investment contracts 6 26 – 126
Cell owners’ interest 854 739 814 Insurance liabilities 7 1 561 1 452 1 595
Current liabilitiesFinancial liabilities – at fair value through income
Debt securities 6 24 24 24 Investment contracts 6 – 77 – Derivatives 6 – – 204
Financial liabilities – at amortised costCollateral guarantee contracts 87 79 82
Insurance liabilities 7 8 912 8 233 9 096 Deferred reinsurance acquisition revenue 132 110 171 Provisions for other liabilities and charges 79 147 84 Trade and other payables 2 274 2 339 2 561 Current income tax liabilities 189 24 15
Total liabilities 15 463 14 498 16 084
Total shareholders’ equity and liabilities 22 443 20 164 22 616

52
Notes
ReviewedSix months
ended 30 June 2014
R million
ReviewedSix months
ended 30 June 2013
R millionChange
%
AuditedYear ended
31 Dec 2013R million
Gross written premium 10 525 9 858 7% 20 631 Less: Reinsurance premium 2 465 2 089 3 731 Net premium 8 060 7 769 4% 16 900 Less: change in unearned premium
Gross amount (335) (204) 334 Reinsurers’ share (63) (123) (185)
Net insurance premium revenue 8 458 8 096 4% 16 751 Investment income 9 377 363 4% 782 Income from reinsurance contracts ceded 522 316 600 Net gains on financial assets and liabilities at fair value through income 9 323 150 449 Net income 9 680 8 925 9% 18 582
Insurance claims and loss adjustment expenses 6 721 6 878 13 807 Insurance claims and loss adjustment expenses recovered from reinsurers (1 273) (1 163) (2 200)Net insurance benefits and claims 5 448 5 715 (5%) 11 607
Expenses for the acquisition of insurance contracts 1 432 1 344 2 721 Expenses for marketing and administration 1 493 1 270 2 562 Expenses for asset management services rendered 16 15 29 Amortisation and impairment of intangible assets 15 30 114 Expenses 8 404 8 374 0% 17 033
Results of operating activities 1 276 551 132% 1 549 Finance cost (48) (59) (118)Net income from associates 17 34 86 Net loss on sale of associate – – (18)Impairment on net investment of associates – (11) (26)Profit before tax 1 245 515 142% 1 473 Income tax expense 10 (292) (93) (300)Profit for the period 953 422 126% 1 173
Other comprehensive incomeCurrency translation differences 12 78 143 Total comprehensive income for the period 965 500 1 316
Profit attributable to:– equity holders of the company 911 405 125% 1 120 – non-controlling interest 42 17 53
953 422 1 173 Total comprehensive income attributable to:– equity holders of the company 923 483 91% 1 263 – non-controlling interest 42 17 53
965 500 1 316
Earnings attributable to equity shareholdersEarnings per share (cents) 12
Basic earnings per share 799 356 125% 982 Diluted earnings per share 794 353 125% 973
Weighted average number of shares – millions 114.12 113.89 114.12 Weighted average number of ordinary shares for diluted earnings per share – millions 114.82 114.72 115.12
C O N S O L I d A T E d S T A T E m E N T O f C O m P R E h E N S I v E I N C O m E

53
Attributable to equity holders of the company
Non-controlling
interest Total
Share capital
R million
Treasury shares
R million
Other reserves R million
Distribut-able
reserves R million R million R million
Balance as at 1 January 2013 107 (579) 77 5 904 108 5 617
Profit for the period – – – 1 120 53 1 173
Other comprehensive income:
Currency translation differences – – 143 – – 143
Total comprehensive income for the period ended 31 December 2013 – – 143 1 120 53 1 316
Issue of target shares – – – – 277 277
Sale of treasury shares – 59 – – – 59
Loss on sale of treasury shares – – – (60) – (60)
Transfer to reserves – – 4 (4) – –
Share-based payments – – – 106 – 106
Dividends paid – – – (745) (37) (782)
Acquisition of subsidiary – – – – (1) (1)
Balance as at 31 December 2013 107 (520) 224 6 321 400 6 532
Profit for the period – – – 911 42 953
Other comprehensive income:
Currency translation differences – – 12 – – 12
Total comprehensive income for the period ended 30 June 2014 – – 12 911 42 965
Purchase of treasury shares – (33) – – – (33)
Sale of treasury shares – 54 – (54) – –
Transfer to reserves – – 3 (3) – –
Share-based payments – – – 41 – 41
Dividends paid – – – (494) (31) (525)
Balance as at 30 June 2014 107 (499) 239 6 722 411 6 980
Balance as at 1 January 2013 107 (579) 77 5 904 108 5 617
Profit for the period – – – 405 17 422
Other comprehensive income:
Currency translation differences – – 78 – – 78
Total comprehensive income for the period ended 30 June 2013 – – 78 405 17 500
Sale of treasury shares – 53 – – – 53
Loss on sale of treasury shares – – – (53) – (53)
Transfer to reserves – – 2 (2) – –
Share-based payments – – – 42 – 42
Dividends paid – – – (467) (25) (492)
Interest acquired from non-controlling interest – – – – (1) (1)
Balance as at 30 June 2013 107 (526) 157 5 829 99 5 666
C O N S O L I d A T E d S T A T E m E N T O f C h A N g E S I N E q u I T Y

54
C O N S O L I d A T E d S T A T E m E N T O f C A S h f L O w S
Notes
ReviewedSix months
ended 30 June 2014
R million
ReviewedSix months
ended 30 June 2013
R million
AuditedYear ended
31 Dec 2013R million
Cash generated from operations 930 516 1 616 Interest paid (48) (34) (118)Income tax paid (101) (88) (221)Net cash from operating activities 781 394 1 277
Cash flows from investing activitiesCash generated from/(utilised in) investment activities 125 (130) (945)Settlement of fence derivative (297) – – Acquisition of subsidiary 11 – (9) (105)Cash acquired through acquisition of subsidiary 11 – 15 15 Purchases of equipment (13) (17) (36)Purchases of software (48) (8) (71)Proceeds from sale of equipment – 1 1 Acquisition of associated companies – – (88)Capitalisation of associated company (17) – – Proceeds from sale of associated companies – – 63 Acquisition of book of business – (9) (9)Net cash from investing activities (250) (157) (1 175)
Cash flows from financing activitiesPurchase of treasury shares (33) – – Proceeds from issue of target shares – – 277 (Decrease)/increase in investment contract liabilities (101) (19) 29 Increase in collateral guarantee contracts 5 5 7 Dividends paid to company’s shareholders (494) (467) (745)Dividends paid to non-controlling interest (31) (25) (37)Increase in cell owners’ interest 40 37 111 Net cash used in financing activities (614) (469) (358)
Net decrease in cash and cash equivalents (83) (232) (256)Cash and cash equivalents at beginning of period 2 343 2 471 2 471 Exchange gains on cash and cash equivalents 32 94 128 Cash and cash equivalents at end of period 2 292 2 333 2 343

55
N O T E S T O T h E I N T E R I m f I N A N C I A L I N f O R m A T I O N
1. Basis of preparation The condensed consolidated interim financial statements are prepared in accordance with International Financial
Reporting Standard (IFRS), IAS 34 Interim Financial Reporting, the SAICA Financial Reporting Guides as issued by the Accounting Practices Committee and Financial Pronouncements as issued by the Financial Reporting Standards Council and the requirements of the Companies Act of South Africa.
2. Accounting policies The accounting policies applied in the preparation of the consolidated financial statements from which the summary
consolidated financial statements were derived are in terms of International Financial Reporting Standards and are consistent with those accounting policies applied in the preparation of the previous consolidated annual financial statements.
The following new IFRSs and/or IFRICs were effective for the first time from 1 January 2014: – Amendments to IFRS 10, IFRS 12 and IAS 27, Investment entities – Amendment to IAS 32, Offsetting Financial Assets and Financial Liabilities – Amendment to IAS 36, Recoverable amount disclosures for non-financial assets – Amendment to IAS 39, Novation of derivatives and continuation of hedge accounting – IFRIC 21, Levies
There was no material impact on the summary financial statements identified based on management’s assessment of these standards.
3. Estimates The preparation of condensed consolidated financial statements requires management to make judgements, estimates
and assumptions that affect the application of accounting policies and the reported amounts of assets and liabilities, income and expense. Actual results may differ from these estimates.
In preparing these condensed consolidated financial statements, the significant judgements made by management in applying the group’s accounting policies and the key sources of estimation uncertainty were the same as those that applied to the consolidated annual financial statements for the year ended 31 December 2013.
4. Risk management The group’s activities expose it to a variety of financial risks: market risk (including price risk, interest rate risk, foreign
currency risk and derivatives risk), credit risk and liquidity risk. Insurance activities expose the group to insurance risk (including pricing risk, reserving risk, accumulation risk and reinsurance risk). The group is also exposed to operational risk and legal risk.
The capital risk management philosophy is to maximise the return on shareholders’ capital within an appropriate risk framework.
The condensed consolidated financial statements do not include all risk management information and disclosure required in the annual financial statements and should be read in conjunction with the group’s annual financial statements as at 31 December 2013.
There have been no changes in the risk management policies since the previous year-end.

56
N O T E S T O T h E I N T E R I m f I N A N C I A L I N f O R m A T I O N
5. Segment information Segments are reported in a manner consistent with the internal reporting provided to the chief operating decision-maker.
The chief operating decision-maker has been identified as the Chief Executive Officer, supported by the group executive committee.
The group consists of two core operating segments, i.e. insurance and investment activities.
Insurance activities are all core general insurance and reinsurance underwriting activities directly undertaken by the group and are analysed by insurance class. The performance of insurance activities is based on gross written premium as a measure of growth; with net underwriting result and net insurance result as measures of profitability.
Investment activities are all investment-related activities undertaken by the group other than strategic diversification activities. Investment activities are measured based on net investment income and net income from associated companies.
Given the nature of the operations there is no single external client that provides 10% or more of the group’s revenues.
Insurance business denominated in foreign currencies is covered by foreign denominated bank accounts. Foreign exchange movements on underwriting results are therefore offset against the foreign exchange movements recognised on the bank accounts.
The MiWay deferred bonus plan (DBP), relating to the compensation of the 10% share previously held by management in MiWay and the Santam black economic empowerment (BEE) transaction costs are unrelated to the core underwriting, investment or strategic diversification performance of the group. Therefore, these costs are disclosed as unallocated activities.
Santam Ltd is domiciled in South Africa. Geographical analysis of gross written premium and non-current assets and liabilities is based on the countries in which the business is underwritten or managed. Non-current assets comprise goodwill and intangible assets, property and equipment, investments in associates and SEM target shares (included in financial instruments).

57
N O T E S T O T h E I N T E R I m f I N A N C I A L I N f O R m A T I O N
5.1 For the six months ended 30 June 2014
Business activityInsurance R million
Investment R million
UnallocatedR million
Total R million
Revenue 10 525 495 11 020
Gross written premium 10 525 10 525
Net written premium 8 060 8 060
Net earned premium 8 459 8 459
Claims incurred 5 448 5 448
Net commission 910 910
Management expenses 1 473 1 473
Underwriting result 628 628
Investment return on insurance funds 222 222
Net insurance result 850 850
Investment income net of management fee and finance costs 413 413
Income from associates net of impairment and losses on sale 17 17
MiWay DBP and Santam BEE transaction costs (20) (20)
Amortisation of intangible assets (15) (15)
Income before taxation 835 430 (20) 1 245
The group’s insurance activities are further analysed over various classes of short-term insurance.
Insurance class
Gross written
premiumR million
Under-writing result
R million
Accident and health 160 (3)
Alternative risk 992 (13)
Crop 70 187
Engineering 538 69
Guarantee 14 2
Liability 544 119
Miscellaneous 26 1
Motor 4 715 199
Property 3 103 36
Transportation 363 31
Total 10 525 628
Comprising:
Commercial insurance 5 319 582
Personal insurance 4 214 59
Alternative risk 992 (13)
Total 10 525 628

58
N O T E S T O T h E I N T E R I m f I N A N C I A L I N f O R m A T I O N
5.2 Investment activities
For detailed analysis of investment activities refer to notes 6 and 8.
5.3 Geographical analysis
Gross written premium
June 2014R million
Non-current assets
June 2014R million
Gross written premiumDec 2013R million
Non-currentassets
Dec 2013R million
South Africa¹ 9 892 1 399 19 585 1 393
Africa² 488 186 845 117
Southeast Asia and India 97 564 123 484
China 48 – 78 –
Group total 10 525 2 149 20 631 1 994
¹ Includes all gross written premium managed by specialist business units.² Includes gross written premium relating to Santam Namibia of R458 million (Dec 2013: R812 million).

59
5.4 For the six months ended 30 June 2013
Business activity
Insurance activitiesR million
Investment activitiesR million
UnallocatedR million
Total R million
Revenue 9 858 282 10 140 Gross written premium 9 858 9 858 Net written premium 7 769 7 769 Net earned premium 8 096 8 096 Claims incurred 5 715 5 715 Net commission 1 028 1 028 Management expenses 1 251 1 251 Underwriting result 102 102 Investment return on insurance funds 195 195 Net insurance result 297 297 Investment income net of management fee and finance costs 244 244 Income from associates 23 23 MiWay DBP and Santam BEE transaction costs (19) (19)Amortisation of intangible assets (30) (30)Income before taxation 267 267 (19) 515
Insurance class
Gross written premiumR million
Underwriting result
R million
Accident and health 151 31 Alternative risk 1 153 (8)Crop 55 (112)Engineering 529 59 Guarantee 26 4 Liability 552 67 Miscellaneous 15 1 Motor 4 329 60 Property 2 776 (16)Transportation 272 16 Total 9 858 102
Comprising:Commercial insurance 4 754 119 Personal insurance 3 951 (9)Alternative risk 1 153 (8)Total 9 858 102
N O T E S T O T h E I N T E R I m f I N A N C I A L I N f O R m A T I O N

60
5.5 For the year ended 31 December 2013
Business activity
Insurance activitiesR million
Investment activitiesR million
UnallocatedR million
Total R million
Revenue 20 631 942 21 573 Gross written premium 20 631 20 631 Net written premium 16 900 16 900 Net earned premium 16 751 16 751 Claims incurred 11 607 11 607 Net commission 2 121 2 121 Management expenses 2 545 2 545 Underwriting result 477 477 Investment return on insurance funds 374 374 Net insurance result 851 851 Investment income net of management fee and finance costs 710 710 Income from associates net of impairment 42 42 MiWay DBP and Santam BEE transaction costs (30) (30)Amortisation of intangible asset (100) (100)Income before taxation 751 752 (30) 1 473
Insurance class
Gross written premiumR million
Underwriting result
R million
Accident and health 316 50 Alternative risk 1 931 2Crop 831 (142)Engineering 1 010 210 Guarantee 43 11 Liability 1 194 119 Miscellaneous 47 2Motor 8 887 199Property 5 832 (2)Transportation 540 28 Total 20 631 477
Comprising:Commercial insurance 10 697 520 Personal insurance 8 003 (45)Alternative risk 1 931 2Total 20 631 477
N O T E S T O T h E I N T E R I m f I N A N C I A L I N f O R m A T I O N

61
The table below analyses financial instruments, carried at fair value through income, by valuation method. There were no significant changes in the valuation methods applied since 31 December 2013. The different levels have been defined as follows:– Level 1: Quoted prices (unadjusted) in active markets for identical assets or liabilities– Level 2: Input other than quoted prices included within Level 1 that is observable for the asset or liability, either
directly (that is, prices) or indirectly (that is, derived from prices)– Level 3: Input for the asset or liability that is not based on observable data (that is, unobservable input)
There were no transfers between the different levels defined above during the period.
All derivative instruments are classified as investments held for trading. The rest of the investment portfolio is designated as financial assets at fair value through income based on the principle that the entire portfolio is managed on a fair value basis.
Financial assets at fair value through income
June 2014Level 1
R millionLevel 2
R millionLevel 3
R millionTotal
R million
Equity securitiesQuoted
Listed 3 006 – – 3 006 Unitised funds – 98 – 98 Irredeemable preference shares 2 – – 2
Unquoted – – 646 646 Total equity securities 3 008 98 646 3 752 Debt securities
QuotedGovernment and public bonds 1 495 165 – 1 660 Redeemable preference shares – 244 – 244 Money market instruments > 1 year – 1 521 – 1 521
UnquotedGovernment and public bonds – 47 – 47 Money market instruments > 1 year – 3 987 – 3 987 Redeemable preference shares – 50 29 79
Total debt securities 1 495 6 014 29 7 538 Derivatives
Interest rate swaps – – – – Foreign exchange contracts – – – – Fence – – – –
Total derivatives – – – – Short-term money market instruments – 1 758 – 1 758
4 503 7 870 675 13 048
Reviewed At 30 June
2014R million
Reviewed At 30 June
2013R million
Audited At 31 Dec
2013R million
6. Financial assets and liabilities at fair value through incomeFinancial assets at fair value through incomeThe group's financial assets are summarised below by measurement category.Financial assets at fair value through income 13 048 11 702 12 742 Loans and receivables 2 079 2 045 2 684 Total financial assets 15 127 13 747 15 426
N O T E S T O T h E I N T E R I m f I N A N C I A L I N f O R m A T I O N

62
June 2013Level 1
R millionLevel 2
R millionLevel 3
R millionTotal
R million
Equity securitiesQuoted
Listed 2 830 – – 2 830Unitised funds – 118 – 118Irredeemable preference shares 2 – – 2
Unquoted – – 324 324Total equity securities 2 832 118 324 3 274Debt securities
QuotedGovernment and public bonds 1 768 62 – 1 830Redeemable preference shares – 281 – 281Money market instruments > 1 year – 1 515 – 1 515
UnquotedGovernment and public bonds – 53 – 53Money market instruments > 1 year – 3 535 – 3 535Redeemable preference shares – – 29 29
Total debt securities 1 768 5 446 29 7 243Derivatives
Interest rate swaps – – 2 2Foreign exchange contracts – – 1 1Fence – – 8 8
Total derivatives – – 11 11Short-term money market instruments – 1 174 – 1 174
4 600 6 738 364 11 702 December 2013Equity securities
QuotedListed 3 350 – – 3 350Unitised funds – 130 – 130Irredeemable preference shares 2 – – 2
Unquoted – – 529 529Total equity securities 3 352 130 529 4 011Debt securities
QuotedGovernment and public bonds 1 607 178 – 1 785Redeemable preference shares – 288 – 288Money market instruments > 1 year – 1 636 – 1 636
UnquotedGovernment and public bonds – 54 – 54Money market instruments > 1 year – 3 520 – 3 520Redeemable preference shares – – 23 23
Total debt securities 1 607 5 676 23 7 306Derivatives
Interest rate swaps – – 1 1Total derivatives – – 1 1Short-term money market instruments – 1 424 – 1 424
4 959 7 230 553 12 742
N O T E S T O T h E I N T E R I m f I N A N C I A L I N f O R m A T I O N

63
The following table presents the changes in level 3 instruments
June 2014
Equitysecuritiesunquoted R million
Debt securitiesunquoted
redeemablepreference
sharesR million
DerivativesR million
TotalR million
Opening balance 529 23 (203) 349
Acquisitions 41 – – 41
Disposals/settlements – – 297 297
Gains/(losses) recognised in profit or loss 76 6 (94) (12)
Closing balance 646 29 – 675
The investment in Cardrow Insurance Ltd was classified as held for sale during 2013 (refer to note 8). The investment had an opening balance of R299 million with exchange gains of R13 million and unrealised fair value losses of R3 million during the year. The closing balance at 30 June 2014 amounted to R309 million.
June 2013
Opening balance 272 29 6 307
Acquisitions 1 – 1 2
Disposals (40) – – (40)
Exchange rate differences 23 – – 23
Gains/(losses) recognised in profit or loss 68 – 4 72
Closing balance 324 29 11 364
Unquoted equity securities consist mainly of the investment in Cardrow Insurance Ltd. This investment was classified as non-current assets held for sale in December 2013.
December 2013
Opening balance 272 29 6 307
Acquisitions 511 – – 511
Interest and dividends capitalised 1 – – 1
Disposals (39) – – (39)
Classified as held for sale (299) – – (299)
Exchange rate differences 64 – – 64
Gains/(losses) recognised in profit or loss 19 (6) (209) (196)
Closing balance 529 23 (203) 349
The investment in Cardrow Insurance Ltd was classified as non-current assets held for sale during 2013 (refer to note 8). The investment had an opening balance of R233 million with exchange gains of R64 million and unrealised fair value gains of R2 million during the year. The closing balance at 31 December 2013 amounted to R299 million.
N O T E S T O T h E I N T E R I m f I N A N C I A L I N f O R m A T I O N

64
Financial liabilities at fair value through income
June 2014Level 1
R millionLevel 2
R millionLevel 3
R millionTotal
R million
Debt securities 1 013 – – 1 013
Investment contracts – 26 – 26
1 013 26 – 1 039
June 2013
Debt securities 1 022 – – 1 022
Investment contracts – 77 – 77
1 022 77 – 1 099
December 2013
Debt securities 1 021 – – 1 021
Investment contracts – 126 – 126
Derivatives
Fence – – 204 204
1 021 126 204 1 351
In June 2014 and December 2013, the unquoted equity instruments recognised as level 3 instruments consist mainly of the participation instruments issued by SEM. The June 2013 balance consisted mainly of the investment in Cardrow Insurance Ltd, which has been classified as held for sale.
The fair value of the SEM target shares is determined using discounted cash flow models. The most significant assumptions used in these models are the discount rate, exchange rate and net insurance margin profile expectations. Should the discount rates increase or decrease by 10% , the cumulative value of the most significant target shares would decrease by R104 million (December 2013: R93 million) or increase by R162 million (December 2013: R147 million) respectively. If exchange rates increase or decrease by 10%, the cumulative fair values will also increase or decrease by R56 million (December 2013: R50 million). Should the net insurance margin profile (projected over a period of 10 years) increase or decrease by 10%, the cumulative fair values will increase by R66 million (December 2013: R64 million) or decrease by R66 million (December 2013: R62 million) respectively.
The interest rate derivatives represent the fair value of interest rate swaps effected on a total of R106 million (December 2013: R108 million; June 2013: R110 million) of fixed interest securities held in the investment portfolio underlining the subordinated callable note. The interest rate swaps have the effect of swapping a variable interest rate for a fixed interest rate on these assets to eliminate interest rate risk on assets supporting the bond liability. The derivatives mature on 30 September 2016 and 10 June 2017.
During the first half of 2013 Santam entered into three derivative fence structures between 28 March 2013 and 8 May 2013 covering equities to the value of R2 billion. All three tranches had downside protection of 10% with upside participation of 9.7%, 9.6% and 9.5% respectively. The implementation levels were 7593 (SWIX40 index), 7515 and 7694 respectively. A negative fair value of R204 million was recorded as at 31 December 2013 and a loss of R93 million was incurred during the six months to 30 June 2014. The final tranche expired in May 2014 and the hedge was not renewed.
N O T E S T O T h E I N T E R I m f I N A N C I A L I N f O R m A T I O N

65
Reviewed At
30 June 2014R million
Reviewed At
30 June 2013 R million
Audited At
31 Dec 2013 R million
7. Insurance liabilities and reinsurance assets
Gross
Long-term insurance contracts
– claims reported and loss adjustment expenses 12 7 3
– claims incurred but not reported 23 15 22
Short-term insurance contracts
– claims reported and loss adjustment expenses 5 613 5 071 5 520
– claims incurred but not reported 1 459 1 423 1 427
– unearned premiums 3 366 3 169 3 719
Total insurance liabilities – gross 10 473 9 685 10 691
Non-current liabilities 1 561 1 452 1 595
Current liabilities 8 912 8 233 9 096
Recoverable from reinsurers
Long-term insurance contracts
– claims reported and loss adjustment expenses 5 2 1
– claims incurred but not reported 4 3 4
Short-term insurance contracts
– claims reported and loss adjustment expenses 1 404 1 050 1 315
– claims incurred but not reported 219 277 207
– unearned premiums 880 730 817
Total reinsurers’ share of insurance liabilities 2 512 2 062 2 344
Non-current assets 140 126 117
Current assets 2 372 1 936 2 227
Net
Long-term insurance contracts
– claims reported and loss adjustment expenses 7 5 2
– claims incurred but not reported 19 12 18
Short-term insurance contracts
– claims reported and loss adjustment expenses 4 209 4 021 4 205
– claims incurred but not reported 1 240 1 146 1 220
– unearned premiums 2 486 2 439 2 902
Total insurance liabilities – net 7 961 7 623 8 347
N O T E S T O T h E I N T E R I m f I N A N C I A L I N f O R m A T I O N

66
8. Non-current assets held for saleSantam Ltd initially set up the Santam International Group to facilitate the expansion into Europe. Santam International Ltd (Santam International) directly and indirectly held three subsidiaries called Santam UK Ltd, Westminster Motor Insurance Agency Ltd (WMIA) and Santam Europe Ltd (Europe). The holdings in WMIA and Europe were sold in 2008 and Santam International only retained deferred conditional rights relating to the sale contracts. WMIA and Europe were renamed subsequent to the sale to Cardrow Insurance Ltd and Beech Hill Insurance Ltd, respectively.
Santam Ltd will realise the deferred conditional rights relating to Cardrow and Beech Hill as and when they become unconditional and therefore these assets have been recognised as held for sale in the group as at 31 December 2013. This process is expected to be concluded by no later than June 2015.
Once the assets have been realised, management will commence a process to unwind the Santam International Group. The investment in Santam International as well as the loan to Santam International have therefore been classified as current assets on a company level. The completion of the unwinding process is subject to Regulatory approval.
In accordance with IFRS 5, the assets held for sale were recognised at their fair value less costs to sell. This is a non-recurring fair value based on the net asset value of the business and related costs that will be incurred in order to conclude the unwinding process. It was therefore also recognised within level 3 of the fair value hierarchy.
Reviewed At 30 June
2014R million
Audited At 31 Dec
2013R million
Assets that are classified as held for sale
Financial assets – at fair value through income
Equity securities 309 299
Loans and receivables including insurance receivables 120 116
429 415
N O T E S T O T h E I N T E R I m f I N A N C I A L I N f O R m A T I O N

67
ReviewedAt
30 June 2014 R million
ReviewedAt
30 June 2013 R million
AuditedAt
31 Dec 2013 R million
9. Investment income and net gains/(losses) on financial assets and liabilities at fair value through incomeInvestment income 377 363 782
Dividend income 68 59 177 Interest income 294 242 514 Foreign exchange differences 15 62 91
Net gains on financial assets and liabilities at fair value through income 323 150 449
Net realised gains on financial assets 430 320 368 Net fair value (losses)/gain on financial assets designated as at fair value through income (14) (222) 240 Net fair value (loss)/gains on financial assets held for trading (5) 13 13 Net realised/fair value (losses)/gain on derivatives (93) 5 (209)Net fair value losses on short-term money market instruments (4) – (3)Net fair value gains on financial liabilities designated as at fair value through income 9 34 40
Net fair value gains on debt securities 9 36 37 Net fair value (loss)/gain on investment contracts – (2) 3
700 513 1 231
10. Income taxSouth African normal taxation
Current year 283 122 259 Charge for the year 283 122 258 STC – – 1
Prior year 2 2 (4)Recovered from cell owners (33) (32) (66)
Foreign taxation 15 17 40 Income taxation for the year 267 109 229 Deferred taxation 25 (14) 74
Current year 35 1 75 Prior year (10) (15) (1)
Recovered from cell owners – (2) (3) 292 93 300
Reconciliation of taxation rate (%)Normal South African taxation rate 28.0 28.0 28.0Adjust for– Exempt income (1.4) (3.6) (3.4)– Investment results (2.6) (2.6) (2.0)– STC – – 0.1– Deferred tax not raised on prior year changes – (2.9) – – Other (0.5) (0.8) (2.3)Net reduction (4.5) (9.9) (7.6)Effective rate 23.5 18.1 20.4
N O T E S T O T h E I N T E R I m f I N A N C I A L I N f O R m A T I O N

68
11. Business combinations
2014There were no material business combinations during the six months ended 30 June 2014.
2013AdditionsTravel Insurance Consultants (Pty) LtdSantam Ltd acquired 100% of the shareholding in Travel Insurance Consultants (Pty) Ltd (TIC) with effect from 1 June 2013. TIC is one of the leading travel insurance underwriting managers and has been in operation for over 25 years. The purchase price amounted to R95 million. The goodwill of R76 million arises from a number of factors such as obtaining economies of scale and unrecognised assets such as the workforce. Key business relationships of R16 million, brandname of R1 million and an additional deferred tax liability of R6 million were also recognised on acquisition.
Provisional accounting was applied for the six months to 30 June 2013.
ReviewedSix months
ended30 June 2013
AuditedYear ended
31 Dec 2013
Details of the assets and liabilities acquired at fair value are as follows: Intangible assets 32 22 Loans and receivables 7 1 Cash and cash equivalents 15 15 Deferred taxation (9) (7)Trade and other payables (12) (12)Net asset value acquired 33 19 Goodwill 62 76 Deferred purchase consideration payable in July 2013 (95) – Purchase consideration paid – 95
Beyonda Group (Pty) Ltd Centriq Insurance Holdings Ltd acquired the additional 51% of the shareholding in Beyonda Group (Pty) Ltd for an amount of R8 million with effect 1 March 2013. Intangible assets of R15 million, net assets of R1 million as well as a profit on the sale of the investment in associate previously held of R1 million were recognised. The fair value of the investment in associate previously held was R7 million.
N O T E S T O T h E I N T E R I m f I N A N C I A L I N f O R m A T I O N
69
ReviewedSix months
ended30 June 2014
ReviewedSix months
ended30 June 2013
AuditedYear ended
31 Dec 2013
12. Earnings per share
Basic earnings per share
Profit attributable to the company’s equity holders (R million) 911 405 1 120
Weighted average number of ordinary shares in issue (million) 114.12 113.89 114.12
Earnings per share (cents) 799 356 982
Diluted earnings per share
Profit attributable to the company’s equity holders (R million) 911 405 1 120
Weighted average number of ordinary shares in issue (million) 114.12 113.89 114.12
Adjusted for share options 0.70 0.83 1.00
Weighted average number of ordinary shares for diluted earnings per share (million) 114.82 114.72 115.12
Diluted basic earnings per share (cents) 794 353 973
Headline earnings per share
Profit attributable to the company’s equity holders 911 405 1 120
Adjust for:
Impairment charge on net investment of associates – 11 26
Impairment of goodwill – – 5
Net loss on sale of investment in associate – – 18
Tax charge – – 9
Headline earnings (R million) 911 416 1 178
Weighted average number of ordinary shares in issue (million) 114.12 113.89 114.12
Headline earnings per share (cents) 799 365 1 033
Diluted headline earnings per share
Headline earnings (R million) 911 416 1 178
Weighted average number of ordinary shares for diluted earnings per share (million) 114.82 114.72 115.12
Diluted headline earnings per share (cents) 794 363 1 023
13. Dividend per share
Dividend per share (cents) 262 242 675
N O T E S T O T h E I N T E R I m f I N A N C I A L I N f O R m A T I O N
NON-EXECUTIVE DIRECTORS SANTAM HEAD OFFICE AND REGISTERED ADDRESS
B Campbell, MD Dunn, MP Fandeso, 1 Sportica Crescent
BTPKM Gamedze, GG Gelink (Chairman), Tyger Valley, Bellville 7530
MLD Marole, MJ Reyneke, JP Möller, J van Zyl PO Box 3881, Tyger Valley 7536
Tel: 021 915 7000
Fax: 021 914 0700
EXECUTIVE DIRECTORS www.santam.co.za
IM Kirk (Chief Executive Officer),
HD Nel (Chief Financial Officer), Y Ramiah
Registration number 1918/001680/06
ISIN ZAE000093779
COMPANY SECRETARY JSE share code: SNT
Masood Allie NSX share code: SNM
TRANSFER SECRETARIES SPONSOR
Computershare Investor Services (Pty) Ltd Investec Bank Ltd
70 Marshall Street, Johannesburg 2001
PO Box 61051, Marshalltown 2107
Tel: 011 370 5000
Fax: 011 688 7721
www.computershare.com

GREYMATTER & FINCH # 8035

INSuRANCE gOOd ANd PROPERWWW.Santam.CO.Za
Top Related