


Languages
Pages
Legal


The Inevitable Policy Response Forecast Policy Scenario 2021 (IPR FPS 2021):Detailed energy system results
Preparing financial markets for climate-related policy and regulatory risks
December 2021
PRI commissioned the Inevitable Policy Response in 2018 to advance the industry’s knowledge of climate
transition risk, and to support investors’ efforts to incorporate climate risk into their portfolio assessments
A research partnership led by Energy Transition Advisors and Vivid Economics conducts the initiative’s policy
research and scenario modelling and includes 2Dii, Carbon Tracker Initiative, Climate Bonds Initiative, Quinbrook
Infrastructure Partners and Planet Tracker
The consortium was given the mandate to bring leading analytic tools and an independent perspective to assess
the drivers of likely policy action and their implications on the market
IPR is commissioned by the Principles for Responsible Investment (PRI), supported by world class research partners and joined by leading financial institutions
The Inevitable Policy Response: Forecast Policy Scenario (FPS)
Leading financial institutions joined the IPR as Strategic Partners in 2021 to provide more in-depth industry
input, and to further strengthen its relevance to the financial industry
Core philanthropic support since IPR began in 2018. The IPR is funded in part by the Gordon and Betty Moore
Foundation through The Finance Hub, which was created to advance sustainable finance and the ClimateWorks
Foundation striving to innovate and accelerate climate solutions at scale
Who supports the Inevitable Policy Response ?
The Inevitable Policy Response: Forecast Policy Scenario (FPS)

4
Markets inconsistently price transition risk
• Policies will continue interacting with new technologies to deeply
disrupt established industries and economies
• Financial institutions need to deepen their understanding of this
unfolding environment to manage their assets effectively
• Yet the scenarios currently available provide limited intelligence about
the realistic risks and opportunities most critical to the financial sector,
and omit the land sector
The Inevitable Policy Response: Forecast Policy Scenario (FPS)
The IPR helps the financial sector navigate the climate transition
5
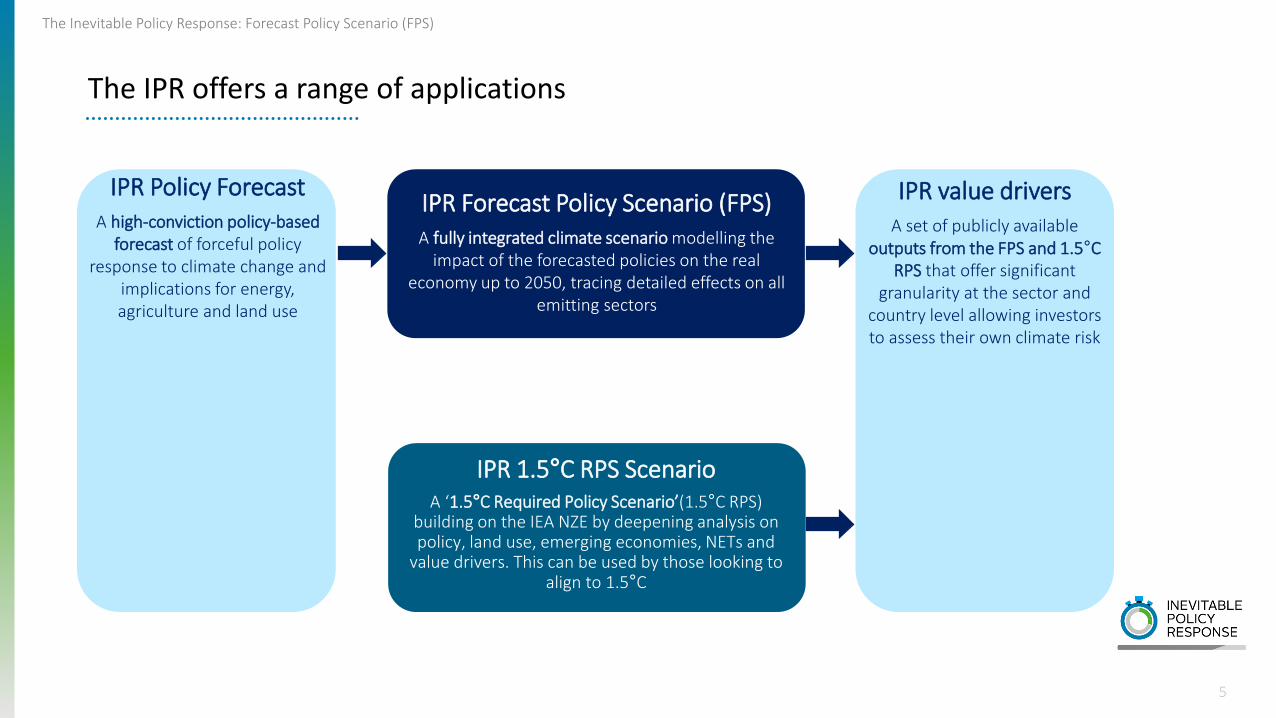
IPR Forecast Policy Scenario (FPS)A fully integrated climate scenario modelling the
impact of the forecasted policies on the real economy up to 2050, tracing detailed effects on all
emitting sectors
IPR 1.5°C RPS ScenarioA ‘1.5°C Required Policy Scenario’(1.5°C RPS)
building on the IEA NZE by deepening analysis on policy, land use, emerging economies, NETs and
value drivers. This can be used by those looking to align to 1.5°C
IPR Policy Forecast A high-conviction policy-based
forecast of forceful policy response to climate change and
implications for energy, agriculture and land use
IPR value driversA set of publicly available
outputs from the FPS and 1.5°C RPS that offer significant
granularity at the sector and country level allowing investors to assess their own climate risk
5
The Inevitable Policy Response: Forecast Policy Scenario (FPS)
The IPR offers a range of applications
6
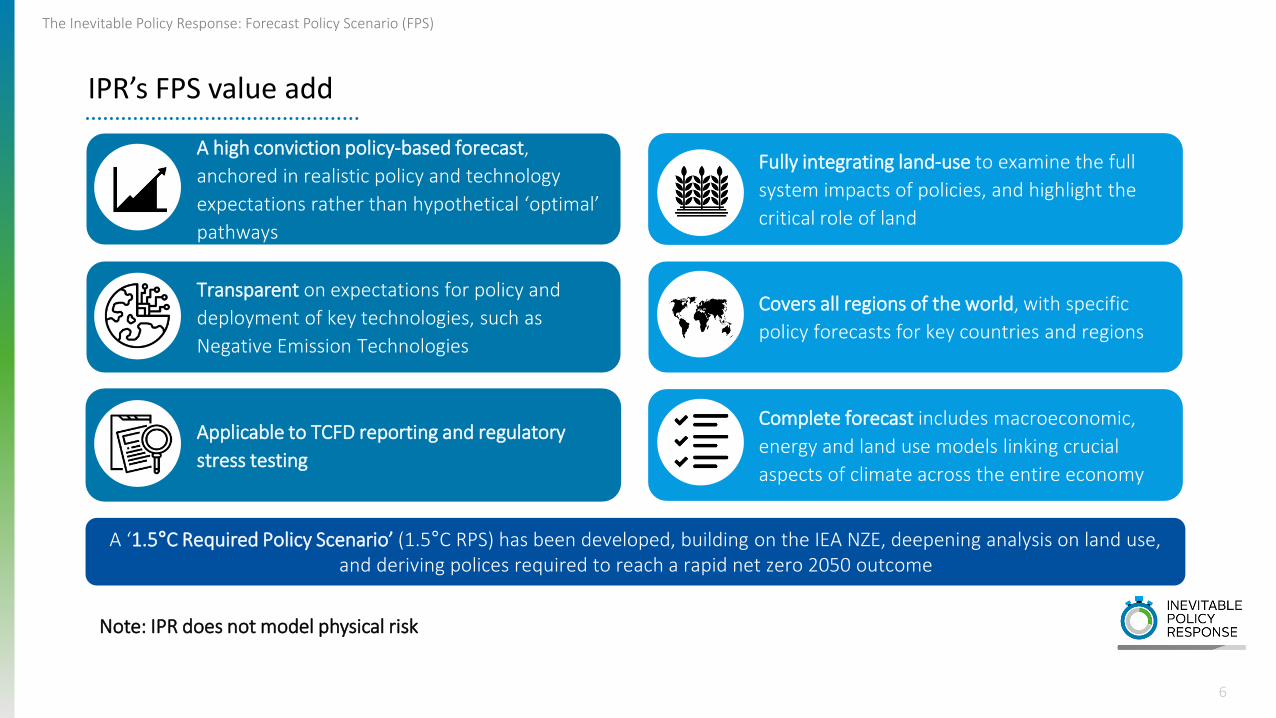
A high conviction policy-based forecast,
anchored in realistic policy and technology
expectations rather than hypothetical ‘optimal’
pathways
Transparent on expectations for policy and
deployment of key technologies, such as
Negative Emission Technologies
Covers all regions of the world, with specific
policy forecasts for key countries and regions
Complete forecast includes macroeconomic,
energy and land use models linking crucial
aspects of climate across the entire economy
Applicable to TCFD reporting and regulatory
stress testing
A ‘1.5°C Required Policy Scenario’ (1.5°C RPS) has been developed, building on the IEA NZE, deepening analysis on land use, and deriving polices required to reach a rapid net zero 2050 outcome
The Inevitable Policy Response: Forecast Policy Scenario (FPS)
IPR’s FPS value add
Fully integrating land-use to examine the full
system impacts of policies, and highlight the
critical role of land
Note: IPR does not model physical risk
The Inevitable Policy Response: Forecast Policy Scenario (FPS)
7
IPR 2021 reports
A series of new IPR reports have been released in 2021. Please visit the PRI website here for more information

Glossary
The Inevitable Policy Response: Forecast Policy Scenario (FPS)
• AgTech - Agriculture technology
• BECCS - Bioenergy with carbon capture and storage
• BNEF - Bloomberg New Energy Finance
• CAGR - Compound average growth rate
• CCS - Carbon capture and storage
• CDR - Carbon dioxide removal
• CH4 - Methane
• CO2 - Carbon dioxide
• CPS - Current Policies Scenario
• DAC - Direct air capture
• LT-DAC - Low temperature solid sorbent
• EV - Electric vehicle
• FPI - Food Price Index
• FPS - Forecast Policy Scenario
• GHG - Greenhouse gas
8
• ICE - Internal Combustion Engine
• IEA - International Energy Agency
• IPR - Inevitable Policy Response
• N2O - Nitrous oxide
• NDC - Nationally determined contributions
• NEO - New Energy Outlook
• NETs - Negative emission technologies
• NPS - New Policies Scenario
• P1 - An IPCC 1.5°C scenario
• P2 - An IPCC 1.5°C scenario
• 1.5°C RPS - 1.5°C Required Policy Scenario
• SDS - Sustainable Development Scenario
• STEPS - Stated Policies Scenario
• TCFD - Task Force on Climate-related Financial Disclosures
• ULEV - Ultra low emission vehicles
• WEO - World Energy Outlook

Contents page
The Inevitable Policy Response: Forecast Policy Scenario (FPS)
• Executive summary overview• CO₂ emissions• Fuel demand• Power and hydrogen• Transport, industry and buildings• Carbon Capture and Storage (CCS)
9
Executive summary overview
10
The Inevitable Policy Response: Forecast Policy Scenario (FPS)
Key findings
11
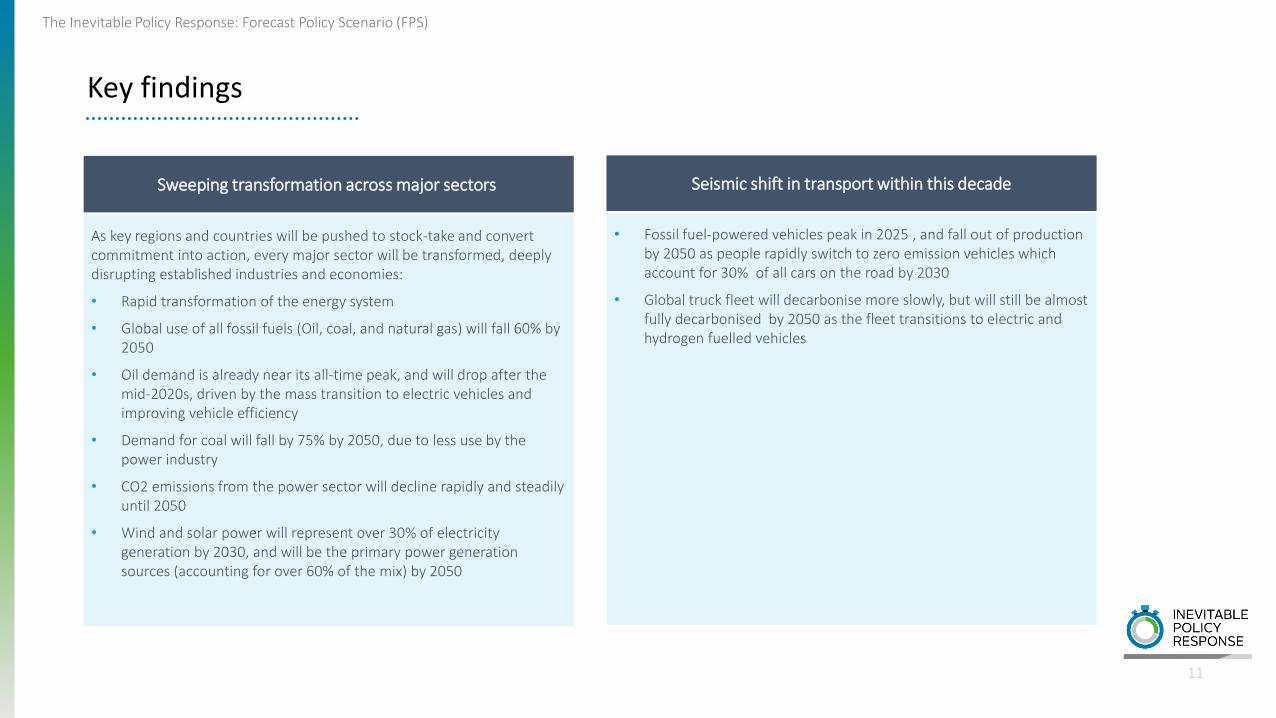
Sweeping transformation across major sectors
As key regions and countries will be pushed to stock-take and convert commitment into action, every major sector will be transformed, deeply disrupting established industries and economies:
• Rapid transformation of the energy system
• Global use of all fossil fuels (Oil, coal, and natural gas) will fall 60% by 2050
• Oil demand is already near its all-time peak, and will drop after the mid-2020s, driven by the mass transition to electric vehicles and improving vehicle efficiency
• Demand for coal will fall by 75% by 2050, due to less use by the power industry
• CO2 emissions from the power sector will decline rapidly and steadily until 2050
• Wind and solar power will represent over 30% of electricity generation by 2030, and will be the primary power generation sources (accounting for over 60% of the mix) by 2050
Seismic shift in transport within this decade
• Fossil fuel-powered vehicles peak in 2025 , and fall out of production by 2050 as people rapidly switch to zero emission vehicles which account for 30% of all cars on the road by 2030
• Global truck fleet will decarbonise more slowly, but will still be almost fully decarbonised by 2050 as the fleet transitions to electric and hydrogen fuelled vehicles

CO2 emissions
The Inevitable Policy Response: Forecast Policy Scenario (FPS)
13
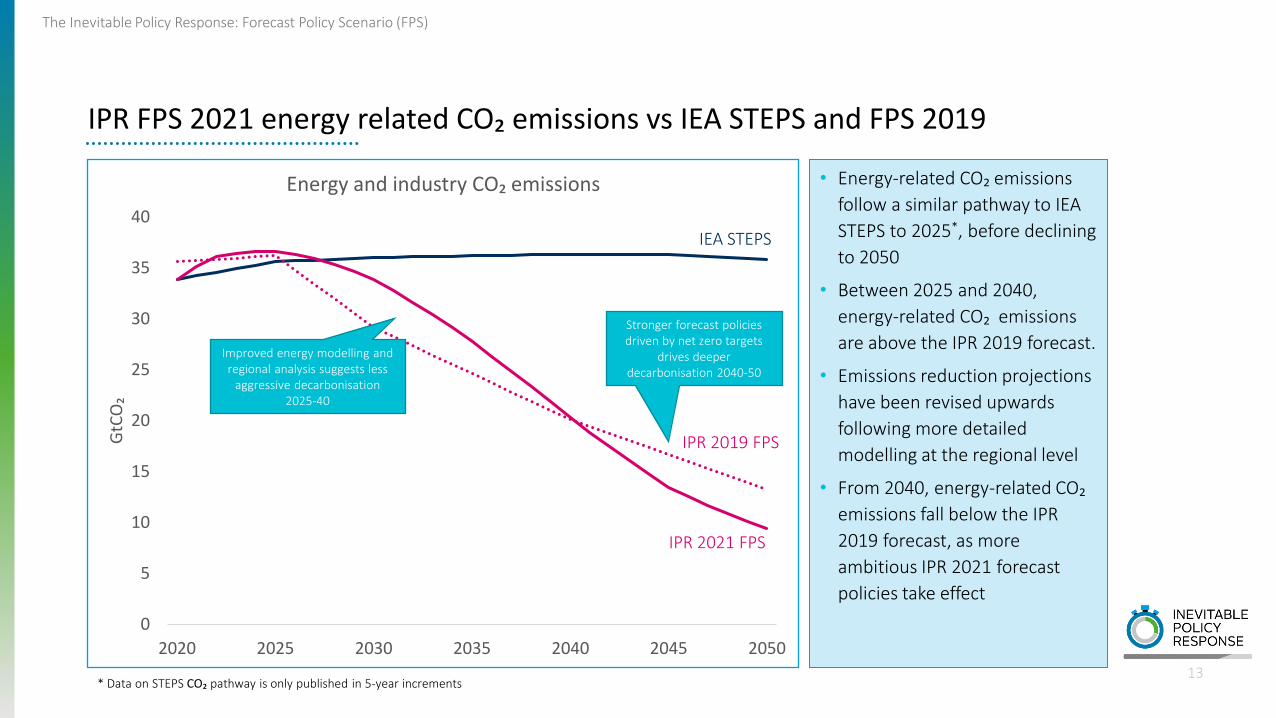
IPR FPS 2021 energy related CO₂ emissions vs IEA STEPS and FPS 2019
• Energy-related CO₂ emissions
follow a similar pathway to IEA
STEPS to 2025*, before declining
to 2050
• Between 2025 and 2040,
energy-related CO₂ emissions
are above the IPR 2019 forecast.
• Emissions reduction projections
have been revised upwards
following more detailed
modelling at the regional level
• From 2040, energy-related CO₂
emissions fall below the IPR
2019 forecast, as more
ambitious IPR 2021 forecast
policies take effect
0
5
10
15
20
25
30
35
40
2020 2025 2030 2035 2040 2045 2050
GtC
O₂
Energy and industry CO₂ emissions
* Data on STEPS CO₂ pathway is only published in 5-year increments
Improved energy modelling and regional analysis suggests less
aggressive decarbonisation 2025-40
Stronger forecast policies driven by net zero targets
drives deeper decarbonisation 2040-50
IEA STEPS
IPR 2019 FPS
IPR 2021 FPS
The Inevitable Policy Response: Forecast Policy Scenario (FPS)
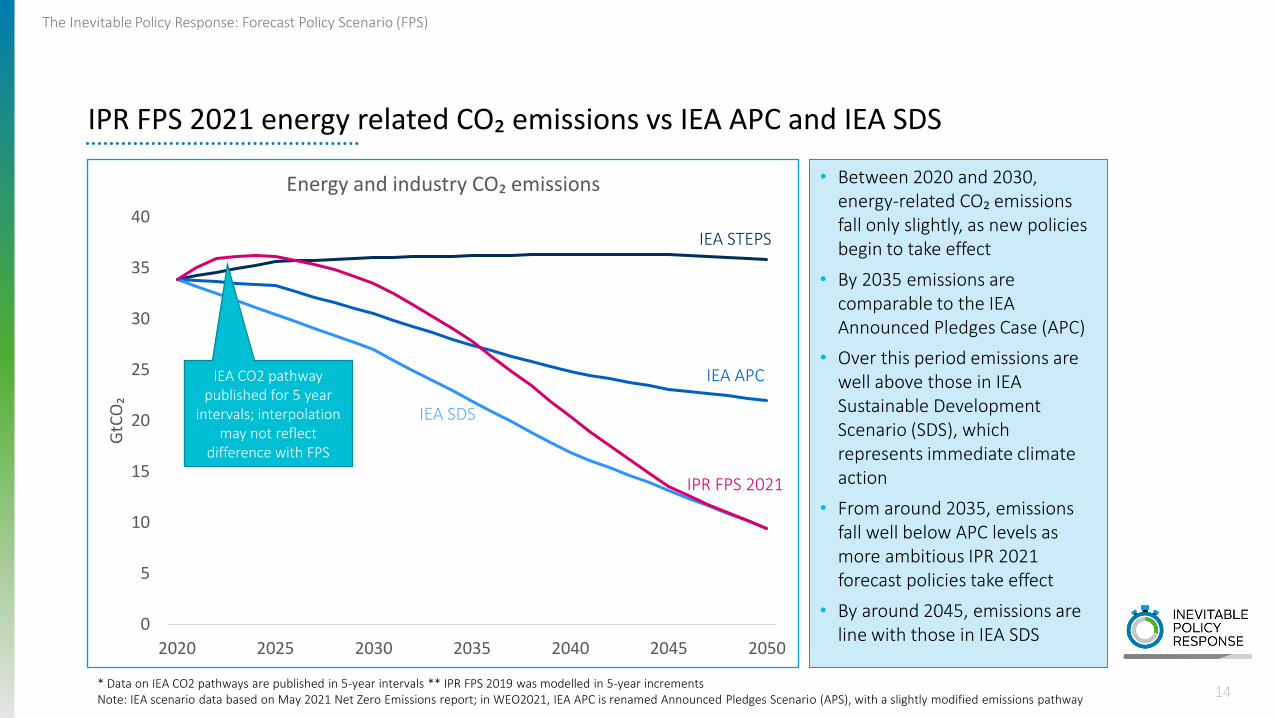
• Between 2020 and 2030, energy-related CO₂ emissions fall only slightly, as new policies begin to take effect
• By 2035 emissions are comparable to the IEA Announced Pledges Case (APC)
• Over this period emissions are well above those in IEA Sustainable Development Scenario (SDS), which represents immediate climate action
• From around 2035, emissions fall well below APC levels as more ambitious IPR 2021 forecast policies take effect
• By around 2045, emissions are line with those in IEA SDS
0
5
10
15
20
25
30
35
40
2020 2025 2030 2035 2040 2045 2050
GtC
O₂
Energy and industry CO₂ emissions
IEA STEPS
IEA APC
IEA SDS
IPR FPS 2021
* Data on IEA CO2 pathways are published in 5-year intervals ** IPR FPS 2019 was modelled in 5-year incrementsNote: IEA scenario data based on May 2021 Net Zero Emissions report; in WEO2021, IEA APC is renamed Announced Pledges Scenario (APS), with a slightly modified emissions pathway
14
IEA CO2 pathway published for 5 year
intervals; interpolation may not reflect
difference with FPS
IPR FPS 2021 energy related CO₂ emissions vs IEA APC and IEA SDS

The Inevitable Policy Response: Forecast Policy Scenario (FPS)
15
By 2050, IPR FPS 2021 decarbonises more rapidly than IEA SDS in power and transport, but more slowly in industry
0.3
1.9
4.9
0.71.0
3.3
3.8
0.8
IPR FPS2021
IEA SDS IPR FPS2021
IEA SDS IPR FPS2021
IEA SDS IPR FPS2021
IEA SDS
Power Transport Industry Buildings
CO₂ emissions by sector in 2050, GtCO₂

Fuel demand

The Inevitable Policy Response: Forecast Policy Scenario (FPS)
17
Biomass, renewables and nuclear grow from around 20% of primary energy in 2020 to around 65% in 2050
• The share of fossil fuels in primary energy falls from around 80% in 2020 to below 40% in 2050
• In contrast, the share of biomass, renewables and nuclear rises substantially
• These low-carbon fuels account for the majority of primary energy by the mid-2040s and for around 65% by 2050
• Overall, around 15% of primary energy is used to produce hydrogen
0
100
200
300
400
500
600
700
2020 2025 2030 2035 2040 2045 2050
EJ p
er y
ear
Primary energy demand
Coal Oil Gas Biomass Renewables and nuclear
The Inevitable Policy Response: Forecast Policy Scenario (FPS)
18
Total fossil fuel demand peaks in the mid-2020s before declining, with coal seeing the fastest fall
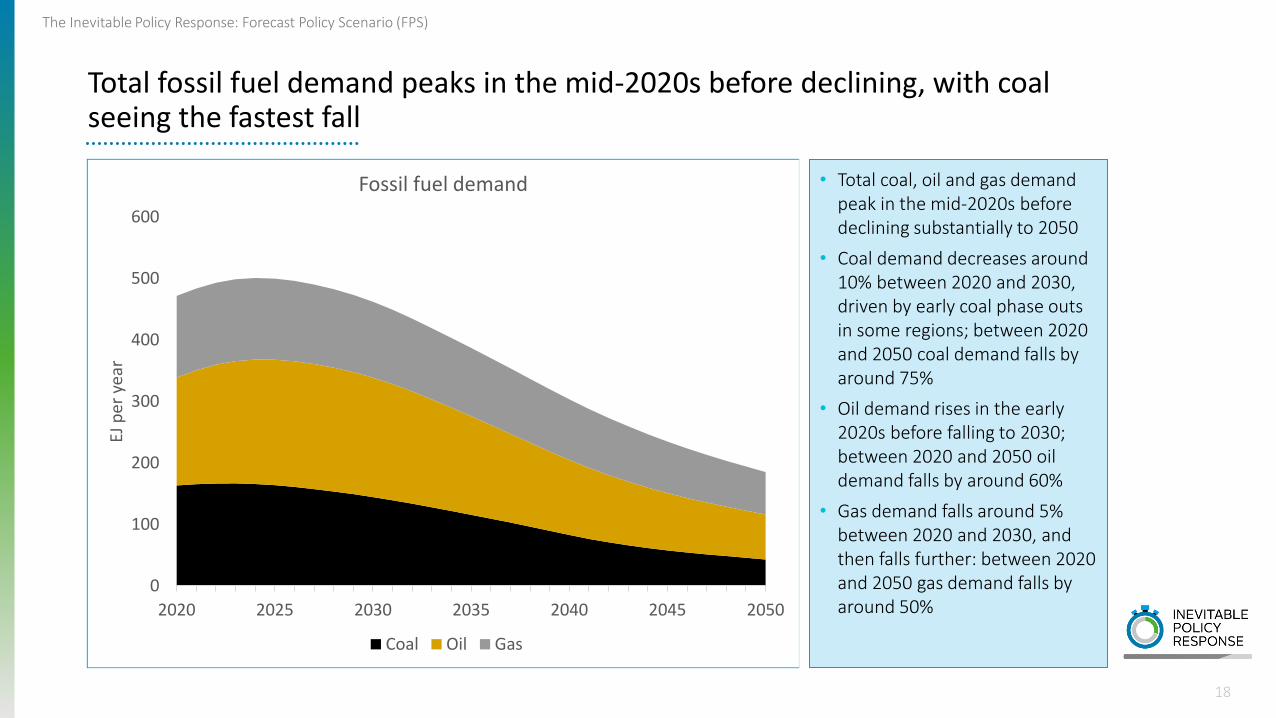
• Total coal, oil and gas demand peak in the mid-2020s before declining substantially to 2050
• Coal demand decreases around 10% between 2020 and 2030, driven by early coal phase outs in some regions; between 2020 and 2050 coal demand falls by around 75%
• Oil demand rises in the early 2020s before falling to 2030; between 2020 and 2050 oil demand falls by around 60%
• Gas demand falls around 5% between 2020 and 2030, and then falls further: between 2020 and 2050 gas demand falls by around 50%
0
100
200
300
400
500
600
2020 2025 2030 2035 2040 2045 2050
EJ p
er y
ear
Fossil fuel demand
Coal Oil Gas
The Inevitable Policy Response: Forecast Policy Scenario (FPS)
0
20
40
60
80
100
120
140
160
180
0
1000
2000
3000
4000
5000
6000
7000
8000
9000
2020 2025 2030 2035 2040 2045 2050
EJ
Mill
ion
to
nn
es
Coal demand by sector
Power Industry Buildings Other
19
Coal demand falls 70%, driven primarily by a reduction in demand in the power sector; by 2050 industry accounts for the largest share of coal demand
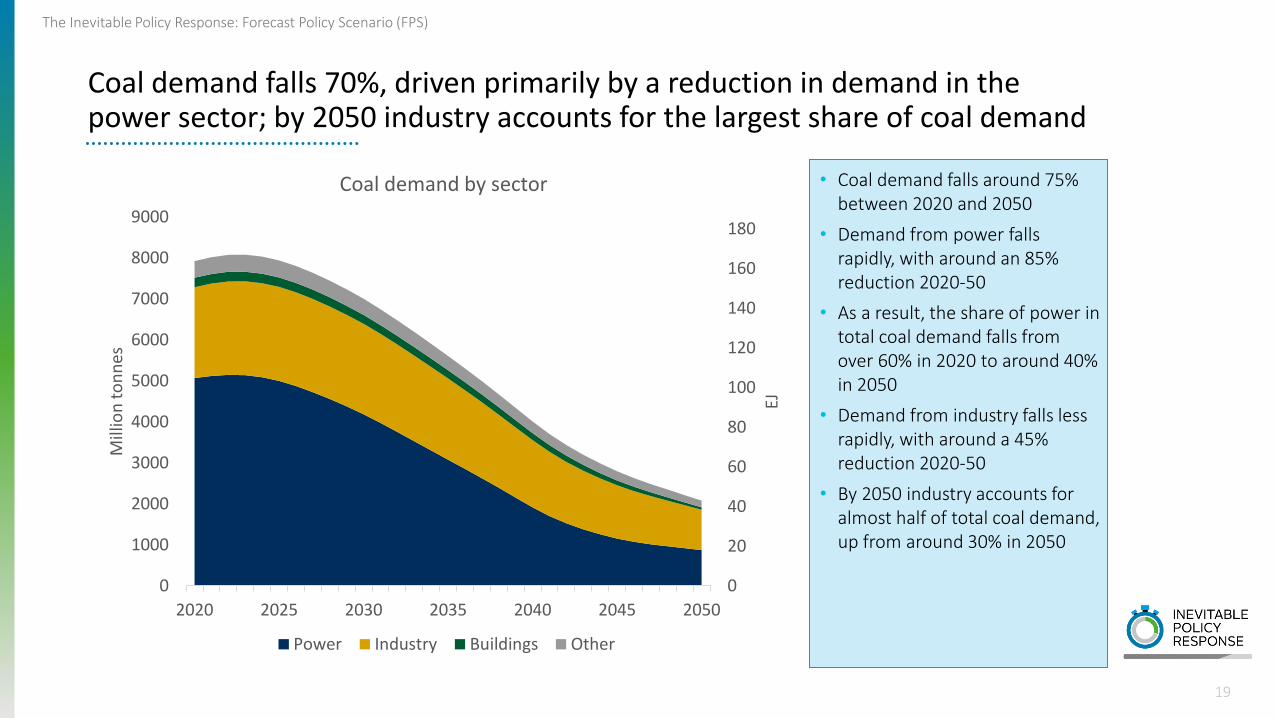
• Coal demand falls around 75% between 2020 and 2050
• Demand from power falls rapidly, with around an 85% reduction 2020-50
• As a result, the share of power in total coal demand falls from over 60% in 2020 to around 40% in 2050
• Demand from industry falls less rapidly, with around a 45% reduction 2020-50
• By 2050 industry accounts for almost half of total coal demand, up from around 30% in 2050
The Inevitable Policy Response: Forecast Policy Scenario (FPS)
20
Relative to IEA’s Sustainable Development Scenario, coal demand declines to similar levels, but is higher in power and lower in industry
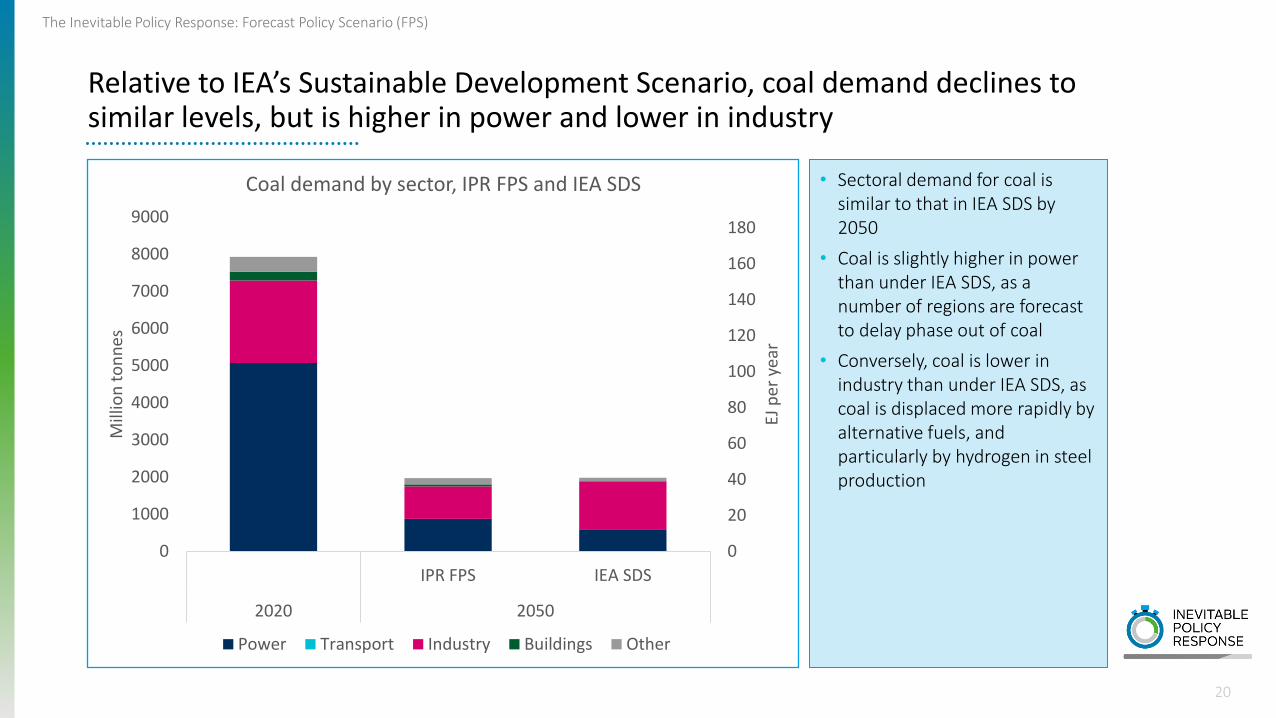
• Sectoral demand for coal is similar to that in IEA SDS by 2050
• Coal is slightly higher in power than under IEA SDS, as a number of regions are forecast to delay phase out of coal
• Conversely, coal is lower in industry than under IEA SDS, as coal is displaced more rapidly by alternative fuels, and particularly by hydrogen in steel production
0
20
40
60
80
100
120
140
160
180
0
1000
2000
3000
4000
5000
6000
7000
8000
9000
IPR FPS IEA SDS
2020 2050
EJ p
er y
ear
Mill
ion
to
nn
es
Coal demand by sector, IPR FPS and IEA SDS
Power Transport Industry Buildings Other

The Inevitable Policy Response: Forecast Policy Scenario (FPS)
21
Oil demand peaks in 2025, and falls around 60% between 2020 and 2050
• Oil demand grows until the mid-2020s, driven by recovery from the COVID-19 pandemic and further economic growth
• Oil demand peaks around 2025, as transport and other sectors reduce use of fossil fuels. Overall oil demand falls around 60% between 2020 and 2050 as fossil vehicles exit the fleet
• Transport accounts for the majority of the demand reduction; oil demand in transport falls around 75% between 2020 and 2050. By 2050, transport accounts for under 35% of oil demand
• Demand in industry falls only slightly, due to continued use of oil as a petrochemical feedstock, where the carbon content is largely embedded in the products. By 2050, industry accounts for over 45% of oil demand
0
50
100
150
200
0
20
40
60
80
100
120
2020 2025 2030 2035 2040 2045 2050
EJ p
er y
ear
MM
bb
l/d
ay
Oil demand by sector
Power Transport Industry Buildings Other
The Inevitable Policy Response: Forecast Policy Scenario (FPS)
22
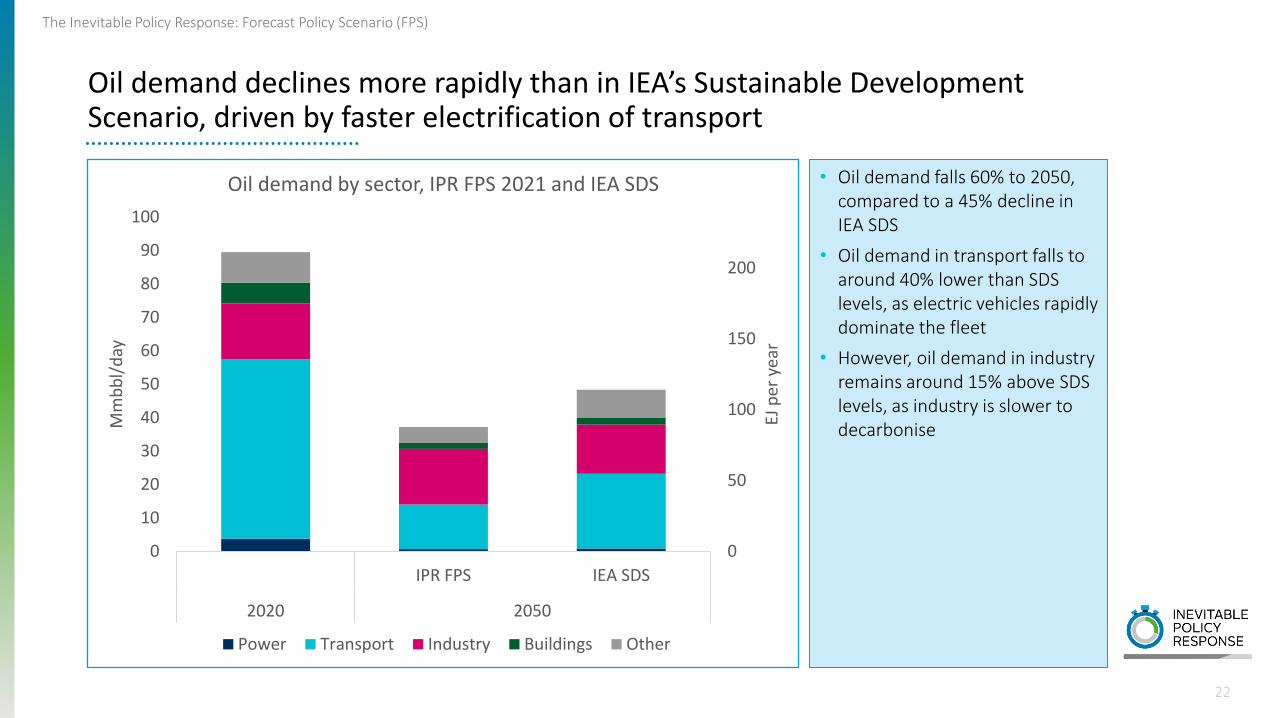
Oil demand declines more rapidly than in IEA’s Sustainable Development Scenario, driven by faster electrification of transport
• Oil demand falls 60% to 2050, compared to a 45% decline in IEA SDS
• Oil demand in transport falls to around 40% lower than SDS levels, as electric vehicles rapidly dominate the fleet
• However, oil demand in industry remains around 15% above SDS levels, as industry is slower to decarbonise
0
50
100
150
200
0
10
20
30
40
50
60
70
80
90
100
IPR FPS IEA SDS
2020 2050
EJ p
er y
ear
Mm
bb
l/d
ay
Oil demand by sector, IPR FPS 2021 and IEA SDS
Power Transport Industry Buildings Other

The Inevitable Policy Response: Forecast Policy Scenario (FPS)
23
Gas demand falls by half, driven primarily by a reduction in demand in the power and buildings sectors
• Gas demand falls around 50% between 2020 and 2050
• The power sector accounts for the majority of the demand reduction, with demand falling ; gas demand in power falls around 70% between 2020 and 2050
• Buildings also account for over one third of the demand reduction; gas demand in buildings falls 80% to 2030 as heating and cooking are electrified in many countries
• Demand falls more slowly in industry, with around a 25% reduction between 2020 and 2050
• As a result, industry accounts for the largest share (around 35%) of gas demand by 2050, followed by power (around 25%)
0
20
40
60
80
100
120
140
0
500
1000
1500
2000
2500
3000
3500
4000
2020 2025 2030 2035 2040 2045 2050
EJ p
er y
ear
bcm
Gas demand by sector
Power Transport Industry Buildings Other
The Inevitable Policy Response: Forecast Policy Scenario (FPS)
24
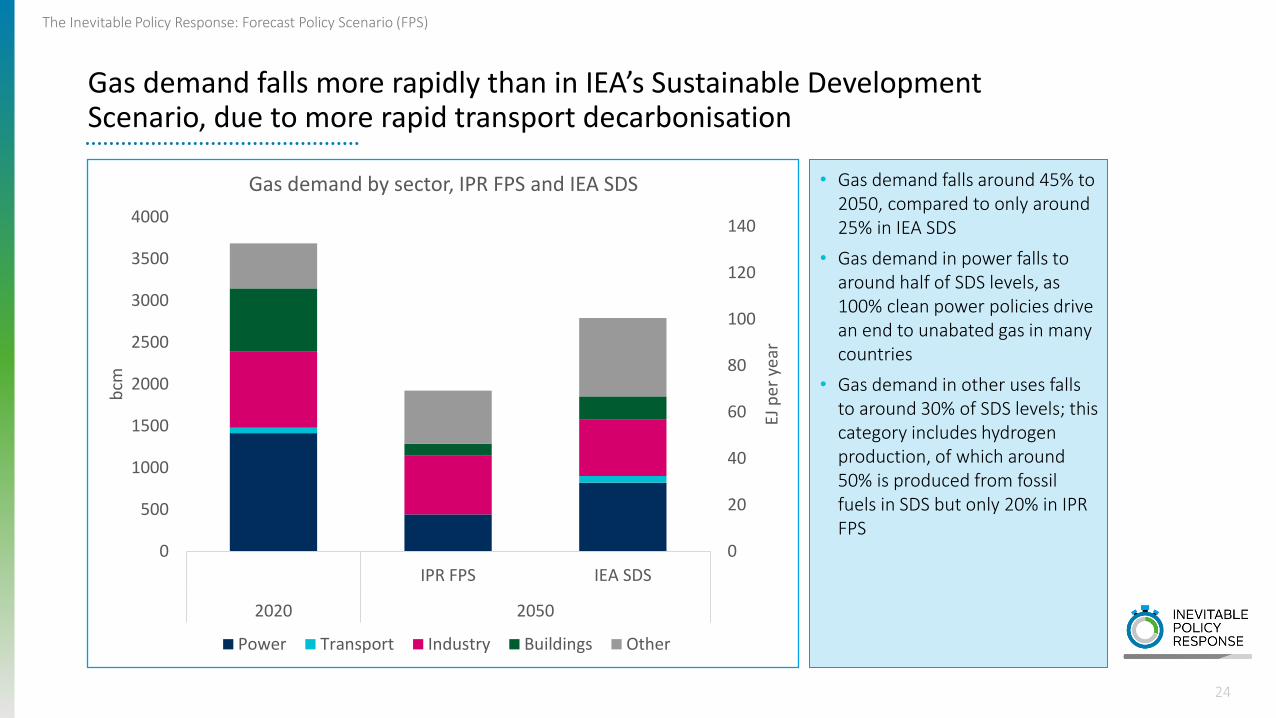
Gas demand falls more rapidly than in IEA’s Sustainable Development Scenario, due to more rapid transport decarbonisation
• Gas demand falls around 45% to 2050, compared to only around 25% in IEA SDS
• Gas demand in power falls to around half of SDS levels, as 100% clean power policies drive an end to unabated gas in many countries
• Gas demand in other uses falls to around 30% of SDS levels; this category includes hydrogen production, of which around 50% is produced from fossil fuels in SDS but only 20% in IPR FPS
0
20
40
60
80
100
120
140
0
500
1000
1500
2000
2500
3000
3500
4000
IPR FPS IEA SDS
2020 2050
EJ p
er y
ear
bcm
Gas demand by sector, IPR FPS and IEA SDS
Power Transport Industry Buildings Other
The Inevitable Policy Response: Forecast Policy Scenario (FPS)
25
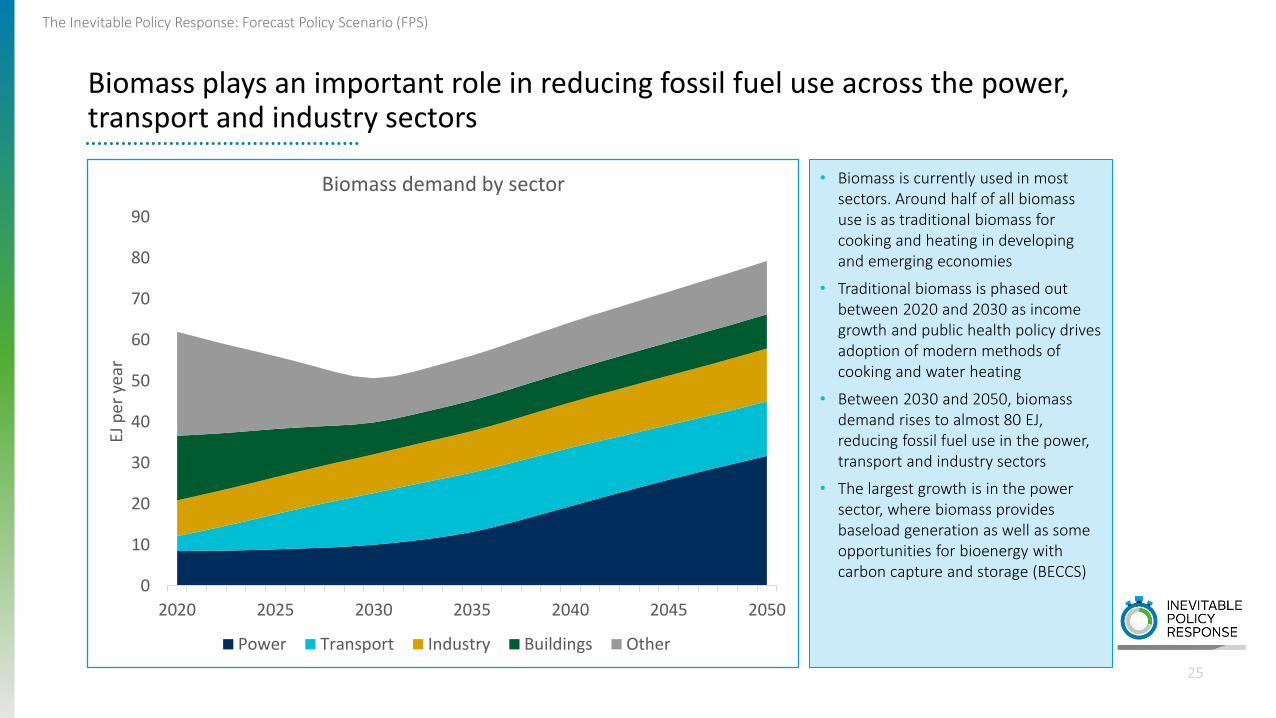
Biomass plays an important role in reducing fossil fuel use across the power, transport and industry sectors
• Biomass is currently used in most sectors. Around half of all biomass use is as traditional biomass for cooking and heating in developing and emerging economies
• Traditional biomass is phased out between 2020 and 2030 as income growth and public health policy drives adoption of modern methods of cooking and water heating
• Between 2030 and 2050, biomass demand rises to almost 80 EJ, reducing fossil fuel use in the power, transport and industry sectors
• The largest growth is in the power sector, where biomass provides baseload generation as well as some opportunities for bioenergy with carbon capture and storage (BECCS)
0
10
20
30
40
50
60
70
80
90
2020 2025 2030 2035 2040 2045 2050
EJ p
er y
ear
Biomass demand by sector
Power Transport Industry Buildings Other
The Inevitable Policy Response: Forecast Policy Scenario (FPS)
26
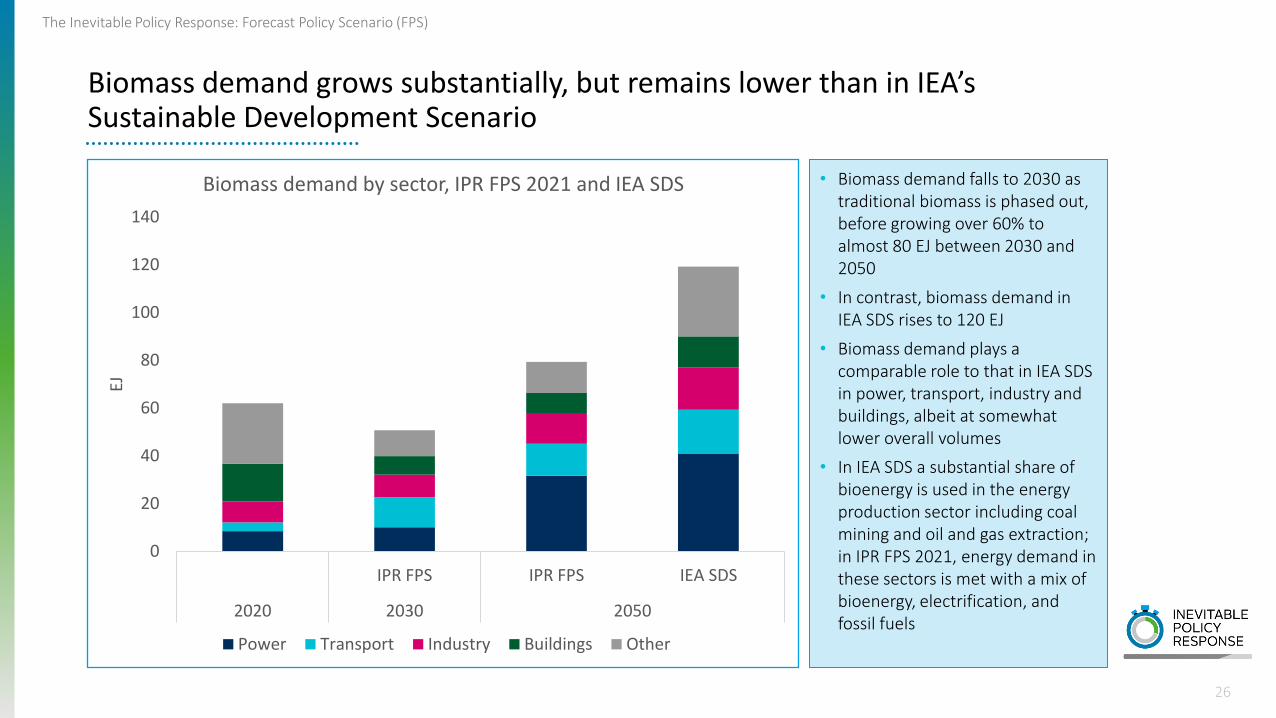
Biomass demand grows substantially, but remains lower than in IEA’s Sustainable Development Scenario
• Biomass demand falls to 2030 as traditional biomass is phased out, before growing over 60% to almost 80 EJ between 2030 and 2050
• In contrast, biomass demand in IEA SDS rises to 120 EJ
• Biomass demand plays a comparable role to that in IEA SDS in power, transport, industry and buildings, albeit at somewhat lower overall volumes
• In IEA SDS a substantial share of bioenergy is used in the energy production sector including coal mining and oil and gas extraction; in IPR FPS 2021, energy demand in these sectors is met with a mix of bioenergy, electrification, and fossil fuels
0
20
40
60
80
100
120
140
IPR FPS IPR FPS IEA SDS
2020 2030 2050
EJ
Biomass demand by sector, IPR FPS 2021 and IEA SDS
Power Transport Industry Buildings Other

Power and hydrogen

The Inevitable Policy Response: Forecast Policy Scenario (FPS)
28
Electricity is almost fully decarbonised by 2050, with renewables accounting for almost 80% of generation
• Fossil generation falls from around 65% of the mix in 2020 to 45% in 2030 and under 10% by 2050. By 2050, CCS accounts for around half of remaining fossil fuel use
• Wind and solar grow from under 10% of the mix in 2020 to over 30% in 2030 and over 60% in 2050
• Including biomass and hydro, renewables account for almost 80% of generation by 2050
• Towards 2050, hydrogen emerges as an important balancing technology
• By 2050, over 95% of generation is low-carbon
0
10
20
30
40
50
60
2020 2025 2030 2035 2040 2045 2050
Tho
usa
nd
TW
h
Electricity generation mix, global
Coal Coal CCS Oil Gas Gas CCS
Nuclear Hydro Biomass Biomass CCS Solar
Onshore wind Offshore wind Hydrogen Other

The Inevitable Policy Response: Forecast Policy Scenario (FPS)
29
IPR FPS has a similar generation mix to IEA SDS, though with higher levels of solar, wind and hydrogen
• Electricity generation grows substantially in both IPR FPS and IEA SDS, as economic growth and electrification of heat and transport drive greater electricity demand
• The generation mix in both scenarios is comparable, with a large reduction in coal, oil and gas; and a large increase in low-carbon generation
• Wind and solar account for the majority of generation by 2050 in both scenarios. Their share is higher in IPR FPS, at over 60% of the mix compared with around 55% in IEA SDS. Within this, solar accounts for around 55% of variable renewables in both scenarios
• The larger share of wind and solar in IPR FPS is offset by a smaller share of nuclear and hydro relative to IEA SDS
• Hydrogen plays a bigger role in IPR FPS, accounting for 7% of generation
0
10
20
30
40
50
60
IPR FPS IEA SDS
2020 2050
Tho
usa
nd
TW
h
Electricity generation mix, IPR FPS and IEA SDS
Other
Hydrogen
Wind
Solar
Biomass
Hydro
Nuclear
Gas
Oil
Coal

The Inevitable Policy Response: Forecast Policy Scenario (FPS)
30
The European Union achieves 100% clean power by 2045 through a portfolio of low-carbon generation technologies
• The EU achieves its FPS policy objective of a coal phase out by 2040 and 100% clean power by 2045
• Fossil generation falls from around 40% of the mix in 2020 to 20% in 2030 and around 5% by 2050; by 2045, gas CCS accounts for all remaining fossil generation
• Wind and solar grow from around 15% of the mix in 2020 to over 30% in 2030 and over 45% in 2050
• The share of hydro and nuclear the declines from around 40% of the mix in 2020 to 30% in 2050, though these technologies continue to play an important role
• Biomass with carbon capture and storage (BECCS) plays a smaller role, offsetting residual emissions in the industry sector to achieve net zero emissions overall
0
1
2
3
4
5
2020 2025 2030 2035 2040 2045 2050
Tho
usa
nd
TW
h
Electricity generation mix, European Union
Coal Coal CCS Oil Gas Gas CCS
Nuclear Hydro Biomass Biomass CCS Solar
Onshore wind Offshore wind Hydrogen Other
The Inevitable Policy Response: Forecast Policy Scenario (FPS)
31
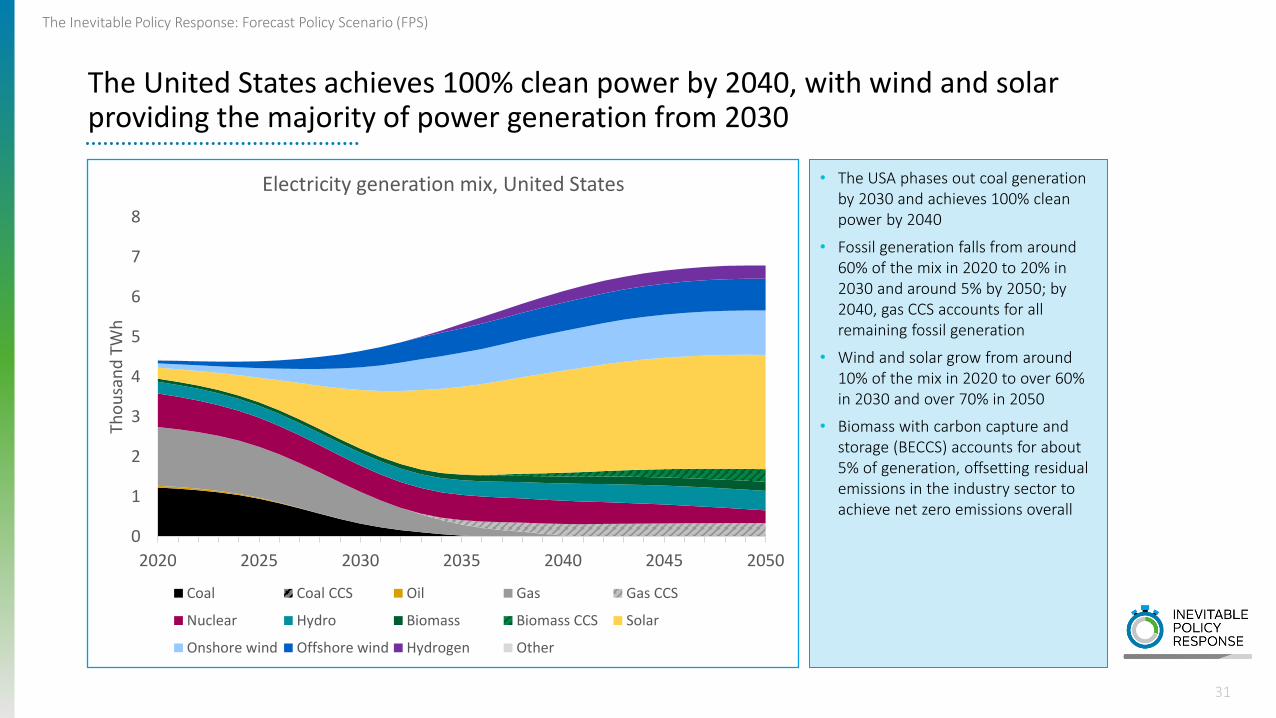
The United States achieves 100% clean power by 2040, with wind and solar providing the majority of power generation from 2030
• The USA phases out coal generation by 2030 and achieves 100% clean power by 2040
• Fossil generation falls from around 60% of the mix in 2020 to 20% in 2030 and around 5% by 2050; by 2040, gas CCS accounts for all remaining fossil generation
• Wind and solar grow from around 10% of the mix in 2020 to over 60% in 2030 and over 70% in 2050
• Biomass with carbon capture and storage (BECCS) accounts for about 5% of generation, offsetting residual emissions in the industry sector to achieve net zero emissions overall
0
1
2
3
4
5
6
7
8
2020 2025 2030 2035 2040 2045 2050
Tho
usa
nd
TW
h
Electricity generation mix, United States
Coal Coal CCS Oil Gas Gas CCS
Nuclear Hydro Biomass Biomass CCS Solar
Onshore wind Offshore wind Hydrogen Other

The Inevitable Policy Response: Forecast Policy Scenario (FPS)
32
China achieves 100% clean power by 2050, with CCS retrofit used to decarbonise remaining coal generation
• China phases out unabated coal generation by 2045 and achieves 100% clean power by 2050
• Coal generation falls only slightly to 2030 but more rapidly thereafter; coal generation falls from around 70% of the mix in 2020 to less than 10% by 2050
• From 2045, all remaining coal generation is retrofitted with CCS
• Wind and solar grow from under 10% of the mix in 2020 to around 30% in 2030 and over 60% in 2050
• Hydro and nuclear continue to play an important role, accounting for around 20% of the mix between 2020 and 20500
123456789
10111213141516
2020 2025 2030 2035 2040 2045 2050
Tho
usa
nd
TW
h
Electricity generation mix, China
Coal Coal CCS Oil Gas Gas CCS
Nuclear Hydro Biomass Biomass CCS Solar
Onshore wind Offshore wind Hydrogen Other
The Inevitable Policy Response: Forecast Policy Scenario (FPS)
33
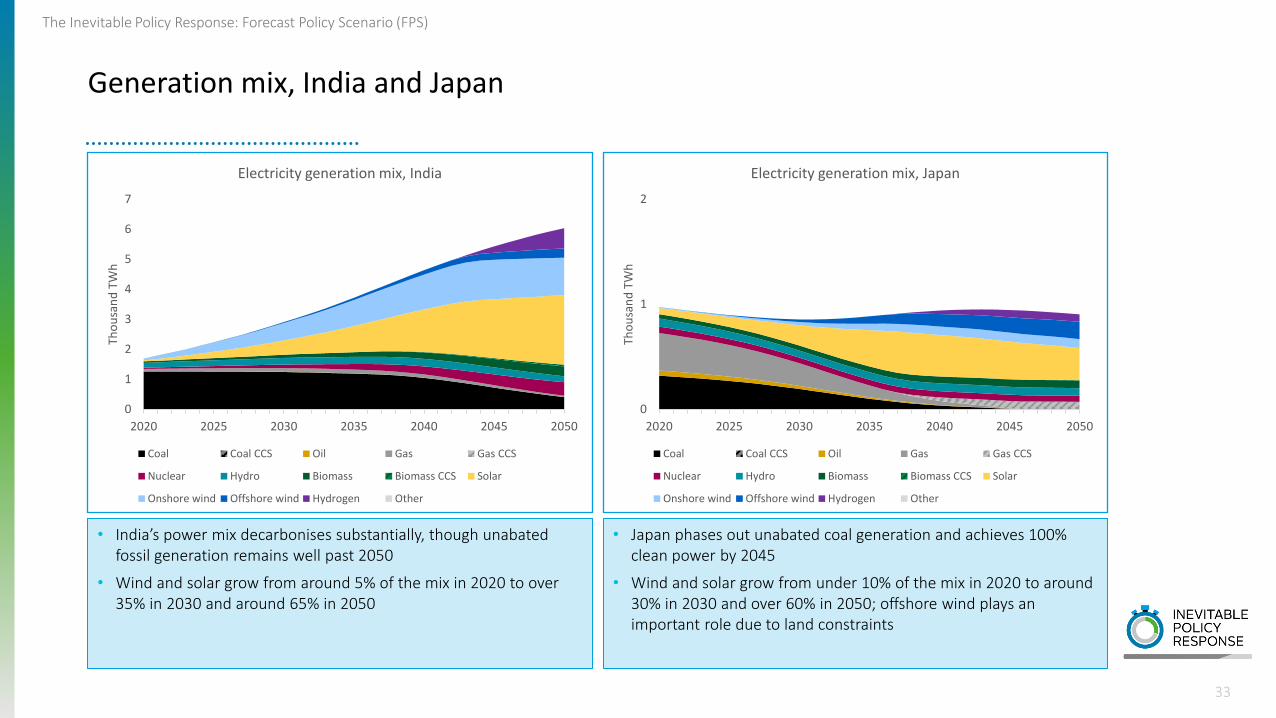
Generation mix, India and Japan
• India’s power mix decarbonises substantially, though unabated fossil generation remains well past 2050
• Wind and solar grow from around 5% of the mix in 2020 to over 35% in 2030 and around 65% in 2050
• Japan phases out unabated coal generation and achieves 100% clean power by 2045
• Wind and solar grow from under 10% of the mix in 2020 to around 30% in 2030 and over 60% in 2050; offshore wind plays an important role due to land constraints
0
1
2
3
4
5
6
7
2020 2025 2030 2035 2040 2045 2050
Tho
usa
nd
TW
h
Electricity generation mix, India
Coal Coal CCS Oil Gas Gas CCS
Nuclear Hydro Biomass Biomass CCS Solar
Onshore wind Offshore wind Hydrogen Other
0
1
2
2020 2025 2030 2035 2040 2045 2050
Tho
usa
nd
TW
h
Electricity generation mix, Japan
Coal Coal CCS Oil Gas Gas CCS
Nuclear Hydro Biomass Biomass CCS Solar
Onshore wind Offshore wind Hydrogen Other

The Inevitable Policy Response: Forecast Policy Scenario (FPS)
0.0
0.2
0.4
0.6
0.8
1.0
2020 2025 2030 2035 2040 2045 2050
Tho
usa
nd
TW
h
Electricity generation mix, Canada
Coal Coal CCS Oil Gas Gas CCS
Nuclear Hydro Biomass Biomass CCS Solar
Onshore wind Offshore wind Hydrogen Other
0.0
0.1
0.2
0.3
0.4
0.5
2020 2025 2030 2035 2040 2045 2050
Tho
usa
nd
TW
h
Electricity generation mix, Australia
Coal Coal CCS Oil Gas Gas CCS
Nuclear Hydro Biomass Biomass CCS Solar
Onshore wind Offshore wind Hydrogen Other
34
Generation mix, Canada and Australia
• Canada phases out unabated coal generation by 2030 and achieves 100% clean power by 2035
• Hydro continues to play a major role in the mix, though its share falls from around 60% in 2020 to 35% in 2050
• Wind and solar provide the majority of demand growth, and account for 40% of the mix in 2050
• Australia phases out unabated coal generation by 2040 and achieves 100% clean power by 2050
• Wind and solar grow from around 10% of the mix in 2020 to 45% in 2030 and almost 75% in 2050

The Inevitable Policy Response: Forecast Policy Scenario (FPS)
35
Coal-fired power generation declines around 80% to 2050, with non-OECD countries accounting for all coal generation post-2040
• Coal-fired power generation declines around 80% between 2020 and 2050
• Coal generation in the USA, EU and
other OECD countries falls to zero by
2040-5 as they phase out unabated
coal and rely on gas CCS and
hydrogen for dispatchable low-
carbon power. From 2045, all coal
generation is located in non-OECD
countries.
• Coal generation in China falls over
80% between 2020 and 2050, driven
by the phase out of unabated coal.
From 2045, residual coal generation
in China is retrofitted with CCS to
reduce emissions.
0
2000
4000
6000
8000
10000
12000
2020 2025 2030 2035 2040 2045 2050
Tho
usa
nd
TW
h
Coal generation by region
China India USA Southeast Asia EU Other OECD Other non-OECD
Note: chart shows total coal, both with and without CCS

The Inevitable Policy Response: Forecast Policy Scenario (FPS)
36
Gas-fired power generation declines around 50% to 2050, with non-OECD countries accounting for a growing majority of overall gas generation
• Gas-fired power generation declines around 50% between 2020 and 2050
• Gas generation in the USA, EU and other OECD countries falls around 70% between 2020 and 2050 as they decarbonise their electricity systems
• Gas generation in MENA, Southeast Asia and other non-OECD regions falls only 30% over the same period, due to rising electricity demand and less rapid power sector decarbonisation
• As a result, the share of total gas-fired power generation represented by OECD countries falls from 45% in 2020 to around 30% in 2050
0
1000
2000
3000
4000
5000
6000
7000
2020 2025 2030 2035 2040 2045 2050
Tho
usa
nd
TW
h
Gas generation by region
USA MENA
EU Southeast Asia
Russia Central and South America
Other non-OECD Other OECD
The Inevitable Policy Response: Forecast Policy Scenario (FPS)
37
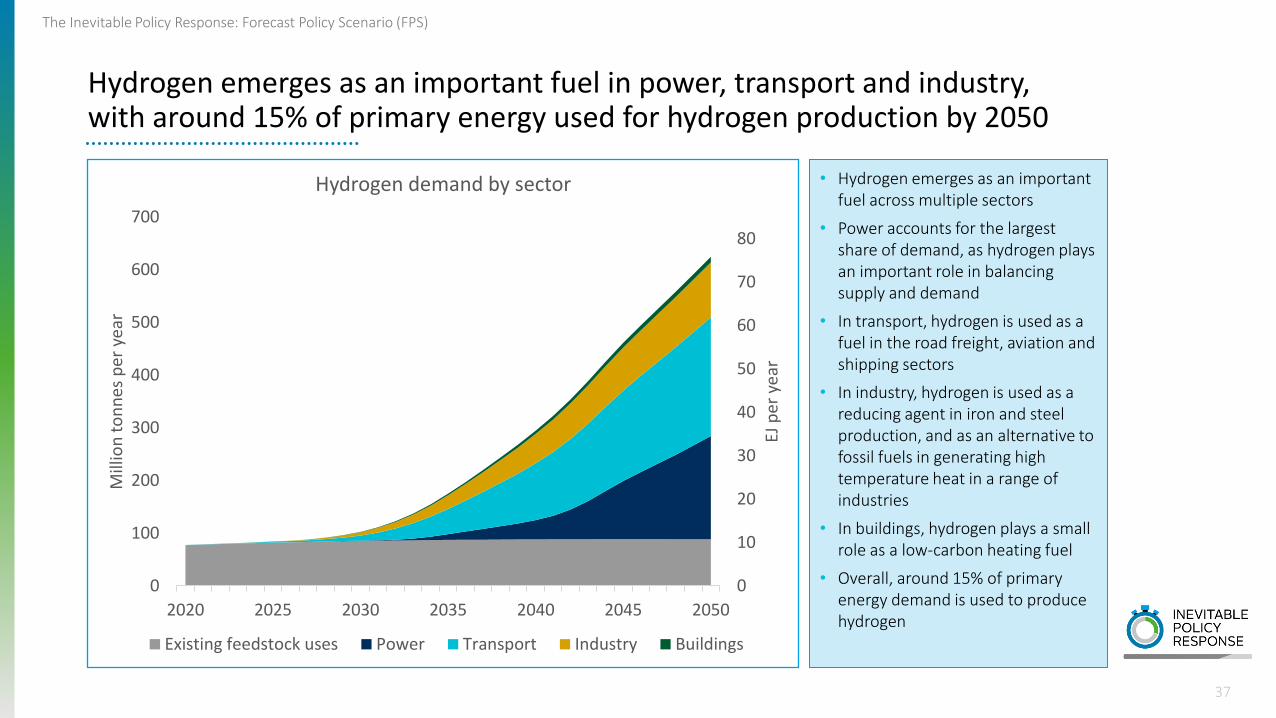
Hydrogen emerges as an important fuel in power, transport and industry, with around 15% of primary energy used for hydrogen production by 2050
• Hydrogen emerges as an important fuel across multiple sectors
• Power accounts for the largest share of demand, as hydrogen plays an important role in balancing supply and demand
• In transport, hydrogen is used as a fuel in the road freight, aviation and shipping sectors
• In industry, hydrogen is used as a reducing agent in iron and steel production, and as an alternative to fossil fuels in generating high temperature heat in a range of industries
• In buildings, hydrogen plays a small role as a low-carbon heating fuel
• Overall, around 15% of primary energy demand is used to produce hydrogen
0
10
20
30
40
50
60
70
80
0
100
200
300
400
500
600
700
2020 2025 2030 2035 2040 2045 2050
EJ p
er y
ear
Mill
ion
to
nn
es p
er y
ear
Hydrogen demand by sector
Existing feedstock uses Power Transport Industry Buildings
The Inevitable Policy Response: Forecast Policy Scenario (FPS)
38
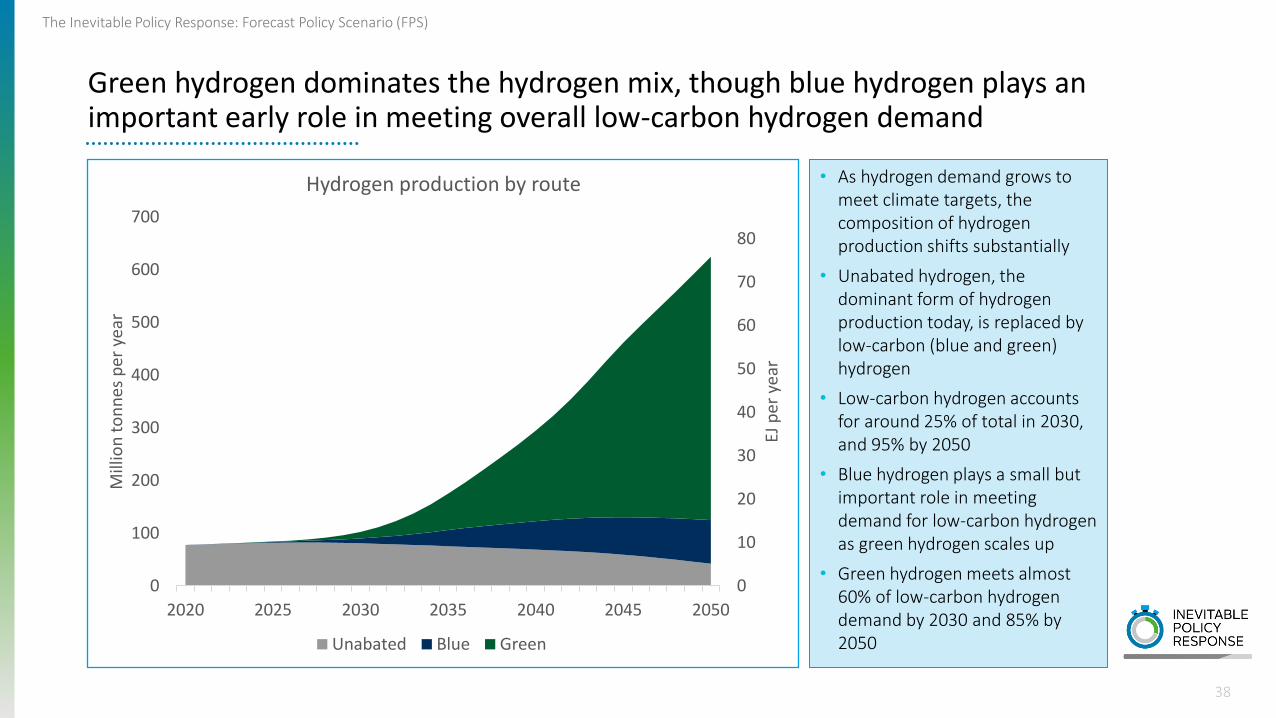
Green hydrogen dominates the hydrogen mix, though blue hydrogen plays an important early role in meeting overall low-carbon hydrogen demand
• As hydrogen demand grows to meet climate targets, the composition of hydrogen production shifts substantially
• Unabated hydrogen, the dominant form of hydrogen production today, is replaced by low-carbon (blue and green) hydrogen
• Low-carbon hydrogen accounts for around 25% of total in 2030, and 95% by 2050
• Blue hydrogen plays a small but important role in meeting demand for low-carbon hydrogen as green hydrogen scales up
• Green hydrogen meets almost 60% of low-carbon hydrogen demand by 2030 and 85% by 2050
0
10
20
30
40
50
60
70
80
0
100
200
300
400
500
600
700
2020 2025 2030 2035 2040 2045 2050
EJ p
er y
ear
Mill
ion
to
nn
es p
er y
ear
Hydrogen production by route
Unabated Blue Green
Transport, industry and buildings

The Inevitable Policy Response: Forecast Policy Scenario (FPS)
• The share of fossil cars and vans in the fleet falls from almost 100% today to under 75% in 2030, and near-zero by 2050
• In contrast, electrified cars and vans grow rapidly, to over 25% of the fleet by 2030 and almost 100% by 2050
• The majority of electrified vehicles are pure battery electric; however plug-in hybrid vehicles and later, hydrogen fuel cell vehicles gain some market share for market segments with large travel distances
Electric vehicles quickly dominate in light duty vehicles, making up the majority of the vehicle fleet by 2035
40
0
200
400
600
800
1,000
1,200
1,400
1,600
1,800
2,000
2020 2025 2030 2035 2040 2045 2050
mill
ion
veh
icle
s
Passenger cars by powertrain
Fossil Plug-in hybrid Battery electric Hydrogen Natural gas
The Inevitable Policy Response: Forecast Policy Scenario (FPS)
41
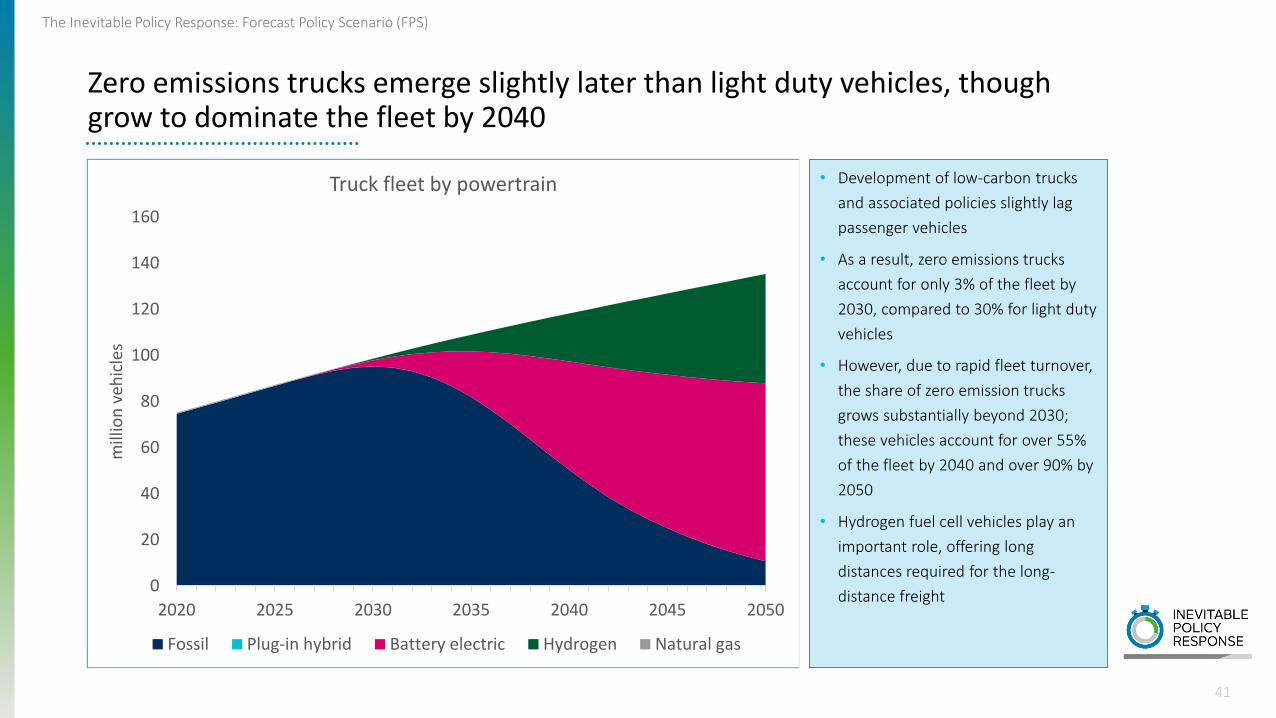
Zero emissions trucks emerge slightly later than light duty vehicles, though grow to dominate the fleet by 2040
• Development of low-carbon trucks
and associated policies slightly lag
passenger vehicles
• As a result, zero emissions trucks
account for only 3% of the fleet by
2030, compared to 30% for light duty
vehicles
• However, due to rapid fleet turnover,
the share of zero emission trucks
grows substantially beyond 2030;
these vehicles account for over 55%
of the fleet by 2040 and over 90% by
2050
• Hydrogen fuel cell vehicles play an
important role, offering long
distances required for the long-
distance freight0
20
40
60
80
100
120
140
160
2020 2025 2030 2035 2040 2045 2050
mill
ion
veh
icle
s
Truck fleet by powertrain
Fossil Plug-in hybrid Battery electric Hydrogen Natural gas
The Inevitable Policy Response: Forecast Policy Scenario (FPS)
42
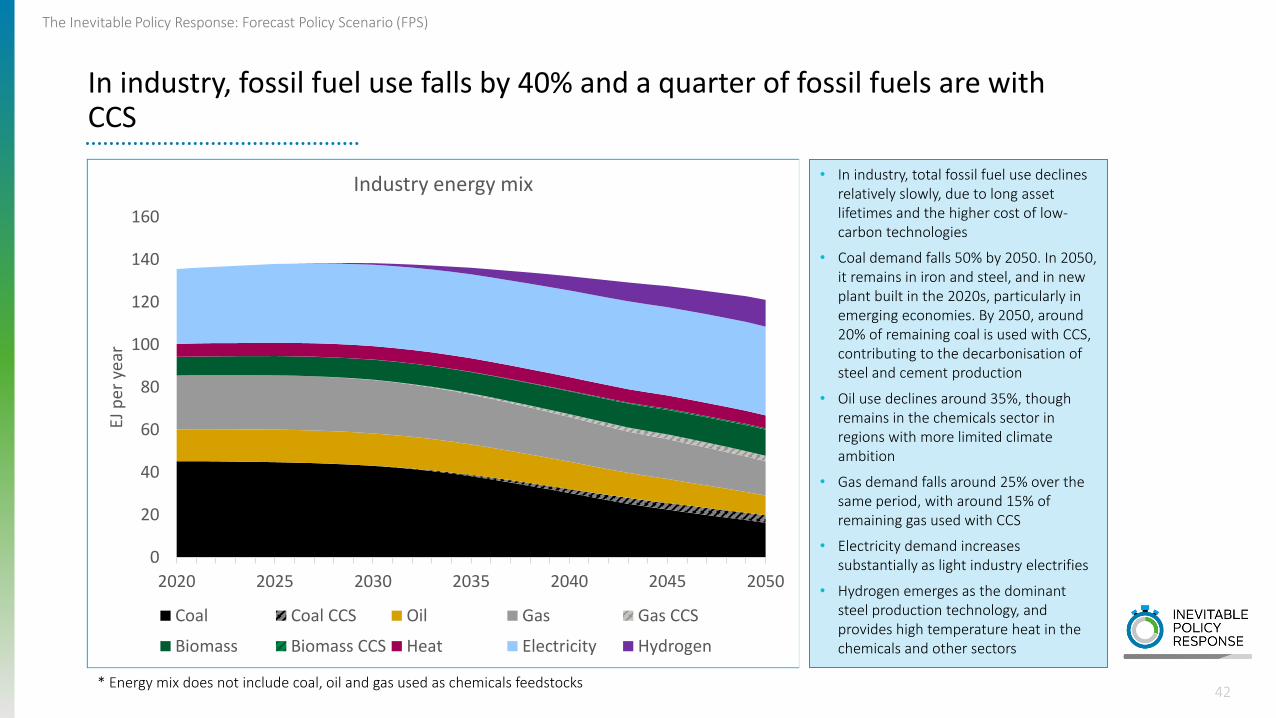
In industry, fossil fuel use falls by 40% and a quarter of fossil fuels are with CCS
• In industry, total fossil fuel use declines relatively slowly, due to long asset lifetimes and the higher cost of low-carbon technologies
• Coal demand falls 50% by 2050. In 2050, it remains in iron and steel, and in new plant built in the 2020s, particularly in emerging economies. By 2050, around 20% of remaining coal is used with CCS, contributing to the decarbonisation of steel and cement production
• Oil use declines around 35%, though remains in the chemicals sector in regions with more limited climate ambition
• Gas demand falls around 25% over the same period, with around 15% of remaining gas used with CCS
• Electricity demand increases substantially as light industry electrifies
• Hydrogen emerges as the dominant steel production technology, and provides high temperature heat in the chemicals and other sectors
0
20
40
60
80
100
120
140
160
2020 2025 2030 2035 2040 2045 2050
EJ p
er y
ear
Industry energy mix
Coal Coal CCS Oil Gas Gas CCS
Biomass Biomass CCS Heat Electricity Hydrogen
* Energy mix does not include coal, oil and gas used as chemicals feedstocks
The Inevitable Policy Response: Forecast Policy Scenario (FPS)
43
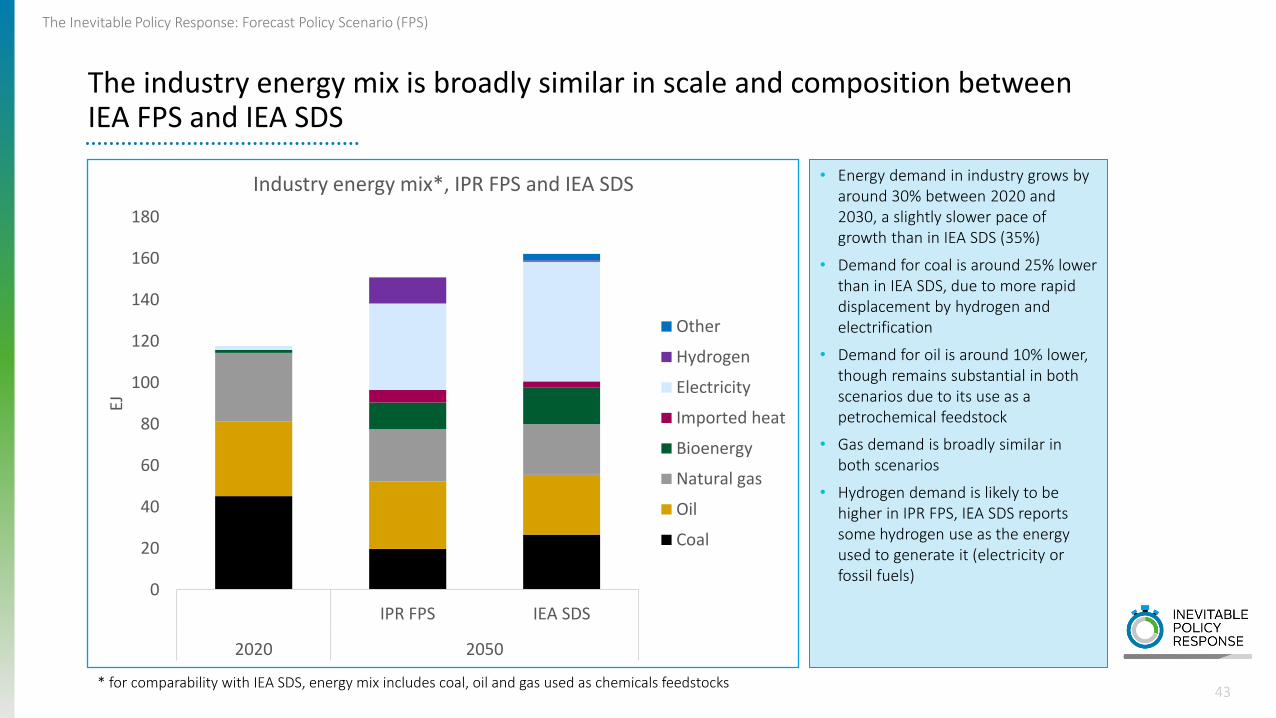
The industry energy mix is broadly similar in scale and composition between IEA FPS and IEA SDS
• Energy demand in industry grows by around 30% between 2020 and 2030, a slightly slower pace of growth than in IEA SDS (35%)
• Demand for coal is around 25% lower than in IEA SDS, due to more rapid displacement by hydrogen and electrification
• Demand for oil is around 10% lower, though remains substantial in both scenarios due to its use as a petrochemical feedstock
• Gas demand is broadly similar in both scenarios
• Hydrogen demand is likely to be higher in IPR FPS, IEA SDS reports some hydrogen use as the energy used to generate it (electricity or fossil fuels)
0
20
40
60
80
100
120
140
160
180
IPR FPS IEA SDS
2020 2050
EJ
Industry energy mix*, IPR FPS and IEA SDS
Other
Hydrogen
Electricity
Imported heat
Bioenergy
Natural gas
Oil
Coal
* for comparability with IEA SDS, energy mix includes coal, oil and gas used as chemicals feedstocks

The Inevitable Policy Response: Forecast Policy Scenario (FPS)
44
Hydrogen direct reduced iron (DRI) emerges as the dominant clean steel production technology, accounting for half of virgin steel production by 2050
• Conventional coal-based steel production falls by more than half between 2020 and 2050
• Clean steel production, using hydrogen direct reduced iron (DRI) or CCS, rises rapidly after 2030, accounting for around 10% of virgin steel production by 2035 and 50% by 2050
• Hydrogen DRI emerges as the dominant clean steel production technology, accounting for 85% of low-carbon virgin steel production, due to the relatively low capture rates of CCS in the steel sector
0
500
1000
1500
2000
2500
2020 2025 2030 2035 2040 2045 2050
Mt
per
yea
r
Steel production by technology
Conventional coal (BF-BOF) BFBOF with CCS
Gas DRI Hydrogen DRI
Scrap with EAF

The Inevitable Policy Response: Forecast Policy Scenario (FPS)
45
Carbon capture and storage is the primary solution to decarbonize the cement sector, capturing both combustion and process emissions
• Unabated fossil fuel based cement production falls by around 40% between 2020 and 2050; by 2050, unabated fossil fuels accounts for only half of the production mix
• A further 35% of the mix is accounted for by fossil fuels with CCS. As industrial processes account for more than half of total emissions from cement, CCS is a vital technological solution in production of low-carbon cement
• Biomass with CCS accounts for a small share of cement production, delivering negative emissions in addition to capturing process emissions
0
500
1000
1500
2000
2500
3000
3500
4000
4500
5000
2020 2025 2030 2035 2040 2045 2050
Mt
per
yea
r
Cement production by technology
Coal Coal CCS Oil Gas Gas CCS Biomass Biomass CCS

The Inevitable Policy Response: Forecast Policy Scenario (FPS)
46
Coal demand falls in all industry sectors, with decarbonization of iron and steel driving the majority of the reduction
• Overall, coal demand falls 50% 2020-50 as low-carbon production technologies displace it in most industry sectors
• Coal demand falls most rapidly in iron and steel, decreasing around 60% between 2020 and 2050 as production shifts to hydrogen over the period
• Demand falls more slowly in the non-metallic minerals sector, dominated by cement. Coal remains an important fuel in cement production, and coal CCS provides a solution to decarbonise both fuel and process emissions
• In chemicals and light industry, coal use declines by around 50% as electrification and hydrogen reduce the need for coal in these sectors
• Remaining unabated coal is located primarily in countries with more limited climate commitments
0
5
10
15
20
25
30
35
40
45
50
2020 2025 2030 2035 2040 2045 2050
EJ
Coal demand by industry sector
Iron and steel Non-metallic minerals Chemicals Other CCS

The Inevitable Policy Response: Forecast Policy Scenario (FPS)
47
Oil demand in industry remains broadly flat, though it is used primarily as feedstock for chemicals where carbon is embedded
• Oil in industry is used primarily as a feedstock for chemicals, and as a fuel in light industry
• Use of oil as a fuel declines slightly to 2050 as electric and hydrogen heating replace it in many regions; but oil remains in use in countries without net zero targets
• Oil continues to be used as a feedstock for plastics and other high value chemicals, where the carbon is embedded
• Policy moderates but does not eliminate the growth in demand for plastics and other high value chemicals
0
5
10
15
20
25
30
35
40
45
2020 2025 2030 2035 2040 2045 2050
EJ
Oil demand by industry sector
Iron and steel Non-metallic minerals Chemicals - fuel
Chemicals - feedstock Other

The Inevitable Policy Response: Forecast Policy Scenario (FPS)
48
Sustained use of gas in light industry, chemicals and non-metallic minerals results in gas demand falling relatively slowly in industry
• Gas demand falls around 25% 2020-50. The fall in gas demand is less marked than for coal, due to its lower CO2 emissions and growth of industrial production in regions with more limited climate commitments
• Gas is primarily used as a fuel in light industry and chemicals. Between 2020 and 2050 demand falls around 30% in light industry and 35% in chemicals as production shifts to electrification and hydrogen in regions with net zero targets
• Gas demand grows slightly in non-metallic minerals as some production shifts from coal to gas, and gas CCS and coal CCS provides a solution to decarbonise both fuel and process emissions
0
5
10
15
20
25
30
2020 2025 2030 2035 2040 2045 2050
EJ
Gas demand by industry sector
Iron and steel Non-metallic minerals Chemicals Other CCS

The Inevitable Policy Response: Forecast Policy Scenario (FPS)
49
In buildings, electric heat pumps displace fossil heating systems to become the dominant heating technology by 2050
• Policy phases out new fossil heating systems between 2035 and 2050
• Driven by policy, heat pumps begin to dominate heating mix by 2050
• Remaining coal, oil and gas demand is in countries with later phase outs; coal and oil continue to be used in areas not connected to the gas grid
• Hydrogen meets a share of heating demand in regions with an existing gas grid, and a less efficient building stock
0
10
20
30
40
50
60
2020 2025 2030 2035 2040 2045 2050
Tho
usa
nd
GW
Building heating technology mix
Coal Oil Gas Biomass District heat Resistive Heat pump Hydrogen

The Inevitable Policy Response: Forecast Policy Scenario (FPS)
50
Thermal efficiency of the building stock improves substantially between 2020 and 2050
• Total building floorspace grows around 35% between 2020 and 2050
• A growing share of buildings are ‘net zero ready’, with high levels of thermal efficiency
• By 2050 around 15% of floorspace is in new buildings that are built net zero ready, while a further 60% is in buildings that are retrofit under energy efficiency policies
• By 2050, only around 30% of buildings have poor levels of thermal efficiency, primarily located in regions without net zero targets
0
50
100
150
200
250
300
2020 2025 2030 2035 2040 2045 2050
bill
ion
m2
Thermal efficiency of building floorspace
Conventional Net zero ready - retrofit Net zero ready - new build

Carbon Capture and Storage (CCS)

The Inevitable Policy Response: Forecast Policy Scenario (FPS)
52
• Overall around 5 GtCO₂ are captured and stored in 2050
• Of this, around 2.5 Gt is captured in the power sector, and 1.5 Gt in the industry sector, where process emissions are otherwise hard to reduce
• A further 0.7 Gt is captured in the production of blue hydrogen
• Finally, 0.5 Gt is captured through Direct Air Capture
• Of the total 5 Gt CCS, around 3.5 Gt of CO₂ is from fossil fuels or industrial processes, while around 1.5 Gt is from biomass or DAC, generating negative emissions
Carbon capture and storage (CCS) reduces emissions by 5 GtCO₂ across energy sectors
0
1
2
3
4
5
6
2020 2025 2030 2035 2040 2045 2050
GtC
O₂
CO₂ captured by fuel and sector
Power - coal Power - gas Power - biomass
Industry - coal Industry - gas Industry - biomass
Industry - process Hydrogen - gas Direct air capture
The Inevitable Policy Response: Forecast Policy Scenario (FPS)
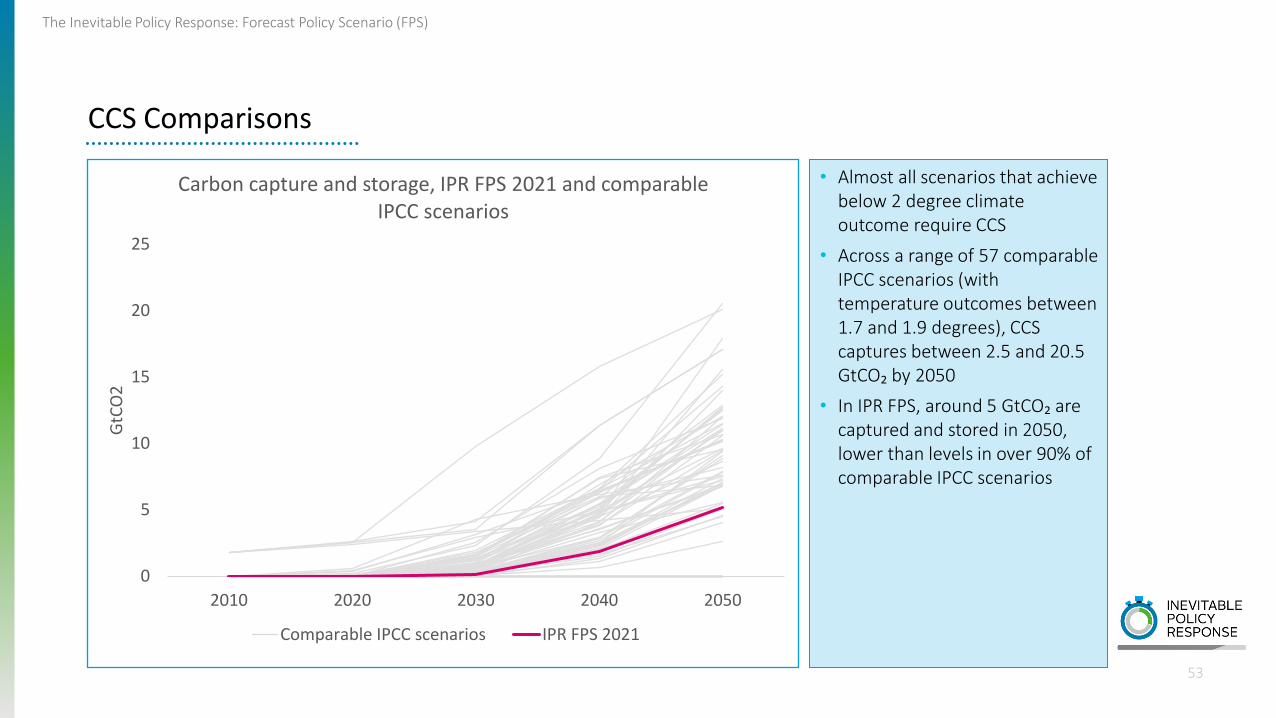
53
• Almost all scenarios that achieve below 2 degree climate outcome require CCS
• Across a range of 57 comparable IPCC scenarios (with temperature outcomes between 1.7 and 1.9 degrees), CCS captures between 2.5 and 20.5 GtCO₂ by 2050
• In IPR FPS, around 5 GtCO₂ are captured and stored in 2050, lower than levels in over 90% of comparable IPCC scenarios
CCS Comparisons
0
5
10
15
20
25
2010 2020 2030 2040 2050
GtC
O2
Carbon capture and storage, IPR FPS 2021 and comparable IPCC scenarios
Comparable IPCC scenarios IPR FPS 2021
54
Thank you!Please see PRI website for further details:
https://www.unpri.org/climate-change/what-is-the-inevitable-policy-response/4787.article
Please follow us at:
IPR Twitter @InevitablePol_R search #iprforecasts
IPR LinkedIn Inevitable Policy Response search #iprforecasts

The Inevitable Policy Response: Forecast Policy Scenario (FPS)
Disclaimer
55
The information contained in this report is meant for the purposes of information only and is not intended to be investment, legal, tax or other advice, nor is it intended to be relied upon in making an investment or other decision. This report is provided with the understanding that the authors and publishers are not providing advice on legal, economic, investment or other professional issues and services. Unless expressly stated otherwise, the opinions, recommendations, findings, interpretations and conclusions expressed in this report are those of the various contributors to the report and do not necessarily represent the views of PRI Association or the signatories to the Principles for Responsible Investment. The inclusion of company examples does not in any way constitute an endorsement of these organisations by PRI Association or the signatories to the Principles for Responsible Investment. While we have endeavoured to ensure that the information contained in this report has been obtained from reliable and up-to-date sources, the changing nature of statistics, laws, rules and regulations may result in delays, omissions or inaccuracies in information contained in this report. PRI Association is not responsible for any errors or omissions, or for any decision made or action taken based on information contained in this report or for any loss or damage arising from or caused by such decision or action. All information in this report is provided “as-is”, with no guarantee of completeness, accuracy, timeliness or of the results obtained from the use of this information, and without warranty of any kind, expressed or implied.
Vivid Economics and Energy Transition Advisors are not investment advisers and makes no representation regarding the advisability of investing in any particular company, investment fund or other vehicle. The information contained in this research report does not constitute an offer to sell securities or the solicitation of an offer to buy, or recommendation for investment in, any securities within the United States or any other jurisdiction. This research report provides general information only. The information is not intended as financial advice, and decisions to invest should not be made in reliance on any of the statements set forth in this document. Vivid Economics and Energy Transition Advisors shall not be liable for any claims or losses of any nature in connection with information contained in this document, including but not limited to, lost profits or punitive or consequential damages. The information and opinions in this report constitute a judgement as at the date indicated and are subject to change without notice. The information may therefore not be accurate or current. The information and opinions contained in this report have been compiled or arrived at from sources believed to be reliable in good faith, but no representation or warranty, express or implied, is made by Vivid Economics or Energy Transition Advisors as to their accuracy, completeness or correctness and Vivid Economics and Energy Transition Advisors do also not warrant that the information is up to date.
Appendix 1: Vivid Energy System Modelling (VESM) toolkit
56

The Inevitable Policy Response: Forecast Policy Scenario (FPS)
Inputs
57
The Vivid Energy Systems Model (VESM) toolkit covers the entire energy system allowing complex scenario analysis and development
Energy production and transformation • By sector• By region• By fuel• Emissions profilesStorage • Batteries or hydrogen storage
Housing/services:• Lighting and appliances, heating, coolingCommodity demand• Iron/steel, cement, chemicals, light industryTransport• Passenger• Freight
Physical constraints• E.g. coal supplyPolicy constraints• E.g. ICE phase outTechnical constraints• E.g. funding limits
TechnologyEnergy demand Constraints
Techno-economic analysis
• Global whole energy system model• Calibrated to latest energy balances
Model type
• 21 regions• ~ 2,700 technologies
Granularity
• 2015 to 2100 with annual resolution
Time resolution
Energy mix
Outputs
Discounted cost analysis Emissions accounting Investment portfolio
VESM is developed in OSeMOSYS - the Open Source Energy Modelling System (http://www.osemosys.org/)

Annex
58

The Inevitable Policy Response: Forecast Policy Scenario (FPS)
59
Annex: IEA Announced Pledges Scenario
• This report has compared emissions in IPR FPS to the IEA Announced Pledges Case (APC) scenario from the May 2021 Net Zero Emissions report
• In WEO 2021, IEA APC is renamed Announced Pledges Scenario (APS), with a slightly modified emissions pathway
Scenario 2020 2030 2040 2050
Announced Pledges Case (APC) May 2021 33.9 30.5 24.8 22.0
Announced Pledges Scenario (APS) October 2021 34.1 33.6 26.7 20.7
Scenario emissions (GtCO₂)
Top Related