


Languages
Pages
Legal


AN ASSESSMENT OF URBAN TREE CANOPY
IN CHATHAM COUNTY, GEORGIA
FEBRUARY 2015
PREPARED FOR: THE SAVANNAH TREE FOUNDATION
PREPARED BY: PLAN-IT GEO
S A V A N N A H T R E E F O U N D A T I O N
P L A N - I T G E O L L C
5 6 9 0 W E B S T E R S T R E E T , A R V A D A , C O 8 0 0 0 2
W W W . P L A N I T G E O . C O M
OUR MISSION IS TO PRESERVE, PROTECT AND PLANT
CANOPY TREES IN CHATHAM COUNTY, GEORGIA. THE
SAVANNAH TREE FOUNDATION PROMOTES, THROUGH
DIRECT ACTION AND EDUCATION, AN AWARENESS OF
TREES AS VITAL ENVIRONMENTAL RESOURCES AND AN
IMPORTANT PART OF OUR CULTURAL HERITAGE.
“TO BE GOOD STEWARDS, WE NEED TO KNOW
WHAT WE HAVE.”
- SAVANNAH TREE FOUNDATION

Prepared By
Plan-It Geo, LLC
Acknowledgements
Funding provided by the Savannah Tree Foundation
Core partners included the Savannah Area GIS (SAGIS) and the Metropolitan Planning Commission. Thanks go
specifically to Karen Jenkins and Mike Browning for their invaluable leadership at many stages of this project, to STF
board member Charlie Belin and to Heather Gordon who provided review. In addition, the USDA Forest Service “Urban
Forestry South” provided a 3rd party review of land cover mapping accuracy.
Prepared For
The Savannah Tree Foundation
AN ASSESSMENT OF URBAN TREE CANOPY
CHATHAM COUNTY, GEORGIA
FEBRUARY 2015
21
12
7
5
3
1
26
EXECUTIVE SUMMARY
BACKGROUND
METHODS
STATE OF THE TREE CANOPY
ADVOCATING FOR TREE CANOPY TO
BETTER THE ECONOMY, ENVIRONMENT,
AND COMMUNITY
RECOMMENDATIONS & STRATEGIES
CONCLUSIONS
27 APPENDIX
CONTENTS
4
An Assessment of Urban Tree Canopy in Chatham County, Georgia
TABLES & FIGURES
LIST OF TABLES
Table 1: Percent UTC and plantable area by municipality ........................................................................................ 7
Table 2: Canopy change by municipality (1996-2010) ............................................................................................. 11
Table 3: Average tree canopy along street corridors by municipality ...................................................................... 13
Table 4: UTC assessment metrics on high school properties ................................................................................... 17
Table 5: Standard error matrix for land cover classification in Chatham County...................................................... 36
Table 6: Standard error matrix for land cover classification excluding unincorporated areas in Chatham County .... 36
Table 7: Business as usual tree canopy projections ............................................................................................... 41
Table 8: Countywide UTC Results ......................................................................................................................... 42
Table 9: UTC results by municipalities .................................................................................................................. 43
Table 10: UTC results by HUC12 drainage basins ................................................................................................... 44
LIST OF FIGURES
Figure 1: Chatham County, Georgia, the UTC assessment study area ....................................................................... 3
Figure 2: Subdivision in western Chatham County designed with open green space ................................................. 6
Figure 3: Percent tree canopy by municipality ........................................................................................................ 7
Figure 4: 2014 Chatham County land cover map and summary statistics .................................................................. 8
Figure 5: Distribution of land cover classes by municipality ...................................................................................... 9
Figure 6: Quantification of some of the monetary benefits of Chatham County’s urban forest ecosystem services .. 10
Figure 7: Canopy loss by municipality based on 30-meter satellite imagery ............................................................ 11
Figure 8: Trends in tree canopy in Chatham County from 1992-2014 using a statistical sampling approach ............. 11
Figure 9: A walkable neighborhood developed by Healthy Savannah .................................................................... 14
Figure 10: Percent tree canopy by drainage basin with aerial inset ........................................................................ 15
5
An Assessment of Urban Tree Canopy in Chatham County, Georgia
Figure 11: Low-income housing near Damon St. & Carolan St. without street or yard trees .................................... 16
Figure 12: Percent UTC by neighborhood and Bayview neighborhood inset ........................................................... 16
Figure 13: Parcels near Groves High School with low canopy and high planting potential ....................................... 17
Figure 14: Street view of tree planting potential at Groves High School ................................................................. 18
Figure 15: Color infrared aerial view of parcels in Pooler that retained tree canopy vs. did not retain canopy ........ 19
Figure 16: Abercorn at Mall Blvd. in Savannah, GA ................................................................................................ 20
Figure 17: Organization of recommendations based on the Chatham County UTC assessment ............................... 21
Figure 18: Aerial view showing canopy loss to new development in Chatham County ............................................ 23
Figure 19a and 19b: Comparing urban tree canopy cover at the county and municipal level .................................. 26
Figure 20: Task 1 percent tree canopy trends from 1996 to 2010 in Chatham County by municipality ..................... 31
Figure 21: Examples of Tree vs. Non-Tree classifications in i-Tree canopy software ................................................ 33
Figure 22: Example of canopy loss near Savannah, GA International Airport .......................................................... 33
Figure 23: Canopy change points from i-Tree canopy statistical sampling .............................................................. 33
Figure 24: Example of general land cover types .................................................................................................... 34
Figure 25: Map of land cover & percent UTC by municipality ................................................................................ 34
Figure 26: Geographic scales assessed through the Chatham County UTC assessment project ................................ 39
Figure 27: i-Tree Canopy tree benefits estimates report......................................................................................... 40
Figure 28: Annual decline in UTC percent implementing a “Business-as-Usual” scenario ........................................ 42
Figure 29: Chatham County existing UTC by percent and acres .............................................................................. 42
Figure 30: Percent UTC by municipality ................................................................................................................ 43
Figure 31: Percent total possible planting area by municipality ............................................................................. 43
Figure 32: Percent UTC by HUC 12 drainage basins ............................................................................................... 44
Figure 33: Percent Total PPA by HUC 12 drainage basins ....................................................................................... 44
Figure 34: Percent UTC in parcels containing parking lots ...................................................................................... 45
Figure 35: Percent PPA in parcels containing parking lots ...................................................................................... 45
1
1
An Assessment of Urban Tree Canopy in Chatham County, Georgia
EXECUTIVE SUMMARY
Across Chatham County, trees along streets, in parks, yards, and natural
areas constitute a valuable urban and community forest. This resource is a
critical element of the region’s green infrastructure, contributing to
environmental quality, public health, water supply, local economies and
aesthetics. Urban forests provide triple bottom line benefits – social,
economic, and environmental – yet tree canopy is being lost faster than it is
being replaced as shown in this study.
To manage, monitor, protect, and enhance the quality and stream of
benefits received from the urban forest, the Savannah Tree Foundation
initiated this study to assess:
The extent of current Urban Tree Canopy (UTC)
Trends in canopy cover over time
Priority areas for tree planting, restoration, and protection
This report presents data, maps, and broad recommendations for setting,
achieving, and monitoring UTC goals and drafting policy improvements for
the benefit of all citizens in Chatham County.
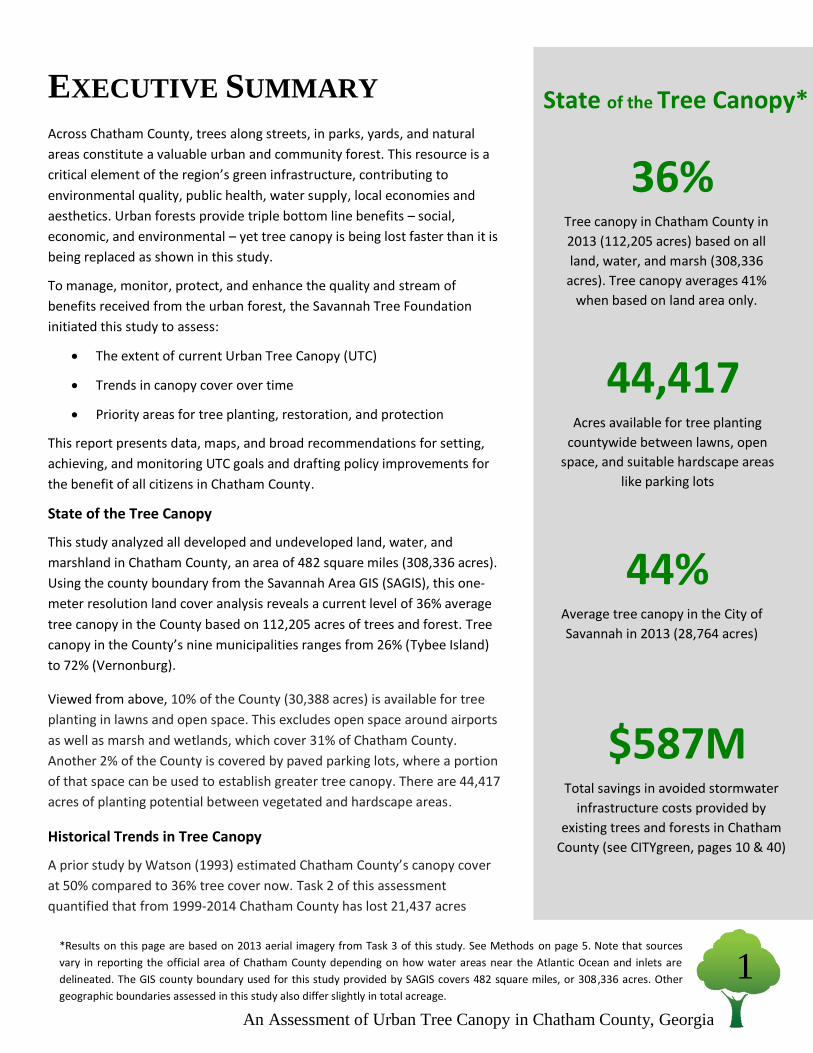
State of the Tree Canopy
This study analyzed all developed and undeveloped land, water, and
marshland in Chatham County, an area of 482 square miles (308,336 acres).
Using the county boundary from the Savannah Area GIS (SAGIS), this one-
meter resolution land cover analysis reveals a current level of 36% average
tree canopy in the County based on 112,205 acres of trees and forest. Tree
canopy in the County’s nine municipalities ranges from 26% (Tybee Island)
to 72% (Vernonburg).
Viewed from above, 10% of the County (30,388 acres) is available for tree
planting in lawns and open space. This excludes open space around airports
as well as marsh and wetlands, which cover 31% of Chatham County.
Another 2% of the County is covered by paved parking lots, where a portion
of that space can be used to establish greater tree canopy. There are 44,417
acres of planting potential between vegetated and hardscape areas.
Historical Trends in Tree Canopy
A prior study by Watson (1993) estimated Chatham County’s canopy cover
at 50% compared to 36% tree cover now. Task 2 of this assessment
quantified that from 1999-2014 Chatham County has lost 21,437 acres
36% Tree canopy in Chatham County in
2013 (112,205 acres) based on all
land, water, and marsh (308,336
acres). Tree canopy averages 41%
when based on land area only.
44,417 Acres available for tree planting
countywide between lawns, open
space, and suitable hardscape areas
like parking lots
$587M Total savings in avoided stormwater
infrastructure costs provided by
existing trees and forests in Chatham
County (see CITYgreen, pages 10 & 40)
44% Average tree canopy in the City of
Savannah in 2013 (28,764 acres)
State of the Tree Canopy*
*Results on this page are based on 2013 aerial imagery from Task 3 of this study. See Methods on page 5. Note that sources
vary in reporting the official area of Chatham County depending on how water areas near the Atlantic Ocean and inlets are
delineated. The GIS county boundary used for this study provided by SAGIS covers 482 square miles, or 308,336 acres. Other
geographic boundaries assessed in this study also differ slightly in total acreage.
2
2
An Assessment of Urban Tree Canopy in Chatham County, Georgia
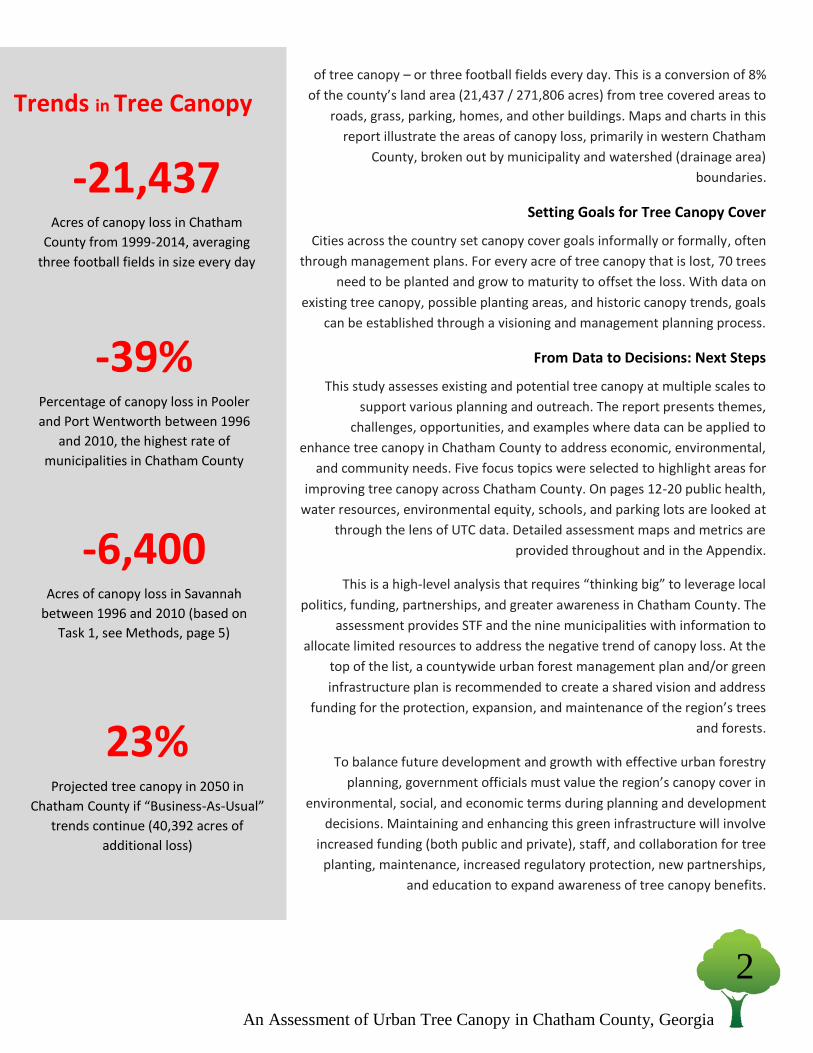
of tree canopy – or three football fields every day. This is a conversion of 8%
of the county’s land area (21,437 / 271,806 acres) from tree covered areas to
roads, grass, parking, homes, and other buildings. Maps and charts in this
report illustrate the areas of canopy loss, primarily in western Chatham
County, broken out by municipality and watershed (drainage area)
boundaries.
Setting Goals for Tree Canopy Cover
Cities across the country set canopy cover goals informally or formally, often
through management plans. For every acre of tree canopy that is lost, 70 trees
need to be planted and grow to maturity to offset the loss. With data on
existing tree canopy, possible planting areas, and historic canopy trends, goals
can be established through a visioning and management planning process.
From Data to Decisions: Next Steps
This study assesses existing and potential tree canopy at multiple scales to
support various planning and outreach. The report presents themes,
challenges, opportunities, and examples where data can be applied to
enhance tree canopy in Chatham County to address economic, environmental,
and community needs. Five focus topics were selected to highlight areas for
improving tree canopy across Chatham County. On pages 12-20 public health,
water resources, environmental equity, schools, and parking lots are looked at
through the lens of UTC data. Detailed assessment maps and metrics are
provided throughout and in the Appendix.
This is a high-level analysis that requires “thinking big” to leverage local
politics, funding, partnerships, and greater awareness in Chatham County. The
assessment provides STF and the nine municipalities with information to
allocate limited resources to address the negative trend of canopy loss. At the
top of the list, a countywide urban forest management plan and/or green
infrastructure plan is recommended to create a shared vision and address
funding for the protection, expansion, and maintenance of the region’s trees
and forests.
To balance future development and growth with effective urban forestry
planning, government officials must value the region’s canopy cover in
environmental, social, and economic terms during planning and development
decisions. Maintaining and enhancing this green infrastructure will involve
increased funding (both public and private), staff, and collaboration for tree
planting, maintenance, increased regulatory protection, new partnerships,
and education to expand awareness of tree canopy benefits.
3.5% Forest Canopy
Gain 1992 – 2013
based on sampling
approach using i-
-21,437 Acres of canopy loss in Chatham
County from 1999-2014, averaging
three football fields in size every day
Chatham County
Chatham County Municipalities
CCAP Land Cover Change
Canopy_Typ
Canopy Gained
Canopy Lost
Existing Canopy
Other Land Cover
23% Projected tree canopy in 2050 in
Chatham County if “Business-As-Usual”
trends continue (40,392 acres of
additional loss)
-39% Percentage of canopy loss in Pooler
and Port Wentworth between 1996
and 2010, the highest rate of
municipalities in Chatham County
-6,400 Acres of canopy loss in Savannah
between 1996 and 2010 (based on
Task 1, see Methods, page 5)
Trends in Tree Canopy

3
3
An Assessment of Urban Tree Canopy in Chatham County, Georgia
BACKGROUND An Assessment of Urban Tree Canopy in Chatham County, GA
In 2012, the Chatham County-Savannah Metropolitan Planning Commission
(MPC) established a Natural and Historic Resources Working Group to develop
recommendations for the continued protection of the County's natural,
cultural and historic resources. After engaging numerous community groups
and experts, Recommendation #9 of 13 called for an Urban Forest Master Plan
and a "periodic tree and canopy survey".
With funding and leadership by the Savannah Tree Foundation (STF), and
geospatial / forestry expertise from consultant Plan-It Geo LLC, the Chatham
County Urban Tree Canopy assessment achieves a portion of MPC’s
Recommendation #9. Maps, data, environmental analysis, and other
information are now available countywide on the extent of tree cover,
potential planting areas, impervious surfaces, marshland, and other land cover
conditions, along with trends in canopy cover change.
Chatham County covers approximately 482 square miles and has a 2014
population of roughly 276,400 (U.S. Census Bureau, 2012). Like most areas of the coast, Chatham County no longer has
large stands of virgin forests. Remaining forests vary in appearance. Maritime forest remnants heavy with saw
palmetto, oaks and other hardwoods cover many of the upland “necks” that meet tidal creeks and rivers. Much post-
agrarian acreage has returned either as secondary growth or as managed pine plantations for the pulp and paper
industries. In narrow upland zones on the banks of rivers and in forest remnants throughout, mixed tree species exist
with an overstory dominated primarily by live oak, southern red oak, water oak, red maple, sweetgum, magnolia, white
oak, and slash, longleaf and loblolly pine (Zydler, 2001).
Canopy cover has been studied before in Chatham County, first in 1993 by Watson (Watson 1993) and again in 2001 by
Kramer (Kramer, 2001). This study verifies previously identified trends in tree canopy loss and builds upon the
knowledge base of the impacts of population growth and development policies on tree canopy.
Tree Canopy and Management Planning
Urban forests require management and planning like any other asset in a community, especially if they are to provide an
optimal level of services and benefits. This requires local leaders, planners, and residents to contribute their efforts and
monetary resources to ensure a vibrant urban forest. To inform management and planning, it is critical to inventory and
assess trees and forests periodically to identify safety concerns, maintenance needs, quality, and large trends which can
be positive or negative and impact policies and outreach.
Chatham County and individual municipalities lack an urban forest management or green infrastructure plan. The data
and trends analysis from this study provide critical information to drive goals, policies, ordinance development and
revisions, funding strategies, revisions, and public involvement for a management plan, benefiting all citizens and
communities in Chatham County. This report should serve to strengthen local/regional partnerships, build awareness of
Figure 1: Chatham County, Georgia,
the UTC assessment study area.
Georgia

4
4
An Assessment of Urban Tree Canopy in Chatham County, Georgia
urban forest benefits and enable Chatham County municipalities to establish and implement canopy goals and
strategies, as well as support the development of an Urban Forest Management Plan.
What is an Urban Tree Canopy Assessment? – One tool that is available to assist in sustainable urban natural resource
planning is an Urban Tree Canopy (UTC) Assessment, a "top-down" GIS analysis of tree canopy cover, impervious
surfaces (developed areas), and other land cover types. UTC studies have been used by more than 300 cities and rural
communities nationwide since 2000. The data shows where tree canopy cover exists and where trees can and should be
planted in a community. The analysis can also quantify some of the economic and environmental services (benefits)
provided by the community's tree cover, including carbon storage and sequestration, air pollution removal, and storm
water management as shown in this report.
An urban tree canopy assessment is a big picture landscape-scale study rather than a localized plan or an on-the-ground
survey of trees species and tree health. Utilizing a UTC assessment requires "thinking big" about natural resources and
the environment, development and regulatory practices, local economies, interdisciplinary collaboration, and the
societal desires in our communities.
How can a UTC study benefit a community? – With data, maps, and tools to visualize green infrastructure, elected
officials and resource managers can plan more intelligently for what is needed and how to get there. UTC data and
reporting provide a baseline for environmental planning programs, policy-making, city forestry budgeting and
maintenance, and education/outreach/awareness. Many people are visual learners, and a UTC assessment provides
critical maps and information to guide planning and development decisions from a city-wide scale to the neighborhood
or even individual property scale.
Valuing Tree Canopy
From tourism and shade to recreation and clean air, trees and forests can be valued for the benefits and services they
provide, both directly and indirectly, as well as for their beauty and sense of place they help create. This study uses the
latest, best available science to quantify a subset of the functional and ecosystem services values from Chatham
County's urban forest (see Figure 6 on page 10).
While this study focuses on tree canopy, the effort as a whole is really about enhancing benefits of the tree canopy to
the community. This includes: public health in terms of air and water quality and the connection between obesity and
walkability; economic development in terms of property values, tourism, recreation, and retail vitality; and
protecting/managing forests, marshes and watersheds for improved water quality, wildlife habitat and flood risk
mitigation. Tree canopy improves our lives in many different ways.

5
5
An Assessment of Urban Tree Canopy in Chatham County, Georgia
METHODS
To improve management, planning, policy-making, and outreach, urban forests are routinely inventoried and assessed
using bottom-up methods such as tree inventories or field plot sampling. Top-down methods involve aerial or satellite
imagery analysis. Three top-down methods were employed for the Chatham County canopy assessment:
Task 1: A Spatial Canopy Cover Trends Analysis – to provide a “wall-to-wall” map of changes in canopy and
developed areas, land cover data from the National Oceanic and Atmospheric Administration’s (NOAA) Coastal
Change Analysis Program (C-CAP) were used (specifically 1996, 2006, and 2010). While this is based on coarse
resolution (30-meter) satellite imagery, it was the only data available to both quantify and spatially map land
cover change across political jurisdictions and drainage areas (watersheds) for multiple time periods.
Task 2: A Statistical Sampling of Canopy Cover Trends – for a more rigorous statistical sample of trends, a sampling
approach with i-Tree Canopy software was used to evaluate “tree vs. non-tree canopy” land cover for 2,250
random points countywide, yielding a 1% standard error (SE) in the measure of canopy cover percent countywide.
One-foot resolution aerial images from 1999, 2004, 2009, and 2014 were used (Google, Bing, and other sources).
Task 3: A Comprehensive Urban Tree Canopy Assessment – this provided a current, accurate, high-resolution
baseline of canopy cover and possible planting areas from the county-scale down to individual properties
(parcels). The UTC Assessment was based on 1-meter resolution, 2013 aerial imagery from the USDA National
Agricultural Imagery Program (NAIP) and 2009 LiDAR data from Savannah Area GIS (SAGIS). Numerous GIS layers
from SAGIS, the USGS, and other sources were used to map the following land cover classes: (1) tree canopy, (2)
marsh and wetlands, (3) grass and open space, (4) buildings, (5) roads, (6) parking lots, (7) other impervious
surfaces (patios, sidewalks, etc.), (8) barren soil / dry vegetation, and (9) water. Once finalized, the land cover data
was overlaid and assessed with numerous boundaries to provide metrics at multiple scales.
Important Details on Calculating Percentages of Land Cover vs. Urban Tree Canopy Metrics in this Study
The tasks above each utilized Geographic Information Systems (GIS) to measure existing canopy cover and historical
canopy trends. However, percentages were calculated and reported differently for Task 1 and 2 vs. Task 3, as follows.
For Tasks 1 and 2 above, land cover percentages at the county-level were calculated by dividing each land cover
class by the entire county area (308,336 acres) which included all land, water, and marsh area. This provided an
apples-to-apples comparison to the Watson (1993) canopy study and allows STF to build upon studies over time
in a consistent way that is specific to Chatham County’s unique coastal ecosystem.
For Task 3 above, UTC assessment metrics described on the next page were calculated by dividing UTC types by
the land area in Chatham County (271,805 acres), which excludes open water areas mapped through this study.
This is consistent with UTC industry protocols developed by the USDA Forest Service (USFS, 2014). See additional
details on methods in the Appendix.
This method allows STF and Chatham County communities to compare tree canopy coverage to other counties
and cities (see tree canopy comparisons, Figures 19a & 19b on page 26).
Tree Canopy Benefits Analysis
The best available science and modeling software, specifically CITYgreen* and i-Tree tools (www.itreetools.org,), were

6
6
An Assessment of Urban Tree Canopy in Chatham County, Georgia
used to calculate some of the economic and environmental benefits (“ecosystem services”; see Key Terms below)
provided by Chatham County’s urban forest. More information on these methods can be found in the Appendix (A-3).
*Information on CITYgreen software can be found at http://www.planningtoolexchange.org/tool/citygreen-0
Key Terms: (See Appendix for additional glossary of urban forestry and assessment terms)
Ecosystem Services: Trees are often appreciated for aesthetics but they also contribute to public health, the economy and the environment. This project quantified some of the functional benefits of urban trees, or ecosystem services, specifically carbon storage and sequestration, stormwater regulation, and air pollution mitigation. Other urban forest ecosystem services include energy conservation and provisioning of food and oxygen.
Geographic Information Systems (GIS): Software and technology for viewing, creating, manipulating, analyzing, and sharing spatial data, attribute database tables, and maps. Examples include Esri ArcGIS and open source GIS software.
National Agricultural Imagery Program (NAIP): USDA, Farm Services Agency (FSA), 1-meter leaf-on aerial photography.
Parking Lots: All paved parking areas, primarily on commercial/industrial land uses (does not include driveways or miscellaneous pavement on single family residential lots). This land cover class is based solely on the GIS data layer provided by SAGIS, digitized based off of 2008 aerial imagery, and includes occasional unpaved industrial surfaces.
Possible Planting Area (PPA): Available space for tree planting, derived from the land cover mapping, categorized by:
PPA Vegetation: Areas of grass and open space where tree canopy does not exist and it is biophysically possible to plant trees. Marshland and wetlands were classified separately from PPA. Percent values in this report for PPA are based on plantable space divided by land area (excludes water).
PPA Impervious: Paved areas void of tree canopy, excluding buildings and roads, where it is biophysically possible to establish tree canopy. Examples include parking lots and patios.
Total PPA: The addition of PPA Vegetation area and PPA Impervious area.
Unsuitable Planting Area: Areas where it is not feasible to plant trees. For the Chatham County project, roadbeds, buildings, agricultural fields, airports, and marshlands were manually defined as unsuitable planting areas.
Urban Tree Canopy (UTC): The "layer of leaves, branches and stems that cover the ground" (Raciti et al., 2006) when viewed from above; the metric used to quantify the extent, function, and value of Chatham County's urban forest.
Figure 2: This subdivision in western Chatham County (west of Interstate-95) was intentionally designed with open
green space and provides ample tree planting potential.

7
7
An Assessment of Urban Tree Canopy in Chatham County, Georgia
STATE OF THE TREE CANOPY This report identifies canopy cover trends as a result of deforestation for development,
conservation of canopy through planning and regulation, and tree planting over the past
several decades. Results are based on Task 3 – Comprehensive UTC Assessment based on
2013 imagery – unless otherwise stated.
Total Countywide Results
This study encompasses 308,336 acres (482 sq. miles) within Chatham County and provides
a snapshot of land cover based on 2013 1-meter NAIP imagery. Trees cover 36%
countywide (112,205 acres), of which almost half (47%) is found in unincorporated
Chatham County. Approximately 10% of Chatham County is covered by various types of
impervious surfaces, and parking lots alone cover 2% (4,853 acres). Total impervious area
may be slightly underestimated where tree canopy overhangs roads, buildings, parking
lots, and other hardscape surfaces.
Individual Municipality Results
Across the nine municipalities in Chatham County, tree canopy ranges from 72% (191 acres) in Vernonburg to 26% (419 acres) on Tybee Island. See Figure 3. Based on the land cover mapping, available space for tree planting comprised of grass, open space, parking lots and more (Total PPA), ranges from a high of 28% (242 acres) in Thunderbolt to a low of 6% (16 acres) in Vernonburg. See Table 1.
Savannah
Vernonburg Unincorporated
Table 1: Percent UTC & plantable area by municipality (based
on land area which excludes water)
Figure 3: Percent tree
canopy by municipality
Tybee Island
Unincorporated Thunderbolt
Pooler
Port Wentworth
Bloomingdale Garden
City

8
8
An Assessment of Urban Tree Canopy in Chatham County, Georgia
*
Detailed Land Cover Results
Figure 4: 2014 Chatham County land cover map and summary statistics
* NWI = National Wetlands Inventory
Figure 4 below from Task 3 depicts the types, extent, and statistical distribution of the land cover in Chatham County based on 1-meter resolution aerial imagery. Tree canopy and marshland collectively make up 2/3 of the total area.
This map and more results are available in an interactive UTC
map book (PDF format). Contact the Savannah Tree
Foundation for a copy.

9
9
An Assessment of Urban Tree Canopy in Chatham County, Georgia
Figure 5: Distribution of land cover classes by municipality in Chatham County, Georgia (percentages are based on total area
including water).
Figure 5 below illustrates the distribution of land cover classes across each municipality. Municipalities with a higher
percentage of marshland, wetlands, and water generally have lower tree canopy. See Appendix for additional tables,
charts, and maps.
Watershed Results
Tree canopy in the County’s drainage basins ranges from 35% (2,470 acres) in the Sterling Creek/Ogeechee River basin
to 85% (1,658 acres) in the Dasher Creek/Savannah River basin. Outlet Savannah River, the County’s largest drainage,
has 46% tree cover. The Sterling Creek / Ogeechee River basin ranked lowest in possible planting area with 4% (292
acres), while the Pipemaker Canal basin has the highest at 20% (1,823 acres). See additional results on page 15 and on
page 44 in the Appendix.

10
10
An Assessment of Urban Tree Canopy in Chatham County, Georgia
Quantifying Ecosystem Benefits of the Tree Canopy in Chatham County
Using the best available science and models such as i-Tree, we can now place a value on some of the benefits and
functions provided by trees and forests in Chatham County. The urban forest holds millions of dollars of savings in
avoided infrastructure costs, pollution reduction, and stored carbon.
Air Quality – trees produce oxygen, capture air pollutants such as particulate matter directly on their leaves, improving
public health, and reduce pollution indirectly by lowering air temperatures, reducing the formation of ozone.
The existing tree canopy in Chatham County removes 4,842 tons of air pollution annually, valued at $8,500,000.
Stormwater and Water Quality – trees and forests mitigate storm runoff which minimizes flood risk, stabilizes soil,
reduces sedimentation in streams and marshland, and absorbs pollutants, thus improving water quality and habitats.*
On average, each acre of tree canopy in Chatham County intercepts the equivalent volume of storm water runoff
that is managed by engineered detention ponds is valued at roughly $5,000. Extrapolated countywide, this
means the County's existing tree canopy provides $587M in storm water regulation over a 20-year financing
period.
Carbon Storage and Sequestration – trees accumulate carbon in their biomass; with most species in a temperate forest,
the rate and amount increases with age.
Chatham County trees store approximately 14.2 million tons of carbon, valued at $274 million, and each year the
tree canopy absorbs and sequesters approximately 652,000 tons of carbon dioxide, valued at $12.6 million.
* CITYgreen software uses the Natural Resources Conservation Service Technical Release 55 (NRCS TR55) model to estimate the
additional stormwater runoff that would result without trees. The model uses the curve number (CN) system and event-based
storms. The values reported are large given the size of the county and remaining canopy. See Appendix page 40 for more
information (Agriculture, 2013).
Figure 6: Quantification of some of the monetary benefits of Chatham County’s urban forest ecosystem services (based on 36% countywide
tree cover).
$587 Million Savings in avoided storm water infrastructure costs in Chatham County
$8.5 Million Annual savings in air pollution removal services provided by the current tree canopy in Chatham County
$274 Million Value of total stored carbon in Chatham County tree canopy
11
11
An Assessment of Urban Tree Canopy in Chatham County, Georgia
Municipality
Change in
Canopy
(Acres)
Change
in
Canopy*
Loss of
Total
Canopy**
Bloom ingdale -1,683 -19% -30%
Garden City -1,032 -11% -24%
Pooler -5,054 -26% -39%
Port W entworth -2,840 -27% -39%
Savannah -6,429 -9% -29%
Thunderbolt -23 -2% -25%
Tybee Island 4 0% 3%
Vernonburg -2 -1% -1%
Unincorporated -6,028 -3% -13%
Chatham County -23,088 -7% -23%
Figure 8: Trends in tree canopy in Chatham County using a
statistical sampling approach, including Watson’s 1992 estimate.
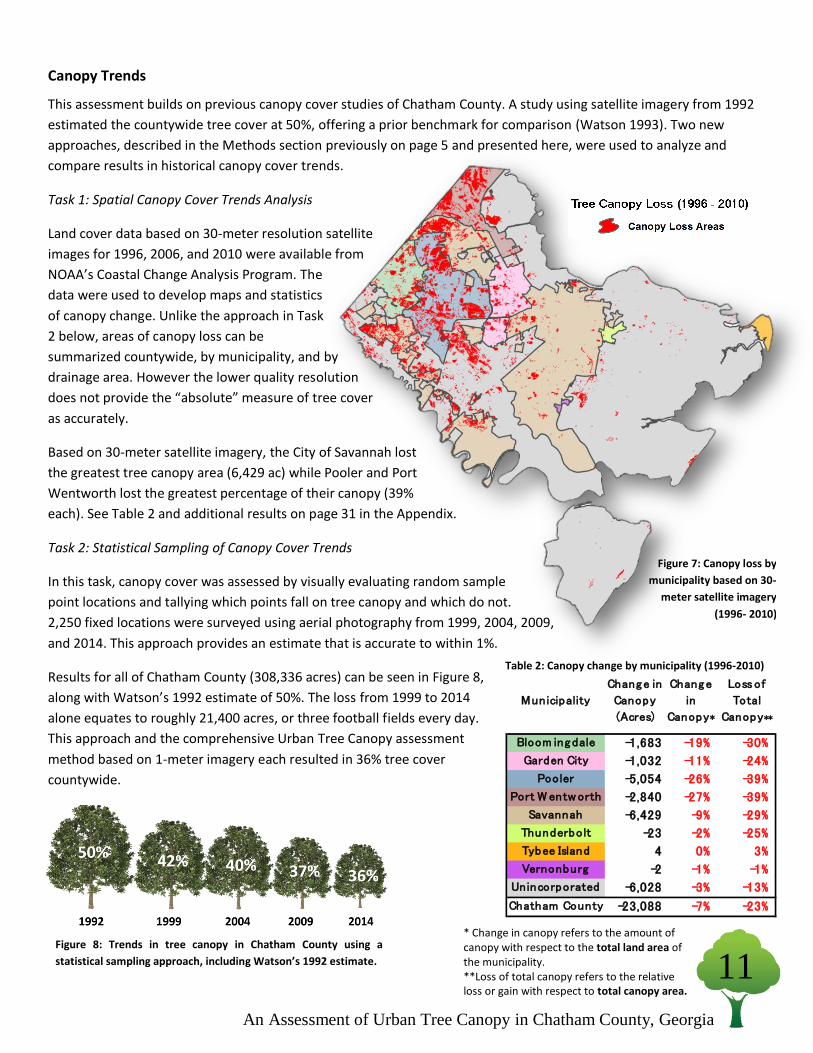
Canopy Trends
This assessment builds on previous canopy cover studies of Chatham County. A study using satellite imagery from 1992
estimated the countywide tree cover at 50%, offering a prior benchmark for comparison (Watson 1993). Two new
approaches, described in the Methods section previously on page 5 and presented here, were used to analyze and
compare results in historical canopy cover trends.
Task 1: Spatial Canopy Cover Trends Analysis
Land cover data based on 30-meter resolution satellite
images for 1996, 2006, and 2010 were available from
NOAA’s Coastal Change Analysis Program. The
data were used to develop maps and statistics
of canopy change. Unlike the approach in Task
2 below, areas of canopy loss can be
summarized countywide, by municipality, and by
drainage area. However the lower quality resolution
does not provide the “absolute” measure of tree cover
as accurately.
Based on 30-meter satellite imagery, the City of Savannah lost
the greatest tree canopy area (6,429 ac) while Pooler and Port
Wentworth lost the greatest percentage of their canopy (39%
each). See Table 2 and additional results on page 31 in the Appendix.
Task 2: Statistical Sampling of Canopy Cover Trends
In this task, canopy cover was assessed by visually evaluating random sample
point locations and tallying which points fall on tree canopy and which do not.
2,250 fixed locations were surveyed using aerial photography from 1999, 2004, 2009,
and 2014. This approach provides an estimate that is accurate to within 1%.
Results for all of Chatham County (308,336 acres) can be seen in Figure 8,
along with Watson’s 1992 estimate of 50%. The loss from 1999 to 2014
alone equates to roughly 21,400 acres, or three football fields every day.
This approach and the comprehensive Urban Tree Canopy assessment
method based on 1-meter imagery each resulted in 36% tree cover
countywide.
Figure 7: Canopy loss by
municipality based on 30-
meter satellite imagery
(1996- 2010)
* Change in canopy refers to the amount of canopy with respect to the total land area of the municipality. **Loss of total canopy refers to the relative loss or gain with respect to total canopy area.
Table 2: Canopy change by municipality (1996-2010)
12
12
An Assessment of Urban Tree Canopy in Chatham County, Georgia
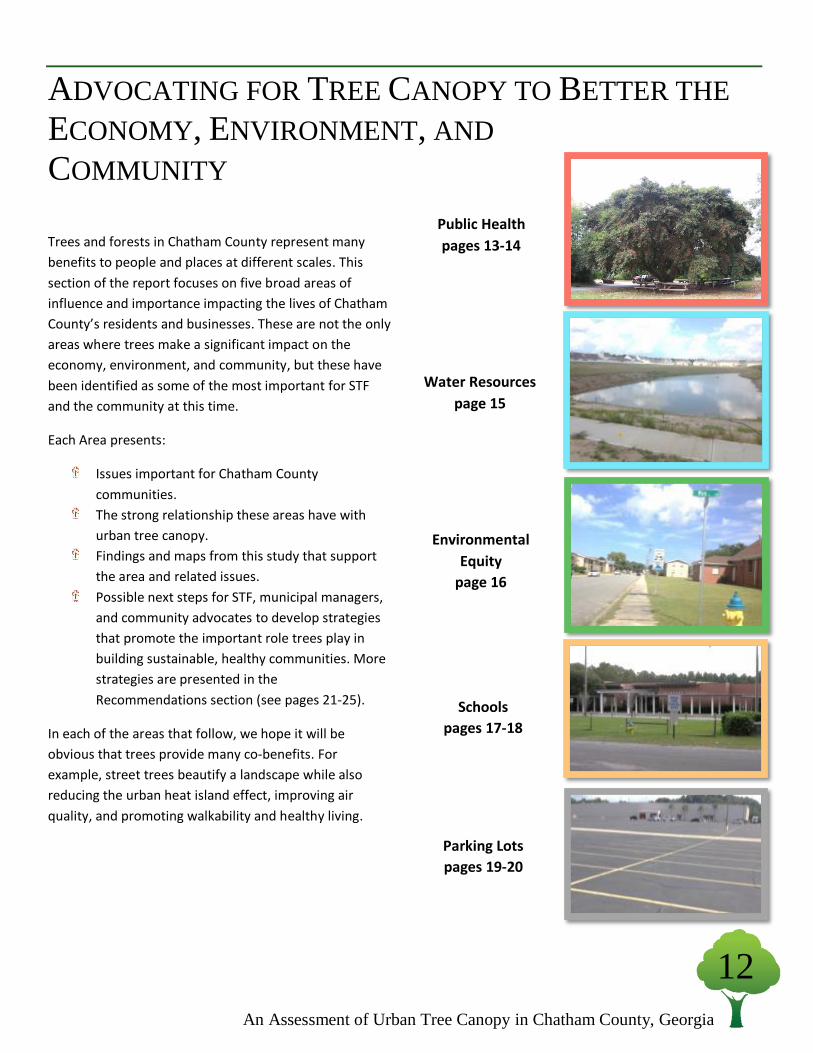
ADVOCATING FOR TREE CANOPY TO BETTER THE
ECONOMY, ENVIRONMENT, AND
COMMUNITY
Trees and forests in Chatham County represent many
benefits to people and places at different scales. This
section of the report focuses on five broad areas of
influence and importance impacting the lives of Chatham
County’s residents and businesses. These are not the only
areas where trees make a significant impact on the
economy, environment, and community, but these have
been identified as some of the most important for STF
and the community at this time.
Each Area presents:
Issues important for Chatham County
communities.
The strong relationship these areas have with
urban tree canopy.
Findings and maps from this study that support
the area and related issues.
Possible next steps for STF, municipal managers,
and community advocates to develop strategies
that promote the important role trees play in
building sustainable, healthy communities. More
strategies are presented in the
Recommendations section (see pages 21-25).
In each of the areas that follow, we hope it will be
obvious that trees provide many co-benefits. For
example, street trees beautify a landscape while also
reducing the urban heat island effect, improving air
quality, and promoting walkability and healthy living.
Environmental
Equity
page 16
Schools
pages 17-18
Parking Lots
pages 19-20
Water Resources
page 15
Public Health
pages 13-14

13
13
An Assessment of Urban Tree Canopy in Chatham County, Georgia
The Issue:
The 2013 Chatham County Community Health Needs
Assessment identified the following public health issues in our
community most relevant to trees and their benefits:
Lung and Bronchus Incidence Rate
Babies with Low Birth Weight
Babies with Very Low Birth Weight
Childhood Obesity and Health
Access to Healthy Food
High School Graduation
An increased effort to address these needs should be focused on the at-risk populations of Chatham
County in ZIP codes 31401, 31404, and 31415. View the Community Health Needs Assessment at:
https://www.memorialhealth.com/uploadedfiles/content/main/about_us/community_needs_assessmen
t/community%20needs%20assessment.pdf
In addition to these categorical public health issues, local doctors note that of great concern is the large
number of Savannah – Chatham County residents who as young adults, and/or still teenagers have
children of their own, or end up in the court-prison system. Many households and individuals depend on
social services and limited area resources. This cycle of poor health, low education and dependence on
government for basic household living monopolizes resources that could otherwise be dispensed for
community wide improvement.
PUBLIC HEALTH
How Trees Relate:
Trees in the Street Right-of-Way (ROW) in planting areas along the outer edge of pavement,
often referred to as street trees, can slow traffic, create more walkable neighborhoods, and filter
out harmful pollutants from car exhaust. Table 3 shows how ROW tree canopy compares among
Chatham County municipalities. A 2008 study of urban areas revealed that neighborhoods with
more greenery were 3 times more likely to have physically active inhabitants, and the residents
were 40% less likely to be obese (Orlando, 2010).
To maximize tree benefits for public health, managers and planners should protect and expand
tree canopy where people are active and air pollution concentration is highest, such as street
corridors, parks, other public spaces, and roadside or industrial buffers. With planning and
proper funding, municipalities can directly manage trees where mitigating vehicle noise and air
pollution will be most effective.
Table 3: Average tree canopy along street
corridors by municipality.
14
14
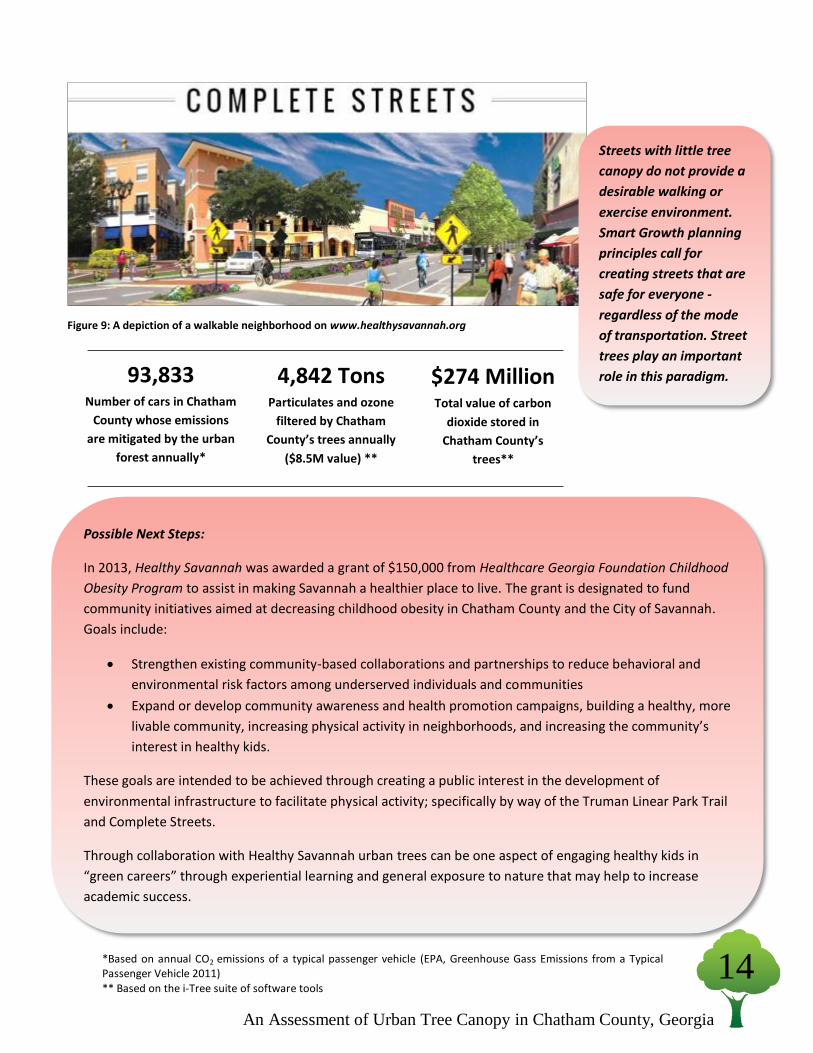
An Assessment of Urban Tree Canopy in Chatham County, Georgia
Figure 9: A depiction of a walkable neighborhood on www.healthysavannah.org
93,833 Number of cars in Chatham
County whose emissions
are mitigated by the urban
forest annually*
$274 Million Total value of carbon
dioxide stored in
Chatham County’s
trees**
4,842 Tons Particulates and ozone
filtered by Chatham
County’s trees annually
($8.5M value) **
Possible Next Steps:
In 2013, Healthy Savannah was awarded a grant of $150,000 from Healthcare Georgia Foundation Childhood
Obesity Program to assist in making Savannah a healthier place to live. The grant is designated to fund
community initiatives aimed at decreasing childhood obesity in Chatham County and the City of Savannah.
Goals include:
Strengthen existing community-based collaborations and partnerships to reduce behavioral and
environmental risk factors among underserved individuals and communities
Expand or develop community awareness and health promotion campaigns, building a healthy, more
livable community, increasing physical activity in neighborhoods, and increasing the community’s
interest in healthy kids.
These goals are intended to be achieved through creating a public interest in the development of
environmental infrastructure to facilitate physical activity; specifically by way of the Truman Linear Park Trail
and Complete Streets.
Through collaboration with Healthy Savannah urban trees can be one aspect of engaging healthy kids in
“green careers” through experiential learning and general exposure to nature that may help to increase
academic success.
Streets with little tree
canopy do not provide a
desirable walking or
exercise environment.
Smart Growth planning
principles call for
creating streets that are
safe for everyone -
regardless of the mode
of transportation. Street
trees play an important
role in this paradigm.
*Based on annual CO2 emissions of a typical passenger vehicle (EPA, Greenhouse Gass Emissions from a Typical Passenger Vehicle 2011) ** Based on the i-Tree suite of software tools
15
15
An Assessment of Urban Tree Canopy in Chatham County, Georgia
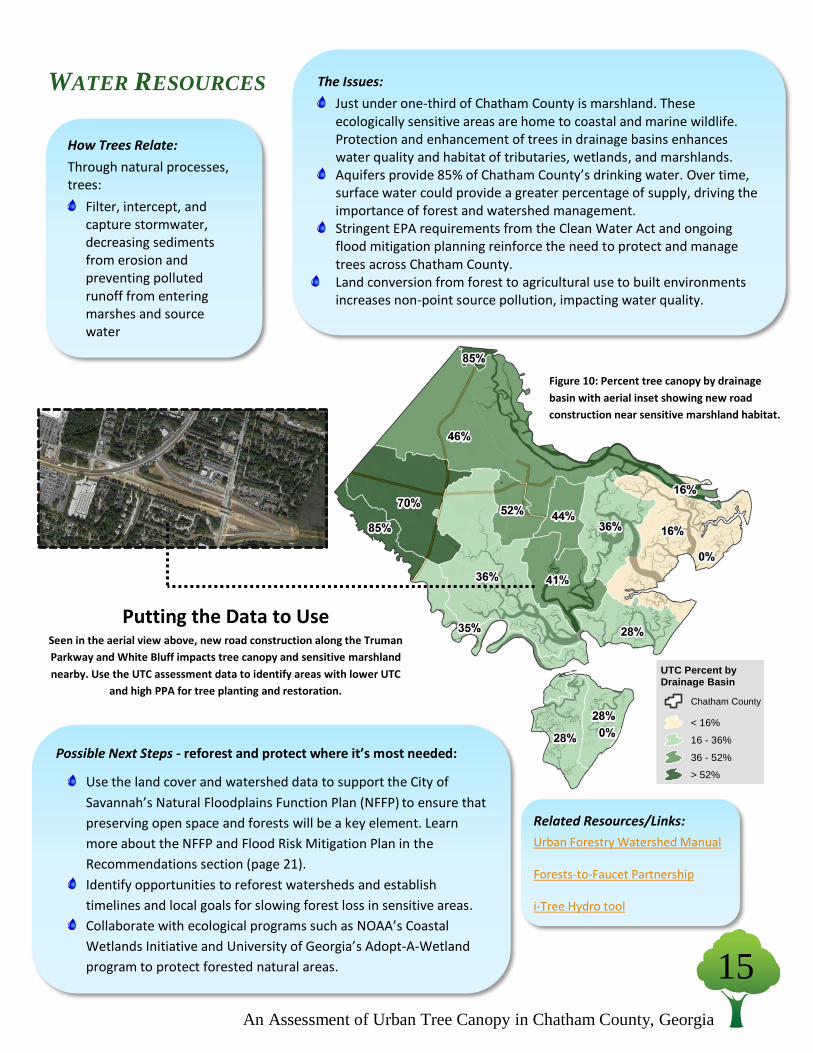
WATER RESOURCES
s
UTC Percent byDrainage Basin
Chatham County
< 16%
16 - 36%
36 - 52%
> 52%
Possible Next Steps - reforest and protect where it’s most needed:
Use the land cover and watershed data to support the City of
Savannah’s Natural Floodplains Function Plan (NFFP) to ensure that
preserving open space and forests will be a key element. Learn
more about the NFFP and Flood Risk Mitigation Plan in the
Recommendations section (page 21).
Identify opportunities to reforest watersheds and establish
timelines and local goals for slowing forest loss in sensitive areas.
Collaborate with ecological programs such as NOAA’s Coastal
Wetlands Initiative and University of Georgia’s Adopt-A-Wetland
program to protect forested natural areas.
The Issues:
Just under one-third of Chatham County is marshland. These ecologically sensitive areas are home to coastal and marine wildlife. Protection and enhancement of trees in drainage basins enhances water quality and habitat of tributaries, wetlands, and marshlands. Aquifers provide 85% of Chatham County’s drinking water. Over time, surface water could provide a greater percentage of supply, driving the importance of forest and watershed management. Stringent EPA requirements from the Clean Water Act and ongoing flood mitigation planning reinforce the need to protect and manage trees across Chatham County. Land conversion from forest to agricultural use to built environments increases non-point source pollution, impacting water quality.
How Trees Relate:
Through natural processes, trees:
Filter, intercept, and capture stormwater, decreasing sediments from erosion and preventing polluted runoff from entering marshes and source water
Related Resources/Links:
Urban Forestry Watershed Manual
Forests-to-Faucet Partnership
i-Tree Hydro tool
Putting the Data to Use
Seen in the aerial view above, new road construction along the Truman
Parkway and White Bluff impacts tree canopy and sensitive marshland
nearby. Use the UTC assessment data to identify areas with lower UTC
and high PPA for tree planting and restoration.
Figure 10: Percent tree canopy by drainage
basin with aerial inset showing new road
construction near sensitive marshland habitat.

16
16
An Assessment of Urban Tree Canopy in Chatham County, Georgia
The Issue:
Nearly 20% of Chatham County residents live below the poverty level
(US Census Bureau 2012). A study conducted by the School of Forestry
& Wildlife Services at Auburn University, AL indicated that for every
1% increase in per capita income, the demand for forest cover
increased by 1.76% (Zhu, 2008). Trees and the benefits they provide
should be enjoyed by all, not just the most affluent neighborhoods in
Chatham County.
ENVIRONMENTAL EQUITY
Possible Next Steps:
Allocate funds to improve greenscaping and landscaping around mixed income residential
neighborhoods
Secure private and public partnerships for public housing to incorporate canopy standards
Collaborate with community centers to engage residents to plant and care for trees
How Trees Relate:
Trees strategically planted
around a home can save a
homeowner hundreds of
dollars in electric bills
annually. Furthermore, trees
can increase the property
value of a home as much as
10%.
A thriving urban forest
creates a more desirable
place to live, reduces crime
and stress.
Forested areas help children
develop social skills, improve
performance in school, and
reduce symptoms of
Attention Deficit Disorder
(Kuo, 2001).
92
Neighborhoods (out of 187)
have more than 30% tree
planting space (Total PPA)
24
Neighborhoods
(out of 187) have
less than 20%
UTC
Figure 12: Percent UTC by neighborhood (data
from SAGIS) and Bayview neighborhood inset
showing properties with less than 5% canopy
and more than 50% planting space.
Parcels with <5% UTC and >50% PPA
Figure 11: Low-income housing near Damon St.
& Carolan St. without street or yard trees to
provide the benefits of tree canopy.

17
17
An Assessment of Urban Tree Canopy in Chatham County, Georgia
SCHOOLS
High School Name
Land Area
(acres)
UTC (acres)
UTC %
PPA Vegetation
(acres)
PPA Vegetation
%
Total PPA (acres)
Total PPA %
Beach 31 8 26% 6 18% 14 44%
Groves 39 3 8% 17 43% 31 78%
Islands 78 39 50% 19 24% 30 38%
Jenkins 40 9 23% 12 31% 22 54%
Johnson 27 6 21% 9 33% 16 58%
New Hampstead 75 43 57% 11 15% 29 39%
Savannah Arts 7 1 8% 1 13% 5 61%
SHS - Liberal Studies 52 14 26% 24 47% 33 64%
Windsor Forest 25 5 19% 11 43% 16 65%
OVERALL 349 122 35% 100 29% 179 51%
Snapshot: Groves High School Graduation Rate (2013): 54%
Percent tree canopy: 8%
Percent open space for planting: 43%
Percent covered by parking lot: 21%
Percent planting space (soft and hardscapes): 78%
Figure 13: Parcels near Groves High School with low
canopy cover (less than 20%) and high planting
potential (greater than 40%).
The Issue:
School grounds are ideal areas to improve the urban
forest in Chatham County from the ground up. Trees
can improve physical fitness, attention span, outdoor
education, and public health.
Legend
PPA > 40% & UTC < 20%
How Trees Relate:
o Trees beautify school grounds and provide shade from the heat and sun. Furthermore,
student tree planting programs help children connect to nature and the environment.
o High tree canopy on school grounds can be linked to improved test scores, lower
occurrences of crime, and higher graduation rates (Orlando, Urban Forests Share Links
with Healthy Lives 2014).
Table 4: UTC assessment metrics on High School properties
18
18
An Assessment of Urban Tree Canopy in Chatham County, Georgia
Possible Next Steps:
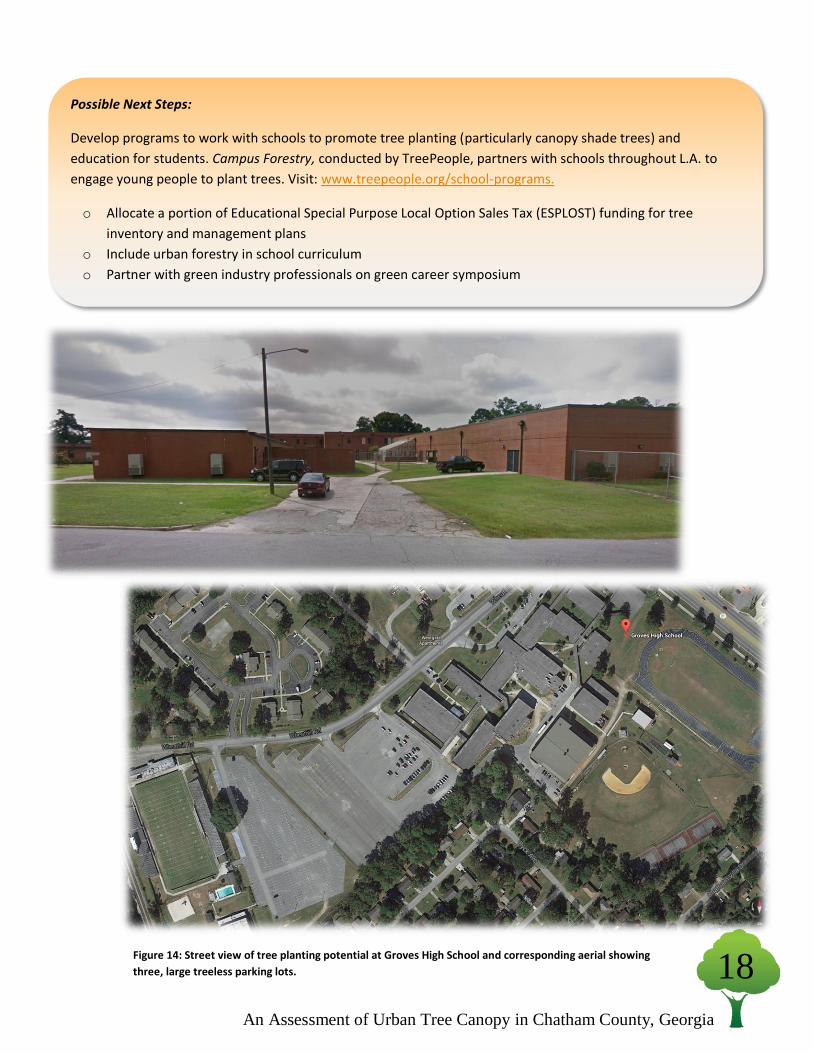
Develop programs to work with schools to promote tree planting (particularly canopy shade trees) and
education for students. Campus Forestry, conducted by TreePeople, partners with schools throughout L.A. to
engage young people to plant trees. Visit: www.treepeople.org/school-programs.
o Allocate a portion of Educational Special Purpose Local Option Sales Tax (ESPLOST) funding for tree
inventory and management plans
o Include urban forestry in school curriculum
o Partner with green industry professionals on green career symposium
Figure 14: Street view of tree planting potential at Groves High School and corresponding aerial showing
three, large treeless parking lots.

19
19
An Assessment of Urban Tree Canopy in Chatham County, Georgia
PARKING LOTS
The Issue:
Impervious surfaces trap radiation during the day increasing surface temperatures and creating urban heat
islands. Parking lots cover 2% (4,853 acres) of Chatham County.* On these parcels, tree canopy is close to half
the County average (21% vs. 36%, respectively) and available planting space averages 48%, 3 times higher
than the rest of the county (16%). Through stronger landscaping ordinances, canopy cover can enhance retail
values as well create healthier and more pleasant environments.
Figure 15: Color-infrared aerial view of parcels in Pooler that retained tree canopy (left, on the northeast corner of Coleman Blvd. and
Artley Road) vs. did not retain canopy (right, on the southeast corner of Continental Blvd. and Louisville Road).
*For this study, parking lots were defined as all paved parking areas, primarily on commercial/industrial land uses (does not include
driveways or miscellaneous pavement on single family residential lots). This land cover class is based solely on the GIS data layer
provided by SAGIS, digitized based off of 2008 aerial imagery, and includes occasional unpaved industrial surfaces.

20
20
An Assessment of Urban Tree Canopy in Chatham County, Georgia
Possible Next Steps and Related Resources:
Strengthen landscaping ordinances in parking lots and enhance stormwater detention
ponds. Read “Parking Lot Shade Regulations: Review and Recommendations” from
the nonprofit Tree Davis and visit: http://www.isa-
arbor.com/education/resources/educ_TreeOrdinanceGuidelines.pdf.
Work w/Chatham municipalities to strengthen tree ordinances to include strong
incentives for more parking lot interior shade and better enforcement for
maintenance of trees preserved or planted.
How Trees Relate:
Tree canopy over large hardscape, impervious areas such as parking lots cools surface temperatures on
hot sunny days, mitigates storm water runoff and the effects of urban heat islands, and improves air
quality and aesthetics. Studies have shown that consumers report a willingness to pay 9-12% more for
goods in districts with mature tree canopy (Wolf, 2005).
As seen below in Figure 16, even on the Saturday before Christmas, many parking spaces are empty,
indicating greater space is available for trees in parking lots.
Figure 16. Abercorn at Mall Blvd. in Savannah, GA. Saturday afternoon before Christmas.
21
21
An Assessment of Urban Tree Canopy in Chatham County, Georgia
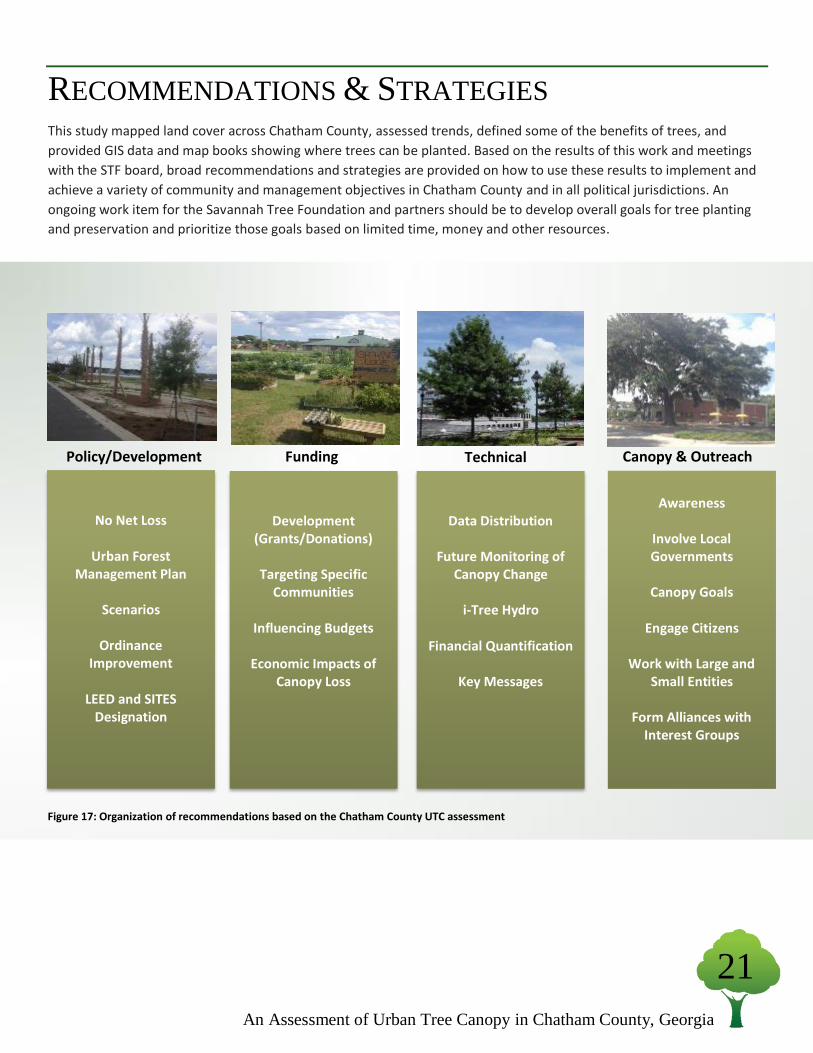
RECOMMENDATIONS & STRATEGIES This study mapped land cover across Chatham County, assessed trends, defined some of the benefits of trees, and
provided GIS data and map books showing where trees can be planted. Based on the results of this work and meetings
with the STF board, broad recommendations and strategies are provided on how to use these results to implement and
achieve a variety of community and management objectives in Chatham County and in all political jurisdictions. An
ongoing work item for the Savannah Tree Foundation and partners should be to develop overall goals for tree planting
and preservation and prioritize those goals based on limited time, money and other resources.
No Net Loss
Urban Forest Management Plan
Scenarios
Ordinance
Improvement
LEED and SITES Designation
Development (Grants/Donations)
Targeting Specific
Communities
Influencing Budgets
Economic Impacts of Canopy Loss
Awareness
Involve Local Governments
Canopy Goals
Engage Citizens
Work with Large and
Small Entities
Form Alliances with Interest Groups
Policy/Development Funding Technical Canopy & Outreach
Data Distribution
Future Monitoring of Canopy Change
i-Tree Hydro
Financial Quantification
Key Messages
Figure 17: Organization of recommendations based on the Chatham County UTC assessment
22
22
An Assessment of Urban Tree Canopy in Chatham County, Georgia
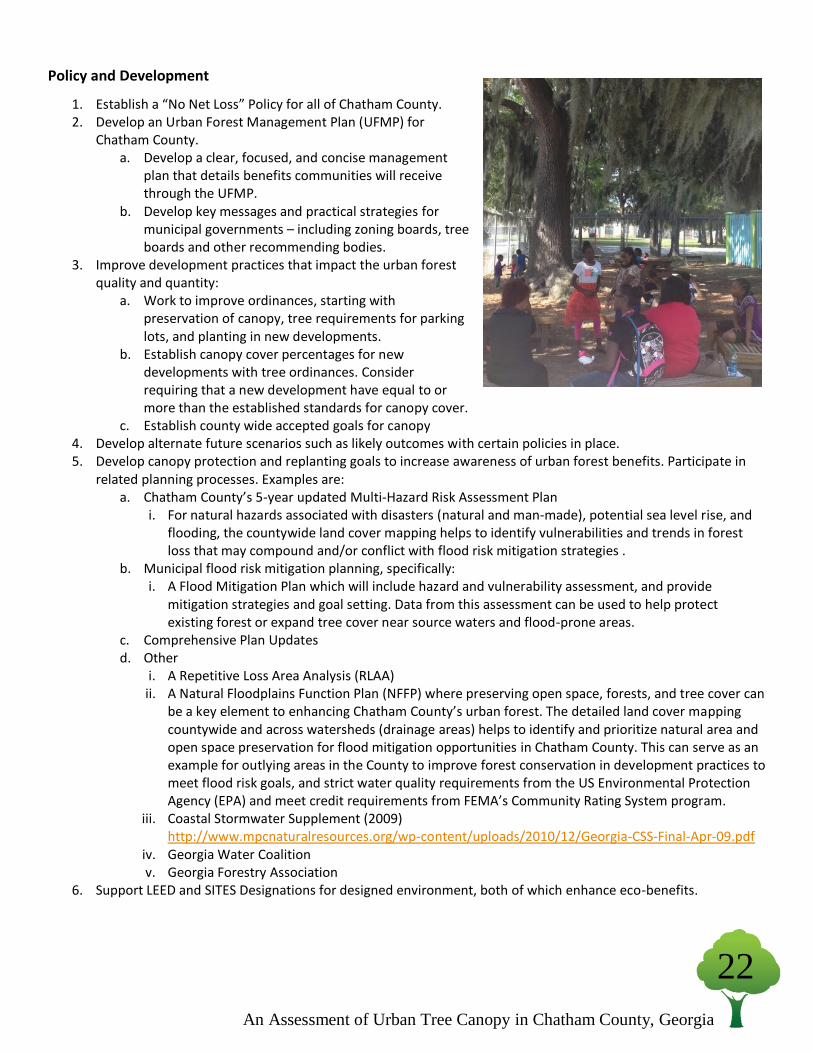
Policy and Development
1. Establish a “No Net Loss” Policy for all of Chatham County. 2. Develop an Urban Forest Management Plan (UFMP) for
Chatham County. a. Develop a clear, focused, and concise management
plan that details benefits communities will receive through the UFMP.
b. Develop key messages and practical strategies for municipal governments – including zoning boards, tree boards and other recommending bodies.
3. Improve development practices that impact the urban forest quality and quantity:
a. Work to improve ordinances, starting with preservation of canopy, tree requirements for parking lots, and planting in new developments.
b. Establish canopy cover percentages for new developments with tree ordinances. Consider requiring that a new development have equal to or more than the established standards for canopy cover.
c. Establish county wide accepted goals for canopy 4. Develop alternate future scenarios such as likely outcomes with certain policies in place. 5. Develop canopy protection and replanting goals to increase awareness of urban forest benefits. Participate in
related planning processes. Examples are: a. Chatham County’s 5-year updated Multi-Hazard Risk Assessment Plan
i. For natural hazards associated with disasters (natural and man-made), potential sea level rise, and flooding, the countywide land cover mapping helps to identify vulnerabilities and trends in forest loss that may compound and/or conflict with flood risk mitigation strategies .
b. Municipal flood risk mitigation planning, specifically: i. A Flood Mitigation Plan which will include hazard and vulnerability assessment, and provide
mitigation strategies and goal setting. Data from this assessment can be used to help protect existing forest or expand tree cover near source waters and flood-prone areas.
c. Comprehensive Plan Updates d. Other
i. A Repetitive Loss Area Analysis (RLAA) ii. A Natural Floodplains Function Plan (NFFP) where preserving open space, forests, and tree cover can
be a key element to enhancing Chatham County’s urban forest. The detailed land cover mapping countywide and across watersheds (drainage areas) helps to identify and prioritize natural area and open space preservation for flood mitigation opportunities in Chatham County. This can serve as an example for outlying areas in the County to improve forest conservation in development practices to meet flood risk goals, and strict water quality requirements from the US Environmental Protection Agency (EPA) and meet credit requirements from FEMA’s Community Rating System program.
iii. Coastal Stormwater Supplement (2009) http://www.mpcnaturalresources.org/wp-content/uploads/2010/12/Georgia-CSS-Final-Apr-09.pdf
iv. Georgia Water Coalition v. Georgia Forestry Association
6. Support LEED and SITES Designations for designed environment, both of which enhance eco-benefits.
23
23
An Assessment of Urban Tree Canopy in Chatham County, Georgia
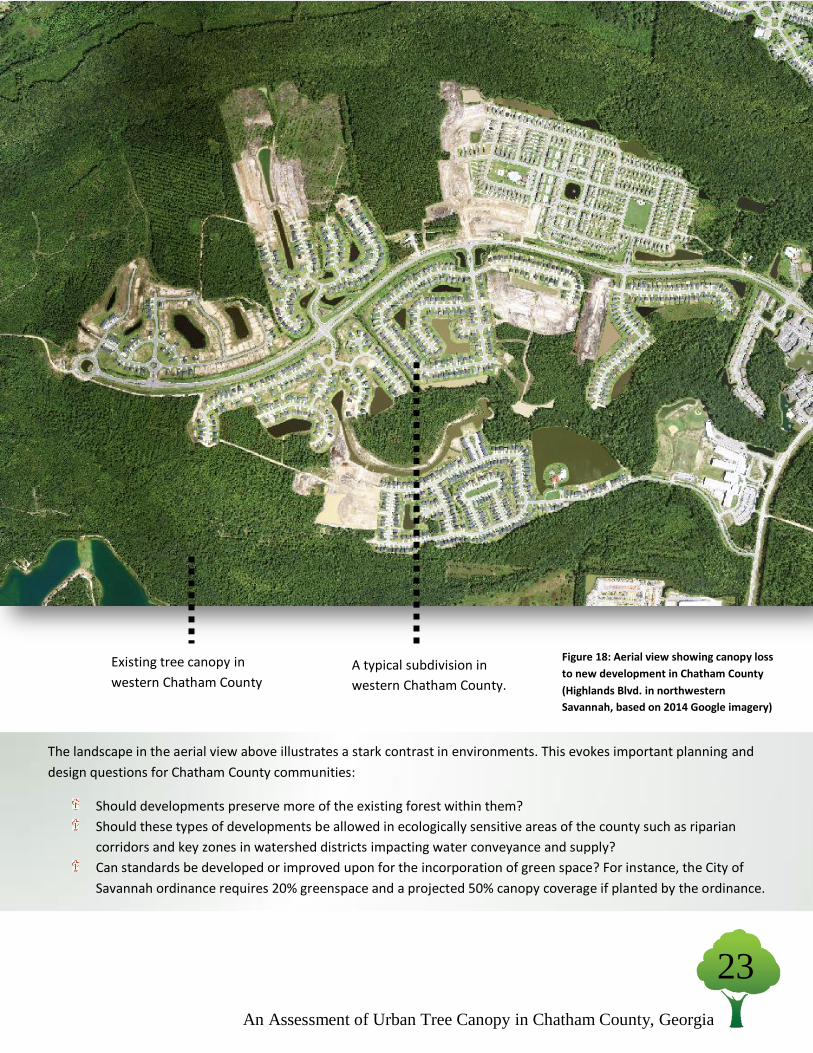
The landscape in the aerial view above illustrates a stark contrast in environments. This evokes important planning and
design questions for Chatham County communities:
Should developments preserve more of the existing forest within them?
Should these types of developments be allowed in ecologically sensitive areas of the county such as riparian
corridors and key zones in watershed districts impacting water conveyance and supply?
Can standards be developed or improved upon for the incorporation of green space? For instance, the City of
Savannah ordinance requires 20% greenspace and a projected 50% canopy coverage if planted by the ordinance.
Figure 18: Aerial view showing canopy loss
to new development in Chatham County
(Highlands Blvd. in northwestern
Savannah, based on 2014 Google imagery)
Existing tree canopy in
western Chatham County A typical subdivision in
western Chatham County.
24
24
An Assessment of Urban Tree Canopy in Chatham County, Georgia
Funding
1. Use this data in preparing supportive information for local budget requests to influence municipal ordinances, tree maintenance, and tree planting positively.
2. Data that are specific by community will be beneficial for grant funding since they show prior investments, priority areas in need, and established mechanisms for tracking successes.
3. Consider solutions that meet multiple objectives, for example: a. A public/private partnership to irrigate, prune or
provide other maintenance of trees in public spaces could create jobs, and if done on bikes with watering devices, promotes physical and mental health.
4. Couple this data with other studies to draw correlations to
diminished economic vitality where communities do not have
a No Net Loss Policy. Use this data to lobby for increased
capital and operating budgets.
Technical
1. Distribute the GIS land cover data to all municipalities, county officials, local agencies, and interest groups so that the most current data can be put to use.
2. Working with SAGIS and municipal GIS staff, use the data from this study to identify priority plantings on school properties, underserved public housing areas, and in corridor/neighborhood revitalization and planning projects.
3. Monitor change in canopy every 5 to 10 years. For future studies: a. Utilize LiDAR data and 1-meter (or better) imagery from aerial or satellite sources. b. Utilize consistent GIS assessment boundaries when calculating canopy cover, for example, as municipal
(political) boundaries change through annexation. c. Water bodies, marshland, and most wetlands are not naturally forested; therefore they impact the
results by changing the total land area in which to calculate percent tree cover at the county and municipal level. In future studies to monitor changes in canopy, ensure that these areas are mapped and utilized consistently or accounted for accordingly.
4. To quantify more localized stormwater and watershed management benefits of the urban forest, utilize i-Tree Hydro or EPA’s Storm Water Management Model (SWMM).
5. Use the financial quantification of tree canopy and compare it to engineered project costs that adjust the land to its new land use from “tree farms” to “people farms”.
6. The assessment provides a top-down approach. Additional bottom-up inventory and assessment methods can ground-truth viable planting areas as well as provide data on species composition, condition/quality, safety, and forest structure to augment findings from this assessment.
25
25
An Assessment of Urban Tree Canopy in Chatham County, Georgia
Canopy & Outreach
1. Establish a strong relationship with public and private elementary schools and educators. Regularly present programs at school events.
2. To expand outreach, develop and share an annual report card with broad stakeholders to continue to engage, inform, and recommend actions about the County’s canopy.
3. With carefully crafted messages and information on canopy cover trends and priority planting areas:
a. Establish a rapport through meet & greet type events and joint volunteer tree plantings in different communities and by working with pertinent municipal staff, council members, and community groups to prioritize local needs and sell the message for greater funding and follow-up care.
b. Concentrate marketing and education efforts on the disinvested areas where the need for trees is greatest. Include all ethnic, age, race, and income groups in natural resource protection and enhancement opportunities.
c. Look at the smaller communities in Chatham County for opportunities and determine ways to get outlying areas to support stronger canopy protection and planting practices and a management plan.
d. Through the process, STF will find local support, help establish community tree boards, and gain support for a countywide Urban Forest Management Plan, meanwhile identifying tree planting sites and gaining funding for trees.
4. To assist in goal setting, use Plan-It Geo’s “Canopy Calculator” spreadsheet tool to see how different types of trees (e.g. palm vs. live oak) impact canopy cover goals.
a. The tool can estimate the number and type of trees needed to increase canopy coverage, help visualize how one citizen planting one tree can make a difference, and be a beneficial tool for a new development ordinance.
5. Use the data to show the past and potential loss of hunting ground or wilderness to form an alliance with hunting, fishing and similar interest groups. The development of more land for commercial and residential units impacts how far recreationists have to go for natural areas and the quality of these areas.
6. Explain the direct impacts that trees and forests have on Chatham County communities through education programs. Provide this information in ways people can understand and relate to, such as shade/cooling, public health, stormwater management, and mitigating flood risk.
7. Use UTC data to identify critically important natural areas and work to preserve such areas with existing tree canopy, or explore options for restoring tree canopy.
COMMUNITREES
Would you like trees planted on your property? CommuniTrees helps groups
plant trees on public sites.
For more information, visit: http://www.savannahtree.com/program
s/communitrees/
26
26
An Assessment of Urban Tree Canopy in Chatham County, Georgia
CONCLUSIONS The Chatham County Urban Tree Canopy Assessment is a planning tool, putting the most reliable data in the hands of
decision makers. It establishes the groundwork for unified community efforts to plant and care for trees in Chatham
County. An ongoing challenge will be to balance new development, limited funding and resources, and the need for tree
maintenance within a shared vision for the community, environment, and economy.
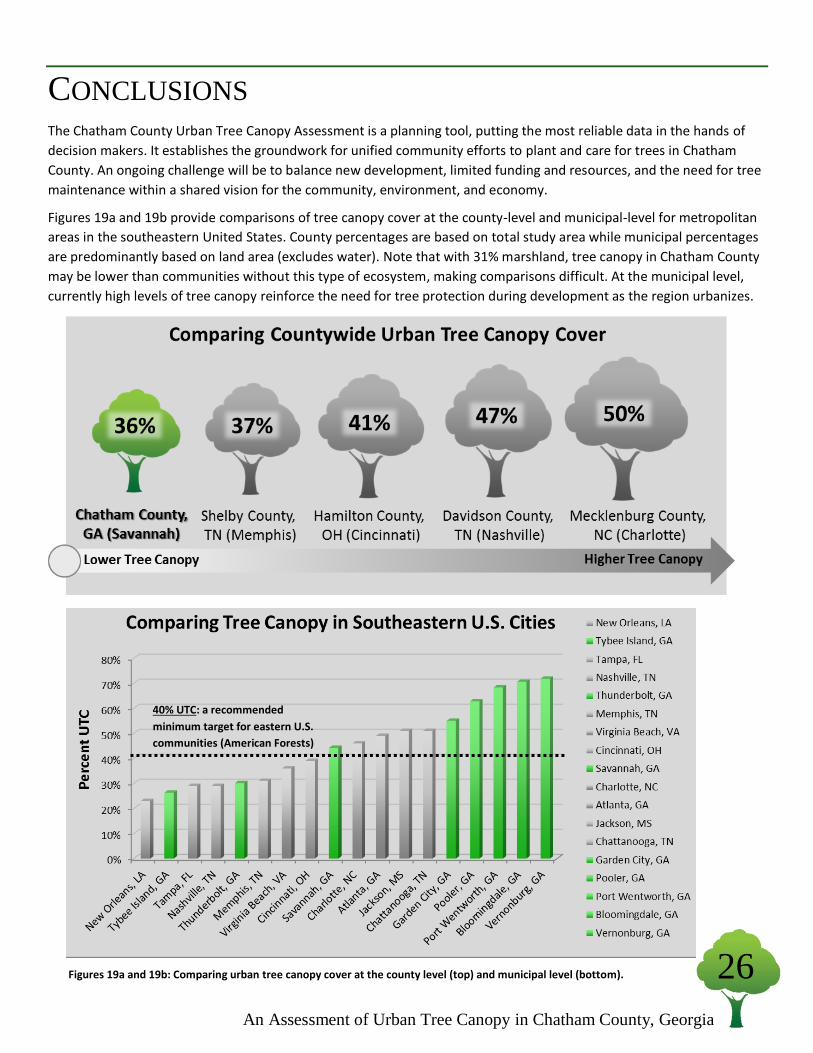
Figures 19a and 19b provide comparisons of tree canopy cover at the county-level and municipal-level for metropolitan
areas in the southeastern United States. County percentages are based on total study area while municipal percentages
are predominantly based on land area (excludes water). Note that with 31% marshland, tree canopy in Chatham County
may be lower than communities without this type of ecosystem, making comparisons difficult. At the municipal level,
currently high levels of tree canopy reinforce the need for tree protection during development as the region urbanizes.
Figures 19a and 19b: Comparing urban tree canopy cover at the county level (top) and municipal level (bottom).
40% UTC: a recommended
minimum target for eastern U.S.
communities (American Forests)

27
27
An Assessment of Urban Tree Canopy in Chatham County, Georgia
APPENDIX
Additional details on the 2014 Chatham County Urban Tree Canopy assessment project are provided including
supporting information on:
A1: Glossary of Terms (pages 28 & 29)
A2: Overview of Urban Forest Ecosystem Services (page 30)
A3: Detailed Methods (Tasks 1-3) and Comprehensive UTC Assessment Results (pages 31-45)
A4: Related Plans/Ordinances and References (pages 46-48)
28
28
An Assessment of Urban Tree Canopy in Chatham County, Georgia
A1: GLOSSARY OF TERMS AND ACRONYMS
Definitions for the following terms are offered in the context of urban forest planning, assessment, management, and benefits analysis and are not meant to be complete or exhaustive in nature.
Air Quality – The quantity of particulates and other pollutants present in a volume of air relative to necessary compounds such as oxygen. Trees improve air quality by absorbing and trapping air pollutants such as particulate matter, ozone, sulfur dioxide, carbon monoxide, and CO2 and by decreasing volatility by lowering air temperatures.
Carbon Sequestration – The rate that carbon is removed from the atmosphere by trees. Carbon is considered a very important element because of its recognized influence on climate regulation as a greenhouse emitter.
Carbon Storage – Cumulative amount of carbon stored in the stems, branches and roots of trees over time.
Ecosystem Services – Direct and indirect benefits provided by natural systems. The most common ecosystem services associated with urban trees and forests are air quality improvement, carbon sequestration, energy conservation, and storm water mitigation.
Energy Conservation – The amount of energy saved due to the presence of trees. Summer cooling through shade, and
by wind blocking in the winter reduces total energy used.
FEMA – The Federal Emergency Management Agency is an agency of the United States Department of Homeland Security, whose primary purpose is to coordinate the response to a disaster that has occurred in the United States and that overwhelms the resources of local and state authorities.
Flood Risk Mitigation Plan – A planning process and document to reduce or eliminate risk of flood damage to buildings
that are insured under the National Flood Insurance Program (NFIP) and proactively prepare for reducing flood losses.
Geographic Information Systems (GIS) – Computer mapping systems used to understand how resources are distributed across the Earth’s surface.
Hazard Mitigation Planning – Planning and guidance (provided by FEMA and contractors) on actions taken to reduce and protect life and property from natural disasters.
Impervious Surfaces – Impermeable manmade areas such as roads, buildings and parking lots. These areas restrict
stormwater infiltration and contribute to runoff and flooding, and increase the urban heat island effect.
i-Tree Canopy – As part of the i-Tree suite developed by the USDA Forest Service, this tool estimates tree cover and tree benefits for a given area with a random sampling process that lets you easily classify ground cover types.
i-Tree Eco – As part of the i-Tree suite developed by the USDA Forest Service, this tool is a software application designed to use field data from complete inventories or randomly located plots throughout a community along with local hourly air pollution and meteorological data to quantify urban forest structure, environmental effects, and value to communities.

29
29
An Assessment of Urban Tree Canopy in Chatham County, Georgia
LEED – Leadership in Energy and Environmental Design is a set of rating systems for the design, construction, operation, and maintenance of green buildings, homes and neighborhoods.
PM 10 & PM 2.5 – Particulate matter, or particle pollution, is a mixture of solid particles and liquid droplets found in the air. PM10 refers to particulate matter greater than 2.5 microns and less than 10 microns in size. PM2.5 refers to particulate matter less than 2.5 microns in size.
PPA Total – Total Possible Planting Area is comprised of non-tree canopy vegetation, such as grass and open space, and impervious surfaces where tree planting is biophysically possible.
Short Tons – The short ton is a unit of mass equal to 2,000 pounds (907.18474 kg), that is most commonly used in the
United States and known simply as the ton. Elsewhere, a short ton is usually known simply as a "ton", without distinguishing it from the tonne (1,000 kilograms or 2,204.62262 pounds, known as the "metric ton").
Storm water Runoff Mitigation and Water Quality – Important ecosystem services related to precipitation events, hydrologic cycles, and urban forests. Trees reduce storm water runoff and improve water quality through rainfall interception, increased soil permeability and infiltration, and erosion control.
SITES – The Sustainable Sites Initiative™ (SITES™) is an interdisciplinary effort to transform land development and
management practices towards regenerative outcomes. The SITES program has focused on developing a comprehensive, voluntary rating system for sustainable landscapes. Source: http://www.sustainablesites.org/.
Urban Heat Island Effect – refers to developed areas that are hotter than surrounding rural areas due to the abundance of man-made materials which absorb the sun’s energy much more than trees or other plants, and in turn warm the air around them (Roberts, T. et al., 2010).
Urban Tree Canopy (UTC) – defined as the "layer of leaves, branches and stems that cover the ground" (Raciti
et al., 2006) when viewed from above; the metric used to quantify the extent, function, and value of Chatham County's urban forest.
Urban Tree Canopy Assessment – a top-down GIS analysis of tree canopy cover, impervious surfaces (developed
areas), and other land cover types quantifying existing canopy cover and areas where new trees can be planted. UTC
data, maps, tools, and reporting provides a green infrastructure baseline for environmental planning programs, policy-
making, city forestry budgeting and maintenance, and education/outreach/awareness. A UTC assessment provides maps
and information to guide planning and development decisions from a citywide or landscape-scale to the neighborhood
or even individual parcel (property) scale.
30
30
An Assessment of Urban Tree Canopy in Chatham County, Georgia
A2: OVERVIEW OF URBAN FOREST ECOSYSTEM BENEFITS
Urban forests are an integral part of the character of Chatham County for residents, businesses, tourists, and policy
makers. The functions and benefits of trees are referred to as “ecosystem services” and describe the ways that urban
forests impact our lives and the environment. Trees are the ultimate multitasker, providing many “co-benefits”. For
example, trees and forests assist in ground water aquifer recharge and filtering pollutants from the air and water,
improving human health and wildlife habitat, while at the same time storing carbon and sequestering pollutants.
The benefits below justify the many reasons to promote, establish, manage, and maintain a robust, “working” urban
forest in Chatham County.
SOCIAL
Test Scores:
Trees and the natural settings they
provide have been shown to boost
academic performance at schools.
Healing and Stress:
Trees help reduce recovery times
from surgery or illness, and studies
have shown that views of greenspace
and larger areas of greenspace in our
places of work and play reduce stress.
Crime and Domestic Violence:
Urban forests help build stronger
communities. Trees provide settings
in which relationships grow stronger
and violence is reduced.
Traffic Safety:
Studies have shown drivers slow
down on streets that have trees.
Street geometry plays a large
factor in speed but so do trees.
ENVIRONMENTAL
Public Health:
Trees help clean our air and water.
Trees help reduce asthma rates by
cooling and purifying the air. They
also encourage exercise along
walking corridors, parks, and trails,
and reduce UV-B exposure by up to
50%.
Storm water Management: Transpiration and interception of rainfall increases soil infiltration which increases water quality and reduces storm water flow. Tree roots hold soil together along stream banks and steep slopes.
Increased Wildlife Habitat: Trees increase biodiversity in urban
areas and provide a cleaner habitat
to local animal species. Forests filter
non-point source pollution and
provide for a cleaner marine habitat.
ECONOMIC
Property Value:
Healthy trees can increase property
value of residential homes by as
much as 10%.
Energy Conservation:
Trees lower energy demand through
summer shade and winter wind
block, reducing energy bills and
saving money. In turn, this also
offsets carbon emissions at power
plants.
Storm water Regulation:
Trees and forests reduce the need
for (or size of) costly infrastructure
facilities.
Tourism:
More people visit places with a
healthy urban forest and studies
have shown that retail sales are
consistently higher with comfortable
landscape settings.
Worker Productivity:
Studies show that people who work
in offices with trees and other green
spaces have reduced stress and have
fewer sick days.

31
31
An Assessment of Urban Tree Canopy in Chatham County, Georgia
A3: DETAILED METHODS AND COMPREHENSIVE UTC ASSESSMENT RESULTS
Task 1: A Spatial Canopy Cover Trends Analysis
The main objective of Task 1 was to tie-in previous studies in Chatham County with the 2014 UTC assessment and to
confirm trends. This objective was accomplished by (1a) conducting an historical trends analysis using existing 30-meter
land cover data for the county and (1b) reviewing the positives and negatives of two previous canopy study reports.
Spatial Canopy Trend Analysis (Task 1a)
Land Use / Land Cover (LULC) changes were assessed focusing on canopy cover and impervious / developed area from
1996, 2006, and 2010 using 30-meter, LANDSAT satellite imagery-derived land cover data from the National Oceanic and
Atmospheric Administration’s (NOAA) Coastal Change Analysis Program (C-CAP). 25 original land cover classes were
simplified to four (4) classes for evaluation; (1) Tree Canopy, (2) Developed Areas, (3) Water, and (4) Other (all other
land cover classes). The classifications show pixels based on how they have changed between image acquisition dates,
for example, how many pixels changed from tree canopy to development for each time period.
Change was derived by comparing the “from” and “to” land cover classes across the county and broken out for each
municipality for each time period. Key findings from this task not highlighted in the main body of this report include:
Between 1996 and 2010, Chatham County
lost a total of 23,112 acres of forest, equating
to an annual rate of 1,651 acres of tree
canopy loss.
Savannah and Port Wentworth show the
greatest loss, at 6,428 acres and 5,054 acres
respectively.
The rate of loss increased from 1,308 acres
per year between 1996 and 2006 (13,084
acres) to 2,507 acres per year between 2006
and 2010 (10,028 acres).
Review of Prior Canopy Studies (Task 1b)
This review describes, compares, and discusses two
previous tree canopy cover studies (Watson, 1993 and Kramer, 2001) commissioned by STF. This provides a critique of
the usability of each study’s results, how well each study builds upon previous studies, and compares each study to the
2014, 1-meter UTC assessment data inputs and methods.
Watson (1993) used the quality data and best analysis methods available at the time to produce the first report of
Chatham County’s canopy. Remote sensing analysis methods used were simple yet thorough, minimizing possible errors
in the analysis results. Interpretation of direct forest loss is difficult (and acknowledged by the author) since each
individual analysis unit (60x60 meter pixel) is larger than individual trees. Caution should be used when making
assumptions about causality from the land use portion of the analysis. The validity of the land use analysis results is
Figure 20: Task 1 percent tree canopy trends from 1996 to 2010 in
Chatham County by municipality.*
* Tree canopy percentages in Figure 20 are based on Task 1 coarse resolution satellite imagery and will not match percent tree
canopy values by municipality for Task 3 (UTC) which utilized 1-meter imagery and provided better accuracy.
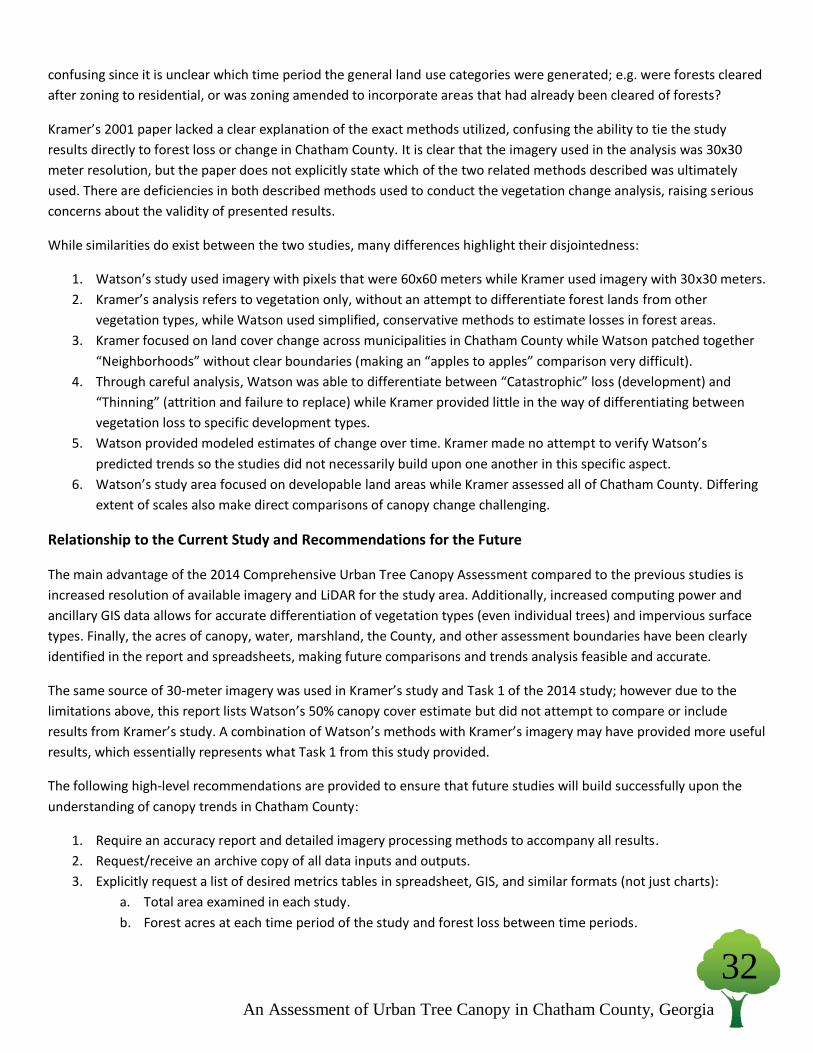
32
32
An Assessment of Urban Tree Canopy in Chatham County, Georgia
confusing since it is unclear which time period the general land use categories were generated; e.g. were forests cleared
after zoning to residential, or was zoning amended to incorporate areas that had already been cleared of forests?
Kramer’s 2001 paper lacked a clear explanation of the exact methods utilized, confusing the ability to tie the study
results directly to forest loss or change in Chatham County. It is clear that the imagery used in the analysis was 30x30
meter resolution, but the paper does not explicitly state which of the two related methods described was ultimately
used. There are deficiencies in both described methods used to conduct the vegetation change analysis, raising serious
concerns about the validity of presented results.
While similarities do exist between the two studies, many differences highlight their disjointedness:
1. Watson’s study used imagery with pixels that were 60x60 meters while Kramer used imagery with 30x30 meters.
2. Kramer’s analysis refers to vegetation only, without an attempt to differentiate forest lands from other
vegetation types, while Watson used simplified, conservative methods to estimate losses in forest areas.
3. Kramer focused on land cover change across municipalities in Chatham County while Watson patched together
“Neighborhoods” without clear boundaries (making an “apples to apples” comparison very difficult).
4. Through careful analysis, Watson was able to differentiate between “Catastrophic” loss (development) and
“Thinning” (attrition and failure to replace) while Kramer provided little in the way of differentiating between
vegetation loss to specific development types.
5. Watson provided modeled estimates of change over time. Kramer made no attempt to verify Watson’s
predicted trends so the studies did not necessarily build upon one another in this specific aspect.
6. Watson’s study area focused on developable land areas while Kramer assessed all of Chatham County. Differing
extent of scales also make direct comparisons of canopy change challenging.
Relationship to the Current Study and Recommendations for the Future
The main advantage of the 2014 Comprehensive Urban Tree Canopy Assessment compared to the previous studies is
increased resolution of available imagery and LiDAR for the study area. Additionally, increased computing power and
ancillary GIS data allows for accurate differentiation of vegetation types (even individual trees) and impervious surface
types. Finally, the acres of canopy, water, marshland, the County, and other assessment boundaries have been clearly
identified in the report and spreadsheets, making future comparisons and trends analysis feasible and accurate.
The same source of 30-meter imagery was used in Kramer’s study and Task 1 of the 2014 study; however due to the
limitations above, this report lists Watson’s 50% canopy cover estimate but did not attempt to compare or include
results from Kramer’s study. A combination of Watson’s methods with Kramer’s imagery may have provided more useful
results, which essentially represents what Task 1 from this study provided.
The following high-level recommendations are provided to ensure that future studies will build successfully upon the
understanding of canopy trends in Chatham County:
1. Require an accuracy report and detailed imagery processing methods to accompany all results.
2. Request/receive an archive copy of all data inputs and outputs.
3. Explicitly request a list of desired metrics tables in spreadsheet, GIS, and similar formats (not just charts):
a. Total area examined in each study.
b. Forest acres at each time period of the study and forest loss between time periods.
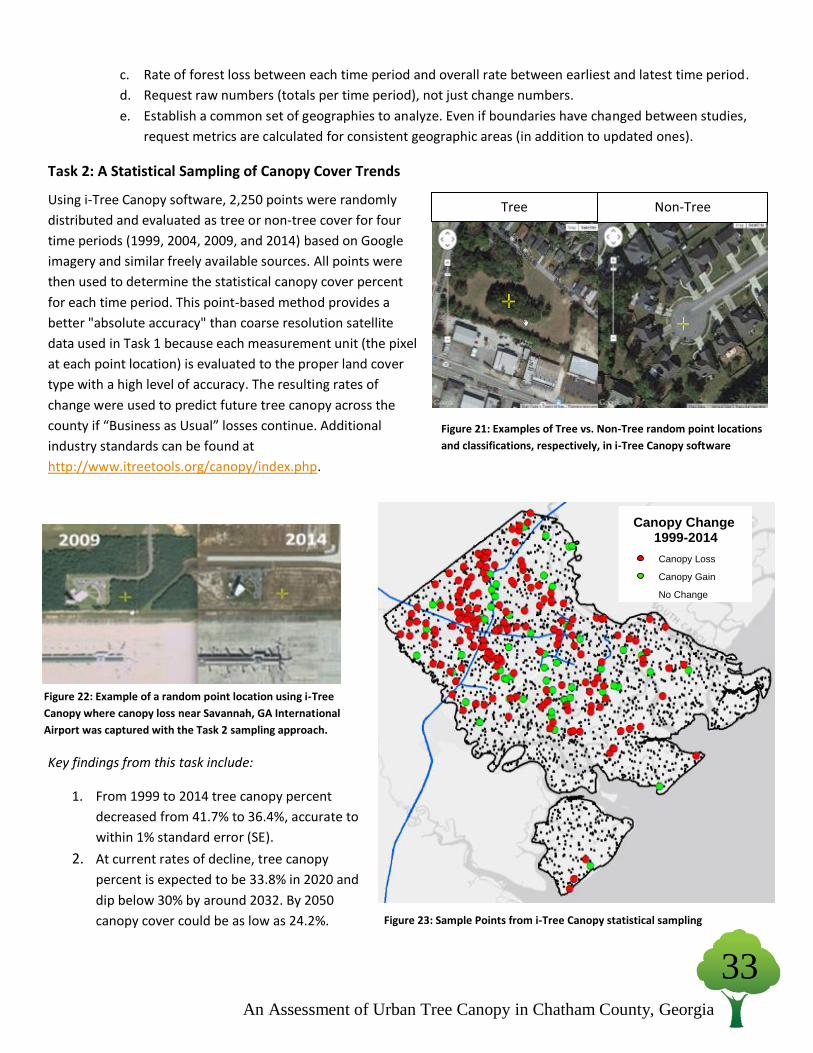
33
33
An Assessment of Urban Tree Canopy in Chatham County, Georgia
c. Rate of forest loss between each time period and overall rate between earliest and latest time period.
d. Request raw numbers (totals per time period), not just change numbers.
e. Establish a common set of geographies to analyze. Even if boundaries have changed between studies,
request metrics are calculated for consistent geographic areas (in addition to updated ones).
Task 2: A Statistical Sampling of Canopy Cover Trends
Using i-Tree Canopy software, 2,250 points were randomly
distributed and evaluated as tree or non-tree cover for four
time periods (1999, 2004, 2009, and 2014) based on Google
imagery and similar freely available sources. All points were
then used to determine the statistical canopy cover percent
for each time period. This point-based method provides a
better "absolute accuracy" than coarse resolution satellite
data used in Task 1 because each measurement unit (the pixel
at each point location) is evaluated to the proper land cover
type with a high level of accuracy. The resulting rates of
change were used to predict future tree canopy across the
county if “Business as Usual” losses continue. Additional
industry standards can be found at
http://www.itreetools.org/canopy/index.php.
Key findings from this task include:
1. From 1999 to 2014 tree canopy percent
decreased from 41.7% to 36.4%, accurate to
within 1% standard error (SE).
2. At current rates of decline, tree canopy
percent is expected to be 33.8% in 2020 and
dip below 30% by around 2032. By 2050
canopy cover could be as low as 24.2%.
Tree Non-Tree
Figure 23: Sample Points from i-Tree Canopy statistical sampling
Canopy Change 1999-2014
Canopy Loss
Canopy Gain
No Change
Municipalities
Interstate Highways
Figure 21: Examples of Tree vs. Non-Tree random point locations
and classifications, respectively, in i-Tree Canopy software
Figure 22: Example of a random point location using i-Tree
Canopy where canopy loss near Savannah, GA International
Airport was captured with the Task 2 sampling approach.
Canopy Change 1999-2014
Canopy Loss
Canopy Gain
No Change
Municipalities
Interstate Highways
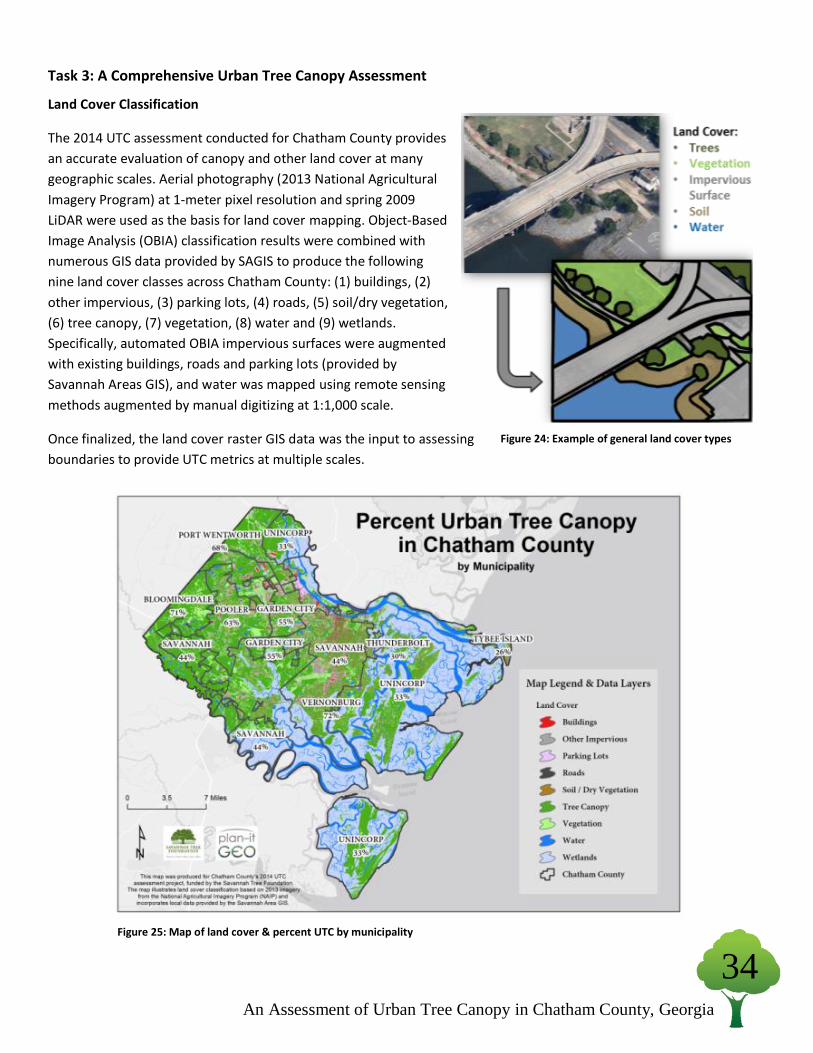
34
34
An Assessment of Urban Tree Canopy in Chatham County, Georgia
Task 3: A Comprehensive Urban Tree Canopy Assessment
Land Cover Classification
The 2014 UTC assessment conducted for Chatham County provides
an accurate evaluation of canopy and other land cover at many
geographic scales. Aerial photography (2013 National Agricultural
Imagery Program) at 1-meter pixel resolution and spring 2009
LiDAR were used as the basis for land cover mapping. Object-Based
Image Analysis (OBIA) classification results were combined with
numerous GIS data provided by SAGIS to produce the following
nine land cover classes across Chatham County: (1) buildings, (2)
other impervious, (3) parking lots, (4) roads, (5) soil/dry vegetation,
(6) tree canopy, (7) vegetation, (8) water and (9) wetlands.
Specifically, automated OBIA impervious surfaces were augmented
with existing buildings, roads and parking lots (provided by
Savannah Areas GIS), and water was mapped using remote sensing
methods augmented by manual digitizing at 1:1,000 scale.
Once finalized, the land cover raster GIS data was the input to assessing
boundaries to provide UTC metrics at multiple scales.
Figure 25: Map of land cover & percent UTC by municipality
Figure 24: Example of general land cover types

35
35
An Assessment of Urban Tree Canopy in Chatham County, Georgia
Land Cover Accuracy
Land cover accuracy assessment was performed in two geographic regions, focusing on (1) all areas of Chatham County,
and (2) remaining municipal areas after excluding unincorporated lands.
Accuracy Assessment
Classification accuracy serves two main purposes: First, accuracy assessments provide internal information to GIS
technicians producing the classification about where land cover mapping processes need to be improved and where
they are effective. Second, measures of accuracy provide information about how to use the classification and how well
land cover classes are expected to estimate actual land cover on the ground. Even with high resolution imagery, very
small differences in classification methodology and image quality can have a large impact on overall map area
estimations. The classification accuracy error matrices illustrated in Tables 5 and 6 contain standard error data that
report the high and low values that could be expected for any comparison between the classification data and what was
actually on the ground in 2013.
Step 1: One thousand (1,000) sample points were randomly distributed across the study area and assigned a random
numeric value. Random values ensure sample points are geographically distributed across the entire study area.
Step 2: Sorting from lowest random value to highest, each sample point was referenced using the NAIP imagery and
assigned one of the five land cover classes (“Ref_ID”) mentioned above.
Step 3: If a reference value could not be discerned from the imagery, the point was dropped from the accuracy analysis.
Step 4: An automated script was then used to assign values from the classification (“Eval_ID”).
Step 5: Misclassified points (where reference ID does not equal evaluation ID) and corresponding land cover were
inspected for necessary corrections to the land cover.* These steps were repeated until accuracy targets are met.
* Note that by manually correcting errors in land cover mapping at specific locations associated with accuracy points, bias is introduced to the error
matrix results. This means that matrix results based on a new set of randomly collected accuracy points will result in different accuracies.

36
36
An Assessment of Urban Tree Canopy in Chatham County, Georgia
Table 5: Standard error matrix for land cover classification in Chatham County. Note the value “76” near the top right is discussed on the next
page.
Table 6: Standard error matrix for land cover classification excluding unincorporated areas in Chatham County. An explanation for this second
error matrix is provided on the next page.
Reference Data
Tree Canopy Vegetation ImperviousSoil / Dry
Veg.Water
Total
Reference
PixelsTree Canopy 386 9 0 0 0 395
Vegetation 6 219 2 0 76 303
Impervious 2 10 91 1 3 107
Soil / Dry Veg. 1 2 0 8 0 11
Water 1 3 0 1 170 175
Total 396 243 93 10 249 991
Overall Accuracy = 88%
Producer's Accuracy User's Accuracy
Tree Canopy 97% Tree Canopy 98%
Veg. / Open Space 90% Veg. / Open Space 72%
Impervious 98% Impervious 85%
Bare Ground / Soil 80% Bare Ground / Soil 73%
Water 68% Water 97%
Cla
ssif
icat
ion
Dat
a
Reference Data
Tree CanopyVegetation /
MarshImpervious
Soil / Dry
Veg.
Total
Reference
PixelsTree Canopy 386 9 0 0 395
Vegetation / Marsh 7 468 2 1 478
Impervious 2 13 91 1 107
Soil / Dry Veg. 1 2 0 8 11
Total 396 492 93 10 991
Overall Accuracy = 96%
Producer's Accuracy User's Accuracy
Tree Canopy 97% Tree Canopy 98%
Veg. / Marsh 95% Veg. / Marsh 98%
Impervious 98% Impervious 85%
Bare Ground / Soil 80% Bare Ground / Soil 73%
Cla
ssif
icat
ion
Dat
a

37
37
An Assessment of Urban Tree Canopy in Chatham County, Georgia
Error Matrix Interpretation and Results
Interpretation of results of the standard error matrix indicates land cover mapping represented true on-the-ground
conditions with 88% overall accuracy for all of Chatham County and 96% for municipalities. Table 5 focuses on all of
Chatham County and aggregates water and marshland together while separating this pairing from all other classes.
Table 6 focuses only on incorporated areas of the County where water is not separated from other land cover classes
and marshland is included as a general vegetation type along with grass and open space areas.
The reason two versions were created and that Table 5 has lower overall accuracy is explained almost entirely by the
value of 76 near the top right (under the Reference Data column for Water). This shows that 76 out of 249 points were
manually identified as water by visual interpretation (i.e. reference data in the columns) but these points were classified
as Vegetation (grass / open space) in the remote sensing analysis (classification data in the rows).
The accuracy is higher for municipal areas due only to human interpretation between marsh areas inundated with
varying levels of water vs. other vegetation. In short, a single pixel or area can represent both water and vegetation, and
different manual interpretation of the reference points dictates the final overall accuracy. Therefore, given the primary
purpose of this study was to map tree canopy, classes are aggregated and both tables are provided to demonstrate the
high accuracy (96%) of the primary classifications: tree canopy, impervious surface, vegetation, and soil / dry vegetation.
Additional Explanation and Examples
Statistical relationships between the reference pixels (representing the true conditions on the ground) and the
intersecting classified pixels are used to understand how closely the entire classified map represents the Chatham
County landscape. The error matrix represents the intersection of reference pixels manually identified by a human
observer (columns) and classification category of pixels in the classified image (rows). The white boxes along the
diagonals of the matrix represent agreement between the two. Off-diagonal values represent the number of pixels
manually referenced to the column class that were classified as another category in the classification image.
Overall accuracy is computed by dividing the total number of correct pixels by the total number of pixels reported in the
matrix (for Table 6, municipal areas: 386+468+91+8 = 953 / 991 = 96%), and the matrix can be used to calculate per class
accuracy percent. For example, 386 points were manually identified in the reference map as Tree Canopy, and 396 of
those pixels were classified as Tree Canopy in the classification map. This relationship is called the “Producer’s Accuracy”
and is calculated by dividing the agreement pixel total (diagonal) by the reference pixel total (column total). Therefore,
the Producer’s Accuracy for Tree Canopy is calculated as: (386/396 = .97), meaning that we can expect that ~97% of all
tree canopy in the Chatham County study area were captured in the classification map.
Conversely, the “User’s Accuracy” is calculated by dividing the number of agreement pixels total by the total number of
classified pixels in the row category. For example, 386 classification pixels intersecting reference pixels were classified as
Tree Canopy, but 9 pixels were identified as Vegetation (grass / open space) or Marshland in the reference map.
Therefore, the User’s Accuracy for Tree Canopy is calculated as: (386/395 = 0.98), meaning that pixels classified as Tree
Canopy in the classification were actual grass, open space, or marshland. It is important to recognize that the Producer’s
and User’s accuracy percent values are based on a sample of the true ground cover, represented by the reference pixels
at each sample point.

38
38
An Assessment of Urban Tree Canopy in Chatham County, Georgia
3rd Party Review of Land Cover Classification Map Accuracy
The U.S. Forest Service’s “Urban Forestry South” in Athens, GA, provided a 3rd party review of the land cover mapping
accuracy. An excerpt of the report provided by Dudley Hartel is below. The full 3rd party accuracy assessment report is
available from the Savannah Tree Foundation.
For the municipal boundary area, my overall accuracy assessment was just under 95% with a 98% tree canopy accuracy.
Following the development of my assessment & accuracy matrix I then look at a subsample (actually nearly all) of the
objects classified that differed from the visual classification. I then reevaluated the point to determine where the two
classification processes had diverged in “opinion” and in nearly all cases can “justify” the object classification in the
vendor provided land cover. The biggest area of disagreement arises between water vs. marsh grass/low vegetation
followed by pavement/building edges; I used grass/low vegetation even in natural areas (including commercial
forestland) where my random points landed in woodland openings larger than about 3 meters, however, the most likely
“error” was interpretation of tree shadows in residential and commercial land uses where I used nearby context and
easily identified lawn edges as a guide for my assessment at a particular shaded point.
For the unincorporated areas which had a higher proportion of coastal wetland I had a higher percentage of
marsh/water errors which was reflected in an overall accuracy of 89% but with a 98% tree canopy accuracy.
Overall, however, the land cover classification is a very good representation of the imagery and users of the data and
products produced from it should be able to place a high degree of confidence in the results.

39
39
An Assessment of Urban Tree Canopy in Chatham County, Georgia
Assessment Boundaries
Assessment boundaries provide geographic units linked to where we live, work and play. Land cover and UTC metrics
were assessed for the GIS boundaries seen in Figure 26 below. Note this report does not include results for every scale
shown below. Results were summarized in the complete UTC Assessment spreadsheet delivered to STF as part of this
study. These metrics provide data for resource managers, planners, and outreach groups at different spatial scales that
are applicable to unique ownerships and use cases.
Chatham County Boundary: 1 Feature
County Commissioner / SCCPSS* Districts:
8 Features
Municipalities: 9 Features
Neighborhoods: 198 Features
ROW and Parcels:
115,000
Drainage Basins: 21 Features
Figure 26: Geographic scales assessed through the Chatham County UTC assessment project.
* Savannah / Chatham County Public School System (SCCPSS) Districts

40
40
An Assessment of Urban Tree Canopy in Chatham County, Georgia
Ecosystem Services
First-order estimates of urban forest ecosystem services were calculated using i-Tree and CITYgreen software.
Air quality and carbon storage and sequestration benefits were calculated using i-Tree Canopy software, developed by
David J. Nowak, Jefferey T. Walton, and Eric J. Greenfield with the USDA Forest Service. Using data points in i-Tree
Canopy from Task 2 (see page 33 for Task 2 details), tree benefit estimates were calculated in tons (T) using monetary
value models for each benefit. The parameter “all” was used to represent a rural/urban mix.
Figure 27: i-Tree Canopy tree benefits estimates report (based on 36.4% tree canopy countywide, including all land, water, and marsh)
For a complete methodology of i-Tree Canopy Air Pollutant, Carbon Storage & Sequestration, and Monetary Value Model
Descriptions, refer to: http://www.itreetools.org/canopy/resources/iTree_Canopy_Methodology.pdf
Stormwater runoff mitigation benefits were calculated using CITYgreen, a GIS-based software developed by American
Forests using research from the U.S. Forest Service and Natural Resources Conservation Service (NRCS). This software
uses the NRCS TR55 model to estimate the additional stormwater runoff without tree canopy. This is sometimes
referred to as a land cover replacement model.
The model is based on soils, the average 2-year precipitation event, slope, and runoff coefficients known as curve
numbers (CN). A higher CN results in higher runoff. The change between total stormwater quantity (volume) from the
modeled storm event for existing tree canopy conditions vs. the replacement land cover type (typically a higher CN) is
used to place a value on the existing forested land cover. Two of the parameters that were used are described below.
Construction cost per cubic foot (cu. ft.): $3/cu. ft. was used as a conservative average for stormwater facility
construction cost to manage the additional runoff increase mitigated by existing trees.
Replacement Land Cover Type: when tree canopy is “replaced” in the CITYgreen model, the replacement land
cover chosen was Open Space - Grass/Scattered Trees: Grass cover 50% - 75%. This provides a more
conservative estimate than replacing the tree canopy with commercial or residential development which has a
much higher curve number (CN).
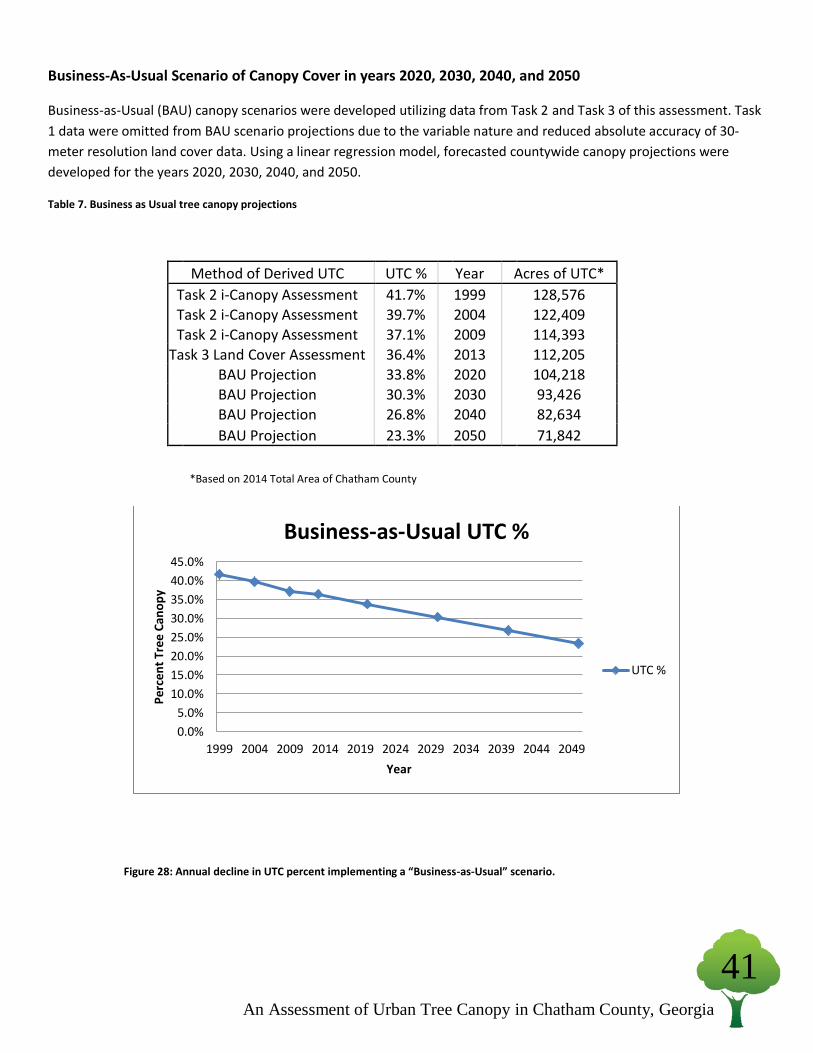
41
41
An Assessment of Urban Tree Canopy in Chatham County, Georgia
Business-As-Usual Scenario of Canopy Cover in years 2020, 2030, 2040, and 2050
Business-as-Usual (BAU) canopy scenarios were developed utilizing data from Task 2 and Task 3 of this assessment. Task
1 data were omitted from BAU scenario projections due to the variable nature and reduced absolute accuracy of 30-
meter resolution land cover data. Using a linear regression model, forecasted countywide canopy projections were
developed for the years 2020, 2030, 2040, and 2050.
Table 7. Business as Usual tree canopy projections
Method of Derived UTC UTC % Year Acres of UTC*
Task 2 i-Canopy Assessment 41.7% 1999 128,576
Task 2 i-Canopy Assessment 39.7% 2004 122,409
Task 2 i-Canopy Assessment 37.1% 2009 114,393
Task 3 Land Cover Assessment 36.4% 2013 112,205
BAU Projection 33.8% 2020 104,218
BAU Projection 30.3% 2030 93,426
BAU Projection 26.8% 2040 82,634
BAU Projection 23.3% 2050 71,842
*Based on 2014 Total Area of Chatham County
0.0%
5.0%
10.0%
15.0%
20.0%
25.0%
30.0%
35.0%
40.0%
45.0%
1999 2004 2009 2014 2019 2024 2029 2034 2039 2044 2049
Per
cen
t Tr
ee C
ano
py
Year
Business-as-Usual UTC %
UTC %
Figure 28: Annual decline in UTC percent implementing a “Business-as-Usual” scenario.
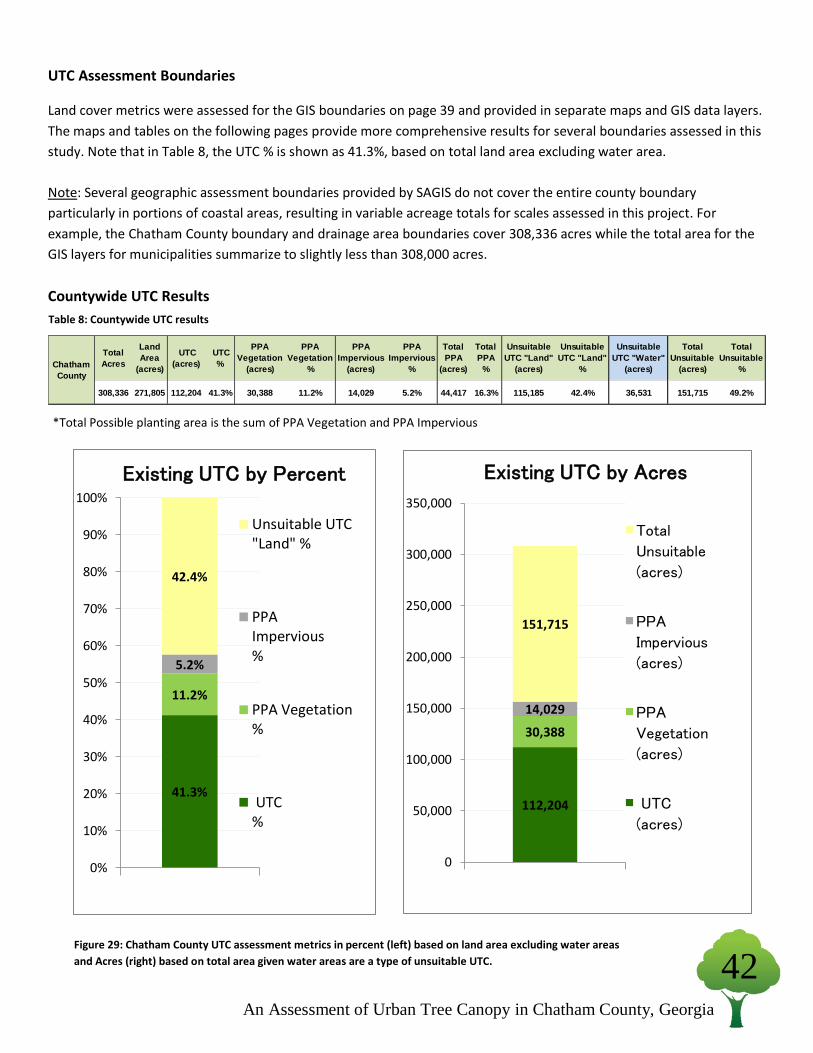
42
42
An Assessment of Urban Tree Canopy in Chatham County, Georgia
UTC Assessment Boundaries
Land cover metrics were assessed for the GIS boundaries on page 39 and provided in separate maps and GIS data layers.
The maps and tables on the following pages provide more comprehensive results for several boundaries assessed in this
study. Note that in Table 8, the UTC % is shown as 41.3%, based on total land area excluding water area.
Note: Several geographic assessment boundaries provided by SAGIS do not cover the entire county boundary
particularly in portions of coastal areas, resulting in variable acreage totals for scales assessed in this project. For
example, the Chatham County boundary and drainage area boundaries cover 308,336 acres while the total area for the
GIS layers for municipalities summarize to slightly less than 308,000 acres.
Countywide UTC Results
Table 8: Countywide UTC results
Figure 29: Chatham County UTC assessment metrics in percent (left) based on land area excluding water areas
and Acres (right) based on total area given water areas are a type of unsuitable UTC.
*
*Total Possible planting area is the sum of PPA Vegetation and PPA Impervious
Total
Acres
Land
Area
(acres)
UTC
(acres)
UTC
%
PPA
Vegetation
(acres)
PPA
Vegetation
%
PPA
Impervious
(acres)
PPA
Impervious
%
Total
PPA
(acres)
Total
PPA
%
Unsuitable
UTC "Land"
(acres)
Unsuitable
UTC "Land"
%
Unsuitable
UTC "Water"
(acres)
Total
Unsuitable
(acres)
Total
Unsuitable
%
308,336 271,805 112,204 41.3% 30,388 11.2% 14,029 5.2% 44,417 16.3% 115,185 42.4% 36,531 151,715 49.2%
Chatham
County
41.3%
11.2%
5.2%
42.4%
0%
10%
20%
30%
40%
50%
60%
70%
80%
90%
100%
Existing UTC by Percent
Unsuitable UTC"Land" %
PPAImpervious%
PPA Vegetation%
UTC%
112,204
30,388
14,029
151,715
0
50,000
100,000
150,000
200,000
250,000
300,000
350,000
Existing UTC by Acres
Total
Unsuitable
(acres)
PPA
Impervious
(acres)
PPA
Vegetation
(acres)
UTC
(acres)
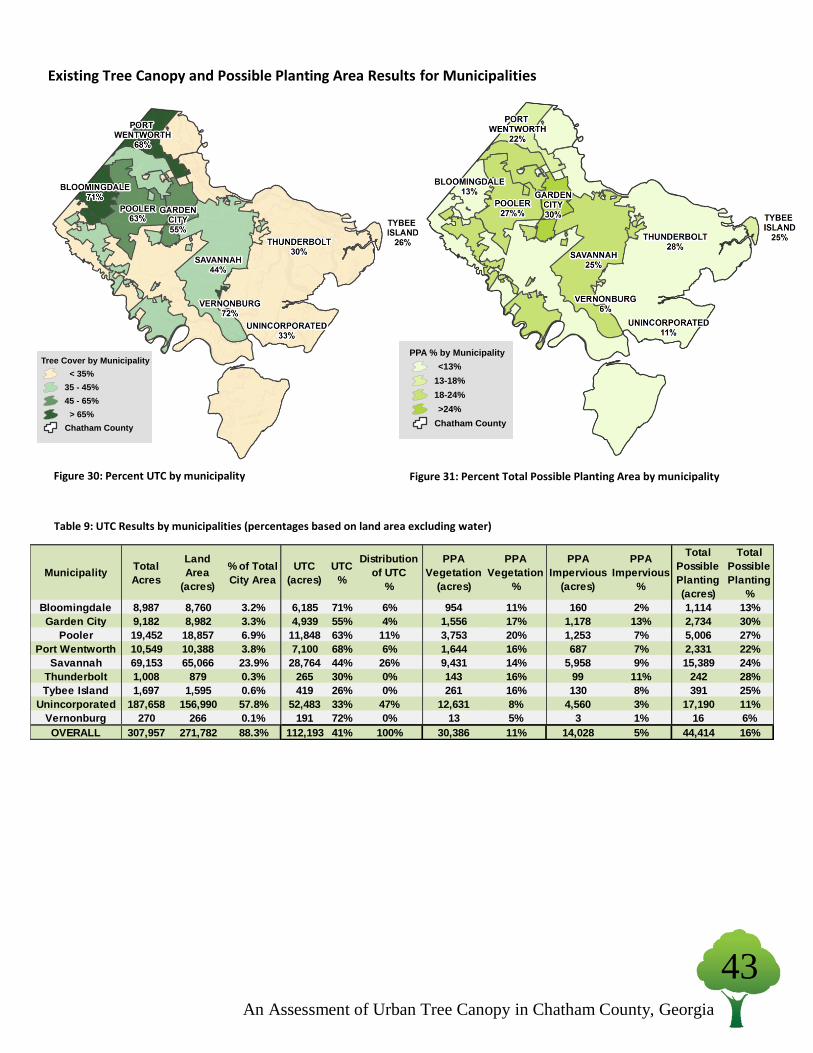
43
43
An Assessment of Urban Tree Canopy in Chatham County, Georgia
Existing Tree Canopy and Possible Planting Area Results for Municipalities
Tree Cover by Municipality
< 35%
35 - 45%
45 - 65%
> 65%
Chatham County
Map Legend & Data Layers
PPA % by Municipality
<13%
13-18%
18-24%
>24%
Chatham County
Map Legend & Data Layers
Figure 30: Percent UTC by municipality Figure 31: Percent Total Possible Planting Area by municipality
Table 9: UTC Results by municipalities (percentages based on land area excluding water)
MunicipalityTotal
Acres
Land
Area
(acres)
% of Total
City Area
UTC
(acres)
UTC
%
Distribution
of UTC
%
PPA
Vegetation
(acres)
PPA
Vegetation
%
PPA
Impervious
(acres)
PPA
Impervious
%
Total
Possible
Planting
(acres)
Total
Possible
Planting
%
Bloomingdale 8,987 8,760 3.2% 6,185 71% 6% 954 11% 160 2% 1,114 13%
Garden City 9,182 8,982 3.3% 4,939 55% 4% 1,556 17% 1,178 13% 2,734 30%
Pooler 19,452 18,857 6.9% 11,848 63% 11% 3,753 20% 1,253 7% 5,006 27%
Port Wentworth 10,549 10,388 3.8% 7,100 68% 6% 1,644 16% 687 7% 2,331 22%
Savannah 69,153 65,066 23.9% 28,764 44% 26% 9,431 14% 5,958 9% 15,389 24%
Thunderbolt 1,008 879 0.3% 265 30% 0% 143 16% 99 11% 242 28%
Tybee Island 1,697 1,595 0.6% 419 26% 0% 261 16% 130 8% 391 25%
Unincorporated 187,658 156,990 57.8% 52,483 33% 47% 12,631 8% 4,560 3% 17,190 11%
Vernonburg 270 266 0.1% 191 72% 0% 13 5% 3 1% 16 6%
OVERALL 307,957 271,782 88.3% 112,193 41% 100% 30,386 11% 14,028 5% 44,414 16%

44
44
An Assessment of Urban Tree Canopy in Chatham County, Georgia
Existing Tree Canopy and Possible Planting Area Results for Drainage Basins
Total PPA ByDrainage Basin
0 - 6%
7 - 18%
19 - 29%
30 - 50%
UTC Percent by Drainage Basin
< 16%
16 - 36%
36 - 52%
> 52%
Chatham County Figure 32: Percent UTC by
HUC 12 drainage basins Figure 33: Percent Total PPA
by HUC 12 drainage basins
Table 10: UTC Results by HUC 12 drainage basins*
Drainage Basin NameTotal
Acres
Land
Area
(acres)
% of Total
County
Area
UTC
(acres)
UTC
%
Distribution
of UTC
%
PPA
Vegetation
(acres)
PPA
Vegetation
%
PPA
Impervious
(acres)
PPA
Impervious
%
Total
Possible
Planting
(acres)
Total
Possible
Planting
%
Atlantic Ocean 2 2 0% 0 0% 0% 0 0% 0 0% 0 0%
Casey Canal-Haneys Creek 8,809 8,695 3% 3,816 44% 3% 1,659 19% 1,209 14% 2,975 34%
Dasher Creek-Savannah River 2,002 1,941 1% 1,658 85% 1% 151 8% 36 2% 186 10%
Hardin Canal-Little Ogeechee River 30,473 29,789 11% 20,873 70% 19% 4,438 15% 877 3% 5,315 18%
Medway River-Frontal Atlantic Ocean 14,136 12,203 4% 3,477 28% 3% 298 2% 4 0% 302 2%
Morgans Bridge-Ogeechee River 8,582 8,035 3% 6,846 85% 6% 792 10% 80 1% 872 11%
Ossabaw Sound-Atlantic Ocean 182 3 0% 0 0% 0% 0 0% 0 0% 0 0%
Ossabaw Sound-Frontal Atlantic
Ocean31,800 27,293 10% 7,542 28% 7% 1,140 4% 57 0% 1,197 4%
Outlet Savannah River 69,559 61,701 23% 28,498 46% 25% 9,070 15% 6,845 11% 17,077 28%
Pipemaker Canal 9,217 8,908 3% 4,619 52% 4% 1,524 17% 1,162 13% 2,985 34%
Saint Catherines Sound-Atlantic
Ocean1 0 0% 0 0% 0% 0 0% 0 0% 0 0%
Salt Creek-Little Ogeechee River 46,838 41,412 15% 14,767 36% 13% 4,759 11% 1,510 4% 6,362 15%
Savannah River-Atlantic Ocean 248 248 0% 38 15% 0% 76 31% 48 19% 124 50%
Sterling Creek-Ogeechee River 9,047 7,064 3% 2,470 35% 2% 292 4% 105 1% 397 6%
Vernon River 17,894 15,139 6% 6,165 41% 5% 2,114 14% 1,150 8% 3,323 22%
Wassaw Sound-Atlantic Ocean 175 54 0% 0 0% 0% 19 36% 0 0% 19 36%
Wassaw Sound-Frontal Atlantic Ocean 37,913 31,643 12% 5,161 16% 5% 1,523 5% 288 1% 1,811 6%
Wilmington River 20,944 17,167 6% 6,193 36% 6% 1,853 11% 630 4% 2,483 14%
Wright River 514 509 0% 81 16% 0% 122 24% 28 6% 150 29%
OVERALL 308,336 271,805 100% 112,204 41% 100% 30,388 11% 14,029 101% 44,417 16%
*19 drainage basins are included in Table 10 above; however two basins were excluded from the maps above in Figures 31 and
32 due to their small size – Atlantic Ocean basin (2 acres) and Saint Catherines Sound Atlantic Ocean basin (1 acre).
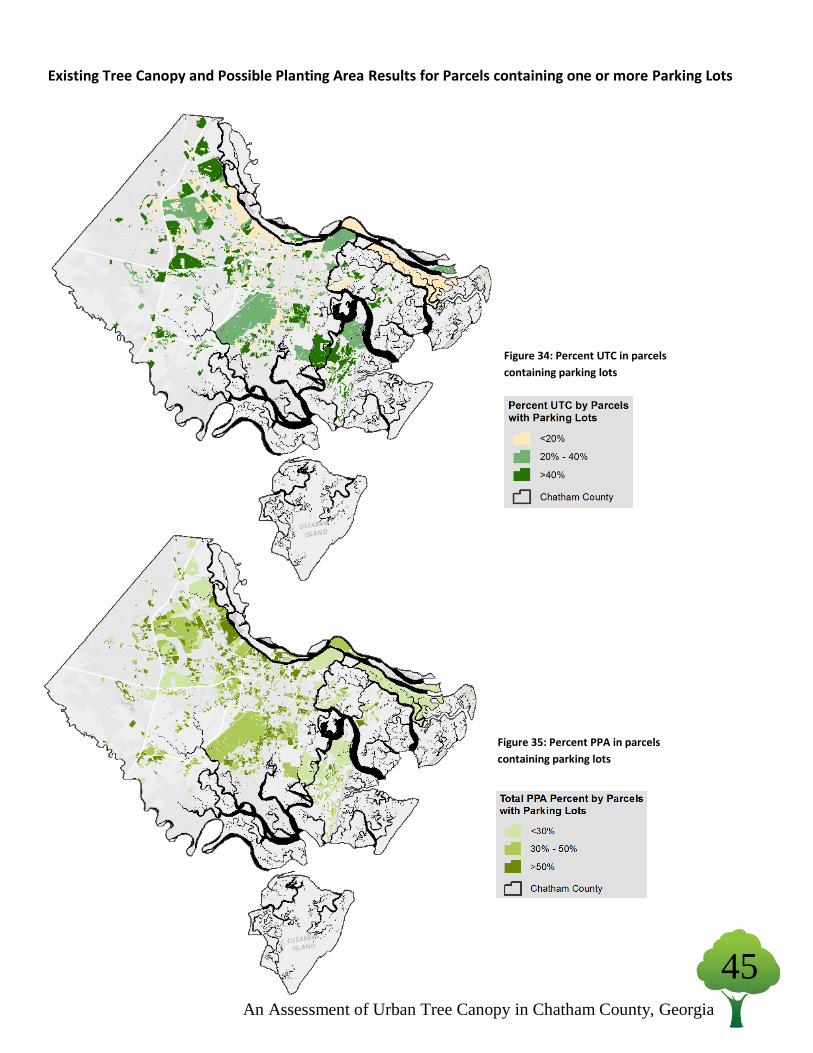
45
45
An Assessment of Urban Tree Canopy in Chatham County, Georgia
Existing Tree Canopy and Possible Planting Area Results for Parcels containing one or more Parking Lots
Figure 34: Percent UTC in parcels
containing parking lots
Figure 35: Percent PPA in parcels
containing parking lots
46
46
An Assessment of Urban Tree Canopy in Chatham County, Georgia
A4: RELATED PLANS/ORDINANCES
MPC Historic and Natural Resources Working Group Recommendations (2012)
1. Create a Resource Database: This would be a multi-year process involving the creation of a website and nomination form to allow the community to nominate resources worthy of protection. Resources might include historic/archaeological sites, neighborhoods, viewsheds, corridors, cultural landscapes, significant trees, natural resources, habitat, etc. It would be necessary to develop some criteria to evaluate and prioritize the resources. It would also entail considerable research and an on-the-ground survey of resources throughout the County. Partnerships could be established with community organizations to assist with creative outreach efforts. This Resource Database would serve as the basis for developing protection mechanisms.
2. Conduct Small/Specific Area Plans: Based on the Resource Database results, conduct small/specific area plans
which would include existing conditions documentation, analysis of opportunities and threats, and protective implementation strategies, likely in the form of overlays. These plans would necessitate a high level of community participation. The Plans would be incorporated into the Comprehensive Plan and Zoning Ordinance when complete. In the short term, Small/Specific Area Plans could be conducted based on neighborhood interest and need.
3. Conduct Corridor Plans: Similar to Small/Specific Area plans, corridor plans would focus on transportation
corridors including adjacent land. Based on the Resource Database results, these plans would include existing conditions documentation, analysis of opportunities and threats, and protective implementation strategies, likely in the form of overlays. These plans would necessitate a high level of community participation. The Plans would be incorporated into the Comprehensive Plan, Zoning Ordinance and the Long Range Transportation Plan when complete. In the short term, Corridor Plans could be conducted based on community interested and need, for example, Victory Drive. This could serve as a model for future plans.
4. Encourage Pursuit of Federal and State Designations: The Resource Database could guide the identification of
eligible properties, districts, and corridors. The responsibility for the designations would primarily lie with non-profits or other private organizations (such as neighborhood associations) with the support of local government agencies.
5. Revise the Development Review Process Part I (short-term): Revising the development review process to include
staff comments regarding the impacts on historic and natural resources could be instituted as an MPC policy change prior to the completion of the database and would be relatively low cost. Staff will also inform the applicant of any identified resources. The comments would not be binding but would instead allow Review Bodies to consider them in their deliberations. The criteria for evaluation would include the eligibility criteria for listing on the National Register of Historic Places (for historic resources) and critical natural areas identified through the State Coastal Georgia Land Conservation Initiative (for natural areas).
6. Revise the Development Review Process Part II (long-term): Revise the development review process and amend
the zoning ordinance to require Review Bodies to consider the impact on resources and require mitigation efforts on projects which have a negative impact. It would be necessary to have the Resource Database complete to effectively implement this.
47
47
An Assessment of Urban Tree Canopy in Chatham County, Georgia
7. Survey and Valuation of Trees for Municipal Projects: On all locally managed municipal projects, encourage City and County to require a complete survey and valuation of trees that may be impacted, both directly and indirectly, prior to finalizing a conceptual design.
8. Revise the County Tree Ordinance: Revise the Chatham County Land Disturbing Activities Ordinance to more
closely resemble the City’s Tree Ordinance. 9. Create an Urban Forestry Master Plan: The City and County should create an Urban Forestry Master Plan which
establishes a vision and sets long and short term goals for accomplishment. This Plan could include a periodic tree and canopy survey and tree management database. The City has an Urban Forestry Master Plan from the 1980s that could serve as a model but needs updating.
10. Pursue Local Historic Designations: Encourage the City and County to designate eligible City and County-owned
properties as historic districts/properties. 11. Easements: Encourage local non-profits to actively pursue conservation easements, specifically targeting
properties identified in the Resource Database. 12. Establish Funding Strategy for the Resource Protection Commission: Develop a long-term funding strategy for
the Chatham County Resource Protection Commission. This Commission is tasked with protecting sites of ecological and historical value through fee-simple purchase, easements, etc. County-wide.
13. Education/Outreach: Encourage local non-profits to conduct education and outreach campaigns promoting
natural and historic resources.
Flood Risk Mitigation Plan (FEMA)
To read full report, visit:
http://engineering.chathamcounty.org/Portals/Engineering/forms/floodzones/flood%20mitigation%20plan.pdf
48
48
An Assessment of Urban Tree Canopy in Chatham County, Georgia
References
Agriculture, U.S. Dept. of. 2013. "WinTR-55 Watershed Hydrology." Natural Resources Conservation Service. Feb 7. Accessed 12 12,
2014. http://www.nrcs.usda.gov/wps/portal/nrcs/detailfull/national/water/?cid=stelprdb1042901.
"Akron, Ohio Master Tree Planting Plan." Akron, OH,2013
Bureau, U.S Census. 2012. American Fact Finder 2012 American Community Survey.
http://factfinder2.census.gov/faces/tableservices/jsf/pages/productview.xhtml?src=CF.
"CITYgreen." Orton Family Foundation, 14 Oct. 2014. Web. http://www.planningtoolexchange.org/tool/citygreen-0.
Clark, N. Matheny, G. Cross, V. Wake. 1997. "A Model of Urban Forest Sustainability." Journal of Arboriculture 23: 17-30.
EPA. 2013. Green & Gray Infrastructure Research. http://www.epa.gov/nrmrl/wswrd/wq/stormwater/green.html#green.
EPA. 2011. "Greenhouse Gass Emissions from a Typical Passenger Vehicle."
Foundation, Arbor Day. n.d. Benefits of Trees. http://www.arborday.org/trees/benefits.cfm.
Group, Savannah Business. 2012. "Childhood Obesity in Chatham County."
Health, Memorial. 2013. Community Health Needs Assessment. Assessment Report, Chatham County: Memorial Health.
Kramer, Elizabeth. 2001. A Study of Tree Cover Change of Chatham County, GA 1992-2000. Savannah Tree Foundation.
Kuo. 2001. "Coping with ADD: The surprising connection to green play settings." Environment and Behavior.
http://www.actrees.org/files/Research/benefits_of_trees.pdf.
Mississauga, City of. 2014. "2014-2016 Parks & Forestry Budget." City of Mississauga.
http://www7.mississauga.ca/documents/budget/2014/G.Parks_and_Forestry.pdf.
Mississauga, City of. 2014. "City of Mississauga Urban Forest Management Plan." Management Plan, Mississauga.
Nowak, David J. n.d. Strategic Tree Planting as an EPA encouraged Pollutant Reduction Strategy: How Urban Trees can Obtain Credit
in State Implementation Plans. Syracuse, NY: Northern Reserach Station.
Orlando, Cynthia. 2010. "Trees, Walkable Communities and Public Health." Forests for Oregon.
—. 2014. Urban Forests Share Links with Healthy Lives. April 11. Accessed September 30, 2014.
http://www.statesmanjournal.com/story/opinion/2014/04/12/urban-forests-share-links-with-healthy-lives/7619817/.
Raciti. 2006. "Environment and Crime in the Inner City: Does Vegetation Reduce Crime?" Environment and Behavior, Volume 33 343-
367. http://www.sustainablesites.org/.
Releaf, Urban. n.d. Benefits of Trees. Accessed 10 1, 2014. http://www.urbanreleaf.org/.
Roberts, T. et al. “Trees and the Urban Heat Island Effect: A Case Study for Providence, Rhode Island.” Brown University Center for
Environmental Studies. Spring 2010. h[p://cameronneat.com/Trees-and-the-Urban-Heat-Island-Effect.
United States. United States Forest Service. Urban Natural Resources Stewardship. 2014. Web. http://www.nrs.fs.fed.us/urban/utc.
Watson, Charles. 1993. A Study of Tree Cover Changes in Chatham County, Georgia, From 1973 to 1992. Savannah Tree Foundation.
Wolf, Kathleen L. "Business district streetscapes, trees, and consumer response." Journal of Forestry 103.8 (2005): 396-400.
Zhu, Pengyu. 2008. "Demand for Urban Froests in U.S Cities." Landscape and Urban Planning 293-300.
Zydler, Nancy. "The Georgia Coast: Waterways & Island." Seaworthy Publications, 2001.
All photos in this report were taken by the Savannah Tree Foundation or Plan-It Geo.
Top Related