


Languages
Pages
Legal


www.spm
.com
.cn
Int. J. Electrochem. Sci., 7 (2012) 8170 - 8184
International Journal of
ELECTROCHEMICAL SCIENCE
www.electrochemsci.org
Preparation and Properties Study of Polyaniline Conductive
Anti-Fouling Coatings
Shuangkou Chen1, Jianfang Zhu
1,* ,Taigang Zhou
2, Bai He
1, Wenzhang Huang
1 , Bochu Wang
2
1 College of Chemistry and Chem-engineering, Chongqing University of Science and Technology,
Chongqing 401331, China; 2 Bioengineering College, Chongqing University, Chongqing 400044, P R China
*E-mail: [email protected]
Received: 25 May 2012 / Accepted: 29 July 2012 / Published: 1 September 2012
An antifouling coating was prepared with the polyaniline(PANi) as conductive filler, chlorine ether
resin as film forming material, and methylsulfonic acid as doping acid as well as other additives. The
influences of PANi content on the coating’s conductivity, physical properties and chemical resistant
performance were studied. The electrochemical behavior of the electrode painted by the coating was
investigated by Tafel analysis and electrochemical impedance spectroscopy measurements. Results
showed conductive properties were significantly influenced by the mass ratio of doping acid/PANi,
and when the mass ration of doped methylsulfonic acid/PANi was 1:1, surface resistance obtained a
lowest value. Conductive properties, chemical substances resistance and anti-corrosion properties of
conductive coatings were all affected by the concentration of PANi added: the concentration of PANi
added in the coating should be controlled in the range from 15% to 25% range, where it had both
perfect conductive property and unique corrosion property. Electrolysis tests showed that an electrode
made by the conductive coating could produce a certain concentration of HOCl, so as to achieve the
anti-fouling purpose.
Keywords: polyaniline; conductive coating; anticorrosion performance
1. INTRODUCTION
In order to prevent the formation of marine organism fouling, for decades there had been an
upsurge of interest in the development of antifouling technology relying on some traditional
antifouling toxins, such as cuprous oxide (Cu2O) or tributyltin (TBT) [1], which were mixed into
antifouling paints and slowly released to hinder the marine organism from attachment. These materials
often have a short service life; besides, they might do harm to the marine environment [2,3,4]. To
avoid the pollution, the development of new non-toxic antifouling methods were pursued [5] and a
www.spm
.com
.cn
Int. J. Electrochem. Sci., Vol. 7, 2012
8171
method called anti-fouling with electrolyzing seawater [6,7,8] was employed to generate HOCl
solution which could prevent the emergence of fouling owing to the effect of HOCl.
How the conductive coating works is shown as followings: first, an insulating film is painted
on the hull plate that might contact with sea water, and then another layer of conductive coating is
coated. Here, the conductive coating serves as an anodic electrode, on which the sea water would be
electrolyzed to generate HOCl if there is current going through it. Ultimately, a hypochloric acid film
covering the conductive coating surface will hinder the marine organisms from adsorbing on the
surface. Therefore, it is of great significance to develop a sustainable antifouling conductive coating.
The traditional conductive coating is often prepared by dispersing the conductive filler such as
graphite, carbon black, metal powder or metal oxides into the organic or inorganic resin, which leads to
a large consumption and an un-uniform distribution of conductive filler, a high cost and a poor quality
of its conductive properties [9,10]. Fortunately, with the development and exploration of the
conductive polymer materials, it is found that organic conductive polymers such as PANi, poly
thiophene and pyrrole have excellent conductive properties, especially, when they are mixed with some
doping acid, their conductivity performance could be as good as metal.
Among these, polyaniline (PANi), a conductive polymer material, has a unique doping
properties and a perfect electrochemical reversibility[11,12,13,14] when it is mixed with doping acid
and some nano-powder (carbon、TiO2 and so on) . Compared with other polymer materials, the low
price, simple synthesis process, unique conductive properties and high thermal stability make PANi
one of the most potential conductive antifouling materials. It has been confirmed that PANi is the most
promising conductive polymers and had become the focus of investigation and exploration [15,16,17].
In this paper, how to prepare the conductive coating is set as the basic thought. A series of
different contents of PANi conductive coatings with additives were prepared, and their properties were
carefully investigated in order to develop a conductive coating with the best conductive properties and
suitable to electrochemical antifouling.
2. EXPERIMENTAL
2.1. Materials
PANi was purchased from Zhengji Company (Jilin, China). Chlorine ether resin MP25 was
purchased from Jiangyin Huitong Fine Chemical Agent Company (Jiangsu, China). Methylsulfonic
acid and dimethylbenzene were purchased from Shanghai Chemical Reagent Company. Nanometer
titanium dioxide was purchased from Iron and Steel Institute of Panzhihua (Sichuan, China). Titanate
coupling agent was purchased from Nanjing Capture Chemical Company (China). Defoamer5300 and
Dispersant were purchased from Deuchem (Shanghai, China). Sodium chloride, Sodium hydroxide and
Sulfuric acid were purchased from Chongqing Beibei Chemical Reagent Plant (China). All solutions in
this study were prepared in distilled water.
www.spm
.com
.cn
Int. J. Electrochem. Sci., Vol. 7, 2012
8172
2.2. Conductive coating preparation
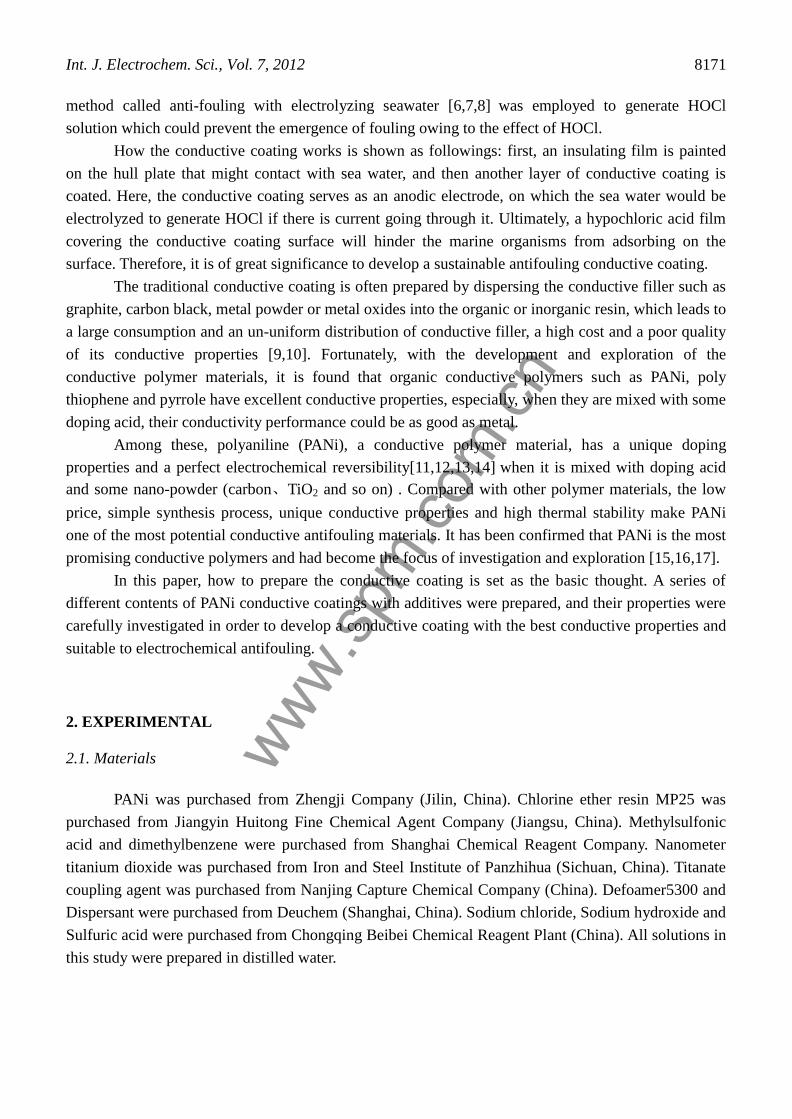
Figure 1 showed the process of preparing the conductive coating. Firstly, put PANi,
methylsulfonic acid, nanometer titanium dioxide as well as some mixture of titanate coupling agent
and dimethylbenzene into a JHS-1 model electronic blender (Hangzhou Meter Motor Factory); then
made the blender work at a constant speed of 1400r/min for 12 hours, and at the same time, mixed the
chlorinated polyether resin and dimethylbenzene to have the chlorinated polyether resin solved
enough; next, mixed the PANi mixture with the chlorinated polyether resin mixture and grinded them
twice with a grinding miller at a low speed with a QMZ-1 Grinder (Tianjin Material Testing Machine
Plant). Then, an ultrasonic process should be done in a SK7200LH Ultrasonic instrument (Shanghai
Kudos) at least for an hour. Finally, another resin needed to be added and a high speed blundering
process (1400r/min) should be carried out for 12 hours. Some solvent were added to adjust the
viscosity and the conductive coating could be obtained.
Figure 1. Process of making coating
2.3. Performance test of the conductive coating
Performance testing of acid, alkali and salt
The steel plates (Bought from China National Center for Quality Supervision & Test of
Coating) used for the acid alkali salt tests have a dimension of 150mm×70mm×0.5mm. Before
painting the conductive coating, the steel plate should be de-greased by a soaking process in a certain
amount of alkaline solution, washed with clean water and roughed via a tiny corrosion process with
www.spm
.com
.cn
Int. J. Electrochem. Sci., Vol. 7, 2012
8173
acid to enhance its adhesion to the coating, then immersed in acetone and ethanol, cleaned with stilled
water and dried with hot air. After that, painted the conductive coating of different PANi amounts
evenly on the steel plate with a wolf hair brush and when the conductive coating was solidified, put it
in an acid solution (5%H2SO4), an alkaline solution(5%NaOH) and a salt solution (3.5%NaCl)
respectively. The measurements could be performed in the three types of solutions.
2.4. Anti-corrosion performance test
Electrodes preparation
The working electrodes used for electrochemical measurements were prepared by A3 steel,
which had poor anti-corrosion properties. The protection behavior of the coating could be investigated
by the use of A3 steel as the electrode.
The working electrodes (4mm×Φ20mm) were prepared by linking a 10cm copper wire to its
bottom surface and embedded in an epoxy resin, just leaving the top surface as the working area. Then
they should be abraded gradually with emery paper 400、600、800、1000# to get a mirror-like
surface, ultrasonically cleaned with acetone and ethanol to remove the organic impurities and dried
with cold and hot air. Finally, painted the working area with the conductive coating and dried it in a
ventilating place for 7 days and the tests could be conducted when it was totally solidified.
Tafel polarization curves measurements
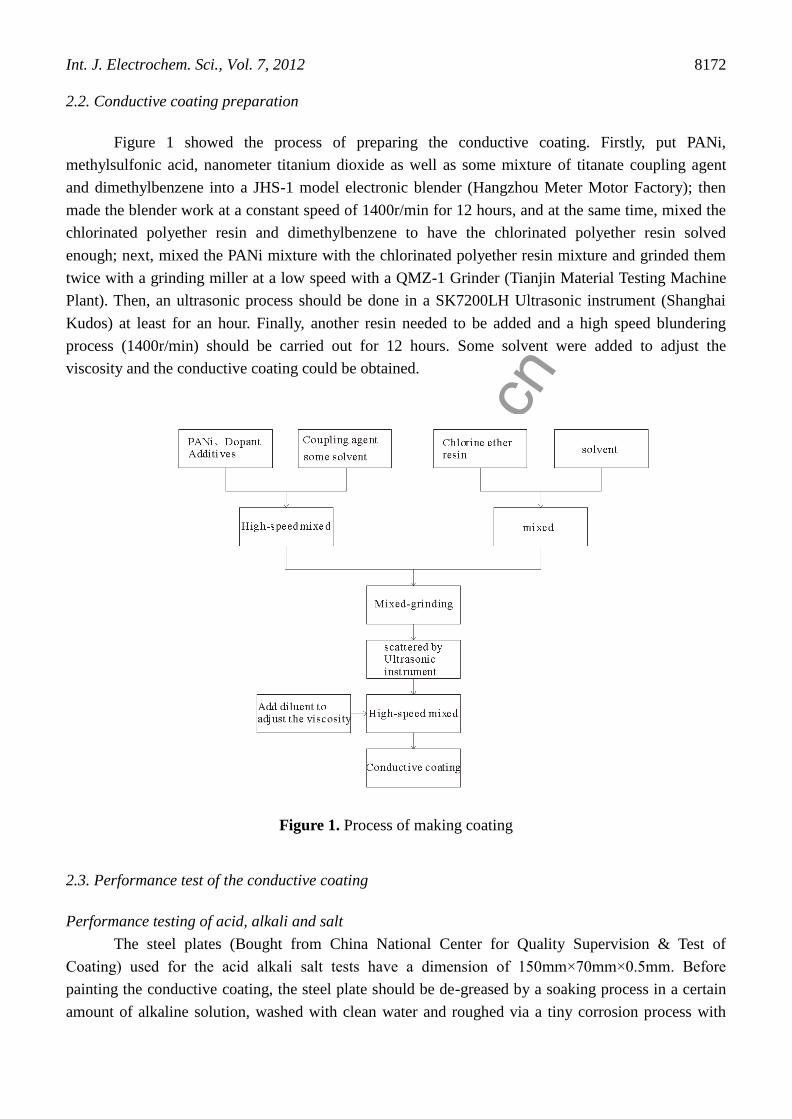
The Tafel polarization cures were measured by a PGSTAT302 Autolab electrochemical
measurements system (Metrohm Autolab), which were used to test the effect of the conductive coating
on the corrosion behavior of the electrodes. The potential scan was started from -250 mV to +250mV
versus the open circuit potential with a scan rate of 1 mV/s. The corrosion rate was determined
according to the anodic current density. During the measurements, a NaCl solution (3.5% w/w) was
used as the corrosion medium, a saturated calomel electrode as the reference electrode and a platinum
plate as the auxiliary electrode. The working electrode was achieved by applying a conductive coating
to the surface of the previous A3 steel. The equipment for polarization curves tests is shown in Figure
2.
Figure 2. The electrochemistry test equipment

www.spm
.com
.cn
Int. J. Electrochem. Sci., Vol. 7, 2012
8174
Electrochemical impedance spectroscopy measurements
Electrochemical impedance spectroscopy tests were performed in the Autolab electrochemical
measurements system in the frequency range of 100 kHz to 10 MHz with an amplitude signal of 5 mV,
which were similar to the polarization curves measurements. It was conducted according to the
following sequence:
i.) Filled 2/3 of the electrolytic cell with the 3.5%NaCl solution, and connected the working
electrode, the calomel electrode and the platinum electrode with the Autolab electrochemical
measurements system and checked the corrosion potential of the working electrode;
ii.) 30 min later, when the corrosion potential reached a stable state, the electrochemical
impedance spectroscopy measurement could be carried out.
2.5. Comprehensive evaluation of the conductive coatings
According to the previous experimental data and the investigation results, the conductive
coatings were prepared by a certain amount of PANi as well as other materials, and their morphologies
were analyzed by XDS-1B inverted microscope (Chongqing Optical Instrument Factory) and Benyuan
CSPM5000 Atomic force microscope(Benyuan Co., China).
Observation of conductive coatings morphologies: firstly, painted each prepared conductive
coating on the glass slide, observed its morphology through the inverted microscope (magnified to 100
times) and then the morphology analysis was conducted in the mode of atomic force microscope with
the apparatus parameters set as followings: scanner:S2037; resolution: 512×512; and scan frequency:
2.0Hz.
3. RESULTS AND DISCUSSION
3.1. The influence of the doping acid amounts on the surface resistance of the conductive coating
-0.2 0.0 0.2 0.4 0.6 0.8 1.0 1.2 1.4 1.6 1.8
0
5
10
15
20
25
Su
rfa
ce
re
sis
tan
ce
(K
)
Acid/PANi (w/w)
B
Figure 3. The relationship between the surface resistance and the weight ratio of methysulfonic
acid/PANi

www.spm
.com
.cn
Int. J. Electrochem. Sci., Vol. 7, 2012
8175
Figure 3 showed the surface resistance of the doped PANi which was achieved by keeping the
PANi amount constant and adjusting the mass ratio of methylsulfonic acid/PANi in the range from 0.0
to 2.0.
It was clear that the surface resistance decreased with the increasing concentration of
methylsulfonic acid, however, when the mol ratio of methylsulfonic acid/PANi reached 1.0, the surface
resistance began to increase. This was ascribed to the fact that at a low methylsulfonic acid
concentration, the doped ratio of the PANi was small and the possibility of forming a conductive
channel was low, which led to a large surface resistance. However, when the doping rate was saturated,
an increase addition of methylsulfonic acid would not be helpful to the increase of the conductivity of
the coating due to the fact that the excess methylsulfonic acid left in the products would be partly
precipitated during the drying process, and the other methylsulfonic acid, residual in the products,
however, had no effect on promote the inductivity of the coating due to its insulative properties and
conversely, it blocked the conductive channel formed by the large PANi molecules which finally
caused an increase in the surface resistance. Therefore, the mol ratio (methylsulfonic acid/PANi) was
important for the conductive coating preparation. In order to obtain a conductive coating with low
surface resistance, it was necessary to choose a proper mol ratio of methylsulfonic acid/PANi.
In addition, Figure 3 showed that when the mass ratio of methylsulfonic acid/PANi was 1.0, the
best doping property was obtained and the coating applied in the latter research would all be prepared
with such a ratio of methylsulfonic acid/PANi.
(a)appropriate doping (b)excessive doping (c)more excessive doping
Figure 4. The comparison schematic diagram of adding excess doping acid
3.2. The influence of PANi concentration on the conductive coating properties
With the mass ratio of methylsulfonic acid/PANi set as 1:1, six types of conductive coatings
were prepared by adjusting the PANi concentration (10%, 15%, 20%, 25%, 30%, and 40% by weight)
added in the film. The surface resistances of the six conductive coatings were shown in Figure 5.
In Figure 5, the surface resistance decreased linearly with the increasing PANi concentration
when its concentration (by weight) was ranged from 10% to 20%. But with the increase of PANi
content, the surface resistance decreasing tendency became smaller and gradually reached a stable

www.spm
.com
.cn
Int. J. Electrochem. Sci., Vol. 7, 2012
8176
value. This is due to the fact that at a low PANi concentration, the distance between the conductive
particles is large, and a few PANi molecules could link with each other to form a chain-like conductive
channel and the surface resistance is largely decreased. When the concentration reached 20%, the
conductive channel has already been formed, and adding more PANi will not lead to an increase in the
formation of the conductive channels, thus, the decreasing tendency of the surface resistance is
gradually reduced and it finally reaches a stable value.
5 10 15 20 25 30 35 40 45
0
10
20
30
40
Su
rfa
ce
re
sis
tan
ce
(K
Ω)
PANi ( w/w %)
Figure 5. Influence of PANi content on surface resistance
3.3. The influence of PANi concentration on the chemical resistant of the conductive coating
The metals with a conductive coating is usually on the passive state due to the fact that a
condense oxide layer is formed on the metal/PANi interface to protect the metal from corrosion. With a
unique scratch and pitting corrosion resistance properties, PANi could be widely applied as an
advanced anti-corrosion coating in the industry and even in some severe conditions. The oxide layer
called the passive film could protect the underneath iron from further corrosion. It was reported by
related articles[18] that an electric field opposite to the electronic transfer direction is formed between
the metal surface and the PANi surface, which works as a charge transfer barrier layer, hindering the
electrons transferring from the metal to the oxides.
Table 1 listed the experimental data of the conductive coatings with various concentration of
PANi after 48 hours’ immersion in the acid solution, alkaline solution and sea water respectively. The
results indicated that the anti-corrosion properties of the conductive coatings decreased with the
increasing concentration of PANi. When the PANi concentration was lower than 20%, the coating
showed no differences after 48 hours’ immersion and exhibited a perfect chemical resistance property.
Nevertheless, when the PANi concentration was higher than 25%, bubbles appeared in the coating,
which might be a result of a reduction of its compactness owing to the high concentration of PANi. It
was said that an increase of the PANi concentration in the coating would lead to an increase of the
coating surface roughness and a decrease of its compactness, which caused a poor effect, namely, the
medium permeating speed into the coating was too high and the formation speed of the passive film

www.spm
.com
.cn
Int. J. Electrochem. Sci., Vol. 7, 2012
8177
was lower than its dissolving speed, thus, the passive film formed on the metal surface was dissolved
by the corrosion medium and corrosion was induced whereas the hydrogen generated in the cathodic
reaction led to the appearing of bubbles. Meanwhile, the results also suggested that the chlorinated
polyether resin was served as a carrier and supported in the conductive coating. Due to the fact that
PANi could not form a firm connection with metals, its concentration should not be too high and with
the cost taken into account, PANi added in the coating should be less than 25%.
Table 1. Effect of PANi content on chemical medium resistance of coatings
Sample(PANi%) NaCl (3.5%) NaOH (5%) H2SO4(5%)
1 (10%) No change No change No change
2 (15%) No change No change No change
3 (20%) No change No change No change
4 (25%) Microbubbles A few small
bubbles
A few small
bubbles
5 (30%) Microbubbles Massive bubbles Massive bubbles
6 (40%) A few small
bubbles
Massive bubbles Massive bubbles
3.4. Electrochemical testing of the PANi coating corrosion resistance
Tafel polarization curves measurements of the coatings with various concentration of PANi
Four types of conductive coatings identified by different additions of PANi, i.e., 15%, 25%,
30% and 40% were prepared and they were painted on the working electrodes made by A3 steel. Tafel
polarization curves were measured on these electrodes in 3.5% NaCl solution and the results were
plotted on Figure 6 (a, b, c and d). The corrosion potentials and the corrosion current densities could be
obtained by extrapolation of the Tafel zone in the polarization curves. Comparing the Tafel curves of a,
b, c and d with that obtained on the A3 steel electrode without any coating, we could find that the
corrosion potentials of the A3 steel had a large positive shift and the corrosion current densities were
remarkably decreased in the presence of PANi. For the coating with the PANi concentration of 15%,
25% and 30%, the corrosion potentials shifted to the positive direction as large as 0.777V, 0.830V, and
0.927V respectively, and the corrosion current densities were decreased by 2 to 3 orders of magnitude.
It was reported that the more positive corrosion potential the metal had, the more stable the metal was,
and the smaller its corrosion possibility was at its service potential, which was due to the fact that the
conductive coating had protected the metal, suggesting that the conductive coatings had a remarkable
anti-corrosion effect on the metal matrix. When the concentration of PANi reached 40%, however, the
corrosion potential began to decrease and the corrosion current density began to increase. This
indicated that the increasing amount of PANi led to the decrease of the conductivity of the coating and
the barrier effect of the electrons transfer; meanwhile it increased the surface roughness, which

www.spm
.com
.cn
Int. J. Electrochem. Sci., Vol. 7, 2012
8178
increased the micro defects largely and the medium permeating speed. As a result, the anti-corrosion
effect of the coating was decreased.
-10 -9 -8 -7 -6 -5 -4 -3 -2 -1-1.0
-0.9
-0.8
-0.7
-0.6
-0.5
-0.4
-0.3
-0.2
-0.1
0.0
0.1
0.2
0.3
0.4
0.5
0.6
0.7
E/V
(vs S
CE
)
logI/A
bare A3 steel
ab
c
d
a: 14%PANi
b: 25%PANi
c: 33%PANi
d: 40%PANi
Figure 6. Tafel curves of film containing different PANi in NaCl solution (3.5% w/w)
Electrochemical impedance spectroscopy (EIS) measurements of the conductive coatings with
various concentrations of PANi
Figure 7 and Figure 8 displayed the EIS results of the samples without ( bare A3 steel ) and
with various PANi concentrations ( 15%(a), 25%(b), 30%(c), and 40%(d) ) of PANi.
0 20 40 60 800
5
10
15
20
25
30
A3:bare steel
Zi
oh
m c
m2
Zrohm cm2
Figure 7. Nyquist diagram for A3 steel in NaCl solution (3.5% w/w)

www.spm
.com
.cn
Int. J. Electrochem. Sci., Vol. 7, 2012
8179
0 50000 100000 150000 200000
0
10000
20000
30000
40000
50000
600000 2000 4000 6000 8000 10000 12000 14000
0
1000
2000
3000
4000
5000
6000
a:14% PANi
b:25% PANi
c:33% PANi
d:40% PANi
a:
Zi /o
hm
cm
2
a: Zr /ohm cm2
b,c
,d:
Zi /o
hm
cm
2
b,c,d: Zr /ohm cm2
Figure 8. Nyquist diagrams for film containing different PANi in NaCl solution (3.5% w/w)
The impedance value is an important parameter to evaluate the anti-corrosion effect of the
coating in a long time, which directly reflects the permeating ability of the corrosion medium into the
coating [19]. The larger the impedance value is, the more time the corrosion medium takes to pass the
coating and the better the anti-corrosion properties of the coating is. Seen from Figure 4, it was clear
that the impedance of the samples covered by the coating with PANi was higher than the bare A3 steel
sample, which indicated that the conductive coatings had a remarkable corrosion inhibition effect for
A3 steel.
The EIS data were fitted by the Autolab software and from the fitting results, the charge
transfer resistance of the bare A3 steel electrode was only 52Ωcm2. In Figure 8, as to the curves of b, c,
and d, there was a semicircle appearing in the high frequency range and a line characteristics of
Warburg impendency appearing in the low frequency, which was ascribed to the fact that the PANi
particles in the coating had a large barrier effect, corrosion could only occur at the interface of the
metal matrix and the corrosion medium which reached there by a penetration process through the
particles pores, thus, the corrosion process of the metal matrix mainly depended on the mass transfer
process and the electrochemical reactions. Curve a in Figure 8 had only a semicircle, indicative of only
one time constant and the impendence of the related coating was about 161 kΩcm2, which was much
larger than that of b, c and d (about 1~4kΩcm2), suggesting the corrosion process was controlled by the
electrochemical reaction, namely, the conductive coatings could effectively hinder corrosion medium
from penetrating into the metal surface. These results were in good agreements with the Tafel curves
analysis, implying that the conductive coatings had unique anti-corrosion properties and excess of
PANi particles would lead to an increase of coating surface roughness and a decrease of the coating
tightness which finally resulted in the corrosion medium penetrating to the metal/coating interface and
initial of corrosion.
The measurements results suggested that the anti-corrosion properties of the conductive coating

www.spm
.com
.cn
Int. J. Electrochem. Sci., Vol. 7, 2012
8180
decreased with the increasing concentration of PANi. Thus, the amount of PANi added in the coating
should not be too high, and an addition of 14~25% would be suitable, at which the coating could
obtain both a unique conductive properties and a best anti-corrosion characteristics.
3.5. Coatings morphology observation
With PANi as the conductive materials, chlorinated polyether resin as the film formers as well
as some other additives, the conductive coatings were prepared. Figure 9 displayed microscope images
(100×) of these coatings tested by painting on the glass slide surface. It could be seen that the size of
the solid particles in the conductive coatings were small, indicating PANi particles had dispersed
uniformly in chlorinated polyether resin. The PANi particles were fibrous and connected to others,
forming a charge transfer net.
Figure 9. The photo of conductive coating by using microscope at 100×
Figure 10 showed the optical and AFM images of the coatings surface morphologies. From the
optical images, the coatings surfaces were not rough but smooth. Due to the fact that AFM image was
obtained by measuring the interaction of the samples with a special probe, its resolution was at the
atomic level. From the two-dimension and three-dimension maps in Figure 10, the micro surface of the
conductive coating was condensed and the coating was continuous with a large area. The roughness of
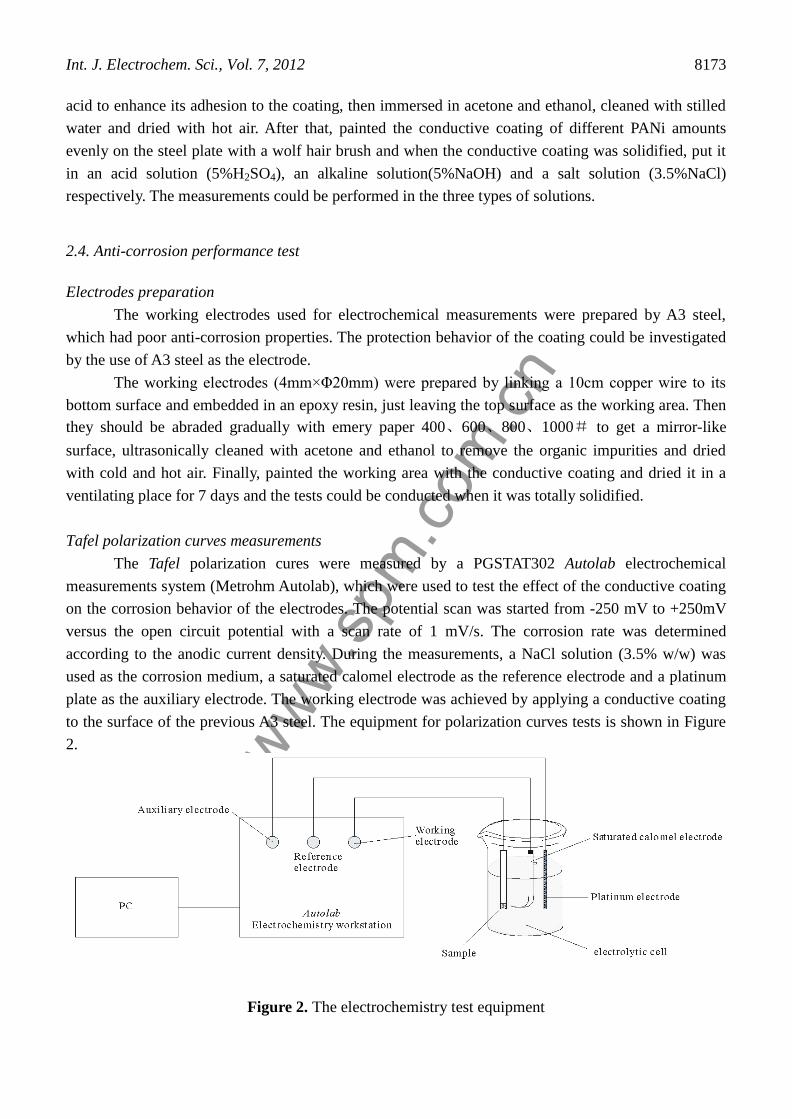
the coating surface (Ra) was only 11nm and its surface heights distribution was shown in Figure 11. It
could be observed that the heights followed a normal distribution with the average height of 91nm,
indicating the surface of the prepared coating was very smooth. The particles in the conductive coating
were assigned to PANi molecules, the particle size of which had a large distribution range. As shown in
Figure 11, the average particle size was 249 nm, indicating PANi molecules were small and could be
easily connected with others to form a conductive network.

www.spm
.com
.cn
Int. J. Electrochem. Sci., Vol. 7, 2012
8181
(a) visual two-dimensional surface
(b) two-dimensional surface measured by AFM
(c) three-dimensional illustration measured by AFM
Figure 10. The surface of conductive coating
www.spm
.com
.cn
Int. J. Electrochem. Sci., Vol. 7, 2012
8182
Figure 11. The distribution map of conductive coating's surface height and conductive coating's
particle size
3.6. Concentration of HClO in test solution
As previous mentioned, in order to obtain a better conductive coating, we produced a
conductive coating with 15% PANi and the weight ratio of methysulfonic Acid/PANi as 1/1 to
prepared the electrode for electrolysis. We designed a simple system to produce HOCl, which was
mainly made up of a potentiostat and a self-made working electrode (painted by PANi conductive
coating). We measured the concentration of HOCl in 3.5 wt % NaCl solution (100 ml volume) by
HClO Rapid Tester (Type S-CL501,QingShiJie Technology Co., Ltd, Shenzhen). As the instrument
range limits was (0-2mg/L), the HOCl concentrations were measured under a lower current density and
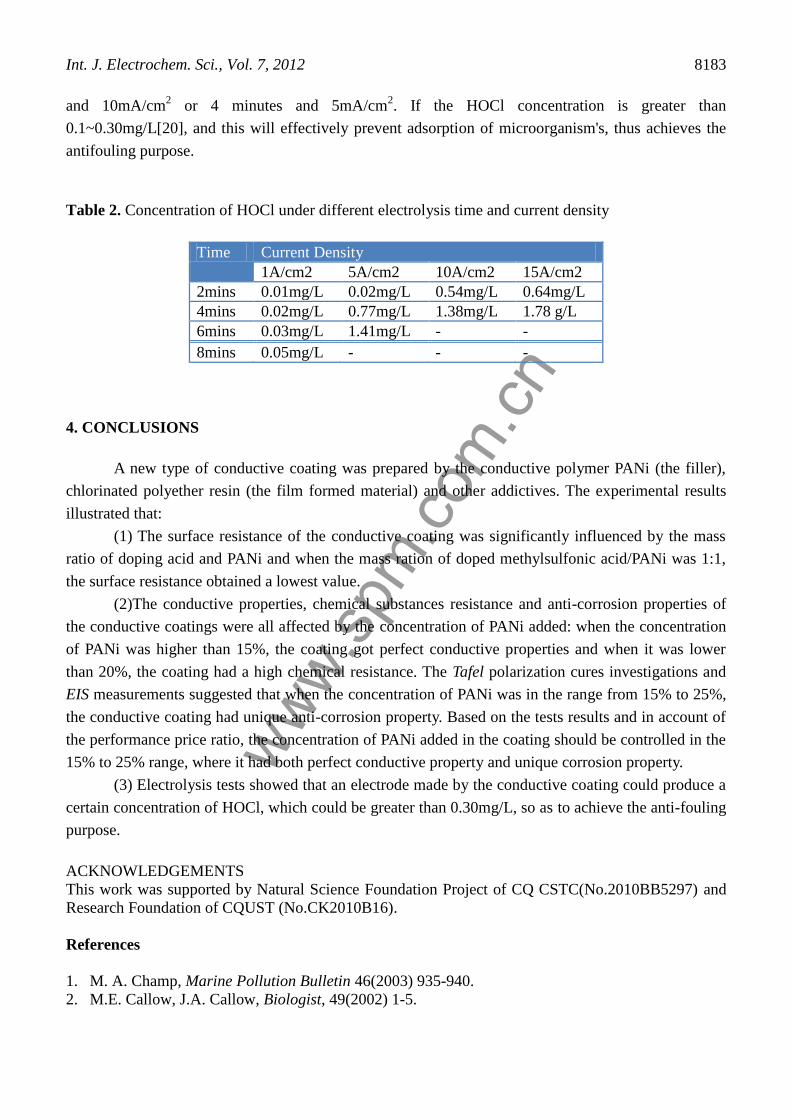
electrolysis time and the data were showed in Table 2. When the current density was low (1mA/cm2),
the concentrations of HOCl were not observed to be significant with increasing electrolysis time.
While the current density increased, the concentrations of HOCl were observed to be notable with
increasing electrolysis time. At the same electrolysis time, the concentrations of HOCl were observed
to be notable with the current density raised. From the table we could find that in order to obtain a
higher HOCl concentration, the electrolysis time and current density should be greater than 2 minutes
www.spm
.com
.cn
Int. J. Electrochem. Sci., Vol. 7, 2012
8183
and 10mA/cm2 or 4 minutes and 5mA/cm
2. If the HOCl concentration is greater than
0.1~0.30mg/L[20], and this will effectively prevent adsorption of microorganism's, thus achieves the
antifouling purpose.
Table 2. Concentration of HOCl under different electrolysis time and current density
Time Current Density
1A/cm2 5A/cm2 10A/cm2 15A/cm2
2mins 0.01mg/L 0.02mg/L 0.54mg/L 0.64mg/L
4mins 0.02mg/L 0.77mg/L 1.38mg/L 1.78 g/L
6mins 0.03mg/L 1.41mg/L - -
8mins 0.05mg/L - - -
4. CONCLUSIONS
A new type of conductive coating was prepared by the conductive polymer PANi (the filler),
chlorinated polyether resin (the film formed material) and other addictives. The experimental results
illustrated that:
(1) The surface resistance of the conductive coating was significantly influenced by the mass
ratio of doping acid and PANi and when the mass ration of doped methylsulfonic acid/PANi was 1:1,
the surface resistance obtained a lowest value.
(2)The conductive properties, chemical substances resistance and anti-corrosion properties of
the conductive coatings were all affected by the concentration of PANi added: when the concentration
of PANi was higher than 15%, the coating got perfect conductive properties and when it was lower
than 20%, the coating had a high chemical resistance. The Tafel polarization cures investigations and
EIS measurements suggested that when the concentration of PANi was in the range from 15% to 25%,
the conductive coating had unique anti-corrosion property. Based on the tests results and in account of
the performance price ratio, the concentration of PANi added in the coating should be controlled in the
15% to 25% range, where it had both perfect conductive property and unique corrosion property.
(3) Electrolysis tests showed that an electrode made by the conductive coating could produce a
certain concentration of HOCl, which could be greater than 0.30mg/L, so as to achieve the anti-fouling
purpose.
ACKNOWLEDGEMENTS
This work was supported by Natural Science Foundation Project of CQ CSTC(No.2010BB5297) and
Research Foundation of CQUST (No.CK2010B16).
References
1. M. A. Champ, Marine Pollution Bulletin 46(2003) 935-940.
2. M.E. Callow, J.A. Callow, Biologist, 49(2002) 1-5.
www.spm
.com
.cn
Int. J. Electrochem. Sci., Vol. 7, 2012
8184
3. N. LeBlanc, J. Davidson, R. Tremblay, M. McNiven, Aquaculture 264(2007) 205-213.
4. C.Fant, K.Sott, H.Elwing et al., “The International Symposium on Marine Biofouling”, University
of Plymouth, July 1999, p.119.
5. Jean-Philippe Maréchal , Claire Hellio, Int. J. Mol. Sci. 10(2009)4623-4637.
6. W.L. Hu, L.L. Wu, J. Zhou, J. Electrochem. 5(1999) 299-303.
7. Y.Huang, M. Iwata, M. Usami, The Proceedings of the Ninth International Offshore and Polar
Engineering Conference, Brest, France, vol. 4, 1999, pp. 146-153.
8. M.Usami, Y.Huang, M.Iwata, J.Soc.Nav.Archit.Jpn. 183(1998)375-382.
9. Marco-A. DE PAOLI,Wilson A. GAZOTTI, Macromol. Symp, 189(2002) 83-103.
10. Z.L Lu, Mater. Prot. 2(1998)12-14.(In Chinese)
11. David Ofer, Richard M. Crooks, Mark S. Wrighton, J. Am. Chem. Soc. 112(1990) 7869-7879.
12. D. F. Li, W. Wang, H.J. Wang, X.S. Jia, J.Y. Wang. Appl. Surf. Sci. 255(2008)581-584.
13. Z. Z. Zhu, Z. Wang, H.L. Li, Appl. Surf. Sci., 254(2008) 2934-2940.
14. X.W. Li, G.C. Wang, X.X Li, D.M. Lu, Appl. Surf. Sci. 229(2004)395-401.
15. Z. Wang, H.L. Li, Chem. J. Chin. Univ. 23(2002) 721-723. (in Chinese)
16. F Fusalba, P Gouérec, D Villers, D Belanger, J. Electrochem. Soc. 148(2001) A1-A6.
17. K. Rajendra Prasad, N. Munichandraiah, J. Electrochem. So. 149(2002) A1393-A1399.
18. F. C. Jain, J.J. Rosato, K. S. Kalonia, Corrosion 42(1986) 700-707.
19. Y.F. Jiang, X.W. Guo, C.Q. Zhai, DW.J. Ding, Journal of Functional Polymers 15(2002) 473-479
(in Chinese)
20. R .Gundersen , B .Johansen , P. O. Gartland, Corrosion 47(1991) 800-807.
© 2012 by ESG (www.electrochemsci.org)
Top Related