


Languages
Pages
Legal


#AnalyticsXC o p y r ig ht © 201 6, SAS In st i tute In c. A l l r ig hts r ese rve d.
Prediction of Chilled Water Plant Failures and System Optimization Using Multivariate Modeling Techniques
Joel UrbanDirector of Quality Assurance
Brady Services, Inc.
Leah Lehman
SAS
IoT Program Director

#AnalyticsXC o p y r ig ht © 201 6, SAS In st i tute In c. A l l r ig hts r ese rve d.
Prediction of Chilled Water Plant Failures and System Optimization Using Multivariate Modeling Techniques
Joel UrbanDirector of Quality Assurance
Brady Services, Inc.
Leah Lehman
SAS
IoT Program Director

#analyticsx
C o p y r ig ht © 201 6, SAS In st i tute In c. A l l r ig hts r ese rve d.
The SAS Smart Campus
Project
Joel Urban, CEM (Brady Services) and Leah Lehman, Ph.D. (SAS)

C o p y r ig ht © 201 6, SAS In st i tute In c. A l l r ig hts r ese rve d.
#analyticsx
C o p y r ig ht © 201 6, SAS In st i tute In c. A l l r ig hts r ese rve d.
Why Should The Market Care?
The Project
The Original Demo
The Challenges and Vision
Q&A
Outline

C o p y r ig ht © 201 6, SAS In st i tute In c. A l l r ig hts r ese rve d.
#analyticsx
C o p y r ig ht © 201 6, SAS In st i tute In c. A l l r ig hts r ese rve d.
Why Should The Market Care?
If you own/operate a business or other organization…
If you own/operate a building(s)…
If you care about your OPEX and CAPEX budgets…
If tenant comfort and employee productivity are important…

C o p y r ig ht © 201 6, SAS In st i tute In c. A l l r ig hts r ese rve d.
#analyticsx
C o p y r ig ht © 201 6, SAS In st i tute In c. A l l r ig hts r ese rve d.
Electricity is
> 2x more
expensive
than any
other energy
source!
Electricity

C o p y r ig ht © 201 6, SAS In st i tute In c. A l l r ig hts r ese rve d.
#analyticsx
C o p y r ig ht © 201 6, SAS In st i tute In c. A l l r ig hts r ese rve d.
Why Should The Market Care?
Nationally, the average commercial building uses 43.7% of its total energy consumption for Heating, Ventilation, and Air Conditioning (HVAC).
Approximately half of the HVAC energy consumption is for Air Conditioning (A/C).
A/C consumes electricity… a lot of expensive electricity.
[Source: US Energy Information Administration, 2012 Commercial Building Energy Consumption Survey (CBECS)]
C o p y r ig ht © 201 6, SAS In st i tute In c. A l l r ig hts r ese rve d.
#analyticsx
C o p y r ig ht © 201 6, SAS In st i tute In c. A l l r ig hts r ese rve d.
C o p y r ig ht © 201 6, SAS In st i tute In c. A l l r ig hts r ese rve d.
#analyticsx
C o p y r ig ht © 201 6, SAS In st i tute In c. A l l r ig hts r ese rve d.
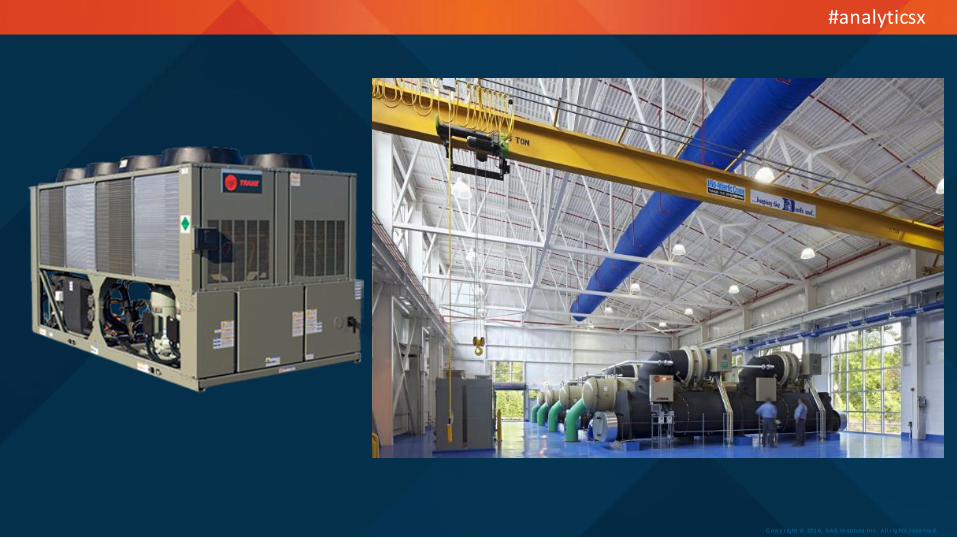
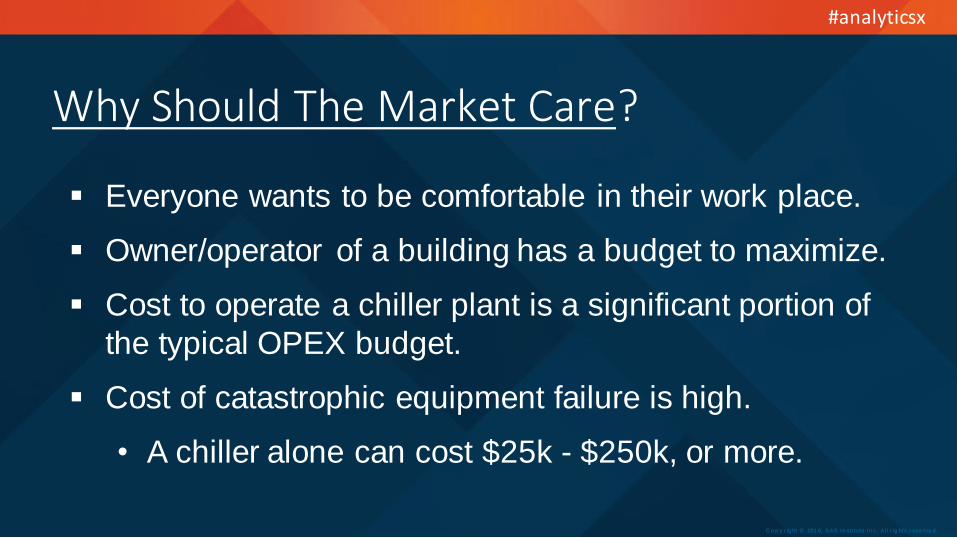
Why Should The Market Care?
Everyone wants to be comfortable in their work place.
Owner/operator of a building has a budget to maximize.
Cost to operate a chiller plant is a significant portion of
the typical OPEX budget.
Cost of catastrophic equipment failure is high.
• A chiller alone can cost $25k - $250k, or more.

C o p y r ig ht © 201 6, SAS In st i tute In c. A l l r ig hts r ese rve d.
#analyticsx
C o p y r ig ht © 201 6, SAS In st i tute In c. A l l r ig hts r ese rve d.
Why Should The Market Care?
Potential savings from implementing a predictive maintenance program:
Return on Investment
Maintenance Costs
Equipment Breakdowns
Downtime Productivity
25-30% 70-75% 35-45% 20-25%
[Source: Operations and Maintenance Best Practices Guide. US Department of Energy]
10X
Improved Efficiency and Reduced Energy Consumption

C o p y r ig ht © 201 6, SAS In st i tute In c. A l l r ig hts r ese rve d.
#analyticsx
C o p y r ig ht © 201 6, SAS In st i tute In c. A l l r ig hts r ese rve d.
The Project
Make SAS World HQ
campus in Cary, NC a
Smart Campus.
Real-world example of an
IoT-enabled advanced
analytics application for
new and existing
buildings.

C o p y r ig ht © 201 6, SAS In st i tute In c. A l l r ig hts r ese rve d.
#analyticsx
C o p y r ig ht © 201 6, SAS In st i tute In c. A l l r ig hts r ese rve d.
The Project
Apply SAS® Visual Analytics (VA), Event Stream
Processing (ESP), Asset Performance Analytics (APA), and
other applicable software to:
1. Create algorithms to facilitate predictive maintenance
and service events.
2. Create diagnostic algorithms that identify opportunities
for optimization of building operations and controls.

C o p y r ig ht © 201 6, SAS In st i tute In c. A l l r ig hts r ese rve d.
#analyticsx
C o p y r ig ht © 201 6, SAS In st i tute In c. A l l r ig hts r ese rve d.
The Original Demo Bldg Q Data:
• Subset of history starting August 2014 to April 2016
• 5 or 15 minute actual data values
• 10,471 sensors (tags)
• 9 assets (e.g., AHUs, chillers, boilers, cooling towers, etc.)
• 12 events (e.g., AHU supply fan failure, chiller failure, etc.)

C o p y r ig ht © 201 6, SAS In st i tute In c. A l l r ig hts r ese rve d.
#analyticsx
C o p y r ig ht © 201 6, SAS In st i tute In c. A l l r ig hts r ese rve d.
The Original Demo
Dimensions:
• Standard Industrial Classification (e.g., Agriculture, Manufacturing,
Mining, etc.)
• Facility Type (e.g., Real Estate, Utilities, etc.)
• Building (C, Q)
Floor
Common Equipment

C o p y r ig ht © 201 6, SAS In st i tute In c. A l l r ig hts r ese rve d.
#analyticsx
C o p y r ig ht © 201 6, SAS In st i tute In c. A l l r ig hts r ese rve d.
The Original Demo
Sensor Names:
• facility name (BQ), Location code (F5), Asset (AHU-5), Control
Device name (MP581.5.1), tag name (Suppl.Fan.Speed)
Example:

C o p y r ig ht © 201 6, SAS In st i tute In c. A l l r ig hts r ese rve d.
#analyticsx
C o p y r ig ht © 201 6, SAS In st i tute In c. A l l r ig hts r ese rve d.
1
2
3
4

C o p y r ig ht © 201 6, SAS In st i tute In c. A l l r ig hts r ese rve d.
#analyticsx
C o p y r ig ht © 201 6, SAS In st i tute In c. A l l r ig hts r ese rve d.
Increase in
supply fan failures
C o p y r ig ht © 201 6, SAS In st i tute In c. A l l r ig hts r ese rve d.
#analyticsx
C o p y r ig ht © 201 6, SAS In st i tute In c. A l l r ig hts r ese rve d.
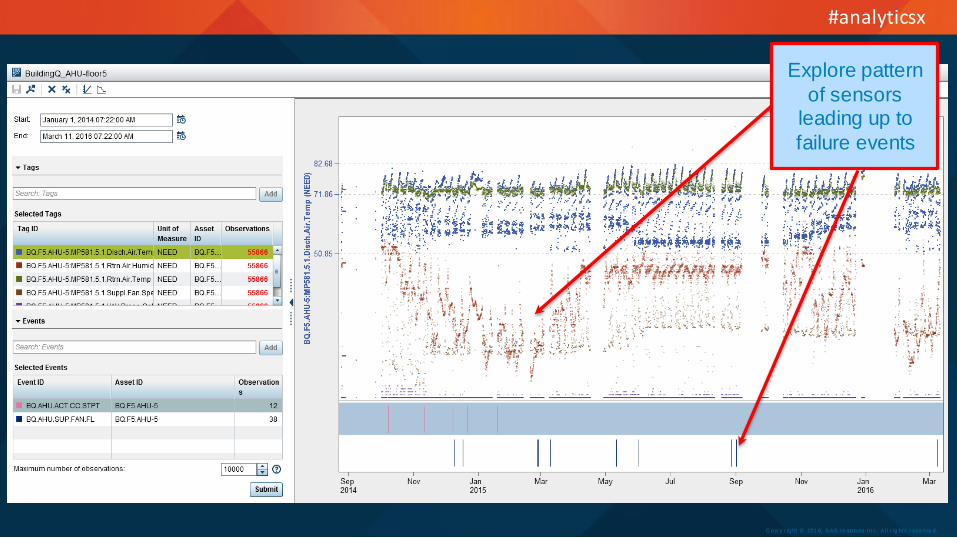
Explore pattern
of sensors leading up to
failure events

C o p y r ig ht © 201 6, SAS In st i tute In c. A l l r ig hts r ese rve d.
#analyticsx
C o p y r ig ht © 201 6, SAS In st i tute In c. A l l r ig hts r ese rve d.
Association rule mining
When this
variable is over its 95th %ile,
chances are 30% greater
for a supply fan failure
Early warnings in the sensors

C o p y r ig ht © 201 6, SAS In st i tute In c. A l l r ig hts r ese rve d.
#analyticsx
C o p y r ig ht © 201 6, SAS In st i tute In c. A l l r ig hts r ese rve d.
• Identify when operation is outside expected stable range
• Alert of potential problems and predict Aug 27th failure

C o p y r ig ht © 201 6, SAS In st i tute In c. A l l r ig hts r ese rve d.
#analyticsx
C o p y r ig ht © 201 6, SAS In st i tute In c. A l l r ig hts r ese rve d.
• Alert field of potential failure
• Implement corrective action

C o p y r ig ht © 201 6, SAS In st i tute In c. A l l r ig hts r ese rve d.
#analyticsx
C o p y r ig ht © 201 6, SAS In st i tute In c. A l l r ig hts r ese rve d.
The Challenges
Change Management
Demonstrate value to stakeholders
Connectivity
Data Acquisition and Quality
Data Context
Time-Series vs. Relational Data
Standardization: Tagging and Tagging (project-haystack.org)

C o p y r ig ht © 201 6, SAS In st i tute In c. A l l r ig hts r ese rve d.
#analyticsx
C o p y r ig ht © 201 6, SAS In st i tute In c. A l l r ig hts r ese rve d.
The Vision
Chiller Plant → Boiler Plant → Air Handlers → Lighting → Ancillary
Systems (e.g., kitchen equipment) → Solar PV
Bldg Q → Bldg C → Bldg A (new) → etc.
Historical Analytics → Real-Time Analytics → Predictive Analytics
→ Visual Analytics
Fully implement analytical platform and turn over to SAS Facility Management and Sustainability teams by 2nd Quarter 2017
C o p y r ig ht © 201 6, SAS In st i tute In c. A l l r ig hts r ese rve d.
#analyticsx
C o p y r ig ht © 201 6, SAS In st i tute In c. A l l r ig hts r ese rve d.
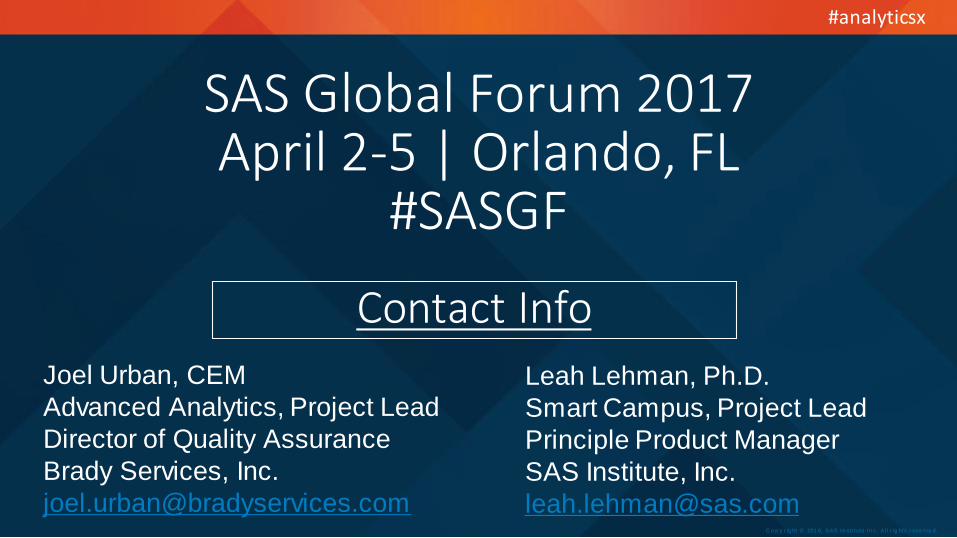
Contact Info
Joel Urban, CEM
Advanced Analytics, Project Lead
Director of Quality Assurance
Brady Services, Inc.
Leah Lehman, Ph.D.
Smart Campus, Project Lead
Principle Product Manager
SAS Institute, Inc.
SAS Global Forum 2017April 2-5 | Orlando, FL
#SASGF

C o p y r ig ht © 201 6, SAS In st i tute In c. A l l r ig hts r ese rve d.
#AnalyticsX
Top Related