


Languages
Pages
Legal


Practical Considerations for Implementation of Real Time Release testing (RTRt)
Graham D. Cook Ph.D.,Senior Director, Global Quality OperationsHavant, [email protected]
CPAC Satellite MeetingRome, March 25, 2010
1
Overview
What needs to be considered when implementing Real Time Release Testing?
Case Study 1 – Product X
Case Study 2 – Product Y
Comparison of some aspects of Product X and Y
Conclusions

2
Real Time Release Testing
‘The ability to evaluate and ensure the quality of in-process and/or final product based on process data, which typically include a valid combination of measured material attributes and process controls.’ (ICH Q8(R2))

33
REAL TIME RELEASE TESTING
SystemsScience
People
ICH Q10 Pharmaceutical Quality System
ICH Q8 Pharmaceutical Development
ICH Q9 Quality Risk Management
Real Time Release Testing - Essential Elements
44
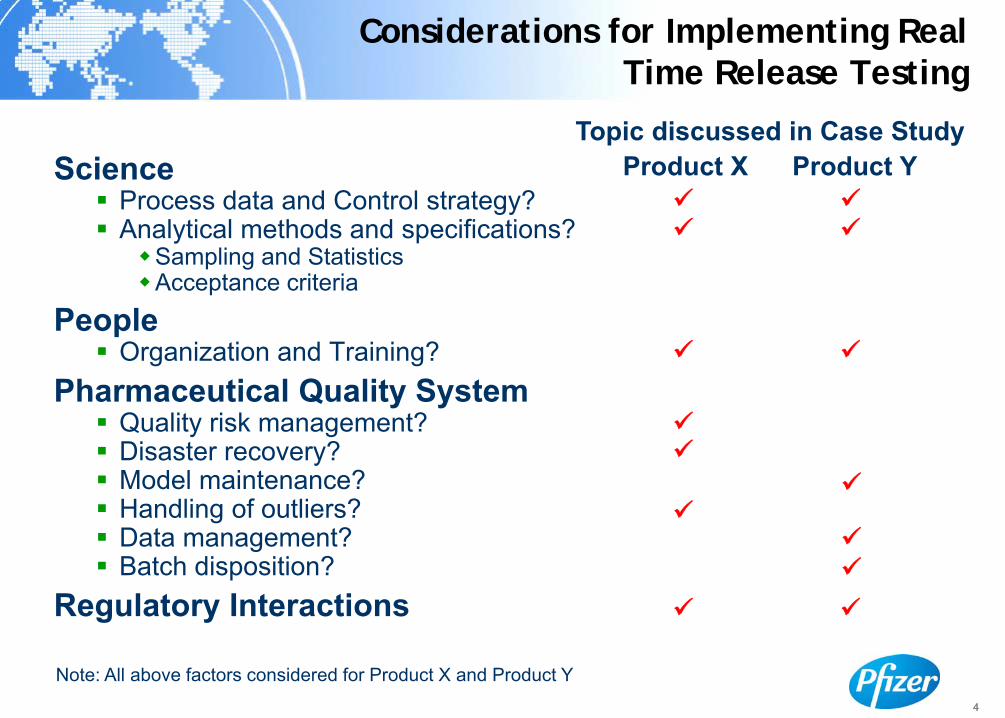
ScienceProcess data and Control strategy?Analytical methods and specifications?
Sampling and StatisticsAcceptance criteria
PeopleOrganization and Training?
Pharmaceutical Quality SystemQuality risk management?Disaster recovery?Model maintenance?Handling of outliers?Data management? Batch disposition?
Regulatory Interactions
Considerations for Implementing Real Time Release Testing
Topic discussed in Case StudyProduct X Product Y
Note: All above factors considered for Product X and Product Y

5
Overview
What needs to be considered when implementing Real Time Release Testing?
Case Study 1 – Product X
Case Study 2 – Product Y
Comparison of some aspects of Product X and Y
Conclusions

666
Product X - Product Description
Dosage FormBCS Class 3 compound (High Water Solubility, Moderate Permeability)Monolithic Extended Release Tablets (multiple strengths)Relatively high dose compound (high drug load)Level A IVIVC has been established for all dose strengths
Polymer is the primary driver of clinical performanceVariation in process parameters did not impact the dissolution performance
Potential to apply Real Time Release TestingProcess understanding at pilot-scale translated well to commercial manufacturing scaleRobust control strategy
7
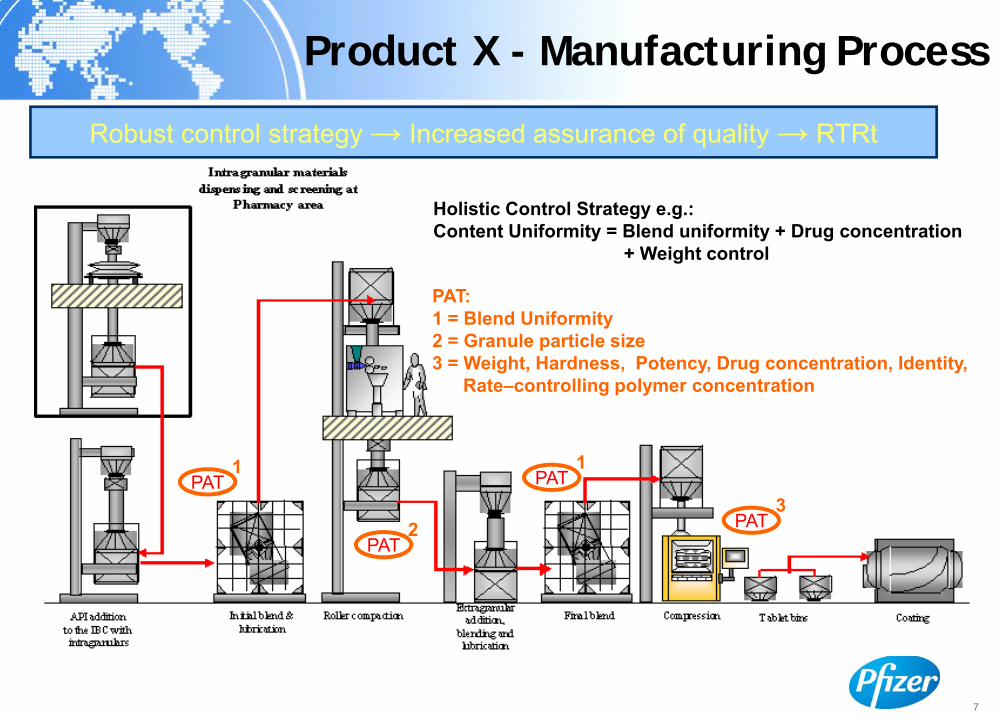
Product X - Manufacturing Process
Robust control strategy → Increased assurance of quality → RTRt
PAT1 PAT
1
PAT:1 = Blend Uniformity2 = Granule particle size3 = Weight, Hardness, Potency, Drug concentration, Identity,
Rate–controlling polymer concentration
PAT2 PAT
3
Holistic Control Strategy e.g.:Content Uniformity = Blend uniformity + Drug concentration
+ Weight control
88
8
Development of Sampling Plans
PAT AnalyzersMeasure condition of the process material in real timeCollect more information about the batch
When and where do we sample?Use of prior knowledge of product and risk assessment in design of plan
e.g. consider potential for segregation (failure mode) in a compression mixStatistical rationale for sampling plan
Performance of plan relative to assurance of qualityRelationship between Real Time Release Testing and Pharmacopoeial TestingPlacement of PAT device in manufacturing equipment
Ensure analyzer measurements are representative of the batch
9
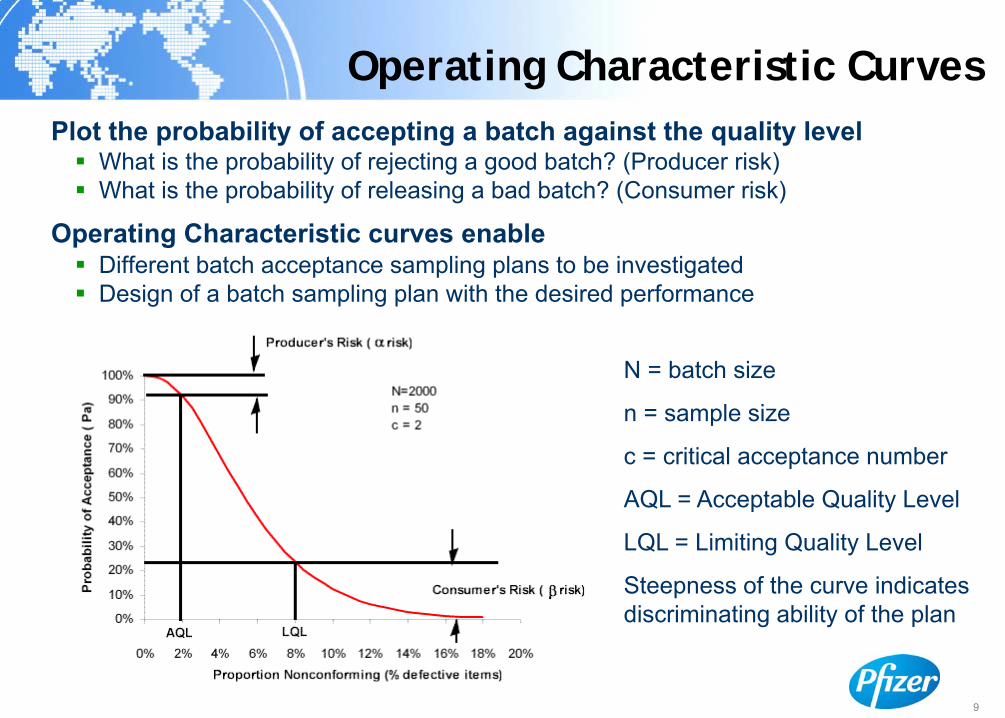
Operating Characteristic CurvesPlot the probability of accepting a batch against the quality level
What is the probability of rejecting a good batch? (Producer risk)What is the probability of releasing a bad batch? (Consumer risk)
Operating Characteristic curves enableDifferent batch acceptance sampling plans to be investigatedDesign of a batch sampling plan with the desired performance
N = batch size
n = sample size
c = critical acceptance number
AQL = Acceptable Quality Level
LQL = Limiting Quality Level
Steepness of the curve indicates discriminating ability of the plan

1010
Operating Characteristic Curves for UDU Test
The USP OC curve shows 90% probability of passing a batch with 2% product outside 85-115% of Label ClaimThe Alternative Plan OC curve shows 0% probability of passing a batch with 2% outside 85-115% of Label Claim The Alternative Plan uses a larger sample size and provides a better assurance of quality than USP
Probability to passAlternative Plan90% probability of passing bx by USPProbability to passUSP
% Product outside 85‐115% of Label Claim
0 1 2 3 4 5 6 7
Note: UDU = Uniformity of Dosage Units (Content Uniformity)‘Coverage’ = % Product meeting 85-115% of Label Claim ‘Coverage’ term used in paper by Sandell, D. et al. (see reference slide 24 )
If the Alternative Plan is chosen for sampling using a PAT analyzer what is the fall-back if the analyzer fails?
- Must maintain same level of quality by using the same sampling plan with the replacement analytical technology

11
Product X - Sampling
Location of PAT Analyzer in BlenderRationale based on prior knowledge (including publications)Blender design: no ‘hot’ spots therefore any location suitableAnalyser placed in bottom of blender
Sampling plan for TabletsTablets samples taken uniformly across batchX tablets taken every Y minutes during compression run
Drug Content of TabletsDrug concentration by NIR and Weight Uniformity determined on different tablet samples
Low risk because high drug loadingCheck using Monte Carlo simulation

12
Monte Carlo SimulationsMonte Carlo Simulation*
A technique that converts uncertainties in input variables of a model into probability distributions. By combining the distributions and randomly selecting values from them, it recalculates the simulated model many times and brings out the probability of the outputAllows several inputs to be used at the same time to create the probability distribution of one or more outputsThe output is generated as a range instead of a fixed value and shows how likely the output value is to occur in the range
Assessment of Drug Content of TabletsDrug Concentration (NIR) and Tablet Weights are independent probability distributionsWhat is probability of releasing a batch of marginal quality?Use Monte Carlo simulation to explore the variation in:
Drug Concentration (NIR mean; NIR std.dev.)Tablet Weight (Weight mean; Weight std. dev.; difference in weights from double-sided tablet press)
*Sanford Bolton, Charles Bon: Pharmaceutical Statistics - Practical and Clinical Applications, Fourth Ed., Marcel Dekker
13
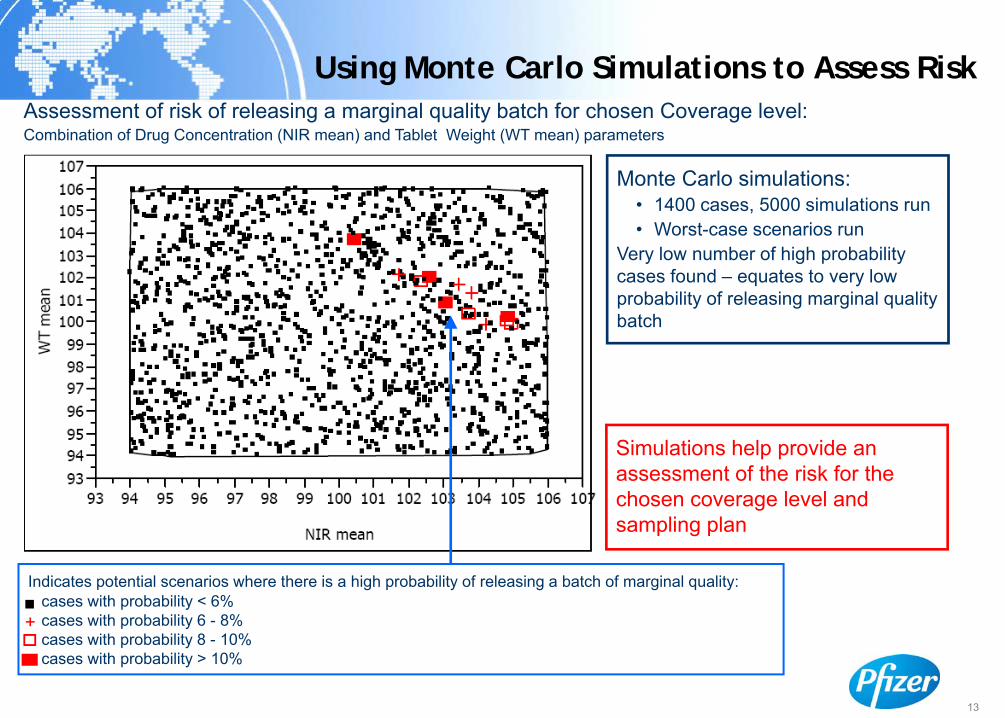
Using Monte Carlo Simulations to Assess RiskAssessment of risk of releasing a marginal quality batch for chosen Coverage level:Combination of Drug Concentration (NIR mean) and Tablet Weight (WT mean) parameters
Indicates potential scenarios where there is a high probability of releasing a batch of marginal quality:cases with probability < 6%cases with probability 6 - 8%cases with probability 8 - 10%cases with probability > 10%
+■
Monte Carlo simulations:• 1400 cases, 5000 simulations run• Worst-case scenarios run
Very low number of high probability cases found – equates to very low probability of releasing marginal quality batch
Simulations help provide an assessment of the risk for the chosen coverage level and sampling plan
1414
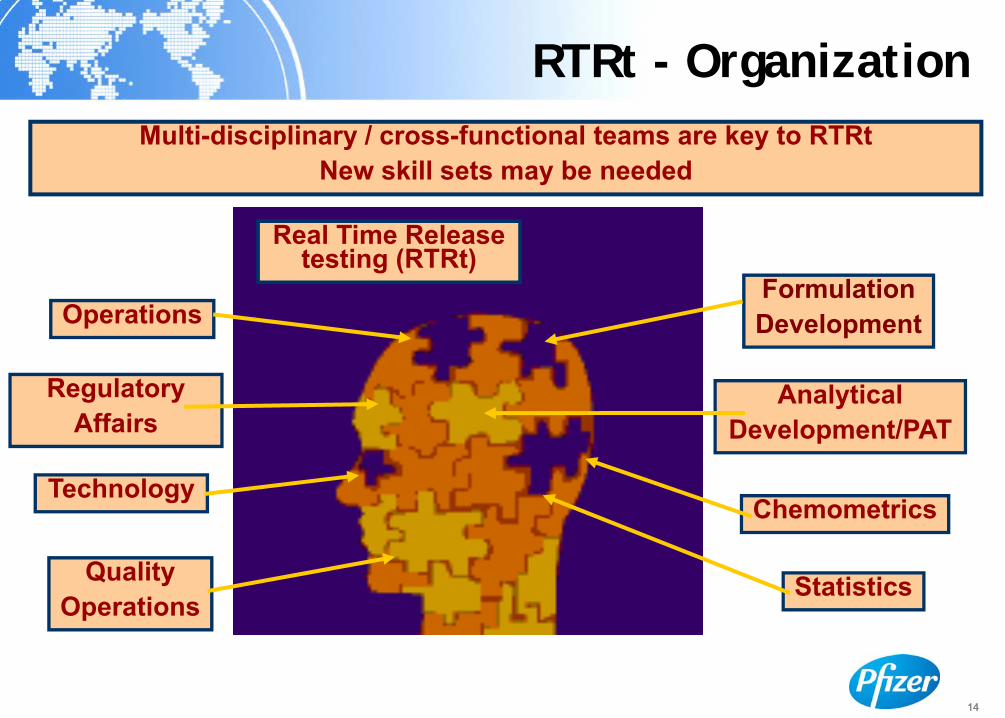
RTRt - OrganizationMulti-disciplinary / cross-functional teams are key to RTRt
New skill sets may be needed
Real Time Release testing (RTRt)
Technology
Regulatory Affairs
QualityOperations
Statistics
FormulationDevelopment
Chemometrics
AnalyticalDevelopment/PAT
Operations
1515
15
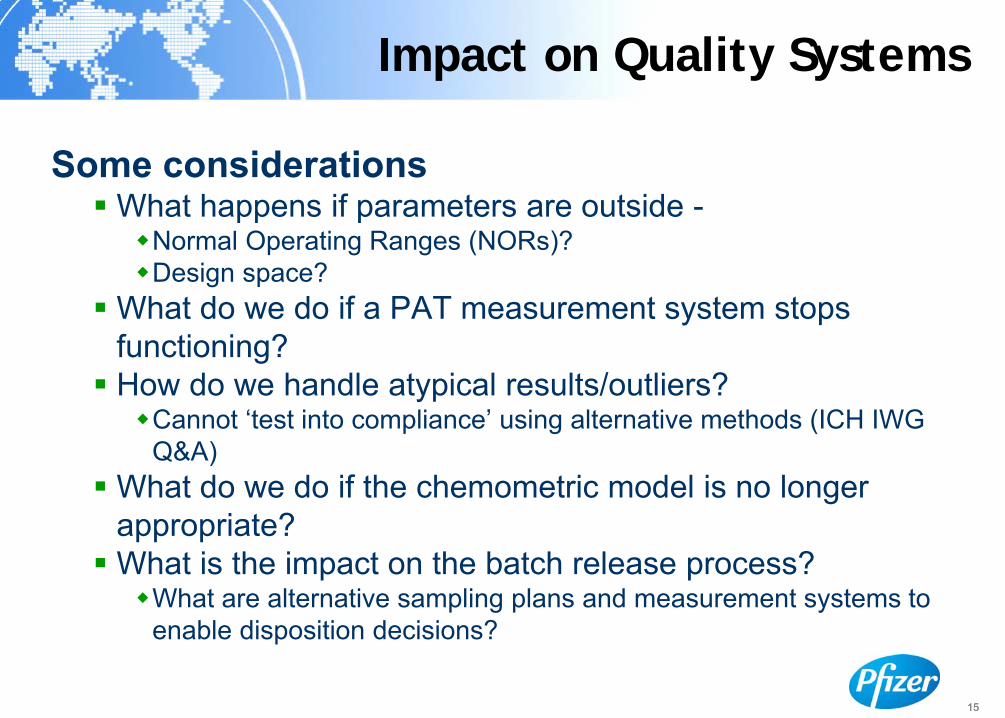
Impact on Quality Systems
Some considerationsWhat happens if parameters are outside -
Normal Operating Ranges (NORs)? Design space?
What do we do if a PAT measurement system stops functioning?How do we handle atypical results/outliers?
Cannot ‘test into compliance’ using alternative methods (ICH IWG Q&A)
What do we do if the chemometric model is no longer appropriate?What is the impact on the batch release process?
What are alternative sampling plans and measurement systems to enable disposition decisions?

16
Quality Risk Management
Quality Risk ManagementEnabler for implementation of Real Time Release testing
Incorporate QRM into proceduresFacilitates uniform implementation of QRM across the entire organizationConsistent use of the same language (terminology) and processEstablish criteria for re-evaluation of risks and mitigation plans
Triggered by time, event or new knowledge
Training program Different levels
Awareness trainingUser training - participant, facilitator, team leader
Facilitates selection of correct QRA approach and toolCulture - proactive approach to quality
1717
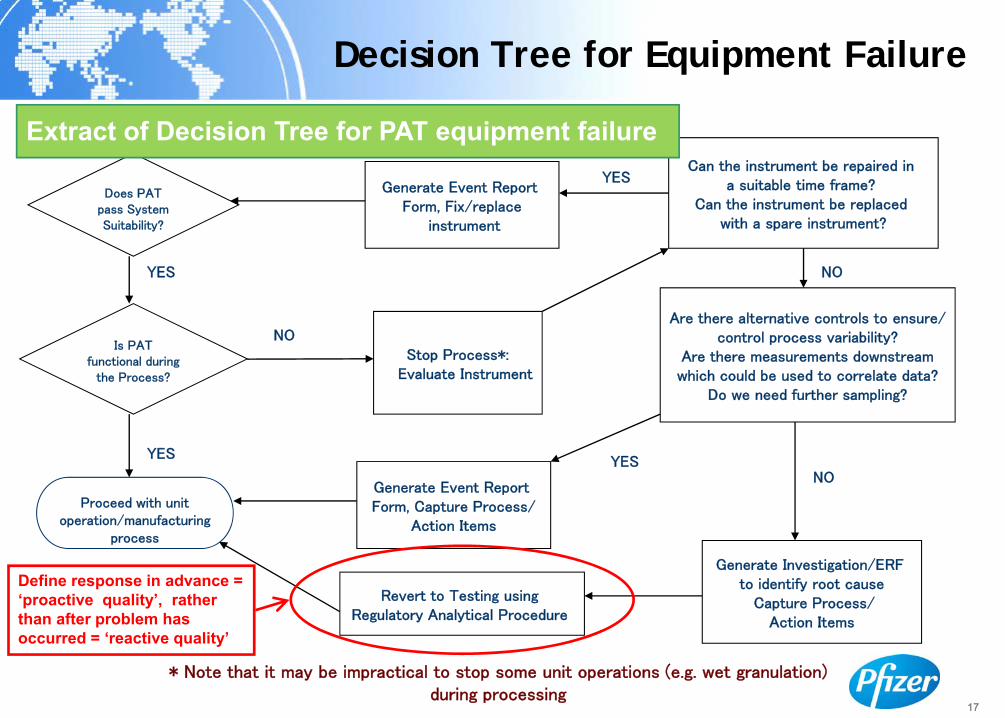
Decision Tree for Equipment Failure
* Note that it may be impractical to stop some unit operations (e.g. wet granulation) during processing
Does PAT pass System Suitability?
NO
Proceed with unit operation/manufacturing
process
YES
YES
NO
Is PAT functional during
the Process?
YES
Can the instrument be repaired in a suitable time frame?
Can the instrument be replaced with a spare instrument?
Generate Event Report Form, Fix/replace
instrument
NO
Are there alternative controls to ensure/control process variability?
Are there measurements downstreamwhich could be used to correlate data?
Do we need further sampling?
Generate Event Report Form, Capture Process/
Action Items
Revert to Testing using Regulatory Analytical Procedure
Generate Investigation/ERF to identify root cause
Capture Process/Action Items
YES
Stop Process*:Evaluate Instrument
Define response in advance = ‘proactive quality’, rather than after problem has occurred = ‘reactive quality’
Extract of Decision Tree for PAT equipment failure
18
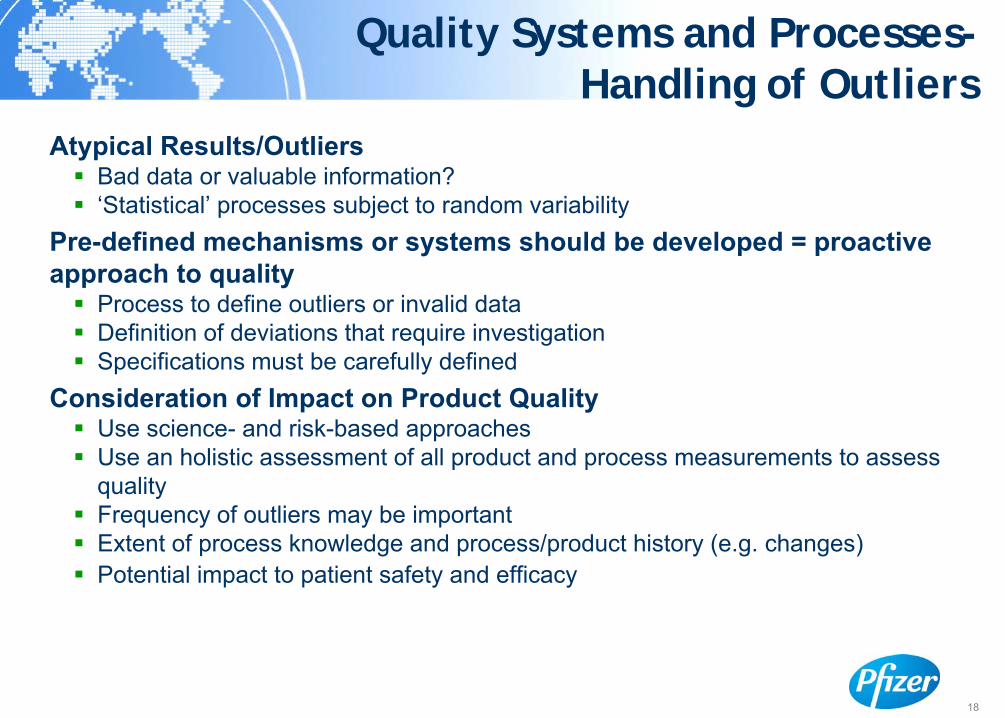
Quality Systems and Processes-Handling of Outliers
Atypical Results/OutliersBad data or valuable information?‘Statistical’ processes subject to random variability
Pre-defined mechanisms or systems should be developed = proactive approach to quality
Process to define outliers or invalid dataDefinition of deviations that require investigationSpecifications must be carefully defined
Consideration of Impact on Product QualityUse science- and risk-based approaches Use an holistic assessment of all product and process measurements to assess qualityFrequency of outliers may be importantExtent of process knowledge and process/product history (e.g. changes)Potential impact to patient safety and efficacy
19
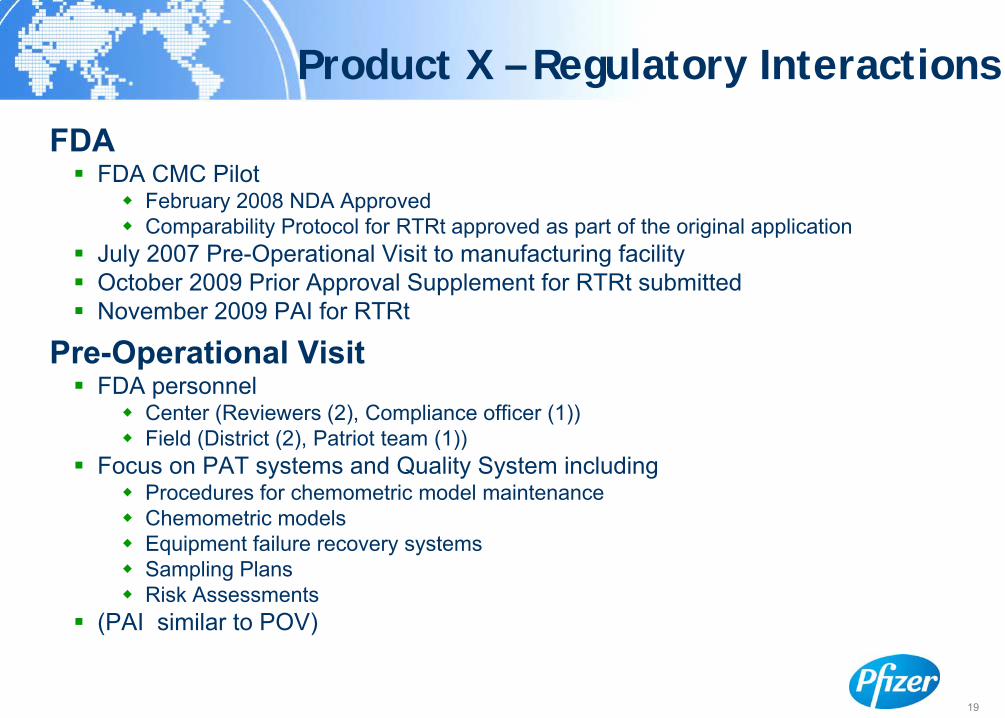
Product X – Regulatory Interactions
FDAFDA CMC Pilot
February 2008 NDA ApprovedComparability Protocol for RTRt approved as part of the original application
July 2007 Pre-Operational Visit to manufacturing facilityOctober 2009 Prior Approval Supplement for RTRt submittedNovember 2009 PAI for RTRt
Pre-Operational VisitFDA personnel
Center (Reviewers (2), Compliance officer (1))Field (District (2), Patriot team (1))
Focus on PAT systems and Quality System includingProcedures for chemometric model maintenance Chemometric modelsEquipment failure recovery systemsSampling Plans Risk Assessments
(PAI similar to POV)

20
Overview
What needs to be considered when implementing Real Time Release Testing?
Case Study 1 – Product X
Case Study 2 – Product Y
Comparison of some aspects of Product X and Y
Conclusions

212121
Product Y - Product Background
Dosage FormBCS Class 1 compound (High Water Solubility, High Permeability)Immediate Release TabletsPotent, low dose compound, low drug load
Launched from small-scale containment manufacturing facility
Potential for Real Time Release TestingIncreased demand – need to increase efficiency
More information in real-timeRobust control strategy

22
API & Excipients
Dispensing Blend BlendSieving Granulation
MagStearate
MagStearate
PAT1
PAT2
BlendTablettingCoating PAT3
PAT4
PAT2
PAT2
PAT:1 = Identification2 = Blend Uniformity3 = Weight, Hardness, Disintegration, Potency, Content Uniformity 4 = Water Determination
Product Y - Manufacturing Process
23
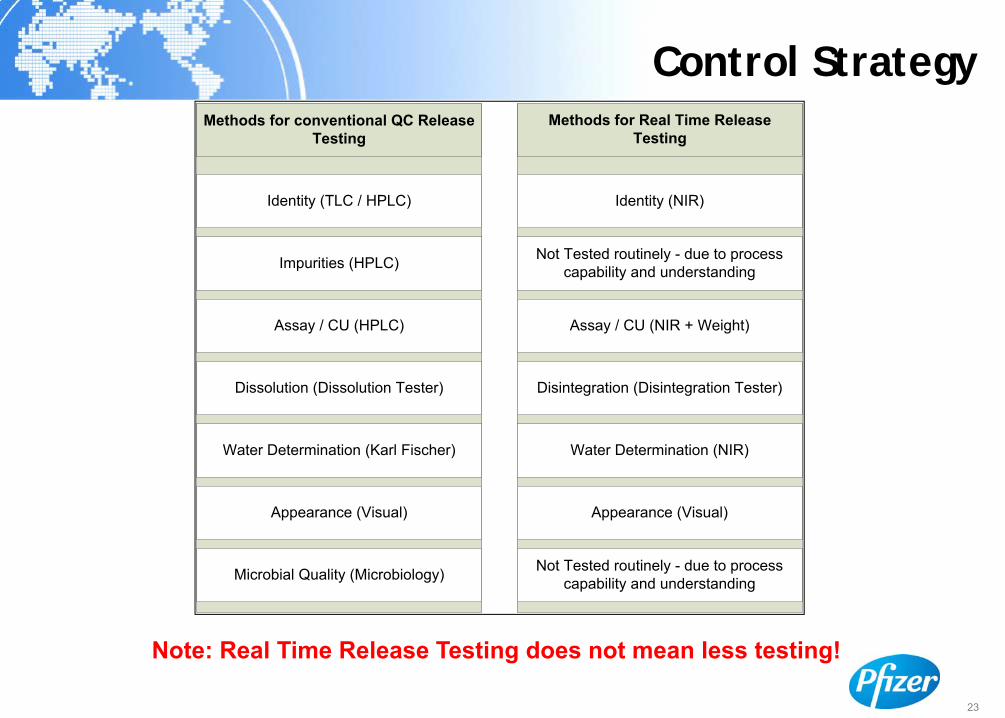
Control StrategyMethods for conventional QC Release
TestingMethods for Real Time Release
Testing
Appearance (Visual) Appearance (Visual)
Identity (TLC / HPLC) Identity (NIR)
Impurities (HPLC) Not Tested routinely - due to process capability and understanding
Assay / CU (NIR + Weight)
Dissolution (Dissolution Tester) Disintegration (Disintegration Tester)
Water Determination (Karl Fischer) Water Determination (NIR)
Microbial Quality (Microbiology) Not Tested routinely - due to process capability and understanding
Assay / CU (HPLC)
Note: Real Time Release Testing does not mean less testing!
24
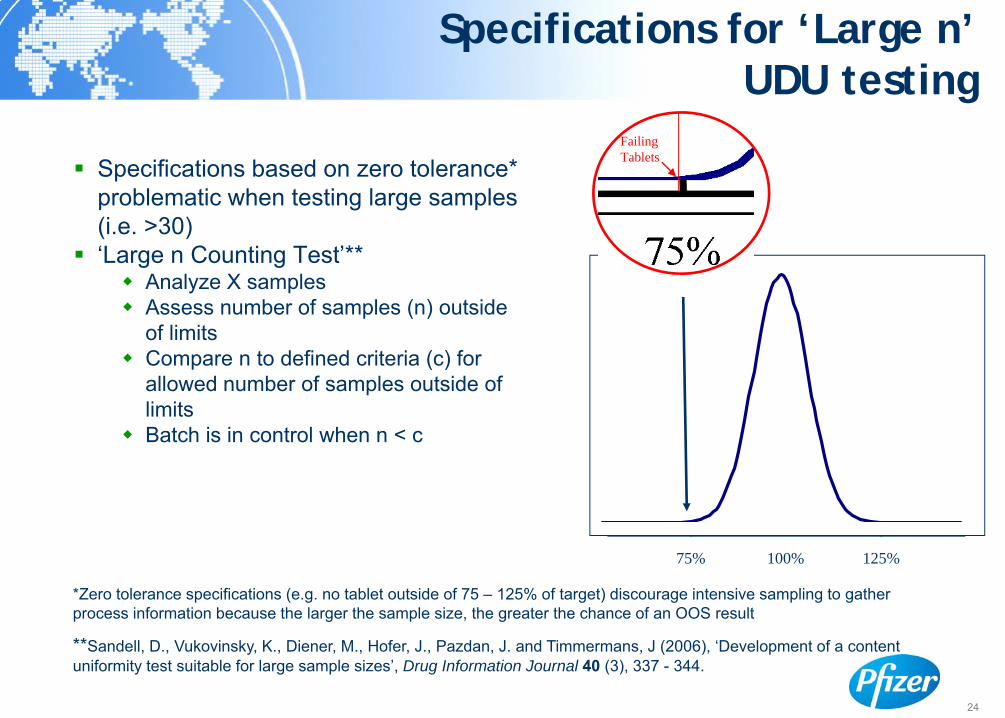
Specifications for ‘Large n’ UDU testing
Specifications based on zero tolerance* problematic when testing large samples (i.e. >30)‘Large n Counting Test’**
Analyze X samplesAssess number of samples (n) outside of limitsCompare n to defined criteria (c) for allowed number of samples outside of limitsBatch is in control when n < c
*Zero tolerance specifications (e.g. no tablet outside of 75 – 125% of target) discourage intensive sampling to gather process information because the larger the sample size, the greater the chance of an OOS result
**Sandell, D., Vukovinsky, K., Diener, M., Hofer, J., Pazdan, J. and Timmermans, J (2006), ‘Development of a content uniformity test suitable for large sample sizes’, Drug Information Journal 40 (3), 337 - 344.
100%75% 125%
Failing Tablets

25
Product Y - Sampling
Sampling plan for TabletsOC curves used to assess performance of sampling plans‘Large n Counting Test’ adoptedTablets samples taken using stratified sampling plan across batchTablets samples taken at minimum of P points during compression runMinimum of Q tablet samples taken
Drug Content of TabletsTablet is assayedNIR for drug concentration and weight measured on the same tablet

26
31302928272625242322212019181716151413121110987654321
6,5
6,0
5,5
5,0
4,5
4,0
3,5
Location Number
CU S
ingl
e V
alue
s
3,75
6,25
4,25
5,75
Boxplot of CU in batch 810467400XXXXXXXXX
Product Y – Sampling for Content Uniformity
125%
115%
473523118864c
1000750500250200183150100n
‘Large n Counting Test’ Criteria
n = number of tablets sampledc = acceptable number of tablets outside 85% to 115%
‘Large n counting test’:
-- accounts for possibility of tablets outside 85% to 115% when collecting large samples

27
Chemometric Model Maintenance and Update
Periodic Evaluation of Applicability of NIR Model used for UDUNIR model evaluated with every batch (system suitability)Annual evaluation of model
Updating the ModelMechanism - Internal change control procedures used to identify material or process changes with potential to impact the NIR modelNIR measurements may not be valid
Operation outside NIR model limitsNew variability in materials and/or process Fall-back: reference HPLC method used for batch release
Assessment for model update:No impact:
– New variability is unrelated to active (i.e. not significant in the regression coefficients) or is compensated for by model parameters.
– Update model (without changes) to include robustness to this new variability Impact:
– Update the model e.g. include new variability within the model or optimize calibration model parameters
28
RTRt - Training
Quality by Design TrainingGeneral conceptsSite-wide training Culture change?
Quality SystemQuality System Elements revised
DeviationsChange ManagementValidationKnowledge Management
Training on revised SOPs
29
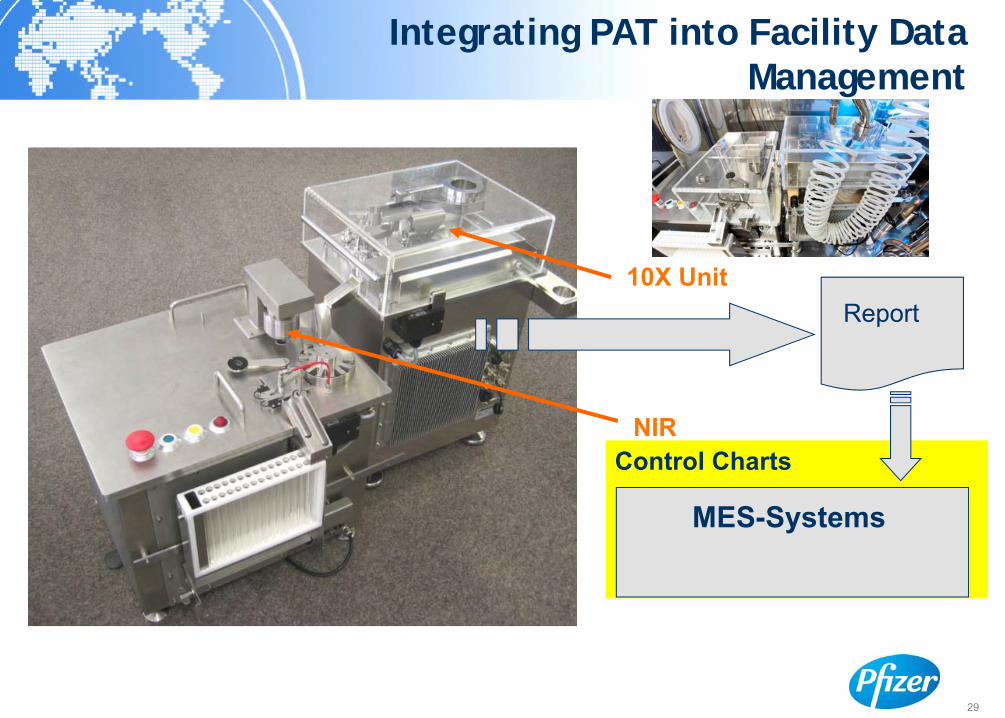
Control Charts
Integrating PAT into Facility Data Management
10X Unit
NIR
Report
MES-Systems
30
Batch Disposition
Batch dispositionBatch disposition process and decision to accept or reject the batch is still needed when RTRt is used (Ref. ICH IWG Q&A)
Batch disposition decision may be facilitated byUse of electronic batch records and exception reporting systems (flag deviations) to provide information in real timeProduct/process monitoring systems (e.g. Statistical Process Control) can provide real time assessment of process performance
Certificate of AnalysisValues from online testing reportedTests not routinely performed: ‘Would comply if tested’
Impact on Qualified Person / Quality Release personRelease process essentially unchanged with RTRtNeed to understand systems supporting the disposition decision
31
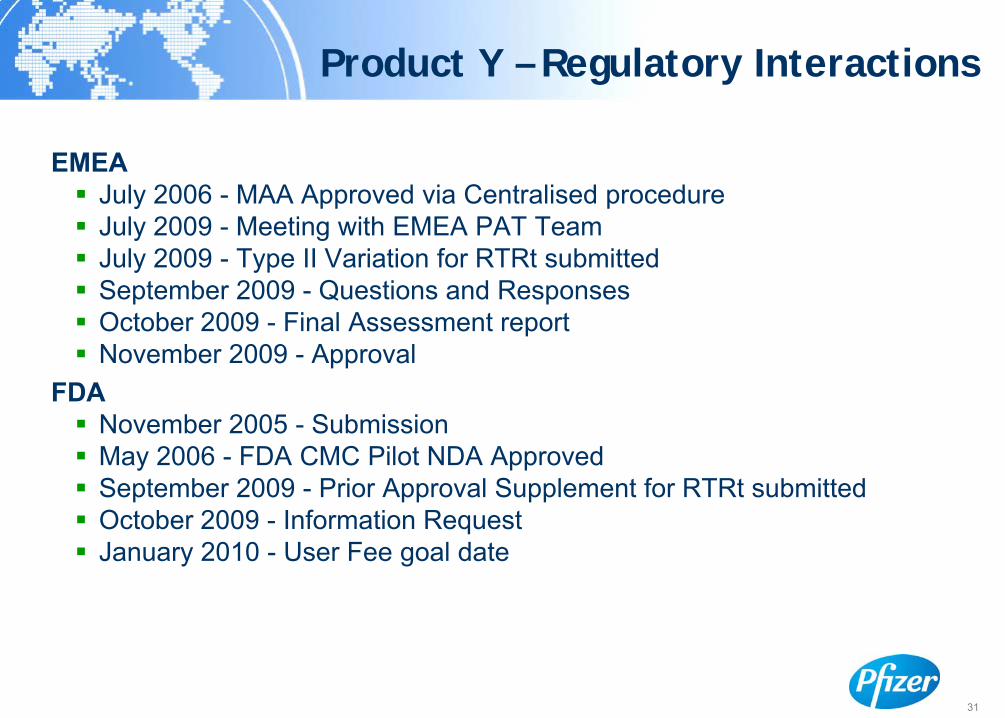
Product Y – Regulatory Interactions
EMEAJuly 2006 - MAA Approved via Centralised procedureJuly 2009 - Meeting with EMEA PAT TeamJuly 2009 - Type II Variation for RTRt submittedSeptember 2009 - Questions and ResponsesOctober 2009 - Final Assessment reportNovember 2009 - Approval
FDANovember 2005 - SubmissionMay 2006 - FDA CMC Pilot NDA Approved September 2009 - Prior Approval Supplement for RTRt submittedOctober 2009 - Information RequestJanuary 2010 - User Fee goal date

32
Overview
What needs to be considered when implementing Real Time Release Testing?
Case Study 1 – Product X
Case Study 2 – Product Y
Comparison of some aspects of Product X and Y
Conclusions
33
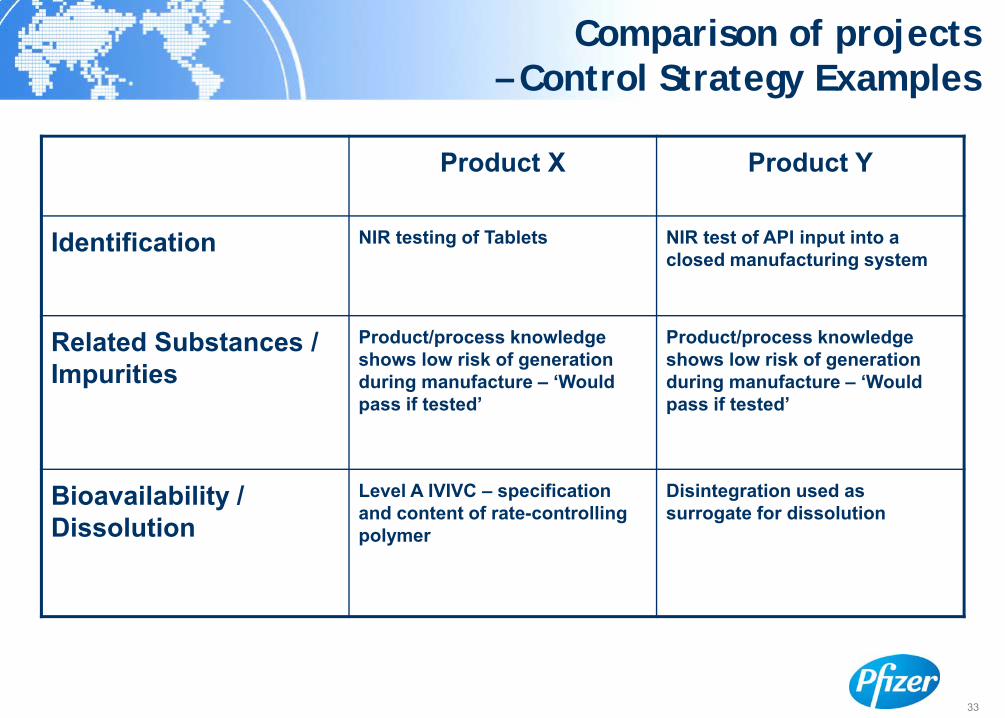
Comparison of projects – Control Strategy Examples
Product X Product Y
Identification NIR testing of Tablets NIR test of API input into a closed manufacturing system
Related Substances / Impurities
Product/process knowledge shows low risk of generation during manufacture – ‘Would pass if tested’
Product/process knowledge shows low risk of generation during manufacture – ‘Would pass if tested’
Bioavailability / Dissolution
Level A IVIVC – specification and content of rate-controlling polymer
Disintegration used as surrogate for dissolution

34
Comparison of Projects – Common Features
ScienceExtensive use of PAT systems for online monitoring and controlOperational Characteristic curves used to assess relationship between online testing and conventional end-product testing
Sampling plans different
Quality SystemsEvolution, not revolution, of existing quality systemsUse of Quality Risk Management
RegulatoryProducts approved with more conventional end-product testing focussed control strategiesReal Time Release Testing introduced via Variation to Marketing Authorisation

35
35
Challenges and Opportunities -1
ResourcesCross-functional / multi-disciplinary team necessary for successful implementation of Real Time Release testingIncreased need for statistics, control engineering etc. skills for successful PAT implementationCulture/mindset challenges (proactive versus reactive quality) Initial capital commitment is needed for PAT equipment
Quality Systems DevelopmentRobust change management systems necessary Quality risk management
e.g. Need systems in place for PAT equipment failureImpact to QP/ Q release person
Understand control strategy, quality systems etc.

36
Challenges and Opportunities -2
Regulatory challenges Acceptance of alternative sampling plans to pharmacopoeial plansGlobal acceptance of RTRt and harmonization?
BenefitsLower manufacturing costs
Improved yieldsFewer deviations and/or rejectsReduced QC resources
Faster cycle timesIncreased assurance of quality for our patients

37
Overview
What needs to be considered when implementing Real Time Release Testing?
Case Study 1 – Product X
Case Study 2 – Product Y
Comparison of some aspects of Product X and Y
Conclusions

38
Conclusions - 1
Multiple approaches to achieve RTRt are possibleRTRt does not mean less testingRTRt may be applied to new or existing products
RTRt and Quality by Design (QbD)RTRt is a possible outcome of QbD developmentQbD may not be necessary for RTRt
RTRt implementation is supported byProduct and process understandingQuality Risk ManagementA robust control strategy (including PAT and appropriate sampling plan)Science and risk-based quality systems aligned with ICH Q10Discussions with the Regulatory Agencies prior to submissions

39
Conclusions - 2
RTRt and Quality SystemsEvolution, not revolution, of quality systems to enable RTRtPre-define responses to deviations and failures
RTRt benefits may includeLower manufacturing costs and cycle timesImproved yields through less wasteIncreased assurance of quality for our patients
40
40
Acknowledgements
Ferdinando AspesiChunsheng CaiCarlos Conde-ReyesPlinio Delos-SantosParimal DesaiNirdosh JagotaCarl Longfellow Steve SimmonsShailesh SinghMerlin Utter T.G. Venkateshwaran Dom Ventura
John GroskophThomas KatzschnerRoger NosalKarl RedlMark SmithJohn O’Sullivan
Top Related