


Languages
Pages
Legal


http://www.worldbank.org/en/publication/wdr2018

Kenya, Tanzania, and Uganda
“The name of the dog is Puppy”
Grade 3
Could understand
Source: Uwezo (2014).

Kenya, Tanzania, and Uganda
Could not understand
“The name of the dog is Puppy”
Grade 3
Source: Uwezo 2014.

Rural India
4617
?Could not solve
_
Grade 3Source: ASER Centre (2017)

Rural India
4617
?Grade 5Could not solve
_
Source: ASER Centre (2017)

South Africa
Could not understand
“He had an old dog named Jack”
Who is Jack?
Grade 4
Source: IEA (2012)

South Africa
Could not pass a simple English test
English Secondary Language Students
Grade 5
Source: Draper and Spaull (2015)
Brazil
2000 2010 2020 2030 2040 2050 2060 2070 2080 2090 2100
Progress in Math (PISA 15 year olds)
Source: OECD (various years)

Brazil
Time to reach OECD average in Math (PISA 15 year olds)
2000 2010 2020 2030 2040 2050 2060 2070 2080 2090 2100
75 years
OECD average
Source: OECD (various years)

Brazil
Time to reach OECD average in Math and Reading (PISA 15 year olds)
2000 2010 2020 2030 2040 2050 2060 2070 2080 2090 2100
>260 years
OECD average
Source: OECD (various years)

Education has great promise,
but too often it doesn’t deliver
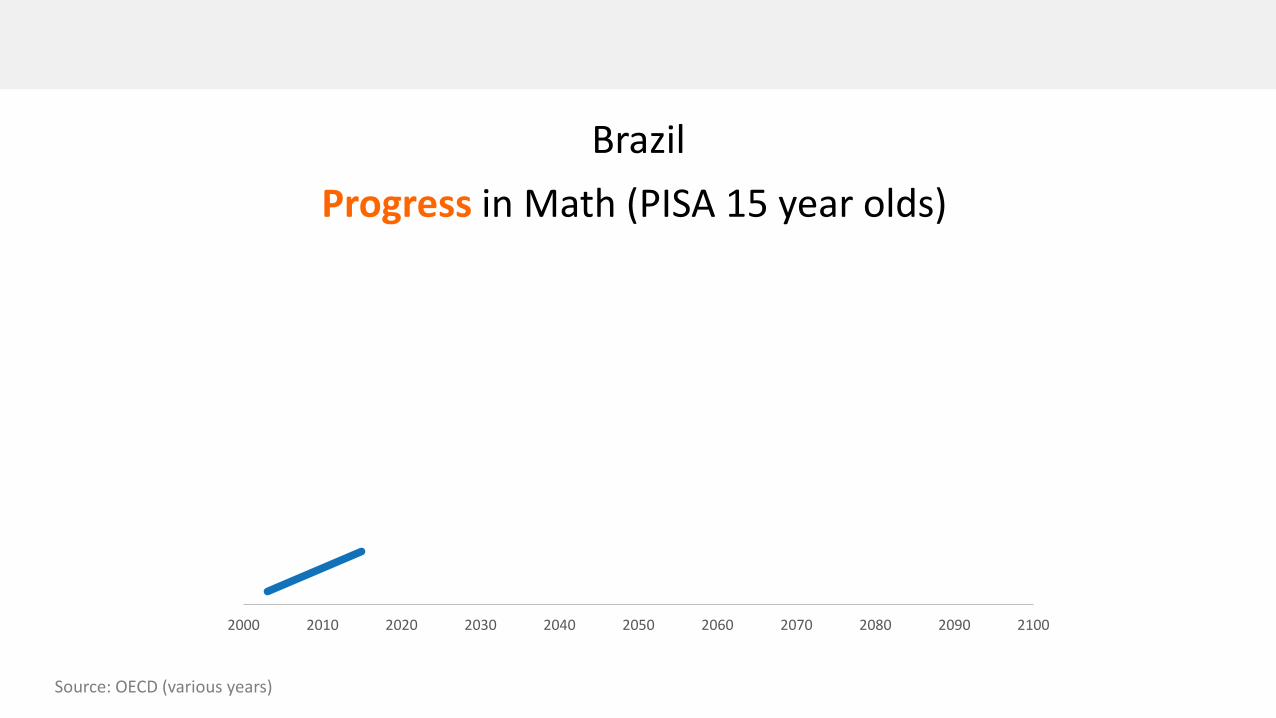
The learning process
Teachers are one of the key ingredients
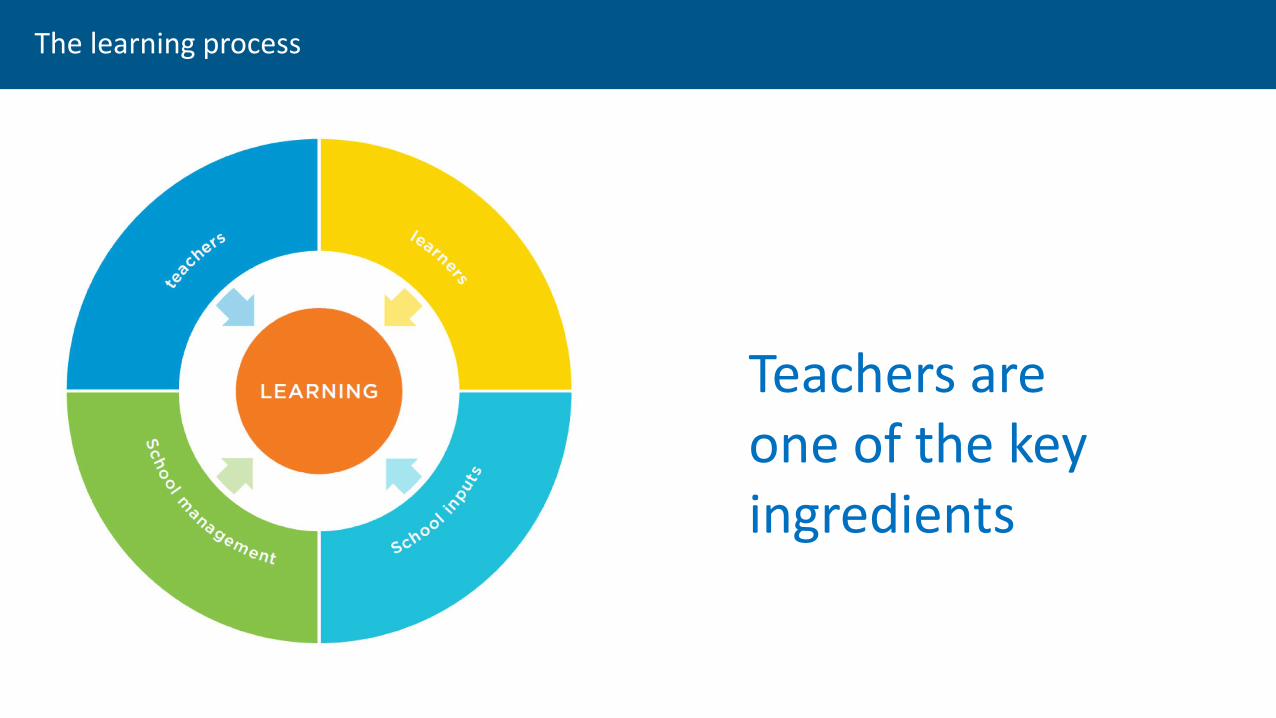
Good teachers matter
0
0.1
0.2
0.3
0.4
0.5
0.6
0.7
0.8
0.9
1
Ecuador US (low) Uganda Pakistan US (high) India
Stan
dar
d D
evia
tio
ns
Moving from a 10th percentile teacher to a 90th percentile teacher would increase learning by…
Source: Buhl-Wiggers et al. 2017; Bau & Das 2017

The most effective interventions work through teachers
Language: 0.23Math: 0.14
Language: 0.12Math: 0.09
Language: 0.01Math: 0.02
Language: -0.01Math: 0.01
Structured pedagogy
Community-based
monitoring
Computer-assisted learning School-based management
Source: Snilstveit et al. 2016
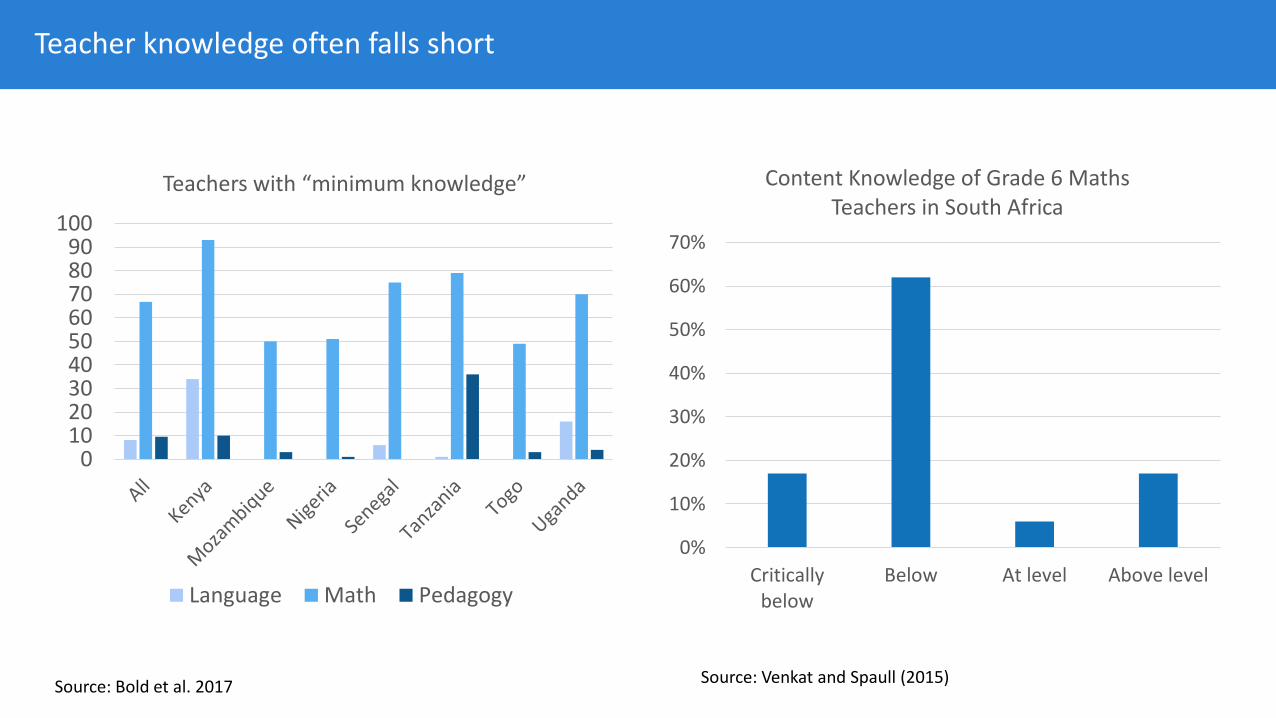
Teacher knowledge often falls short
0102030405060708090
100
Teachers with “minimum knowledge”
Language Math Pedagogy
Source: Bold et al. 2017
0%
10%
20%
30%
40%
50%
60%
70%
Criticallybelow
Below At level Above level
Content Knowledge of Grade 6 Maths Teachers in South Africa
Source: Venkat and Spaull (2015)

Teacher performance also can disappoint
Source: Bold et al. 2017
0
10
20
30
40
50
60
All Kenya Mozambique Nigeria Senegal Tanzania Togo Uganda
Teacher absence from school and from class
Absence from school Absence from class

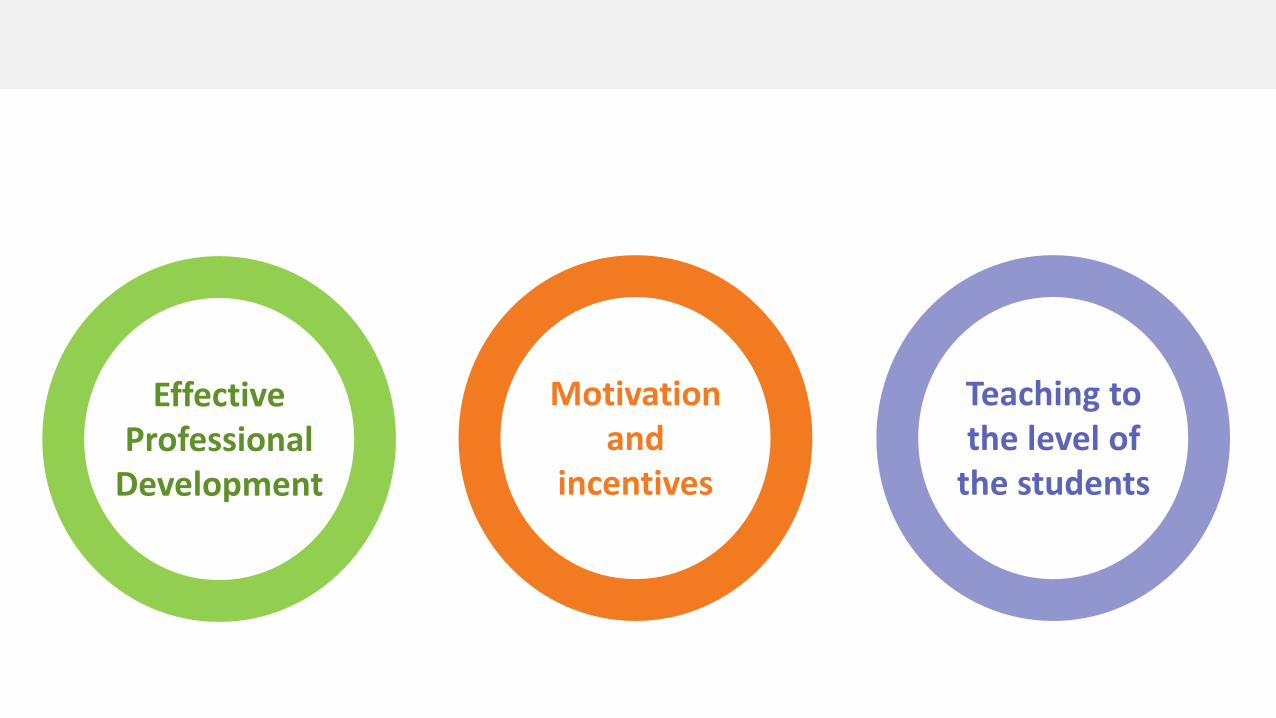
Effective Professional
Development
Motivation and
incentives
Teaching to the level of
the students
How to get the most out of your teachers?

Effective Professional
Development

Training is taking place
Source: TALIS (2013)
No , 36%
Yes, undefined , 18%
Yes, 1 to 5 days , 21%
Yes, 10 or more days,
24%
Did you participate in professional development in the last 12 months?
(OECD sample)
Are teachers required to participate in professional development?
(Sample of middle- and low-income countries)
70 80 90 100
Chile
France
Japan
Spain
Norway
Cyprus
Israel
UAE
Netherlands
International average
Croatia
Singapore
Source: Evans and Yuan 2017, based on SABER Teachers (2017)

Most goes unevaluated
Source: Popova et al. (2017)
0%
10%
20%
30%
40%
50%
60%
Teacherknowledge
Teacherbehavior
Studentlearning
No evaluation
HOW OFTEN ARE MAJOR TEACHER PROFESSIONAL DEVELOPMENT PROGRAMS EVALUATED?
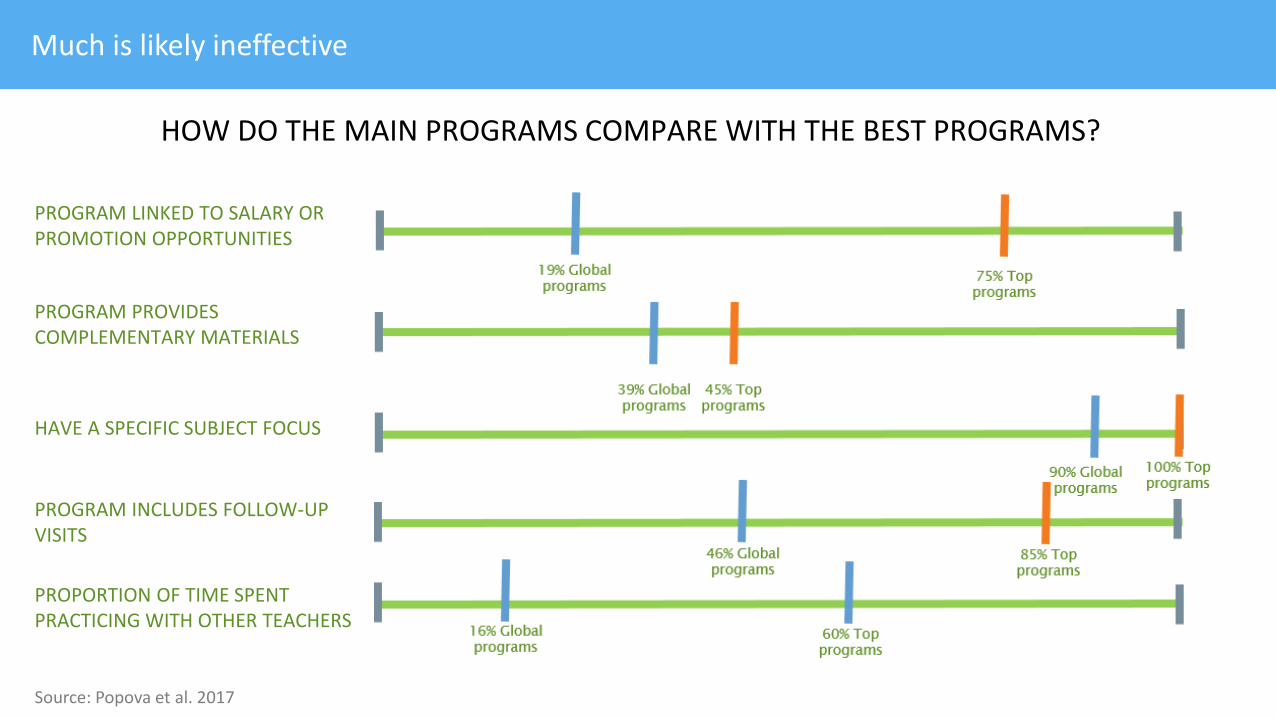
Much is likely ineffective
PROGRAM LINKED TO SALARY OR PROMOTION OPPORTUNITIES
PROGRAM PROVIDES COMPLEMENTARY MATERIALS
HAVE A SPECIFIC SUBJECT FOCUS
PROGRAM INCLUDES FOLLOW-UP VISITS
PROPORTION OF TIME SPENT PRACTICING WITH OTHER TEACHERS
HOW DO THE MAIN PROGRAMS COMPARE WITH THE BEST PROGRAMS?
Source: Popova et al. 2017

Effective Professional
Development
• Individualized, repeated training • India: Little pre-service but repeated follow-up
(Banerjee et al. 2007)
• Uganda: Regular mentoring for early grade reading (Lucas et al. 2014)
• Associated with a specific task• Chile: Lead reading groups (Cabezas et al. 2011)
• India: Storybooks and flash cards (He et al. 2009)
• Follow-up in schools: coaching & mentoring
There are approaches that work
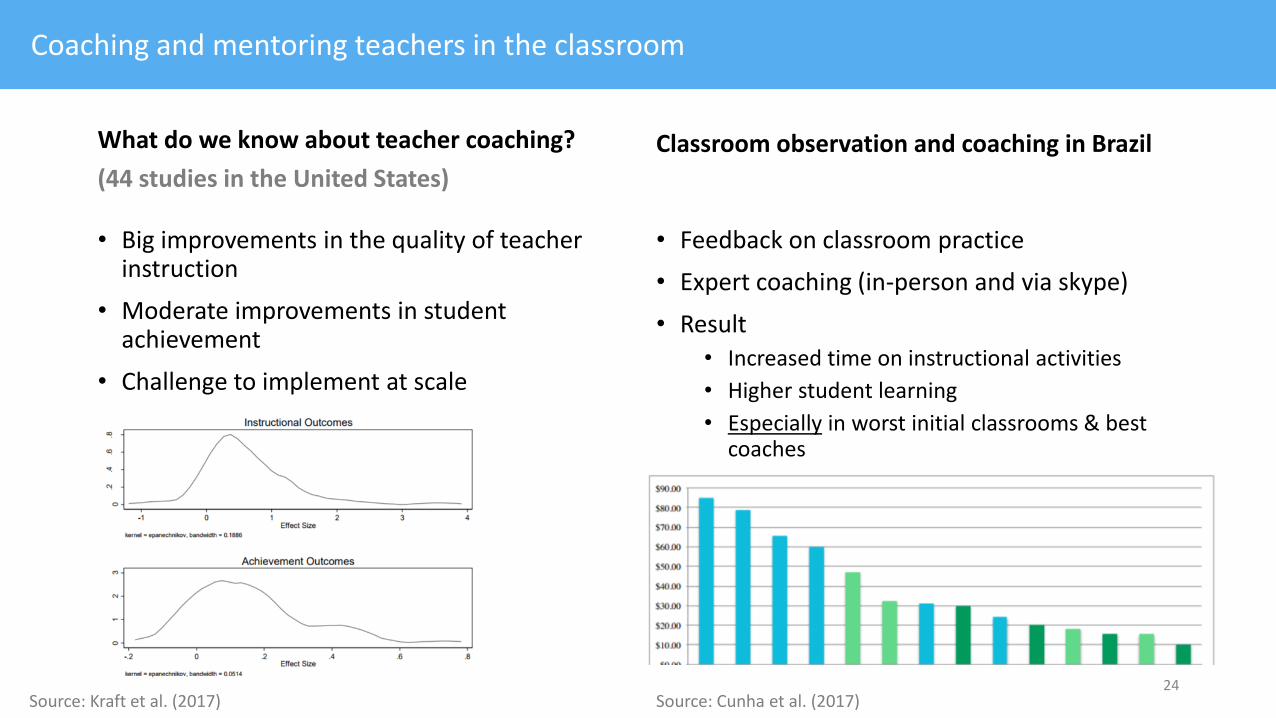
What do we know about teacher coaching?
(44 studies in the United States)
• Big improvements in the quality of teacher instruction
• Moderate improvements in student achievement
• Challenge to implement at scale
Classroom observation and coaching in Brazil
• Feedback on classroom practice
• Expert coaching (in-person and via skype)
• Result• Increased time on instructional activities
• Higher student learning
• Especially in worst initial classrooms & best coaches
24
Coaching and mentoring teachers in the classroom
Source: Kraft et al. (2017) Source: Cunha et al. (2017)

Motivation and
incentives
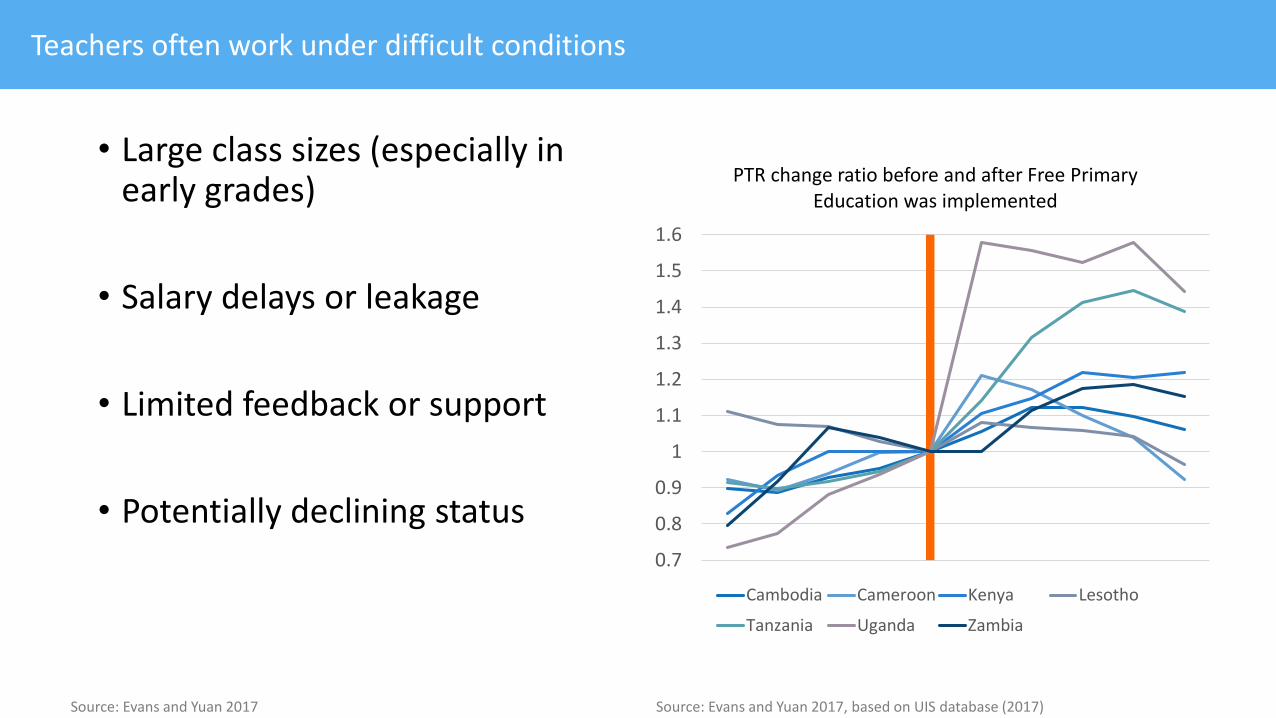
Teachers often work under difficult conditions
0.7
0.8
0.9
1
1.1
1.2
1.3
1.4
1.5
1.6
PTR change ratio before and after Free Primary Education was implemented
Cambodia Cameroon Kenya Lesotho
Tanzania Uganda Zambia
Source: Evans and Yuan 2017, based on UIS database (2017)Source: Evans and Yuan 2017
• Large class sizes (especially in early grades)
• Salary delays or leakage
• Limited feedback or support
• Potentially declining status

Accountability comes in many forms
Source: Gill et al. 2016
Forms of Teacher Accountability
Outcome-based Rule-based Market-based Professional
Classroom windows
Public reporting of schoolwide test results
Minimum certification requirements
School ratings by local news media
Peer observation
Charter-school enrollment fairs
Coaching
Value-added incorporated in teacher
evaluations
Formal observation by principal
Advanced certification

Motivation and incentives can be strengthened
Motivation and
incentives
• Low-stakes report cards• Effective
• Pakistan: Whole market
• Mexico: Low stakes
• Uganda: Participatory vs standard
• Ineffective:
• Kenya: Student-only
• Financial incentives (but only if teachers know how to improve)• Positive in India• Conditional in Tanzania• Weak in USA
• Professionalization (Finland, Singapore)
Sources: Pakistan (Andrabi et al. 2017), Mexico (de Hoyos et al. 2015), Uganda (Zeitlin et al. 2011), Kenya (Lieberman et al. 2013)
Sources: India (Muralidharan & Sundararaman 2011; Muralidharan 2012), Tanzania (Mbiti et al. 2015), USA (Fryer 2013; Glazerman et al. 2009; Springer et al. 2010)

Teaching to the level of
the students

Only a small fraction of learners keep up with the curriculum
Probability of a correct answer on a math test, by grade,relative to curriculum standards, Andhra Pradesh, India
Grade
Source: WDR 2018 team, using data from Muralidharan and Zieleniak (2013).
Why?
• High performers are easier to teach
• Ambitious curricula

Helping teachers teach to the level of the students
Teaching to the level of
the students
• Diagnostics• Liberia, Malawi, Rwanda
• Not India
• Grouping• Kenya (Duflo et al. 2011)
• India (Banerjee et al. 2016)
• Remedial teaching• Ghana• India (camps, community
teachers)
• Dynamic ICT• India
Sources: Liberia (Piper & Korda 2010), Malawi (Bolyard 2003), Rwanda (Friedlander & Goldberg 2016), India (Duflo et al. 2014; Muralidharan & Sundararaman 2010), Kenya (Duflo et al. 2011), India (Banerjee et al. 2016), Ghana (Kiessel & Duflo 2014), India (Banerjee et al. 2007, 2016), India (Muralidharan et al. 2017)
Effective Professional
Development
Motivation and
incentives
Teaching to the level of
the students

Top Related