


Languages
Pages
Legal


Potential Savings from Biosimilars in Canada
2
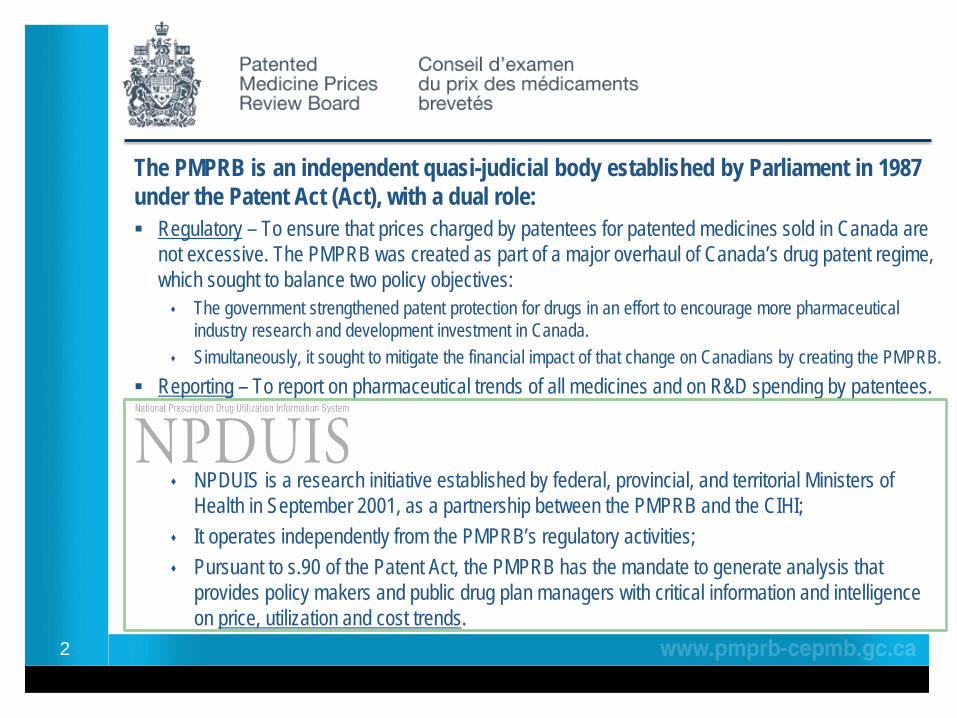
The PMPRB is an independent quasi-judicial body established by Parliament in 1987 under the Patent Act (Act), with a dual role: Regulatory – To ensure that prices charged by patentees for patented medicines sold in Canada are
not excessive. The PMPRB was created as part of a major overhaul of Canada’s drug patent regime, which sought to balance two policy objectives: The government strengthened patent protection for drugs in an effort to encourage more pharmaceutical
industry research and development investment in Canada. Simultaneously, it sought to mitigate the financial impact of that change on Canadians by creating the PMPRB.
Reporting – To report on pharmaceutical trends of all medicines and on R&D spending by patentees.
NPDUIS is a research initiative established by federal, provincial, and territorial Ministers of Health in September 2001, as a partnership between the PMPRB and the CIHI;
It operates independently from the PMPRB’s regulatory activities; Pursuant to s.90 of the Patent Act, the PMPRB has the mandate to generate analysis that
provides policy makers and public drug plan managers with critical information and intelligence on price, utilization and cost trends.

PMPRB analytical reporting on biologics and biosimilars Under the NPDUIS banner and at the request of the
jurisdictions participating in the NPDUIS initiative:
3
Available at: http://www.pmprb-cepmb.gc.ca/en/npduis/analytical-studies

C. Biosimilars savings Are a function of:
1. Importance of drugs (e.g. sales) Biologics with larger sales have a greater
biosimilar saving potential 2. Timing of biosimilar market entry Earlier market entry allows for the savings to be
realized sooner 3. Biosimilar uptake (e.g. use)
4. Price discount Greater price discount Greater saving potential
4
Molecule
2016 Canadian
sales
Infliximab $ 1,008M
Adalimumab $ 649M
Etanercept $ 337M
Ranibizumab $ 337M
Insulin glargine $ 259M
Trastuzumab $ 251M
Rituximab $ 241M
Filgrastim $ 128M
Omalizumab $ 106M
Bevacizumab $ 104M
Epoetin alfa $ 99M
Natalizumab $ 50M
Follitropin alfa $ 14M
Increased market penetration of the biosimilar = Greater saving
potential
= Source: MIDAS™ Database, IMS AG. All rights reserved
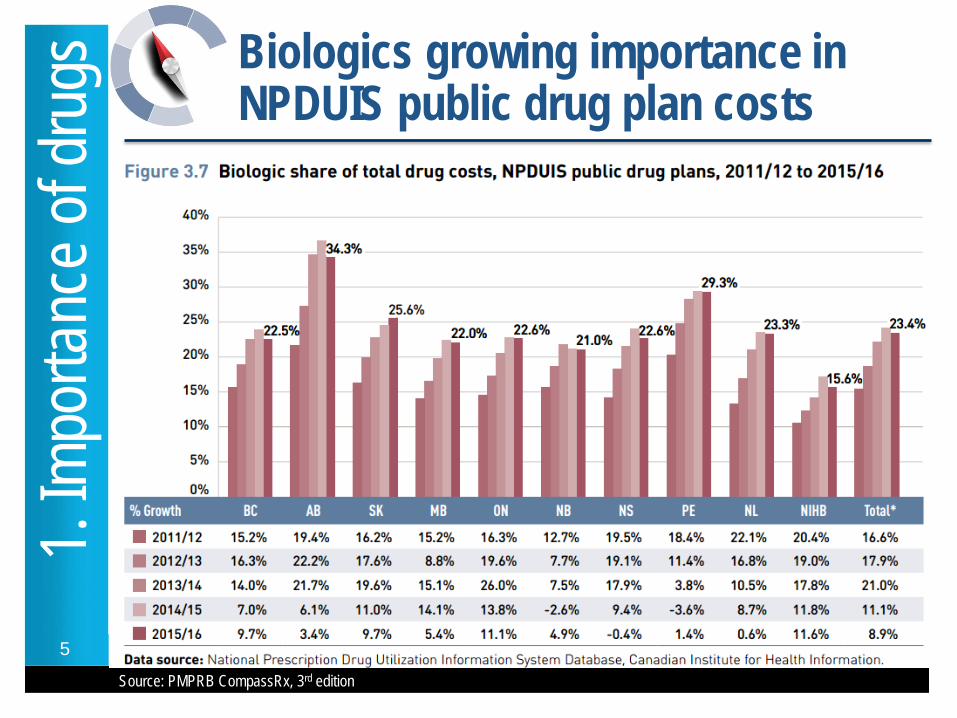
Biologics growing importance in NPDUIS public drug plan costs
5
Source: PMPRB CompassRx, 3rd edition
1. Im
porta
nce o
f dru
gs
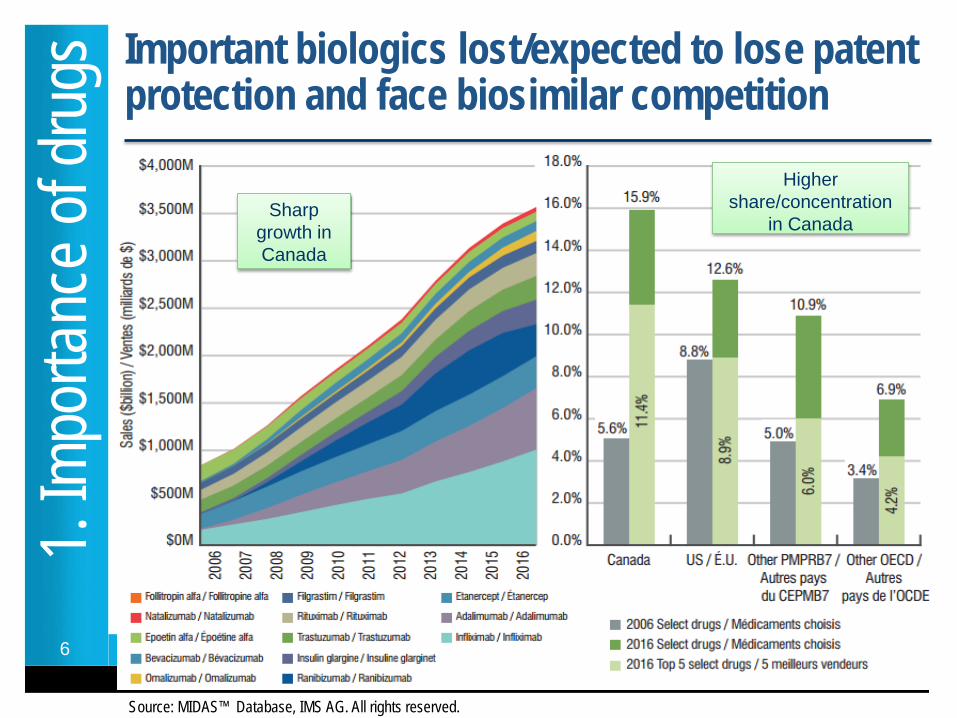
Important biologics lost/expected to lose patent protection and face biosimilar competition
6
Sharp growth in Canada
Higher share/concentration
in Canada
1. Im
porta
nce o
f dru
gs
Source: MIDAS™ Database, IMS AG. All rights reserved.
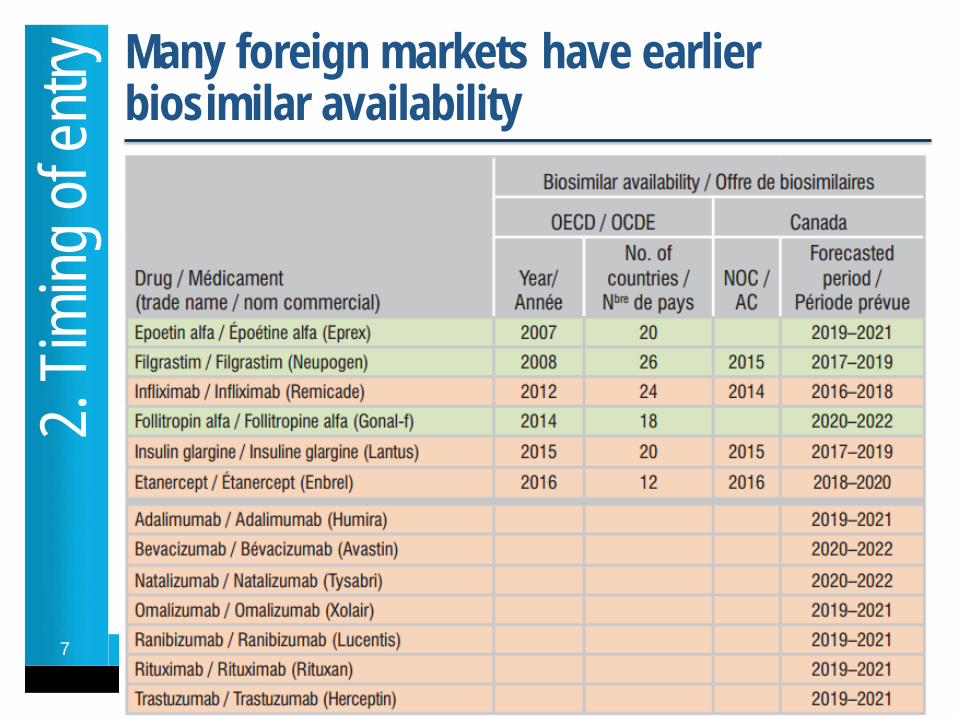
Many foreign markets have earlier biosimilar availability
7
2. Tim
ing of
entry

Reference price – biosimilar price The infliximab experience
8
47%
3. Bi
osim
ilar d
iscou
nt
Source: Market Intelligence Report: Biologic Response Modifier Agents, 2015, PMPRB, NPDUIS

Greater biosimilar discounts would bring Canadian prices in line with OECD medians
9
3. Bi
osim
ilar d
iscou
nt
Source: MIDAS™ Database, Q4-2015, IMS AG. All rights reserved.
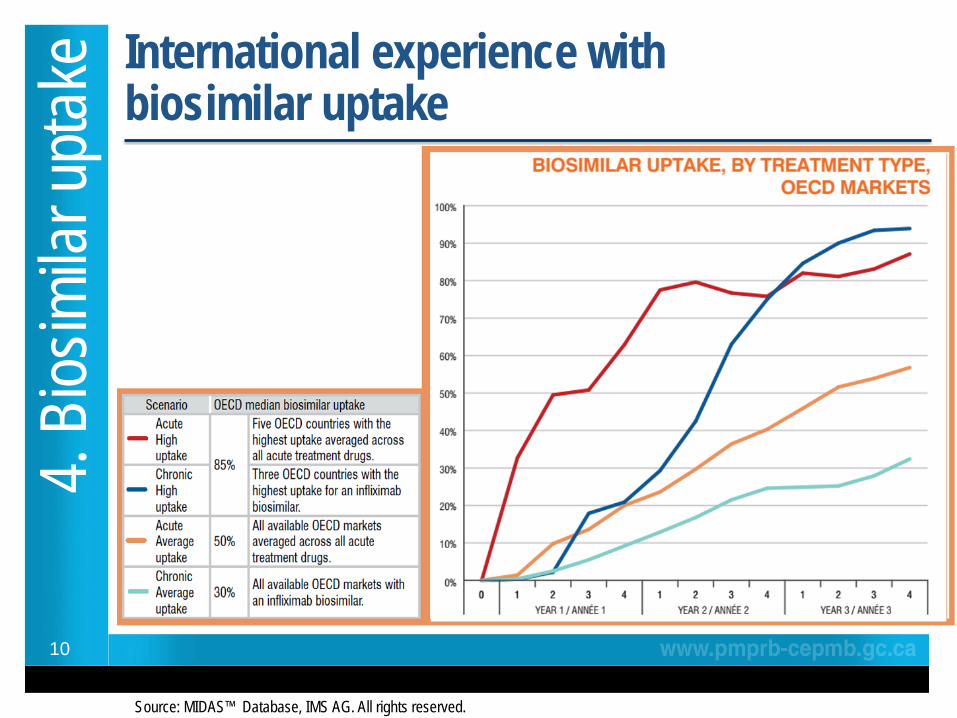
International experience with biosimilar uptake
10
4. Bi
osim
ilar u
ptake
Source: MIDAS™ Database, IMS AG. All rights reserved.
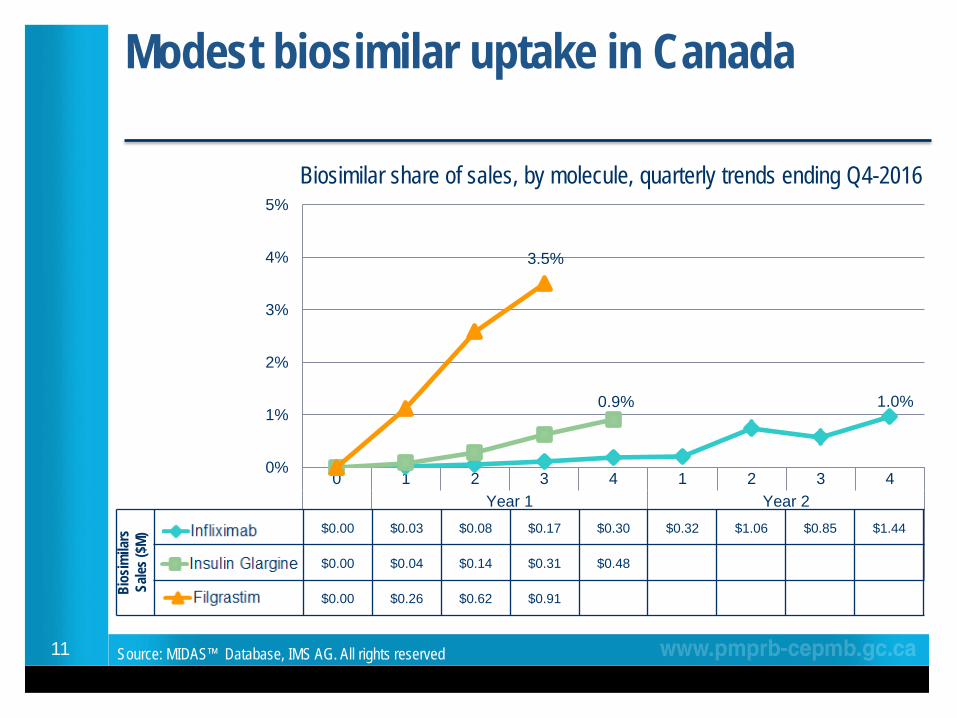
Modest biosimilar uptake in Canada
11
0 1 2 3 4 1 2 3 4Year 1 Year 2
Infliximab 0.0% 0.0% 0.1% 0.1% 0.2% 0.2% 0.7% 0.6% 1.0%Insulin Glargine 0.0% 0.1% 0.3% 0.6% 0.9%Filgrastim 0.0% 1.1% 2.6% 3.5%
1.0% 0.9%
3.5%
0%
1%
2%
3%
4%
5%
Source: MIDAS™ Database, IMS AG. All rights reserved
$0.00 $0.03 $0.08 $0.17 $0.30 $0.32 $1.06 $0.85 $1.44
$0.00 $0.04 $0.14 $0.31 $0.48
$0.00 $0.26 $0.62 $0.91 Bios
imila
rs
Sales
($M)
Biosimilar share of sales, by molecule, quarterly trends ending Q4-2016
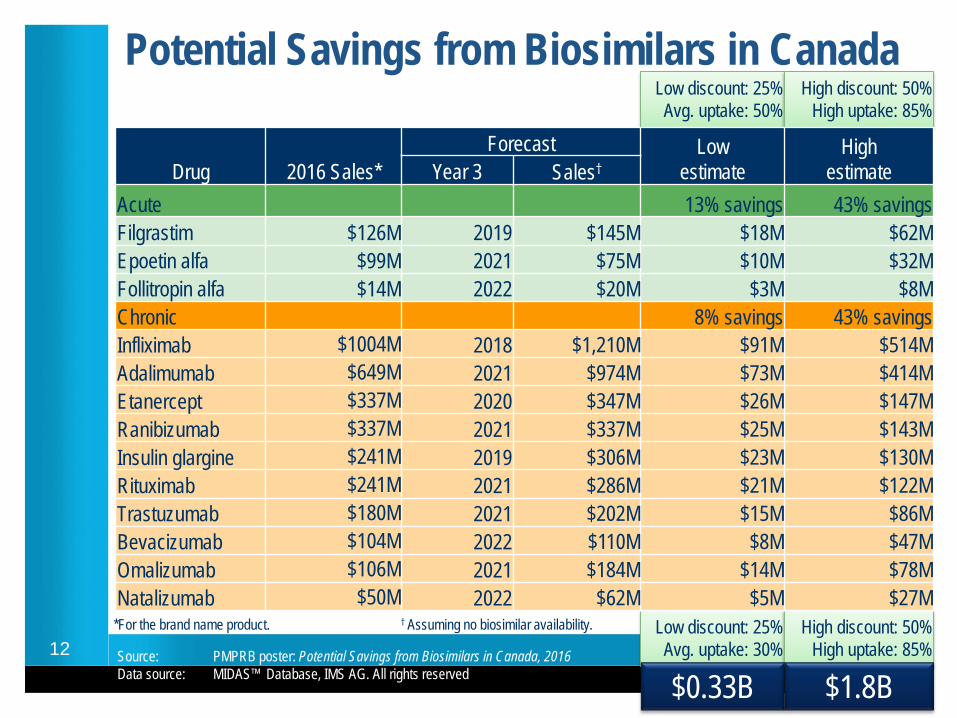
Potential Savings from Biosimilars in Canada
12
Low discount: 25% Avg. uptake: 50%
High discount: 50% High uptake: 85%
Low discount: 25% Avg. uptake: 30%
High discount: 50% High uptake: 85%
Drug 2016 Sales* Forecast Low
estimate High
estimate Year 3 Sales†
Acute 13% savings 43% savings Filgrastim $126M 2019 $145M $18M $62M Epoetin alfa $99M 2021 $75M $10M $32M Follitropin alfa $14M 2022 $20M $3M $8M Chronic 8% savings 43% savings Infliximab $1004M 2018 $1,210M $91M $514M Adalimumab $649M 2021 $974M $73M $414M Etanercept $337M 2020 $347M $26M $147M Ranibizumab $337M 2021 $337M $25M $143M Insulin glargine $241M 2019 $306M $23M $130M Rituximab $241M 2021 $286M $21M $122M Trastuzumab $180M 2021 $202M $15M $86M Bevacizumab $104M 2022 $110M $8M $47M Omalizumab $106M 2021 $184M $14M $78M Natalizumab $50M 2022 $62M $5M $27M
*For the brand name product. † Assuming no biosimilar availability.
Source: PMPRB poster: Potential Savings from Biosimilars in Canada, 2016 Data source: MIDAS™ Database, IMS AG. All rights reserved $0.33B $1.8B
13
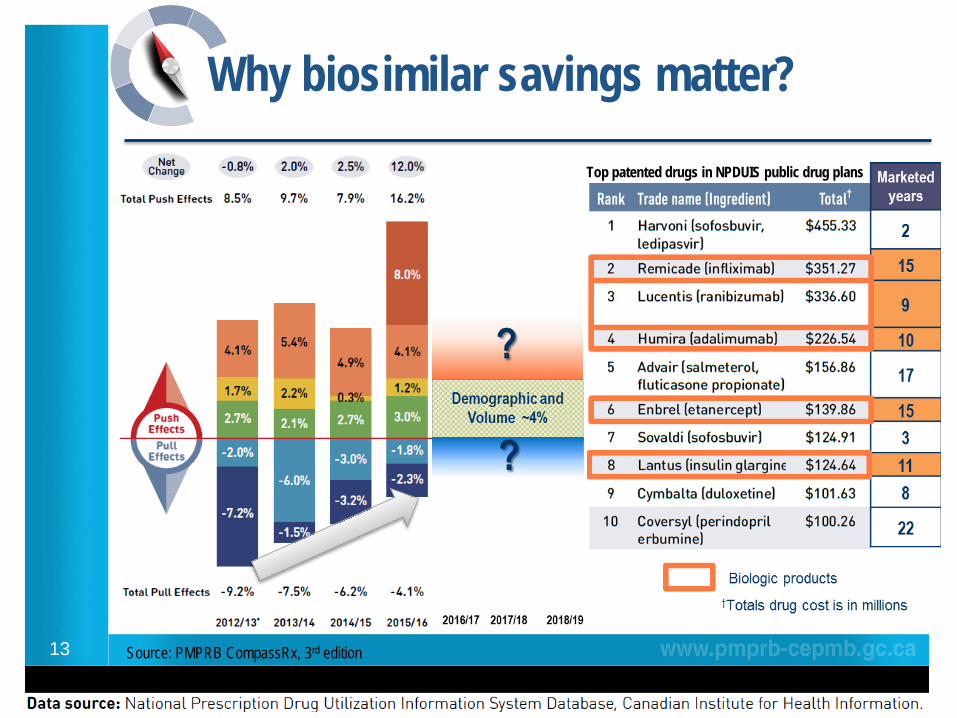
Why biosimilar savings matter?
Source: PMPRB CompassRx, 3rd edition
Top patented drugs in NPDUIS public drug plans

Conclusions A. Pharmaceutical cycle
Beyond patent protection period, drug spending on branded products may mean lost opportunities to fund newer treatment options.
B. Canada’s experience with biologics The relatively higher use of biologics in Canada means Canadians have the most to
gain from potential biosimilar savings. C. Biosimilars savings
Have been modest to date due to the low uptake. At current Canadian price discounts for a number of biosimilars (~25%) and average
OECD uptake (30% by 3rd year), the savings would be limited: 8% or tens of millions of dollars for top-selling biologics.
The price discount of recent biosimilars (15%-23%) has resulted in relatively higher prices in Canada (except for the biosimilar of infliximab);
Greater biosimilar discounts (30%-60%) would result in closer alignment with OECD price levels and greater saving potential;
– At the same time, greater biosimilar uptake (e.g. 85%) could results in savings as high as 43%, or hundreds of millions of dollars for top-selling biologics.
Biosimilars could offer yearly savings of $1.8 billion. 14
Top Related