


Languages
Pages
Legal


EXPORT-IMPORT BANK OF INDIA
WORKING PAPER NO. 31
POTENTIAL FOR ENhANcING INTRA-SAARc TRADE:A BRIEF ANALySIS
EXIM Bank’s Working Paper Series is an attempt to disseminate the findings of research studies carried out in the Bank. The results of research studies can interest exporters, policy makers, industrialists, export promotion agencies as well as researchers. However, views expressed do not necessarily reflect those of the Bank. While reasonable care has been taken to ensure authenticity of information and data, EXIM Bank accepts no responsibility for authenticity, accuracy or completeness of such items.
© Export-Import Bank of IndiaJune 2014


Export-Import Bank of India 3
Potential for Enhancing Intra-SAARC Trade: A Brief Analysis
cONTENTS
Page No.
List of Tables 5
List of Annexures 7
List of Charts 7
List of Exhibits 7
List of Boxes 7
Executive Summary 9
1. Economic Environment of the SAARC Region 13
2. Recent Trends in SAARC’s International Trade 16
3. Status of Intra-SAARC Trade 29
4. Potential for Enhancing Intra-SAARC Trade 35
5. Challenges and Strategies for Enhancing Intra-SAARC Trade 48
6. The Role of SAARC Development Fund 60
7. Export-Import Bank of India – A Partner in Development of the SAARC Region 64
Project Team:Mr. David Sinate, Chief General ManagerMr. Vanlalruata Fanai, Assistant General ManagerMs. Snehal Bangera, Manager


Export-Import Bank of India 5
Potential for Enhancing Intra-SAARC Trade: A Brief Analysis
LIST OF TABLES
Table No. Title Page No.
1.1 Macroeconomic Snapshot of SAARC Countries 13
1.2 Structure of SAARC’s Economy (Share in GDP, %) 14
2.1 SAARC’s Foreign Trade, 2003-2013 16
2.2 Major Commodities Traded by Afghanistan and its Major Trading Partners, 2013 21
2.3 Major Commodities Traded by Bangladesh and its Major Trading Partners, 2013 22
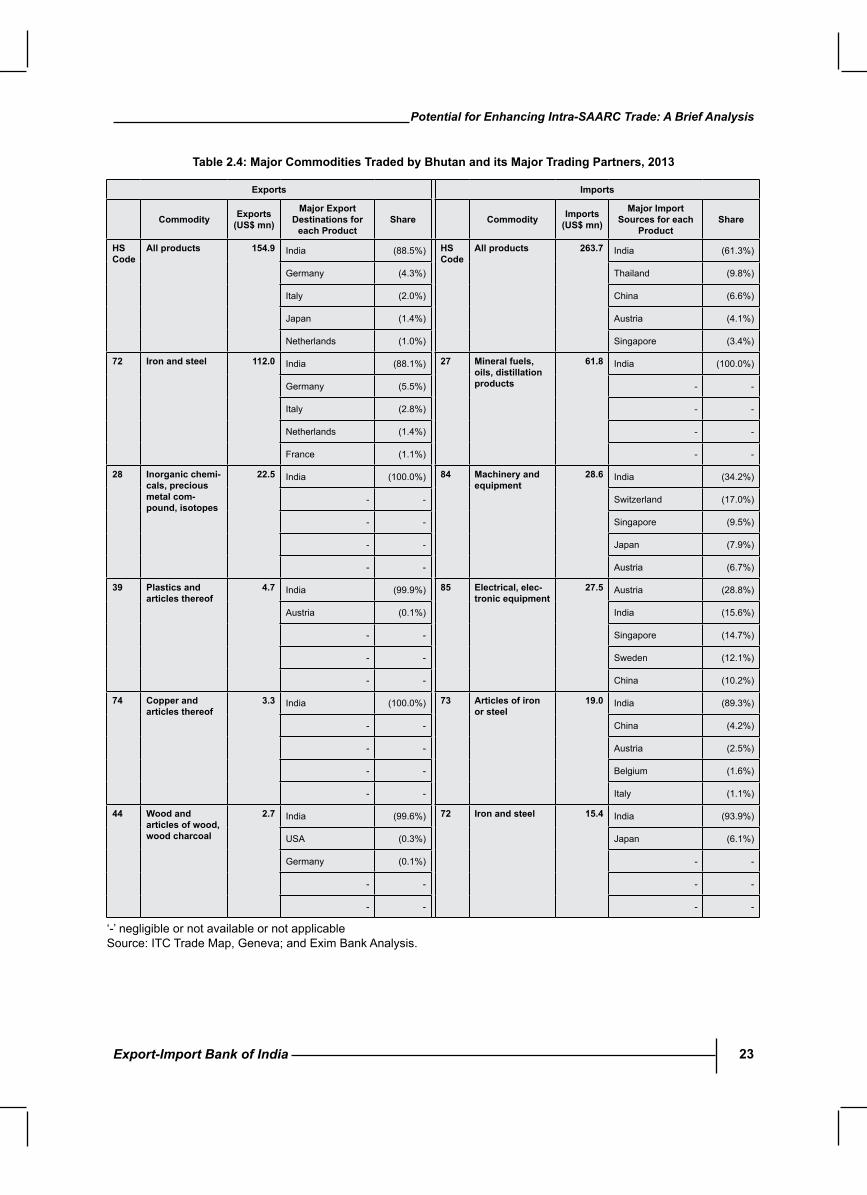
2.4 Major Commodities Traded by Bhutan and its Major Trading Partners, 2013 23
2.5 Major Commodities Traded by India and its Major Trading Partners, 2013 24
2.6 Major Commodities Traded by Maldives and its Major Trading Partners, 2013 25
2.7 Major Commodities Traded by Nepal and its Major Trading Partners, 2013 26
2.8 Major Commodities Traded by Pakistan and its Major Trading Partners, 2013 27
2.9 Major Commodities Traded by Sri Lanka and its Major Trading Partners, 2013 28
3.1 Intra-Trade of Select Regional Groups (% of total trade of the group) 29
3.2 Intra-Exports of Select Regional Groups (% of total exports of the group) 30
3.3 Intra-imports of Select Regional Groups (% of total imports of the group) 30
3.4 Intra-SAARC Trade (US$ billion) 31
3.5 Intra-SAARC Exports (US$ billion) 32
3.6 Intra-SAARC Imports (US$ billion) 32
3.7 Intra-regional Exports of SAARC countries (% of total exports of the country) 33
3.8 Intra-regional Imports of SAARC countries (% of total imports of the country) 34
3.9 Comparative Growth Dynamics of Intra-regional Trade (2006 to 2011) 34
4.1 Potential for Enhancing Bangladesh’s Exports to SAARC 36
4.2 Potential for Enhancing Sri Lanka’s Exports to SAARC 37
4.3 Potential for Enhancing Pakistan’s Exports to SAARC 39
4.4 Potential for Enhancing India’s Exports to SAARC 41
4.5 Potential for Enhancing Nepal’s Exports to SAARC 42
4.6 Potential for Enhancing Maldives’ Exports to SAARC 43
4.7 Potential for Enhancing Afghanistan’s Exports to SAARC 44

Export-Import Bank of India6
Potential for Enhancing Intra-SAARC Trade: A Brief Analysis
LIST OF TABLES
Table No. Title Page No.
5.1 Comparative Analysis of Trading Time, Cost & Documents across 49
South Asia and Select Regions, 2007, 2009, 2011 and 2013
5.2 Trading across borders: Performance of South Asia Region 51
5.3 Estimated Informal Trade with India in 2011 (US$ million) 51
5.4 Key Land Ports in Bangladesh 53
5.5 Key Border Points in Nepal 55
5.6 Key Trade Regions in Bhutan 56
6.1 Comprehensive Trade Cost among SAARC Members (%) 61
6.2 Average Comprehensive Trade Cost with SAARC (%) 62
7.1 Exim Bank’s Exposure in the SAARC region during 2004-05 to 2013-14 (` crore) 67

Export-Import Bank of India 7
Potential for Enhancing Intra-SAARC Trade: A Brief Analysis
LIST OF ANNEXuRES
LIST OF EXhIBITS
LIST OF BOXES
LIST OF chARTS
Annexure No. Title Page No.
1 Potential Export Items for Bangladesh in the SAARC region 75
2 Potential Export Items for Sri Lanka in the SAARC region 78
3 Potential Export Items for Pakistan in the SAARC region 80
4 Potential Export Items for India in the SAARC region 83
5 Potential Export Items for Nepal in the SAARC region 84
6 Potential Export Items for Maldives in the SAARC region 85
7 Potential Export Items for Afghanistan in the SAARC region 86
8. Exim Bank’s LOCs in the SAARC Region 87
Exhibit No. Title Page No.
7.1 Financing Programmes of Exim Bank of India 64
7.2 Exim Bank of India’s Global Presence (2009-10 to 2013-14) 67
Box No. Title Page No.
1 Bhutan’s Power Sector - Untapped Trade Potential 35
2 Tala Hydroelectric Project, Bhutan 69
3 Nepal Transmission Line Project 70
chart No. Title Page No.
1.1 Real GDP Growth of the SAARC Region (annual percentage change) 15
2.1 SAARC’s Global Exports (2009-2013) 17
2.2 SAARC’s Global Imports (2009-2013) 18
5.1 Doing Business Rankings for Trading Across Borders 48


Export-Import Bank of India 9
Potential for Enhancing Intra-SAARC Trade: A Brief Analysis
Regional integration has been considered as one of the most important strategies for development among countries and regions, and instrumental in promoting economic growth and development of the economy, particularly, through intra-regional trade and cross-border investment. Though the patterns of regional integration differ across regions, reducing barriers to trade between member countries remains the primary objective. Many go beyond removing intra-regional tariffs on trade in goods to removing non-tariff barriers, and even include investment.
The SAARC region is characterized by varying levels of degree of openness. Trade1 to GDP ratio for the region peaked in 2008 to 42.4 per cent, but fell drastically in 2009 to 31.8 per cent mainly due to the global financial crisis, eventually picked up in the subsequent years, and stood at 41.4 per cent by 2013. Interestingly, the smallest economies, Bhutan and Maldives, are the most open economies in the region.
Accordingly, the share of the SAARC region in global GDP also increased from 2.5 per cent in 2008 to 3.2 per cent in 2013, and is expected to increase to 3.7 per cent by 2018. India, the largest economy in the region, accounted for 79 per cent of GDP of the SAARC region in 2013, followed by Pakistan and Bangladesh, contributing around 10 per cent and 6 per cent to GDP, respectively.
While South Asia made significant progress in integrating with the global economy, integration within the region remained limited, and the region is yet to harness the beneficial effects of common cultural affinity, common geography, and the proximity advantage within the region.
The SAARC region is among the least integrated regions in the world, in terms of intra-regional
trade, cross-border investments, and exchange of ideas, among others.
To promote intra-regional trade the SAARC countries have taken various initiatives through several bilateral, regional and multilateral agreements. Several bilateral trading arrangements are also in place among members of SAARC, including, among others, India and Nepal (FTA); India and Bhutan (FTA); India and Sri Lanka (FTA); India and Afghanistan (PTA); Pakistan and Afghanistan (Transit Trade Agreement); and Pakistan and Sri Lanka (FTA).
In spite of efforts made by SAARC member nations, intra-SAARC trade remained somewhat stagnant at a modest level below 5 per cent of the total trade much below that of EU-27 (around 59 per cent), ASEAN (around 25 per cent) and CIS (around 20 per cent). While intra-regional exports (5.8 per cent of total exports from the region) stood much higher compared to intra-imports (3.4 per cent of total imports of the region), it remained below that of other trade blocs.
Analysis of trading patterns within the region reveals that nature of intra-regional trade in terms of size and direction in South Asia are quite diverse, mainly reflecting comparative sizes of the economies and their location. While some countries concentrated within the region, others traded mostly with countries outside the region. Countries like Bhutan and Nepal trade mostly with other SAARC members, while, India, Pakistan, Sri Lanka, Afghanistan, Bangladesh and Maldives trade mostly with the rest of the world.
The share of SAARC in exports of Bhutan and Nepal are 88 per cent and 64 per cent, respectively, of which, nearly 100 per cent of goods exports are directed toward India. The share of SAARC in
Executive Summary
1Trade = exports + imports

Export-Import Bank of India10
Potential for Enhancing Intra-SAARC Trade: A Brief Analysis
Afghanistan’s exports is 69 per cent in 2012 and is mainly trading with Pakistan (75 per cent in 2012) and India among the SAARC countries. The share of SAARC in the export baskets of Bangladesh (2.4 per cent in 2012), India (4.7 per cent) Sri Lanka (8.7 per cent), and Maldives (14 per cent), however, are very small as majority of their exports are towards other developing countries or western countries.
One of the objectives under the SAARC Charter is acceleration of economic growth. Cooperation in trade was identified as one of the core economic areas for SAARC Member Countries. It is interesting to note that during the post-SAFTA i.e. after 2006, there has been increasing dependence on SAARC region, both as source of imports as well as export destination, for a larger number of member countries reflecting increasing importance given to the regional market. However, intra-SAARC trade analysis reveals that though SAARC members like Bhutan, Maldives, and Nepal are highly dependent on SAARC region for their exports, they maintain a surmounting trade deficit with the region. Other countries that maintain an intra-regional trade deficit include Afghanistan, Bangladesh, and Sri Lanka. Further, given the complementarities in trade in select commodities and the locational advantage, SAARC members like India, Pakistan, Sri Lanka, Bangladesh, and Afghanistan can source their imports of such commodities from their neighbours in the SAARC region. In this regards, this paper highlights broad strategies on enhancing intra-SAARC trade.
Strategies for Enhancing Intra-SAARc Trade
l EnhancingExportoftheIdentifiedPotentialItems: The analysis attempts to highlight the potential for enhancing trade within the region by identifying commodities at the 6-digit level in which SAARC members have potential for trade within the region. Accordingly, we have estimated that if all the identified commodities
are being traded among the SAARC members to the full potential, i.e. demand for these select commodities from SAARC is met to the fullest extent possible by SAARC countries, then intra-SAARC trade would have increased by approximately 33 per cent. Thus, having focused only on the identified commodities would have increased the share of intra-SAARC trade to its global trade from the existing 4.3 per cent to approximately 5.7 per cent. In addition to focusing on these commodities, reductions in transaction costs, revision of sensitive list, and elimination/ reduction of the existing tariff and non-tariff barriers would further increase the share of intra-SAARC trade.
l Revisiting and Revising Sensitive Lists of Member countries: The analysis has also brought out select commodities in which SAARC members may consider revisiting and revising their sensitive lists for LDCs and non-LDCs. Given the existing trade complementarities in select commodities and the locational advantage, SAARC members could source their import requirements from their neighbours in the region. It is expected that this revision under SAFTA, apart from tackling the existing non-tariff barriers, would further enhance trade integration among SAARC members.
lPower Trade: Power trade among SAARC members is also an important aspect that can enhance intra-SAARC co-operation. Many regions in SAARC countries face on-peak and off-peak power shortages. Along with this, there is seasonal diversity in demand and supply of electricity (time lag, holidays, etc.) among the member nations. SAARC members can leverage on these differences and enhance power trade in these regions. For example, in the eastern region of India, the state of West Bengal faces negligible on-peak

Export-Import Bank of India 11
Potential for Enhancing Intra-SAARC Trade: A Brief Analysis
and off-peak power shortages. On the other hand, in Bangladesh, of the two zones (east and west), the east zone contains nearly all of the country’s electricity generating capacity while the west zone imports most power from the east. Therefore, there is scope for cross border electricity trade between the eastern region of West Bengal and the western region of the east zone of Bangladesh.
Apart from the above, there exists scope for joint investments for development of energy-efficient electricity transmission lines among SAARC members for facilitating power trade, similar to that of which India has with Nepal and Bhutan.
l Addressing Informal Trade: The issue of high level of informal trade may be addressed by streamlining the formal channels, and minimizing the impediments through institutional reforms, streamlining customs-related processes at borders, supported by well-targeted investments, and strategic implementation of policies. Further, SAARC members may also consider opening more ‘border haats’ along their borders.
lTransit Facility: Enhancing intra-regional connectivity could be in the form of granting transit rights to each, especially taking into consideration the three landlocked countries of the region - Bhutan, Afghanistan and Nepal. Optimum usage of existing trade routes, developments of key ports, improving facilities as well as building necessary infrastructure to ease access to the ports would pave a long way in improving intra-regional connectivity of SAARC in this part of the region.
lEffective Exchange of Information Through collaborations: An important element of the strategy would also be effective exchange
of information relating to trade/investment opportunities to potential exporters and investors among SAARC countries as also prospective partners in the region. This can be facilitated through increased bilateral/regional visits by trade and industry delegations. Such economic / trade missions would serve to enhance awareness in the region about strengths and capabilities of countries in the region. The trade promotion measures could also include participation in specialized regional trade and industry fairs and exhibitions, and organizing buyer-sellers meets, and conducting annual business forum meet for exchange of opinions and views to enhance co-operation between businessmen from SAARC through collaborations and strategic alliance.
l Role of SDF in Enhancing Intra-SAARc Trade: One of the key instruments in minimising cross-border trade related transaction costs is infrastructure and related services. An analysis of intra-SAARC trade reveals that the existing low level of intra-regional trade is to a certain extent due to the high trading costs among member nations, emanating on account of poor infrastructure facilities. However, fiscal space and lack of resources have limited governments’ capacity to finance large scale infrastructure projects in the region. Traditionally, infrastructure investments in South Asia have been funded largely by the public sector and various multilateral agencies including the World Bank, Asian Development Bank (ADB) and Japan Bank for International Cooperation (JBIC). In recent years, the private sector has also entered the picture. Demand for private capital has increased considerably in the South Asia region, influenced by the financing needs of large infrastructure development programs.

Export-Import Bank of India12
Potential for Enhancing Intra-SAARC Trade: A Brief Analysis
With the operation of SDF (economic and infrastructure window) gaining traction and reaching its optimal levels, this void could be plugged, at least to a certain extent.
lSDF – The Way Forward: Trade finance plays an important role in facilitating trade by securing finance, and thus becomes an essential element of enhancing export capabilities. Among South Asian countries, India is the only country to have a dedicated export credit agency exclusively for financing
exports from the country. Further, the South Asian region also does not have a dedicated regional development bank (RDB). As a long term strategy, the SAARC Development Fund, therefore, could assume the role of multilateral financial institution for the region, with active support from member countries. Some of the roles and functions of SDF also may be further fine-tuned with focus on trade financing as well as financing trade promoting infrastructure within the region.

Export-Import Bank of India 13
Potential for Enhancing Intra-SAARC Trade: A Brief Analysis
1. Economic Environment of the SAARc Region
In December 1985, seven South Asian countries – Bangladesh, Bhutan, India, Maldives, Nepal, Pakistan and Sri Lanka – charter formally establishing the South Asian Association for Regional Cooperation (SAARC). With Afghanistan joining the organisation in 2007, SAARC comprised eight members. SAARC member cooperation among others were in the area of agriculture and rural, biotechnology, culture, energy, environment, economy and trade, finance, funding mechanism, human resource development, poverty alleviation, people to people contact, security aspects, social development, science and technology, communications, and tourism. The SAARC Preferential Trading Agreement (SAPTA) signed in April 1993 in Dhaka, Bangladesh, paved way to the Agreement on South Asian Free Trade Area (SAFTA). SAFTA was signed by the seven
member states during the twelfth ‘SAARC Summit’ held in Islamabad, Pakistan on January 04-06, 2004, and came into force from January 01, 2006.
The size of economy of the SAARC region has increased by nearly three-fold, from US$ 793.9 billion in 2003 to US$ 2.4 trillion in 2013, and is projected to touch 3.5 trillion by 2018 (Table 1.1). Accordingly, the share of the SAARC region in global GDP also increased from 2.1 per cent in 2003 to 3.2 per cent in 2013, and is expected to increase further to 3.7 per cent by 2018. India, the largest economy in the SAARC region, accounted for 79 per cent of the GDP of SAARC region in 2013, followed by Pakistan and Bangladesh, contributing around 10 per cent and 6 per cent to GDP, respectively.
countryGDP (uS$ bn) GDP Growth
(%)GDP per capita
(uS$)
consumer PriceInflation
(%)
Exports (uS$ bn)
Imports (uS$ bn)
2003 2013 2003 2013 2003 2013 2003 2013 2003 2013 2003 2013
Afghanistan 4.5 20.7 8.4 3.6 195.3 678.7 24.8 7.4 0.2 0.7 1.6 6.6
Bangladesh 54.5 141.3 5.8 5.8 391.4 903.9 5.4 7.5 8.3 30.7 8.5 32.8
Bhutan 0.6 2.0 9.1 5.0 907.3 2665.1 2.1 8.7 0.1 0.2 0.1 0.3
India 618.4 1870.7 7.9 4.4 572.3 1504.5 3.9 9.5 59.4 336.6 72.4 466.0
Maldives 1.0 2.3 14.2 3.7 3332.1 6764.9 -2.8 4.0 0.1 0.2 0.5 1.8
Nepal 6.3 19.3 3.9 3.6 258.0 692.6 4.7 9.9 0.6 0.7 1.1 5.9
Pakistan 89.8 238.7 4.7 3.6 612.0 1307.5 3.2 7.4 11.9 25.1 13.0 43.8
Sri Lanka 18.9 65.8 5.9 7.3 982.3 3161.7 9.0 6.9 5.1 9.5 6.1 16.7
SAARc 793.9 2360.8 7.5 4.6 906.3 2209.9 6.3 7.6 85.7 403.7 103.3 573.9
Table 1.1: Macroeconomic Snapshot of SAARc countries
e: estimates; f: forecastSource: IMF, WEO, April 2014; ITC Trademap; and Exim Bank Analysis

Export-Import Bank of India14
Potential for Enhancing Intra-SAARC Trade: A Brief Analysis
SAARC economy is mostly dominated by services sector, which accounted for 55 per cent of GDP in 2012, followed by industry and agriculture (Table 1.2). In Bhutan, however, industry continued to be a dominant sector, accounting for 44 per cent of the GDP in 2012; while in Afghanistan and Nepal, however, agriculture continued to remain the second largest sector.
Outlook
SAARC is among the fastest growing regions in the world with an average real GDP growth rate of 6.5 per cent in the last 10 years (2004-2013), and is expected to grow faster than emerging markets and developing economies, and several other regions including ASEAN-5, CIS, and LAC during 2014-2018 (chart 1.1).
1.Agriculture 2.Industry 2.a.Manufacturing 3.Services
2002 2012 2002 2012 2002 2012 2002 2012
Afghanistan 38 25 24 22 19 13 38 53
Bangladesh 23 18 26 28 16 18 51 54
Bhutan 26 16 39 44 8 9 35 40
India 21 18 26 26 15 14 53 56
Maldives 7 4 14 21 6 7 79 75
Nepal 39 37 18 15 9 7 43 48
Pakistan 23 24 24 22 16 14 53 54
Sri Lanka 14 11 28 31 18 18 58 58
SAARc 24 19 25 26 13 13 51 55
SAARC’s real GDP growth is forecast to improve, mainly as growth in India is expected to recover due to structural reforms. Sri Lanka’s economy is expected to grow on the back of an improving external environment, higher investments, and a recovery in domestic consumption.While both Bangladesh and Pakistan are engaged in wide-ranging adjustment programs, which are forecast to strengthen their economic fundamentals. In Bhutan, real GDP growth is expected to rebound as hydropower construction projects under the Eleventh Five-Year Plan get under way. Improving global economic prospects are expected to boost tourism in Maldives and thus overall economic growth. Favourable monsoons resulting in recovery of the agricultural sector and an expected strengthening in remittance inflows will lead to a recovery in growth in Nepal. While in Afghanistan, recovery is expected to be slow during the forecast period.
Source: World Development Indicators 2014, World Bank; and Exim Bank Analysis
Table 1.2: Structure of SAARc’s Economy (Share in GDP, %)
country

Export-Import Bank of India 15
Potential for Enhancing Intra-SAARC Trade: A Brief Analysis
chart 1.1: Real GDP Growth of the SAARc Region (annual percentage change)
f - forecastSource: IMF, WEO, April 2014; and Exim Bank Analysis.

Export-Import Bank of India16
Potential for Enhancing Intra-SAARC Trade: A Brief Analysis
2. Recent Trends in SAARc’s International Trade
The SAARC region is well endowed with natural resources. The region also has abundant agricultural wealth in terms of the variety and mass of arable land and has significant human resources and technological capabilities. With a combined population of 1.7 billion and an estimated GDP of US$ 2.5 trillion in 2013 the SAARC region represents a huge market for trade.
The total trade of SAARC has increased over five-fold from US$ 189 billion in 2003 to US$ 977.6 billion in 2013 (Table 2.1). This upward trend has been underlined by favourable growth performances of both SAARC’s exports and imports.
In the case of exports, SAARC’s total exports have risen from US$ 85.3 billion in 2003 to US$ 403.7 billion in 2013, with a resultant rise in the share of SAARC in global exports from 1.1 per cent to 2.2 per cent during the period.
As regards imports, SAARC’s total imports have also witnessed a continuous growth. In 2013, SAARC’s total imports rose more than five-fold to US$ 573.9 billion (3.1 per cent of global imports), up from US$ 103.3 billion (1.3 per cent of global imports) in 2003.
SAARC generally maintains a trade deficit, which has widened from US$ 17.5 billion in 2003 to US$ 170.2 billion in 2013.
2003 2004 2005 2006 2007 2008 2009 2010 2011 2012 2013
Exports (uS$ bn) 85.7 103.4 132.6 157.4 185.7 228.5 220.6 272.5 365.6 351.9 403.7
% growth 41.9 23.8 28.2 18.7 18.0 23.1 -3.5 23.5 34.2 -3.7 14.7
% share in Asia 3.7 3.5 3.8 3.9 3.9 4.1 5.0 4.7 5.2 4.8 5.8
% share in Global Exports 1.1 1.1 1.3 1.3 1.3 1.4 1.8 1.8 2.0 1.9 2.2
Imports (uS$ bn) 103.3 138.7 191.6 238.4 285.6 398.2 334.5 438.4 572.3 594.9 573.9
% growth 39.8 30.9 38.1 24.4 19.8 39.4 -16.0 31.1 30.5 3.9 -3.5
% share in Asia 5.0 5.3 6.1 6.7 6.8 7.8 8.1 8.1 8.6 8.6 8.0
% share in Global Imports 1.3 1.5 1.8 1.9 2.0 2.4 2.6 2.9 3.1 3.2 3.1
Total Trade (uS$ bn) 189.0 242.1 324.2 395.7 471.3 626.7 555.1 710.9 937.9 946.8 977.6Trade Balance (uS$ bn) -17.5 -35.3 -59.0 -81.0 -99.9 -169.6 -113.9 -166.0 -206.8 -243.0 -170.2
Table 2.1: SAARc’s Foreign Trade, 2003-2013
Source: ITC Trade Map, Geneva; and Exim Bank Analysis

Export-Import Bank of India 17
Potential for Enhancing Intra-SAARC Trade: A Brief Analysis
In the SAARC region, India is the largest trading
member, accounting for 83.4 per cent of SAARC’s
total exports and 81.2 per cent of SAARC’s total
imports in 2013. Other important exporters from
the region include Bangladesh (7.6 per cent
of SAARC’s total exports), Pakistan (6.2 per
cent), and Sri Lanka (2.4 per cent). Other major
importers in the region include Pakistan (7.6 per
cent of SAARC’s total imports), Bangladesh (5.7
per cent), and Sri Lanka (2.9 per cent) (chart 2.1 and 2.2).
There exist wide disparities in trade among member countries. For instance, India alone accounted for 82.1 percent of total trade of the region. An important aspect of SAARC trade is that member countries generally maintain a trade deficit, which has increased from US$ 113.9 billion in 2009 to US$ 170.2 billion in 2013. This can be primarily attributed to the trade deficit of US$ 129.4 billion witnessed by India in 2013, followed by Pakistan (US$ 18.7 billion), Sri Lanka (US$ 7.2 billion), Afghanistan (US$ 5.9 billion), Nepal (US$ 5.2 billion), Bangladesh (US$ 2.1 billion), Maldives (US$ 1.6 billion), and Bhutan (US$ 0.1 billion).
chart 2.1: SAARc’s Global Exports (2009-2013)
Source: ITC Trade Map, Geneva; and Exim Bank Analysis

Export-Import Bank of India18
Potential for Enhancing Intra-SAARC Trade: A Brief Analysis
• Afghanistan
Table 2.2 presents Afghanistan’s major traded commodities and their respective trading partners. As can be seen from the table, edible fruit, nuts, peel of citrus fruit and melons are the largest items in Afghanistan’s export basket, accounting for 27.7 per cent of its total exports in 2013. Other important items include cotton, mineral fuels, oils, and distillation products, and edible vegetables and certain roots and tubers. Major export destinations of Afghanistan in 2013 include Pakistan (43.6 per cent of its total exports), India
(30.2 per cent), USA (5.8 per cent), Finland (2.4 per cent), and Germany (2.3 per cent).
As regards imports, vehicles other than railway, tramway were the largest imported commodity accounting for 11.4 per cent of Afghanistan’s overall imports in 2013, followed by electrical and electronic equipment, and mineral fuels, oils, and its distillation products. Afghanistan’s major import sources include Pakistan (30.3 per cent of its total imports in 2013), USA (21.4 per cent), India (7.8 per cent), Russian Federation (7.3 per cent), and China (5.0 per cent).
chart 2.2: SAARc’s Global Imports (2009-2013)
Source: ITC Trade Map, Geneva; and Exim Bank Analysis

Export-Import Bank of India 19
Potential for Enhancing Intra-SAARC Trade: A Brief Analysis
• Bangladesh
Bangladesh’s major traded commodities and their respective trading partners are presented in Table 2.3. As can be seen from the table, readymade garments (articles of apparel, accessories, knit or crochet and not knit or crochet) are the largest items in Bangladesh’s export basket accounting for 85.1 per cent of its total exports in 2013. Major export destinations of Bangladesh in 2013 include USA (18.2 per cent of its total exports), Germany (15.2 per cent), UK (9.5 per cent), France (6.5 per cent), and Spain (5.4 per cent).
Cotton, and machinery and equipments were the largest imported commodities cumulatively accounting for 25.3 per cent of Bangladesh’s overall imports in 2013. Bangladesh’s major import sources include China (29.6 per cent of its total imports), India (18.3 per cent), Singapore (7.7 per cent), and Malaysia (4.8 per cent).
• Bhutan
Bhutan’s major traded commodities and their respective trading partners are presented in Table 2.4. Iron and steel is the largest item in Bhutan’s export basket, with a share of 72.3 per cent of its total exports in 2013. India is the largest destination for Bhutan’s exports accounting for 88.5 per cent of Bhutan’s total exports in 2013.
As regards imports, mineral fuels, oils, and its distillation products were the largest imported commodity accounting for 23.5 per cent of Bhutan’s overall imports in 2013, followed by machinery and equipment (10.8 per cent of its total imports), and electrical and electronic equipment (10.4 per cent). Bhutan’s major import sources include India (61.3 per cent of its total imports in 2013), Thailand (9.8 per cent), and China (6.6 per cent).
India•
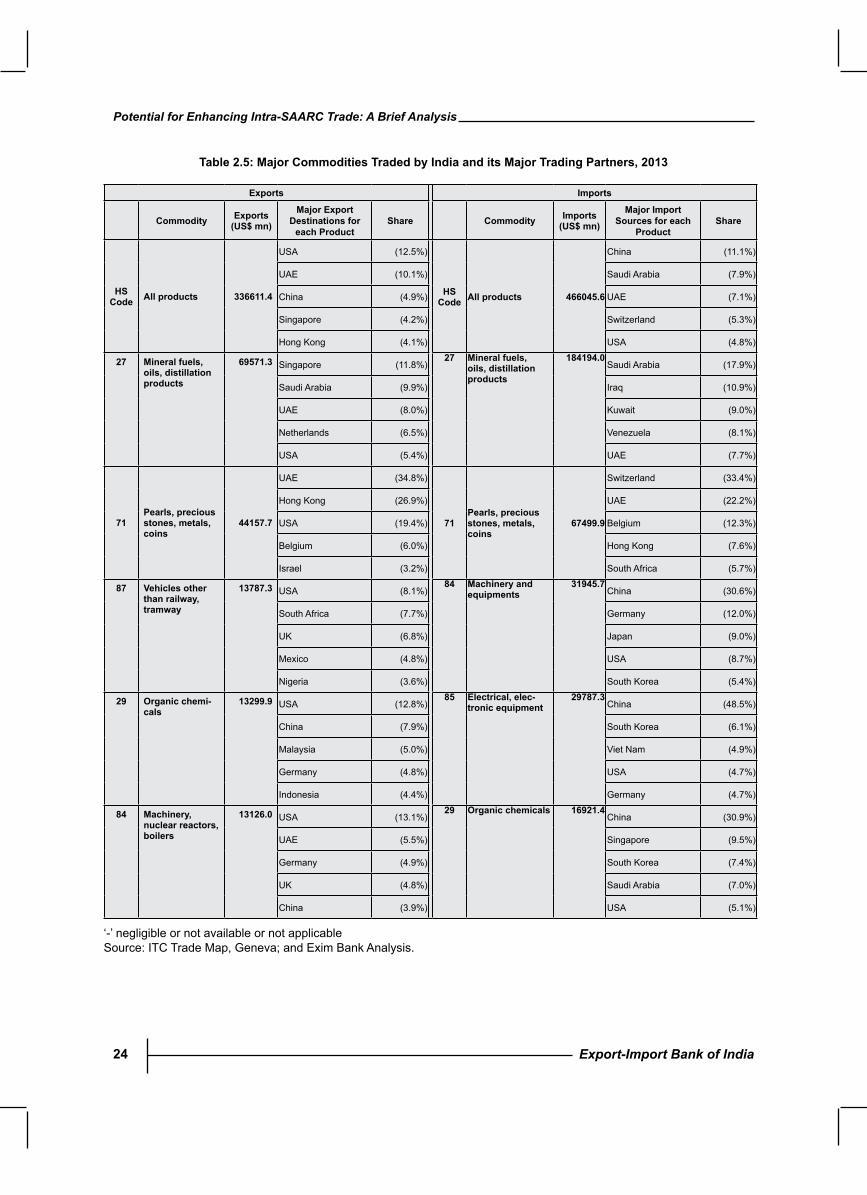
Table 2.5 presents India’s major traded commo-dities and their respective trading partners. Mineral fuels, oils, and distillation products (petroleum products) are the largest items in India’s export basket, with a share of 20.7 per cent of its total exports in 2013. Major export destinations of India include USA (12.5 per cent of its total exports), UAE (10.1 per cent), China (4.9 per cent), Singapore (4.2 per cent), and Hong Kong (4.1 per cent).
Mineral fuels, oils, and distillation products (crude) were the largest imported commodity accounting for 39.5 per cent of India’s overall imports in 2013, followed by pearls, precious stones, metals, coins which accounted for 14.5 per cent of the overall imports during the same year. India’s major import sources include China (11.1 per cent of its total imports), Saudi Arabia (7.9 per cent), UAE (7.1 per cent), Switzerland (5.3 per cent), and USA (4.8 per cent).
Maldives•
Table 2.6 presents Maldives’ major traded commodities and their respective trading partners. Fish, crustaceans, molluscs, and aquatic invertebrates are the largest item in Maldives’ export basket, accounting for 88 per cent of its total exports in 2013. Major export destinations of Maldives in 2013 include Thailand (37.0 per cent of its total exports in), France (13.5 per cent), Iran (6.5 per cent), Germany (6.0 per cent), and Sri Lanka (5.7 per cent).
As regards imports, mineral fuels, oils, and distillation products were the largest imported items commodity accounting for 29.1 per cent of Maldives’ overall imports in 2013, followed by machinery and equipment, and electrical and electronic equipment. Maldives’ major import sources include UAE (28.4 per cent of its total

Export-Import Bank of India20
Potential for Enhancing Intra-SAARC Trade: A Brief Analysis
imports), Singapore (16.2 per cent), India (8.9 per cent), Sri Lanka (5.9 per cent), and Thailand (5.0 per cent).
Nepal•
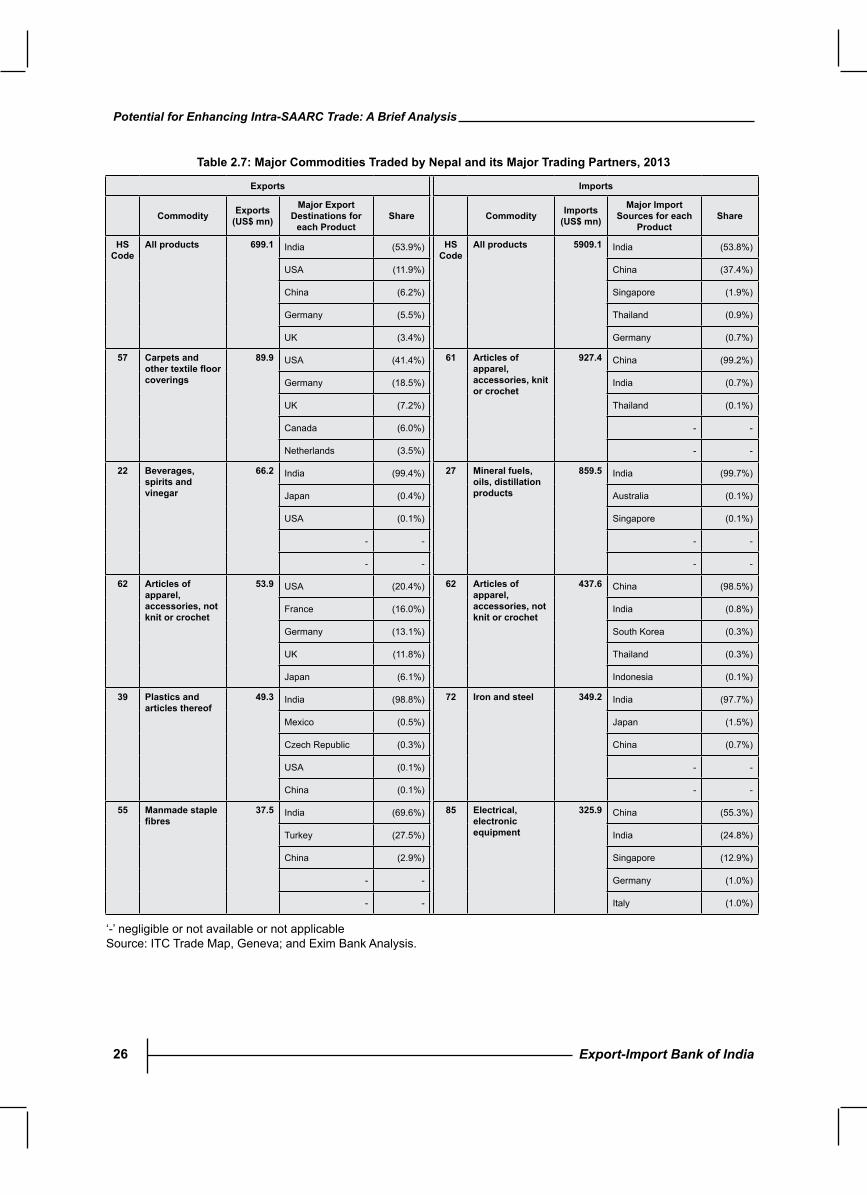
Nepal’s major traded commodities and their respective trading partners are presented in Table 2.7. Carpets and other textile floor coverings, accounting for 12.9 per cent of Nepal’s overall exports in 2013, was the largest item in Nepal’s exported basket. Major export destinations of Nepal in 2013 include India (53.9 per cent of its total exports in 2013), USA (11.9 per cent), China (6.2 per cent), and Germany (5.5 per cent).
As regards imports, articles of apparel, accessories, knit or crochet were the largest imported commodity accounting for 15.7 per cent of Nepal’s overall imports in 2013. Nepal’s major import sources include India (53.8 per cent of its total imports in 2013), China (37.4 per cent), and Singapore (1.9 per cent).
Pakistan•
Table 2.8 presents Pakistan’s major traded commodities and their respective trading partners. Cotton is the largest item in Pakistan’s export basket, with a share of 21.2 per cent of its total exports in 2013. Major export destinations of Pakistan in 2013 include USA (14.9 per cent of its total exports in 2013), China (10.6 per cent), Afghanistan (8.0 per cent), UAE (7.1 per cent), and UK (5.7 per cent).
Mineral fuel, oil, and its distillation products were the largest imported commodity accounting for 34.8 per cent of Pakistan’s overall imports in 2013, followed by machinery and equipment, and electrical and electronic equipment. Pakistan’s major import sources include UAE (17.7 per cent of its total imports in 2013), China (15.1 per cent), Kuwait (9.0 per cent), Saudi Arabia (8.8 per cent), and Japan (4.5 per cent).
Sri Lanka•
Table 2.9 presents Sri Lanka’s major traded commodities and their respective trading partners. As can be seen from the table, readymade garments (articles of apparel, accessories, knit or crochet and not knit or crochet), followed by coffee, tea, mate and spices are the largest items in Sri Lanka’s export basket in 2013. Major export destinations of Sri Lanka in 2013 include USA (27.0 per cent of its total exports in 2013), UK (11.6 per cent), Germany (6.3 per cent), India (5.4 per cent), and Belgium (5.1 per cent).
As regards imports, mineral fuel, oil, and its distillation products were the largest imported commodity accounting for 16.2 per cent of Sri Lanka’s overall imports in 2013. Sri Lanka’s major import sources include India (28.4 per cent of its total imports in 2013), China (20.5 per cent), Singapore (11.7 per cent), Japan (3.5 per cent), and Malaysia (3.4 per cent).

Export-Import Bank of India 21
Potential for Enhancing Intra-SAARC Trade: A Brief Analysis
Table 2.2: Major commodities Traded by Afghanistan and its Major Trading Partners, 2013
Exports Imports
commodity Exports (uS$ mn)
Major Export Destinations for
each ProductShare commodity Imports
(uS$ mn)
Major Import Sources for each
ProductShare
hS code
All products 705.3 Pakistan (43.6%) hS code
All products 6591.5 Pakistan (30.3%)
India (30.2%) USA (21.4%)
USA (5.8%) India (7.8%)
Finland (2.4%) Russian Federation (7.3%)
Germany (2.3%) China (5.0%)
08 Edible fruit, nuts, peel of citrus fruit, melons
195.2 India (70.7%) 87 Vehicles other than railway, tramway
751.2 USA (28.9%)
Pakistan (17.5%) Thailand (20.8%)
Russian Federation (6.0%) Germany (14.2%)
Germany (0.9%) China (6.8%)
UK (0.8%) Netherlands (5.4%)
52 cotton 127.1 Pakistan (99.6%) 85 Electrical, electronic equipment
495.8 USA (37.6%)
Malaysia (0.3%) China (12.7%)
- - Turkey (8.7%)
- - Germany (8.3%)
- - Pakistan (6.3%)
27Mineral fuels, oils, distillation products
55.7
Pakistan (99.9%)
27Mineral fuels, oils, distillation products
490.4
Russian Federation (62.4%)
Mozambique (0.1%) Estonia (8.3%)
- - Lithuania (7.3%)
- - Kazakhstan (5.5%)
- - Pakistan (5.2%)
07 Edible vegeta-bles and certain roots and tubers
46.5 Pakistan (54.1%) 90 Optical, photo, technical, medi-cal apparatus
440.9 USA (87.0%)
India (36.7%) Italy (4.2%)
Kazakhstan (4.5%) China (1.7%)
Russian Federation (4.3%) Japan (1.2%)
Canada (0.3%) UK (1.0%)
72 Iron and steel 42.1 Pakistan (99.1%) 84 Machinery and equipment
403.4 USA (35.9%)
Germany (0.3%) Pakistan (13.6%)
Mexico (0.2%) China (10.0%)
Mozambique (0.2%) Turkey (4.9%)
Senegal (0.1%) UK (4.2%)
‘-’ negligible or not available or not applicableSource: ITC Trade Map, Geneva; and Exim Bank Analysis.

Export-Import Bank of India22
Potential for Enhancing Intra-SAARC Trade: A Brief Analysis
Table 2.3: Major commodities Traded by Bangladesh and its Major Trading Partners, 2013
Exports
Imports
commodity Exports (uS$ mn)
Major Export Destinations for
each ProductShare commodity Imports
(uS$ mn)
Major Import Sources for each
ProductShare
hS code
All products 30693.5 USA (18.2%) hS code
All products 32836.1 China (29.6%)
Germany (15.2%) India (18.3%)
UK (9.5%) Singapore (7.7%)
France (6.8%) Malaysia (4.8%)
Spain (5.4%) South Korea (4.3%)
61 Articles of apparel, accessories, knit or crochet
13115.0 Germany (19.5%) 52 cotton 4974.1 China (43.6%)
UK (10.7%) India (33.4%)
USA (9.3%) Pakistan (12.3%)
France (8.8%) Australia (2.3%)
Spain (6.9%) USA (2.1%)
62 Articles of apparel, accessories, not knit or crochet
12993.0 USA (29.4%) 84 Machinery and equipment
3345.1 China (34.1%)
Germany (13.7%) Singapore (13.7%)
UK (9.4%) India (8.5%)
France (5.7%) Germany (6.5%)
Spain (5.1%) Italy (5.7%)
63 Other made textile articles, sets, worn clothing
1032.6 USA (19.0%) 27 Mineral fuels, oils, distillation products
2270.5 Singapore (47.5%)
Germany (12.4%) Malaysia (31.0%)
UK (7.5%) India (7.1%)
France (7.1%) South Korea (5.8%)
Canada (6.9%) Qatar (2.8%)
03 Fish, crustaceans, molluscs, aquatic invertebrates
625.7 UK (14.9%) 85 Electrical, electronic equipment
1805.0 China (52.4%)
Belgium (13.5%) Singapore (9.4%)
Germany (12.3%) India (7.3%)
Netherlands (11.1%) South Korea (4.6%)
China (10.0%) Germany (3.7%)
53
Vegetable textile fibres,paperyarn, woven fabric
585.4
Turkey (31.4%)
72 Iron and steel 1618.2
Japan (19.2%)
India (17.0%) India (15.4%)
China (15.8%) Taipei, Chinese (14.6%)
Pakistan (7.5%) South Korea (10.8%)
Russian Federation (3.8%) China (8.6%)
‘-’ negligible or not available or not applicableSource: ITC Trade Map, Geneva; and Exim Bank Analysis.
Export-Import Bank of India 23
Potential for Enhancing Intra-SAARC Trade: A Brief Analysis
Exports
Imports
commodity Exports (uS$ mn)
Major Export Destinations for
each ProductShare commodity Imports
(uS$ mn)
Major Import Sources for each
ProductShare
hS code
All products 154.9 India (88.5%) hS code
All products 263.7 India (61.3%)
Germany (4.3%) Thailand (9.8%)
Italy (2.0%) China (6.6%)
Japan (1.4%) Austria (4.1%)
Netherlands (1.0%) Singapore (3.4%)
72 Iron and steel 112.0 India (88.1%) 27 Mineral fuels, oils, distillation products
61.8 India (100.0%)
Germany (5.5%) - -
Italy (2.8%) - -
Netherlands (1.4%) - -
France (1.1%) - -
28 Inorganic chemi-cals, precious metal com-pound, isotopes
22.5 India (100.0%) 84 Machinery and equipment
28.6 India (34.2%)
- - Switzerland (17.0%)
- - Singapore (9.5%)
- - Japan (7.9%)
- - Austria (6.7%)
39 Plastics and articles thereof
4.7 India (99.9%) 85 Electrical, elec-tronic equipment
27.5 Austria (28.8%)
Austria (0.1%) India (15.6%)
- - Singapore (14.7%)
- - Sweden (12.1%)
- - China (10.2%)
74 copper and articles thereof
3.3 India (100.0%) 73 Articles of iron or steel
19.0 India (89.3%)
- - China (4.2%)
- - Austria (2.5%)
- - Belgium (1.6%)
- - Italy (1.1%)
44 Wood and articles of wood, wood charcoal
2.7 India (99.6%) 72 Iron and steel 15.4 India (93.9%)
USA (0.3%) Japan (6.1%)
Germany (0.1%) - -
- - - -
- - - -
Table 2.4: Major commodities Traded by Bhutan and its Major Trading Partners, 2013
‘-’ negligible or not available or not applicableSource: ITC Trade Map, Geneva; and Exim Bank Analysis.
Export-Import Bank of India24
Potential for Enhancing Intra-SAARC Trade: A Brief Analysis
Exports
Imports
commodity Exports (uS$ mn)
Major Export Destinations for
each ProductShare commodity Imports
(uS$ mn)Major Import
Sources for each Product
Share
hS code All products 336611.4
USA (12.5%)
hS code All products 466045.6
China (11.1%)
UAE (10.1%) Saudi Arabia (7.9%)
China (4.9%) UAE (7.1%)
Singapore (4.2%) Switzerland (5.3%)
Hong Kong (4.1%) USA (4.8%)
27 Mineral fuels, oils, distillation products
69571.3 Singapore (11.8%)27 Mineral fuels,
oils, distillation products
184194.0Saudi Arabia (17.9%)
Saudi Arabia (9.9%) Iraq (10.9%)
UAE (8.0%) Kuwait (9.0%)
Netherlands (6.5%) Venezuela (8.1%)
USA (5.4%) UAE (7.7%)
71Pearls, precious stones, metals, coins
44157.7
UAE (34.8%)
71Pearls, precious stones, metals, coins
67499.9
Switzerland (33.4%)
Hong Kong (26.9%) UAE (22.2%)
USA (19.4%) Belgium (12.3%)
Belgium (6.0%) Hong Kong (7.6%)
Israel (3.2%) South Africa (5.7%)
87 Vehicles other than railway, tramway
13787.3 USA (8.1%)84 Machinery and
equipments31945.7
China (30.6%)
South Africa (7.7%) Germany (12.0%)
UK (6.8%) Japan (9.0%)
Mexico (4.8%) USA (8.7%)
Nigeria (3.6%) South Korea (5.4%)
29 Organic chemi-cals
13299.9 USA (12.8%)85 Electrical, elec-
tronic equipment29787.3
China (48.5%)
China (7.9%) South Korea (6.1%)
Malaysia (5.0%) Viet Nam (4.9%)
Germany (4.8%) USA (4.7%)
Indonesia (4.4%) Germany (4.7%)
84 Machinery, nuclear reactors, boilers
13126.0 USA (13.1%)29 Organic chemicals 16921.4
China (30.9%)
UAE (5.5%) Singapore (9.5%)
Germany (4.9%) South Korea (7.4%)
UK (4.8%) Saudi Arabia (7.0%)
China (3.9%) USA (5.1%)
Table 2.5: Major commodities Traded by India and its Major Trading Partners, 2013
‘-’ negligible or not available or not applicableSource: ITC Trade Map, Geneva; and Exim Bank Analysis.

Export-Import Bank of India 25
Potential for Enhancing Intra-SAARC Trade: A Brief Analysis
Exports
Imports
commodity Exports (uS$ mn)
Major Export Destinations for
each ProductShare commodity Imports
(uS$ mn)
Major Import Sources for each
ProductShare
hS code
All products 168.4 Thailand (31.1%) hS code
All products 1753.1 Singapore (22.5%)
France (16.4%) India (12.8%)
USA (11.8%) China (10.0%)
UK (9.0%) Thailand (8.4%)
Italy (6.9%) Malaysia (8.1%)
03 Fish, crustaceans, molluscs, aquatic invertebrates
148.2 Thailand (36.5%) 27 Mineral fuels, oils, distillation products
509.7 Singapore (92.6%)
France (19.2%) India (4.0%)
USA (13.7%) Oman (2.1%)
Italy (8.0%) China (0.7%)
UK (7.4%) USA (0.2%)
16 Meat,fishandseafood food preparations
16.7 Ireland (29.5%) 84 Machinery and equipment
143.0 Singapore (28.9%)
UK (28.6%) Italy (11.2%)
Netherlands (18.7%) Malaysia (10.5%)
Japan (13.1%) India (7.9%)
Germany (5.2%) China (7.2%)
72 Iron and steel 1.8 India (99.9%) 85 Electrical, elec-tronic equipment
125.3
Singapore (48.1%)
Pakistan (0.1%) China (21.6%)
- - USA (4.6%)
- - Czech Republic (3.7%)
- - Malaysia (3.1%)
23 Residues, wastes of food industry, animal fodder
0.7 Turkey (100.0%) 88 Aircraft, space-craft, and parts thereof
57.2 France (84.4%)
- - Australia (6.0%)
- - Canada (5.0%)
- - Singapore (1.7%)
- - Germany (0.9%)
74 copper and articles thereof
0.7 India (94.7%) 44 Wood and articles of wood, wood charcoal
52.8 Malaysia (38.1%)
Malaysia (5.3%) New Zealand (15.4%)
- - Singapore (14.1%)
- - China (12.9%)
- - Czech Republic (3.6%)
Table 2.6: Major commodities Traded by Maldives and its Major Trading Partners, 2013
‘-’ negligible or not available or not applicableSource: ITC Trade Map, Geneva; and Exim Bank Analysis.
Export-Import Bank of India26
Potential for Enhancing Intra-SAARC Trade: A Brief Analysis
Exports
Imports
commodity Exports (uS$ mn)
Major Export Destinations for
each ProductShare commodity Imports
(uS$ mn)
Major Import Sources for each
ProductShare
hS code
All products 699.1 India (53.9%) hS code
All products 5909.1 India (53.8%)
USA (11.9%) China (37.4%)
China (6.2%) Singapore (1.9%)
Germany (5.5%) Thailand (0.9%)
UK (3.4%) Germany (0.7%)
57 carpets and othertextilefloorcoverings
89.9 USA (41.4%) 61 Articles of apparel, accessories, knit or crochet
927.4 China (99.2%)
Germany (18.5%) India (0.7%)
UK (7.2%) Thailand (0.1%)
Canada (6.0%) - -
Netherlands (3.5%) - -
22 Beverages, spirits and vinegar
66.2 India (99.4%) 27 Mineral fuels, oils, distillation products
859.5 India (99.7%)
Japan (0.4%) Australia (0.1%)
USA (0.1%) Singapore (0.1%)
- - - -
- - - -
62 Articles of apparel, accessories, not knit or crochet
53.9 USA (20.4%) 62 Articles of apparel, accessories, not knit or crochet
437.6 China (98.5%)
France (16.0%) India (0.8%)
Germany (13.1%) South Korea (0.3%)
UK (11.8%) Thailand (0.3%)
Japan (6.1%) Indonesia (0.1%)
39 Plastics and articles thereof
49.3 India (98.8%) 72 Iron and steel 349.2 India (97.7%)
Mexico (0.5%) Japan (1.5%)
Czech Republic (0.3%) China (0.7%)
USA (0.1%) - -
China (0.1%) - -
55 Manmade staple fibres
37.5 India (69.6%) 85 Electrical, electronic equipment
325.9 China (55.3%)
Turkey (27.5%) India (24.8%)
China (2.9%) Singapore (12.9%)
- - Germany (1.0%)
- - Italy (1.0%)
Table 2.7: Major commodities Traded by Nepal and its Major Trading Partners, 2013
‘-’ negligible or not available or not applicableSource: ITC Trade Map, Geneva; and Exim Bank Analysis.

Export-Import Bank of India 27
Potential for Enhancing Intra-SAARC Trade: A Brief Analysis
Exports
Imports
commodity Exports (uS$ mn)
Major Export Destinations for
each ProductShare commodity Imports
(uS$ mn)
Major Import Sources for each
ProductShare
hS code
All products 25120.9 USA (14.9%) hS code
All products 43775.2 UAE (17.7%)
China (10.6%) China (15.1%)
Afghanistan (8.0%) Kuwait (9.0%)
UAE (7.1%) Saudi Arabia (8.8%)
UK (5.7%) Japan (4.5%)
52 cotton 5333.8 China (36.3%) 27 Mineral fuels, oils, distillation products
15247.4 UAE (43.2%)
Bangladesh (11.5%) Kuwait (22.8%)
Hong Kong (3.9%) Saudi Arabia (19.1%)
Italy (3.8%) Oman (5.9%)
Turkey (3.1%) Malaysia (2.5%)
63 Other made textile articles, sets, worn clothing
3685.5 USA (38.6%) 84 Machinery and equipment
3058.3 China (27.4%)
UK (12.8%) USA (12.7%)
Germany (6.4%) Japan (9.2%)
Australia (4.4%) Germany (9.2%)
Belgium (4.3%) Italy (6.6%)
10 cereals 2181.0 Kenya (9.1%) 85 Electrical, elec-tronic equipment
2682.3 China (65.5%)
UAE (8.7%) USA (7.1%)
Afghanistan (6.7%) Singapore (2.9%)
China (6.6%) UK (2.8%)
Saudi Arabia (5.8%) South Korea (2.3%)
61 Articles of apparel, accessories, knit or crochet
2105.3 USA (49.9%) 29 Organic chemicals
2015.5 Kuwait (20.3%)
UK (14.3%) China (18.8%)
Netherlands (5.9%) Saudi Arabia (15.6%)
Germany (5.2%) India (12.9%)
Belgium (4.0%) UAE (5.2%)
62 Articles of ap-parel, accesso-ries, not knit or crochet
1854.9 USA (28.4%) 15 Animal, vegetable fats and oils, cleavage products
1979.6 Malaysia (58.8%)
UK (13.3%) Indonesia (35.8%)
Germany (11.3%) Argentina (2.8%)
Spain (11.2%) Australia (0.8%)
Belgium (6.4%) USA (0.4%)
Table 2.8: Major commodities Traded by Pakistan and its Major Trading Partners, 2013
‘-’ negligible or not available or not applicableSource: ITC Trade Map, Geneva; and Exim Bank Analysis.

Export-Import Bank of India28
Potential for Enhancing Intra-SAARC Trade: A Brief Analysis
Exports
Imports
commodity Exports (uS$ mn)
Major Export Destination for each Product
Share commodity Imports (uS$ mn)
Major Import Sources for each
ProductShare
hS code All products 9531.4
USA (27.0%)
hS code All products 16728.5
India (28.4%)
UK (11.6%) China (20.5%)
Germany (6.3%) Singapore (11.7%)
India (5.4%) Japan (3.5%)
Belgium (5.1%) Malaysia (3.4%)
61 Articles of apparel, accessories, knit or crochet
2525.9 USA (36.3%) 27 Mineral fuels, oils, distillation products
2713.3 Singapore (47.4%)
UK (18.5%) India (24.3%)
Italy (7.1%) China (8.8%)
Belgium (5.9%) Malaysia (5.5%)
Germany (5.3%) Oman (4.9%)
62 Articles of apparel, accessories, not knit or crochet
2051.9 USA (41.3%) 84 Machinery and equipment
1445.1 China (32.6%)
UK (21.9%) Singapore (14.9%)
Germany (6.5%) India (10.5%)
Italy (6.1%) Germany (7.7%)
Russian Federation (2.4%) Italy (3.9%)
09 coffee, tea, mate and spices
1022.1 Russian Federation (24.6%) 87 Vehicles other than railway, tramway
1158.8 India (38.1%)
India (8.4%) Japan (34.7%)
Mexico (6.2%) China (10.7%)
Japan (5.3%) UK (3.9%)
USA (5.2%) Germany (3.9%)
40 Rubber and articles thereof
990.9 USA (30.9%) 88 Aircraft, spacecraft, and parts thereof
959.1 India (97.0%)
Germany (11.4%) Netherlands (1.3%)
UK (4.8%) Singapore (0.8%)
Belgium (4.6%) France (0.4%)
Italy (4.6%) Germany (0.1%)
71Pearls, precious stones, metals, coins
527.2
Belgium (35.6%)
85Electrical, electronic equipment
874.7
China (42.7%)
USA (21.1%) India (14.9%)
Israel (13.1%) Singapore (11.4%)
Switzerland (6.7%) France (3.3%)
Thailand (5.4%) Indonesia (2.8%)
Table 2.9: Major commodities Traded by Sri Lanka and its Major Trading Partners, 2013
‘-’ negligible or not available or not applicableSource: ITC Trade Map, Geneva; and Exim Bank Analysis.

Export-Import Bank of India 29
Potential for Enhancing Intra-SAARC Trade: A Brief Analysis
3. Status of Intra-SAARc Trade
As highlighted in the previous chapter, South Asia has made significant progress in integrating with the global economy. The following chapter appraises the level of intra-SAARC trade.
Various initiatives have been taken by the SAARC countries to promote intra-regional trade through several bilateral, regional and multilateral agreements. SAFTA envisaged a duty free area between SAARC member countries by 2016. Under Article 7 of the Agreement, which came into force on January 1, 2006, tariff reduction modality is defined as Trade Liberalisation Programme (TLP) – in the first phase, India, Pakistan and Sri
Lanka would bring down their customs tariff to 20 per cent within a time-frame of two years from the date of coming into force i.e. by January 01, 20082. As regards the Least Developed Country (LDC) Member States i.e. Bangladesh, Bhutan, Maldives and Nepal, they would reduce their customs tariff to 30 per cent. Non-LDCs (NLDCs) will then bring down tariffs from 20 per cent to 0-5 per cent in 5 years (Sri Lanka 6 years), while LDCs will do so in 8 years. NLDCs will reduce their tariffs for LDC products to 0-5 per cent in 3 years3. According to the SAARC secretariat, while reduction in the size of Sensitive Lists is important to increase the quantum of regional trade, efforts are being made
2 Ministry of Commerce & Industry website, http://commerce.nic.in/india_rta.htm3Maldives graduated to developing country status on January 01, 2011.
Intra-Trade 1995 2000 2005 2006 2007 2008 2009 2010 2011 2012
AAGR of Intra-Trade in Value
term1995-2005
2006-2012
ASEAN 21.3 22.5 25.4 25.4 25.5 25.2 24.7 24.9 24.4 24.7 9.3 10.9
CARICOM 10.8 11.4 12.3 11.4 11.4 12.5 10.5 11.8 11.8 12.6 10.9 9.8
CIS 30.1 27.8 22.3 21.8 22.8 22.3 22.6 20.2 21.2 20.4 8.9 15.0
COMESA 4.8 4.8 5.6 5.6 5.0 5.5 6.5 7.1 7.6 6.3 11.3 16.0
EAC 12.9 14.3 13.2 10.4 11.0 11.4 12.1 12.3 11.4 12.2 7.8 16.1
ECOWAS 9.4 10.4 10.9 9.8 9.2 10.1 10.1 9.0 7.4 8.6 11.9 12.4
EU-27 64.9 64.6 64.5 64.0 64.6 63.3 63.3 61.6 60.9 59.1 7.0 4.9
MERCOSUR 18.8 19.2 15.3 16.3 16.7 16.6 17.2 17.4 16.6 16.0 6.9 15.4
SAARc 4.8 4.6 5.6 5.1 5.3 4.8 4.2 4.7 4.4 4.3 14.0 14.0
Table 3.1: Intra-Trade of Select Regional Groups (% of total trade of the group)
AAGR: Average Annual Growth Rate.Note: EU-27: European Union-27; ASEAN: Association of South-East Asian Nations; EAC: East African Community; CIS: Commonwealth of Independent States; MERCOSUR: Mercado Común Sudamericano; CARICOM: Caribbean Community; COMESA: Common Market for Eastern and Southern Africa; ECOWAS: Economic Community of West African States; SAARC: South Asian Association for Regional CooperationSource: UNCTAD; and Exim Bank Analysis.

Export-Import Bank of India30
Potential for Enhancing Intra-SAARC Trade: A Brief Analysis
to take out those products from the Sensitive Lists that are of export interests to the SAARC Member States for trade within South Asia4.
It may be noted that bilateral trading arrangements are also in place among members of SAARC, including: India and Nepal (FTA); India and Bhutan (FTA); India and Sri Lanka (FTA); India-
and Afghanistan (PTA); Pakistan and Afghanistan (Transit Trade Agreement); and Pakistan and Sri Lanka (FTA).
In spite of efforts made by SAARC member nations, intra-SAARC trade remained stagnant at modest level of below 5 per cent of the total trade much below that of EU-27 (around 59 per cent),
Table 3.2: Intra-Exports of Select Regional Groups (% of total exports of the group)
Regional Blocs 2005 2006 2007 2008 2009 2010 2011 2012
EU27 67.6 67.8 67.8 67.0 66.3 64.8 63.9 61.8
ASEAN 25.3 24.9 25.2 25.5 24.5 25.0 25.0 26.0
EAC 18.6 16.3 18.1 19.1 19.3 19.8 19.7 20.9
CIS 18.0 18.2 19.4 19.2 19.6 16.8 17.6 16.0
MERCOSUR 12.2 13.6 14.6 14.9 15.7 16.2 15.4 14.9
CARICOM 13.4 12.7 12.4 14.3 13.1 13.8 14.0 14.5
COMESA 5.2 5.1 4.8 5.5 7.2 7.5 9.5 6.9
ECOWAS 9.7 8.4 8.5 9.2 10.0 8.3 6.5 7.5
SAARc 6.8 6.3 6.4 6.6 5.3 6.1 5.5 5.8
Note: EU-27: European Union-27; ASEAN: Association of South-East Asian Nations; EAC: East African Community; CIS: Commonwealth of Independent States; MERCOSUR: Mercado Común Sudamericano; CARICOM: Caribbean Community; COMESA: Common Market for Eastern and Southern Africa; ECOWAS: Economic Community of West African States; SAARC: South Asian Association for Regional CooperationSource: UNCTAD; and Exim Bank Analysis.
Table 3.3: Intra-imports of Select Regional Groups (% of total imports of the group)
Regional Blocs 2005 2006 2007 2008 2009 2010 2011 2012EU27 61.5 60.2 61.5 59.6 60.3 58.5 58.0 56.3
CIS 29.2 27.3 27.7 26.9 26.9 25.3 26.6 26.8
ASEAN 25.6 25.9 25.8 24.9 24.9 24.8 23.9 23.5
MERCOSUR 20.6 20.3 19.6 18.8 19.1 18.8 18.1 17.2
CARICOM 11.5 10.2 10.6 10.9 9.0 10.4 10.1 11.3
ECOWAS 12.6 11.8 10.3 11.0 10.3 10.1 9.0 10.4
EAC 10.4 8.0 8.2 8.4 9.1 9.1 8.1 8.8
COMESA 6.0 6.2 5.2 5.6 5.9 6.7 6.4 5.8
SAARc 4.7 4.4 4.5 3.8 3.5 3.8 3.7 3.4Note: EU-27: European Union-27; ASEAN: Association of South-East Asian Nations; EAC: East African Community; CIS: Commonwealth of Independent States; MERCOSUR: Mercado Común Sudamericano; CARICOM: Caribbean Community; COMESA: Common Market for Eastern and Southern Africa; ECOWAS: Economic Community of West African States; SAARC: South Asian Association for Regional Cooperation
Source: UNCTAD; and Exim Bank Analysis.
4SAARC Secretariat website, http://saarc-sec.org/areaofcooperation/detail.php?activity_id=5 (accessed on February 21, 2014)

Export-Import Bank of India 31
Potential for Enhancing Intra-SAARC Trade: A Brief Analysis
ASEAN (around 25 per cent) and CIS (around 20 per cent). While intra-regional exports (5.8 per cent of total exports from the region) stood much higher compared to intra-imports (3.4 per cent of total imports of the region), it remained below that of other trade blocs (Table 3.1-Table 3.3).
On the other hand, the low share of intra-SAARC trade could also be due to various reasons. For instance, excluding India’s exports, the share of intra-SAARC in global exports of SAARC region stood at around 14 per cent in 2012. Country-wise analysis also reveals that smaller countries such as Afghanistan, Bhutan, Nepal have greater proportion of their exports directed to the sub-region.
In terms of value, Intra-SAARC trade increased from US$ 11 billion in 2003 to US$ 40 billion in 2012, witnessing a rise of over three fold during the
past ten years, supported by increase in regional trade for all the member countries (Table 3.4).
As seen from Table 3.5 and Table 3.6, except for India and Pakistan, imports of most countries in the SAARC region, particularly, Bangladesh, Nepal, Afghanistan and Sri Lanka, from regional markets exceed their exports to the region highlighting, the scope for enhancing exports to regional markets.
According to UNESCAP, the full potential of intra-regional exports in SAARC is estimated to be at US$ 37.5 billion, while the actual export in 2010 was only US$ 16 billion. Thus, nearly 57 per cent of the potential of intra-SAARC trade is yet to be exploited. UNESCAP also projected the intra-regional export potential of SAARC for 2017 at US$ 72.4 billion5.
5United Nations Economic and Social Commission for Asia and the Pacific, South and South West Asia Office, Regional Cooperation for Inclusive and Sustainable Development: South and South-West Asia Development Report 2012-13, Rout-ledge, New Delhi, 2012
2003 2004 2005 2006 2007 2008 2009 2010 2011 2012
INTRA-SAARc TRADE 11.0 12.8 16.6 19.2 23.4 29.8 23.7 33.1 41.5 40.0
Afghanistan 0.6 0.8 1.3 1.3 1.2 2.0 2.1 2.4 3.5 2.9
Bangladesh 1.7 1.6 1.8 2.4 3.2 4.1 3.0 4.2 5.2 6.4
Bhutan 0.1 0.1 0.5 0.6 0.9 0.9 0.9 1.0 1.1 0.3
India 4.5 5.5 6.8 7.7 9.6 12.3 8.9 13.2 15.4 16.0
Maldives 0.1 0.2 0.1 0.2 0.2 0.2 0.2 0.2 0.2 0.3
Nepal 1.3 1.0 1.2 1.3 1.6 2.2 2.8 3.9 4.4 3.9
Pakistan 1.1 1.6 2.6 3.1 3.1 4.4 3.5 4.7 6.2 5.4
Sri Lanka 1.5 2.0 2.2 2.6 3.6 3.6 2.4 3.5 5.4 4.7
Table 3.4: Intra-SAARc Trade (uS$ billion)
Source: ITC Trade Map, Geneva; and Exim Bank Analysis.

Export-Import Bank of India32
Potential for Enhancing Intra-SAARC Trade: A Brief Analysis
2003 2004 2005 2006 2007 2008 2009 2010 2011 2012
INTRA-SAARc IMPORTS 5.4 6.1 7.8 9.4 11.6 15.0 12.0 16.7 21.6 20.2
Afghanistan 0.5 0.6 1.2 1.2 1.1 1.8 1.8 2.1 3.2 2.6
Bangladesh 1.6 1.4 1.5 2.1 2.6 3.7 2.6 3.8 4.5 5.7
Bhutan 0.1 0.1 0.3 0.3 0.4 0.4 0.4 0.7 0.8 0.2
India 0.6 0.9 1.4 1.5 1.7 2.2 1.5 2.1 2.5 2.3
Maldives 0.1 0.1 0.1 0.1 0.2 0.2 0.2 0.2 0.2 0.2
Nepal 1.0 0.8 0.8 0.9 1.2 1.7 2.1 3.3 3.8 3.4
Pakistan 0.3 0.6 0.8 1.3 1.5 1.9 1.3 1.8 2.0 2.0
Sri Lanka 1.2 1.5 1.6 2.0 3.0 3.1 1.9 2.9 4.7 3.9
Table 3.5: Intra-SAARc Exports (uS$ billion)
2003 2004 2005 2006 2007 2008 2009 2010 2011 2012
INTRA-SAARc EXPORTS 5.5 6.7 8.8 9.8 11.8 14.8 11.7 16.4 19.9 19.7
Afghanistan 0.1 0.1 0.1 0.1 0.2 0.2 0.2 0.3 0.3 0.3
Bangladesh 0.1 0.2 0.3 0.3 0.6 0.4 0.3 0.5 0.7 0.7
Bhutan 0.1 0.1 0.2 0.3 0.6 0.5 0.5 0.4 0.4 0.2
India 3.9 4.6 5.4 6.2 7.8 10.1 7.4 11.1 12.9 13.7
Maldives neg. neg. neg. neg. neg. neg. neg. neg. neg. neg.
Nepal 0.4 0.3 0.3 0.4 0.3 0.5 0.6 0.7 0.6 0.6
Pakistan 0.7 1.0 1.8 1.8 1.6 2.4 2.2 2.9 4.2 3.5
Sri Lanka 0.3 0.5 0.6 0.6 0.6 0.6 0.4 0.6 0.7 0.8
neg. - negligibleSource: ITC Trade Map, Geneva; and Exim Bank Analysis.
Table 3.6: Intra-SAARc Imports (uS$ billion)
Source: ITC Trade Map, Geneva; and Exim Bank Analysis.

Export-Import Bank of India 33
Potential for Enhancing Intra-SAARC Trade: A Brief Analysis
Trade Inter-Dependence among SAARc Nations
India’s export to SAARC countries steadily increased during the last decade, witnessing over five-fold increase from US$ 3.9 billion in 2003 to US$ 13.7 billion in 2012. India’s exports to SAARC countries as a proportion to its total exports, however, stood at roughly 5.8 per cent in the recent years, while its imports from the region accounted for as low as 0.5 per cent of its total imports. While these figures indicate low level of our trade with the neighbouring region in spite of our strategic location, it is equally important to examine the share of India in their trade basket. For instance, more than 85 per cent of both exports and imports of Bangladesh within the SAARC region are with India.
Analysis of trading patterns within the region reveals that levels of intra-regional trade in South Asia are quite diverse, mainly reflecting comparative sizes of the economies and their location. While some member countries concentrated within the region, others trade mostly
with countries outside the region. Countries like Bhutan, Nepal, and Afghanistan trade mostly with other SAARC members, while Bangladesh, India, Maldives, Pakistan and Sri Lanka trade mostly with the rest of the world.
The share of SAARC in exports of Bhutan and Nepal are 88 per cent and 64 per cent, respectively, of which nearly 100 per cent of goods exports are directed toward India. The share of SAARC in Afghanistan’s exports is 69 per cent in 2012 and is trading primarily with Pakistan (75 per cent in 2012) and India among the SAARC countries. More than 85 per cent of both exports and imports of Bangladesh within SAARC region are with India, followed by Pakistan and Sri Lanka.
On the other hand, the share of SAARC in the export baskets of Bangladesh (2.4 per cent in 2012), India (4.7 per cent) Sri Lanka (8.7 per cent), and Maldives (14 per cent) however, are very small as majority of their exports are towards other developing countries or western countries. (Table 3.7 and Table 3.8).
Countries 2003 2004 2005 2006 2007 2008 2009 2010 2011 2012e
Afghanistan 36.2 54.0 43.8 49.5 51.4 43.1 18.9 48.0 65.7 69.2
Bangladesh 1.4 2.1 2.9 2.8 4.9 2.5 1.9 2.3 2.7 2.4
Bhutan 94.0 88.2 92.9 80.0 83.4 98.8 97.0 87.4 81.9 87.8
India 6.5 6.0 5.4 5.1 5.4 5.6 4.2 5.0 4.3 4.7
Maldives 13.9 10.5 13.0 13.8 16.8 11.1 19.4 23.0 13.8 9.0
Nepal 53.8 47.0 50.5 57.2 52.9 61.4 71.0 74.5 71.2 63.6
Pakistan 6.3 7.2 11.2 10.4 9.1 12.1 12.5 13.5 16.7 14.0
Sri Lanka 7.1 9.1 10.5 8.9 8.4 6.9 6.2 7.3 7.0 8.7
Table 3.7: Intra-regional Exports of SAARc countries (% of total exports of the country)
e: Estimates.Source: ITC Trade Map, Geneva; IMF, Direction of Trade Statistics; and Exim Bank Analysis.

Export-Import Bank of India34
Potential for Enhancing Intra-SAARC Trade: A Brief Analysis
It is interesting to note that post SAFTA i.e. after 2006, there has been increasing inter-dependence on the SAARC region, both as source of imports as
well as export destination, for a larger number of member countries reflecting increasing importance given to the regional market (Table 3.9).
Table 3.8: Intra-regional Imports of SAARc countries (% of total imports of the country)
countries 2003 2004 2005 2006 2007 2008 2009 2010 2011 2012e
Afghanistan 32.9 33.1 33.9 33.3 28.1 32.0 28.5 22.8 25.6 30.8
Bangladesh 15.6 12.7 12.3 13.1 14.5 19.6 14.4 14.3 14.0 18.9
Bhutan 72.9 37.4 76.6 70.0 74.2 75.1 79.7 77.1 72.9 55.4
India 0.9 0.9 1.0 0.8 0.8 0.7 0.6 0.6 0.5 0.5
Maldives 24.3 21.3 17.4 15.8 18.8 16.7 19.1 17.7 16.1 15.8
Nepal 53.6 59.7 63.2 62.8 59.1 65.0 57.2 64.0 63.9 52.7
Pakistan 2.7 3.3 3.0 4.4 4.5 4.6 4.2 4.9 4.5 4.5
Sri Lanka 18.1 19.0 19.1 20.3 26.2 22.4 20.4 23.1 24.0 21.9
e: Estimates.Source: ITC Trade Map, Geneva; IMF, Direction of Trade Statistics; and Exim Bank Analysis.
Region/country Intra RegionalExports
(cAGR, %)
GlobalExports
(cAGR, %)
IntraRegionalImports
(cAGR, %)
Global Imports
(cAGR, %)
SAARc 15.3 18.2 18.1 19.2
Afghanistan 20.9 14.3 22.2 28.7
Bangladesh 16.8 17.9 16.7 15.1
Bhutan 2.3 1.8 21.2 20.2
India 15.7 20.0 10.8 21.0
Maldives -9.2 -9.3 9.2 8.8
Nepal 10.6 5.8 32.3 31.8
Pakistan 19.1 8.4 8.3 7.9
Sri Lanka 3.2 8.2 19.0 15.0
Table 3.9: comparative Growth Dynamics of Intra-regional Trade (2006 to 2011)
Note: Shaded area implies intra-regional export/import growth is greater than global export/import growth.Source: ITC Trade Map, Geneva; and Exim Bank Analysis.

Export-Import Bank of India 35
Potential for Enhancing Intra-SAARC Trade: A Brief Analysis
4. Potential for Enhancing Intra- SAARc TradeAs per UNESCAP, the Trade Complementarity Index (TCI) – that measures the degree of overlap between the export profile of the source and the import profile of the destination – among SAARC countries is as high as 58 per cent in 2007 (as per latest data available). Informal trade in the SAARC region is also a good indicator of the existing trade complementarity in the region6. However, intra-SAARC trade still accounts for a modest level of below 5 per cent of its global trade, clearly indicating the existence of potential for enhancing intra-regional trade.
Trade integration among SAARC members continues to be low as compared to the EU and the ASEAN. It is expected that with further reduction of tariff barriers under SAFTA, along with non-tariff barriers, would result in enhanced trade integration among SAARC members.
One of the objectives under the SAARC Charter is acceleration of economic growth. Cooperation in trade was identified as one of the core economic
areas for SAARC Member Countries. An analysis of the intra-SAARC trade reveals that though SAARC members like Bhutan, Maldives, and Nepal are highly dependent on the region for their exports, they maintain a surmounting trade deficit with the region. Other countries that maintain an intra-regional trade deficit include Afghanistan, Bangladesh, and Sri Lanka. Further, given the complementarities in trade in select commodities and the locational advantage, SAARC members like India, Pakistan, Sri Lanka, Bangladesh, and Afghanistan can source their import requirements from their neighbours in the SAARC region.
Underlying these advantages, an attempt has been made to highlight select commodities up to 6-digit disaggregated level, in which SAARC nations7 have trade potential, but witnessed low or negligible trade. Bhutan already has around 90 per cent of its global exports directed towards the SAARC region. Further, it has a huge export potential in the power sector (Box 1).
6Source: Regional Integration, Trade and Conflict in South Asia, Shaheen Rafi Khan, Faisal Haq Shaheen, Moeed Yusuf and Aska Tanveer, International Institute for Sustainable Development, January 2007.7Data for the analysis has been sourced from ITC trademap, which does not classify Afghanistan under SAARC
Box 1: Bhutan’s Power Sector – untapped Trade PotentialBhutan is endowed with abundant water resources and has an estimated hydropower potential of around 30,000 megawatts (MW). The installed capacity of the four major hydropower plants, viz. Chukha, Kurichhu, Basochu, and Tala, stands at 1,480 MW. Though electricity trade between Bhutan and India exists, there is still a huge untapped hydro-power potential (nearly 20-times the existing installed capacity). This advantage needs to be leveraged upon to bridge Bhutan’s trade deficit with India.
Bhutan currently supplies only a very small amount of what India requires. As the production cost of hydropower in Bhutan is also among the cheapest in the world, this makes it a high return and extremely feasible sector for investment and thus, power trade.
Further, opportunities exist in renewable energy sources, like solar, wind, and biomass energy, which are yet to be exploited to its full potential.
Source: An investment Guide to Bhutan, Opportunities and Conditions 2013, UNCTAD

Export-Import Bank of India36
Potential for Enhancing Intra-SAARC Trade: A Brief Analysis
A. Bangladesh
There exists potential to further enhance two way trade flows between Bangladesh and SAARC countries, especially given the fact that Bangladesh has a trade deficit of US$ 5 billion with the SAARC region in 2012. Further, under the purview of SAFTA, Bangladesh has the added advantage of preferential duties and an LDC status.
Table 4.1 presents SAARC’s major import items, in terms of 2-digit HS code, and Bangladesh’s share in SAARC’s global imports of these items, along with Bangladesh’s global exports. As can be seen from the table, despite Bangladesh’s global export capability, Bangladesh’s share in SAARC’s select imports is still low, which highlights the potential for enhancing the export of these items to the rest of the SAARC region.
Vehicles other than railway, tramway (hS 87)
Under vehicles other than railway, tramway (HS 87), India is a major importer of bicycles and other cycles (HS 871200) in the SAARC region – importing nearly two-third of the region’s import of bicycles and other cycles. Main sources of India for import of bicycles and other cycles have been
China, Sri Lanka, Taiwan, Germany, and Brazil. India’s import of bicycles and other cycles from China, Taiwan, Germany and Brazil carry an ad valorem equivalent tariff of 10 per cent8. On the other hand, Bangladesh, which is the largest exporter of bicycles (43 per cent of the region’s exports) exports mainly to UK, Germany and Belgium. As per SAFTA, import of HS 87 does not feature in India’s sensitive list for LDCs, thus giving Bangladesh a preferential access to the Indian market for export of this commodity.
Apart from the above, select commodities at the 6-digit level under HS 87, in which Bangladesh has an export potential have been listed in Annexure 1 (A).
Raw hides, skins and leather (hS 41)
In the SAARC region, India is the largest importer of raw hides, skins and leather (HS 41), accounting for nearly 75 per cent of the region’s import of raw hides, skins and leather, while Pakistan accounts for 13 per cent. Under this category, India mainly imports hides and skins of bovine “incl. buffalo” or equine animals (HS 410419 and HS 410449). Main sources for India’s import for both these commodities include Italy, Argentina, Thailand, Indonesia, Germany and China (all of which carry
hS code Product name
SAARc’s imports
from world
SAARc’s imports from Bangladesh
Bangladesh’s exports to world
uS$ mn(2012)
uS$ mn(2012)
% share in SAARc’s
global imports
uS$ mn(2012)
TOTAL All products 594893 655 1.1 27040
87 Vehicles other than railway, tramway 8987 0.9 0.01 70
41 Raw hides, skins and leather 667 5 0.8 305
64 Footwear, gaiters and parts thereof 642 2 0.3 396
Table 4.1: Potential for Enhancing Bangladesh’s Exports to SAARc
Source: ITC Trade Map, Geneva; and Exim Bank Analysis
8Data sourced from ITC Trademap, reference year 2007; Currently the tariff for import of bicycles from China has increased to 20%

Export-Import Bank of India 37
Potential for Enhancing Intra-SAARC Trade: A Brief Analysis
an ad valorem tariff ranging from 7 per cent-10 per cent). As regards Bangladesh, some of the major export markets for hides and skins of bovine incl. buffalo or equine animals (HS 410419 and HS 410449) include China, Italy and Thailand.
Likewise, Bangladesh also has an export potential for leather of other animals (HS 4107). Leather of other animals (HS 4107) accounts for 12 per cent of Pakistan’s HS 41 imports. Major source for Pakistan’s import of HS 4107, are Hong Kong, UK, and Portugal for grain splits leather (HS 410712); and Brazil, Korea, and China for full grains leather (HS 410711).
Bangladesh has a preferential access to both India and Pakistan for export of these commodities under SAFTA. Bangladesh may consider enhancing its exports to India and Pakistan. At the 6-digit level under HS 41, select commodities in which Bangladesh has an export potential have been listed in Annexure 1 (B).
Footwear, gaiters and parts (hS 64)
Bangladesh has a potential to enhance its export of footwear, gaiters and parts (HS 64) to the SAARC region. Despite having preferential access, as
also export capability, Bangladesh accounts for a marginal 0.3 per cent (US$ 2 million) of the SAARC region’s import of footwear, gaiters and parts (US$ 642 million). Among SAARC members, India (importing 55.9 per cent of the region’s HS 64 imports), Pakistan (18.2 per cent), and Nepal (12.4 per cent) are the major importers of footwear, gaiters and parts thereof.
Further, under HS 64 India’s major imports include footwear viz. HS 6406, HS 6403, and HS 6402, which are mainly sourced from China, Italy, Hong Kong and Vietnam.
At the 6-digit level under HS 64, select commodities in which Bangladesh has an export potential and a preferential access have been listed in Annexure 1 (c).
B. Sri Lanka
Trade between Sri Lanka and SAARC has grown in recent years, however underlying this growth there is a trade deficit accounting for nearly 36 per cent of Sri Lanka’s global deficit. Given that Sri Lanka recently got its middle-income economy status, the possibility of reducing the country’s import is low; however, to tackle its deficit Sri
hS code Product name
SAARc’s imports from
world
SAARc’s imports from Sri Lanka
Sri Lanka’s exports to
world
uS$ mn(2012)
uS$ mn(2012)
% share in SAARc’s imports
from the world
uS$ mn(2012)
TOTAL All products 594893 909 1.5 9370
49 Printed books, newspapers, and pictures 921 3 0.4 43
95 Toys, games, sports requisites 565 3 0.5 56
53 Vegetable textile fibres, paper yarn and woven fabric 443 2 0.4 117
Table 4.2: Potential for Enhancing Sri Lanka’s Exports to SAARc
Source: ITC Trade Map, Geneva; and Exim Bank Analysis.

Export-Import Bank of India38
Potential for Enhancing Intra-SAARC Trade: A Brief Analysis
Lanka could beef up its exports, especially to the SAARC region. Currently, Sri Lanka’s exports to SAARC account for merely 1.5 per cent of SAARC’s imports. Sri Lanka has a narrow export base, with exports traditionally being concentrated towards RMG, tea and coffee, rubber, and pearls and precious stones. Under SAFTA, given the preferential duties, potential exists to enhance Sri Lanka’s exports to the region. At the 2-digit level Table 4.2 presents those commodities where Sri Lanka has an export potential to the SAARC region.
Printed books, newspapers and pictures (hS 49)
In the SAARC region, Sri Lanka is the second-largest exporter of printed books, newspapers (accounting for 11 per cent of the region’s export of this commodity), after India that accounts for 87 per cent. Nevertheless, Sri Lanka is the only country in the SAARC region to have a trade surplus in printed books, newspapers, pictures, etc (HS 49) which amounted to US$ 4 billion. Despite this Sri Lanka accounts for only a marginal 0.4 per cent of the region’s import of this commodity. In the SAARC region, India accounts for 74 per cent of the region’s import of HS 49, while Pakistan and Bangladesh account for 15 per cent and 4 per cent, respectively. Sri Lanka’s export potential to the SAARC region under SAFTA at the 6-digit level for select commodities under HS 49 has been described in the Annexure 2 (A). Further, Sri Lanka has a preferential access for the identified commodities to all the markets in SAARC, as the commodities do not feature in the Sensitive list of rest of SAARC members.
For example, children’s picture, drawing or colouring books (HS 490300), Pakistan and India are the largest importers of this commodity, and their major sources include China, Australia, and UK. While under SAFTA, Sri Lanka has preferential
access to both India and Pakistan. Sri Lanka may consider enhancing its exports of printed books, newspapers and pictures to the region.
Toys, games, sports requisites (hS 95)
Sri Lanka can enhance its export of toys, games, sports requisites (HS 95) to the SAARC region, as it only accounts for 0.5 per cent of the region’s imports in 2012. At the 6-digit level select potential items of exports have been enlisted in Annexure 2 (B). For example, Sri Lanka has an export potential for festive, carnival or other entertainment art (HS 950590). In the SAARC region, India is the largest importer of festive, carnival or other entertainment art, importing 89 per cent of the regions import of this commodity (US$ 12.3 million), while India’s import sources for this commodity are mainly China (US$ 10.3 million), USA (US$ 0.5 million), and Switzerland (US$ 0.5 million). Sri Lanka has a preferential access to India under SAFTA and can thus enhance its export of this commodity to the region.
Vegetabletextilefibres,paperyarn,andwovenfabric (hS 53)
In the SAARC region, Bangladesh and India are the largest global suppliers of vegetable textile fibres (HS 53). At the same time, at the 6-digit level Sri Lanka also has an export potential for woven fabrics of paper yarn (HS 531100) and coconut, abaca Manila hemp or Musa textiles (HS 530500). India, however, imports woven fabrics of paper yarn (HS 531100) mainly from China (US$ 13.7 million out of its global import of US$ 14.5 million), Taiwan (US$ 0.4 million) and South Korea (US$ 0.1 million), which has an ad valorem tariff of 10 per cent9. Bangladesh also sources its imports from China (nearly 100 per cent of its imports i.e. US$ 13.6 billion), which carries an ad valorem tariff of 25 per cent10.
9Data sourced from ITC Trademap, reference year 200910Data sourced from ITC Trademap, reference year 2008

Export-Import Bank of India 39
Potential for Enhancing Intra-SAARC Trade: A Brief Analysis
Due to SAFTA, both these countries get a preferential rate for imports from Sri Lanka for this commodity. Sri Lanka may thus consider enhancing exports of this commodity to the SAARC region.
c. Pakistan
Pakistan is the third-largest exporter in the SAARC region accounting for 7 per cent of the region’s exports; however, it maintained a trade deficit of US$ 0.4 billion with the region in 2012. The SAARC region accounts for only 6.3 per cent of Pakistan’s global imports; and Pakistan’s hare in SAARC’s global import is 2.6 per cent. Pakistan may thus consider enhancing its exports to the region, given its export potential in select commodities that have been represented at the 2-digit level in Table 4.3.
Pearls, precious stones, metals and coins (hS 71)
In pearls, precious stones, metals, and coins (HS 71), Pakistan has a trade surplus of US$ 1.4 billion. However, with
the SAARC region, it maintains a deficit of US$ 24.2 million. Further examination at the disaggregated level highlights that this deficit is mainly on account of trading of articles of jewellery & parts thereof (HS 711319), which accounted for 95 per cent of its deficit with SAARC, while at a global level, it maintains a trade surplus of US$ 1.5 billion in this commodity. Pakistan could thus focus on enhancing export of this commodity to the region. Major importers of articles of jewellery and parts thereof (HS 711319) in the region include India (imports amounting to US$ 5.2 billion) and Bangladesh (US$ 85.6 million). Major sources for India are UAE (imports amounting to US$ 4.1 billion), Hong Kong (US$ 0.6 billion) and Thailand (US$ 0.1 billion). For Bangladesh, major suppliers of this commodity include Singapore (US$ 79.9 million), and India (US$ 5.6 million). Pakistan has a preferential access to both India and Bangladesh. Thus, it can leverage upon this preferential access and enhance its exports to India and Bangladesh.
Further at the 6-digit level, select commodities with which Pakistan has a preferential access and export potential to SAARC region have been enlisted in Annexure 3 (A).
hS code Product name
SAARc’s imports
from world
SAARc’s imports fromPakistan
Pakistan’s ex-ports to world
uS$ mn(2012)
uS$ mn(2012)
% share in SAARc’s imports
from the world
uS$ mn(2012)
TOTAL All products 594893 1554 2.6 24614
71 Pearls, precious stones, metals and coins 82497 0.8 0.001 1634
17 Sugars and sugar confectionery 1094 6.7 0.6 2006
82 Tools, implements, cutlery of base metal 778 1.8 0.2 1694
Table 4.3: Potential for Enhancing Pakistan’s Exports to SAARc
Source: ITC Trade Map, Geneva; and Exim Bank Analysis.

Export-Import Bank of India40
Potential for Enhancing Intra-SAARC Trade: A Brief Analysis
Sugars and sugar confectionery (hS 17)
Pakistan accounts for 0.6 per cent of SAARC’s global import of sugars and sugar confectionery, while SAARC accounts for a meagre 0.3 per cent of Pakistan’s export of the same. Bangladesh, India, and Sri Lanka cumulatively account for 97 per cent of the region’s imports, which amounts to US$ 1 billion in 2012. Pakistan can leverage on the preferential access to enhance exports of this commodity to the rest of the SAARC region. At the 6-digit disaggregated level, select commodities in which Pakistan has an export potential are listed in Annexure 3 (B).
For example, Pakistan has an export potential for refined sugar in solid form (HS 170199), especially white crystalline cane sugar (HS17019910). Among SAARC members, Sri Lanka and Bangladesh are the largest importers of this commodity. Sri Lanka sources its imports of white crystalline cane sugar from India, Brazil, and Thailand; with Brazil and Thailand – non-SAARC members – accounting for 26.6 per cent and 9.5 per cent of its import of white crystalline cane sugar respectively.
Under SAFTA, refined sugar in solid form (HS170199) features in the sensitive list of both Sri Lanka and Bangladesh. Both Bangladesh and Sri Lanka may thus consider revising their sensitive list.
Tools, implements, cutlery of base metal (hS 82)
Pakistan accounts for a meagre 0.2 per cent of SAARC’s import of tools, implements, and cutlery of base metal (HS 82); while from an export perspective, Pakistan’s export of this commodity
to the SAARC region account for 0.1 per cent of Pakistan’s global export of tools, implements, and cutlery of base metal. Clearly Pakistan has an export potential to the SAARC region for this commodity.
For example, Pakistan has an export potential for manicure or pedicure sets and instruments, including nail files (HS 821420) to the SAARC region. Under this commodity, Pakistan has an export potential for manicure or pedicure sets and instruments (HS 82142000). While Bangladesh is the largest importer of this commodity in the SAARC region, which are sourced mainly from China and Hong Kong.
This commodity is also a part of Bangladesh’s sensitive list. Thus Bangladesh could revises its sensitive list, to have preferential access under SAFTA. At the 6-digit disaggregated level, under HS 82 select commodities in which Pakistan has an export potential are listed in Annexure 3 (c).
D. India
India is the largest country in the SAARC region as regards geographical area, GDP size and also trade. Most countries in the SAARC region are dependent on India for their trade. However, there are still certain commodities in which India has an export potential to rest of the SAARC countries. At the two-digit level, India may consider enhancing its exports to rest of the SAARC countries particularly with respect to the commodities listed in Table 4.4. Enhancing export of these commodities can provide rest of the SAARC members a preferential access under SAFTA, as compared to their imports from the rest of the world.

Export-Import Bank of India 41
Potential for Enhancing Intra-SAARC Trade: A Brief Analysis
Animal, vegetable fats and oils, and cleavage products (hS 15)
India has a potential for export of animal, vegetable fats and oils, cleavage products. Currently, SAARC’s imports from India of this product account for 0.1 per cent of SAARC’s global imports and 0.6 per cent of India’s global exports. India’s export potential to the SAARC region for select commodities under HS 15 at 6-digit disaggregated level, has been highlighted in Annexure 4 (A).
For example, among the SAARC members, major importers of vegetable fats & oils & fractions hydrogenated (HS 151620) are Pakistan and Bangladesh, cumulatively accounting for 68 per cent of SAARC’s global import of vegetable fats, oils and fractions hydrogenated. India, on the other hand accounts for only 1 per cent of SAARC’s global import of this commodity, while supplies to SAARC also account for just 1 per cent of India’s export of this commodity. As regards Pakistan, its major import sources include Malaysia (38.5 per cent), Italy (32.4 per cent) and USA (12.6 per cent), while Bangladesh’s major import sources are Malaysia (69.6 per cent), Australia (17 per cent), and France (12.6 per cent).
Under SAFTA, India has a preferential access to Bangladesh, but not Pakistan. India may consider enhancing its export of vegetable fats & oils & fractions hydrogenated (HS 151620) to Bangladesh, and Pakistan may consider revising its sensitive list.
Meat, fish and seafood food preparations (hS 16)
Currently, SAARC’s import of meat, fish and seafood food preparations from India account for just 0.1 per cent of SAARC’s global imports, and 0.1 per cent of India’s global exports. India thus has an export potential for select items under meat, fish and seafood food preparations (HS 16).
For example, India has an export potential for fowl meat, prepared/preserved (HS 160232). Pakistan is the largest importer of this commodity in the SAARC region, accounting for 37 per cent of the region’s imports. Pakistan sources its imports from China, Malaysia, and Australia, cumulatively accounting for 93.7 per cent of Pakistan’s imports. India has a preferential access to Pakistan for the
Product code Product label
SAARc’s import from
the world
South Asian Association for Regional cooperation (SAARc)’s
imports from India
India’s exports to
world
US$ mn(2012)
US$ mn(2012)
% share in SAARc’s imports
from the world
US$ mn(2012)
TOTAL All products 594893 12932 2.2 289565
15 Animal, vegetable fats and oils, and cleavage products 6748 6.2 0.1 956
16 Meat, fish and seafood food preparations 79 0.1 0.1 85
Table 4.4: Potential for Enhancing India’s Exports to SAARc
Source: ITC Trade Map, Geneva, and Exim Bank Analysis.

Export-Import Bank of India42
Potential for Enhancing Intra-SAARC Trade: A Brief Analysis
export of this commodity. India can thus enhance its exports under SAFTA.
Maldives is the second largest importer of fowl meat, prepared/preserved (HS 160232), accounting for 25 per cent of the region’s imports; and the largest importer of sausage & similar products of meat and meat offal (HS 160100) accounting for 60 per cent of the region’s import of HS 160100. Maldives sources both these commodities mainly from UAE. Further, both these commodities also feature in Maldives’ sensitive list for India. Maldives may consider revising its list as it could avail a preferential rate under SAFTA for the import of this commodity.
E. Nepal
SAARC’s imports from Nepal currently account for only a marginal 0.05 per cent of SAARC’s global imports, while it accounts for nearly 50 per cent of Nepal’s global exports. This clearly shows Nepal’s dependence on SAARC region, however, underlying this is the large trade deficit which it maintains with the region, nearly amounting to over US$ 3 billion, i.e. 60 per cent of its global deficit. There exist commodities in which Nepal can enhance its exports to the SAARC region
and bridge its trade deficit. These have been represented at 2-digit level in Table 4.5.
Carpets and other textile floor coverings (hS 57)
Nepal has a potential to enhance its export of carpets and other textile floor coverings (HS 57) to the SAARC region. Currently imports from Nepal account for 0.05 per cent of SAARC’s global import of carpets and other textile floor coverings, and 0.1 per cent of Nepal’s global exports. At the 6-digit disaggregated level, Nepal’s export potential for select commodities under HS 57 to the SAARC region has been listed in the Annexure 5(A).
For example, Nepal has an export potential for carpets of wool or fine animal hair, knotted (HS 570110). Pakistan and India are the major importers of carpets of wool or fine animal hair, knotted in the SAARC region. Pakistan mainly sources its imports from USA, accounting for nearly 50 per cent of its imports; while India mainly sources it from Indonesia, USA and China. Currently export of carpets of wool or fine animal hair, knotted from Nepal to the SAARC region are at negligible levels. Nepal has preferential access to both Pakistan and India under SAFTA, as this
hS code Product name
SAARc’s imports from
worldSAARc’s imports from Nepal
Nepal’s exports to
world
US$ mn(2012)
US$ mn(2012)
% share in SAARc’s imports from the
world
US$ mn(2012)
TOTAL All products 594893 309 0.05 622
57 Carpets and other textile floor coverings 112 0.1 0.05 96
97 Works of art, collectors pieces and antiques 25 0.2 0.7 11
Table 4.5: Potential for Enhancing Nepal’s Exports to SAARc
Source: ITC Trade Map, Geneva, and Exim Bank Analysis.

Export-Import Bank of India 43
Potential for Enhancing Intra-SAARC Trade: A Brief Analysis
commodity does not feature in the sensitive list of both the countries. Nepal may thus consider enhancing its exports of this commodity to the SAARC region.
Similarly, Nepal has an export potential for carpets of felt or textile material (HS 570490). Pakistan is the largest importer of carpets of felt or textile material, and it mainly sources its imports from China. Carpets of felt or textile material also features in Pakistan’s sensitive list for LDCs. Pakistan may thus consider revising its sensitive list, in order to get preferential rate under SAFTA.
Works of art, collectors pieces and antiques (hS 97)
Nepal also has a potential to increase its export of works of art, collectors pieces and antiques to the SAARC region. Currently SAARC’s imports from Nepal account for only 0.7 per cent of SAARC’s global imports of this commodity, and 1.8 per cent of Nepal’s global exports.
For example, Nepal can enhance its export of paintings, drawings & pastels executed by hand
(HS 970110) to the SAARC region. Currently, imports from Nepal account for just 0.2 per cent of SAARC’s total imports under this commodity. India is the largest importer of paintings, drawings and pastels executed by hand in the SAARC region, and mainly sourced it from USA (42.9 per cent), UK (29.2 per cent), and Germany (13.3 per cent). Nepal has a preferential access to the Indian market under SAFTA and also a locational advantage for trade with India. Nepal can thus enhance its export of paintings, drawings & pastels executed by hand.
F. Maldives
The SAARC region accounts for 8.6 per cent of Maldives’ global exports. Maldives maintains a trade deficit of US$ 231 million with the SAARC region, and is mainly dependent on India and Sri Lanka for its total trade, accounting for approximately 97 per cent of its total trade with the region. Maldives can thus enhance its exports to the SAARC region, in order to reduce its deficit with the region. At the two-digit level, commodities in which Maldives has an export potential to rest of the SAARC countries are listed Table 4.6.
hS code Product name
SAARc’s imports
from world
SAARc’s imports from Maldives
Maldives’ exports to
world
uS$ mn(2012)
uS$ mn(2012)
% share in SAARc’s imports from the
world
uS$ mn(2012)
TOTAL All products 594893 14 0.002 162
16 Meat, fish and seafood preparations 62 0.01 0.01 14
Table 4.6: Potential for Enhancing Maldives’ Exports to SAARc
Source: ITC Trade Map, Geneva, and Exim Bank Analysis.

Export-Import Bank of India44
Potential for Enhancing Intra-SAARC Trade: A Brief Analysis
Meat,fishandseafoodpreparations(HS16)
Maldives can also enhance its export of tunas (HS 160414) to the SAARC region. Maldives has a preferential access to Afghanistan, Bangladesh, Bhutan, India, Nepal, and Pakistan under SAFTA (Annexure 6 (A)).
G. Afghanistan11
The SAARC region accounts for a decent 73 per cent of Afghanistan’s global exports. Underlying Afghanistan’s dependence on SAARC for its exports is the trade deficit of US$ 0.7 billion it maintains with the region. Afghanistan could thus consider enhancing its exports to the region. At the two-digit level, commodities in which Afghanistan has an export potential to rest of the SAARC countries have been represented in Table 4.7.
Oil seed, oleagic fruits, grain, seed, and fruit (hS 12)
Afghanistan has a potential to enhance its export of sesamum seeds, whether or not broken (HS
120740) to the SAARC region (Annexure 7(A)). Currently, Afghanistan’s export of sesamum seeds stood at US$ 20.6 million in 2012, while SAARC’s imports stood at US$ 14 million. India is the largest importer of sesamum seeds in the SAARC region, accounting for 92 per cent of the region’s import of this commodity. India’s main import sources are Somalia (34.6 per cent of India’s global imports for this commodity), Pakistan (24.3 per cent) and UAE (12.9 per cent). Since sesamum seeds do not feature in India’s sensitive list for LDCs, Afghanistan could consider enhancing its export of sesamum seeds to India under SAFTA.
coffee, tea, mate and spices (hS 09)
Under Coffee, tea, mate and spices, Afghanistan has a potential to enhance its export of cumin seeds (HS 090930). Sri Lanka (accounting for 52 per cent of the region’s import of cumin seeds), Nepal (24.8 per cent), and Bangladesh (19.6 per cent) are the major importers of cumin seeds in the SAARC region. Afghanistan has a preferential access to
11Data for the analysis has been sourced from ITC trademap, which does not classify Afghanistan under SAARC, However, we have considered bilateral trade between Afghanistan and SAARC (countries as per ITC classification) for the following analysis.
hS code Product name
SAARc’s imports
from world
SAARc’s imports from Afghanistan
Afghanistan’s exports to
world
uS$ mn(2012)
uS$ mn(2012)
% share in SAARc’s im-
ports from the world
uS$ mn(2012)
TOTAL All products 594893 314.8 0.05 429
12 Oil seed, oleagic fruits, grain, seed, and fruit 1182 1 0.1 21
09 Coffee, tea, mate and spices 1137 1.3 0.1 54
Table 4.7: Potential for Enhancing Afghanistan’s Exports to SAARc
Source: ITC Trade Map, Geneva; and Exim Bank Analysis.

Export-Import Bank of India 45
Potential for Enhancing Intra-SAARC Trade: A Brief Analysis
these markets, except Bangladesh for export of this commodity under SAFTA. Afghanistan may thus consider enhancing its export of the following commodity to these countries.
Potential growth in Intra-SAARC trade
The above analysis attempts to highlight the potential for enhancing trade within the region by identifying select commodities at the 6-digit level in which SAARC members have potential for trade within the region. Accordingly, we have estimated that if all these commodities are being traded among the SAARC members to the full potential, i.e. demand for these select identified commodities from SAARC is met to the fullest extent possible by SAARC countries, then the intra-SAARC trade would have increased by approximately 33 per cent. Thus, having focused only on the above identified commodities would have increased the share of intra-SAARC trade to its global trade from the existing 4.3 per cent to approximately 5.7 per cent. In addition to focusing on the above commodities, reductions in transaction costs, revision of sensitive list, and elimination/ reduction of the existing tariff and non-tariff barriers could help in further increase of intra-SAARC trade.
Select Areas of concern
Bangladesh is the largest exporter of articles •
of apparel, knit or crochet (HS 61) in the SAARC region, exporting nearly 55 per cent of the region’s export of articles of apparel, knit or crochet. While Nepal is the largest importer of articles of apparel, knit or crochet (HS 61) in the SAARC region, especially men’s and women’s apparel (HS 6103 and HS 6104 respectively), it mainly sourced its imports
from China. Further, since most items under HS 61 feature in Nepal’s sensitive list, Nepal could consider revising its sensitive list so as to enhance trade with the SAARC region.
Pakistan has an export potential for refined •
sugar in solid form (HS 170199), especially white crystalline cane sugar (HS17019910), and Sri Lanka and Bangladesh are the largest importers of this commodity in the region. Sri Lanka sources its imports of crystalline cane sugar (HS17019910) from India, Brazil, and Thailand, with Brazil (26.6 per cent) and Thailand (9.5 per cent) cumulatively accounting for 36 per cent of its import of crystalline cane sugar (HS 17019910). Under SAFTA, refined sugar, in solid form (HS170199) features in the sensitive list of both Sri Lanka and Bangladesh. Both Bangladesh and Sri Lanka could consider revising their sensitive list, so that it could import at a preferential rate under SAFTA, particularly from Pakistan.
Similarly, as per the above analysis, Pakistan •
has an export potential for manicure or pedicure sets and instruments, including nail files (HS 821420) to the SAARC region. At the 8-digit level, Pakistan has potential to enhance its export of manicure or pedicure sets and instruments (HS 82142000) to the region. At the same time, Bangladesh is the largest importer of manicure or pedicure sets and instruments (HS 82142000) in the SAARC region, however, it mainly imports from China and Hong Kong. This commodity is also a part of Bangladesh’s sensitive list under SAFTA. Thus, Bangladesh could consider revising its sensitive list for non-LDCs under SAFTA.

Export-Import Bank of India46
Potential for Enhancing Intra-SAARC Trade: A Brief Analysis
Among SAARC • members, Pakistan and Bangladesh are major importers of vegetable fats & oils & fractions hydrogenated (HS 151620), cumulatively accounting for 68 per cent of SAARC’s global import of these items. As regards Pakistan, it mainly sourced its imports from Malaysia (38.5 per cent), Italy (32.4 per cent) and USA (12.6 per cent). India accounts for only 1 per cent of SAARC’s global import of this commodity. Under SAFTA, India has a preferential access to Bangladesh, but not Pakistan. Pakistan can thus consider revising its sensitive list to non-LDCs.
Maldives is the second largest importer of •fowl meat, prepared/preserved (HS 160232) in the region, accounting for 25 per cent of the region’s imports; and the largest importer of sausage & similar products of meat and meat offal (HS 160100) in the region, accounting for 60 per cent of the region’s import of these items. Maldives sources both these commodities mainly from UAE. At the same time, both these commodities feature in Maldives’ sensitive list for non-LDCs. If Maldives revised its list it could avail a preferential rate under SAFTA for the import of this commodity. Among SAARC members, India is the largest exporter of fowl meat accounting for 88 per cent of SAARC’s global exports of US$ 1 million; and Sri Lanka is the largest exporter of sausage and similar products of meat, accounting for 51 per cent of SAARC’s global export of US$ 3 million.
Similarly, Nepal has an export potential for •carpets of felt or textile material (HS 570490). Pakistan, the largest importer of carpets of felt of textile material, mainly sources its imports from China. Carpets of felt of textile material features in Pakistan’s sensitive list for LDCs. Pakistan could thus consider revising its
sensitive list, in order to get preferential rate under SAFTA.
Importance of Trade Facilitation in the SAARc Region
The existing low-level of intra-SAARC trade is mainly due to the numerous trade facilitation constraints in the region. The removal of these constraints is critical to boosting intra-regional trade. Further, without their elimination, the removal of tariffs on intra-regional trade will have limited effect in boosting intra-SAARC trade.
The existing inefficiencies in transportation and trade facilitation also partly indicates the existence of large potential for regional cooperation, while regional integration through connectivity supporting infrastructure would help in boosting industrial investment levels and unlock the growth potential in the region. Poor quality trade-related infrastructure as well as inadequate transport infrastructure, which results in high costs of trading, thus hurting domestic and international trade, needed to be addressed12.
Study by UNESCAP (2012) also supported that poor connectivity, low level of trade facilitation that results in high trade costs, poor supply capabilities especially in least developed countries, and a high proportion of unofficial trade at the borders as the major reasons for low level of intra-SAARC trade. South Asia region would, therefore, benefit from strengthening transport, transit and trade facilitation through a regional transport and transit agreement, improving border logistics and cross border arrangements, investments in upgrading infrastructure at the LCSs, adoption of a single window approach to customs procedures, and by moving towards international standards and harmonized conformity assessment procedures.
12P.V. Srinivasan, “Regional Cooperation and Integration (RCI) through Cross-Border Infrastructure Development in South Asia: Impact on Poverty”, Asian Development Bank, 2011.

Export-Import Bank of India 47
Potential for Enhancing Intra-SAARC Trade: A Brief Analysis
Major economies like Bangladesh, India and Sri Lanka, which have potential to provide port facilities to other member nations could play important role in addressing the issues of connectivity.
Welfare gains resulting from regional trade liberalization helps in creating supply capabilities in lesser developed economies in the region. This is evidenced from India-Sri Lanka FTA (ISFTA), which has resulted in much more balanced growth of bilateral trade between the two countries, with Sri Lanka exporting to India new value-added products often produced by joint ventures (JVs) with Indian companies. While India has become one of the largest sources of FDI in Sri Lanka following the FTA, Sri Lankan companies are also undertaking investments in India to take advantage of supply chains.
Measures geared towards enhancing trade facilitation would allow for a realisation of trade expansion that would otherwise be subdued because of non-tariff and behind-the-border barriers, thus, helping in trade and development strategies of SAARC member countries. Regional trade facilitation can also create efficiency gains through the elimination of costly procedures and services. Eradicating costly procedures enables efficiency gains for firms and allows smaller scale operators to access markets.
A Study by WTO13 highlights the achievements of initiatives like the ASEAN Infrastructure Fund (created in 2012) and the Greater Mekong Subregion (GMS) (created in 1992), with its secretariat at the ADB. Such initiatives are
instrumental in reducing the costs of intra-regional interchange not as a means of raising intra-regional trade shares as a goal in itself, but rather to attract production networks, which in turn usually have the effect of raising intra-regional trade. This also results in lowering costs, increasing competitiveness and attracting FDI, all of which have been a hallmark of the ASEAN success story over the past generation.
A study by Weerahewa (2009), which explores the extent to which trade facilitation helps in agricultural trade in South Asia, suggests that the status of trade facilitation in South Asia is quite low and there is an opportunity to improve trade flows by improving trade facilitation. According to the study, improving trade costs and time delays in South Asian countries up to the average values of best performers in the region helps in significantly increasing the value of agricultural trade in the region. Thus, as per the results of the study, bringing down trade costs by around 17 per cent would increase agricultural trade by 18 per cent. These results indicate that by reducing inefficiencies at the borders in South Asia, significant trade gains can be achieved.
Unlike some of the other major barriers to intra-SAARC trade, the issue of trade facilitation can be addressed relatively quickly and without much cost, with political will and greater commitment to the promotion of intra-SAARC trade. Trade facilitation will not only assist in the deepening of SAARC’s market integration but also enhance the performance of SAARC countries in global trade.
13WTO, Aid for Trade at a Glance 2013: Connecting to Value Chains

Export-Import Bank of India48
Potential for Enhancing Intra-SAARC Trade: A Brief Analysis
As highlighted in the previous chapters, intra-regional trade as a share of total trade in the SAARC region is among the lowest in the world. There are several other factors that constrain intra-SAARC trade. The following chapter highlights the challenges for enhancing intra-SAARC trade and strategies for the same.
challenges
The growth of intra-SAARC trade has been constrained by a number of factors. These include, among others, high and escalating trade cost, including restrictive customs procedures, administrative and technical barriers; informal trade; poor intra-regional connectivity; supply side constraints and weak of productive capacity; inadequacies of trade-related infrastructure, trade
finance, and trade information, which need to be addressed.
A. high and Escalating Trade costs: In the World Bank’s ‘Ease of Doing Business’, trading across borders index has six sub-components namely (i) documents to export (total number), (ii) documents to import (total number), (iii) time to export (in days), (iv) time to import (in days), (v) cost to export (US$ per container) and (vi) cost to import (US$ per container). It has been observed that despite progress made in the past, the cost of doing business in South Asia remains high. The region suffers from outdated and inefficient border procedures, inadequate infrastructure, including those at the borders, lack of reliable logistics services, and absence
5. challenges and Strategies for Enhancing Intra-SAARc Trade
chart 5.1: Doing Business Rankings for Trading Across Borders
Source: World Bank, Doing Business 2014.
SAARc

Export-Import Bank of India 49
Potential for Enhancing Intra-SAARC Trade: A Brief Analysis
of a regional transport and transit agreement, resulting in high transactions costs and long delays, which in turn adversely impact trade. As observed in chart 5.1 below, the region ranked much below in trading across border index compared to East Asia and the Pacific, MENA, Latin America and Europe and Central Asia. Sri Lanka, which ranked 51 out of 189 countries, was the top SAARC country, followed by Pakistan.
According to UNCTAD (2012), though SAARC countries are sharing borders, trade costs encountered in intra-SAARC trade are higher than those encountered by SAARC countries in trading with far distant markets such as the EU and the US. While trade costs for exports to different regions have declined between 2007 and 2009, such patterns are not observed in the case of intra-SAARC trade, which shows that intra-SAARC trade has not exploited the
benefit of geographical proximity by incurring costs greater than those applicable to distant locations, which calls for improving physical connectivity and trade facilitation.
Further, as can be seen in Table 5.1 and 5.2, in spite of some improvements in certain parameters, most countries in the region are afflicted with procedural delays and high costs. For instance, SAARC countries took 2 to 10 times the number of days taken by Malaysia to import. Further, the region has witnessed high level of cost in trading containers through ports, except for Pakistan and Sri Lanka which are comparable with some of the East Asian countries. In fact, there has been consistent rise in the cost in several countries including Afghanistan, Nepal, Bhutan and Bangladesh. Policymakers in the region need to further deepen attention to policies aimed at reducing the cost of doing business and improving competitiveness.
2007 2009 2011 2013
Regions Export Import Export Import Export Import Export Import
Afghanistan 66 88 74 77 74 77 81 85
Nepal 44 37 41 35 41 35 42 39
Bhutan 39 42 39 38 38 38 38 38
Bangladesh 35 57 28 32 25 31 25 35
Pakistan 24 19 24 18 21 19 21 18
Maldives 15 21 21 20 21 22 21 22
Sri Lanka 25 27 21 20 21 19 20 17
India 27 41 17 20 17 20 16 20
THAILAND 24 22 14 13 14 13 14 13
MALAYSIA 20 22 18 14 18 14 11 8
INDONESIA 25 30 21 27 20 27 17 23
Table 5.1: comparative Analysis of Trading Time, cost & Documents across South Asia and Select Regions, 2007, 2009, 2011 and 2013
A. Time (in days)
Source: World Bank, Doing Business, Various Issues.

Export-Import Bank of India50
Potential for Enhancing Intra-SAARC Trade: A Brief Analysis
B. costs (uS$/container)
2007 2009 2011 2013
Regions Export Import Export Import Export Import Export Import
Afghanistan 2,500 2,100 3,000 2,600 3,865
3,830 4,645 5,180
Nepal 1,599 1,800 1,764 1,900 1,960 2,095 2,295 2,400
Bhutan 1,230 1,950 1,210 2,140 1,352 2,665 2,230 2,330
Bangladesh 902 1,287 970 1,315 985 1,390 1,075 1,470
Pakistan 996 1,005 611 660 611 680 660 725
Maldives 1,000 1,784 1,348 1,348 1,550 1,526 1,625 1,610
Sri Lanka 797 789 865 895 715 745 595 775
India 864 1,244 945 960 1,055 1,025 1,170 1,250
THAILAND 848 1042 625 795 625 795 595 760
MALAYSIA 481 428 450 450 450 450 450 485
INDONESIA 546 675 704 660 704 660 615 660
Source: World Bank, Doing Business, Various Issues.
c. Documents required (no.)
2007 2009 2011 2013
Regions Export Import Export Import Export Import Export Import
Afghanistan 7 11 12 11 12 11 10 10
Nepal 7 10 9 10 9 10 11 11
Bhutan 10 14 8 11 8 11 9 12
Bangladesh 7 16 6 8 6 8 6 8
Pakistan 8 12 9 8 9 8 8 8
Maldives 8 9 8 9 8 9 7 9
Sri Lanka 8 13 8 6 8 6 5 7
India 10 15 8 9 8 9 9 11
THAILAND 9 12 4 3 4 3 5 5
MALAYSIA 6 12 7 7 7 7 11 8
INDONESIA 7 10 5 6 5 6 4 8
Source: World Bank, Doing Business, Various Issues.

Export-Import Bank of India 51
Potential for Enhancing Intra-SAARC Trade: A Brief Analysis
B. Informal Trade: Studies have suggested that the scope of informal trade in South Asia in many cases is comparable to formal flows, and even exceeds them in some cases. Being the largest and most centrally located country in the region, most informal trade in the SAARC region happens between India and its neighbours. RIS (2008) noted that huge amount of informal trade takes place through third countries such as Dubai or Singapore to obviate trade restrictions, which once taken into account would result in higher level of intra-trade14. According to Taneja (2005), if informal trade is taken into account,
Table 5.2: Trading across borders: Performance of South Asia Region
Indicator Lowest regional performance
Best regional performance
Regional average
Trading Across Borders (rank) 184 (Afghanistan) 51 (Sri Lanka) 134
Documents to export (number) 11 (Nepal) 5 (Sri Lanka)* 8
Time to export (days) 81 (Afghanistan) 16 (India) 33
Cost to export (US$ per container) 4,645 (Afghanistan) 595 (Sri Lanka) 1,787
Documents to import (number) 12 (Bhutan) 7 (Sri Lanka) 10
Time to import (days) 85 (Afghanistan) 17 (Sri Lanka) 34
Cost to import (US$ per container) 5,180 (Afghanistan) 725 (Pakistan) 1,968
* Two or more economies share the top ranking on this indicator.Source: World Bank, Doing Business 2014
14Research and Information System for Developing Countries (RIS) (2008). South Asia Development and Cooperation Report 2008. New Delhi: Oxford University Press.
India’s trade surplus with neighbouring countries like Bangladesh, Bhutan, and Pakistan, would be lesser than actual surplus, and may have a trade deficit with Nepal, and a balanced trade with Sri Lanka. UNESCAP (2012), has estimated the size of SAARC’s informal trade with India close to US$ 12 billion (Table 5.3). There has been, therefore, considerable opportunity to increase trade flows in South Asia through institutional reforms and by streamlining customs-related processes at borders, supported by well-targeted investments and strategic implementation of policies.
countries Estimated Informal Exports Estimated Informal ImportsBangladesh 3222 1045Nepal 3314 451Pakistan 34 1967Sri Lanka 1393 348Total 7963 3811
Table 5.3: Estimated Informal Trade with India in 2011 (uS$ million)
Source: UNESCAP, 2012; and Exim Bank Analysis.

Export-Import Bank of India52
Potential for Enhancing Intra-SAARC Trade: A Brief Analysis
c. Poor Intra-Regional connectivity: Poor physical connectivity, especially connectivity across borders by land, remains one of the biggest stumbling blocks in the region which has caused the cost of trading across borders to be one of the highest in the world. There has been fragmentation of surface transport networks in the region in spite of putting in place several basic infrastructure and facilities for promoting mutually beneficial intra- and inter-regional transport linkages. Land connectivity by road and rail are poor, imposing significant barriers to trade in terms of time and cost. These problems are accentuated by poor sea connectivity for intra-SAARC trade.
A study by Taneja, Prakash and Kalita (2013)15 observed that India plays a central role in trade integration in South Asia and is also at the helm of all regional trade facilitation and transit issues. India’s efforts in strengthening its bilateral links with its neighbours can be observed in its signing FTA with Nepal, Bhutan and Sri Lanka and a PTA with Afghanistan. The extent of integration within the region would largely depend on granting transit rights to each other, especially taking into consideration the three landlocked countries of the region - Bhutan, Afghanistan and Nepal. The study suggested that India can take additional steps by laying down the roadmap for granting access to Nepal and Bhutan into the Pakistani market. With these measures, the risks of failed integration in South Asia would be greatly minimised.
Regional Multi Modal Transport and Transit Agreement among SAARC countries would provide for greater efficiency in movement of goods. The SAARC governments could also explore the possibility of an Open Skies policy to promote air connectivity, with equity holdings across the region, and also facilitate the enhancement of maritime transportation links, including ferry services, to link and integrate SAARC countries (FICCI, 2013).
Inadequate intra-regional transportation networks of road, rail, air and waterways resulted in high trade costs in the SAARC region. For the landlocked countries, these costs are much higher. Development of cross-border road infrastructure, and other transportation network, therefore, would help in harnessing the potential of low transport costs, while at the same time making remote areas accessible through transit routes in neighbouring countries. Regional integration with landlocked economies like Bhutan, Nepal and Afghanistan is essential to attract greater FDI and more trade16. This is expected to generate incomes in the key sectors of the countries, through improved market access for goods, better access to technologies, among others. At the same time, it is also important to ensure optimum usage of existing trade routes. For instance, there are 12 land routes between India and Pakistan, among which only one is in operation17.
According to a study conducted by ADB (2013), intra-regional trade in South Asia is hampered not only by high costs of lengthy processes - nearly all South Asian economies spend more than half of trade cost on paperwork
15 Nisha Taneja, Shravani Prakash and Pallavi Kalita “India’s Role in Facilitating Trade under SAFTA”, ICRIER Working Paper 263, January 2013.16Mirza, Tanseem and Bacani, Eleanor, “Addressing Hard and Soft Infrastructure Barriers to trade in South Asia, South Asia Working Paper Series No. 16, February 2013, Asian Development Bank.17CUTS CITEE, 2014, Trade Consignment Meeting in South Asia, February 21, 2014, http://www.cuts-citee.org/TCMSA/pdf/Report-Project_Inception_Meeting-TCMSA.pdf

Export-Import Bank of India 53
Potential for Enhancing Intra-SAARC Trade: A Brief Analysis
processing-but also due to trade and transport agreements between countries. Trade in this part of the region - including Bangladesh, Bhutan, India and Nepal - is asymmetric and depends mainly on bilateral relations. Bhutan and Nepal, for example, have strong trade links with India (more than two-thirds of their trade is with India). In contrast, bilateral trade between Bangladesh–Bhutan, Bangladesh–Nepal, and Bhutan–Nepal remains at less than one-tenth of total trade. Factors affecting intensity of intra-regional trade would include, among other, border management systems,
cross-border transport and trans-shipment facilities, in-transit logistics and handling of goods, legal procedures, and other bilateral/multilateral trading arrangements. The Study had identified key land ports across the border of Bhutan, Bangladesh and Nepal, which are also strategically important (Table 5.4, 5.5 and 5.6). Developments of these ports, improving facilities as well as building necessary infrastructure to ease access to the ports would pave a long way in improving intra-regional trade of SAARC in this part of the region.
Bangladesh &correspondingBorder Post
Strategic Importance, General Description, Investment Needs & Ongoing Initiatives
Hili (NW)- Hili(West Bengal)
Land Port (LP) Facilities: Under operation since 2007. LP consists of 10 acres of land, four ware-houses, two open yards, one customs godown, one transshipment yard, one weigh bridge, one truck terminal, and one administrative building.Under operation of BOT.Imports: Fruits, fresh fish, maize, rice bran, oil cake, onions.Exports: Sugar-cane molasses, coal, bricks.
Bibirbazar (SE) -Srimantpur(Tripura)
LP Facilities: Under operation since 2009. LP includes 10 acres of land, a warehouse, a weigh bridge, one yard, one fork lift, and office building. Under BOT operation.
Birol (NW) -Radhikapur (WestBengal)
LP Facilities: 17.54 acres of land is available, although no infrastructure is in place as there is no road/rail connectivity to port. Needs about 3.5 km of road link to get the port functioning. BOT Operator has been appointed but cannot start yet.
Banglabandha (N)- Phulbari (WestBengal)
Strategic Importance: Banglabandha provides trade links with Nepal; falls along SRC 4. Trade volumes here are still very low due to cross-border vehicle movement restrictions. Until January 2011, India and Bangladesh had a truck-to-truck loading and unloading system for transship-ments of goods at the zero point. Thereafter the land port at Banglabandha allowed trucks to reach the warehouses. In October 2010 the two countries signed an agreement on standard operating procedures and a car-pass procedure.Imports: Whole red lentils, leather.Exports: Cotton products, Cotton-knitted fabric, batteries, juice, float glass.LP Facilities: 10 acres of land, a warehouse, a yard, an office building, one Barrack.Relevant ADB Projects: four-laning of Hatikamrul-Rangpur National Highway (157 km, project cost: US$ 270 million).
Table 5.4: Key Land Ports in Bangladesh
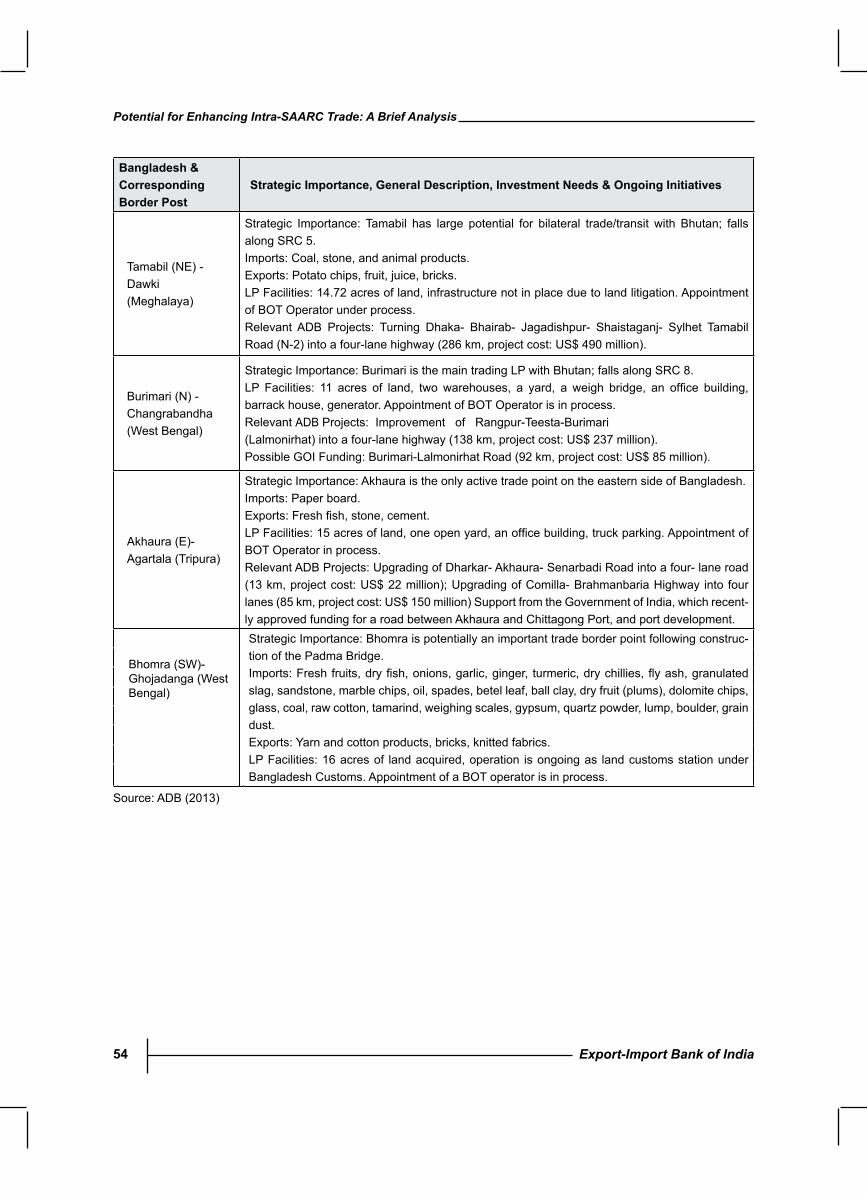
Export-Import Bank of India54
Potential for Enhancing Intra-SAARC Trade: A Brief Analysis
Bangladesh &correspondingBorder Post
Strategic Importance, General Description, Investment Needs & Ongoing Initiatives
Tamabil (NE) -Dawki(Meghalaya)
Strategic Importance: Tamabil has large potential for bilateral trade/transit with Bhutan; falls along SRC 5.Imports: Coal, stone, and animal products.Exports: Potato chips, fruit, juice, bricks.LP Facilities: 14.72 acres of land, infrastructure not in place due to land litigation. Appointment of BOT Operator under process.Relevant ADB Projects: Turning Dhaka- Bhairab- Jagadishpur- Shaistaganj- Sylhet Tamabil Road (N-2) into a four-lane highway (286 km, project cost: US$ 490 million).
Burimari (N) -Changrabandha(West Bengal)
Strategic Importance: Burimari is the main trading LP with Bhutan; falls along SRC 8.LP Facilities: 11 acres of land, two warehouses, a yard, a weigh bridge, an office building, barrack house, generator. Appointment of BOT Operator is in process.Relevant ADB Projects: Improvement of Rangpur-Teesta-Burimari(Lalmonirhat) into a four-lane highway (138 km, project cost: US$ 237 million).Possible GOI Funding: Burimari-Lalmonirhat Road (92 km, project cost: US$ 85 million).
Akhaura (E)-Agartala (Tripura)
Strategic Importance: Akhaura is the only active trade point on the eastern side of Bangladesh.Imports: Paper board.Exports: Fresh fish, stone, cement.LP Facilities: 15 acres of land, one open yard, an office building, truck parking. Appointment of BOT Operator in process.Relevant ADB Projects: Upgrading of Dharkar- Akhaura- Senarbadi Road into a four- lane road (13 km, project cost: US$ 22 million); Upgrading of Comilla- Brahmanbaria Highway into four lanes (85 km, project cost: US$ 150 million) Support from the Government of India, which recent-ly approved funding for a road between Akhaura and Chittagong Port, and port development.Strategic Importance: Bhomra is potentially an important trade border point following construc-tion of the Padma Bridge.Imports: Fresh fruits, dry fish, onions, garlic, ginger, turmeric, dry chillies, fly ash, granulated slag, sandstone, marble chips, oil, spades, betel leaf, ball clay, dry fruit (plums), dolomite chips, glass, coal, raw cotton, tamarind, weighing scales, gypsum, quartz powder, lump, boulder, grain dust.Exports: Yarn and cotton products, bricks, knitted fabrics.LP Facilities: 16 acres of land acquired, operation is ongoing as land customs station under Bangladesh Customs. Appointment of a BOT operator is in process.
Bhomra (SW)-Ghojadanga (WestBengal)
Source: ADB (2013)

Export-Import Bank of India 55
Potential for Enhancing Intra-SAARC Trade: A Brief Analysis
Strategic Importance, General Description, Investment Needs & Ongoing Initiatives
Birgunj - Raxaul(Bihar)
Strategic Importance: Located at south-central, Birgunj is the largest trading border point for Nepal, and is the only one with access to broad-gauge railway; falls on SRC 2.Border amenities: An Inland Clearance Depot (ICD) or a dry port jointly developed by the government and the World Bank. The ICD consists of broad-gauge railway yard, administration block, container stacking yard, covered container freight station, high-level goods platform, covered goods shed.Trade Share: 55 per cent.Ongoing Investments: An Integrated Check Post (ICP) is under consideration. Upgrading of existing roads and bridges connecting to Birgunj are also under consideration. Bilateral wagon interchange agreement for movement of larger cross border rail cargo will be beneficial.
Bhairahawa -Sunauli (UttarPradesh)
Strategic Importance: Located in the south-west, Bhairahawa is the second-largest trading border point for Nepal; falls along SRC 10.Border amenities: The existing ICD is equipped with an administration block, bituminous pavement area, inspection shed, customs litigation and goods shed, a gate complex, security office, and canteen area.Trade Share: 13 per cent.Ongoing Investments: ICP under consideration. Upgrading of existing roads and bridges connecting to Birgunj are also under consideration.
Biratnagar -Jogbani (Bihar)
Strategic Importance: Biratnagar is the major trading point in the southeast region.Border amenities: ICD is equipped with container yard for 150 TEUs, parking areas for 80 trucks, administration block, container freight station, vacant area for parking and storage, ancillary facilities, including electric substation, workshop, water-tank and car parking.Trade Share: 11 per cent.Ongoing Investments: ICP under consideration. Upgrades of existing roads and bridges connecting to Birgunj are also under consideration.
Nepalgunj -Rupaidiha (UttarPradesh)
Strategic Importance: Nepalgunj is a developing trading point in theSouth-western region.Border amenities: No ICD exists but an ICP is under consideration.Trade Share: 2 per cent.
Kakarvitta -Phulbari (WestBengal)
Strategic Importance: Kakarvitta is the main trading corridor leading toBhutan, Bangladesh and northeast India; falls along SRC 4.Border amenities: An ICD Facility has been recently completed in 2011 withADB funding, along with a road upgrading project to improve connectivity toBirgunj and Bhairahawa. The project includes installation of facilities such as asecured boundary, covered shed, weighbridge, container platforms andadministrative buildings, and a separate immigration office with all facilities.The project also includes installation of ASYCUDA selectivity and a brokers’ direct trade input module.Trade Share: 3 per cent.
Table 5.5: Key Border Points in Nepal
Nepal &correspondingBorder Post
Source: ADB (2013)

Export-Import Bank of India56
Potential for Enhancing Intra-SAARC Trade: A Brief Analysis
Bhutan &corresponding
Border Post
Strategic Importance, General Description, Investment Needs & OngoingInitiatives
Phuntsholing -West Bengal(IND)
Strategic Importance: Largest trading region for Bhutan; falls along SAARC Road Corridor 3 (SRC 3).Main Gates: Phuntsholing Gate, Lhamoi Zingkha Gate.Border amenities: Regional Revenue & Customs Office, Private Clearing Agents, 2 Parking Lots, 1 Transshipment Yard with limited cranes and equipment, 2 Warehouses.Trade Share: Export share: 66 per cent; Import share: 85 per cent.Investment Needs: The Royal Government of Bhutan has highly prioritized development of a dry port at Phuntsholing.
SamdrupJongkhar (SJ) -Assam (IND)
Strategic Importance: Located in the southeast of Bhutan, SJ has potential to become a key corridor for trade with/through Bangladesh and NE India; falls along SRC 5.Main Gates: Samdrup Gate, Phuntsholing Gate, Daifam Gate, Richenthang Trade Share: Export share: 11 per cent; Import share: 5 per centInvestment Needs: Development and upgrading of border infrastructure and cross-border road links.
Gelephu - Assam(IND)
Strategic Importance: Located in the south-center, is likely to become an important border point once the development of southern road networks is complete.Main Gates: Gelephu Gate.Trade Share: Export share: 1 per cent; Import share: 3 per cent
Samtse - Assam(IND)
Strategic Importance: Key region for trade with Nepal.Main Gates: Gomtu Gate, Samtse Gate, Puglia Gate, Other: Jytty, Bindoo, Sipsso, Trashijong.Trade Share: Export share: 19 per cent; Import share: 4 per cent
Paro Airport Strategic Importance: Only international airport in Bhutan.Trade Share: Export share: 5 per cent; Import share: 3 per cent.
Table 5.6: Key Trade Regions in Bhutan
Source: ADB (2013)

Export-Import Bank of India 57
Potential for Enhancing Intra-SAARC Trade: A Brief Analysis
D. Supply-side constraints and weak productive capacities: The effect of trade liberalisation and facilitation has been constrained by poor supply capacities especially in the LDC member countries. Industrial restructuring in these countries and investments by Indian enterprises in the region could help in expanding supply capabilities for exporting back to India (RIS, 2008). As mentioned earlier, India - Sri Lanka FTA could be one classic case where Indian investment helped in enhancing supply capability of the country. Such kind of related measures could be introduced to promote intra-regional investment to strengthen supply capabilities in the SAARC region, especially, with the LDCs.
Specific attention needs to be given to productive capacity-building, and trade related infrastructure, which are essential for growth, structural transformation, creation of employment, and enhancing intra-regional trade. Structural transformation will not only reduce exposure to shocks, but also help countries move towards higher growth path. At the same time, More domestic investment as well as official development assistance and multilateral lending, particularly in the LDC region, need to be channelled into productive capacity-building, including infrastructure and energy18.
E. Trade Financing and Related Institutional Mechanism: Access to trade finance for members of the SAARC region can be identified as one of the major requirements in promoting intra-regional trade. This gains even more significance in light of the recent
global financial turmoil.Trade finance market has benefited from the development of new technology, the emergence of new institutions and agencies in other developing countries, and the development of financing and guarantee facilities by regional development banks to fill the market gaps in financing of smaller transactions in countries with little access to international markets.
There is, therefore, a need for development of regional trade financing and related institutions that can provide finance, credit and guarantee for cross-border trade, for boosting intra-SAARC trade. Export-Import Bank of India (Exim Bank) has been sharing its experience and expertise by undertaking consultancy assignments, including setting up of such kind of institutions, and is in a position to assist in giving consultancy service for setting up similar institution in the SAARC region as well.
F. Lack of Trade Information Network: Bridging of information gap constitutes an important component of any strategy for boosting intra-SAARC trade. For instance, with adequate information, SAARC countries can identify and source within the region some of the products and services for which they depend on external supply, thus enhancing regional integration.
Taneja et al (2013) have noted that under the Committee of Experts (COE), formed under the aegis of SAFTA, Pakistan, Bangladesh and Nepal had notified number of Non-tariff measures (NTMs)/Para-tariff Measures (PTMs) that they faced in accessing the Indian
18 Boosting productive capacity in world’s poorest countries: new LDC report, 2013, http://www.safpi.org/news/article/2013/boosting-productive-capacity-world-s-poorest-countries-new-ldc-report

Export-Import Bank of India58
Potential for Enhancing Intra-SAARC Trade: A Brief Analysis
market, which after close examinations were found to be in accordance with the principle of national treatment and do not pose any barrier to entry. To bridge such kind of information gap, centres of trade information exchange could, therefore, be set up for providing information on business opportunities and trade regimes available on the region.
Strategies on Enhancing Intra-SAARc Trade
In a nutshell, strategies on boosting intra-SAARC trade would include the following
A. Enhancingexportoftheidentifiedpotentialitems: The analysis attempts to highlight the potential for enhancing trade within the region by identifying commodities at the 6-digit level in which SAARC members have potential for trade within the region. Accordingly, we have estimated that if all the identified commodities are being traded among the SAARC members to the full potential, i.e. demand for these select commodities from SAARC is met to the fullest extent possible by SAARC countries, then, the intra-SAARC trade would have increased by approximately 33 per cent. Thus, having focused only on the identified commodities would have increased the share of intra-SAARC trade to its global trade from the existing 4.3 per cent to approximately 5.7 per cent. In addition to focusing on these commodities, reductions in transaction costs, revision of sensitive list, and elimination/ reduction of the existing tariff and non-tariff barriers would further increase the share of intra-SAARC trade.
B. Revisiting and revising sensitive lists of member countries: The analysis has also brought out select commodities (identified in Chapter 4) in which SAARC members may consider revisiting and revising their sensitive
lists for LDCs and non-LDCs. Given the existing trade complementarities in select commodities and the locational advantage, SAARC members could source their import requirements from their neighbours in the region. It is expected that this revision under SAFTA, apart from tackling the existing non-tariff barriers, would further enhance trade integration among SAARC members.
c. Power Trade: Power trade among SAARC members is also an important aspect that can enhance intra-SAARC co-operation. Many regions in SAARC countries face on-peak and off-peak power shortages. Along with this, there is seasonal diversity in demand and supply of electricity (time lag, holidays, etc.) among the member nations. SAARC members can leverage on these differences and enhance power trade in these regions. For example, in the eastern region of India, the state of West Bengal faces negligible on-peak and off-peak power shortages. On the other hand, in Bangladesh, of the two zones (east and west), the east zone contains nearly all of the country’s electricity generating capacity while the west zone imports most power from the east. Therefore, there is scope for cross border electricity trade between the eastern region of West Bengal and the western region of the east zone of Bangladesh.
Apart from the above, there exists scope for joint investments for development of energy-efficient electricity transmission lines among SAARC members for facilitating power trade, similar to what India has with Nepal and Bhutan.
D. Addressing Informal Trade: The issue of high level of informal trade may be addressed by streamlining the formal channels and minimise the impediments through institutional

Export-Import Bank of India 59
Potential for Enhancing Intra-SAARC Trade: A Brief Analysis
reforms and by streamlining customs-related processes at borders, supported by well-targeted investments and strategic implementation of policies. Further, SAARC members may also consider opening more ‘border haats’ at strategic locations along their borders.
E. Transit Facility: Enhancing intra-regional connectivity could be in the form of granting transit rights to each, especially taking into consideration the three landlocked countries of the region - Bhutan, Afghanistan and Nepal. Optimum usage of existing trade routes, developments of key ports, improving facilities as well as building necessary infrastructure to ease access to the ports would pave a long way in improving intra-regional connectivity of SAARC in this part of the region.
F. Effective Exchange of Information Through collaborations: An important element of the strategy would also be effective exchange of information relating to trade/investment opportunities to potential exporters and investors among SAARC countries as also prospective partners in the region. This can be facilitated through increased bilateral/regional visits by trade and industry delegations. Such economic/ trade missions would serve to enhance awareness in the region about strengths and capabilities of countries in the region. The trade promotion measures could also include participation in
specialized regional trade and industry fairs and exhibitions and organizing buyer-sellers meets and conducting annual business forum meet for exchange of opinions and views to enhance co-operation between businessmen from SAARC through collaborations and strategic alliance.
G. Role of SAARc Development Fund (SDF) in Enhancing Intra-SAARc Trade: One of the key instruments in reducing cross-border trade related transaction costs is improving infrastructure and related services. An analysis of intra-SAARC trade reveals that the existing low level of intra-regional trade is to a certain extent due to the high trading costs among member nations, emanating on account of poor infrastructure facilities. However, fiscal space and lack of resources have limited governments’ capacity to finance large scale infrastructure projects in the region. Traditionally, infrastructure investments in South Asia have been funded largely by the public sector and various multilateral agencies including the World Bank, ADB and JBIC. In recent years, the private sector has also entered the picture. Demand for private capital has increased considerably in the South Asia region, influenced by the financing needs of large infrastructure development programs. With the operation of SDF (economic and infrastructure window) this void could be plugged to a significant extent. Details on SDF is covered in the following Chapter.

Export-Import Bank of India60
Potential for Enhancing Intra-SAARC Trade: A Brief Analysis
The SAARC Development Fund (SDF) Secretariat was inaugurated was in April 2010 during the 16th SAARC Summit. The primary objective of the SDF is to:
to promote the welfare of the people of i) SAARC Region,to improve the quality of life, andii) to accelerate economic growth, social iii) progress and poverty alleviation in the SAARC Region.
The SDF has three windows viz. Social, Economic and Infrastructure.
Social Window: This window primarily funds projects, inter alia, on poverty alleviation, social development focusing on education; health; human resources development; support to venerable/ disadvantaged segments of the society; funding needs of communities, mirco-enterprises, rural infrastructure development. The projects funded by this window are in line with SAARC’s Social Charter, SAARC Development Goals, SAARC Plan of Action on Poverty Alleviation and other SAARC agreed and endorsed plans, programmes and instruments.
Economic Window: This window extends funding primarily to non-infrastructural projects related to trade and industrial development, agriculture, service sector, science and technology and other non-infrastructure areas. It shall also be utilized for identifying, studying, developing and /or sponsoring commercially viable programmes/ projects of regional priority including their pre-feasibility and feasibility studies.
These include differences in trade regimes; restrictive customs procedures, administrative
and technical barriers; limitations of productive capacity; inadequacies of trade-related infrastructure, trade finance, and trade information; lack of factor market integration; and inadequate focus on internal market issues.
Infrastructure Window: Funds through this window would primarily be utilized for projects in areas such as energy, power, transportation, telecommunications, environment, tourism and other infrastructure areas.
Currently, only the Social Window is operational with projects under implementation in SAARC countries. SDF is in the process to operationalize the Economic and Infrastructure Windows in order to accelerating economic growth and infrastructure development in SAARC countries.
Role of Infrastructure in Enhancing Trade
Infrastructure and infrastructural services play a key role in promoting and facilitating trade. As stated earlier, intra-SAARC trade as a share of the region’s total trade is just above 4 per cent. Though high level of protectionism among the SAARC countries have impeded trade integration, poor infrastructure leading to high transportation costs have also acted as bottlenecks to inter-regional trade integration. Trading costs among SAARC members is significantly high despite most members sharing land borders.
Table 6.1 highlights the comprehensive trade cost among SAARC members. The values in each year for each country indicate the costs associated with both importing and exporting goods between two countries. Trade cost is indicated in an ad valorem equivalent form. Thus, when trade cost between
6. The Role of SAARc Development Fund

Export-Import Bank of India 61
Potential for Enhancing Intra-SAARC Trade: A Brief Analysis
Afghanistan and India in 2011 is 155.1 per cent, it implies, on average, for trading between India and Afghanistan for all tradable goods, there is an additional cost amounting to approximately 155.1 per cent of the value of goods - as compared to when the two countries trade these goods within their borders.
Bangladesh shares approximately 95 per cent of its land boundaries with India. Trading between India and Bangladesh for all tradable goods in 2007, costs approximately 114.4 per cent more than the value of goods. This was far higher compared to Bangladesh’s trade cost with its other trading partners, Hong Kong (99.5 per cent) and Netherlands (99.6 per cent).
country 1 country 2 2005 2006 2007 2008 2009 2010 2011
Afghanistan India - - - 143.3 150.7 164.1 155.1
Afghanistan Pakistan - - - 85.3 88.7 97.6 93.7
Bangladesh Bhutan 153.0 228.9 229.2 - - - -
Bangladesh India 125.2 122.8 114.4 - - - -
Bangladesh Pakistan 137.4 145.1 139.3 - - - -
Bangladesh Sri Lanka 169.8 168.5 163.9 - - - -
Bhutan India 91.9 87.6 89.7 98.7 98.7 95.0 93.5
Bhutan Nepal - - - - 181.7 160.2 235.7
Bhutan Pakistan - - 642.1 - - - -
Bhutan Sri Lanka 688.4 - - - - - -
India Maldives 291.7 283.9 279.3 372.9 274.1 284.7 279.4
India Nepal 97.9 98.3 98.6 98.9 99.2 99.4 92.3
India Pakistan 148.0 141.0 146.1 144.2 153.8 148.7 155.0
India Sri Lanka 80.2 85.0 87.0 95.0 109.9 100.9 103.6
Maldives Nepal - - - - - - 603.6
Maldives Sri Lanka 80.4 80.1 78.9 94.5 100.6 100.3 112.0
Nepal Pakistan 292.2 307.7 323.1 338.6 354.0 356.7 327.1
Nepal Sri Lanka 244.0 257.1 270.3 283.4 296.6 383.1 388.2
Pakistan Sri Lanka 124.0 122.2 125.3 132.1 136.3 134.9 145.0
Note: Derived from table 6.1- not availableSource: UNESCAP-World Bank Trade Cost Database; and Exim Bank Analysis
Average comprehensive trade cost for each member with the rest of SAARC for each year ranged from 124.4 per cent to 331.7 per cent (Table 6.2). Clearly this is one of the major barriers to enhancing inter-SAARC trade. The region needs to look at ways to improve trade and transportation linkages, including cross border rail, road, sea, and air links to enhance connectivity not only in South Asia, but also beyond viz. Central, West, South-East and East Asia and the larger Indian Ocean region. There is a need for proper warehousing, parking and banking facility; continual electricity supply; fixed telephone facility, email or fax at the land customs stations (LCSs). Infrastructure at the LCSs plays a key role in enhancing South Asia’s competitiveness and trade prospects.
Table 6.1: comprehensive Trade cost among SAARc Members (%)

Export-Import Bank of India62
Potential for Enhancing Intra-SAARC Trade: A Brief Analysis
Infrastructure Funding Gap in South Asia
Countries in South Asian region are growing at different stages of development and have differing social and economic priorities. Traditionally, infrastructure investment in South Asia has been funded largely by the public sector and various multilateral agencies including the World Bank, ADB and organisations like JBIC. These agencies help develop cross-border infrastructure, advance trade and investment, promote monetary and financial initiatives, encourage cooperation in regional public goods, and promote and support several sub-regional programs in various sectors. Fiscal space and lack of resources has limited governments’ capacity to finance large scale infrastructure projects. In recent years, however, the private sector has entered the picture to support local government in addition to its own business needs to help finance and build large-scale infrastructure projects in South Asia. Today, the private sector is the engine of growth for many countries and expansion of the private sector
Table 6.2: Average comprehensive Trade cost with SAARc (%)
2005 2006 2007 2008 2009 2010 2011
Afghanistan - - - 114.3 119.7 130.9 124.4
Bangladesh 146.4 166.3 161.7 - - - -
Bhutan 311.1 158.3 320.3 98.7 140.2 127.6 164.6
India 139.2 136.4 135.9 158.8 147.7 148.8 146.5
Maldives 186.1 182.0 179.1 233.7 187.4 192.5 331.7
Nepal 211.4 221.0 230.7 240.3 232.9 249.9 329.4
Pakistan 175.4 179.0 275.2 175.1 183.2 184.5 180.2
Sri Lanka 231.1 142.6 145.1 151.3 160.9 179.8 187.2
Note: Derived from Table 6.1- not availableSource: UNESCAP-World Bank Trade Cost Database; and Exim Bank Analysis
has become a central theme in the development agenda of many of those countries.
The demand for private capital has increased considerably in the South Asia region, influenced by the financing needs of large infrastructure development programs as well as the capitalisation needs of financial institutions. As per a World Bank report19, South Asia lags behind most regions in the world with regards to projects with private sector participation. India makes up the lion’s share of South Asia’s private sector investment hosting 380 projects with a total value of US$ 158 billion, while Pakistan attracted only US$ 28 billion in 63 projects and the rest of the region the remaining US$ 12 billion in 70 projects. For comparison, Brazil received US$ 270 billion for 467 projects over the same period. Thus, there is a need to operationalise SDF’s Economic and Infrastructure Windows. With the operation of these two windows at its optimal levels, this void could be suitably plugged, at least to a certain extent, resulting in accelerated economic growth and infrastructure development in SAARC countries.
19World Bank Group, Infrastructure Strategy Update FY2012-2015, Transformation Through Infrastructure

Export-Import Bank of India 63
Potential for Enhancing Intra-SAARC Trade: A Brief Analysis
SDF – The Way Forward
Trade finance plays an important role in facilitating trade by securing finance in order to manage cash flows, risks and costs; raise funds and capital; and aids in expansion of international trade. Thus, it is different from normal commercial bank lending, mortgage lending and insurance. Importers and exporters look for any competitive advantage that would help them to increase their business. For instance, flexible payment terms enable a product to become more competitive, when there are similar products from different countries. Similarly, the cost of finance (interest rate and other fees) has a strong impact on price and can render a product uncompetitive in the international market.
A Study by Auboin and Engemann (2013) reveals the importance of access to trade finance to promote exports. There have been huge challenges to trade finance especially for traders in low-income countries, in obtaining low cost finance for international transaction, particularly import finance. A recent OECD/WTO (2013) study on Aid for Trade also pointed out that lack of access to trade finance has been ranked as the main barrier to entering, establishing or moving up the international value chain. In fact, the study had also included limited access to trade finance as one of the most important constraints in intra-regional trade across various regional
organisations. Hence, trade finance becomes an essential element of enhancing export capabilities, more so, for the firms in developing countries. Broadly speaking, there are four key players involved in trade financing, viz. commercial banks, private insurers, regional and multilateral financial institutions and export credit agencies.
Among South Asian countries, India is the only country to have a dedicated export credit agency exclusively for financing exports from the country. Further, the South Asia region does not have regional development banks (RDBs) like ECOWAS Bank for Investment and Development (EBID) in Economic Community of West African States (ECOWAS), BOAD for West Africa, Development Bank of Latin America (formerly CAF) for Latin America, etc. It may be noted that EBID also had initially started as ECOWAS Fund for Co operation, Compensation and Development (ECOWAS Fund) and was later transformed into a regional bank20.
As a long-term strategy, SAARC Development Fund, therefore, could assume the role of a multilateral financial institution for the region, with active support from member countries. Some of the roles and functions of SDF also may be further fine-tuned with focus on financing trade as well as trade promoting infrastructure within the region.
20 http://bidc-ebid.com/en/historique.php

Export-Import Bank of India64
Potential for Enhancing Intra-SAARC Trade: A Brief Analysis
7. Export-Import Bank of India – A Partner in Development of the SAARc Region
Set up by an act of the Parliament in 1982, Export-Import Bank of India’s (Exim Bank) mandate was to enhance exports and integrate India’s international trade and investment with its economic growth.
Commencing operations as a purveyor of export credit, like other Export Credit Agencies in the world, Exim Bank has evolved into an institution that plays an important role in partnering Indian industries, particularly the Small and Medium Enterprises (SMEs), in their globalisation efforts,
through a wide range of products and services offered at all stages of the business cycle, starting from import of technology to export production, export marketing, pre-shipment and post-shipment and overseas investment.
Exim Bank offers a diverse range of financing services for the Indian exporters, including a variety of Export Credit facilities, financing import of capital goods and bulk imports and Finance for Export Oriented Companies (Exhibit 7.1).
Exhibit 7.1: Financing Programmes of Exim Bank of India

Export-Import Bank of India 65
Potential for Enhancing Intra-SAARC Trade: A Brief Analysis
Major Programmes
• Project Exports Finance
Exim Bank is the coordinator and facilitator for the promotion of project exports from India. The Bank serves as the focal point of the Working Group on project exports, and plays a pivotal role in supporting Indian companies in execution of projects by offering both funded and non-funded facilities for overseas turnkey projects, civil construction contracts, supplies as well as technical and consultancy service contracts. Funded facilities include pre-shipment and post-shipment credit, and Export Project Cash Flow Deficit Finance (EPCDF), while non-funded facilities include advance payment guarantee, performance guarantee, retention money guarantee, and other guarantees in lieu of customs duty or security deposit for expatriate labour, equipment etc.
As on March 31, 2014, 319 project export contracts valued at ` 1,40,326 crore (approx. US$ 23.42 billion) supported by the Bank, were under execution in 74 countries across Asia, Africa and CIS by 99 Indian companies. Out of which, 61 project export contracts valued at ` 19,419.7 crore (approx. US$ 3.23 billion; i.e 13.8 per cent of total project export contracts), were in the SAARC region21. Out of these projects under execution, 42 projects valued at ` 6,300.9 crore are under Exim Bank’s GOI-supported LOCs.
Project exports from India have been increasing steadily over the years, indicating the growing stature of Indian expertise overseas in a wide range of activities. An analysis of project exports supported by the Bank highlights significant jump in the number and value of projects supported in the SAARC Region from 25 project as on March 31, 2005, to 61 project export contracts as on March 31, 2014.
Sectoral composition of projects supported has also diversified during the period. As on March 31, 2005, the power generation and transmission sector accounted for 57.2 per cent of contracts under execution in SAARC, while infrastructure and engineering & construction accounted for 24.6 per cent and 0.9 per cent, respectively. This spread diversified to power generation and transmission sector dominating at 52.7 per cent of the contracts under execution, however with a declined share; while that of infrastructure increased to 29.7 per cent and engineering & construction increased to 6.9 per cent, as on March 31, 2014.
The geographical spread of project exports in the SAARC region, in terms of the number of projects under execution, was the highest in Bangladesh with 9 of the 25 projects under execution as on March 31, 2005, followed by Bhutan (8) and Afghanistan (4). This diversified to Sri Lanka having the highest number of projects under execution in the SAARC region, with 18 out the 61 ongoing contracts, as on March 31, 2014, followed by Bangladesh (17) and Nepal (14).
From the perspective of region-cum-sector concentration, in terms of value of contracts under execution, as on March 31, 2005, Bhutan (48.9 per cent) dominated the picture, ranking first by a wide margin with its highest power generation and transmission contracts. As on March 31, 2014, Bhutan continued to dominate the region-cum-sector concentration, in terms of value of contracts under execution, with 42.6 per cent of the overall contracts under execution, with the highest power generation and transmission contracts. The dominance is almost certainly an outcome of the large number of project opportunities in the hydro power sector in Bhutan. This was followed by Sri Lanka, accounting for 33.5 per cent of the overall contracts under execution as on March 2014, in terms of value of contracts under execution.
21In the following analysis, Exim Bank’s exposure to SAARC excludes India

Export-Import Bank of India66
Potential for Enhancing Intra-SAARC Trade: A Brief Analysis
Infrastructure projects, particularly railway rehabilitation, dominated the projects supported in Sri Lanka.
• Buyer’s Credit under National Export Insurance Account (BC-NEIA)
In order to provide further impetus to project exports from India on medium or long term basis, a new product called Buyer’s Credit under National Export Insurance Account (NEIA) was introduced in April 2011. Under this programme, Exim Bank facilitates project exports from India by way of extending credit facility to overseas sovereign governments and government owned entities for import of goods and services from India on deferred credit terms with NEIA cover. Indian exporters can obtain payment of eligible value from Exim Bank, without recourse to them, against negotiation of shipping documents. NEIA is a Trust, set up by Ministry of Commerce and Industry (MOCI), Government of India, for providing medium to long term export credit insurance covers for promoting project exports from India, administered by Export Credit Guarantee Corporation of India Limited (ECGC).
As on March 31, 2014, the Bank has sanctioned an aggregate amount of US$ 444 million for 5 projects valued US$ 520 million under this programme. Of which, an aggregate amount of US$ 349.62 million (78.7 per cent of the total sanctions) for 3 projects valued US$ 421.61 million were in the SAARC region.
• Lines of Credit
A Line of Credit (LOC) is a financing mechanism through which Exim Bank extends support for export of projects, equipment, goods and services from India. Exim Bank extends LOCs on its own and also at the behest and with the support of Government of India (GOI), to overseas financial
institutions, regional development banks, sover-eign governments and other entities overseas.
As on March 31, 2014, the total number of operative LOCs stood at 189, and covered 75 countries in Africa, Asia, CIS, Europe and Latin America, with credit commitments aggregating US$ 10.33 billion. Of these, 173 LOCs aggregating to US$ 10.03 billion, covering 62 countries are guaranteed by GOI. During the same period, there were 10 operative LOCs in the SAARC region with credit commitments of US$ 2.3 billion (22.9 per cent of the total operative GOI LOCs) covering Afghanistan, Bangladesh, Maldives, Nepal, and Sri Lanka. Exim Bank had also extended a GOI-supported product specific LOC of US$ 150 million to Ceylon Petroleum Corporation which has been fully repaid. Thus, Exim Bank has so far extended 11 LOCs worth US$ 2.5 billion in the SAARC region (Annexure 8).
• Overseas Investment Finance
Exim Bank’s Overseas Investment Finance is a comprehensive programme providing equity finance, loans, guarantees and advisory services to support Indian outward investments including overseas acquisitions. Term loans offered to Indian companies, are for both, equity investment in their ventures overseas as well as for onlending purposes. The Bank also extends term finance directly to overseas ventures of Indian companies. Besides, Exim Bank also undertakes Direct Equity Stake in Indian Ventures Abroad, to enable Indian companies to supplement their equity with Exim Bank’s equity contribution.
As on March 31, 2014, Exim Bank has provided finance to 494 ventures set up by 391 companies in 80 countries, with an aggregate assistance of ` 37,139.37 crore. With the SAARC region, Exim Bank has provided finance to 11 ventures set up by 10 companies in three countries, with

Export-Import Bank of India 67
Potential for Enhancing Intra-SAARC Trade: A Brief Analysis
an aggregate assistance of ` 340.29 crore (1 per cent of the overall assistance).
Exim Bank in SAARc Region
Countries in SAARC have always been a focus region for the Government of India, and thus a critical component of the Bank’s strategy to promote and support two-way trade and investment. To enhance bilateral trade and investment relations with other SAARC members, and in line with the SAARC charter, Exim Bank operates the aforesaid programmes in the region.
2004-05 2005-06 2006-07 2007-08 2008-09 2009-10 2010-11 2011-12 2012-13 2013-14
Exim Bank’s Exposure to SAARC 61.1 722.7 1,429.5 1,485.3 2,268.5 2,162.8 10,006.5 13,302.6 15,165.4 15,989.3
Exim Bank’s overall exposure 23,672.5 25,445.5 35,181.1 43,139.2 51,097.2 56,737.2 69,408.8 101,801.5 102,552.7 135,500.3
Share SAARC in Exim Bank’s overall expo-sure
0.3% 2.8% 4.1% 3.4% 4.4% 3.8% 14.4% 13.1% 14.8% 11.8%
Exim Bank’s overall exposure to SAARC stood at ` 15,989.3 crore during 2013-14 (Table 7.1). The share of SAARC in Exim Bank’s exposure has grown significantly during the decade from 0.3 per cent in 2004-05 to 11.8 per cent during 2013-14.
Exim Bank’s programmes in the SAARC region, in addition to enhancing India’s and trade investment relations with the region has played a developmental role in the host country. Programmes operating in the SAARC region are broadly under Project Exports, LOCs, and Overseas Investment Finance (Exhibit 7.2).
Table 7.1: Exim Bank’s Exposure in the SAARc region during 2004-05 to 2013-14 (` crore)
Note: Exposure to a Particular Country = LOC Commitment + Outstanding Amount + non-funded exposure (guarantees, LCs, SBLC) + unutilized sanctions (funded and non-funded)
Exhibit 7.2: Exim Bank of India’s Global Presence (2009-10 to 2013-14)

Export-Import Bank of India68
Potential for Enhancing Intra-SAARC Trade: A Brief Analysis
AFghANISTAN
v Project Exports
Some of the key large value projects approved during the period 2004-05 to 2013-14, are highlighted as under:
- Construction of Afghan Parliament Building and Indian Chancery Building.
- Rehabilitation of Highway between Kandahar and Kabul.
- Construction of Kandahar to Heart Highway Road Project.
- Supply and erection of 220 kV power transmission line.
v Lines of credit
Exim Bank, at the behest of the Government of India, extended an LOC of US$ 50 million to the Government of Afghanistan to finance export of goods and services, and project exports.
BANgLAdESh
v Project Exports
Some of the key large value projects approved during the period 2004-05 to 2013-14, are highlighted as under:
- Design, manufacture, erection, testing and commissioning of 360 MW Bheramara Combined Cycle Power Plant Development Project.
- Supply and installation of 2X120 MW gas turbine power plant.
- Construction of Jatrabari – Gulistan flyover. - Construction of Cement Plant.
v Lines of credit
Exim Bank, at the behest of the Government of India, has an operative LOC of US$ 800 million with the Government of Bangladesh to finance export of goods and projects including development of railway infrastructure, dredging, construction of bridges, procurement of buses, locomotives, coaches and rehabilitation of Saidpur Workshop.
Approved contracts under this LOC include:
- Procurement of double-decker, single-decker and articulated buses
- Procurement of Broad Gauge (BG) and Meter Gauge (MG) locomotives
- Construction of Bhairab and Titas Rail bridge with approach rail lines and Khulna-Mongla port rail line, including feasibility study
- Supply of dredgers and ancillary crafts and accessories
- Modernisation and Strengthening of Bangladesh Standards and Testing Institution (BSTI)
vBuyer’s credit
Exim Bank extended Buyer’s Credit Facility to finance import of capital machinery and equipment from India for setting up a steel melting and billet casting plant.
v Finance for Ventures Overseas
Setting-up of Denim Fabric manufacturing unit in Bangladesh.

Export-Import Bank of India 69
Potential for Enhancing Intra-SAARC Trade: A Brief Analysis
BhuTAN
v Project Exports
Some of the key large value projects approved during the period 2004-05 to 2013-14, are highlighted as under:
- Construction of diversion tunnel, dam, intake and desilting arrangement.
- Construction of diversion tunnel, dam, intake and desilting arrangement for 990 mw Punatsangchhu-II.
- Design, manufacture, supply, erection, testing and commissioning of 6 generating units and associated auxiliaries for 1200 MW Punatsangchhu-I Hydroelectric Project.
- Design, manufacture, supply, erection, testing and commissioning of 6 power generating units and associated auxiliaries for 1020 MW Punatsangchhu-II Hydroelectric Project.
- Construction of head race tunnel, surge shaft, butterfly valve chamber, pressure shafts, power house and tail race tunnel for 990 mw Punatsangchhu-II Hydroelectric Project.
- Construction of Tunnel for Tala Hydro Electric Project (Package C1).
v Buyer’s credit
Exim Bank extended Buyer’s Credit Facility to finance import of machinery, equipment, other materials and construction services from India for setting up a greenfield cement project.
MALdIvES
vProject Exports
Some of the key large value projects approved during the period 2004-05 to 2013-14, are highlighted as under:
- Construction of 485 housing units on design build basis. The contract was executed under GOI-Supported LOC.
v Lines of credit
Exim Bank, at the behest of the Government of India, extended an LOC of US$ 40 million to the Government of Maldives for financing the export of eligible goods, services, machinery and equipment including consultancy services from India for the construction of 500 housing units in Maldives.
Box 2: Tala hydroelectric Project, Bhutan
The 1,020 MW Tala hydroelectric project is a joint project between India and Bhutan, generating 4,865 million kWh/yr. The dam is built on the Wangchu River, in Tala Village located in Chukha Dzongkhag in western Bhutan. The project is entirely funded by Government of India (GOI), 60 per cent by way of grant and 40 per cent by way of loan. Surplus electricity from the project will be purchased by GOI. Bhutan aims to export 10,000MW of power by the year 2020.
The construction contract for this project was awarded to four Indian project exporters Bharat Heavy Electricals Limited (BHEL), Hindustan Construction Company Ltd. (HCC), Jaiprakash Associates Ltd. (JAL), and Larsen & Toubro Ltd. (L&T). Construction of dam and Head Race Tunnel (HRT) was awarded to HCC, JAL and L&T, while construction of surge shaft, pressure shaft, power house complex and tail race tunnel was awarded to JAL and BHEL. Exim Bank has extended support to all these four Indian Companies.

Export-Import Bank of India70
Potential for Enhancing Intra-SAARC Trade: A Brief Analysis
NEPAL
vProject Exports
Some of the key large value projects approved during the period 2004-05 to 2013-14, are highlighted as under:
- Constructing the Rahughat Hydroelectric Station.
- Supply of Optic Fibre Cable.
vLines of credit
Exim Bank extended a GOI-supported LOC of US$ 100 million to the Government Nepal in June 2006 for financing various road projects, rural electrification projects, power transmission projects and hydropower projects in Nepal.
In 2010, Exim Bank, at the behest of the Government of India, extended its second line of US$ 250 million for financing infrastructure projects such as highways, airports, bridges, irrigation, roads,
railways, and hydropower projects. Accordingly, Exim Bank has a cumulative line of US$ 350 million with the Government of Nepal.
Under the LOC of US$ 100 million, select approved contracts include:
- Rehabilitation of Devighat hydro power plant
- Supply and construction of Rahughat Hydroelectric Project
- Upgradation of 11 roads in Nepal
i. Tulsipur-Salyan Road
ii. Sanfebagar-Mangalsen Road
iii. Chandranigahapur-Gaur Road
iv. Bhaluwang-Pyuthan Road
v. Chakchake-Liwang Road
vi. Surkhet-Ranimatta-Dailekh Road
vii. Sanfebagar - Martadi Road
viii. Hilepani-Diktel Road
ix. Basantpur-Myanglang Road
x. Ameliya Tulsipur Road
xi. Maldhunga- Beni Road
Box 3: Nepal Transmission Line Project
Under the GOI-supported LOC of US$ 100 million to Nepal, M/s. Tata Projects Ltd. is executing a contract valued at US$ 7 million for the 400 kV D/C Dhalkebar-Bhittamod (Nepal border) section of the Dhalkebar (Nepal) – Muzaffarpur (India) transmission line.
Significance of the Nepal Transmission Line Project
The Nepal Transmission Line Project is an initiative to facilitate the development of transmission interconnection between India and Nepal for the mutual interest and benefit of both countries. The purpose of the Dhalkebar (Nepal) – Muzaffarpur (India) transmission line would be to import power from India in the initial years in order to reduce the power shortage in Nepal and ultimately to export power to India when sufficient hydropower generation would develop in Nepal.

Export-Import Bank of India 71
Potential for Enhancing Intra-SAARC Trade: A Brief Analysis
Under the LOC of US$ 250 million, select approved contracts include:
o Rahughat Hydroelectric Project Phase II o 220 kV Koshi Corridor Transmission Line
Project o 132 kV Solu Corridor Transmission Line
Project o 132 kV Modi- Lekhnath Transmission
Line Project
v Finance for Overseas Investment
- Setting up of 120 MW hydel power plant
- Acquisition of Nepal Jalabidyut Pravardan Tatha Bikash Ltd, Nepal (NJPBL), which is involved in developing hydropower projects and investing in infrastructure development projects.
SRI LANkA
v Project Exports
Some of the key large value projects approved during the period 2004-05 to 2013-14, are highlighted as under:
- Design and reconstruction of the Omanthai to Pallai Railway Line.
- Construction of the Madhu Road to Talai Mannar Railway Line.
- Medawachchiya to Madhu Road Railway Line.
- Civil and mechanical & engineering works for the Aluthgama, Mathugama and Agalawatta Integrated Water Supply Project.
- Pallai-Kankesanthurai Railway Line.
- Design, construction and delivery of two advanced offshore patrol vessels.
v Lines of credit
Exim Bank at the behest of the Government of India has extended six LOCs to the Government of Sri Lanka, cumulating to US$ 1.2 billion. Of which, LOC of US$ 150 million to Ceylon Petroleum Corporation, Sri Lanka has been fully repaid. The existing LOCs are mainly towards financing the upgradation of the railway system of Sri Lanka.
- LOC to Ceylon Petroleum Corporation, Sri Lanka of US$ 150 million for financing the purchase of petroleum products from Indian public sector oil marketing companies on term contract.
- Five LOCs valued at US$ 1066.2 million for the re-construction of railway lines in the northern province of Sri Lanka. Under these LOCs, select approved contracts include upgradation of:
o Southern Railway Line from Colombo to Matara
o Medawachchiya - Madhu railway line
o Pallai-Kankesanthurai railway line
o Omanthai - Pallai sector
o Madhu Church - Tallaimannar sector
o Setting up of signaling and telecommuni-cations systems for the Northern railway line
v Buyers credit under National Export Insurance Account
As on March 31, 2014, Exim Bank has sanctioned an aggregate US$ 349.6 million for three projects valued US$ 421.6 million in Sri Lanka under its BC-NEIA Programme. A summary of the projects covered are as follows:

Export-Import Bank of India72
Potential for Enhancing Intra-SAARC Trade: A Brief Analysis
- Financing a water treatment and distribution project
- Financing the design, construction and delivery of two advanced offshore patrol vessels
- Execution of the Plant & Design – Build Contract for Civil and Mechanical & Engineering Works for the Aluthgama, Mathugama and Agalawatta Integrated Water Supply Project
v Finance for Ventures Overseas
- Setting up of manufacturing facility in the agro and food processing industry.
• Exim Bank’s Research and Advisory Services
Exim Bank offers a diverse range of information, advisory and support services, which enable exporters to evaluate international risks, exploit export opportunities and improve competitiveness. The Bank also carries out research on issues related to international trade, economics, and sector / product / country studies, which it publishes in the form of Occasional Papers and Working Papers.
Select studies in the SAARC region include:
- SAARC: An Emerging Trade Bloc
- BIMST-EC Initiative: A Study of India’s Trade and Investment Potential with Select Asian Countries
- Indian Ocean Rim Association for Regional Co-operation (IOR-ARC): A Study of India’s Trade and Investment Potential
- India’s Trade and Investment Relations with LDCs (Least Developed Countries): Harnessing Synergies
- Fresh Fruits, Vegetables and Dairy Products: India’s Potential For Exports to Other Asian Countries
- Potential for Enhancing India’s Trade with Pakistan: A Brief Analysis
Exim Bank’s Institutional Linkages in the SAARc region
The Bank has fostered a network of alliances and institutional linkages with multilateral agencies, export credit agencies, banks and financial institutions, trade promotion bodies, and investment promotion boards in the SAARC region to help create an enabling environment for supporting trade and investment. Select institutions in the SAARC region with which Exim Bank has entered into MOUs/ MOCs include: Afghanistan Investment Support Agency (AISA); Industrial Promotion and Development Co. of Bangladesh Ltd.; Hatton National Bank Ltd., Sri Lanka; Board of Investment of Sri Lanka; SME Bank of Sri Lanka; and Ceylon Chamber of Commerce, Sri Lanka.
Exim Bank as an International consultant
Exim Bank is uniquely placed as a key financial institution, with experience as an actual practitioner, to synthesise the needs of a newly industrialised economy with contemporary experience from developing and developed countries. The Bank is registered with the World Bank and Asian Development Bank as a consulting organisation.Exim Bank has rendered assistance to a number of institutions in the developing world. Overseas assignments undertaken include:

Export-Import Bank of India 73
Potential for Enhancing Intra-SAARC Trade: A Brief Analysis
- Strategy paper for SAARC Development Fund to promote intra-regional projects in the South Asian Region
- Pre-feasibility study for setting up Commonwealth Trade and Development Bank (CTIB)
- Capacity building of export credit insurance industry to enhance the international trade competiveness of Sri Lanka
In sum, Exim Bank, with its comprehensive range of financing, advisory and support services, seeks to create an enabling environment for enhancing two-way flow of trade, investment and technology between India and the other SAARC members, while also promoting infrastructure development, facilitating private sector development in host countries, and contributing towards institutional building in the region.

Export-Import Bank of India74
Potential for Enhancing Intra-SAARC Trade: A Brief Analysis
References
Ahmed, Sadiq and Ghani, Ejaz (Ed.), 2007, South Asia: Growth and Regional Integration, The World Bank, Washington, DC.
Asian Development Bank, 2011, Regional Cooperation Strategy, South Asia, 2011-15, Philippines, November.
Auboin, Marc and Engmann, Martina, 2013, Trade Finance in Period of Crisis: What have we learned in recent years?, Staff Working Paper ERSD - 2013-01, World Trade Organisation, Geneva, January.
CUTS CITEE, 2014, Trade Consignment Meeting in South Asia, February 21, 2014, HTTP://WWW.CUTS-CITEE.ORG/tcmsa/pdf/Report-Project_Inception_Meeting-TCMSA.pdf
FICCI, 2014, The South Asian Century: Progressing Towards Regional Integration - A Study, Federation of Indian Chambers of Commerce and Industries, New Delhi, January.
Mirza, Tasneem and Bacani, Eleanor, 2013, Addressing Hard and Soft Infrastructure Barriers to Trade in South Asia, ADB South Asia Working Paper Series No. 16, Asian Development Bank, February.
Mukherji, Indra Nath and Iyengar, Kavita, 2013, Deepening economic cooperation between India and Sri Lanka, Philippines: Asian Development Bank.
Research and Information System for Developing Countries (RIS), 2008, South Asia Development and Cooperation Report 2008, Oxford University Press, New Delhi.
Research and Information System for the Non-Aligned and Other Developing Nations, 2002,
South Asia Development & Cooperation Report 2001/02, New Delhi.
Srinivasan, P.V., 2011, “Regional Cooperation and Integration (RCI) through Cross-Border Infrastructure Development in South Asia: Impact on Poverty”, Asian Development Bank.
Taneja, Nisha, 2005, Informal trade in south Asia: how to channelize to a formal route? CUTS International Briefing paper, RECA 5/2005. CUTS International
Taneja, Nisha, Ray, Saon, Kaushal, Neetika and Chowdhury, Devjit Roy, 2013, Enhancing Intra-SAARC Trade: Pruning India’s Sensitive List under SAFTA, Indian Council for Research on International Economic Relations (ICRIER), New Delhi.
Taneja, Nisha, Shravani Prakash, and Pallavi Kalita, 2013, India’s Role in Facilitating Trade under SAFTA, Working Paper No. 263, Indian Council for Research on International Economic Relations (ICRIER), New Delhi.New Delhi.
United Nations Economic and Social Commission for Asia and the Pacific, South and South West Asia Office, 2013 Regional Cooperation for Inclusive and Sustainable Development: South and South-West Asia Development Report 2012-13, Routledge, New Delhi, 2012
Weerahewa, Jeevika, 2009, Impact of Trade Facilitation Measures and Regional Trade Agreements on Food and Agricultural Trade in South Asia, Asia-Pacific Research and training Network on Trade Working Paper Series No. 69, June.
World Bank, 2013, Doing Business 2014: South Asia, Washington, D.C.
World Trade Organisation, 2013, Aid for Trade at a Glance 2013: Connecting to Value Chains, Geneva.

Export-Import Bank of India 75
Potential for Enhancing Intra-SAARC Trade: A Brief Analysis
ANNEXuRE - 1
1 (A) Vehicles other than railway, tramway (hS 87)
Potential Export Items for Bangladesh in the SAARc Region
hS code Product label
SAARc’s imports
from Bangladesh
Bangladesh’s exports to
world
SAARc’s imports
from world
Preferential access under
SAFTA
Sensitive list under
SAFTA
uS$ mn uS$ mn uS$ mn
871200Bicycles and other cycles (including delivery tricycles), not motorised
0.08 65.5 63.7India, Bhutan, Maldives, Nepal, Afghanistan
Sri Lanka, Pakistan
Source: ITC Trade Map, Geneva; and Exim Bank Analysis.

Export-Import Bank of India76
Potential for Enhancing Intra-SAARC Trade: A Brief Analysis
1 (B) Raw hides, skins and leather (hS 41)
hS code Product label
SAARc’s imports
from Ban-gladesh
Bangla-desh’s
exports to world
SAARc’s imports
from world
Preferential ac-cess under SAFTA
Sensitive list under SAFTA
uS$ mn uS$ mn uS$ mn
410419Hides and skins of bovine “incl. buffalo” or equine animals
0.517 14.0 118.2India, Pakistan, Sri Lanka, Bhutan, Maldives, Nepal
Afghanistan
410449Hides and skins of bovine “incl. buffalo” or equine animals
0.71 15.0 93.3India, Pakistan, Sri Lanka, Bhutan, Maldives, Nepal
Afghanistan
410712Grain splits leather “incl. parchment-dressed leather”
0.00 90.4 9.9India, Pakistan, Sri Lanka, Bhutan, Maldives, Nepal
Afghanistan
411310Leather further prepared after tanning or crusting “incl. parchment
0.03 17.4 9.6India, Pakistan, Sri Lanka, Bhutan, Maldives, Nepal
Afghanistan
410792Grain splits leather “incl. parchment-dressed leather”, of the portion
0.00 37.0 9.3India, Pakistan, Sri Lanka, Bhutan, Maldives, Nepal
Afghanistan
410711Full grains leather “incl. parchment-dressed leather”, unsplit
0.01 5.9 7.9India, Pakistan, Sri Lanka, Bhutan, Maldives, Nepal
Afghanistan
Source: ITC Trade Map, Geneva; and Exim Bank Analysis.

Export-Import Bank of India 77
Potential for Enhancing Intra-SAARC Trade: A Brief Analysis
1 (c) Footwear, gaiters and parts thereof (hS 64)
hS code
Product label
SAARc’s imports from Bangladesh
Bangladesh’s exports to
world
SAARc’s imports
from world
Preferential access under
SAFTA
Sensitive list under
SAFTAuS$ mn uS$ mn uS$ mn
640299Footwear, outer soles/uppers of rubber or plastics
0.009 16.5 125.2India, Maldives, Bhutan, Afghanistan
Nepal,Sri Lanka, Pakistan
640419Footwear o/t sports, with outer soles of rubber/plastics
0.47 63.9 94.3India, Maldives, Bhutan, Afghanistan,
Nepal,Sri Lanka, Pakistan
640399Footwear, outer soles of rubber/plastics uppers of leather
0.289 149.9 57.5India, Maldives, Bhutan, Afghanistan,
Nepal,Sri Lanka, Pakistan
640610Uppers and parts thereof, other than stiffeners
0.075 11.9 36.7
India, Maldives, Bhutan, Afghanistan, Pakistan
Nepal,Sri Lanka,
640411Sports footwear w outer soles of rubber or plastics
0.02 9.6 28.4
India, Maldives, Bhutan, Sri Lanka, Afghanistan,
Nepal, Pakistan
Source: ITC Trade Map, Geneva; and Exim Bank Analysis.
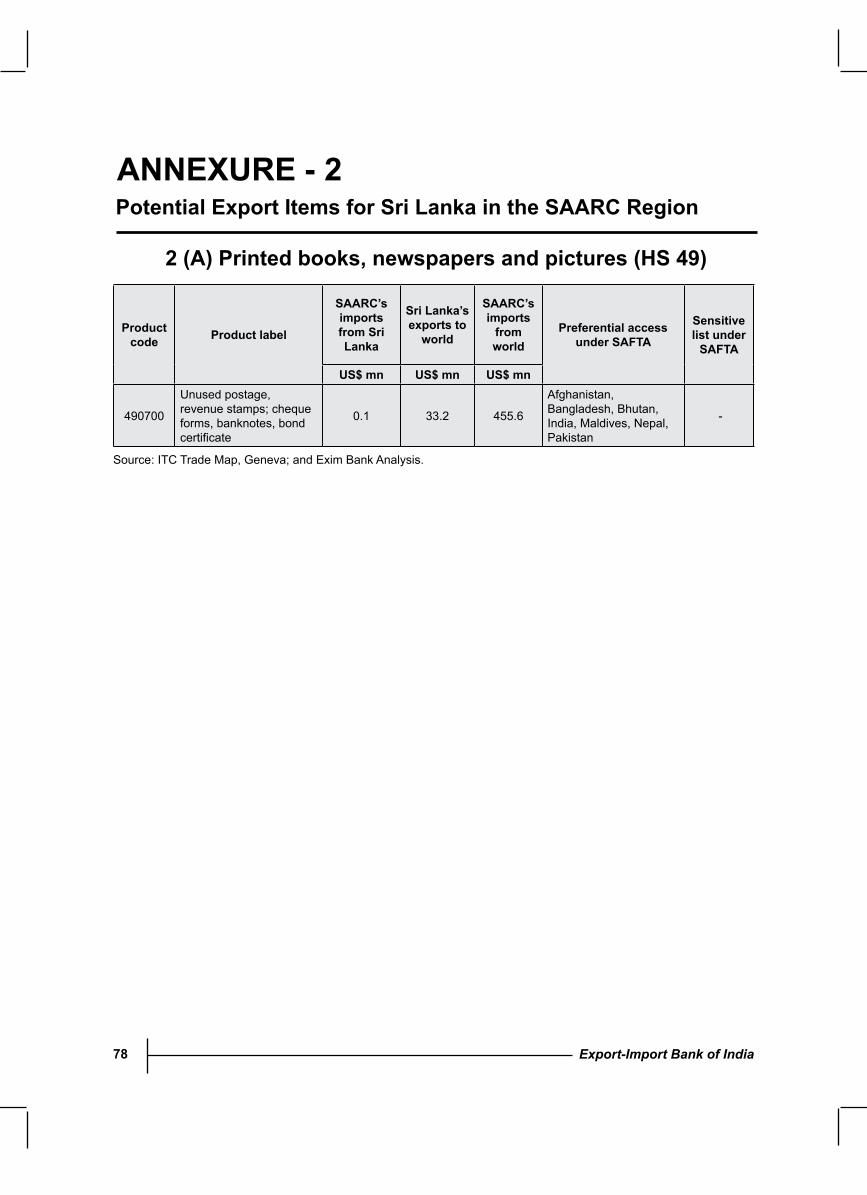
Export-Import Bank of India78
Potential for Enhancing Intra-SAARC Trade: A Brief Analysis
ANNEXuRE - 2
2 (A) Printed books, newspapers and pictures (hS 49)
Potential Export Items for Sri Lanka in the SAARc Region
Product code Product label
SAARc’s imports from Sri Lanka
Sri Lanka’s exports to
world
SAARc’s imports
from world
Preferential access under SAFTA
Sensitive list under
SAFTA
uS$ mn uS$ mn uS$ mn
490700
Unused postage, revenue stamps; cheque forms, banknotes, bond certificate
0.1 33.2 455.6
Afghanistan, Bangladesh, Bhutan, India, Maldives, Nepal, Pakistan
-
Source: ITC Trade Map, Geneva; and Exim Bank Analysis.

Export-Import Bank of India 79
Potential for Enhancing Intra-SAARC Trade: A Brief Analysis
2 (B) Toys, games, sports requisites (hS 95)
Product code
Product label
SAARc’s imports from Sri Lanka
Sri Lanka’s
exports to world
SAARc’s imports
from world
Preferential access under SAFTA
Sensitive list under
SAFTA
uS$ mn uS$ mn uS$ mn
950590Festive, carnival or other entertainment art
0.01 5.1 13.9
Afghanistan, Bangladesh, Bhutan, India, Maldives, Nepal, Pakistan
-
950510Articles for Christmas festivities
0.0 2.7 8.8
Afghanistan, Bangladesh, Bhutan, India, Maldives, Nepal, Pakistan
-
950629Water-skis, surf-boards and other watersport equipment
0.01 17.0 4.8
Afghanistan, Bangladesh, Bhutan, India, Maldives, Nepal, Pakistan
-
950720Fish-hooks, whether or not snelled
0.0 2.3 3.1
Afghanistan, Bangladesh, Bhutan, India, Maldives, Nepal, Pakistan
-
Source: ITC Trade Map, Geneva; and Exim Bank Analysis.

Export-Import Bank of India80
Potential for Enhancing Intra-SAARC Trade: A Brief Analysis
ANNEXuRE - 3
3 (A) Pearls, precious stones, metals and coins (hS 71)
Potential Export Items for Pakistan in the SAARc Region
Product code
Product label
SAARc’s imports
from Pakistan
Pakistan’s exports to
world
SAARc’s imports
from world
Preferential access under
SAFTA
Sensitive list under
SAFTAuS$ mn uS$ mn uS$ mn
711319 Articles of jewellery & parts 0 1522.7 5205.2Bangladesh, Bhutan, India, Nepal, Sri Lanka
Afghanistan, Maldives
710310Prec/semi-prec stones (o/t diamonds) unworked/simply sawn/rough shaped
0.1 4.0 297.8
Bangladesh, Bhutan, India, Maldives, Nepal, Sri Lanka
Afghanistan
711311Articles of jewellery & parts thereof of silver
0 88.2 63.4
Bangladesh, Bhutan, India, Maldives, Nepal, Sri Lanka
Afghanistan
711411Articles of gold/silver smith & parts of silver
0 6.6 2.9
Bangladesh, Bhutan, India, Maldives, Nepal, Sri Lanka
Afghanistan
Source: ITC Trade Map, Geneva; and Exim Bank Analysis.

Export-Import Bank of India 81
Potential for Enhancing Intra-SAARC Trade: A Brief Analysis
3 (B) Sugars and sugar confectionery (hS 17)
Product code
Product label
SAARc’s imports
from Pakistan
Pakistan’s exports to
world
SAARc’s imports
from world
Preferential access under
SAFTA
Sensitive list under SAFTA
uS$ mn uS$ mn uS$ mn
170199 Refined sugar, in solid form 4.2 161.4 376.4Bhutan, Maldives
Afghanistan, Bangladesh, India, Nepal, Sri Lanka
170490Sugar confectionery (including white chocolate),not containing cocoa
0.2 26.6 30.5 Bhutan, India
Afghanistan, Bangladesh, Maldives, Nepal, Sri Lanka
170230 Glucose & glucose syrup 0.004 20.8 19.5Afghanistan, Bhutan, India, Maldives, Nepal
Bangladesh, Sri Lanka
170112 Raw sugar, beet 0 5.8 8.8Afghanistan, Bhutan, India, Maldives, Nepal
Bangladesh, Sri Lanka
170410Chewing gum containing sugar, except medicinal
0.005 23.4 5.7Bhutan, India, Maldives
Afghanistan, Bangladesh, Nepal, Sri Lanka
Source: ITC Trade Map, Geneva; and Exim Bank Analysis.

Export-Import Bank of India82
Potential for Enhancing Intra-SAARC Trade: A Brief Analysis
3 (c) Tools, implements, cutlery of base metal (hS 82)
Product code
Product label
SAARc’s imports
from Pakistan
Pakistan’s exports to
world
SAARc’s imports
from world
Preferential access under
SAFTA
Sensitive list under SAFTA
uS$ mn uS$ mn uS$ mn
821420Manicure or pedicure sets and instruments (including nail files)
0.04 52.7 6.9Afghanistan, Bhutan, India, Maldives, Nepal
Bangladesh, Sri Lanka
821300Scissors, tailors’ shears and similar shears, and blades
0.05 5.8 6.3
Afghanistan, Bhutan, India, Maldives, Nepal, Sri Lanka Bangladesh
821192Butcher’s knives, hunting knives and other knives having fixed blades
0 6.8 2.6Afghanistan, Bhutan, India, Maldives, Nepal
Bangladesh, Sri Lanka
Source: ITC Trade Map, Geneva; and Exim Bank Analysis.

Export-Import Bank of India 83
Potential for Enhancing Intra-SAARC Trade: A Brief Analysis
4(A) Animal, vegetable fats and oils, and cleavage products (hS 15)
Potential Export Items for India in the SAARc RegionANNEXuRE - 4
Product code
Product label
SAARc’s imports
from India
India’s exports to
world
SAARc’s imports
from world
Preferential access under SAFTA
Sensitive list under SAFTA
uS$ mn uS$ mn uS$ mn
151620Veg fats & oils & fractions hydrogenated
0.7 63.5 66.2Bangladesh, Bhutan, Maldives
Afghanistan, Nepal, Pakistan, Sri Lanka
151800 Animal / veg fats & oils 0.2 16.1 48.3
Afghanistan, Bangladesh, Bhutan, Maldives, Nepal
Pakistan, Sri Lanka
151590Veg fats & oils &their fractions, refined or not but not chemically modified
0.2 24.8 28.2
Afghanistan, Bangladesh, Bhutan, Maldives, Nepal
Pakistan, Sri Lanka
Source: ITC Trade Map, Geneva; and Exim Bank Analysis.

Export-Import Bank of India84
Potential for Enhancing Intra-SAARC Trade: A Brief Analysis
5(A)Carpetsandothertextilefloorcoverings(HS57)
Potential Export Items for Nepal in the SAARc Region
ANNEXuRE - 5
Product code
Product label
SAARc’s imports
from Nepal
Nepal’s exports to
world
SAARc’s imports
from world
Preferential access under
SAFTA
Sensitive list under SAFTA
uS$ mn uS$ mn uS$ mn
570110Carpets of wool or fine animal hair, knotted
0 73.9 4.3
Bangladesh, Bhutan, India, Maldives, Pakistan, Sri Lanka
Afghanistan
570190Carpets of other textile materials, knotted
0.001 11.3 1.8
Bangladesh, Bhutan, India, Maldives, Pakistan, Sri Lanka
Afghanistan
570310Carpets of wool or fine animal hair, tufted
0.02 1.8 1.2
Bangladesh, Bhutan, India, Maldives, Sri Lanka
Afghanistan, Pakistan
Source: ITC Trade Map, Geneva; and Exim Bank Analysis.

Export-Import Bank of India 85
Potential for Enhancing Intra-SAARC Trade: A Brief Analysis
6(A)Meat,fishandseafoodpreparations(HS16)
Potential Export Items for Maldives in the SAARc Region
ANNEXuRE - 6
Product code
Product label
SAARc’s imports
from Maldives
Maldives’ exports to
world
SAARc’s imports
from world
Preferential access under
SAFTA
Sensitive list under SAFTA
uS$ mn uS$ mn uS$ mn
160414Tunas, skipjack & bonito, prepared/ preserved, whole/in pieces, ex minced
0 13.78 4.9
Afghanistan, Bangladesh, Bhutan, India, Nepal, Pakistan
Sri Lanka
Source: ITC Trade Map, Geneva; and Exim Bank Analysis.

Export-Import Bank of India86
Potential for Enhancing Intra-SAARC Trade: A Brief Analysis
7 (A) Oil Seeds (hS 12)
Potential Export Items for Afghanistan in the SAARc Region
ANNEXuRE - 7
Product code
Product label
SAARc’s imports from Afghanistan
Afghanistan’s exports to
world
SAARc’s imports
from world
Preferential access under SAFTA
Sensitive list under SAFTA
uS$ mn uS$ mn uS$ mn
120740Sesamum seeds, whether or not broken
0 20.6 14.0
Bangladesh, Bhutan, India, Maldives, Nepal, Pakistan
Sri Lanka
Source: ITC Trade Map, Geneva; and Exim Bank Analysis.

Export-Import Bank of India 87
Potential for Enhancing Intra-SAARC Trade: A Brief Analysis
Exim Bank’s LOcs in the SAARc Region
ANNEXuRE - 8
Sr. No. Name of the LOc recipient Amount
(uS$ mn)year of
approval Purpose
1 Government of Afghanistan 50.0 2006-07 Export of goods and services and project exports Afghanistan Total 50.0
2 Government of Bangladesh 800.0 2009-10
Financing export of goods and projects including devel-opment of railway infrastructure, dredging, construction of bridges, procurement of buses, locomotives, coaches and rehabilitation of Saidpur Workshop.
Bangladesh* Total 800.03 Government of Maldives 40.0 2010-11 Construction of 500 housing units Maldives Total 40.0
4 Government of Nepal 100.0 2006-07 Road projects, rural electrification projects, power trans-mission projects and hydro power projects
5 Government of Nepal 250.0 2010-11 Financing infrastructure projects such as highways, airports, bridges and irrigation projects
Nepal Total 350.0
6 Ceylon Petroleum Corporation, Sri Lanka 150.0 2004-05 Export of petroleum products by MRPL
7 Government of Sri Lanka 100.0 2005-06 Purchase of equipment/ supplies8 Government of Sri Lanka 100.0 2008-09 Upgradation of railway line (Colombo-Matara)
9 Government of Sri Lanka 67.4 2009-10 Upgradation of Southern Railway Corridor from Co-lombo to Matara
10 Government of Sri Lanka 416.4 2009-10
(i) Track laying on the Omanthai-Pallai sector, (ii) Track laying on the Madhu Church-Tallaimannar sector, and (iii) Track laying on the Medawachchiya- Madhu railway line
11 Government of Sri Lanka 382.4 2010-11
(i) Track laying on the Pallai-Kankesanthurai railway line, (ii) Setting up of signaling and telecommunications systems for the Northern railway line and (iii) other projects as may be approved by Government of India (US$ 146.51 mn)
Sri Lanka Total 1,216.20
Total LOc to SAARc 2,456.20
* In 2012 the LOC was restructured to an US$ 800 million LOC and a US$ 200 million grant, to be used at the discretion of the Government of Bangladesh for urgent development projects.