
![[Mudcrab] post-harvet, processing - Aquatic Commonsaquaticcommons.org/20147/1/DagoonNJ1997-post-harvest-processing… · Crab processing Fresh, ... 1967. Biological evaluation of](https://static.fdocuments.in/doc/165x107/5aa2bf3b7f8b9a46238d75e6/mudcrab-post-harvet-processing-aquatic-c-crab-processing-fresh-1967.jpg)


Languages
Pages
Legal


SUSTAINABLE FISHERIES MANAGEMENT PROJECT (SFMP)
Post-harvest Processing Stove Performance Report

This publication is available electronically on the Coastal Resources Center’s website at
http://www.crc.uri.edu/projects_page/ghanasfmp/
For more information on the Ghana Sustainable Fisheries Management Project, contact:
USAID/Ghana Sustainable Fisheries Management Project
Coastal Resources Center
Graduate School of Oceanography
University of Rhode Island
220 South Ferry Rd.
Narragansett, RI 02882 USA
Tel: 401-874-6224 Fax: 401-874-6920 Email: [email protected]
Citation: Entee, S. (2015). Post-harvest Processing Stove Performance Report. The
USAID/Ghana Sustainable Fisheries Management Project (SFMP), Narragansett, RI: Coastal
Resources Center, Graduate School of Oceanography, University of Rhode Island and SNV
Netherlands Development Organization. GH2014_ACT005_SNV. 36 pp.
Authority/Disclaimer:
Prepared for USAID/Ghana under Cooperative Agreement (AID-641-A-15-00001) awarded
on October 22, 2014 to the University of Rhode Island and entitled; the USAID/Ghana
Sustainable Fisheries Management Project (SFMP).
This document is made possible by the support of the American People through the United
States Agency for International Development (USAID). The views expressed and opinions
contained in this report are those of the SFMP team and are not intended as statements of
policy of either USAID or the cooperating organizations. As such, the contents of this report
are the sole responsibility of the SFMP Project team and do not necessarily reflect the views
of USAID or the United States Government.

Detailed Partner Contact Information: USAID/Ghana Sustainable Fisheries Management Project (SFMP)
10 Obodai St., Mempeasem, East Legon, Accra, Ghana Brian Crawford Chief of Party [email protected]
Najih Lazar Senior Fisheries Advisor [email protected]
Patricia Mensah Communications Officer [email protected]
Bakari Nyari Monitoring and Evaluation Specialist [email protected]
Don Robadue, Jr. Program Manager, CRC [email protected] Justice Odoi USAID Administrative Officer Representative [email protected]
Kofi.Agbogah
StephenKankam
Hen Mpoano
38 J. Cross Cole St. Windy Ridge
Takoradi, Ghana
233 312 020 701
Andre de Jager
SNV Netherlands Development Oganization
#161, 10 Maseru Road,
E. Legon, Accra, Ghana
233 30 701 2440
Donkris Mevuta
Kyei Yamoah
Friends of the Nation
Parks and Gardens
Adiembra-Sekondi, Ghana
233 312 046 180
Peter Owusu Donkor
Spatial Solutions
#3 Third Nautical Close,
Nungua, Accra, Ghana
233 020 463 4488
Thomas Buck
SSG Advisors
182 Main Street
Burlington, VT 05401
(802) 735-1162
Victoria C. Koomson
CEWEFIA
B342 Bronyibima Estate
Elmina, Ghana
233 024 427 8377
Lydia Sasu
DAA
Darkuman Junction, Kaneshie Odokor
Highway
Accra, Ghana
233 302 315894
Gifty Asmah
Daasgift Quality Foundation
Headmaster residence, Sekondi College
Sekondi, Western Region, Ghana
233 243 326 178
For additional information on partner activities:
CRC/URI: http://www.crc.uri.edu
CEWEFIA: http://cewefia.weebly.com/
DAA: http://womenthrive.org/development-action-association-daa
Daasgift: https://www.facebook.com/pages/Daasgift-Quality-Foundation-
FNGO/135372649846101
Friends of the Nation: http://www.fonghana.org
Hen Mpoano: http://www.henmpoano.org
SNV: http://www.snvworld.org/en/countries/ghana
SSG Advisors: http://ssg-advisors.com/
Spatial Solutions: http://www.spatialsolutions.co/id1.html
ii
ACRONYMS AOR Administrative Officer Representative
ASSESS Analytical Support Services and Evaluations for Sustainable Systems
CEMAG Community Environmental Monitoring and Advocacy Group
CCLME Canary Current Large Marine Ecosystem
CCM Centre for Coastal Management
CDCS Country Development Cooperation Strategy
CEWEFIA Central and Western Region Fishmongers Improvement Association
COMFISH Collaborative Management for a Sustainable Fisheries Future
CoP Chief of Party
CPUE Catch Per Unit Effort
CR Central Region
CRC Coastal Resources Center at the Graduate School of Oceanography, University
of Rhode Island
CRCC Central Regional Coordinating Council
CSLP Coastal Sustainable Landscapes Project
CSO Civil Society Organization
DA District Authorities
DAA Development Action Association
DAASGIFT Daasgift Quality Foundation
DFAS Department of Fisheries and Aquatic Sciences
DFID Department for International Development
DO Development Objective
EBM Ecosystem-Based Management
EG Economic Growth
EMMP Environmental Mitigation and Monitoring Plan
ERF Environmental Review Form
ETP Endangered, Threatened and Protected
FAO Food and Agricultural Organization of the United Nations
FASDEP Food and Agriculture Sector Development Program
FASDP Fisheries and Aquaculture Sector Development Program
FC Fisheries Commission
FCWCGG Fisheries Committee for the West central Gulf of Guinea
FEU Fisheries Enforcement Unit
FHI Family Health International
FoN Friends of Nation
FtF Feed the Future
HM Hen Mpoano
GCLME Guinea Current Large Marine Ecosystem
GIFA Ghana Inshore Fishermen's Association
GIS Geographic Information System
GIZ Gesellschaft für Internationale Zusammenarbeit
GLM Generalized Linear Models
GNAFF Ghana National Association of Farmers and Fishermen
GNCFC Ghana National Canoe Fishermen’s Council
GoG Government of Ghana
GSA Ghana Standards Authority
GSO Graduate School of Oceanography, University of Rhode Island
ICFG Integrated Coastal and Fisheries Governance
ICM Integrated Coastal Management
iii
ICT Information, Communication Technology
IEE Initial Environmental Examination
IR Intermediate Results
IUCN International Union for Conservation of Nature
IUU Illegal Unreported Unregulated
JICA Japan International Cooperation Agency
LEAP Livelihood Enhancement Against Poverty
LOE Level of Effort
LOGODEP Local Government Development Program
LoP Life of Project
MCS Monitoring, Control and Surveillance
METASIP Medium Term Agricultural Investment Program
METSS Monitoring, Evaluation and Technical Support Services
MFRD Marine Fisheries Research Division
MOFAD Ministry of Fisheries and Aquaculture Development
MOU Memorandum of Understanding
MPA Marine Protected Area
MSME Micro Small and Medium Enterprises
MSP Marine Spatial Planning
M&E Monitoring and Evaluation
NAFAG National Fisheries Association of Ghana
NGO Non-Governmental Organization
NC National Committee
NRM Natural Resources Management
PMEP Performance Monitoring and Evaluation Plan
PMP Performance Management Plan
PPP Public Private Partnerships
RAVI Rights and Voices Initiative
RCC Regional Coordinating Council
RFA Request for Application
RPA Rapid Partnership Appraisal
SAMP Special Area Management Plans
SFMP Sustainable Fisheries Management Program
SMEs Small and Medium Enterprises
SNV Netherlands Development Organization
SS Spatial Solutions
SSG SSG Advisors
STEP Sustainable, Transparent, Effective Partnerships
STWG Scientific and Technical Working Group
UCAD University Cheikh Anta Diop
UCC University of Cape Coast
URI University of Rhode Island
USAID United States Agency for International Development
USG United States Government
WA West Africa
WARFP West Africa Regional Fisheries Development Program
WASH Water, Sanitation and Hygiene
WR Western Region

iv
EXECUTIVE SUMMARY This report presents the findings from a Controlled Cooking Test (CCT) on fish stoves based
on locations. The performance tests were carried out at Azizanyea, Ada-Foah on Morrison
and a Chorkor stoves; Association of Women for Environment Project (AWEP) stove and
another model of the Chorkor stove – Otuam; KOSMOS Oven, Tullow Oven and KOSMOS
Chorkor at Ankobra all fishing communities and the FAO-Thiaroye Fish Processing
Technology (FTT) stove at Ghana Standards Authority, Accra. This is part of the activities
under the Sustainable Fisheries Management Project (SFMP) for the promotion and adoption
of clean cooking and other renewable energy technologies in support of fish processing
industries, in order to enhance environmental sustainability and livelihoods. In addition, to
ensue technology transfer the event serves as an opportunity for testing and comparing stove
performance (energy and production efficiencies). In this event SFMP /SNV Ghana therefore
consulted the Regional Testing and Knowledge Centre at CSIR - Institute of Industrial
Research, to conduct a comparative test to assess the performances and efficiencies of the
Morrison and Chorkor, AWEP, another type of Chorkor at Otuam, KOSMOS Oven, Tullow
Oven, KOSMOS Chorkor and FTT stove technologies.
The stoves were carried out for a Controlled Cooking Test (CCT) using six (6) wooden
trays/shelves under the same conditions and procedures and the results were compared for
fuel efficiencies and emissions. The raw data obtained from the measurements and tests were
recorded for off-line analyses using the CCT 2.0 version (Rob Bailis, 2004).
The test results indicated that most of the stoves do not meet the EnDev requirements of 40%
fuel saving. Only the Morrison stove was better among the stoves which were 36.7% when
compared to the Chorkor-Ada.
Comparisons were not made among the stoves since they were not constructed with
measurement and dimensional standards. The tray dimensions also lack a uniform
dimensions.
We therefore recommend that the stoves and accessories should be of standardized
measurement.
v
TABLE OF CONTENTS
Acronyms ............................................................................................................................ ii
Executive Summary ........................................................................................................... iv
1.0 INTRODUCTION .........................................................................................................1
1.1 About CSIR ...........................................................................................................1
1.2 The Institute of Industrial Research (IIR) .............................................................1
1.3 The Project Synopses ............................................................................................1
2.0 OBJECTIVES ................................................................................................................2
3.0 EXPERIMENTAL METHODS AND PROCEDURES ................................................2
3.1 Brief description of wood fuel improved Fish Stoves: ..............................................2
3.1.1 Morrison Stove: ...................................................................................................2
3.1.2 Chorkor Stove (Ada-Foah): .................................................................................2
3.1.3 AWEP Stove: .......................................................................................................3
3.1.4 Chorkor Stove (Otuam): ......................................................................................3
3.1.5 KOSMOS Oven: ..................................................................................................3
3.1.6 TULLOW Oven:..................................................................................................3
3.1.7 Chorkor-KOSMOS Stove: ...................................................................................4
3.1.8 FTT Stove: ...........................................................................................................4
3.2 Materials and Methods ..........................................................................................6
3.2.1 Fuel used ..............................................................................................................6
3.2.2 Moisture content ..................................................................................................6
3.2.3 Atmospheric conditions .......................................................................................6
3.2.4 Experimental procedures .....................................................................................7
4.0 RESULTS AND DISCUSSION ..................................................................................10
4.1 Controlled Cooking Test (CCT) ..........................................................................10
4.1.1 Total Weight of Food Cooked ...........................................................................15
4.1.2 Equivalent Dry Wood Consumed ......................................................................15
4.1.3 Specific Fuel Consumption ...............................................................................15
4.1.4 Total Cooked Rate .............................................................................................16
4.1.5 Processing Rate..................................................................................................17
4.1.6 Emissions ...........................................................................................................18
5.0 CONCLUSIONS..........................................................................................................26
LIST OF TABLES Table 1 Controlled Cooking Test Statistical Results for the cookstoves at Ada-Foah
(Chorkor Ada and Morrison) .............................................................................................10 Table 2 Controlled Cooking Test statistical results (t-test) for the cookstoves (@ α =
0.05) at Otuam (Chorkor Otuam and AWEP) ...................................................................11 Table 3 Controlled Cooking Test statistical results (t-test) for the cookstoves (@ α =
0.05) at Ankobra (Chorkor-KOSMOS and KOSMOS Oven). ..........................................12 Table 4 Controlled Cooking Test statistical results (t-test) for the cookstoves (@ α =
0.05) at Ankobra (Chorkor-KOSMOS and TULLOW Oven). ..........................................13
Table 5 Controlled Cooking Test statistical results (t-test) for the cookstoves (@ α =
0.05) at Ankobra (KOSMOS Oven and TULLOW Oven). ...............................................14 Table 6 Controlled Cooking Test statistical results (t-test) for the cookstoves (@ α =
0.05) at Ghana Standards Authority (Chorkor-KOSMOS and FTT). ................................15
vi
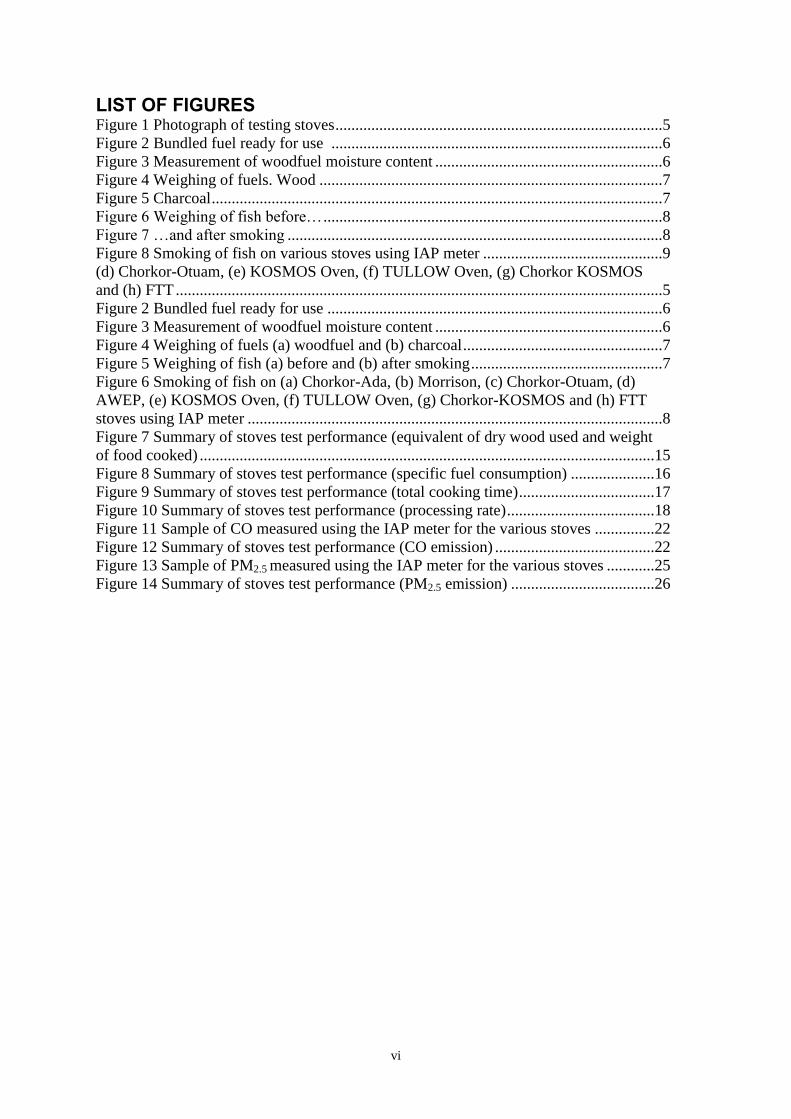
LIST OF FIGURES Figure 1 Photograph of testing stoves ..................................................................................5
Figure 2 Bundled fuel ready for use ...................................................................................6 Figure 3 Measurement of woodfuel moisture content .........................................................6 Figure 4 Weighing of fuels. Wood ......................................................................................7 Figure 5 Charcoal .................................................................................................................7 Figure 6 Weighing of fish before… .....................................................................................8
Figure 7 …and after smoking ..............................................................................................8 Figure 8 Smoking of fish on various stoves using IAP meter .............................................9 (d) Chorkor-Otuam, (e) KOSMOS Oven, (f) TULLOW Oven, (g) Chorkor KOSMOS
and (h) FTT ..........................................................................................................................5
Figure 2 Bundled fuel ready for use ....................................................................................6
Figure 3 Measurement of woodfuel moisture content .........................................................6
Figure 4 Weighing of fuels (a) woodfuel and (b) charcoal ..................................................7
Figure 5 Weighing of fish (a) before and (b) after smoking ................................................7
Figure 6 Smoking of fish on (a) Chorkor-Ada, (b) Morrison, (c) Chorkor-Otuam, (d)
AWEP, (e) KOSMOS Oven, (f) TULLOW Oven, (g) Chorkor-KOSMOS and (h) FTT
stoves using IAP meter ........................................................................................................8
Figure 7 Summary of stoves test performance (equivalent of dry wood used and weight
of food cooked) ..................................................................................................................15
Figure 8 Summary of stoves test performance (specific fuel consumption) .....................16
Figure 9 Summary of stoves test performance (total cooking time) ..................................17
Figure 10 Summary of stoves test performance (processing rate) .....................................18
Figure 11 Sample of CO measured using the IAP meter for the various stoves ...............22
Figure 12 Summary of stoves test performance (CO emission) ........................................22
Figure 13 Sample of PM2.5 measured using the IAP meter for the various stoves ............25
Figure 14 Summary of stoves test performance (PM2.5 emission) ....................................26

1
1.0 INTRODUCTION
1.1 About CSIR
The Centre for Scientific and Industrial Research (CSIR) is a semi-autonomous organisation
with the mandate to pursue the implementation of government policies on scientific research
and development, encourage coordination of scientific research for the management,
utilization and conservation of the natural resources of Ghana; and to advise Government on
scientific and technological advances likely to be of importance to national development.
The CSIR now operates under the mandate of CSIR Act 521 of 1996, which among other
things, empowers to commercialize its research activities. The mission of CSIR is to become
the force of accelerated social and economic development of Ghana through examining,
exploring and creating science and technology catalysts for public and private wealth
creation. The CSIR oversees 13 research institutes of which Institute of Industrial Research
(IIR) is one.
1.2 The Institute of Industrial Research (IIR)
The Institute of Industrial Research is one of the leading research institutes of CSIR; among
its duties, is to assist in poverty reduction through the creation of opportunities for generating
and increasing incomes within the Small and Medium-scale Enterprises (SMEs); contribute
towards food security, and apply cost-effective industrial technologies that are both
environmentally friendly and commercially viable. The Institute is one of the Regional
Testing and Knowledge Centres supported by the United Nations Foundation through the
Global Alliance for Clean Cookstoves.
The Institute of Industrial Research projects include the following:
Mitigation of the global warming problem (CO2), reduction of pollutant emission
Higher efficiency of Ghana’s energy utilization
Strengthening the competitive position of IIR through innovation of process
technologies
Increase knowledge in the production and application of energy such as wind, hydro,
solar, fuel cells, biofuels and cookstove testing
Reduce energy waste in industry and commercial institutions through energy audit.
The CSIR-IIR research, develop and promote technologies which include renewable energy,
industrial processes, new materials development, improved sanitation, locally equipment
fabrication, repair/maintenance and calibration, and information technology.
1.3 The Project Synopses
SNV (Netherlands Development Organization) Ghana is committed to combating
deforestation, to increasing the profitability of agro-processing businesses in Ghana and to
improve the working environment for women entrepreneurs. Through the introduction of
energy efficient and clean cooking technologies, all these targets can be addressed. Improved
stoves have the potential to significantly reduce fuelwood consumption and excessive
exposure to heat and smoke. The Sustainable Fisheries Management Project is a 5 year
intervention aimed at introducing improved cooking and other renewable energy technologies
to agro-processing communities.
The project serves as an opportunity for testing and comparing stove performance (energy
and production efficiencies). The emergence of new stove technologies creates the need to
2
compare stove performance in fuel efficiency and in other relevant parameters to enhance
knowledge on potential to promote improved stove technologies. An accurate and
comparable measurement of stove performance will help SFMP/SNV, consumers/end users,
and businesses (stove building entrepreneurs) to make decisions about replacing traditional
Chorkor stove with improved technologies, understanding well which benefits can be attained
from such an investment.
In this event SFMP/SNV Ghana has sought the support of the Regional Testing and
Knowledge Centre of the CSIR – Institute of Industrial Research as Consultant to conduct
comparative tests to assess the performances and efficiencies of the Morrison, FTT, AWEP,
KOSMOS Oven, Tullow Oven and KOMOS Chorkor Fish Stove technologies at Azizanyea,
Ada-Foah and Ghana Standards Authority (Greater Accra Region), Otuam (Central Region)
and Ankobra (Western Region).
The Project period was from 16th
June – 16th
July, 2015.
2.0 OBJECTIVES The objective of this assignment is to
1. Conduct performance and efficiency test of stoves at various locations Ada Foah,
Otuam, Ankobra and Ghana Standards Authority.
2. Conduct a comparative test between the Morrison and Chorkor-Ada; AWEP and
Chorkor-Otuam; KOSMOS Oven, TULLOW Oven and Chorkor-KOSMOS; Chorkor-
KOSMOS and FTT stoves using Controlled Cooking Test (CCT) protocol.
3.0 EXPERIMENTAL METHODS AND PROCEDURES
3.1 Brief description of wood fuel improved Fish Stoves:
3.1.1 Morrison Stove:
The stove is built mainly with clay; mixed with saw dust and water. Recently, the idea of
mixing clay with saw dust at the 4:1proportion has been adopted. This means that for every
four (4) proportion of clay used in volume, a one (1) volume proportion each of saw dust was
added. The top of the combustion chamber has an opened wooden tray embedded in the stove
frame upon which series of trays are stalked. Tray dimensions are 2337 x 960 x 75 mm (L x
B x H). The ends of the trays are designed such that it gives a good interlocking which also
prevent smoke leakages. The Morrison Fish Stove is design to hold a capacity of eight (8)
trays with a last tray lined with a jute bag to filter and trap most smoke inside the system
which controls the smoke through a small chimney made from a galvanized pipe of diameter
105 mm and length 1220 mm. The design is with the elevated chimney make it suitable for
fish smoking. The overall dimensions are 2400 x 1200 x 720 mm (L x B x H) with wall
thickness of 200 mm and two (2) firepots (front loading for the woodfuel) of dimensions 380
x 420 mm (L x H). The two combustion chambers are partitioned and can allow either
chamber to be used in some cases.
3.1.2 Chorkor Stove (Ada-Foah):
The stove is built mainly with clay mixed with small quantity of sand at the 4:1 proportion
has been adopted. This means that for every four (4) proportion of clay used in volume, a one
(1) volume proportion each of sand was added. The trays are loaded on top of the combustion
chamber but no interlocking device. The handles at the ends are chamfered for easy gripping
of hands when carrying The Chorkor stove is design to hold a capacity of eight (8) trays to
3
control the smoke. The tray dimensions are 1560 x 950 x 60 mm (L x B x H) with a small
chimney made from a galvanized pipe of diameter 105 mm and length 1220 mm. The design
is with the elevated chimney make it suitable for fish smoking. The overall dimensions are
1510 x 1120 x 620 mm (L x B x H) with wall thickness of 150 mm and two (2) firepots (front
loading for the woodfuel) of dimensions 440 x 380 mm (L x H) with a common combustion
chamber and two (2) firepots (front loading points for the woodfuel) of dimensions 380 x 420
mm (L x H).
3.1.3 AWEP Stove:
The stove is built mainly with clay; mixed with sandcrete and water. Recently, the idea of
mixing clay with saw dust at the 4:1proportion has been adopted. This means that for every
four (4) proportion of clay used in volume, a one (1) volume proportion each of sandcrete
was added. Series of wooden trays are stalked on the top of the combustion chamber has an
opening. Tray dimensions are outside (1575 x 753 x 70 mm) and inside of 1135 x 642 x 52
mm (L x B x H) given wire mesh surface area of 0.73 m2. The edges of the trays are does not
allow good interlocking device which also prevent smoke leakages. The AWEP Stove can
hold a capacity of eight (8) trays but without a chimney incorporated to the design. The
overall dimensions are 1300 x 880 x 620 mm (L x B x H) with wall thickness of 150 mm and
a single firepot (front loading for the woodfuel) of dimensions 420 x 460 mm (L x H).
3.1.4 Chorkor Stove (Otuam):
The stove is built mainly with clay mixed with small quantity of sand at the 4:1 proportion
has been adopted. This means that for every four (4) proportion of clay used in volume, a one
(1) volume proportion each of sand was added. The trays are loaded on top of the combustion
chamber but no interlocking device. The handles at the ends are chamfered for easy gripping
of hands when carrying. The Chorkor stove is design to hold a capacity of eight (8) trays
which dimensions are outside (1295 x 950 x 50 mm) and inside of 1055 x 900 x 50 mm (L x
B x H) given a wire mesh surface area of 0.95 m2 without a chimney. The overall dimensions
are 2060 x 1360 x 540 mm (L x B x H) with wall thickness of 150 mm and two (2) firepots
(front loading for the woodfuel) of dimensions 440 x 380 mm (L x H) with a common
combustion chamber and two (2) firepots (front loading points for the woodfuel) of
dimensions 350 x 420 mm (L x H).
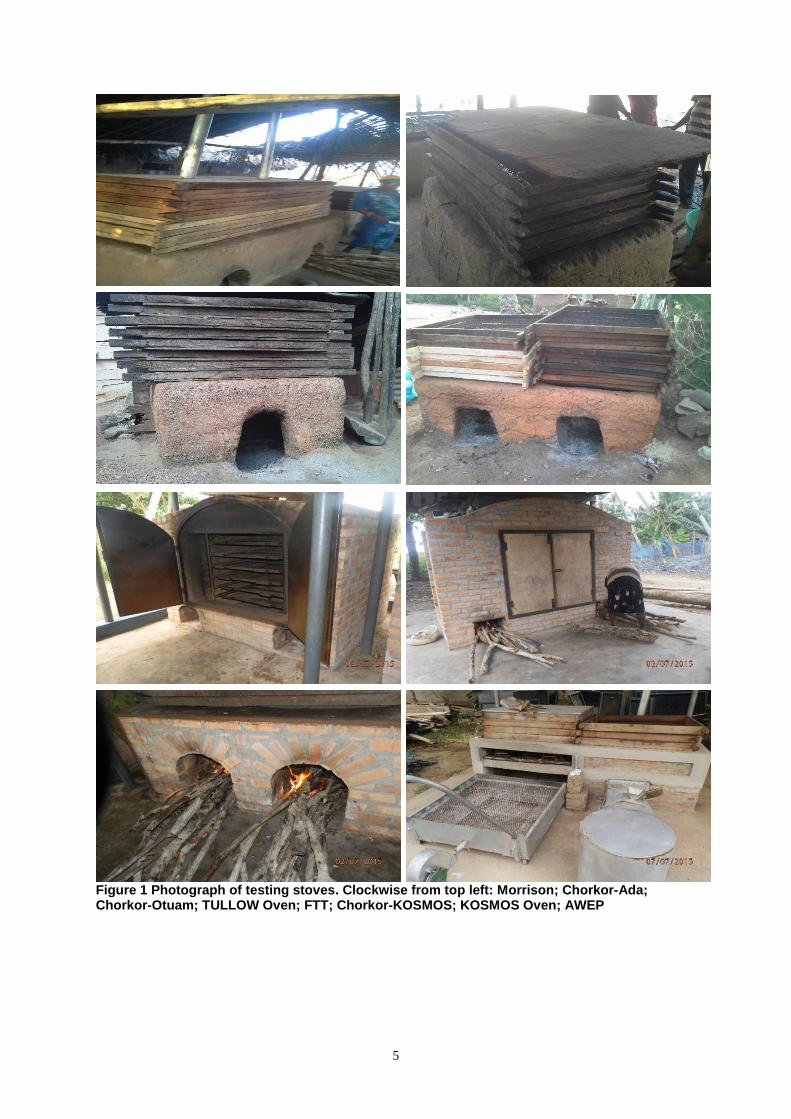
3.1.5 KOSMOS Oven:
The oven is built mainly with fired-bricks. Six (6) metal-trays are stalked on metal shelf
inside the combustion chamber where woodfuels are packed side-by-side the lower tray at the
fire pots. The overall dimensions of the oven are 2115 x x1650 x 1500 mm (L x B x H) and a
brick wall thickness of 200 mm including a chimney of 540 x 460 x 2800 mm (L x B x H)
incorporated to the design. The oven has dual firepots (front loading for the woodfuel) of
dimensions 340 x 300 mm (L x H) as presented in Figure 1 a. Tray overall dimensions are
1075 x 870 x 25 mm and wire mesh surface area of 0.94 m2
3.1.6 TULLOW Oven:
The oven is built mainly with fired-bricks. Eight (8) metal-trays are stalked on metal shelf
inside the combustion chamber where woodfuels are packed side-by-side the lower tray at the
fire pots similar to the KOSMOS Oven. The overall dimensions of the oven are 2930 x 1650
x2070 mm (L x B x H) and a brick wall thickness of 200 mm including a chimney of 960 x
465 x 2880 mm (L x B x H) incorporated to the design. The oven has dual firepots (front
loading for the woodfuel) of dimensions 395 x 360 mm (L x H) as presented in Figure 1 a.
Tray overall dimensions are 1290 x 770 x 25 mm and wire mesh surface area of 0.99 m2

4
3.1.7 Chorkor-KOSMOS Stove:
The oven is built mainly with fired-bricks. The quantity of trays is not restricted but can take
twelve (12) wooden trays per batch which are stalked on the combustion chamber. The
overall dimensions of the oven are 1855 x 1200 x 810 mm (L x B x H) and a brick wall
thickness of 235 mm at the front and back and 265 mm at the sides with no chimney
incorporated to the design. The stove has dual firepots (front loading for the woodfuel) of
dimensions 440 x 550 mm (L x H) and the tray overall dimensions are 1780 x 470 x 65 mm
with a wire mesh surface area of 1.05 m2.
3.1.8 FTT Stove:
The oven is built mainly with fired-bricks. The quantity of trays is not restricted but can take
six (6) wooden trays per batch which are stalked on the combustion chamber. The overall
dimensions of the stove are 2400 x 1175 x 690 mm (L x B x H). The stove has two (2)
chambers with dimensions 1050 x 920 for Chamber I and 1010 x 940 for Chamber II. The
ash tray which located under Chamber I was made from a galvanized plate with dimensions
1000 x 985 x 75 mm (L x B x H). A chimney also made from a galvanized pipe with a
diameter 100 mm and height 1530 mm located at the back of Chamber II. The stove uses
charcoal for Chamber I and coconut fibre in Chamber II for browning of the fish after
cooking in Chamber I which has a manually operated blower to supply air to the chamber.
Overall dimensions of the wooden tray are 1230 x 1080 x 80 mm and inner dimensions are
1025 x 938 x 80 mm wire mesh surface area of 0.96 m2.
Figure 1 shows photograph of constructed stoves Morrison and Chorkor (Ada-Foah); AWEP
and Chorkor (Otuam); KOSMOS Oven, TULLOW Oven and Chorkor KOSMOS (Ankobra)
and FTT (Ghana Standards Authority, Accra).
The trays were not of the same dimensions likewise the stoves. The designs and dimensions
differ from location to location.
5
Figure 1 Photograph of testing stoves. Clockwise from top left: Morrison; Chorkor-Ada; Chorkor-Otuam; TULLOW Oven; FTT; Chorkor-KOSMOS; KOSMOS Oven; AWEP
6
3.2 Materials and Methods
3.2.1 Fuel used
Mangrove (Bruguiera Gymnorrhiza – Ada Foah; Rhizophera Spp – Otuam and Bruguiera
Sexangula) were used as fuel with a higher calorific values of 20.4, 17.43 and 19.4 MJ/kg
respectively from literature. Sample of woodfuels were obtained from bundled batches and
measured at various positions. The average dimensions (L x D) of the fuels was determined
to be 140.8±6.5 x 6.5±2.3 cm; 91.7±5.5 x 3.2±1.3 cm; 94.9±5.5 x 6.9±2.3 cm for Ada-Foah,
Otuam and Ankobra respectively. Charcoal was used on the FTT stove at Ghana Standards
Authority. Bundle of fuel ready for use and measurement of moisture content of the woodfuel
have been presented in Figure 2 and Figure 3 respectively.
Figure 2 Bundled fuel ready for use
Figure 3 Measurement of woodfuel moisture content
3.2.2 Moisture content
The moisture content of the fuel was determined by using moisture meter Voltcraft FM-300
(Conrad Electronics SE, Hirschau) which measurement was in dry basics. Five (5) samples of the fuel were collected at random and measurements were taken at four (4) locations in each
fuel selected for a bundle of wood. Average values were therefore determined and converted
in wet basics. The moisture content was determined to be 19.1%, 25%, 42.2% and 13% (for
charcoal) at Ada-Foah, Otuam, Ankobra and Accra respectively.
3.2.3 Atmospheric conditions
The stoves were tested in the field which is well ventilated with a light breeze. The
atmospheric conditions (temperature and humidity) were determined with a temperature,

7
humidity and clock meter THC-2 and the average values recorded were 30.2oC and 72%;
28.3oC and 74%; 27.7
oC and 80%, and 31.9
oC and 70% at Ada-Foah, Otuam, Ankobra and
Accra respectively.
3.2.4 Experimental procedures
For Controlled Cooking Test (CCT), the same weight of woodfuel and fish were weighed to
the cook accordingly. The cook was to prepare a good quality and refined product from the
specimens where time to cook and amount of fuel used were measured before and after
completion of operation. An electronic weighing scale (KERN DE 60 K1 DL) of maximum
weight of 60 kg and resolution of 0.5 g was used to weigh the fuel and fish as presented in
Figures 4 and 5 respectively. Figure 6 depicts smoking of fish using the Chorkor and
Morrison stoves during the CCT with the Indoor Air Pollution (IAP) meter attached to the
cook, in order to measure and record the possible inhalation of emission (i.e., CO and PM 2.5)
for some few minutes.
Figure 4 Weighing of fuels. Wood
Figure 5 Charcoal
8
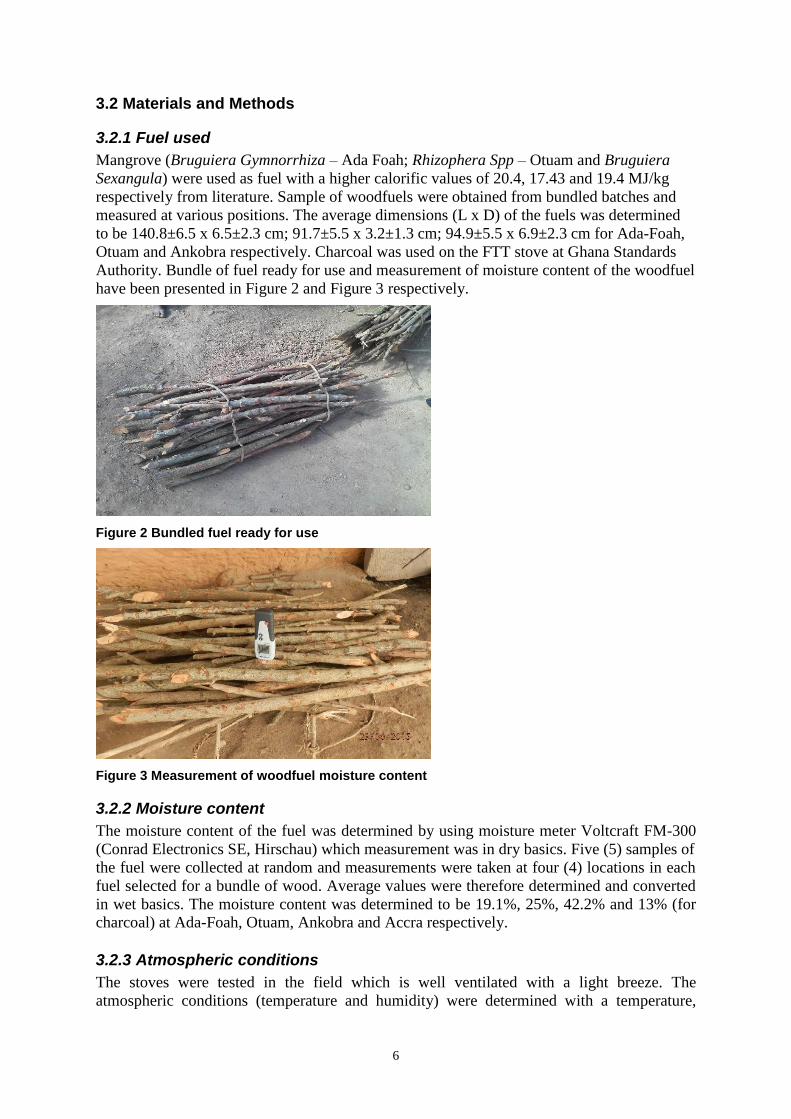
Figure 6 Weighing of fish before…
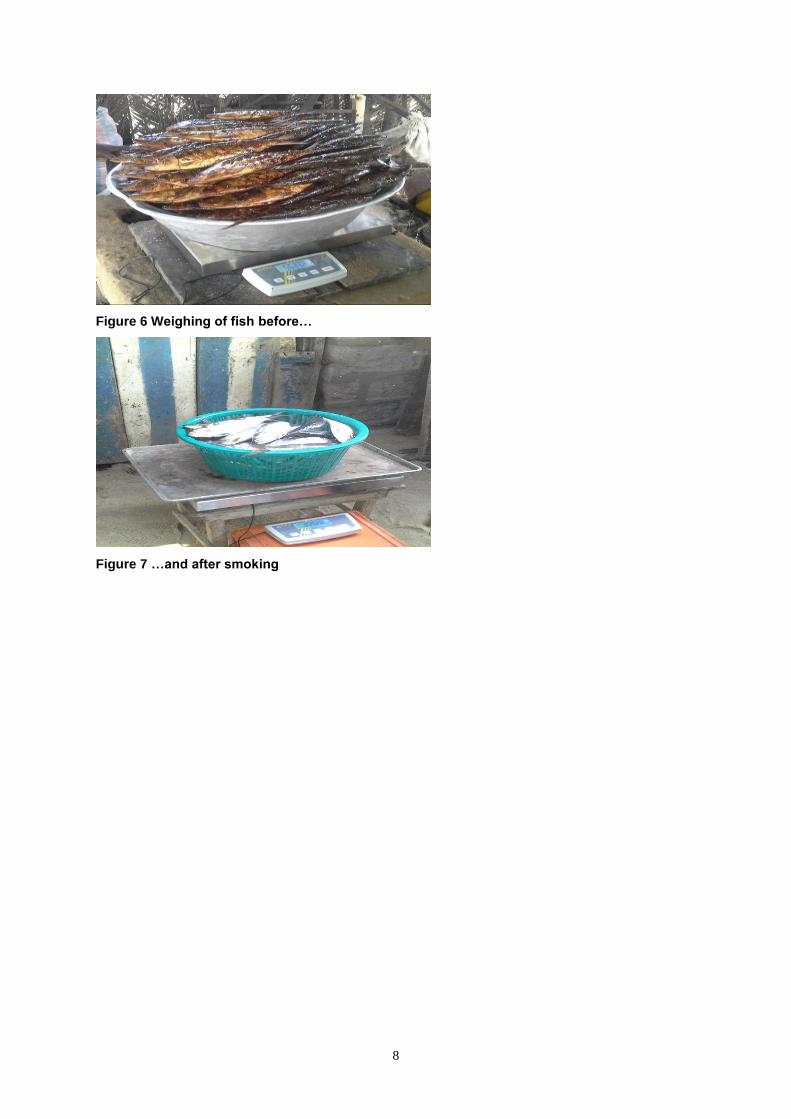
Figure 7 …and after smoking

9
Figure 8 Smoking of fish on various stoves using IAP meter. Clockwise from top left: Morrison; Chorkor-Ada; Chorkor-Otuam; TULLOW Oven; FTT; Chorkor-KOSMOS; KOSMOS Oven; AWEP

10
4.0 RESULTS AND DISCUSSION The constructed stoves were carried out under Controlled Cooking Test (CCT) protocol and
each stove test was repeated twice with a quantity of fish. Although the tray sizes were not
the same, the cook was supplied with the same weight of fish and woodfuel but weight varies
per testing location for each process. Comparison was determined between the stoves
performance at various locations.
The statistically significant analyses (t-test) and summary among the stoves results per
location have been presented at a confidence level of 95%.
4.1 Controlled Cooking Test (CCT)
Table 1 Controlled Cooking Test Statistical Results for the cookstoves at Ada-Foah (Chorkor Ada and Morrison)
1. CCT results: Chorkor-Ada
units Test 1 Test 2 Mean St Dev
Total weight of food cooked g 67017 48496 57756.5 13096.3
Weight of char remaining g 0 0 0 0
Equivalent dry wood consumed
g 33984.6 56927.1 45455.9 16222.8
Specific fuel consumption g/kg 507.1 480.9 494 18.5
Total cooking time min 306 318 312 8.5
2. CCT results: Morrison units Test 1 Test 2 Mean St. Dev
Total weight of food cooked g 64019 44496 54257.5 13804.9
Weight of char remaining g 0 0 0 0
Equivalent dry wood consumed
g 19685.8 32934.4 26310.1 9368.2
Specific fuel consumption g/kg 307.5 318.9 313.2 8.1
Total cooking time min 270 300 285 21.2
Comparison of Stove 1 and Stove 2
% difference
T-Test Sig @ 95%?
Specific fuel consumption g/kg 0.365995 12.65381 YES
Total cooking time min 0.056604 1.67 NO
Chorkor Morrison
Processing rate g/min
185.1 190.4
% Yield 2.763044
11
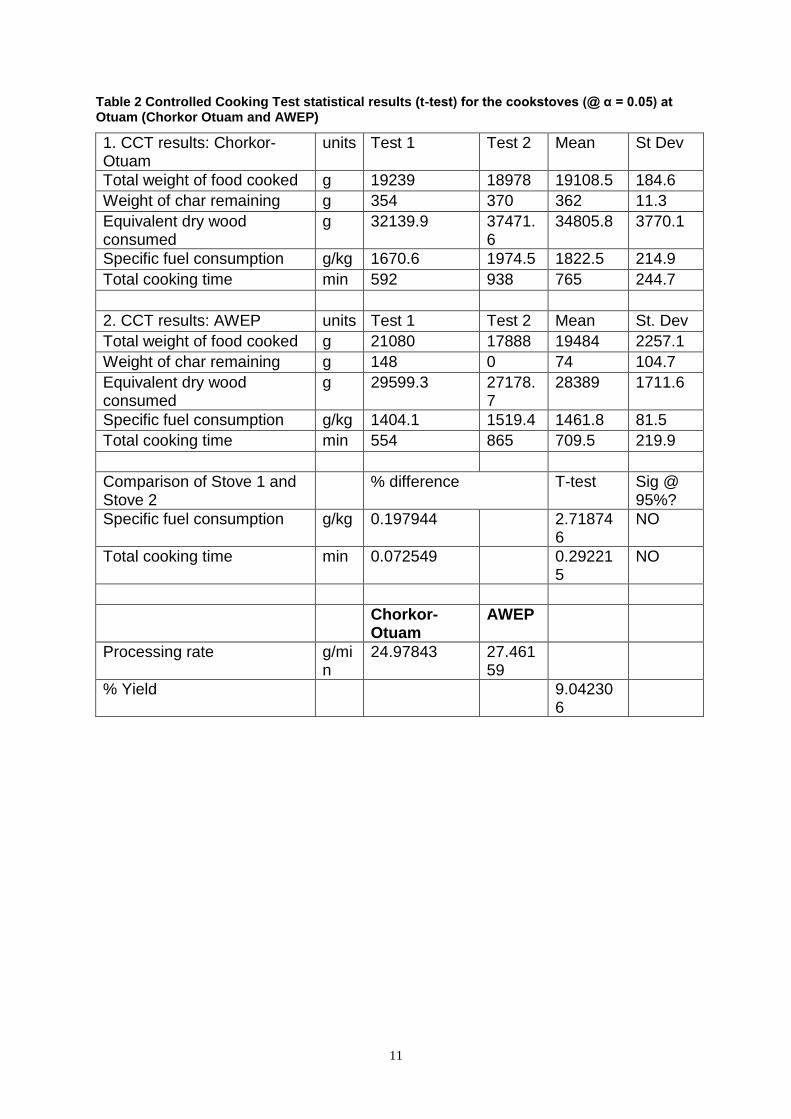
Table 2 Controlled Cooking Test statistical results (t-test) for the cookstoves (@ α = 0.05) at Otuam (Chorkor Otuam and AWEP)
1. CCT results: Chorkor-Otuam
units Test 1 Test 2 Mean St Dev
Total weight of food cooked g 19239 18978 19108.5 184.6
Weight of char remaining g 354 370 362 11.3
Equivalent dry wood consumed
g 32139.9 37471.6
34805.8 3770.1
Specific fuel consumption g/kg 1670.6 1974.5 1822.5 214.9
Total cooking time min 592 938 765 244.7
2. CCT results: AWEP units Test 1 Test 2 Mean St. Dev
Total weight of food cooked g 21080 17888 19484 2257.1
Weight of char remaining g 148 0 74 104.7
Equivalent dry wood consumed
g 29599.3 27178.7
28389 1711.6
Specific fuel consumption g/kg 1404.1 1519.4 1461.8 81.5
Total cooking time min 554 865 709.5 219.9
Comparison of Stove 1 and Stove 2
% difference T-test Sig @ 95%?
Specific fuel consumption g/kg 0.197944 2.718746
NO
Total cooking time min 0.072549 0.292215
NO
Chorkor-Otuam
AWEP
Processing rate g/min
24.97843 27.46159
% Yield 9.042306

12
Table 3 Controlled Cooking Test statistical results (t-test) for the cookstoves (@ α = 0.05) at Ankobra (Chorkor-KOSMOS and KOSMOS Oven).
1. CCT results: Chorkor-KOSMOS
units Test 1 Test 2 Mean St Dev
Total weight of food cooked
g 19944 20354 20149 289.9
Weight of char remaining g 1105 577 841 373.4
Equivalent dry wood consumed
g 55745.5 26642.7 41194.1 20578.8
Specific fuel consumption g/kg 2595.1 2013.0 2304.1 411.6
Total cooking time min 434 302 368 93.3
2. CCT results: KOSMOS Oven
units Test 1 Test 2 Mean St. Dev
Total weight of food cooked
g 21114 21385 21249.5 191.6
Weight of char remaining g 757 1222 989.5 328.8
Equivalent dry wood consumed
g 25128.1 27300 26214.0 1535.7
Specific fuel consumption g/kg 2856 2784 2820 50.9
Total cooking time min 450 480 465 21.2
Comparison of Stove 1 and Stove 2
% difference T-test Sig @ 95%?
Specific fuel consumption g/kg -0.22393 -1.75931 NO
Total cooking time min -0.26359 -1.43315 NO
Chorkor-KOSMOS
KOSMOS Oven
Processing Rate g/min 54.75272 45.69785
Yield % 16.53775
13
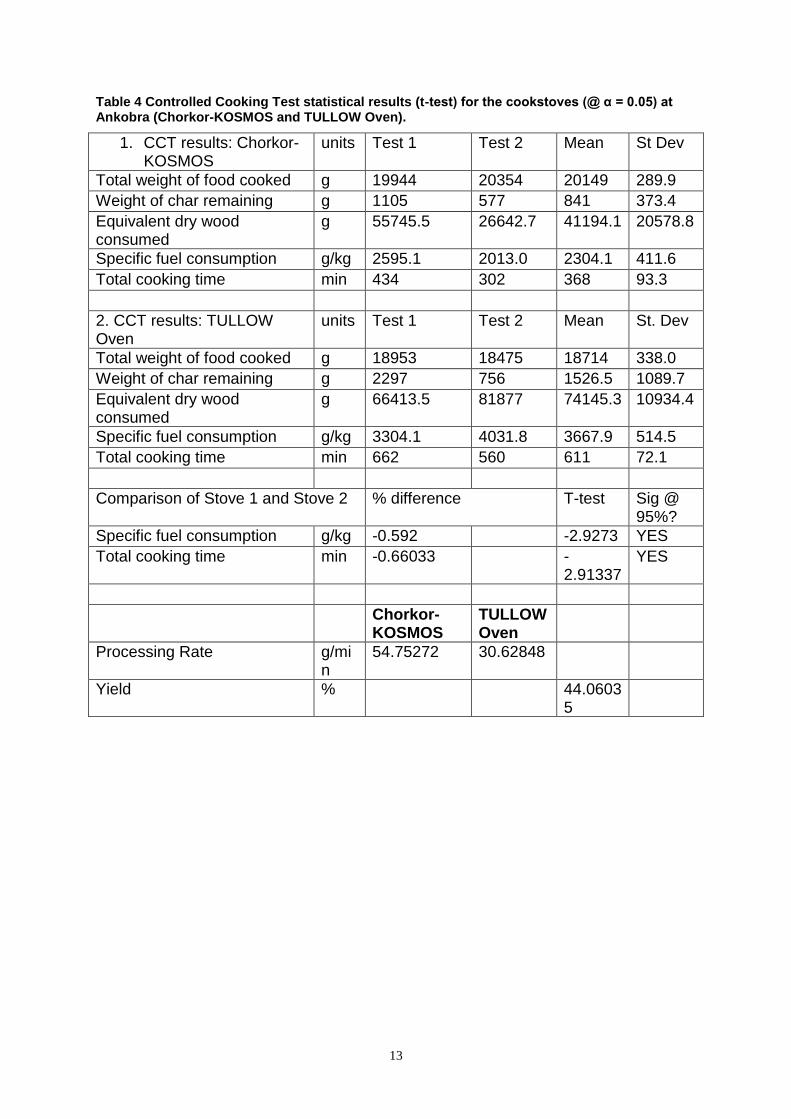
Table 4 Controlled Cooking Test statistical results (t-test) for the cookstoves (@ α = 0.05) at Ankobra (Chorkor-KOSMOS and TULLOW Oven).
1. CCT results: Chorkor-KOSMOS
units Test 1 Test 2 Mean St Dev
Total weight of food cooked g 19944 20354 20149 289.9
Weight of char remaining g 1105 577 841 373.4
Equivalent dry wood consumed
g 55745.5 26642.7 41194.1 20578.8
Specific fuel consumption g/kg 2595.1 2013.0 2304.1 411.6
Total cooking time min 434 302 368 93.3
2. CCT results: TULLOW Oven
units Test 1 Test 2 Mean St. Dev
Total weight of food cooked g 18953 18475 18714 338.0
Weight of char remaining g 2297 756 1526.5 1089.7
Equivalent dry wood consumed
g 66413.5 81877 74145.3 10934.4
Specific fuel consumption g/kg 3304.1 4031.8 3667.9 514.5
Total cooking time min 662 560 611 72.1
Comparison of Stove 1 and Stove 2 % difference T-test Sig @ 95%?
Specific fuel consumption g/kg -0.592 -2.9273 YES
Total cooking time min -0.66033 -2.91337
YES
Chorkor-KOSMOS
TULLOW Oven
Processing Rate g/min
54.75272 30.62848
Yield % 44.06035

14
Table 5 Controlled Cooking Test statistical results (t-test) for the cookstoves (@ α = 0.05) at Ankobra (KOSMOS Oven and TULLOW Oven).
1. CCT results: KOSMOS Oven
units
Test 1 Test 2 Mean St Dev
Total weight of food cooked g 21114 21385 21249.5
191.6
Weight of char remaining g 757 1222 989.5 328.8
Equivalent dry wood consumed
g 25128.1 27300 26214.0
1535.7
Specific fuel consumption g/kg 2856 2784 2820 50.9
Total cooking time min 450 480 465 21.2
2. CCT results: TULLOW Oven
units
Test 1 Test 2 Mean St. Dev
Total weight of food cooked g 18953 18475 18714 338.0
Weight of char remaining g 2297 756 1526.5 1089.7
Equivalent dry wood consumed
g 66413.5 81877 74145.3
10934.4
Specific fuel consumption g/kg 3304.1 4031.8 3667.9 514.5
Total cooking time min 662 560 611 72.1
Comparison of Stove 1 and Stove 2
% difference T-test Sig @ 95%?
Specific fuel consumption g/kg -0.300689 -2.31929
NO
Total cooking time min -0.313978 -2.74642
NO
Processing Rate g/min
KOSMOS Oven
TULLOW Oven
Yield % 45.697849 30.628478
32.97611
15
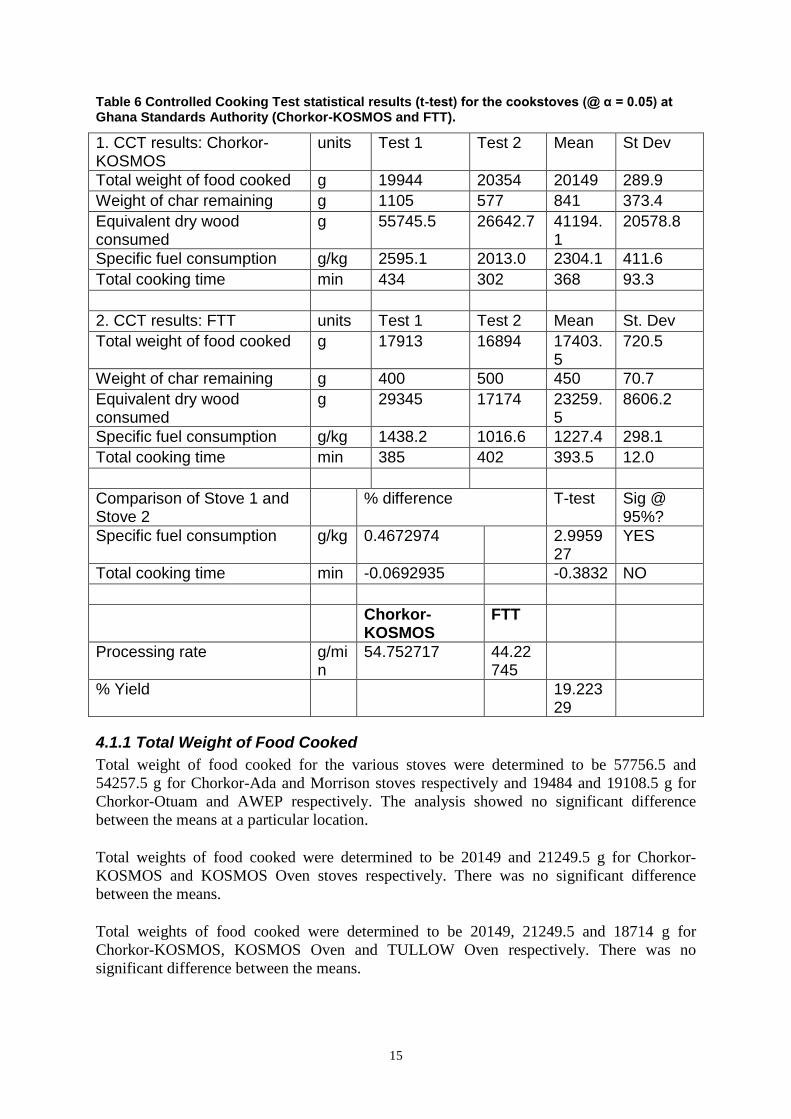
Table 6 Controlled Cooking Test statistical results (t-test) for the cookstoves (@ α = 0.05) at Ghana Standards Authority (Chorkor-KOSMOS and FTT).
1. CCT results: Chorkor-KOSMOS
units Test 1 Test 2 Mean St Dev
Total weight of food cooked g 19944 20354 20149 289.9
Weight of char remaining g 1105 577 841 373.4
Equivalent dry wood consumed
g 55745.5 26642.7 41194.1
20578.8
Specific fuel consumption g/kg 2595.1 2013.0 2304.1 411.6
Total cooking time min 434 302 368 93.3
2. CCT results: FTT units Test 1 Test 2 Mean St. Dev
Total weight of food cooked g 17913 16894 17403.5
720.5
Weight of char remaining g 400 500 450 70.7
Equivalent dry wood consumed
g 29345 17174 23259.5
8606.2
Specific fuel consumption g/kg 1438.2 1016.6 1227.4 298.1
Total cooking time min 385 402 393.5 12.0
Comparison of Stove 1 and Stove 2
% difference T-test Sig @ 95%?
Specific fuel consumption g/kg 0.4672974 2.995927
YES
Total cooking time min -0.0692935 -0.3832 NO
Chorkor-KOSMOS
FTT
Processing rate g/min
54.752717 44.22745
% Yield 19.22329
4.1.1 Total Weight of Food Cooked
Total weight of food cooked for the various stoves were determined to be 57756.5 and
54257.5 g for Chorkor-Ada and Morrison stoves respectively and 19484 and 19108.5 g for
Chorkor-Otuam and AWEP respectively. The analysis showed no significant difference
between the means at a particular location.
Total weights of food cooked were determined to be 20149 and 21249.5 g for Chorkor-
KOSMOS and KOSMOS Oven stoves respectively. There was no significant difference
between the means.
Total weights of food cooked were determined to be 20149, 21249.5 and 18714 g for
Chorkor-KOSMOS, KOSMOS Oven and TULLOW Oven respectively. There was no
significant difference between the means.

16
The total weight of food cooked using the FTT was determined to be 17403.5 g. There was
no significant difference between the means (Chorkor-KOSMOS and FTT).
4.1.2 Equivalent Dry Wood Consumed
Equivalent dry wood consumed for the various stoves were determined to be 45455.9,
26310.1, 34805.8 and 28389 g for Chorkor, Morrison, AWEP and Chorkor-Otuam stoves
respectively. The analysis showed that there was a significant difference between the means.
Equivalent dry wood consumed were determined to be 41194.1, 26214 and 74145.3 g for
Chorkor-KOSMOS, KOSMOS Oven and TULLOW Oven respectively. The analysis showed
that there was a significant difference between the means.
Equivalent dry wood consumed for the FTT stove was determined to be 23259.5 g and
compared to Chorkor-Ada. The analysis showed a significant difference between the means.
Figure 7 Shows that the TULLOW Oven used more dry wood than any of the stoves. The weight of raw fish used on the Chorkor-Ada and Morrison were more than the other test locations.
4.1.3 Specific Fuel Consumption
The specific fuel consumption were determined to be 494 and 313.2 g/kg for Chorkor-Ada
and Morrison stoves respectively. The analysis shows that there was a significant difference
between the means @ 95% confidence level and determined to be 36.6% - YES (i.e. fuel
saving of 36.6%) but does not meet the EnDev requirement of 40%.
The specific fuel consumption were determined to be 1822.5 and 1461.8 g/kg for Chorkor-
Otuam and AWEP respectively. The analysis showed that there was no significant difference
between the means and was determined to be 19.8% - NO; Sig. @ 95% confidence level (i.e.
fuel saving of 19.8%) which does not meet the EnDev requirement of 40%.
57.7565
54.2575
19.1085
19.484
20.149
21.2495
18.714
17.4035
45.4559
26.3101
34.8058
28.389
41.1941
26.214
74.1453
23.2595
0 10 20 30 40 50 60 70 80
Chorkor-Ada
Morrison
Chorkor-Otuam
AWEP
Chorkor-KOSMOS
KOSMOS Oven
TULLOW Oven
FTT
Weight [kg]
Sto
ve
STOVES TEST PERFORMANCE
EQUIVALENT OF DRY WOOD USED WEIGHT OF FOOD COOKED
17
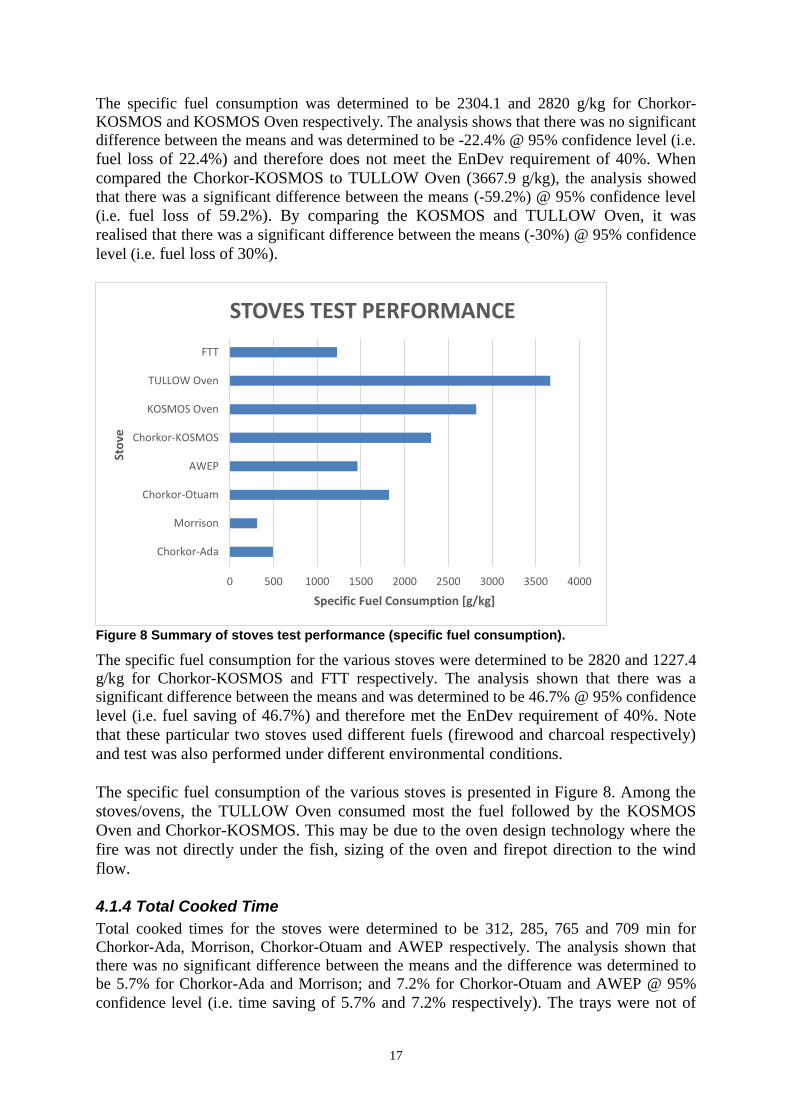
The specific fuel consumption was determined to be 2304.1 and 2820 g/kg for Chorkor-
KOSMOS and KOSMOS Oven respectively. The analysis shows that there was no significant
difference between the means and was determined to be -22.4% @ 95% confidence level (i.e.
fuel loss of 22.4%) and therefore does not meet the EnDev requirement of 40%. When
compared the Chorkor-KOSMOS to TULLOW Oven (3667.9 g/kg), the analysis showed
that there was a significant difference between the means (-59.2%) @ 95% confidence level
(i.e. fuel loss of 59.2%). By comparing the KOSMOS and TULLOW Oven, it was
realised that there was a significant difference between the means (-30%) @ 95% confidence
level (i.e. fuel loss of 30%).
Figure 8 Summary of stoves test performance (specific fuel consumption).
The specific fuel consumption for the various stoves were determined to be 2820 and 1227.4
g/kg for Chorkor-KOSMOS and FTT respectively. The analysis shown that there was a
significant difference between the means and was determined to be 46.7% @ 95% confidence
level (i.e. fuel saving of 46.7%) and therefore met the EnDev requirement of 40%. Note
that these particular two stoves used different fuels (firewood and charcoal respectively)
and test was also performed under different environmental conditions.
The specific fuel consumption of the various stoves is presented in Figure 8. Among the
stoves/ovens, the TULLOW Oven consumed most the fuel followed by the KOSMOS
Oven and Chorkor-KOSMOS. This may be due to the oven design technology where the
fire was not directly under the fish, sizing of the oven and firepot direction to the wind
flow.
4.1.4 Total Cooked Time
Total cooked times for the stoves were determined to be 312, 285, 765 and 709 min for
Chorkor-Ada, Morrison, Chorkor-Otuam and AWEP respectively. The analysis shown that
there was no significant difference between the means and the difference was determined to
be 5.7% for Chorkor-Ada and Morrison; and 7.2% for Chorkor-Otuam and AWEP @ 95%
confidence level (i.e. time saving of 5.7% and 7.2% respectively). The trays were not of
0 500 1000 1500 2000 2500 3000 3500 4000
Chorkor-Ada
Morrison
Chorkor-Otuam
AWEP
Chorkor-KOSMOS
KOSMOS Oven
TULLOW Oven
FTT
Specific Fuel Consumption [g/kg]
Sto
ve
STOVES TEST PERFORMANCE
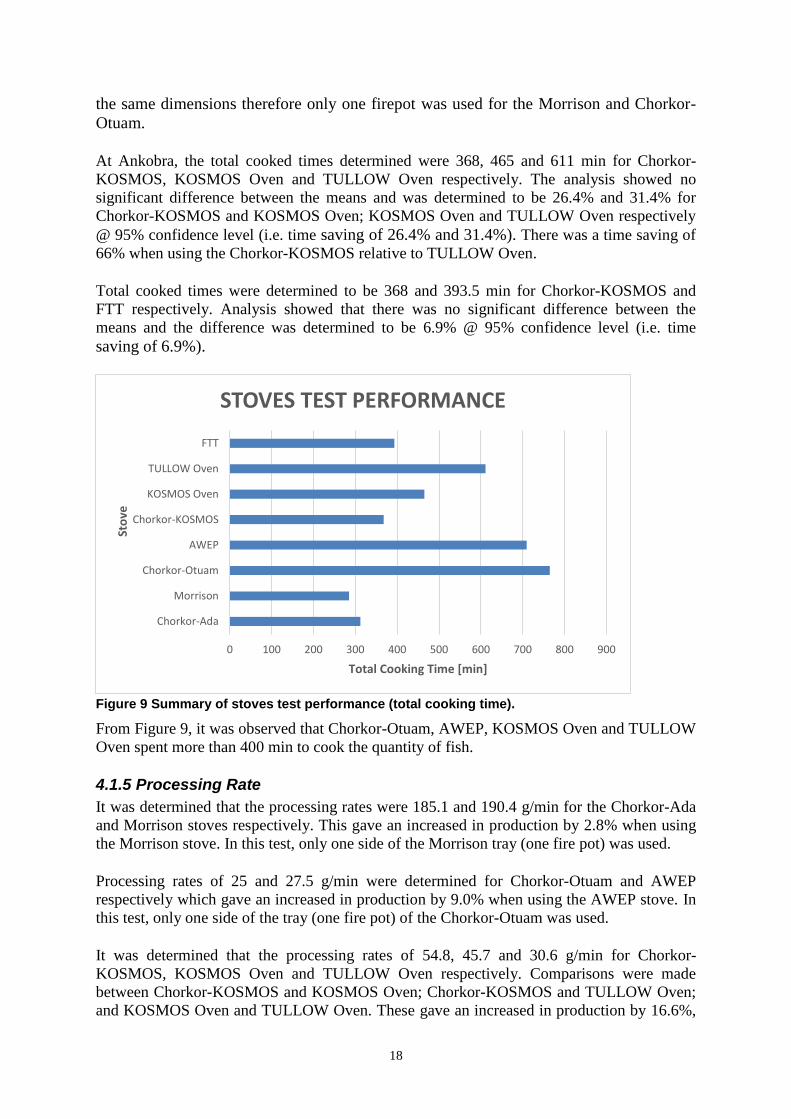
18
the same dimensions therefore only one firepot was used for the Morrison and Chorkor-
Otuam.
At Ankobra, the total cooked times determined were 368, 465 and 611 min for Chorkor-
KOSMOS, KOSMOS Oven and TULLOW Oven respectively. The analysis showed no
significant difference between the means and was determined to be 26.4% and 31.4% for
Chorkor-KOSMOS and KOSMOS Oven; KOSMOS Oven and TULLOW Oven respectively
@ 95% confidence level (i.e. time saving of 26.4% and 31.4%). There was a time saving of
66% when using the Chorkor-KOSMOS relative to TULLOW Oven.
Total cooked times were determined to be 368 and 393.5 min for Chorkor-KOSMOS and
FTT respectively. Analysis showed that there was no significant difference between the
means and the difference was determined to be 6.9% @ 95% confidence level (i.e. time
saving of 6.9%).
Figure 9 Summary of stoves test performance (total cooking time).
From Figure 9, it was observed that Chorkor-Otuam, AWEP, KOSMOS Oven and TULLOW
Oven spent more than 400 min to cook the quantity of fish.
4.1.5 Processing Rate
It was determined that the processing rates were 185.1 and 190.4 g/min for the Chorkor-Ada
and Morrison stoves respectively. This gave an increased in production by 2.8% when using
the Morrison stove. In this test, only one side of the Morrison tray (one fire pot) was used.
Processing rates of 25 and 27.5 g/min were determined for Chorkor-Otuam and AWEP
respectively which gave an increased in production by 9.0% when using the AWEP stove. In
this test, only one side of the tray (one fire pot) of the Chorkor-Otuam was used.
It was determined that the processing rates of 54.8, 45.7 and 30.6 g/min for Chorkor-
KOSMOS, KOSMOS Oven and TULLOW Oven respectively. Comparisons were made
between Chorkor-KOSMOS and KOSMOS Oven; Chorkor-KOSMOS and TULLOW Oven;
and KOSMOS Oven and TULLOW Oven. These gave an increased in production by 16.6%,
0 100 200 300 400 500 600 700 800 900
Chorkor-Ada
Morrison
Chorkor-Otuam
AWEP
Chorkor-KOSMOS
KOSMOS Oven
TULLOW Oven
FTT
Total Cooking Time [min]
Sto
ve
STOVES TEST PERFORMANCE
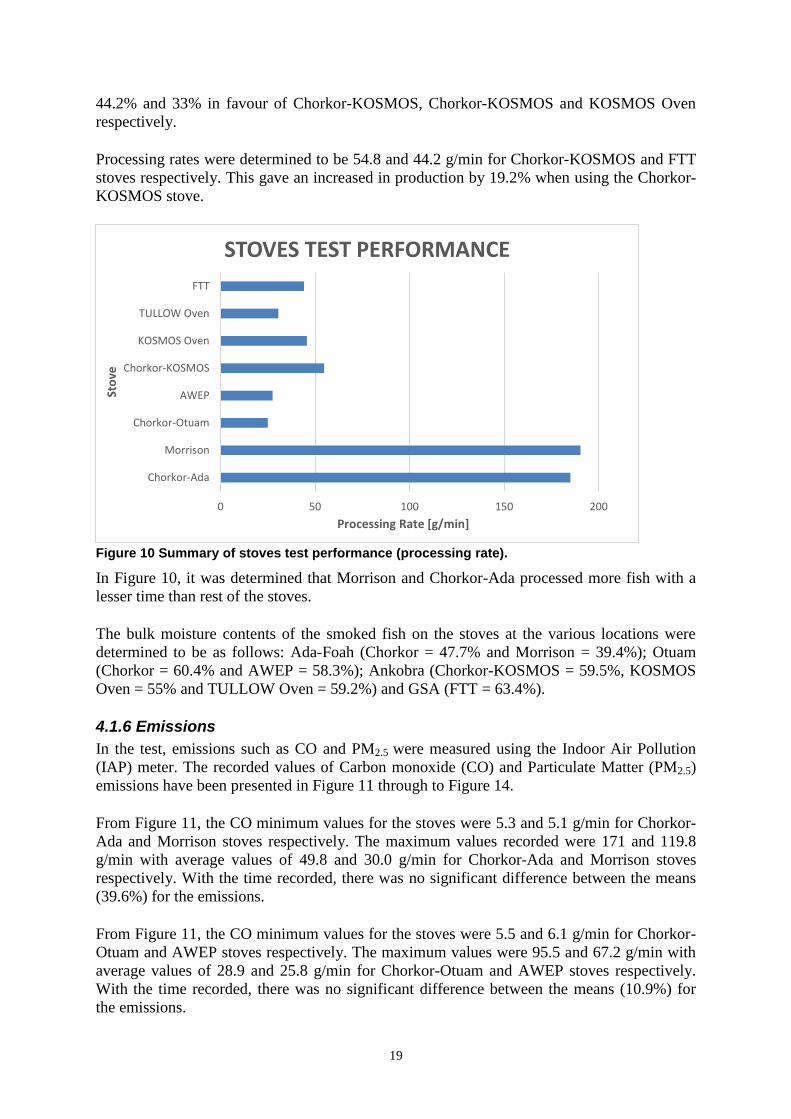
19
44.2% and 33% in favour of Chorkor-KOSMOS, Chorkor-KOSMOS and KOSMOS Oven
respectively.
Processing rates were determined to be 54.8 and 44.2 g/min for Chorkor-KOSMOS and FTT
stoves respectively. This gave an increased in production by 19.2% when using the Chorkor-
KOSMOS stove.
Figure 10 Summary of stoves test performance (processing rate).
In Figure 10, it was determined that Morrison and Chorkor-Ada processed more fish with a
lesser time than rest of the stoves.
The bulk moisture contents of the smoked fish on the stoves at the various locations were
determined to be as follows: Ada-Foah (Chorkor = 47.7% and Morrison = 39.4%); Otuam
(Chorkor = 60.4% and AWEP = 58.3%); Ankobra (Chorkor-KOSMOS = 59.5%, KOSMOS
Oven = 55% and TULLOW Oven = 59.2%) and GSA (FTT = 63.4%).
4.1.6 Emissions
In the test, emissions such as CO and PM2.5 were measured using the Indoor Air Pollution
(IAP) meter. The recorded values of Carbon monoxide (CO) and Particulate Matter (PM2.5)
emissions have been presented in Figure 11 through to Figure 14.
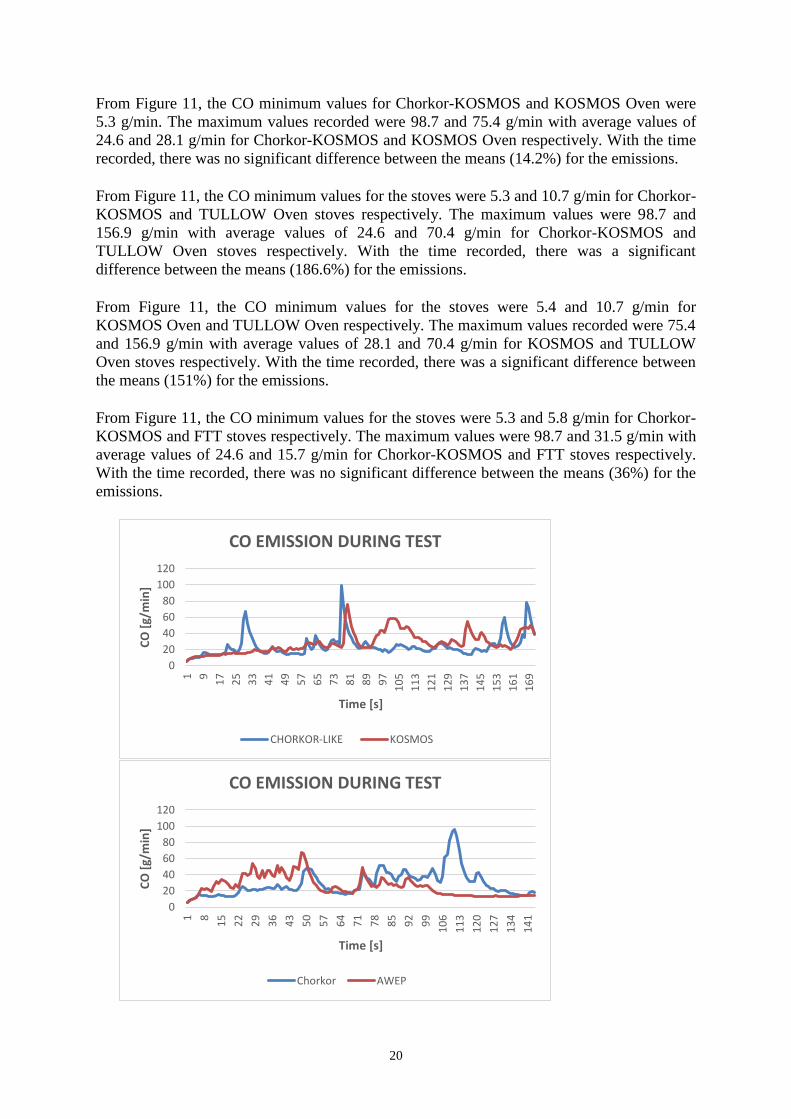
From Figure 11, the CO minimum values for the stoves were 5.3 and 5.1 g/min for Chorkor-
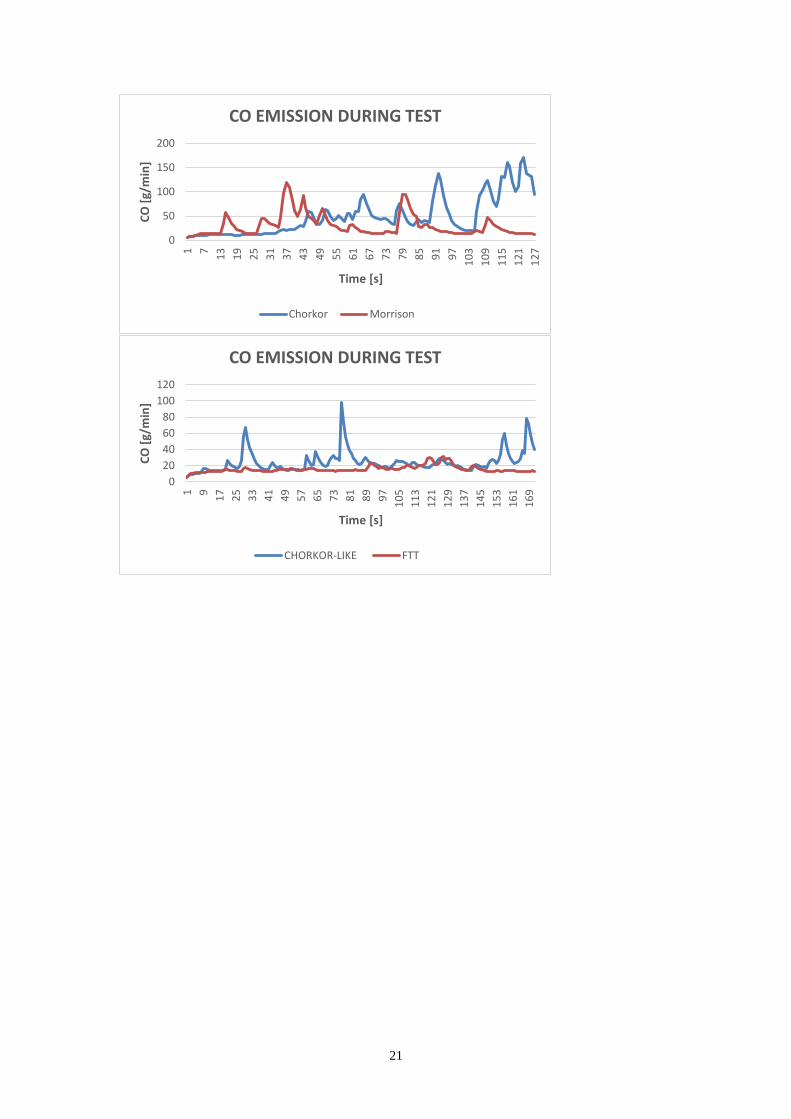
Ada and Morrison stoves respectively. The maximum values recorded were 171 and 119.8
g/min with average values of 49.8 and 30.0 g/min for Chorkor-Ada and Morrison stoves
respectively. With the time recorded, there was no significant difference between the means
(39.6%) for the emissions.
From Figure 11, the CO minimum values for the stoves were 5.5 and 6.1 g/min for Chorkor-
Otuam and AWEP stoves respectively. The maximum values were 95.5 and 67.2 g/min with
average values of 28.9 and 25.8 g/min for Chorkor-Otuam and AWEP stoves respectively.
With the time recorded, there was no significant difference between the means (10.9%) for
the emissions.
0 50 100 150 200
Chorkor-Ada
Morrison
Chorkor-Otuam
AWEP
Chorkor-KOSMOS
KOSMOS Oven
TULLOW Oven
FTT
Processing Rate [g/min]
Sto
ve
STOVES TEST PERFORMANCE
20
From Figure 11, the CO minimum values for Chorkor-KOSMOS and KOSMOS Oven were
5.3 g/min. The maximum values recorded were 98.7 and 75.4 g/min with average values of
24.6 and 28.1 g/min for Chorkor-KOSMOS and KOSMOS Oven respectively. With the time
recorded, there was no significant difference between the means (14.2%) for the emissions.
From Figure 11, the CO minimum values for the stoves were 5.3 and 10.7 g/min for Chorkor-
KOSMOS and TULLOW Oven stoves respectively. The maximum values were 98.7 and
156.9 g/min with average values of 24.6 and 70.4 g/min for Chorkor-KOSMOS and
TULLOW Oven stoves respectively. With the time recorded, there was a significant
difference between the means (186.6%) for the emissions.
From Figure 11, the CO minimum values for the stoves were 5.4 and 10.7 g/min for
KOSMOS Oven and TULLOW Oven respectively. The maximum values recorded were 75.4
and 156.9 g/min with average values of 28.1 and 70.4 g/min for KOSMOS and TULLOW
Oven stoves respectively. With the time recorded, there was a significant difference between
the means (151%) for the emissions.
From Figure 11, the CO minimum values for the stoves were 5.3 and 5.8 g/min for Chorkor-
KOSMOS and FTT stoves respectively. The maximum values were 98.7 and 31.5 g/min with
average values of 24.6 and 15.7 g/min for Chorkor-KOSMOS and FTT stoves respectively.
With the time recorded, there was no significant difference between the means (36%) for the
emissions.
0
20
40
60
80
100
120
1 9
17
25
33
41
49
57
65
73
81
89
97
10
5
11
3
12
1
12
9
13
7
14
5
15
3
16
1
16
9
CO
[g/
min
]
Time [s]
CO EMISSION DURING TEST
CHORKOR-LIKE KOSMOS
0
20
40
60
80
100
120
1 8
15
22
29
36
43
50
57
64
71
78
85
92
99
10
6
11
3
12
0
12
7
13
4
14
1
CO
[g/
min
]
Time [s]
CO EMISSION DURING TEST
Chorkor AWEP
21
0
50
100
150
200
1 7
13
19
25
31
37
43
49
55
61
67
73
79
85
91
97
10
3
10
9
11
5
12
1
12
7
CO
[g/
min
]
Time [s]
CO EMISSION DURING TEST
Chorkor Morrison
0
20
40
60
80
100
120
1 9
17
25
33
41
49
57
65
73
81
89
97
10
5
11
3
12
1
12
9
13
7
14
5
15
3
16
1
16
9
CO
[g/
min
]
Time [s]
CO EMISSION DURING TEST
CHORKOR-LIKE FTT

22
Figure 11 Sample of CO measured using the IAP meter for the various stoves.
From Figure 12 it was observed that Chorkor-Ada and TULLOW Oven emitted the highest
CO emissions greater than 30 g/min.
Figure 12 Summary of stoves test performance (CO emission).
Figure 13 depicts the recorded PM2.5 for the stoves with minimum values of 856.9 and 841.5
mg/min for Chorkor-Ada and Morrison stoves respectively. The maximum values were
0
50
100
150
200
1 9
17
25
33
41
49
57
65
73
81
89
97
10
5
11
3
12
1
12
9
13
7
14
5
15
3
16
1
16
9
CO
[g/
min
]
Time [s]
CO EMISSION DURING TEST
KOSMOS TULLOW
0
50
100
150
200
1 9
17
25
33
41
49
57
65
73
81
89
97
10
5
11
3
12
1
12
9
13
7
14
5
15
3
16
1
16
9
CO
[g/
min
]
Time [s]
CO EMISSION DURING TEST
CHORKOR-LIKE TULLOW
0 10 20 30 40 50 60 70 80
Chorkor-Ada
Morrison
Chorkor-Otuam
AWEP
Chorkor-KOSMOS
KOSMOS Oven
TULLOW Oven
FTT
CO Emission [g/min]
Sto
ve
STOVES TEST PERFORMANCE
23
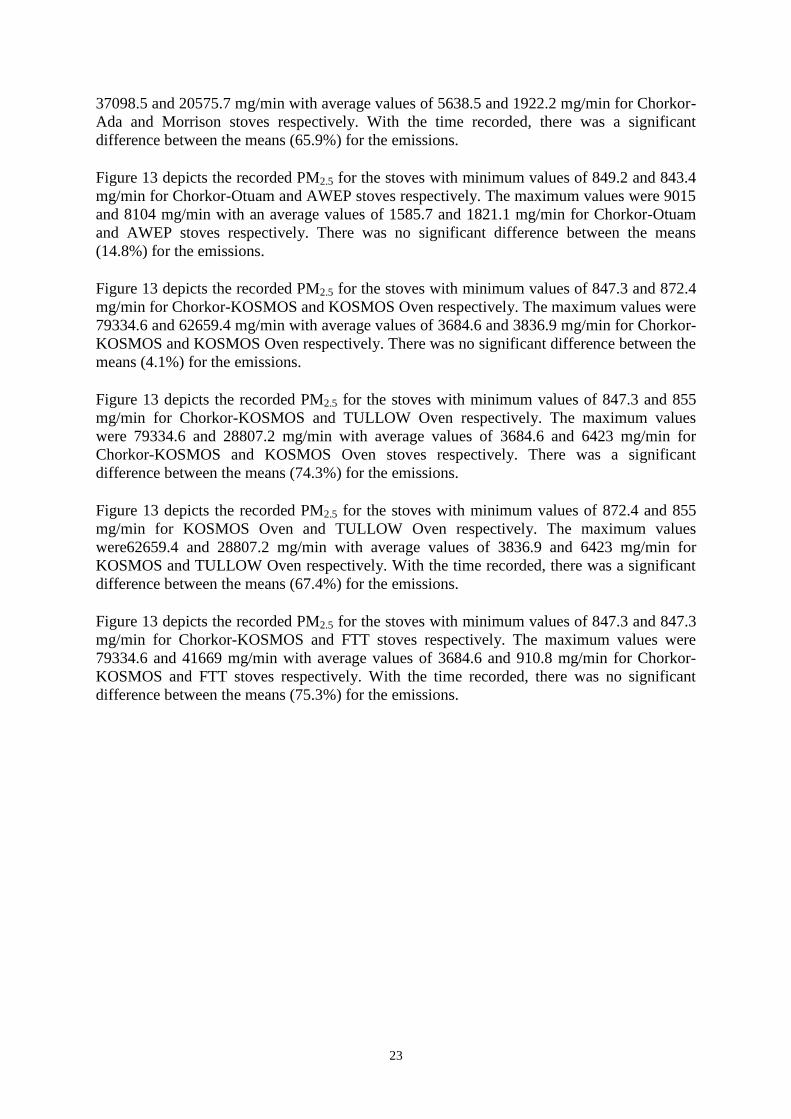
37098.5 and 20575.7 mg/min with average values of 5638.5 and 1922.2 mg/min for Chorkor-
Ada and Morrison stoves respectively. With the time recorded, there was a significant
difference between the means (65.9%) for the emissions.
Figure 13 depicts the recorded PM2.5 for the stoves with minimum values of 849.2 and 843.4
mg/min for Chorkor-Otuam and AWEP stoves respectively. The maximum values were 9015
and 8104 mg/min with an average values of 1585.7 and 1821.1 mg/min for Chorkor-Otuam
and AWEP stoves respectively. There was no significant difference between the means
(14.8%) for the emissions.
Figure 13 depicts the recorded PM2.5 for the stoves with minimum values of 847.3 and 872.4
mg/min for Chorkor-KOSMOS and KOSMOS Oven respectively. The maximum values were
79334.6 and 62659.4 mg/min with average values of 3684.6 and 3836.9 mg/min for Chorkor-
KOSMOS and KOSMOS Oven respectively. There was no significant difference between the
means (4.1%) for the emissions.
Figure 13 depicts the recorded PM2.5 for the stoves with minimum values of 847.3 and 855
mg/min for Chorkor-KOSMOS and TULLOW Oven respectively. The maximum values
were 79334.6 and 28807.2 mg/min with average values of 3684.6 and 6423 mg/min for
Chorkor-KOSMOS and KOSMOS Oven stoves respectively. There was a significant
difference between the means (74.3%) for the emissions.
Figure 13 depicts the recorded PM2.5 for the stoves with minimum values of 872.4 and 855
mg/min for KOSMOS Oven and TULLOW Oven respectively. The maximum values
were62659.4 and 28807.2 mg/min with average values of 3836.9 and 6423 mg/min for
KOSMOS and TULLOW Oven respectively. With the time recorded, there was a significant
difference between the means (67.4%) for the emissions.
Figure 13 depicts the recorded PM2.5 for the stoves with minimum values of 847.3 and 847.3
mg/min for Chorkor-KOSMOS and FTT stoves respectively. The maximum values were
79334.6 and 41669 mg/min with average values of 3684.6 and 910.8 mg/min for Chorkor-
KOSMOS and FTT stoves respectively. With the time recorded, there was no significant
difference between the means (75.3%) for the emissions.

24
0
20000
40000
60000
80000
100000
1 9
17
25
33
41
49
57
65
73
81
89
97
10
5
11
3
12
1
12
9
13
7
14
5
15
3
16
1
16
9
PM
2.5 [
mg/
min
]
Time [s]
PM2.5 EMISSION DURING TEST
CHORKOR-LIKE KOSMOS
0
2000
4000
6000
8000
10000
1 8
15
22
29
36
43
50
57
64
71
78
85
92
99
10
6
11
3
12
0
12
7
13
4
14
1
PM
2.5
[mg/
min
]
Time [s]
PM 2.5 EMISSION DURING TEST
Chorkor AWEP
0
10000
20000
30000
40000
1 7
13
19
25
31
37
43
49
55
61
67
73
79
85
91
97
10
3
10
9
11
5
12
1
12
7
PM
(2.
5) [
mg/
min
]
Time [s]
PM (2.5) EMISSION DURING TEST
Chorkor Morrison

25
Figure 13: Sample of PM2.5 measured using the IAP meter for the various stoves
0
20000
40000
60000
80000
100000
1 9
17
25
33
41
49
57
65
73
81
89
97
10
5
11
3
12
1
12
9
13
7
14
5
15
3
16
1
16
9
PM
2.5 [
mg/
min
]
Time [s]
PM2.5 EMISSION DURING TEST
CHORKOR-LIKE FTT
0
20000
40000
60000
80000
100000
1 9
17
25
33
41
49
57
65
73
81
89
97
10
5
11
3
12
1
12
9
13
7
14
5
15
3
16
1
16
9
PM
2.5
[m
g/m
in]
Time [s]
PM 2.5 EMISSION DURING TEST
CHORKOR-LIKE TULLOW
0
20000
40000
60000
80000
1 9
17
25
33
41
49
57
65
73
81
89
97
10
5
11
3
12
1
12
9
13
7
14
5
15
3
16
1
16
9
PM
2.5
[mg/
min
]
Time [s]
PM2.5 EMISSION DURING TEST
KOSMOS TULLOW
26
Figure 14 Summary of stoves test performance (PM2.5 emission).
From Figure 14 it was observed that Chrokor-Ada, Chorkor-KOSMOS, KOSMOS Oven and
TULLOW Oven emitted more PM 2.5 at a rate greater than 2000 mg/min
5.0 CONCLUSIONS Controlled Cooking Tests (CCT) were performed at Ada-Foah, Otuam, Ankobra and
Accra for fish smoking and compared the fuel efficiencies and emissions of the
constructed stoves at various locations.
For total weight of food cooked for the various stoves, the analyses showed that there were
no significant differences between the means at various locations.
There were no char remaining after cooking using Chorkor-Ada and Morrison stoves as fuels
were allowed to burn completely which had been the normal practice in the community.
Weight of char remaining after cooking for the various stoves was determined to be 362 and
74 g for Chorkor-Otuam and AWEP respectively, 841, 989.5 and 1526.5 g for Chorkor-
KOSMOS, KOSMOS-Oven and TULLOW Oven respectively. There was no significant
difference between the means (Chorkor-KOSMOS and KOSMOS Oven) but a significant
difference between the means (Chorkor-KOSMOS, KOSMOS Oven against TULLOW
Oven).
Weight of char remaining after cooking for the various stoves was determined to be 841 and
450 g for the Chorkor-KOSMOS and FTT stoves respectively. There was a significant
difference between the means.
Equivalent dry wood consumed for the various stoves was determined to be 45455.9 and
26310.1 g for Chorkor and Morrison stoves respectively; 34805.8 and 28389 g for AWEP
and Chorkor-Otuam respectively; 41194.1, 26214, 74145.3 and 23259.5 g for Chorkor-
KOSMOS, KOSMOS Oven, TULLOW Oven and FTT respectively. All the analyses showed
a significant difference between the means.
0 1000 2000 3000 4000 5000 6000 7000
Chorkor-Ada
Morrison
Chorkor-Otuam
AWEP
Chorkor-KOSMOS
KOSMOS Oven
TULLOW Oven
FTT
PM2.5 Emission [mg/min]
Sto
ve
STOVES TEST PERFORMANCE

27
The specific fuel consumption was determined to be 494 and 313.2 g/kg for Chorkor-Ada and
Morrison stoves respectively and 1822.5 and 1461.8 g/kg for Chorkor-Otuam and AWEP
respectively. There was a fuel savings of 36.6% for Morrison and 19.8 for AWEP but does
not meet the EnDev requirement of 40%.
The specific fuel consumption were determined to be 2304.1, 2820 and 3667.9 g/kg for
Chorkor-KOSMOS, KOSMOS Oven and TULLOW Oven respectively. There was a fuel
loses of 22.4% by using the KOSMOS Oven and 59.2% when using the TULLOW Oven.
Between KOSMOS Oven and TULLOW Oven there was 30% fuel loss when using the
TULLOW Oven.
The specific fuel consumption were determined to be 2304.1and 1227.4 g/kg for Chorkor-
KOSMOS and FTT respectively. There was a fuel saving of 46.7% for the FTT which met
the EnDev requirement of 40% but note that the test was performed under different
environmental conditions as well as fuel used.
Total cooked times for the various stoves were determined to be 312 and 285 min for
Chorkor-Ada and Morrison respectively. There was a time saving of 5.7% for the Morrison
stove.
Total cooked times were determined to be 765 and 709 min for Chorkor-Otuam and AWEP
respectively. There was a time saving of 7.3%. The trays are larger than that of the AWEP
and only one firepot was used for the Chorkor-Otuam stove.
Total cooked times were determined to be 368, 465 and 611 min for Chorkor-KOSMOS,
KOSMOS Oven and TULLOW Oven respectively. There was no significant difference
between the means and time loss of 26.4% (Chorkor-KOSMOS and KOSMOS Oven) but a
significant difference between the means and a time saving of 66% (Chorkor-KOSMOS
and TULLOW Oven) and a time saving of a time saving of 31.4 % (KOSMOS Oven and
TULLOW Oven).
Total cooked times were 368 and 393.5 min for Chorkor-KOSMOS and FTT respectively.
There was a time saving of 6.9%.
It was determined that the processing rates were 185.1 and 190.4 g/min for the Chorkor-Ada
and Morrison stoves respectively which gave an increased in production by 2.8% when using
the Morrison stove.
Processing rates of 25 and 27.5 g/min for Chorkor-Otuam and AWEP respectively which
gave an increased by 9.0% when using the AWEP stove.
Processing rates of 54.8, 45.7 and 30.6 g/min were determined for the Chorkor-KOSMOS,
KOSMOS Oven and TULLOW Oven respectively. This gave a decreased in production by
16.5% and 44% when using the KOSMOS Oven and TULLOW Oven respectively and an
increase of 33% when compared KOSMOS Oven and TULLOW Oven. Processing rate of
44.2 g/min was determined for the FTT stove when compared to Chorkor-KOSMOS it gave a
decreased by 19.2%.
28
The bulk moisture contents of the smoked fish on the stoves at the various locations were
determined to be as follows: Ada-Foah (Chorkor = 47.7% and Morrison = 39.4%); Otuam
(Chorkor = 60.4% and AWEP = 58.3%); Ankobra (Chorkor-KOSMOS = 59.5%, KOSMOS
Oven = 55% and TULLOW Oven = 59.2%) and GSA (FTT = 63.4%).
Carbon Monoxide (CO) average values of 49.8 and 30.0 g/min were determined for Chorkor-
Ada and Morrison stoves respectively and 28.9 and 25.8 g/min for Chorkor-Otuam and
AWEP stoves respectively. There was no significant difference between the means for the
emissions.
Carbon Monoxide (CO) average values of 24.6, 28.1and 70.4 g/min were determined for
Chorkor-KOSMOS, KOSMOS Oven and TULLOW Oven respectively. There was no
significant difference between the means (Chorkor-KOSMOS and KOSMOS Oven) and a
significant difference between the means (Chorkor-KOSMOS and TULLOW Oven;
KOSMOS Oven and TULLOW Oven) for the emissions.
The average values of CO were 24.6 and 15.7 g/min for Chorkor-KOSMOS and FTT stoves
respectively and no significant difference between the means for the emissions.
The average PM2.5 values of 5638.5 and 1922.2 mg/min were determined for Chorkor-Ada
and Morrison stoves respectively. There was a significant difference between the means for
the emissions and 1585.7 and 1821.1 mg/min for Chorkor-Otuam and AWEP stoves
respectively. There was no significant difference between the means for the emissions.
The average PM2.5 values recorded were 3684.6, 3836.9 and 6423 mg/min for Chorkor-
KOSMOS, KOSMOS Oven and TULLOW Oven respectively. There was no significant
difference between the means (Chorkor-KOSMOS, KOSMOS Oven) but a significant
difference between the means (Chorkor-KOSMOS and TULLOW Oven; KOSMOS Oven
and TULLOW Oven) for the emissions.
The average PM2.5 values recorded were 3684.6 and 910.8 mg/min for Chorkor-KOSMOS
and FTT stoves respectively. There was a significant difference between the means for the
emissions.
It can be concluded that almost all the stoves do not meet the EnDev requirements but the
Morrison could be considered for promotion.
REFERENCES Rob Bailis, 2004. The Household Energy and Health Programme, Shell Foundation, August
2004.
Top Related