


Languages
Pages
Legal


Population Ageing and the CurrentAccount in Selected OECD Countries
Maxime Fougère and Marcel Mérette∗
98-04
This study was partially derived from on work done by the OECD Secretariat, whose co-operation we gratefullyacknowledge. The authors also wish to thank Steven James and André Plourde for useful comments and LynnBouchard for technical assistance. The views expressed in this paper are solely those of the authors. Noresponsibility for them should be attributed to the Department of Finance.
Abstract
It is well known that over the next several decades, there will be significant changes in the agestructure of OECD populations. According to recent demographic projections by the UnitedNations, the share of the old-aged population is expected to double, on average, over the next 50years in the major industrialised countries. These demographic changes may have significantfiscal and economic consequences, and pose important public policy challenges for the countriesinvolved.
In this paper, we extend the Hviding and Mérette (1998) computable overlapping-generation(OLG) models to a small economy framework to investigate the possible effects of populationageing on the current account of six OECD countries. The calibration of the new models is suchthat a direct comparison of our simulation results with those obtained under the original modelsis possible. The comparison allows a thorough investigation of the potentially role of foreigninvestment in alleviating the negative macroeconomic effects of ageing populations
Our results show that the globalisation of capital markets may reduce, to some extent, thenegative effects of domestic population ageing for small open economies that age more rapidlythan the rest of the world. In such a case, the international capital market is able to offer betterreturns to domestic savings than would otherwise occur in a closed-economy context.
Résumé
C’est un fait reconnu qu’au cours des prochaines décennies, les pays de l’OCDE feront face àd’importants changements démographiques. Selon les projections récentes des Nations Unies, lapart des personnes âgées (65 ans et plus) sur l’ensemble de la population totale doublera au coursdes 50 prochaines années, dans les pays industrialisés. Ces changements démographiquespourraient avoir des conséquences financières et économiques importantes, et mettent en lumièreles défis que devront relever les politiques publiques des pays concernés.
Dans cet article, nous modifions le cadre d’analyse du modèle numérique de Hviding andMérette (1998) à générations imbriquées pour examiner les effets possibles du vieillissement dela population sur le compte courant pour six pays de l’OCDE. Le calibrage des nouveauxmodèles est tel qu’il permet une comparaison directe des résultats de simulations avec ceuxobtenus par les modèles originaux. La comparaison nous permet d’évaluer le potentiel quepourrait jouer les investissements étrangers en tant que palliatif aux effets économiques négatifsdu vieillissement des populations.
Nos résultats montrent que la globalisation des marchés des capitaux peut permettre de réduirequelque peu les effets néfastes du vieillissement de la population pour une petite économieouverte qui vieillit plus rapidement que le reste du monde. Dans un tel cas, les marchésinternationaux des capitaux sont capables d’offrir de meilleurs rendements à l’épargnedomestique que dans le cas d’une économie fermée.

1
1. Introduction
It is well known that, as the baby-boom generation retires, OECD populations will
age rapidly over the next several decades. According to recent demographic projections
by the United Nations, the share of the old-aged population is expected to double, on
average, in major industrialised countries over the next 50 years and the old-age
dependency ratio (ratio of old-age to working-age population) to rise substantially. There
is growing concern that these demographic changes will have significant macroeconomic
effects and pose difficult fiscal policy challenges.
The potential economic impacts of population ageing have been examined in a
number of papers. Some studies have used general equilibrium models with overlapping-
generations (OLG) to investigate the effect of ageing on national savings 1. The results
from these studies suggest that population ageing will lead to a sharp reduction in
national savings rates and in real output per capita over the next decades. Different
ageing patterns across countries may also induce important international capital flow
movements and hence affect current account balances. However, there has been very
little analysis done so far on the effect of ageing on the current account.
1 See for example Hviding and Mérette (1998), Miles (1996), Auerbach et al. (1989) and Auerbach and Kotlikoff(1987).

2
In this paper, we extend the Hviding and Mérette (1998) OLG models, that were
built for an OECD study2, to examine the impact of population ageing on the current
account. To address this issue, we replace the models’ closed-economy assumption with a
small open economy assumption. The countries examined are Canada, France, Italy,
Japan, Sweden, the United Kingdom and the United States. The extended versions are
calibrated with exactly the same parameters as in the original models and, consequently,
generate the same initial steady states. Thus, we are in a position to compare our results
on economic variables to those obtained by Hviding and Mérette (1998) and hence, to
investigate the role of foreign investment in alleviating the negative economic effects of
ageing populations.
The models are populated by a series of 15 rational overlapping generations (each
period in the model corresponding to 4 years), that optimally choose life patterns of
consumption and bequest. The models are of a type similar to that developed by
Auerbach and Kotlikoff (1987). To investigate the possible effects of population ageing
on current accounts, we assume for convenience that interest rates movements are
determined in the world market by the US economy. However, this exercise is only
illustrative, since in reality movements in world capital markets are determined through
interactions among countries.
2 The results of their work were first presented at the Working Party no. 1 on Macroeconomics and Structural PolicyAnalysis at the OECD, October 1997.

3
The remainder of this paper is divided as follows: Section 2 discusses the
prospective demographic trends for the seven OECD countries and the impact on old-age
dependency ratios. Section 3 describes the structure and calibration of the models used
for the analysis. Section 4 briefly summarises the baseline simulation results from
Hviding and Mérette (1998). Section 5 discusses the impact on current accounts. Finally,
Section 6 provides some concluding remarks.
2. Ageing and Demographics
An increase in life expectancy or a drop in the fertility rate (the expected number
of births over a woman’s life span) are the two major reasons why average population
age can increase. In most industrialised countries, a declining fertility rate is the principal
source of ageing. In the case of Japan, however, increased life expectancy is also a
relatively important factor. According to recent demographic projections by the United
Nations, the proportion of the elderly is expected virtually to double over the next 50
years. Of the seven countries examined, Italy and Japan are projected to experience the
largest increases in the proportion of old-aged people (see Table 1). Ageing is projected
to be least dramatic in Sweden. Canada, France, the US, and the UK rank in the middle of
the countries considered.

4
Table 1Share of Old-Age Population
(as a Percent of Total Population)
1996 2050
Canada 12 24
France 15 24
Italy 17 34
Japan 15 30
Sweden 17 22
United Kingdom 15 23
United States 13 21Source: United Nations
3. The Models1954 1966 1978 1990 2002 2014 2026 2038 2050
Source: United Nations
5
10
15
20
25
30
35
40
45
50
55
60
65
70
75
Italy
Sweden
UK
USA
Japan
France
Canada
Chart 1Old-Age Dependency Ratios for Seven OECD Countries
Projections

5
The old-age dependency ratio shown in Chart 1 also illustrates the impact of the
bulge in the age structure. In Japan and Italy, the dependency ratio is already increasing
rapidly and is projected to rise even faster in the future, rising by 190% and 170%
respectively between 1996 and 2050. For the other five countries, the rise in the
dependency ratio is more gradual until 2010, but increases at a much faster rate
thereafter. For Canada, France and the US, the dependency ratio is expected to increase
by 130%, 100% and 90% respectively, over the same period, compared to 60% and 50%
for the UK and Sweden.
3. The Models
The models are based on the life-cycle theory of savings behaviour. In the models,
there are 15 generations living side by side at each point in time. Each new generation
has 15 periods to live, with each period corresponding to 4 years of life. The 15
generations included in the model are 16 to 75 years of age.3 Individuals are assumed to
work until age 63, so 12 of the 15 generations are members of the active population.
Population growth rates are exogenous. The structure of these and Hviding and Mérette
(1998) models is similar to that of Auerbach and Kotlikoff (1987), with the exception that
the labour supply is exogenous and bequest motives are included. The models are
calibrated as in Hviding and Mérette (1998). The small open economy assumption is
incorporated such as the benchmark steady states of the different economies are similar 4.
3 The structural equations of the model are presented in Appendix I.
4 The calibration results are presented in Appendix II.

6
However, the small open economy assumption implies that the adjustment in the capital
market will differ following an ageing shock. It is an international flow of capital
(current account balances) that re-equilibrate the capital market rather than the domestic
capital return as in Hviding and Mérette (1998).
Technologies and Firm Behaviour
The final goods sector production depends on physical capital and effective
labour. All firms are identical. Technology is assumed to be Cobb-Douglas. Physical
assets can be accumulated as forgone consumption, which is equivalent to assuming that
physical capital goods are produced in a separate sector that has the same technology as
the final-output sector.
Factor demands stem from profit maximisation by firms. Firms rent physical
capital at the market rental rate and hire labour at the market wage rate per unit of
effective labour, up to the point at which their marginal products equal their marginal
costs. Since population growth is exogenous, the labour force increases at the rate of
labour augmenting technical progress and evolves from one period to the next with the
changing age composition of the population. The effective wage rate is equal to the
marginal product of effective labour. The firm’s wage bill is thus the product of the gross
effective wage rate times the stock of effective labour supplied by all living individuals.

7
Cohort Behaviour
There is a representative individual for each generation. Each individual chooses
final goods consumption and a bequest to maximise an intertemporal (constant elasticity
of substitution) utility function, subject to physical capital accumulation conditions.
Bequest motives are specified as in Blinder (1974). Bequests are distributed at the end of
each generation’s lifetime and are received equally by all working generations. A
generation’s lifetime profile of wage income is calibrated similarly in all models. Each
generation’s interest income is determined by its stock of physical wealth.
Government Behaviour
The pension system is assumed to be pure “pay-as-you-go” (PAYG) and is fully
integrated into government accounts. The government has the responsibility to maintain
the solvency of the pension fund by obtaining sufficient contributions from each
generation. The public-sector debt-to-GDP ratio is assumed to be constant and the PAYG
pension plan is financed through a wage-income tax. Government expenditures are
restricted to pensions, spending on public goods and interest payments on the public debt.
Public good expenditures affect neither private consumption nor production in the model.
The government collects three types of taxes from each generation: on wage income,
capital income and consumption. Tax rates on capital income and consumption are kept
exogenous. The government’s debt instruments are one-period bonds that pay the
prevailing market interest rate in the current period and the principal in the next period.

8
Capital Market
In a small open economy framework, foreign debt equals the sum of domestic
physical capital and government debt, minus domestic private wealth. Capital inflows
finance the difference between final output and aggregate consumption, government
consumption, domestic investment and interest payments on the foreign debt. Foreign
debts are calibrated such as to keep private wealth and domestic capital equal to that in
Hviding and Mérette (1998). As Buiter (1981) shows, current account imbalances are
possible along a balanced growth path in a one-good overlapping generations model. He
demonstrates that to generate current account imbalances in a two-period two-country
version, it is only necessary to assume that the countries differ in their pure rate of time
preference. In a many-period model, such as the one used in this paper, a domestic ageing
process that diverges from the rest of the world is equivalent for saving behaviour to
differences in pure rates of time preference. A faster ageing country behaves as if its
“representative agent” was relatively more impatient. Consequently, such a country will
experience a larger decline in private savings as does the country with the greater rate of
time preference in Buiter (1981).
4. Summary of the OECD Secretariat Baseline Simulation Results
Hviding and Mérette (1998) examined the macroeconomic effects of ageing for
seven countries. The demographic shock is simulated through changes in the birth rate
that begins in 1954. In the long run, it is assumed that the birth rate returns to a steady-

9
state level. This section summarises their baseline results of this ‘pure’ ageing shock.
Their main results are presented in Charts 2 to 5. The results in Charts 2 to 4 present the
level of the wage-income tax rate, the national savings rate and the real return on capital.
In the absence of the shock, these variables remain equal to their 1954 levels. Chart 5
illustrates the percent shock minus control impact of ageing on real GDP.
1954 1970 1986 2002 2018 2034 2050 2066 20820
0.1
0.2
0.3
0.4
0.5
0.6
0.7
Canada
France
Italy
Sweden
USA
Japan
Uk
Chart 2Wage-Income Tax Rate
1954 1970 1986 2002 2018 2034 2050 2066 20820
0.05
0.1
0.15
0.2
0.25
0.3
0.35Canada
France
Italy
Sweden
USA
Japan
Uk
Chart 3National Savings Rate
1954 1970 1986 2002 2018 2034 2050 2066 20820.1
0.2
0.3
0.4
0.5
CanadaFrance
ItalySweden
USAJapan
Uk
Chart 4Real Return on Capital
1954 1970 1986 2002 2018 2034 2050 2066 2082-40
-30
-20
-10
0
10Canada
France
Italy
Sweden
USA
Japan
UK
Chart 5Real GNP per Capita
(percent shock minus control)

10
In their results, population ageing puts upward pressure on wage income taxes in
all seven countries (see Chart 2) because there are fewer workers to finance public
pension systems, and tax bases thus diminish. Tax rate increases peak between 2034 and
2050, depending on the size of the demographic shock and the tax structure in each
country (see Table 3 in Appendix II).
Population ageing also puts significant downward pressure on private and national
savings (see Chart 3). As mentioned in the previous section, the life-cycle theory of
savings behaviour is a key assumption of the model and explains the reduction in private
savings. Therefore, both capital stock and labour force fall. However, the labour force
falls further and as a result, the capital-labour ratio increases, which in turn leads to a
reduction in the real return on capital (see Chart 4) and an increase in before-tax real
wages. This implies that the reduction in the demand for investment is greater than the
reduction in the supply of savings. Finally, real output per capita significantly falls for all
seven countries. Italy and Japan are most affected, because their demographic shocks are
relatively larger than those of the other countries considered.
5. Ageing and the Current Account Balance
In the context of the world economy, population ageing can significantly affect
current account balances, depending on the extent and the evolution of ageing in one
country relative to another. By affecting world savings and investment, ageing may

11
induce important changes in world capital markets, affecting capital flow movements
across countries and current account balances.
Buiter (1981) used a Samuelson-Diamond type model with two overlapping
generations to explain international capital movements for differences in rate of time
preference. He showed that a country with a higher rate of time preference has a lower
supply of savings and runs a steady-state current account deficit. This suggests that a fast
ageing country be expected to run a current account deficit. However, this only accounts
for the reduction in savings and ignores the investment side. As shown in the previous
section, Hviding and Mérette (1998) found that the demographic shock has a greater
negative effect on the demand for investment than on the supply of savings.
To examine the impact of population ageing on the current account, we modify the
original Hviding and Mérette (1998) OLG models to reflect a small open economy
framework. This modification does not apply to the United States, which is assumed, for
convenience, to represent the rest of the world. However, this exercise is only illustrative,
since the other countries taken as a whole group or individually likely influence world
capital markets.
In the small open economy version of the models, domestic wealth may differ
from the domestic capital stock. Domestic physical capital and government debt are equal
to private wealth and foreign debt, and firms rent physical capital from domestic and
foreign sources at the world rental rate. As noted earlier, we assume that movements in

12
world interest rates are determined by developments in the United States. When we
simulate country-specific demographic shocks, movements in US interest rates determine
domestic interest rate changes in all the countries. In a closed economy, capital market
equilibrium conditions are respected via the capital return adjustment mechanism. In the
small open economy case, equilibrium comes from international capital flow adjustments.
The dynamic path of each country’s current account is closely related to its demographic
shock relative to that in the United States. Since private agents in the models are endowed
with forward-looking behaviour, they anticipate correctly the changes in rates of returns
induced by the demographic shocks.
Chart 6 shows the relative dependency ratios between the six OECD countries and
the United States, over the period 1954 to 2050 (normalised to 1 in 1954). The
dependency ratios in Japan, Italy and Canada increase much faster than the U.S.
dependency ratio (for example, it is about 3 times faster for Japan between 1954 and
2018). In the Hviding and Mérette (1998) models, this implies that these countries’ real
rates return on capital diverge from those in the United States. However, for France,
Sweden and the UK, the dependency ratios are similar to that in the United States,
implying a similar impact on the real return on capital.

13
In each country, the differential between the real capital return, under the small
open economy and closed economy assumptions determines the impact of the
demographic shock on the current account. Given that developments in the United States
are assumed to drive world interest rates, Charts 7 to 12 illustrate the impact of ageing on
the real return to capital in the remaining countries. Results under both closed and small
open economy assumptions are presented, and it is important to recall that those for the
closed economy case correspond to the Hviding and Mérette (1998) simulations
1954 1970 1986 2002 2018 2034 20500.5
1
1.5
2
2.5
3
3.5
1954=1
Canada
France
Italy
Japan
Sweden
UK
Chart 6Dependency Ratios Relative to the United States

14
presented in Chart 4. As shown in the previous section, under the closed economy
assumption real returns on capital diminish as a result of the demographic shocks.
1954 1970 1986 2002 2018 2034 2050
0.15
0.2
0.25
0.3
0.35
0.4
Closed Ecn.Small Open Ecn.
Chart 7Real Return on Capital (Canada)
1954 1970 1986 2002 2018 2034 2050
0.15
0.2
0.25
0.3
0.35
0.4Closed Ecn.Small Open Ecn.
Chart 8Real Return on Capital (France)
1954 1970 1986 2002 2018 2034 2050
0.15
0.2
0.25
0.3
0.35
0.4Closed Ecn.Small Open Ecn.
Chart 9Real Return on Capital (Italy)
1954 1970 1986 2002 2018 2034 2050
0.15
0.2
0.25
0.3
0.35
0.4Closed Ecn.
Small Open Ecn.
Chart 10Real Return on Capital (Japan)
1954 1970 1986 2002 2018 2034 2050
0.15
0.2
0.25
0.3
0.35
0.4Closed Ecn.
Small Open Ecn.
Chart 11Real Return on Capital (Sweden)
1954 1970 1986 2002 2018 2034 2050
0.15
0.2
0.25
0.3
0.35
0.4
Closed Ecn.Small Open Ecn.
Chart 12Real Return on Capital (UK)

15
When we introduce the small open economy assumption, the reduction in the real return
on capital is less pronounced for Japan, Italy, Canada and the UK. For Sweden, the
reduction in the real return on capital is smaller initially, but larger thereafter, while for
France, there is virtually no difference. The differential between the real capital return,
under the small open economy and closed economy assumptions increases initially for
Canada, the UK and Italy, but eventually diminishes and turns to zero for the UK by
2050. For Japan, the differential continues to increase by 2050, but more moderately. For
Sweden, the real capital return differential turns negative after 2018 and the negative
differential still increases in an absolute value by 2050. Finally, for France the real capital
return differential fluctuates around zero.
The stock of net foreign debt adjusts according to the change in real capital return
differentials between the two scenarios. Under the small open economy assumption,
agents from the countries that age more rapidly have an incentive to finance investments
abroad, since the demand for investment in the home country falls relative to domestic
savings. This, in turn, reduces the net stock of foreign debt as a proportion of GNP in the
home country (see Chart 13). For Japan, Italy, Canada and the UK, the stock of net
foreign debt diminishes as a proportion of GNP during the period 1954 to 2018 and
stabilises for a while, except for Canada where it continues to decline until 2034. After
2034, the stock of net foreign debt begins to increase, with the exception of Japan,

16
because the real capital return differential diminishes. For France and Sweden, the stock
of net foreign debt increases slightly during most of the period.
As demonstrated in Chart 14, there is a net capital outflow (positive current
account balance) in the countries between 1954 and 2018, except in France where there is
a net capital inflow. After a given year, which differs across countries, the current
account balance stabilises or reverses in sign, because real capital return differentials
stabilise or diminish.
1954 1970 1986 2002 2018 2034 2050
-0.5
-0.4
-0.3
-0.2
-0.1
0
0.1
Canada
France
Italy
Japan
Sweden
UK
Chart 13Stock of Net Foreign Debt as a Proportion of GNP

17
More specifically, the demographic shock in Italy and Japan relative to the
demographic shock in the United States has a favourable impact on the Italian and
Japanese current accounts, contributing up to 7 and 8 percent of GNP in net capital
outflows during the 1980s. However, the impact is less favourable thereafter, since by
2020 the effect of relative ageing leads to a deterioration in their current account.
The demographic shock in Canada and the UK relative to the United States also
has a favourable effect on the Canadian and British current accounts. For Canada, the
positive effect is more persistent than in other countries, peaking at 3 percent of GNP,
1954 1970 1986 2002 2018 2034 2050-0.1
-0.075
-0.05
-0.025
0
0.025
0.05
0.075
CanadaItaly
JapanUK
SwedenFrance
Chart 14Change in Net Capital Flows as a percent of GNP

18
and not becoming negative until 2034. For the UK, the positive effect is much smaller
and less persistent.
The impact on the current account is negative for France until 2026, reaching 1
percent of GNP and, fluctuating around zero thereafter. Finally, the impact is positive in
the initial period for Sweden, but becomes negative by 2002 and remains negative in the
long term.
Charts 15 to 20 also compare the impact of ageing on real GNP in both closed and
small open economy scenarios. The results indicate that the impact of ageing on real
GNP is similar for France and Sweden under the small open economy assumption,
because the impact on the investment income balance is modest. On the other hand,
because Canada, Italy and Japan enjoy an improvement in their international investment
position and investment income balance, the negative impact of ageing on real GNP is
somewhat smaller than under the closed economy assumption. Finally, for the UK, the
impact of ageing on real GNP is similar to the closed economy case initially, but turns
slightly worse by 2050 under the small open economy scenario, because of the
deterioration in the investment income balance.

19
1954 1970 1986 2002 2018 2034 2050 2066 2082-40
-30
-20
-10
0
10Closed Ecn.Small Open Ecn.
Chart 15Real GNP per Capita (Canada) (percent shock minus control)
1954 1970 1986 2002 2018 2034 2050 2066 2082-40
-30
-20
-10
0
10
Closed Ecn.Small Open Ecn.
Chart 16Real GNP per Capita (France) (percent shock minus control)
1954 1970 1986 2002 2018 2034 2050 2066 2082-40
-30
-20
-10
0
10Closed Ecn.
Small Open Ecn.
Chart 17Real GNP per Capita (Italy)
(percent shock minus control)
1954 1970 1986 2002 2018 2034 2050 2066 2082-40
-30
-20
-10
0
10Closed Ecn.Small Open Ecn.
Chart 18Real GNP per Capita (Japan) (percent shock minus control)
1954 1970 1986 2002 2018 2034 2050 2066 2082-40
-30
-20
-10
0
10Closed Ecn.Small Open Ecn.
Chart 19Real GNP per Capita (Sweden) (percent shock minus control)
1954 1970 1986 2002 2018 2034 2050 2066 2082-40
-30
-20
-10
0
10
Closed Ecn.Small Open Ecn.
Chart 20Real GNP per Capita (UK)
(percent shock minus control)

20
6. Conclusion
In this paper, we have modified the Hviding and Mérette (1998) models to
examine the impact of population ageing on the current account for six OECD countries,
assuming for convenience that these countries are small open economies. The exercise in
this paper does not necessarily apply to the countries examined, since as a group or
individually, they likely influence international capital markets. Hence, this exercise is
only illustrative. However, from the simulation experiments, we draw the following
conclusions.
We have shown that population ageing may have an important impact on world
capital markets and current account balances, depending on the extent and the evolution
of ageing in one country relative to another. A relatively faster ageing country will
experience an improvement in its current account balance, not a deterioration. This is
due to a decline in domestic investment demands that is greater than the reduction in
national savings. Consequently, the globalisation of capital markets may reduce the
negative effects of domestic population ageing for small open economies in which the
dependency ratio increases more rapidly. In such a case, the international capital market
is able to offer better returns on domestic savings than would otherwise occur in a closed
economy context. Consequently, GNP is less affected by domestic population ageing.
However, our results also suggest that income from foreign investment would only make
a modest contribution to offsetting pressures from the demographic shock.

21
In a broader context, these results also suggest that population ageing may lead to
important international capital flows over the next few decades from countries with an
ageing population to countries with a relatively younger population, such as newly
industrialised and developing countries. Finally, although this analysis provides a good
intuition for the impact of population ageing on the current account, it would be useful in
future research to extend the scope of the analysis through the use of an OLG type multi-
country model.

22
References
Auerbach, Alan J. and Laurence J. Kotlikoff (1987), Dynamic Fiscal Policy, Cambridge
University Press, Cambridge, UK.
Auerbach, Alan J., Laurence J. Kotlikoff, Robert P. Hagemann and Giuseppe Nicoletti
(1989), “The Economic Dynamics of an Ageing Population: The Case of Four OECD
Countries”, OECD Economic Review, no. 12, pp. 97-130.
Blinder, Alan S. (1974), Toward an Economic Theory and Income Distribution, MIT
Press, Cambridge, US.
Buiter, Willem H. (1981), “Time Preference and International Lending and Borrowing in
an Overlapping-Generations Model”, Journal of Political Economy, vol. 89, pp. 769-797.
Hviding, Ketil and Marcel Mérette (1998), Macroeconomic Effects of Pension Reforms in
the Context of Ageing Populations: OLG Simulations for Seven OECD Countries, OECD
Working Paper, Forthcoming.
Leibfritz, W., D. Roseveare et al. (1995), “Ageing Populations, Pension Systems and
Government Budgets: How Do They Affect Savings?”, OECD Economics Department
Working Paper no. 156.
Miles, David (1996), Demographics and Saving: Can We Reconcile the Evidence?,
Working Paper no. W97/6, Institute for Fiscal Studies, London, UK.

23
Appendix I: Structural Equations of the Models
Final Goods Production Function
The final goods sector depends on both physical capital and effective labour. All
firms are assumed identical. The economy’s production technology is represented by a
Cobb-Douglas function:
(1) Y AK Lt t e t= −ε ε,
1 ,
where Y is real final output, A a scaling variable, K the stock of physical capital, Le
effective labour and ε the capital income share.
The productivity of a worker is assumed to be age-related following this quadratic
function of the age g:
(2) 2ggep g ψλγ −+= , γ, λ, and ψ > 0.
Furthermore, it is assumed that technical change is exogenous and “labour embodied”; every
new generation has a larger stock of technical knowledge than the previous cohort and is more
productive by a constant factor η. Thus, the supply of effective labour is growing over time with
a constant rate in excess of the growth rate of the working-age population. Consequently, the
effective productivity of each age-group at period t is gt
gep η , and effective labour supply at
period t equals:

24
(3) ∑=
=12
1,
g
gt
gt
gte popepL η ,
where pop gggttt is the number of people of age g at period t.
Household Behaviour
Each generation maximises its utility function, U, of consumption and bequest
given its lifetime income. The representative generation's preferences are represented by
the following constant intertemporal elasticity of substitution utility function:
(4) ( )θθθ βρθ
−−
=
+
+−
= ∑ 1115
1 11
11
ggg
g
g
BeqcU , 10 << θ ; βg≠15 = 0, β g15 > 0,
where c is consumption, ρ the pure rate of time preference, θ the inverse of the
intertemporal elasticity of substitution, β is a constant parameter and Beq is bequest.
The One-period Budget Constraint
The representative generation budget constraint at each period is:
(5) ( ) tttwg
tsktttwgt
gtt
gt
gt InhBeqpencarepwaa
t+−−++−−+−≤−+
+ ,,1
1 1)1()1()1( ττττη ,
where a is physical wealth asset; w and r are the wage rate and interest rate
respectively; τ w ,τ r and τ s are tax rates on labour and pension incomes, interest income
and consumption, respectively; pen are pensions and Inh inheritances. Inheritances are
received equally by the working generations:
25
(6) mt
mt
jt
jt popBeqpopInh
121
= , j = 1,2,…,12 and m = 15.
Finally, the amount of pensions received depend on the replacement rate α of previous
wage earnings:
(7) ggmt
g
ggmt
mt epwpen +−
=+−∑⋅= ηα
12
1121 , m=13,14,15.
Government
The government needs to finance public expenditures and pensions, using
domestic bond issues and taxation. The one-period budget constraint of the government
is given by:
(8) ttttttt TPENGDrDD −++=−+1 ,
where D are government bonds, G government expenditures, PEN is total pensions
payments ( ∑=g
gg penpopPEN ) and T government revenues out of taxation. Taxation
revenue emanates from three sources: labour and pension incomes, capital income, and
consumption. Summing over all generations, total government revenue is
(9) ( ) ∑∑∑ ⋅+⋅++=g
gt
gts
g
gt
gtktr
g
gt
gt
gt
gttwt popcpoparpoppennepwT τττ ,, .
Equilibrium and Aggregation Conditions
All markets are assumed perfectly competitive. Equilibrium market conditions for
factors of production physical capital and labour are respectively:

26
(10) εεεδ −−=− 1,
1tett LAKr ,
(11) ( )w AK Lt t e t= − −1 ε ε ε, ,
where δ is the rate of capital depreciation.
To ensure that no resources are wasted, two more equilibrium conditions are introduced.
First, physical capital plus government debt equals total private wealth plus the stock of
net foreign debt every periods:
(12) ∑ +⋅=+g
tgt
gttt NFDpopaDK ,
where NFD is the stock of net foreign debt.
Second, final goods output equals household and government consumption (C+G), plus
net investment NtI and the current account balance NX:
(13) tNtttt NXIGCY +++= ,
where ∑=g
gt
gtt popcC , tt
Nt KKI )1(1 δ−−= + and )( 1 ttttt NFDrNFDNFDNX −−−= + .

27
APPENDIX II
TABLE 1:CALIBRATION RESULTS
ε δ η ρ α K/Y S/Y D/Y
Canada 34.5 3.10 2.4 .0047 45.9 2.7 22.4 .27
France 33.2 3.02 1.6 .0002 52.16 4.0 23.3 .08
Italy 34.4 2.58 2.6 .0050 45.4 3.6 28.5 .62
Japan 34.2 4.54 2.4 .0025 53.7 2.9 31.8 .09
Sweden 30.0 2.70 2.4 -.003 49.0 3.6 23.1 -.08
United Kingdom 30.4 2.75 2.9 .0035 24.4 2.5 17.6 .35
United States 32.6 3.52 2.4 .0055 42.0 2.5 19.4 .34
TABLE 2: PARAMETERS COMMON TO ALL COUNTRIES
Source: Analytical Databank, OECD; Auerbach and Kotlikoff (1987).
γ = 1; λ = .25; ϕ = .012; 1/θ = .25;
28
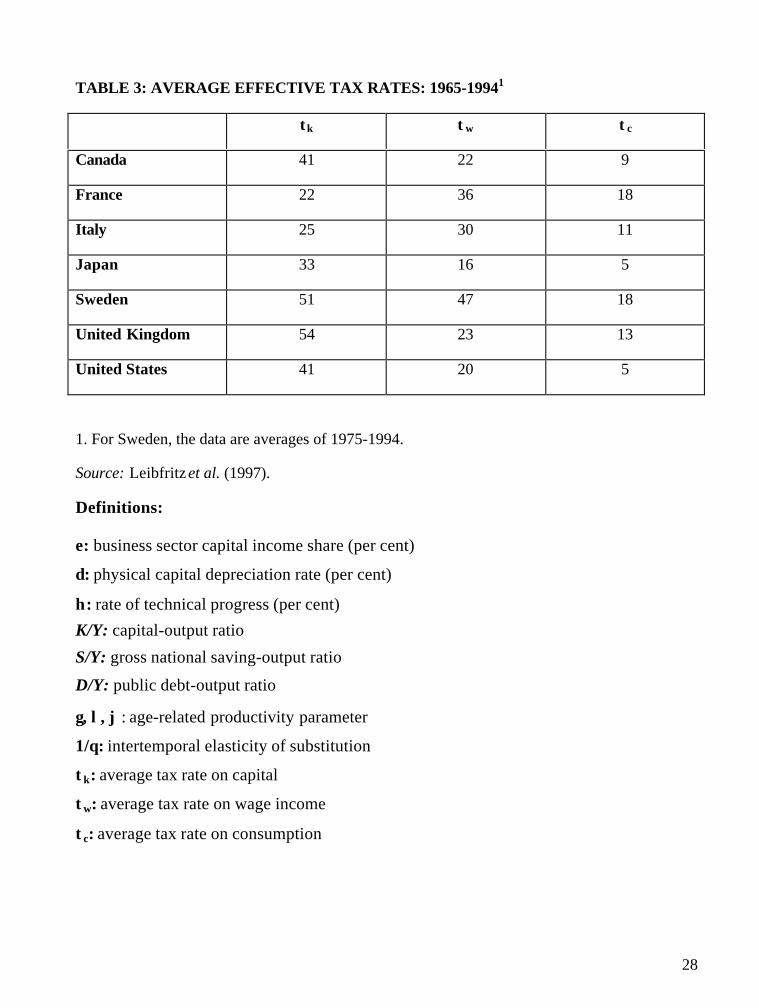
TABLE 3: AVERAGE EFFECTIVE TAX RATES: 1965-19941
τκ τw τc
Canada 41 22 9
France 22 36 18
Italy 25 30 11
Japan 33 16 5
Sweden 51 47 18
United Kingdom 54 23 13
United States 41 20 5
1. For Sweden, the data are averages of 1975-1994.
Source: Leibfritz et al. (1997).
Definitions:
ε: business sector capital income share (per cent)
δ: physical capital depreciation rate (per cent)
η: rate of technical progress (per cent)
K/Y: capital-output ratio
S/Y: gross national saving-output ratio
D/Y: public debt-output ratio
γ, λ, ϕ : age-related productivity parameter
1/θ: intertemporal elasticity of substitution
τκ: average tax rate on capital
τw: average tax rate on wage income
τc: average tax rate on consumption

20002000-07 Networks for Macroeconomic Forecasting: A Complementary Approach to Linear Regression Models – Steven Gonzalez
2000-06 Forecasting employment Rates: A Cohort Approach – Marie-France Paquet and Timothy C. Sargent
2000-05 Measuring Human Capital in Canada - Mireille Laroche and Marcel Mérette of the University of Ottawa
2000-04 L’écart à terme comme indicateur de l’activité économique : L’expérience des années 90 Paul Delâge et Jean-François Fillion
2000-03 Croissance endogène et vieillissement démographique : le cas d’une petite économie ouverte* Maxime Fougère
2000-02 “Modeling Federal Finances under Uncertainty” Derek Hermanutz and Chris Matier
2000-01 “Liability Management Using Dynamic Portfolio Strategies” Richard Black, Colin R. Telmer
1999
99-03 “An Econometric Examination of the Impact of Population Ageing on Personal Savings in Canada” , Maxime Fougère - Finance, Marcel Mérette - University of Ottawa
99-02 “Analyzing and Forecasting Credit Ratings: Some Canadian Evidence” Patrick Sabourin
99-01 “Taxation and Economic Performance: A Cross-Country Comparison and Model Sensitivity Analysis” Jing Xu
1998
98-09 “The BU Ratio: Prospect and Retrospect” Timothy C. Sargent
98-08 “Youth and the 1990s Labour Market” Carolyn Wilkins
98-07 “The Canadian Economic and Fiscal Model – 1996 Version: Part 3 – Empirical Specificationand Statistical Assessment” Jian-Guo Cao and Benoît Robidoux
98-06 “The Canadian Economic and Fiscal Model – 1996 Version: Part 2 – Dynamic Forecasting andSimulation Properties” Alain DeSerres, Benoît Robidoux and Bing-Sun Wong

98-05 “The Canadian Economic and Fiscal Model – 1996 Version: Part 1 – Model Structure” BenoîtRobidoux and Bing-Sun Wong
98-04 “Population Ageing and the Current Account in Selected OECD Countries” Maxime Fougèreand Marcel Mérette
98-03 “Population Ageing and Economic Growth in Seven OECD Countries” Maxime Fougère andMarcel Mérette
98-02 “The Persistence of Low Income Spells in Canada, 1982-1993” Mireille Laroche
98-01 “On the Concept and Dimensions of Human Capital in a Knowledge-Based Economy Context”Mireille Laroche, Marcel Mérette and G.C. Ruggeri
1997
97-08 “Estimating the Economic Efficiency Consequences of Alternative Tax Reforms Using a CGE Model: Homogeneous Vs Heterogeneous Labour Specifications” Louis Beauséjour, Mokhtar Souissi, Carole Vincent and G.C. Ruggeri
97-07 “Tax Expenditures and Tax Preferences in the Personal Income Tax System of Selected OECD Countries: A Suggested Classification, G.C. Ruggeri and Carole Vincent
97-06 “Income Taxes, Life-Cycles and Growth”, Marcel Mérette
97-05 “Effective Income Tax Rates in Macroeconomics: An Update for Canada”, G.C. Ruggeri, Mireille Laroche and Carole Vincent
97-04 “A Public versus a Private Canada Pension Plan: A Survey of the Economics” Steven James
97-03 “Forecasting Canadian Recessions with Macroeconomic Indicators” Robert Lamy
97-02 “The Dynamic Effects of Taxes and Government Spending in a Calibrated Canadian Endogenous Growth Model” Jing Xu
97-01 “The Impact of Fiscal Policy on the Risk Premium of Government Long-Term Debt: Some Canadian Evidence” Todd Mattina and François Delorme
1996
96-06 “Does the Length of the Current Expansion Increase the Probability of Recession?” Lisa Backa
96-02 “Do Mechanical Filters Provide a Good Approximation of Business Cycles?”, Alain Guay and Pierre St-Amant

96-01 “An Indicator Model of Core Inflation in Canada” Robert Lamy and Paul Rochon
1995
95-12 “Potential Economic Effects of Experience-Rating the Unemployment Insurance System Using a Multi-Sector General Equilibrium Model of Canada” Louis Beauséjour, Munir A. Sheikh and Baxter Williams
95-11 “Active Labour Market Policies: An Evaluation” Lori Marchildon
95-10 “An Index of Unemployment Insurance Disincentives” Timothy C. Sargent
95-09 “The Economics of Canada Pension Plan Reforms” Steven James, Chris Matier, Humam Sakhnini and Munir Sheikh
95-08 “The Long-Run Economic Impacts of Government Debt Reduction” Steven James and Chris Matier
95-07 “Time Series Properties of Canadian Real Interest Rates”, Chris Matier and Werner Schüle
95-06 “Interpreting Sacrifice Ratios Across Countries and Over Time” Brenda Lipsett and Steven James
95-05 “Effective Rates of Assistance: An Old Idea Whose Time Has Come?” Louis Beauséjour and Munir A. Sheikh
95-04 “Aggregate Fluctuations, Monetary Policy and Nominal Wage Rigidities in a New-Classical Setting: Results for Canada” Humam Sakhnini
95-03 “Ricardian Equivalence and the Permanent Income Hypothesis: An Empirical Investigation”Benoit Perron
95-02 “Are New-Classical Models Becoming Relevant Policy Tools: A Survey of Recent New- Classical Models” Humam Sakhnini
95-01 “Fluctuations économiques dans un environnement de stabilité des prix” Claude LavoiePlease note that this working paper is available in French only.
1994
94-06 “Conditional Productivity Convergence in Canada” Frank C. Lee
94-05 “A Guide to Applied Modern Macroeconometrics” Alain Paquet

94-04 “Interindustry Wage Differentials: Evidence, Explanations and Potential Distortions” Mario Iacobacci
94-03 “Regional Productivity Convergence in Canada” Frank C. Lee and Serge Coulombe
94-02 “Regional Economic Disparities in Canada” Serge Coulombe and Frank C. Lee
94-01 “The Interaction of Inflation with a Canadian-Type Capital Tax System: A Dynamic General Equilibrium Analysis Incorporating Endogenous Leverage and Heterogeneous Households” Steven James
1992
92-04 “An Environmental CGE Model of Canada and the United States” Louis Beauséjour, Gordon Lenjosek and Michael Smart
92-03 “Estimating Trend Total Factor Productivity Growth in Canada” Carolyn Wilkins, Frank Lee and Steven James
92-02 “Un indice de prix régional de biens et services comparables au Canada et son application aux disparités régionales de revenu” Raynald Létourneau. Available in French only.
92-01 “A New Composite Leading Indicator of the Canadian Economy” Robert Lamy
1990
90-07 “Une analyse empirique des déterminants du taux d'intérêt réel mondial” Benoît RobidouxPlease note that this working paper is available in French only.
90-06 “Real Interest Rates in Historical Perspective” Paul Jenkins
90-05 “The Contribution of Fiscal Policy to Real Interest Rate Movements in the 1980s” Paul Jenkins
90-04 “The Constant Price Hypothesis in Multi-Industry Cross-Section Studies: The Impact on Cost Function Estimates” Benoît Robidoux and John Lester
90-03 “The Cyclically-Adjusted Output Methodology” Mario Albert, Nathalie Boisvert and Robert Fonberg
90-02 “The Determination of Real Interest Rates” Joel Fried and David Burgess
90-01 “La voie des dépenses fiscales : le point sur les questions conceptuelles et les controverses”Neil Bruce. Available in French only.

1989
89-07 “INTERMOD 2.0: Model Specification and Simulation Properties” Guy Meredith
89-06 “The Calculation of Marginal Effective Tax Rates in the 1987 White Paper on Tax Reform”Jack Jung
89-05 “Effects of Changing Age Structure on Consumption and Saving” Paul Jenkins
89-04 “Expectations, Policy Shocks, and Output Behaviour in a Multi-Country Macroeconomic Model”
Guy Meredith
89-03 “The Goods and Services Tax: A General Equilibrium Analysis” Bob Hamilton and Chun-Yan Kuo
89-02 “A Survey of Some Recent Developments in Macroeconomics” Michael Devereux
89-01 “Closed Economy Analysis of the Dynamics of Deficits and Debt in a Unitary and Federal State” - Carolyn Wilkins and Mario Albert
1988
88-10 “A Guide to the GET Model” Richard G. Harris
88-09 “INTERMOD Model User's and Developer's Guide for PC Systems” Philip Bagnoli and Anders Kruus
88-08 “The Trade Sector in INTERMOD” Guy Meredith
88-07 “INTERMOD 1.1: A G-7 Version of the IMF's Multimod” John F. Helliwell, Guy Meredith, Yves Durand and Philip Bagnoli
88-06 “Resolutions of the U.S. Trade Imbalances: How Painful Will the Adjust Be?” Janice Haritos
88-05 “Econometric Estimates of Import Price Elasticities for Canada” Raynald Létourneau and John Lester
88-04 “Econometric Estimates of Scale Economies in Canadian Manufacturing” Benoît Robidoux and John Lester
88-03 “Trade Barriers Between Canada and the United States” John Lester and Tony Morehen

88-02 “New Estimates of Canadian Tariff Rates by Industry and Commodity” John Lester and Tony Morehen
88-01 “Geographic Labour Mobility in Canada” Louis Grignon and Kei Moray
1987
87-01 “Économies d'échelle : Un survol des techniques d'estimation et des problèmes méthodologiques”
Benoît Robidoux. Available in French only.1986
86-01 “The Structure of Production in Ten Canadian Industries” François Delorme and John Lester
Top Related