


Languages
Pages
Legal

POLICY RESEARCH WORKING PAPER 2524
Racing to the Bottom? Critics of free trade haveraised the specter of a "race
to the bottom," in which
Foreign Investment and Air Pollution environmental standards
in Developing Countries collapse because pollutersthreaten to relocate to
Dpollution havens" in the
developing world. The flaw in
the race-to-the-bottom model
is that its basic assumptions
misrepresent the political
economy of pollution control
in developing countries.
The World BankDevelopment Research GroupInfrastructure and Environment aJanuary 2001
Pub
lic D
iscl
osur
e A
utho
rized
Pub
lic D
iscl
osur
e A
utho
rized
Pub
lic D
iscl
osur
e A
utho
rized
Pub
lic D
iscl
osur
e A
utho
rized
Pub
lic D
iscl
osur
e A
utho
rized
Pub
lic D
iscl
osur
e A
utho
rized
Pub
lic D
iscl
osur
e A
utho
rized
Pub
lic D
iscl
osur
e A
utho
rized

| POLICY RESEARCH WORKING PAPER 2524
Summary findingsCritics of free trade have raised the specter of a "race to suspended particulate matter-has actually declined inthe bottom," in which environmental standards collapse major cities in all four countries during the era ofbecause polluters threaten to relocate to "pollution globalization.havens" in the developing world. Proponents of this view Citing recent research, Wheeler argues that the race-advocate high, globally uniform standards enforced by to-the-bottom model is flawed because its basicpunitive trade measures that neutralize the cost assumptions misrepresent the political economy ofadvantage of would-be pollution havens. pollution control in developing countries.
To test the race-to-the-bottom model, Wheeler He proposes a more realistic model, in which low-analyzes recent air quality trends in the United States and income societies serve their own long-run interests byin Brazil, China, and Mexico, the three largest recipients reducing pollution. He concludes with recommendationsof foreign investment in the developing world. for international assistance measures that can improve
The evidence clearly contradicts the model's central environmental quality without counterproductiveprediction. The most dangerous form of air pollution- enforcement of uniform standards and trade sanctions.
This paper-a product of Infrastructure and Environment, Development Research Group-is part of a larger effort in thegroup to study the economics of pollution control in developing countries. Copies of the paper are available free from theWorld Bank, 1818 H Street NW, Washington, DC 20433. Please contact David Wheeler, room MC2-529, telephone 202-473-3401, fax 202-522-3230, email address dwheelerl @worldbank.org. Policy Research Working Papers are also postedon the Web at www.worldbank.org/research/workingpapers. January 2001. (24 pages)
The Policy Research Working Paper Series disseminates the findings of work in progress to encourage the exchange of ideas aboutdevelopment issues. An objective of the series is to get the findings out quickly, even if the presentations are less than fully polished. Thepapers carry the names of the autbors and sbould be cited accordingly. The findings, interpretations, and conclusions expressed in this
paper are entirely those of the authors. They do not necessarily represent the view of the World Bank, its Executive Directors, or thecountries they represent.
Produced by the Policy Research Dissemination Center
Racing to the Bottom?Foreign Investment and Air Pollution
in Developing Countries
David Wheeler*Development Research Group
World Bank
* The author is Lead Economist in the Infrastructure/Environment Team of theDevelopment Research Group. Many thanks to Ashoka Mody for useful commentson a previous draft of this paper.

Racing to the Bottom?Foreign Investment and Air Pollution in Developing Countries
1. Introduction
Could globalization trigger an environmental "race to the bottom," in which
competition for investment and jobs relentlessly degrades environmental standards?
Since billions of people subsist on less than two dollars a day, it would be cavalier to
dismiss this threat lightly. Indeed, the race-to-the-bottom model provokes widespread
concern because its underlying assumptions have an air of plausibility. 1 In the race-to-
the-bottom world, decent environmental standards impose high costs on polluters in high-
income economies. To remain competitive, these firms relocate to low-income countries
whose people are desperate for jobs and income. Local goverrnents ignore regulation to
promote investment and economic growth, allowing businesses to minimize costs by
polluting with impunity. Driven by shareholders to maximize profits, international firms
follow suit. Rising capital outflows force govermnents in high-income countries to begin
' Daly (2000) has recently provided a forceful statement of the race-to-the-bottom model. In the US,political opponents of NAFTA and the WTO frequently invoke elements of the model. For example,Congressman David Bonior has recently offered the following critique of the WTO: ".... many of theworld's political and economic leaders have adopted our ways of discussing the global economy. They'rewarning against 'a race to the bottom.' They calling for 'putting a human face on the global economy.' Andthey say they're supporting labor and environmental standards in trade agreements .... Make no mistakeabout what is at stake in the deliberations and decisions of the WTO.... The WTO, as currently structured,threatens to undo internationally everything we have achieved nationally - every environmental protection,every consumer safeguard, every labor victory." (Bonior, 1999)
In a similar vein, the Nader-for-President campaign has offered this statement on Trade andEnvironment at its Website (http://www.votenader.com/issues/environment.html): "Among the most fetidexamples of political cowardice and collusion between elected representatives and big business of the pastthirty-five years are the passage of the North American Free Trade Agreement (NAFTA) and the revisedGeneral Agreement on Tariffs and Trade (GATT) into federal law. These agreements have little to do withthe benefits of trade for citizens of member countries. The agreements were designed, largely by corporatelobbyists, as a "pull-down" mechanism and to facilitate the movement of capital across national boundaries.Such one-dimensional monetized logic tramples long-standing efforts around the world-some verysuccessful-to protect the environment because environmental safeguards are very often considered 'non-tariff barriers to trade' and thus become targets for removal. Five years of WTO operation have made clearwhat a grave threat the trade organization is to the world environment."
I

relaxing environmental standards, but this proves fruitless because the poorest countries
have no environmental standards at all. As the ensuing "race to the bottom" accelerates,
all countries converge to the hellish pollution levels that afflict the poorest.
Proponents of this catastrophe model have a straightforward preventive
recommendation: High, globally-uniform environmental standards and, for countries that
are unwilling or unable to enforce them, tariffs or other restrictions on imports of their
pollution-intensive products that neutralize their cost advantage as pollution havens.
Proponents of free trade naturally view these prescriptions as anathema, arguing that their
main impact would be denial of jobs and income to the world's poorest people.
2. A Simple Test of the Race-to-the-Bottom Model
If the race-to-the-bottom model is correct, then globalization will ultimately provoke
a strong backlash in high-income countries as business relocation threatens jobs, wages
and environmental standards. Fortunately, the potential for this reversal is easy to gauge
because the simple structure of the race-to-the-bottom model yields an equally simple,
robust prediction: After decades of increasing capital mobility and economic
liberalization, the race to the bottom should be underway and pollution should be
increasing everywhere. It should be rising in poor countries because they are pollution
havens, and in high-income economies because they are relaxing standards to remain
cost-competitive. Trends in available pollution data provide a reasonable basis for testing
these propositions.
Climatic and economic factors cause pollution to vary considerably from year to
year, so trend analysis requires an extended series of monitoring data. For comparison of
environmental conditions in large urban regions, air pollution measures are generally
2
more reliable and comparable than water pollution data. Among widely-measured air
pollutants, the international health community currently believes the most damaging to be
suspended particulate matter (dust). Numerous health studies in low- and high-income
countries have associated high concentrations of suspended particulates with higher-than-
normal rates of death and illness from cardio-pulmonary problems. Over time, health
research has narrowed its focus from all suspended particulate matter (SPM) to particles
less than 10 microns in diameter (PM- 10) and, most recently, to particles whose
diameters are less than 2.5 microns (PM-2.5). Atmospheric monitoring is adjusting to
these findings, but PM-2.5 readings remain scarce in low-income countries. Since all
particulate concentration measures are correlated, however, even SPM measures provide
useful information about pollution that severely damages human health.
Air quality monitoring is routine in high-income countries, but it remains uneven in
the developing world. China, Mexico and Brazil provide notable exceptions. During the
past two decades, these three rapidly-industrializing countries have begun monitoring and
reporting SPM, PM-10, and other forms of air pollution in a number of industrial centers.
In addition, they have had the top three shares of foreign direct investment among
developing countries throughout the 1990's. China's average share has been 28%, while
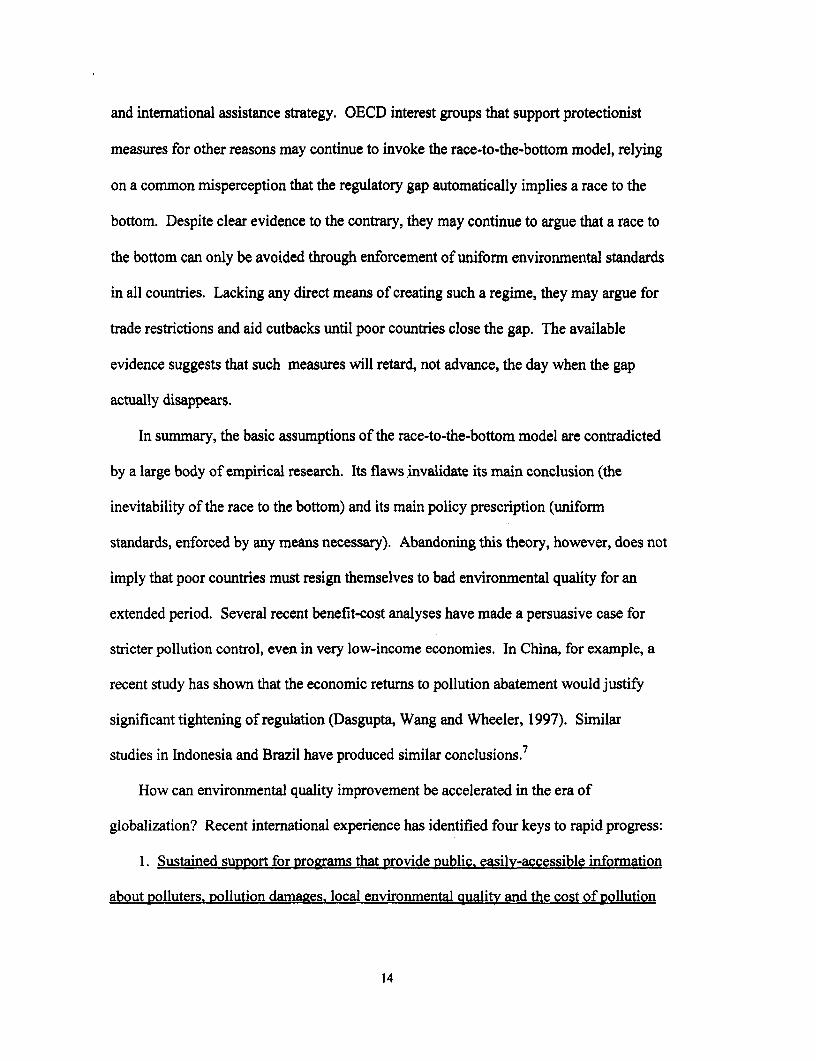
the averages for Mexico and Brazil have been 9% and 7%, respectively. As Figure 1
shows, their combined FDI was nearly 60% of the total for developing countries in 1998.
If the race-to-the-bottom model is correct, then urban SPM and PM-l0 levels should be
rising in all three countries. In the United States, race-to-the-bottom proponents have
been particularly vocal about more liberal trade agreements with Mexico and China. It
3

would seem reasonable to trace this concern to deteriorating air quality in US cities, since
US industrial imports from all three countries have been expanding for decades.
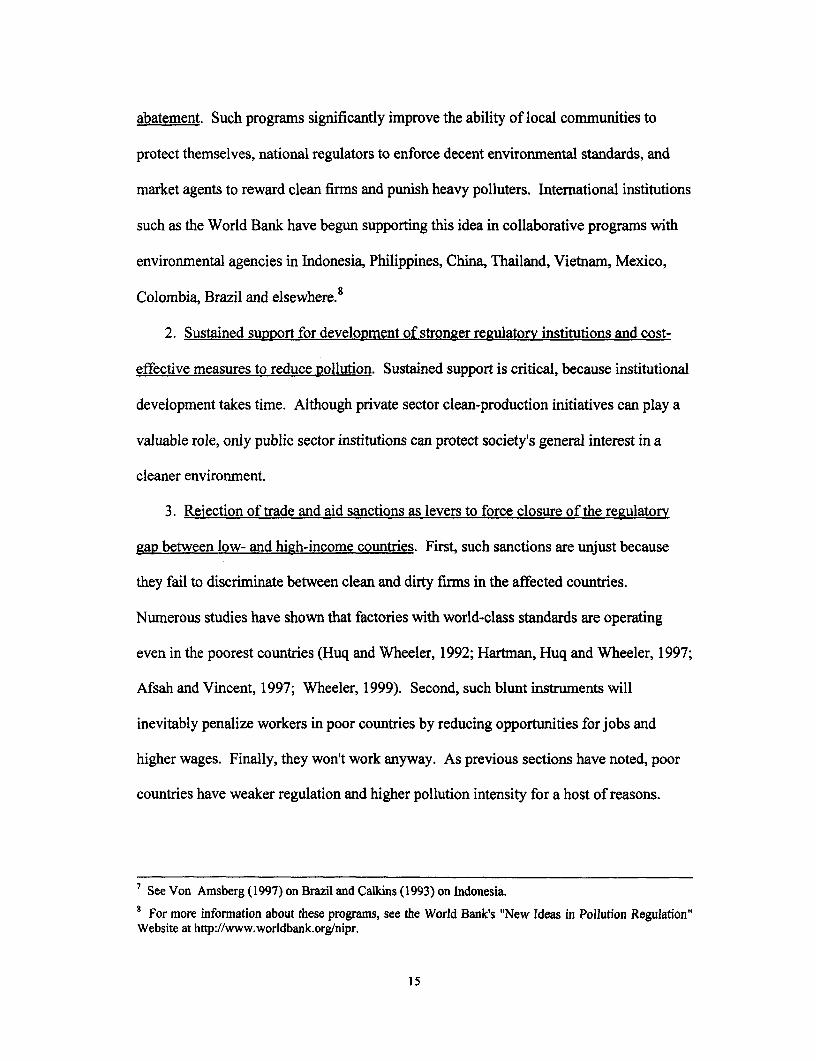
To test the race-to-the-bottom prediction, Figures 2-4 present SPM and PM-10
monitoring data along with foreign direct investment statistics for China, Mexico and Sao
Paulo State, which is Brazil's dominant industrial region. For comparison, Figure 5
displays PM-i 0 monitoring data from five US metropolitan areas (Los Angeles, Houston,
Chicago, Atlanta and New York). The Chinese series is the average annual SPM reading
for over 50 cities, reflecting the extensive coverage of China's air monitoring network.
The Mexican data reflect SPM readings in Mexico City, while the Brazilian series are
drawn from PM- 1O measures for the industrial region of Cubatao in Sao Paulo State.
Mexico City is by far the largest industrial center in Mexico and Cubatao has traditionally
been a center for pollution-intensive industry in Sao Paulo.2 These two regions, along
with Los Angeles, suffer from geographic and climatic conditions that make them natural
"traps" for air pollution.
The foreign investment data in Figures 1-4 provide a compelling picture of
expansion in China, Mexico and Brazil during the past two decades. However, Figures
2-5 show no sign of a race to the bottom; trends in particulate pollution are downward in
all four countries. Despite China's poverty and rapid industrialization, its major urban
areas have experienced a significant decline in SPM. During the period 1987 - 1995, the
average concentration fell from nearly 500 micrograms per cubic meter (ug/m3) to
somewhat over 300. After rising in the early 1990's, Mexico City's percentage of SPM
2 Data sources: US: USEPA online at http://www.epa.gov/oar/aqtrnd97/tables.html; Brazil: PollutionControl Agency of Sao Paulo State (CETESB, 1996, 1990, 1994) and CETESB online athttp://www.cetesb.br; China: China Environmental Monitoring Center and Wheeler (1999); Mexico: NationalEnvironment Ministry online at http:H/www.ine.gob.mx/dggia/cal_aire/libros/segu_info/mexico.html
4
readings above standards fell to historical lows in the latter part of the decade (the period
during which NAFTA was implemented). In Cubatao, Brazil, the average PM-10
concentration fell from 180 ug/m3 in 1984 to around 80 in 1998.3 In the United States,
all five metropolitan areas had declining PM-1O concentrations during the period 1988-
1997. The sharpest reduction -- 32% -- was recorded in Los Angeles, the largest US
urban-industrial area in the region most affected by NAFTA.
These results strongly contradict the race-to-the-bottom model. Instead of racing
toward the bottom, major urban areas in China, Brazil, Mexico and the US have all
experienced significant improvements in air quality. The improvements in Los Angeles
and Mexico City are particularly noteworthy, since they are the dominant industrial
centers in the region most strongly affected by NAFTA.
3. Problems with the Race-to-the-Bottom Model
The race-to-the-bottom model's basic assumptions must be flawed, since its
predictions are inconsistent with urban air pollution trends in three of the developing
world's major industrial powers. In fact, empirical research has undermined all of these
assumptions.
1. Pollution control is not a critical cost factor for most private firms. Research in
both high- and low-income countries suggests that pollution control does not impose high
costs on business firns. Jaffe (1995) and others have shown that compliance costs for
OECD industries are surprisingly small, despite the use of command-and-control
regulations that are economically inefficient. These results suggest that differential
3 Comparable PM-10 series for the Sao Paulo Metropolitan Area are not available. However, air qualityreports from CETESB, Sao Paulo State's Environmental Agency, show that average SPM levels in SaoPaulo fell by 52% during the period 1980 - 1995.
5

pollution control costs do not provide OECD firms with strong incentives to move
offshore. Firms in developing countries frequently have even lower costs, because the
labor and materials used for pollution control are less costly than in the OECD
economies. Big polluters also have lower average control costs per unit of pollution
because abatement is subject to scale economies. Figure 6 displays recent econometric
estimates of control costs for sulfur dioxide air pollution in large Chinese factories
(Dasgupta, Wang and Wheeler, 1997).4 For non-state-owned enterprises, costs of a few
dollars per ton are typical until control rates rise above 70%. As Figure 6 shows, state-
owned enterprises have much higher costs because they are operated less efficiently. The
average cost of pollution control has therefore declined as China has moved away from
state ownership during the era of liberalization. In Colombia, a new pollution charge
program has sharply reduced organic water pollution by large factories. Colombian
factory managers have found that cleaning up is cheaper than paying charges, even when
they are set at relatively low levels. No participating factory seems to have experienced
financial difficulties in the process (Wheeler, 1999). Similar conclusions have emerged
from studies of regulation and control costs in Malaysia (Jha, Markandya and Vossenaar,
1999; Khalid and Braden, 1993).
2. Low-income communities penalize dangerous polluters, even when formal
regulation is weak or absent. Abundant evidence from Asia and Latin America shows
that neighboring communities can strongly influence factories' environmental
4 Xu, et. al. (1994) have shown that atmospheric sulfur dioxide (SO 2 ) concentrations are highly correlatedwith damage from respiratory disease in China. Sulfur dioxide and other oxides of sulfur combine withoxygen to form sulfates, and with water vapor to form aerosols of sulfurous and sulfuric acid. Much of thehealth damage from SO2 seems to come from fine particulates (PM-2.5) in the form of sulfates.
6

performance.5 Where formal regulators are present, communities use the political process
to influence the strictness of enforcement. Where regulators are absent or ineffective,
NGOs and community groups -- including religious institutions, social organizations,
citizens' movements, and politicians -- pursue informal regulation based on convincing
polluters to conform to social norms. Although these groups vary from region to region,
the pattern everywhere is similar: Factories negotiate directly with local actors in
response to threats of social, political or physical sanctions if they fail to compensate the
community or reduce emissions.
Indeed, communities sometimes resort to extreme measures when sufficiently
provoked. In the Asian Survey, Robert Cribb has recounted an Indonesian incident
"reported from Banjaran near Jakarta in 1980 when local farmers burned a government-
owned chemical factory that had been polluting their irrigation channels." In a similar
vein, Mark Clifford has reported in the Far Eastern Economic Review that community
action prevented the opening of a chemical complex in Korea until appropriate pollution
control equipment was installed.
When factories respond directly to communities, the results may bear little
resemblance to the dictates of formal regulation. For example, Cribb also cites the case
of a cement factory in Jakarta that -- without admitting liability for the dust it generates --
"compensates local people with an ex gratia payment of Rp. 5,000 and a tin of evaporated
milk every month." In India, Anil Agarwal, et al. (1982) describe a situation where,
confronted by community complaints, an Indian paper mill installed pollution abatement
equipment -- and, to compensate residents for remaining damage, the mill also
5 See Pargal and Wheeler (1996), Hettige, Huq, Pargal and Wheeler (1996), Huq and Wheeler (1992),Hartman, Huq and Wheeler (1997), and Dasgupta, Lucas and Wheeler (1998).
7

constructed a Hindu temple. If all else fails, community action can also trigger physical
removal of the problem. In Rio de Janeiro, for example, a neighborhood association
protest against a polluting tannery led managers to relocate it to the city's outskirts (Stotz,
1991).
3. Rising income strengthens regulation. Countries regulate pollution more strictly
as they get wealthier for three main reasons. First, pollution damage gets higher priority
after rising wealth has financed basic investments in health and education. Second,
higher-income societies have stronger regulatory institutions because technical personnel
are more plentiful and budgets for monitoring and enforcement activities are more
generous. Third, higher income and education empower local communities to enforce
higher environmental standards, whatever stance is taken by the national government
(Dasgupta and Wheeler, 1996; Pargal and Wheeler, 1996). The result is a very close
relationship between national pollution regulation and income per capita, as illustrated by
Figure 7.
4. Local businesses control pollution because abatement reduces costs. Although
public spirit moves a notable minority of firms to control pollution, most managers are
bound by pressures from markets and shareholders. Through a variety of channels,
regulatory and market forces induce managers to reduce costs by controlling pollution.
Where formal regulation is well-developed, financial penalties for excessive pollution
can include charges, fines and revenue losses from plant closures. Where formal
regulation is not present, local communities can exact penalties through political, social
and economic channels. Market agents can also play an important role. Bankers may
refuse to extend credit because they are worried about liability; consumers may avoid the
8
products of firms that are known to be heavy polluters. Responding to these factors, cost-
minimizing managers will reduce pollution to the point where the marginal cost of
abatement equals the marginal penalty for polluting.
Polluting emissions also reflect managers' technology decisions. Pollutants are
unmarketed production residuals whose disposal creates environmental damage.
Improved technologies that waste fewer raw materials therefore have an environmental
advantage that complements their cost advantage. In the OECD countries, innovations
induced by stricter regulation have generated significantly cleaner technologies that are
available at incremental cost to producers in developing countries. Even in weakly-
regulated economies, many firms have adopted cleaner technologies simply because they
are more profitable. Empirical studies have shown that firms in relatively open
developing economies adopt such technologies more quickly (Birdsall and Wheeler,
1993; Huq, Martin and Wheeler, 1993).
5. Large multinational firms generally adhere to OECD environmental standards in
their developing-country operations. Multinational firms operate under close scrutiny
from consumers and environmental NGOs in the OECD economies. While the influence
of these groups is well-known, recent research has suggested that investors also play an
important role in encouraging clean production. Heavy emissions may signal to investors
that a firm's production techniques are inefficient. Investors also weigh potential
financial losses from regulatory penalties and liability settlements. Several studies have
confirmed that the US and Canadian stock markets react significantly to environmental
9
news, generating gains from good news and losses from bad news in the range of 1-2%.6
According to a recent study of toxic polluters (Konar and Cohen, 1997), firms whose
bad press has the greatest impact on stock prices subsequently reduce emissions the most.
Similar effects have been identified by recent research on new stock markets in
Argentina, Chile, Mexico and the Philippines (Dasgupta, Laplante and Mamingi, 1997).
In fact, the responses are much larger than those reported for US and Canadian firms:
Gains average 20% in response to good news and losses range from 4-15% in the wake of
bad news.
Multinationals have responded to such factors. A recent study of 89 US-based
manufacturing and mining multinationals with branches in developing countries found
that nearly 60% adhere to a stringent internal standard that reflects OECD norms, while
the others enforce local standards (Dowell, Hart and Yeung, 2000). Controlling for other
factors (e.g. physical assets, capital structure), the study found that firms with uniform
internal standards had an average market value $10.4 billion higher than their
counterparts. To illustrate the implications for local environmental quality, Figure 8
reports results from a careful audit of Indonesian factories undertaken in 1995 (Afsah and
Vincent, 1997). Almost 70% of domestic plants failed to comply with Indonesian water
pollution regulations, while around 80% of the multinational plants were fully compliant.
4. Implications of the Evidence
A large body of evidence suggests that the predictions of the race-to-the-bottom
model are inaccurate because its assumptions are not realistic. Although pollution
6 See Muoghalu et al. (1990); Lanoie, Laplante (1994); Klassen, McLaughlin (1996); Hamilton (1995); andLanoie, Laplante and Roy (1997).
10
control costs matter to factory owners and managers, they are generally not a critical
factor in location decisions. In addition, emissions are strongly affected by the increased
availability of clean technologies and the ubiquity of penalties for polluting. Even where
formal regulation is weak or absent, local communities use numerous informal channels
to penalize polluters when they suffer from severe environmental damage. At the
national level, governments display a remarkably consistent tendency to tighten
regulation as incomes grow. Within countries, regional differences in income and
education also produce variations in community-based enforcement of environmental
norns. At the international level, scrutiny from customers and investors has led the
majority of firms to standardize their environmental performance on OECD norms. The
rest subscribe to local norms, which rise over time with income.
In this more realistic view of the world, an environmental "race to the bottom"
appears extremely unlikely. In fact, the converse appears to occur as "the bottom" rises
with economic growth. The poorest societies persistently improve their environmental
quality as investment increases employment and income. Mutually-reinforcing feedback
mechanisms at the local, national and international levels produce increasing pressures
for pollution control as societies develop.
While the evidence suggests that globalization has been generally compatible with
pollution reduction, several caveats are in order. First, to invert Keynes' maxim, "in the
short run a lot of us might be dead." Under rapid liberalization, a sudden increase of
industrial investment could create pockets of severe pollution before national
governments or local communities could respond effectively. This could occur even if
"clean" multinationals expanded locally, since domestic firms would also be attracted by
11

increased production and export opportunities. Second, communities' capacity to control
pollution formally or informally depends on the quality of available information about
emissions sources and damages. Some dangerous pollutants can be seen or smelled, but
others cannot be detected without specialized equipment. So, information gaps may well
lead to much higher levels of contamination than local communities would tolerate if
they were better-informed.
Third, globalization is almost certain to produce an increase in average pollution
intensity (emissions/output) as developing countries increase their share of world
industrial production. High-income countries have stricter formal and informal
regulation than low-income countries, so production in the latter has higher pollution
intensity (on average -- exceptions have been noted in the previous section). To
illustrate, Figure 9 summarizes a recent econometric result from a cross-country analysis
of organic water pollution: Relative to the highest-income countries, the poorest
countries have an approximately tenfold differential in pollution intensity. The biggest
improvements come relatively early in the growth process, as countries grow from
around $500 per capita to $3,000 per capita. After that, the marginal improvements level
off considerably (Mani and Wheeler, 1998).
The air monitoring data in Figures 2-5 reveal the consequences of differential
pollution intensity. In the late 1990's, Cubatao's PM-10 concentration was around 80
while PM- 10 concentrations in most US cities were below 30. After a decade of decline,
China's urban SPM readings were still around 300 in 1995 -- far higher than readings in
OECD cities. This differential may have created the mistaken view that globalization is
creating a "race to the bottom," even though air quality seems to be improving in
12

countries at all income levels. If current trends continue, the "bottom" will continue to
rise and international average pollution intensities will begin to fall at some point in the
future. The critical point for the globalization debate is that cities in developing countries
have actually improved their environmental quality during a period of rapid liberalization
and industrial growth.
7. Conclusions and Policy Implications
A large body of evidence suggests that there will be no environmental "race to the
bottom" for two main reasons. First, communities in developing countries are neither
passive agents nor focused exclusively on material gain. Empowered with good
information about the benefits and costs of environmental protection, they will act to
protect their own interests. As their income and education levels improve, they will
control pollution more strictly. Second, consumers and investors assign significant value
to environmental performance and, if they are well-informed, their market decisions will
provide powerful incentives to reduce pollution. On both counts, the most plausible
long-run forecast is for rising, not falling, environmental quality in both high- and low-
income economies. A significant gap may remain, but pollution damage should decline
significantly in poor countries as they develop.
While this news is good for the global commons in the long run, adjustment to a
cleaner world is not likely to be smooth. Countries whose economic policies induce a
rapid expansion of income and employment may also experience severe environmental
damage unless direct measures are taken to accelerate regulation's positive long-run
response to income growth. On the macro-policy front, the persistence of a regulatory
gap between rich and poor countries may lead to continuing controversy over trade policy
13
and international assistance strategy. OECD interest groups that support protectionist
measures for other reasons may continue to invoke the race-to-the-bottom model, relying
on a common misperception that the regulatory gap automatically implies a race to the
bottom. Despite clear evidence to the contrary, they may continue to argue that a race to
the bottom can only be avoided through enforcement of uniform environmental standards
in all countries. Lacking any direct means of creating such a regime, they may argue for
trade restrictions and aid cutbacks until poor countries close the gap. The available
evidence suggests that such measures will retard, not advance, the day when the gap
actually disappears.
In summary, the basic assumptions of the race-to-the-bottom model are contradicted
by a large body of empirical research. Its flaws invalidate its main conclusion (the
inevitability of the race to the bottom) and its main policy prescription (uniform
standards, enforced by any means necessary). Abandoning this theory, however, does not
imply that poor countries must resign themselves to bad environmental quality for an
extended period. Several recent benefit-cost analyses have made a persuasive case for
stricter pollution control, even in very low-income economies. In China, for example, a
recent study has shown that the economic returns to pollution abatement would justify
significant tightening of regulation (Dasgupta, Wang and Wheeler, 1997). Similar
studies in Indonesia and Brazil have produced similar conclusions.'
How can environmental quality improvement be accelerated in the era of
globalization? Recent international experience has identified four keys to rapid progress:
1. Sustained support for programs that provide public. easily-accessible information
about polluters. pollution damages. local environmental quality and the cost of pollution
14
abatement. Such programs significantly improve the ability of local communities to
protect themselves, national regulators to enforce decent environmental standards, and
market agents to reward clean firms and punish heavy polluters. International institutions
such as the World Bank have begun supporting this idea in collaborative programs with
environmental agencies in Indonesia, Philippines, China, Thailand, Vietnam, Mexico,
Colombia, Brazil and elsewhere.8
2. Sustained support for development of stronger regulatorv institutions and cost-
effective measures to reduce pollution. Sustained support is critical, because institutional
development takes time. Although private sector clean-production initiatives can play a
valuable role, only public sector institutions can protect society's general interest in a
cleaner environment.
3. Reiection of trade and aid sanctions as levers to force closure of the reaulatorv
gap between low- and high-income countries. First, such sanctions are unjust because
they fail to discriminate between clean and dirty firms in the affected countries.
Numerous studies have shown that factories with world-class standards are operating
even in the poorest countries (Huq and Wheeler, 1992; Hartman, Huq and Wheeler, 1997;
Afsah and Vincent, 1997; Wheeler, 1999). Second, such blunt instruments will
inevitably penalize workers in poor countries by reducing opportunities for jobs and
higher wages. Finally, they won't work anyway. As previous sections have noted, poor
countries have weaker regulation and higher pollution intensity for a host of reasons.
7 See Von Amsberg (1997) on Brazil and Calkins (1993) on Indonesia.
a For more information about these programs, see the World Bank's "New Ideas in Pollution Regulation"Website at http://www.worldbank.org/nipr.
15

Governments of low-income countries could not deliver on promises of OECD-level
regulation, even if they were willing to make them.
4. Willingness by the World Bank. the IMF and other institutions to take explicit
account of environmental risks in the design and implementation of adjustment
operations and other economic reform programs. Rapid structural change could inflict
severe pollution damage on some localities unless public environmental information and
regulation keep pace with changing conditions. Willingness to recognize and compensate
for this risk with targeted programs will greatly strengthen the credibility of international
institutions that support continued economic liberalization in the name of sustainable
development.
16

References
Afsah, S. and J. Vincent, 1997, "Putting Pressure on Polluters: Indonesia's PROPERProgram," A Case Study for the HIID 1997 Asia Environmental Economics PolicySeminar (Harvard Institute for International Development), March.
Agarwal, A., R. Chopra, and K. Sharma, 1982, "The State of India's Environment,1982," New Delhi, India: Centre for Science and Environment.
Birdsall, N. and D. Wheeler, 1993, "Trade Policy and Industrial Pollution in LatinAmerica: Where Are The Pollution Havens?" Journal of Environment andDevelopment, 2,1, Winter.
Bonior, D., 1999, "Defending Democracy in the New Global Economy," statement to anAFL-CIO conference on workers' rights, trade development, and the WTO, Seattle,Washington, December.
Calkins, R., et. al., 1994, Indonesia: Environment and Development (Washington:World Bank).
Clifford, M., 1990, "Kicking up a stink: South Korean Government reels from anti-pollution backlash," Far Eastern Economic Review, Oct. 18, 72-73.
Cribb, R., 1990, "The Politics of Pollution Control in Indonesia," Asian Survey, 30:1123-35
Daly, H., 2000, "Globalization," presented at the 50th Anniversary Conference of theAspen Institute, Aspen, Colorado, August.
Dasgupta, S. and D. Wheeler, 1996, "Citizen Complaints As Environmental Indicators:Evidence From China," World Bank Policy Research Department Working Paper,No. 1704, November.
Dasgupta, S., B. Laplante and N. Mamingi, 1997, "Capital Market Responses toEnvironmental Performance in Developing Countries," World Bank DevelopmentResearch Group Working Paper, No. 1909, October.
Dasgupta, S., A. Mody, S. Roy and D. Wheeler, 1995, "Environmental Regulation AndDevelopment: A Cross-Country Empirical Analysis," World Bank Policy ResearchDepartment Working Paper, No. 1448, March.
Dasgupta, S., H. Wang and D. Wheeler, 1997, "Surviving Success: Policy Reform andthe Future of Industrial Pollution in China," World Bank Policy Research DepartmentWorking Paper, No. 1856, October.
17
Dasgupta, S., R. Lucas and D. Wheeler, 1998, "Small Manufacturing Plants, Pollutionand Poverty: New Evidence from Brazil and Mexico," World Bank DevelopmentResearch Group Working Paper, No. 2029, December.
Dowell, G., S. Hart and B. Yeung, 2000, "Do Corporate Global Environmental StandardsCreate or Destroy Market Value?" Management Science, August.
Hamilton, J., 1995, "Pollution as News: Media and Stock Market Reactions to the ToxicRelease Inventory Data," Journal of Environmental Economics and Management, 28,98-103.
Hartman, R., M. Huq and D. Wheeler, 1997, "Why Paper Mills Clean Up: Determinantsof Pollution Abatement in Four Asian Countries," World Bank Policy ResearchDepartment Working Paper, No. 1710, January.
Hettige, H., M. Huq, S. Pargal and D. Wheeler, 1996, "Determinants of PollutionAbatement in Developing Countries: Evidence from South and Southeast Asia," WorldDevelopment, Vol. 24, No. 12, 1891-1904.
Huq, M. and D. Wheeler, 1992, "Pollution Reduction Without Formal Regulation:Evidence from Bangladesh," World Bank Environment Department Working Paper,No. 1993-39.
Jaffe, A., S. Peterson, P. Portney, and R. Stavins, 1995, "Environmental Regulation andthe Competitiveness of U.S. Manufacturing. What does the Evidence tell Us?", Journalof Economic Literature 33: 132-63.
Jha, V., A. Markandya, and R. Vossenaar, 1999, Reconciling Trade and theEnvironment. Lessons from Case Studies in Developing Countries, Edward ElgarPublishing Co.
Khalid, R., and J.B. Braden, 1993, "Welfare Effects of Environmental Regulation in anOpen Economy: The Case of Malaysian Palm Oil," Journal of Agricultural Economics44: 25-37, January
Klassen, R.D. and C.P. McLaughlin, 1996, "The Impact of Environmental Management onFirm Performance," Management Science, 42(8), 1199-1214.
Konar, S. and M. Cohen, 1997, "Information as Regulation: The Effect of Community Rightto Know Laws on Toxic Emissions", Journal of Environmental Economics andManagement, Vol. 32,109-124.
Lanoie, P. and B. Laplante, 1994, "The Market Response to Environmental Incidents inCanada: a Theoretical and Empirical Analysis", Southern Economic Journal, Vol. 60.
18

Laplante, B., P. Lanoie and M. Roy, 1997, "Can Capital Markets Create Incentives forPollution Control?" World Bank Policy Research Department Working Paper, No.1753, April.
Mani, M. and D. Wheeler, 1998, "In Search of Pollution Havens? Dirty Industry in theWorld Economy, 1960-1995," Journal of Environment and Development, Fall.
Muoghalu, M., D. Robison and J. Glascock, 1990, "Hazardous waste lawsuits,stockholder returns, and deterrence," Southern Economic Journal, October, 357-70.
Pargal, S. and D. Wheeler, 1996, "Informal Regulation of Industrial Pollution inDeveloping Countries: Evidence From Indonesia," Journal of Political Economy, Vol.104, No. 6, 1314+.
Stotz, E., 1991, "Luta Pela Saude Ambiental: A AMAP Contra Cortume Carioca, S.A.,Una Experiencia Vitoriosa," V. V. Valla and E. N. Stotz (eds.) Participacao Popular,Educacao e Saude, Rio de Janeiro, 133-160.
Von Amsberg, J., 1997, "Brazil: Managing Pollution Problems, The BrownEnvironmental Agenda," World Bank Report #16635-BR, June.
Wheeler, D., et. al., 1999, Greening Industry: New Roles for Communities, Marketsand Governments, (New York: Oxford/World Bank).
Wheeler, D., M. Huq and P. Martin, 1993, "Process Change, Economic Policy, andIndustrial Pollution: Cross Country Evidence from the Wood Pulp and Steel Industries,"presented at the Annual Meetings, American Economic Association, Anaheim,California, January.
Xu, X., J. Gao, D. Dockery and Y. Chen, 1994, "Air Pollution and DailyMortality in Residential Areas of Beijing, China," Archives of EnvironmentalHealth, 49(4), 216-22.
19
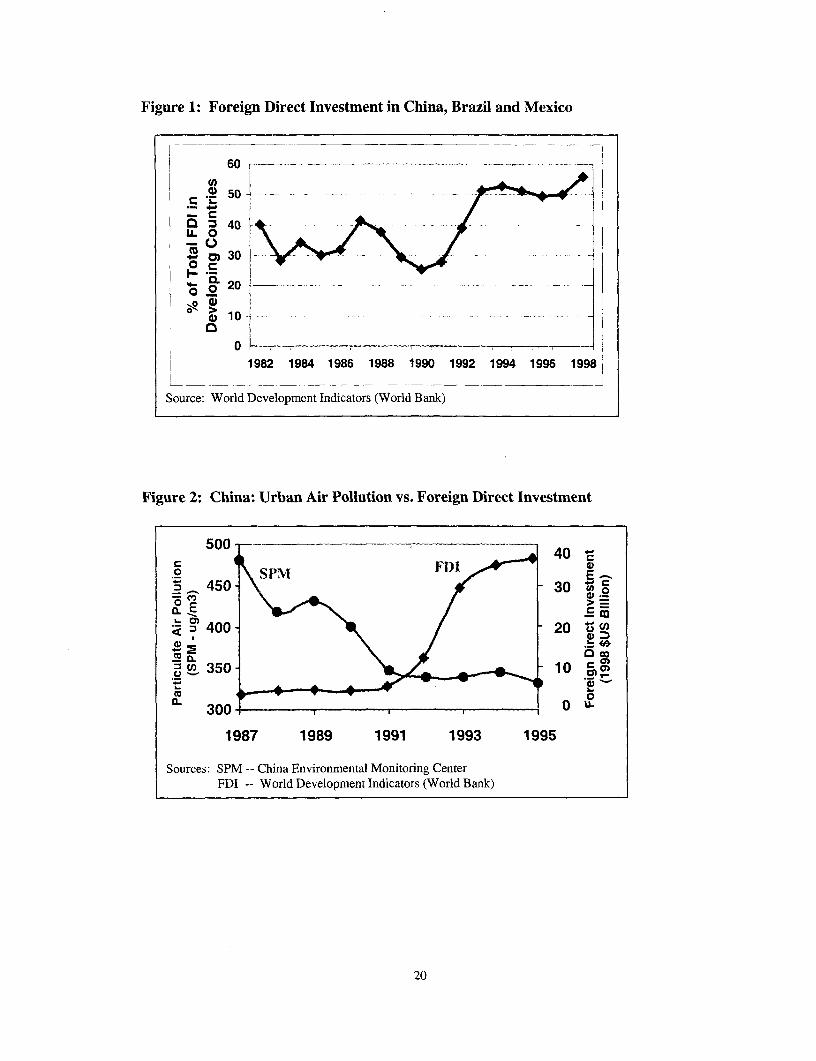
Figure 1: Foreign Direct Investment in China, Brazil and Mexico
60
U,
1982 1984 1986 1988 1990 1992 1994 1996 1998
Source: World Development Indicators (World Bank)
Figure 2: China: Urban Air Pollution vs. Foreign Direct Investment
400 40 E
_ 450 310 3
I- 02
z 40 20~09 ~ ~ ~ ~ ~ ~ ~ 0
0~~~~~~~~~~~~
1982 198498 198 191 0 192 13 9 1995 99
Source: World Development Indicators (World Bank)
Figre2-Chia:Uran irPoluionvs Frein irct nvs20n

Figure 3: Air Pollution in Mexico City vs. FDI in Mexico
60 - 14.5
0 50 - ID! '12.0 * O(0
40 - .5
~U) >c
0
-10 - 2.0 U.
1989 1991 1993 1995 1997
Sources: FDI -- World Development Indicators (World Bank)SPM Readings -- SEMARNAP (National Environment Ministry) athttp://www.ine.gob.mx/dggia/cal-aire/libros/segu-info/mexico.html
Figure 4: Brazil: Air Pollution in Cubatao vs. FDI in Sao Paulo State
155 r10e0 PM-10 E~~~~~~~~~1
,~ 140 8 -608Z E>a19 125 6 199
2- 110 4 44co
~- 95 2 a
L
80 01985 1987 1989 1991 1993 1995 1997
Sources: PM-10 -- CETESB (Sao Paulo State Environmental Agency)FDI -- SEADE (Sao Paulo State System for Data Analysis)
World Develoipment Indicators, World Bank
21

Figure 5: Air Pollution in US Metropolitan Areas, 1988 - 1997
-- Chicago
140 -- - -- Houstonm , ~~~~~~~~~~~--oAtiants
60 -a. .11- _- Now York
30
25
201988 1989 1990 1991 1992 1M 1994 1995 199 1997
Source: USEPA online at httx,:lWww.eoa.-Lov/oar/autnd97/tables.htmI
Figure 6: Air Pollution Control Costs in China
Sulphur Dioxide Marginal Abatement Costs:Large Chinese Factories
'L 300 :___:.
250
200
iso ~ ~ ~ ~ ~ ~ ~ .- Non-SOE
01. 12 03 0 9 05 0.6 0.7 016 19
Rate oa Abatement
Source: Wheeler (1999)
22
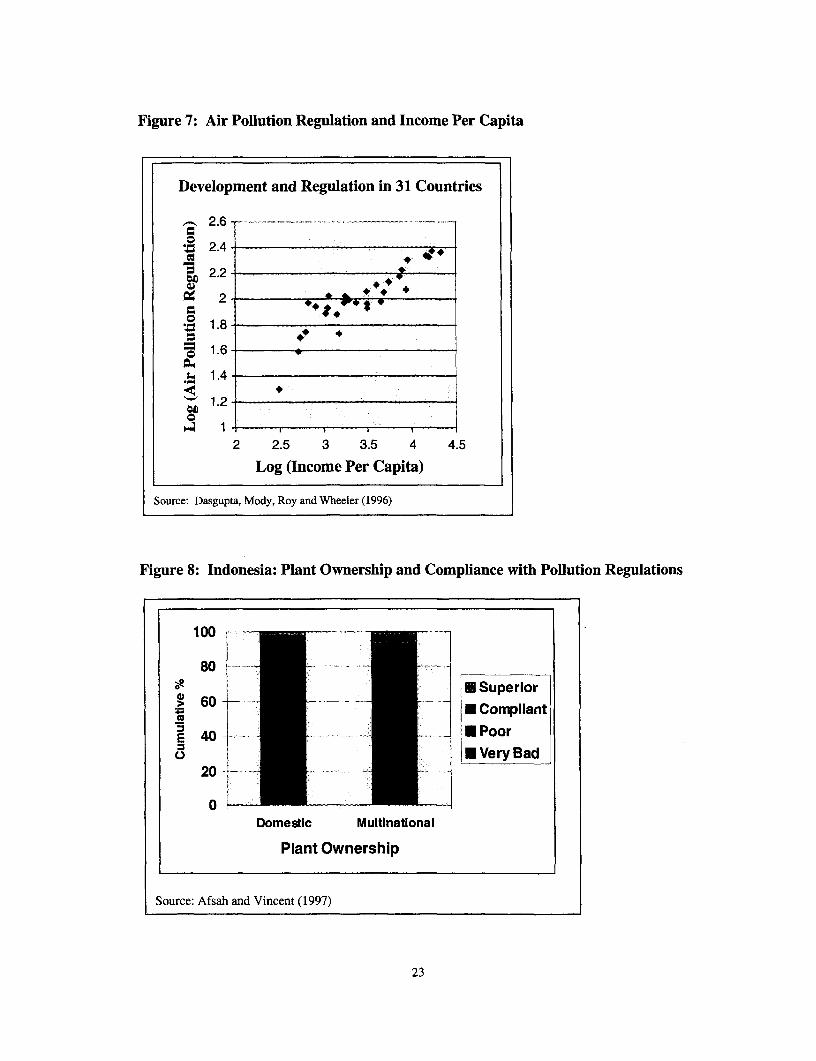
Figure 7: Air Pollution Regulation and Income Per Capita
Development and Regulation in 31 Countries
2.6 -
*z 2.4-
2.2-
2 2
*;1.8-
1.6
L 1.4-
1.2-
4 1- , I
2 2.5 3 3.5 4 4.5
Log (Income Per Capita)
Source: Dasgupta, Mody, Roy and Wheeler (1996)
Figure 8: Indonesia: Plant Ownership and Compliance with Pollution Regulations
100
806 Superior
.60 _ *Compliant
E0 Poor* Very Bad
20-
0.Domestic Multinational
Plant Ownership
Source: Afsah and Vincent (1997)
23
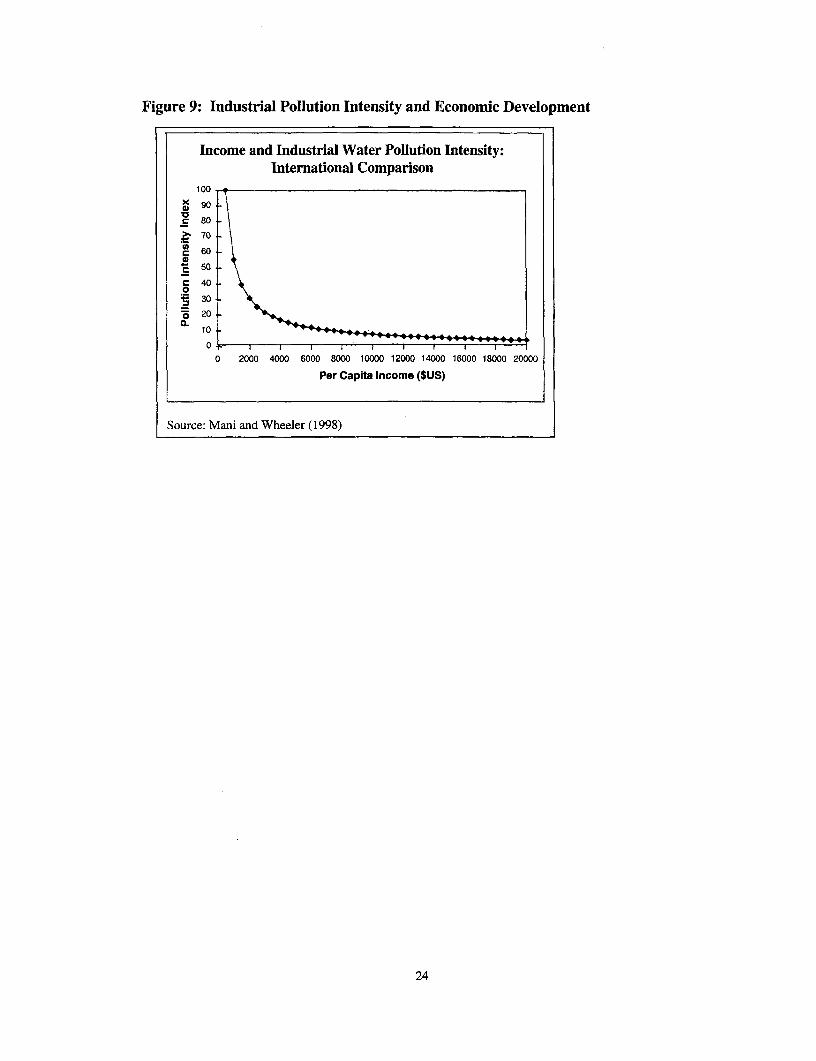
Figure 9: Industrial Pollution Intensity and Economic Development
Income and Industrial Water Pollution Intensity:International Comparison
100X 90
070
c 600* 50
C400
-30
20 e
1010
0 2000 4000 6000 8000 10000 12000 14000 16000 18000 20000
Per Capita Income ($US)
Source: Mani and Wheeler (1998)
24
Policy Research Working Paper Series
ContactTitle Author Date for paper
WPS2505 Family Altruism and Incentives Roberta Gatti December 2000 R. Bonfield31248
WPS2506 Ethnicity and Wage Determination Abigail Barr December 2000 R. Bonfieldin Ghana Abena Oduro 31248
WPS2507 Public Expenditures and Gunnar S. Eskeland December 2000 H. SladovichEnvironmental Protection: When Is 37698the Cost of Funds Irrelevant?
WPS2508 Sources of Financial Assistance for Mattias Lundberg December 2000 V. SoukhancHouseholds Suffering an Adult Mead Over 35271Death in Kagera, Tanzania Phare Mujinja
WPS2509 How Tax Policy and Incentives Jacques Morisset December 2000 N. BusjeetAffect Foreign Direct Investment: Neda Pirnia 33997A Review
WPS251 0 Environmental Protection and Gunnar S. Eskeland December 2000 H. SladoviclhOptimal Taxation 37698
WPS2511 Monetary Policy under Flexible Pierre-Richard Agenor December 2000 M. GosiengfiawExchange Rates: An Introduction to 33363Inflation Targeting
WPS2512 Quantifying the Impact of Technical Keith E. Maskus December 2000 L. TabadaBarriers to Trade: A Framework for John S. Wilson 36896Analysis Tsunehiro Otsuki
WPS2513 Do State Holding Companies Facilitate Michel Kerf December 2000 M. LeonPrivate Participation in the Water Sector? 36151Evidence from C6te d'lvoire, the Gambia,Guinea, and Senegal
WPS2514 Intersectoral Dynamics and Economic Norbert M. Fiess January 2001 A. PillayGrowth in Ecuador Dorte Verner 88046
WPS2515 Firm-Level Survey Provides Data on Mary Hallward-Driemeier January 2001 E. KhineAsia's Corporate Crisis and Recovery 37471
WPS2516 Does Decentralization Increase Jean-Paul Faguet January 2001 H. Sladov,c;Responsiveness to Local Needs? 37698Evidence from Bolivia
WPS2517 The Effect of International Monetary William Easterly January 2001 K. LabrieFund and World Bank Programs 31001on Poverty
Policy Research Working Paper Series
ContactTitle Author Date for paper
WPS2518 Can Reforming Global Institutions Andres Solimano January 2001 R. BonfieldHelp Developing Countries Share 31248More in the Benefits fromGlobalization?
WPS2519 Is Investment in Africa Too Low or Shantayanan Devarajan January 2001 H. SladovichToo High? Macro and Micro Evidence William R. Easterly 37698
Howard Pack
WPS2520 Wage Effects of Unions and Industrial Kristin F. Butcher January 2001 P. SaderCouncils in South Africa Cecilia Elena Rouse 33902
WPS2521 Labor Market Rigidity and the Alvaro Forteza January 2001 P. SaderSuccess of Economic Reforms Martin Rama 33902across More than 100 Countries
WPS2522 Trade in International Maritime Carsten Fink January 2001 L.TabadaServices: How Much Does Policy Aaditya Mattoo 36896Matter? Ileana Cristina Neagu
WPS2523 Can Duty Drawbacks Have a Olivier Cadot January 2001 L. TabadaProtectionist Bias? Evidence from Jaime de Melo 36896Mercosur
Top Related