


Languages
Pages
Legal

Innovative Plug‐and‐Play Battery Charging System to Maximize Overall Electrical Power System Efficiency in 1U and 2U CubeSats
Matt RodencalChargerSat‐1
University of Alabama Huntsville
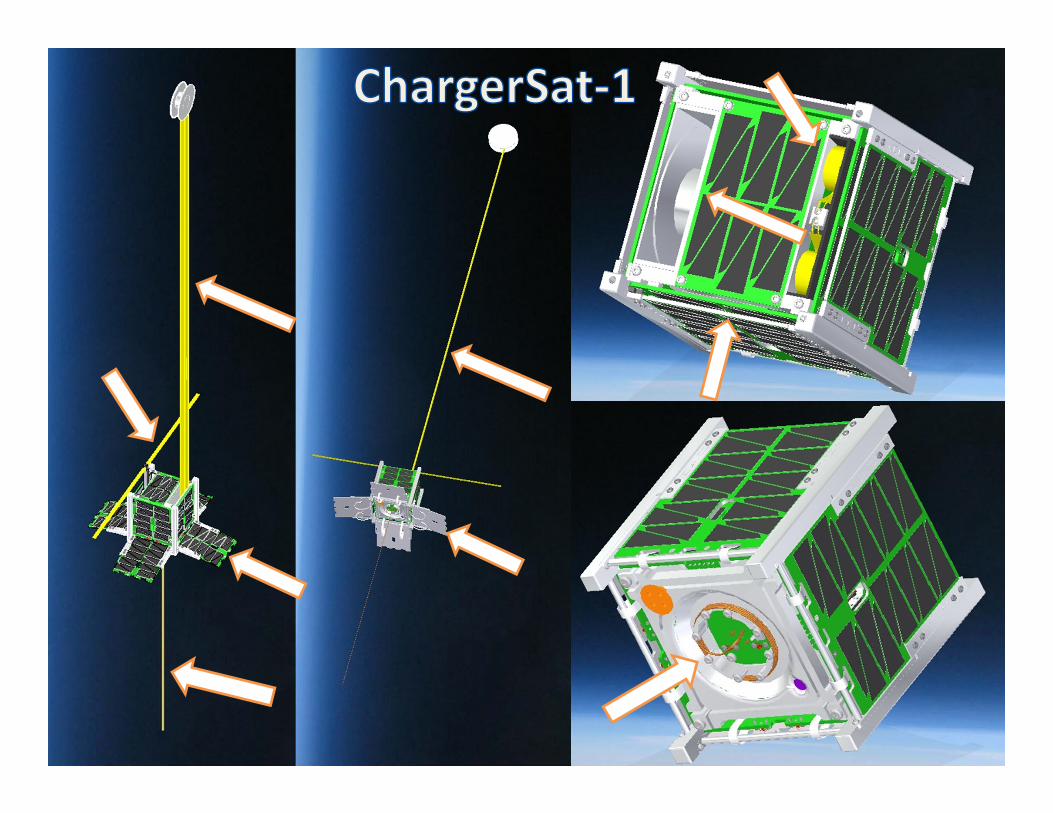
ChargerSat‐1
Electrical Power System

General EPS Flow Diagram
Side Solar Panel A
Deployable Solar Panel B
Side Solar Panel B
Deployable Solar Panel C
Side Solar Panel C
Deployable Solar Panel D
Side Solar Panel D
Top Solar Panel
PPT 8
PPT 9
PPT 7
PPT 6
PPT 5
PPT 4
PPT 3
PPT 2
PPT 1Deployable Solar Panel A
3.3 Volt Rail
9 Volt Rail
PMIC 1
PMIC 2
EPS MCU(NOT C&DH)
Battery 1
RBF, Deployment Switch, & Battery Protection
Disconnect 1
Battery 2
RPF , Deployment Switch, & Battery Protection
Disconnect 2
Temperature Shutdown
Temperature Shutdown
Voltage Measurement
Load Control
Load Control
Voltage & Temp. Measurement
Voltage & Temp. Measurement
PowerData
Solar Panels Power Point Trackers
Power Management System Voltage Rails
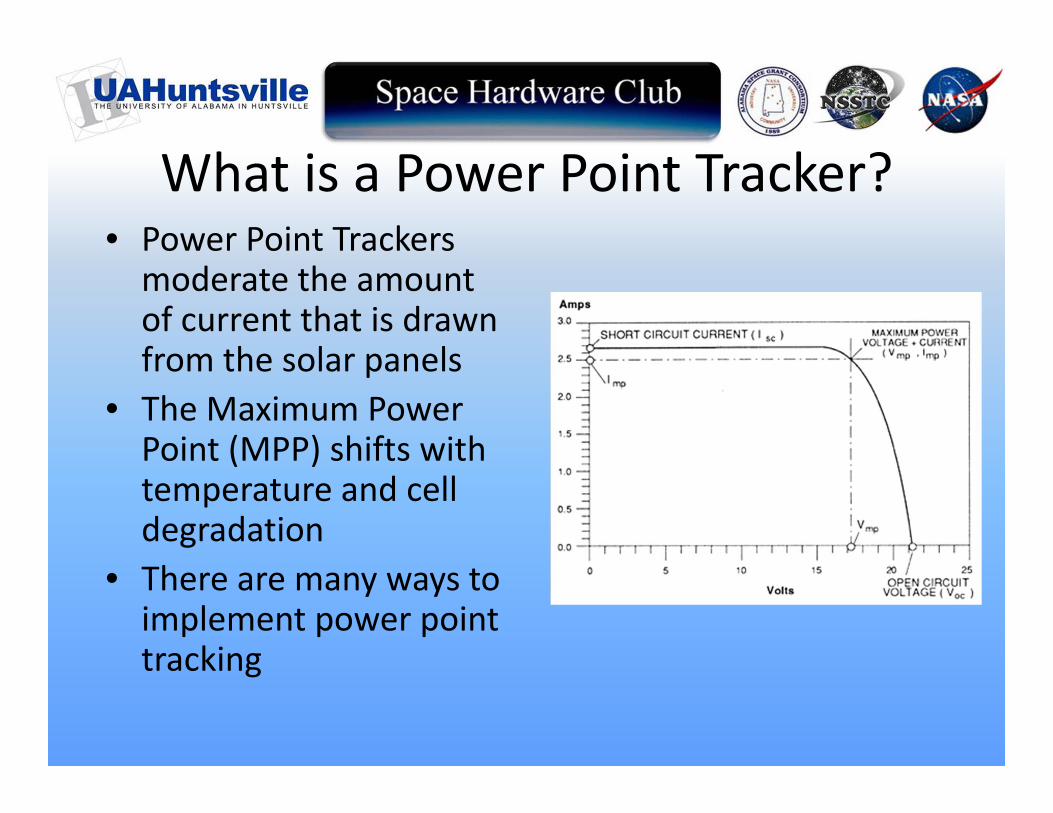
What is a Power Point Tracker?• Power Point Trackers moderate the amount of current that is drawn from the solar panels
• The Maximum Power Point (MPP) shifts with temperature and cell degradation
• There are many ways to implement power point tracking

Fun Facts About Power Point Tracking• Power IF: Draw > AvailableTHEN: Bus Voltage Drops
IF: Draw < AvailableTHEN: Power Point
Trackers not activehttp://www.daviddarling.info/encyclopedia/I/AE_I‐V_curve.html

ChargerSat‐1 Power Point TrackersPower Point Tracker
• Consists of a MAX1771 DC‐DC convertor and a MAX990 comparator.
• The MAX990 compares input voltage to the DC‐DC to the voltage of a test cell on the solar panel
• Based on the principle that the maximum power point of a solar panel is some percentage of its open circuit voltage.
• Test cell allows for analog tracking of thermal drift and radiation degradation
• PPTs are on the back of Side Panels• Status
– Prototype Designed and Tested– Awaiting Full System Integration and
environmental testing
Input and Output waveforms of PPT
SHDN (OFF = LOW)
DC‐DC Input
DC‐DC Output
Comparator In

Battery Charging

http://fjdbattery.en.made‐in‐china.com/product/oecxDJUuhMhN/China‐Li‐Po‐Battery.html
Bi‐state Battery ChargingAdvantages
1. Hold the charge current constant and let the Battery voltage climb
2. Once the battery voltage has reached ~4.25V, hold it constant and let the current drop off
How to Charge a Li‐Po Battery
http://www.batterywholesale.com/charging_c.html
1. Easily implemented with COTS solution
2. Maximizes battery lifetime3. Reliable4. Minimal chance of violent
battery failure
http://www.rcgroups.com/forums/showthread.php?t=151687

0.00
1.00
2.00
3.00
4.00
5.00
6.00
7.00
0 10 20 30 40 50 60 70
Power (W
)
Time (min)
Power Over 1 Orbit @ 500km, 51o (Deployed)
Available SolarPowerPower Stored(0.2C, 400mA)Power Stored(0.5C, 1000mA)
0.00
0.50
1.00
1.50
2.00
2.50
3.00
0 10 20 30 40 50 60 70
Power (W
)
Time (min)
Power Over 1 Orbit @ 500km, 51o (Undeployed)
Available Solar Power
Power Stored (0.2C, 400mA)
Total Power Used: 64.52%
Total Power Used: 29.38%
Total Power Used: 50.97%
*Videos made in STK
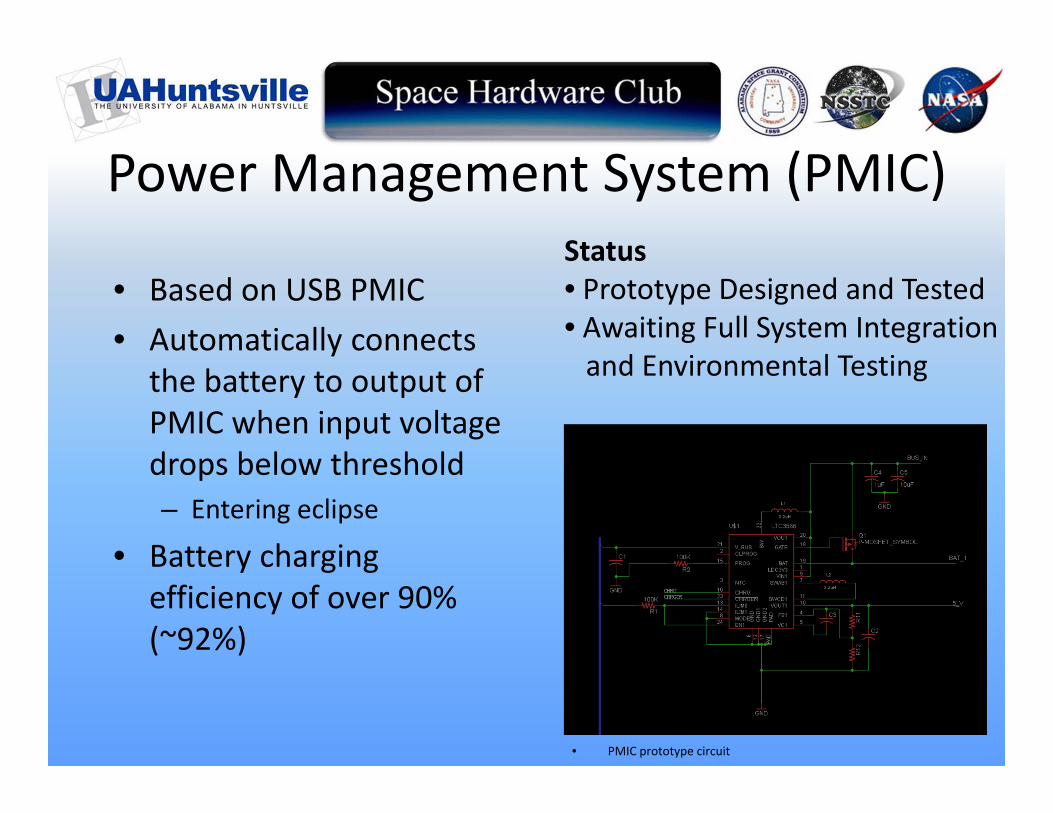
Power Management System (PMIC)
• Based on USB PMIC• Automatically connects
the battery to output of PMIC when input voltage drops below threshold– Entering eclipse
• Battery charging efficiency of over 90% (~92%)
• PMIC prototype circuit
Status• Prototype Designed and Tested• Awaiting Full System Integrationand Environmental Testing
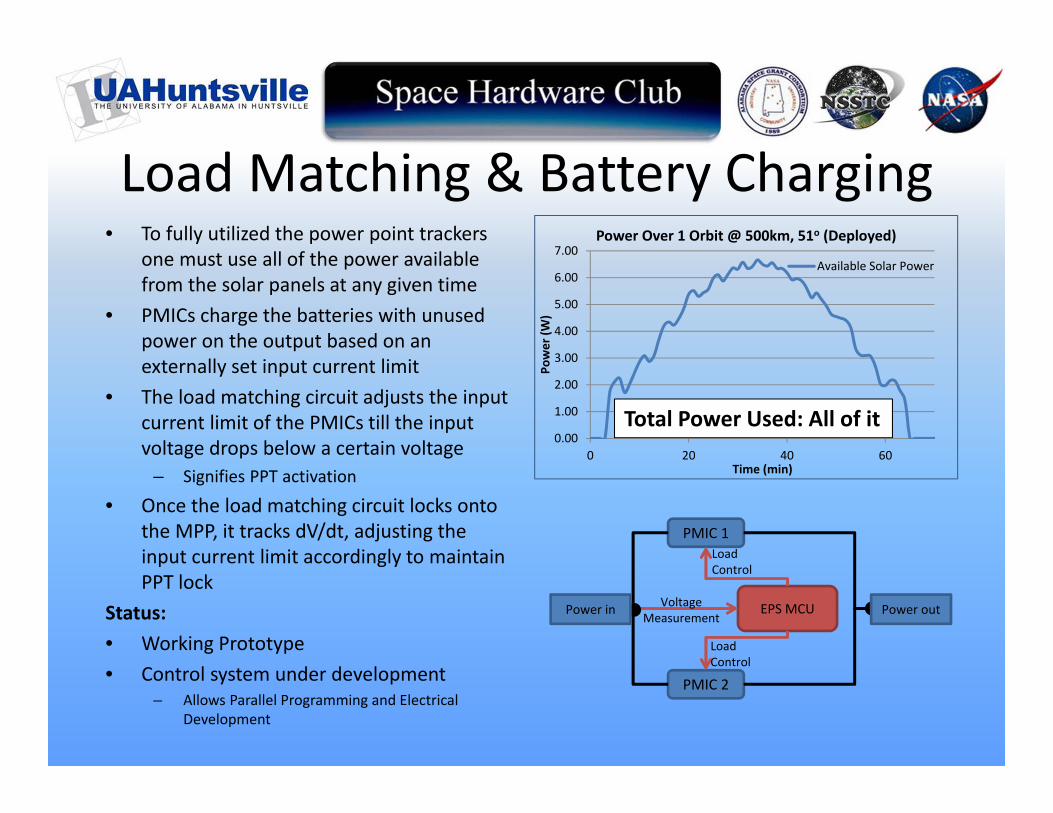
PMIC 1
PMIC 2
EPS MCUVoltage Measurement
Load Control
Load Control
Power in Power out
Load Matching & Battery Charging• To fully utilized the power point trackers
one must use all of the power available from the solar panels at any given time
• PMICs charge the batteries with unused power on the output based on an externally set input current limit
• The load matching circuit adjusts the input current limit of the PMICs till the input voltage drops below a certain voltage
– Signifies PPT activation
• Once the load matching circuit locks onto the MPP, it tracks dV/dt, adjusting the input current limit accordingly to maintain PPT lock
Status:• Working Prototype• Control system under development
– Allows Parallel Programming and Electrical Development
0.00
1.00
2.00
3.00
4.00
5.00
6.00
7.00
0 20 40 60
Power (W
)
Time (min)
Power Over 1 Orbit @ 500km, 51o (Deployed)
Available Solar Power
Total Power Used: All of it
Pros and ConsAdvantages• All available power used
(minus charging losses)• Automatically optimized • Extremely tolerant to solar
panel fatigue and failure• Modular– Can be supplied by any 5V input– Can charge many Li‐Pos on the
market• Wide charge current range– 0.01mA to 2A per PMIC – ChargerSat‐1 EPS capable of fully
utilizing combined 20W solar array• System failure behaves like bi‐
state charger
Disadvantages• Effects on battery lifetime
unknown– Only gone through 15‐20 charge
cycles
• Battery failure rate unknown
– Although 0% failure rate so far

• ~80% efficient – Not taking in to account
thermal gradients
• After 25% solar cell degradation, batteries can not be fully charged – Limits mission lifetime
• After 30% solar cell degradation, Vmp < VBatt
Direct Energy Transfer• EPS: 85.6‐80%
– PPT: 93‐87% efficient– PMIC: ~92% efficient
• Compensates for solar cell degradation and thermal gradients– No limit on mission lifetime
• Modular and easy to implement
• Extremely Robust – Can still function with over 50%
of EPS failure
ChargerSat‐1 EPS
EPS comparisonSide Solar Panel A
Deployable Solar Panel B
Side Solar Panel B
Deployable Solar Panel C
Side Solar Panel C
Deployable Solar Panel D
Side Solar Panel D
Top Solar Panel
PPT 8
PPT 9
PPT 7
PPT 6
PPT 5
PPT 4
PPT 3
PPT 2
PPT 1Deployable Solar Panel A
3.3 Volt Rail
9 Volt Rail
PMIC 1
PMIC 2
EPS MCU
Battery 1
RBF, Deployment Switch, & Battery Protection
Disconnect 1
Battery 2
RPF , Deployment Switch, & Battery Protection
Disconnect 2
Temperature Shutdown
Temperature Shutdown
Voltage Measurement
Load Control
Load Control
Voltage & Temp. Measurement
Voltage & Temp. Measurement
PowerData
Solar Panels Power Point Trackers
Power Management System
Special thanks to
• University of Alabama in Huntsville• Alabama Space Grant Consortium • National Space Science and Technology Center(NSSTC)
Without them, none of this would be possible
Top Related