


Languages
Pages
Legal


Data for use of Deputy Chairman, Planning Commission
5th Deccember 2012
http://planningcommission.gov.in
i
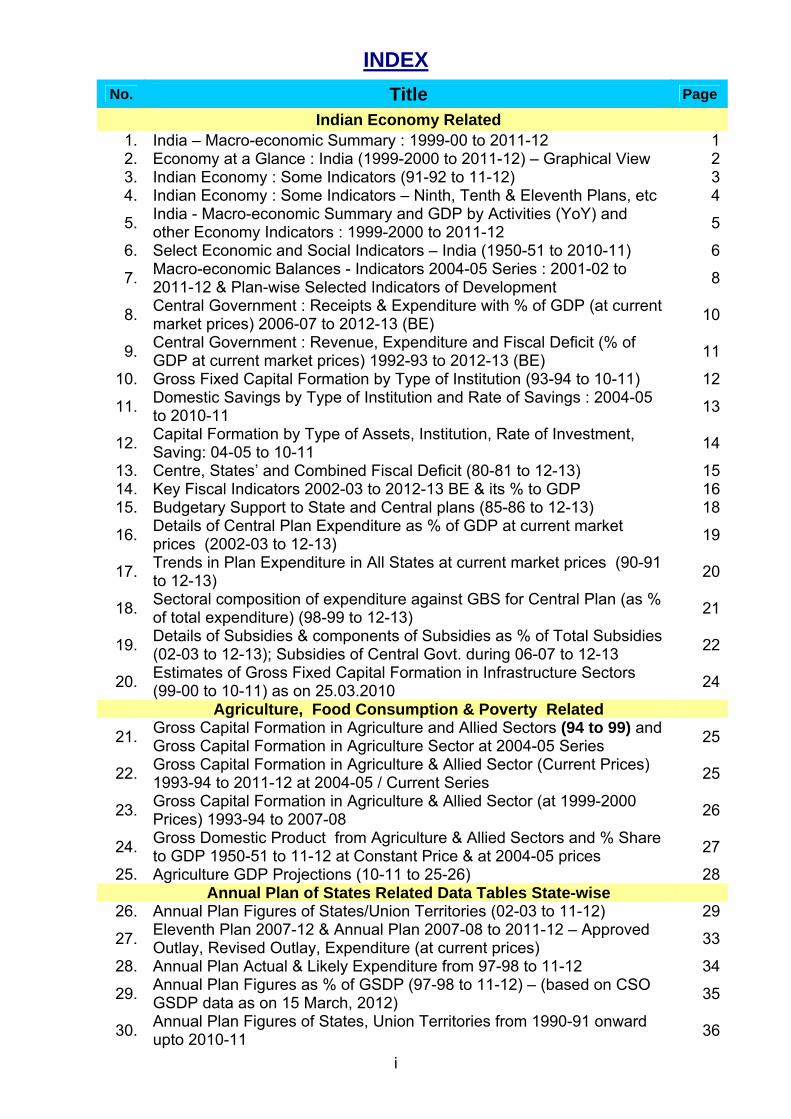
INDEX
No. Title Page
Indian Economy Related
1. India – Macro-economic Summary : 1999-00 to 2011-12 12. Economy at a Glance : India (1999-2000 to 2011-12) – Graphical View 23. Indian Economy : Some Indicators (91-92 to 11-12) 34. Indian Economy : Some Indicators – Ninth, Tenth & Eleventh Plans, etc 4
5. India - Macro-economic Summary and GDP by Activities (YoY) and other Economy Indicators : 1999-2000 to 2011-12 5
6. Select Economic and Social Indicators – India (1950-51 to 2010-11) 6
7. Macro-economic Balances - Indicators 2004-05 Series : 2001-02 to 2011-12 & Plan-wise Selected Indicators of Development 8
8. Central Government : Receipts & Expenditure with % of GDP (at current market prices) 2006-07 to 2012-13 (BE) 10
9. Central Government : Revenue, Expenditure and Fiscal Deficit (% of GDP at current market prices) 1992-93 to 2012-13 (BE) 11
10. Gross Fixed Capital Formation by Type of Institution (93-94 to 10-11) 12
11. Domestic Savings by Type of Institution and Rate of Savings : 2004-05 to 2010-11 13
12. Capital Formation by Type of Assets, Institution, Rate of Investment, Saving: 04-05 to 10-11 14
13. Centre, States’ and Combined Fiscal Deficit (80-81 to 12-13) 1514. Key Fiscal Indicators 2002-03 to 2012-13 BE & its % to GDP 1615. Budgetary Support to State and Central plans (85-86 to 12-13) 18
16. Details of Central Plan Expenditure as % of GDP at current market prices (2002-03 to 12-13) 19
17. Trends in Plan Expenditure in All States at current market prices (90-91 to 12-13) 20
18. Sectoral composition of expenditure against GBS for Central Plan (as % of total expenditure) (98-99 to 12-13) 21
19. Details of Subsidies & components of Subsidies as % of Total Subsidies (02-03 to 12-13); Subsidies of Central Govt. during 06-07 to 12-13 22
20. Estimates of Gross Fixed Capital Formation in Infrastructure Sectors (99-00 to 10-11) as on 25.03.2010 24
Agriculture, Food Consumption & Poverty Related
21. Gross Capital Formation in Agriculture and Allied Sectors (94 to 99) and Gross Capital Formation in Agriculture Sector at 2004-05 Series 25
22. Gross Capital Formation in Agriculture & Allied Sector (Current Prices) 1993-94 to 2011-12 at 2004-05 / Current Series 25
23. Gross Capital Formation in Agriculture & Allied Sector (at 1999-2000 Prices) 1993-94 to 2007-08 26
24. Gross Domestic Product from Agriculture & Allied Sectors and % Share to GDP 1950-51 to 11-12 at Constant Price & at 2004-05 prices 27
25. Agriculture GDP Projections (10-11 to 25-26) 28 Annual Plan of States Related Data Tables State-wise
26. Annual Plan Figures of States/Union Territories (02-03 to 11-12) 29
27. Eleventh Plan 2007-12 & Annual Plan 2007-08 to 2011-12 – Approved Outlay, Revised Outlay, Expenditure (at current prices) 33
28. Annual Plan Actual & Likely Expenditure from 97-98 to 11-12 34
29. Annual Plan Figures as % of GSDP (97-98 to 11-12) – (based on CSO GSDP data as on 15 March, 2012) 35
30. Annual Plan Figures of States, Union Territories from 1990-91 onward upto 2010-11 36
ii
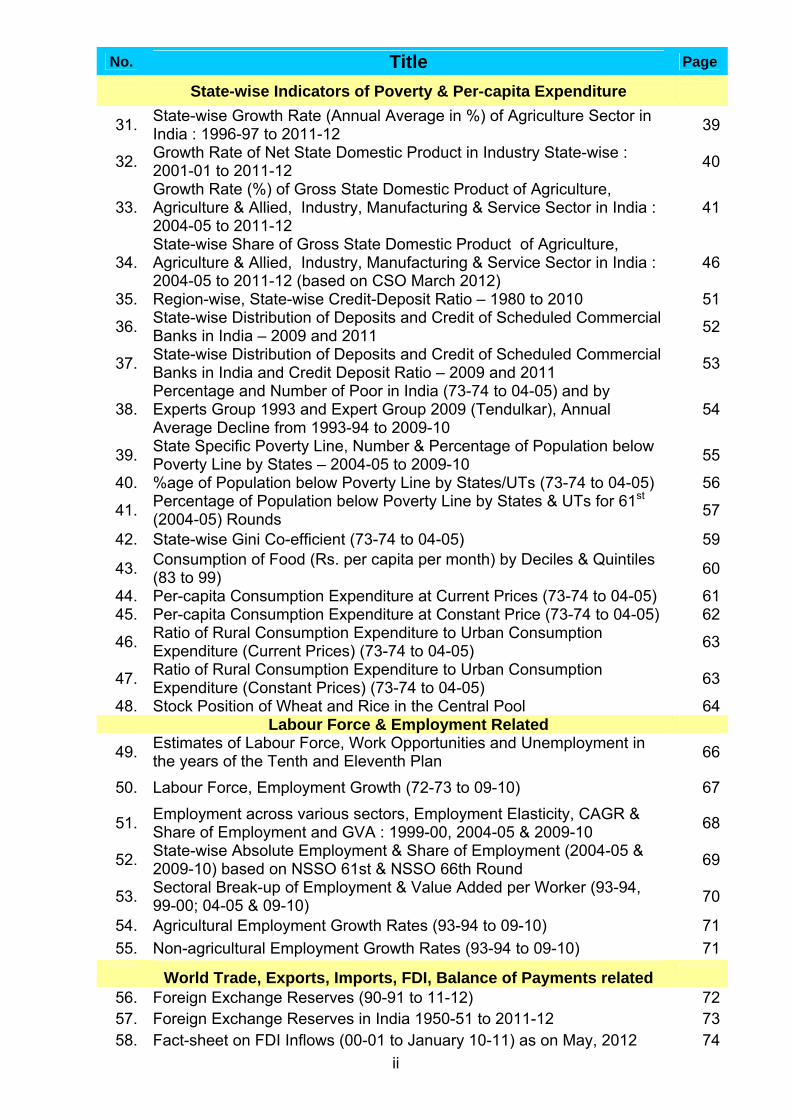
No. Title Page
State-wise Indicators of Poverty & Per-capita Expenditure
31. State-wise Growth Rate (Annual Average in %) of Agriculture Sector in India : 1996-97 to 2011-12 39
32. Growth Rate of Net State Domestic Product in Industry State-wise : 2001-01 to 2011-12 40
33. Growth Rate (%) of Gross State Domestic Product of Agriculture, Agriculture & Allied, Industry, Manufacturing & Service Sector in India : 2004-05 to 2011-12
41
34. State-wise Share of Gross State Domestic Product of Agriculture, Agriculture & Allied, Industry, Manufacturing & Service Sector in India : 2004-05 to 2011-12 (based on CSO March 2012)
46
35. Region-wise, State-wise Credit-Deposit Ratio – 1980 to 2010 51
36. State-wise Distribution of Deposits and Credit of Scheduled Commercial Banks in India – 2009 and 2011 52
37. State-wise Distribution of Deposits and Credit of Scheduled Commercial Banks in India and Credit Deposit Ratio – 2009 and 2011 53
38. Percentage and Number of Poor in India (73-74 to 04-05) and by Experts Group 1993 and Expert Group 2009 (Tendulkar), Annual Average Decline from 1993-94 to 2009-10
54
39. State Specific Poverty Line, Number & Percentage of Population below Poverty Line by States – 2004-05 to 2009-10 55
40. %age of Population below Poverty Line by States/UTs (73-74 to 04-05) 56
41. Percentage of Population below Poverty Line by States & UTs for 61st (2004-05) Rounds 57
42. State-wise Gini Co-efficient (73-74 to 04-05) 59
43. Consumption of Food (Rs. per capita per month) by Deciles & Quintiles (83 to 99) 60
44. Per-capita Consumption Expenditure at Current Prices (73-74 to 04-05) 6145. Per-capita Consumption Expenditure at Constant Price (73-74 to 04-05) 62
46. Ratio of Rural Consumption Expenditure to Urban Consumption Expenditure (Current Prices) (73-74 to 04-05) 63
47. Ratio of Rural Consumption Expenditure to Urban Consumption Expenditure (Constant Prices) (73-74 to 04-05) 63
48. Stock Position of Wheat and Rice in the Central Pool 64 Labour Force & Employment Related
49. Estimates of Labour Force, Work Opportunities and Unemployment in the years of the Tenth and Eleventh Plan 66
50. Labour Force, Employment Growth (72-73 to 09-10) 67
51. Employment across various sectors, Employment Elasticity, CAGR & Share of Employment and GVA : 1999-00, 2004-05 & 2009-10 68
52. State-wise Absolute Employment & Share of Employment (2004-05 & 2009-10) based on NSSO 61st & NSSO 66th Round 69
53. Sectoral Break-up of Employment & Value Added per Worker (93-94, 99-00; 04-05 & 09-10) 70
54. Agricultural Employment Growth Rates (93-94 to 09-10) 7155. Non-agricultural Employment Growth Rates (93-94 to 09-10) 71
World Trade, Exports, Imports, FDI, Balance of Payments related
56. Foreign Exchange Reserves (90-91 to 11-12) 7257. Foreign Exchange Reserves in India 1950-51 to 2011-12 7358. Fact-sheet on FDI Inflows (00-01 to January 10-11) as on May, 2012 74
iii
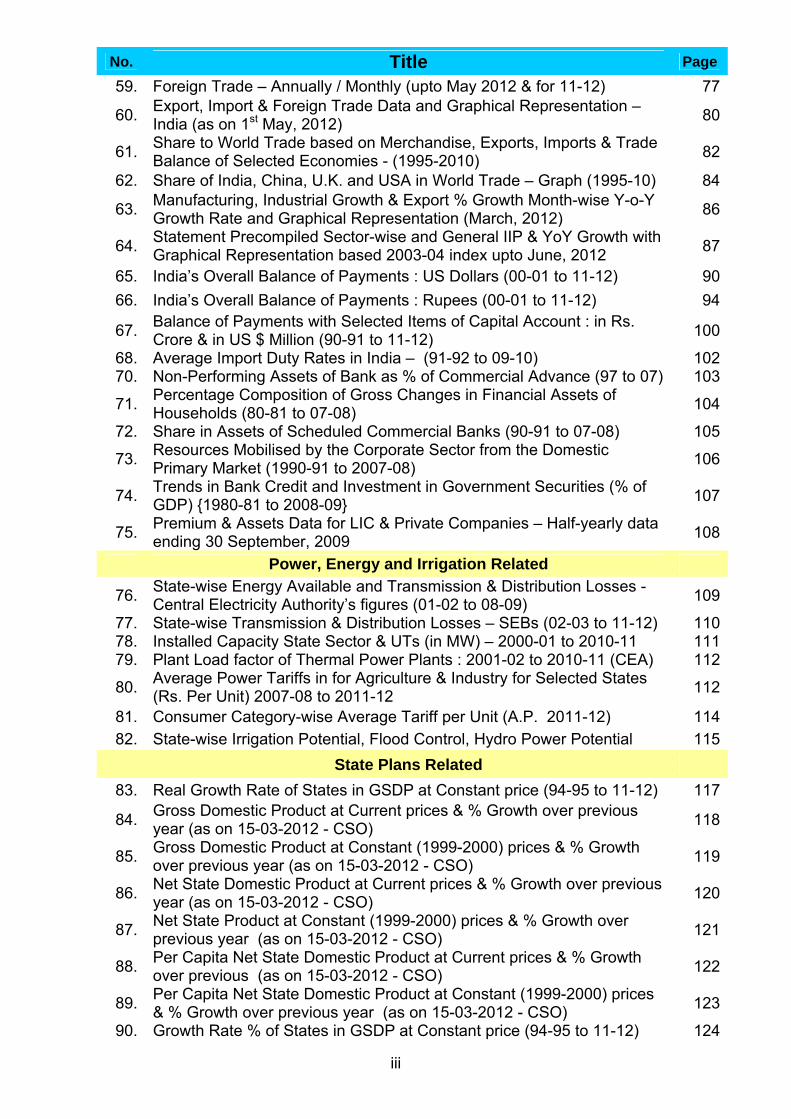
No. Title Page
59. Foreign Trade – Annually / Monthly (upto May 2012 & for 11-12) 77
60. Export, Import & Foreign Trade Data and Graphical Representation – India (as on 1st May, 2012) 80
61. Share to World Trade based on Merchandise, Exports, Imports & Trade Balance of Selected Economies - (1995-2010) 82
62. Share of India, China, U.K. and USA in World Trade – Graph (1995-10) 84
63. Manufacturing, Industrial Growth & Export % Growth Month-wise Y-o-Y Growth Rate and Graphical Representation (March, 2012) 86
64. Statement Precompiled Sector-wise and General IIP & YoY Growth with Graphical Representation based 2003-04 index upto June, 2012 87
65. India’s Overall Balance of Payments : US Dollars (00-01 to 11-12) 9066. India’s Overall Balance of Payments : Rupees (00-01 to 11-12) 94
67. Balance of Payments with Selected Items of Capital Account : in Rs. Crore & in US $ Million (90-91 to 11-12) 100
68. Average Import Duty Rates in India – (91-92 to 09-10) 10270. Non-Performing Assets of Bank as % of Commercial Advance (97 to 07) 103
71. Percentage Composition of Gross Changes in Financial Assets of Households (80-81 to 07-08) 104
72. Share in Assets of Scheduled Commercial Banks (90-91 to 07-08) 105
73. Resources Mobilised by the Corporate Sector from the Domestic Primary Market (1990-91 to 2007-08) 106
74. Trends in Bank Credit and Investment in Government Securities (% of GDP) {1980-81 to 2008-09} 107
75. Premium & Assets Data for LIC & Private Companies – Half-yearly data ending 30 September, 2009 108
Power, Energy and Irrigation Related
76. State-wise Energy Available and Transmission & Distribution Losses - Central Electricity Authority’s figures (01-02 to 08-09) 109
77. State-wise Transmission & Distribution Losses – SEBs (02-03 to 11-12) 11078. Installed Capacity State Sector & UTs (in MW) – 2000-01 to 2010-11 11179. Plant Load factor of Thermal Power Plants : 2001-02 to 2010-11 (CEA) 112
80. Average Power Tariffs in for Agriculture & Industry for Selected States (Rs. Per Unit) 2007-08 to 2011-12 112
81. Consumer Category-wise Average Tariff per Unit (A.P. 2011-12) 11482. State-wise Irrigation Potential, Flood Control, Hydro Power Potential 115
State Plans Related
83. Real Growth Rate of States in GSDP at Constant price (94-95 to 11-12) 117
84. Gross Domestic Product at Current prices & % Growth over previous year (as on 15-03-2012 - CSO) 118
85. Gross Domestic Product at Constant (1999-2000) prices & % Growth over previous year (as on 15-03-2012 - CSO) 119
86. Net State Domestic Product at Current prices & % Growth over previous year (as on 15-03-2012 - CSO) 120
87. Net State Product at Constant (1999-2000) prices & % Growth over previous year (as on 15-03-2012 - CSO) 121
88. Per Capita Net State Domestic Product at Current prices & % Growth over previous (as on 15-03-2012 - CSO) 122
89. Per Capita Net State Domestic Product at Constant (1999-2000) prices & % Growth over previous year (as on 15-03-2012 - CSO) 123
90. Growth Rate % of States in GSDP at Constant price (94-95 to 11-12) 124
iv
No. Title Page
91. Growth Rate % of States in GSDP at Current price (94-95 to 11-12) 125
92. Fiscal Deficit as % of GSDP of States (97-98 to 11-12) (as on 15-03-2012 - CSO) 126
93. Revenue Deficit as % of GSDP of States (97-98 to 11-12) 127
94. Own Tax Revenue as % of GSDP of States (97-98 to 11-12) (as on 15-03-2012 - CSO) 128
95. Public Debt (Total Outstanding Liabilities) as % of GSDP of States (97-98 to 11-12) (as on 15-03-2012 - CSO) 129
96. Public Debt (Total Outstanding Liabilities) as % of Total Revenue Receipt for States (97-98 to 11-12) (as on 15-03-2012 - CSO) 130
97. Total Revenue Receipt as % of GSDP (97-98 to 11-12) 13198. Real Growth Rate of States at % GSDP and other Valuable Parameters 132
Social Sector - Health & Family Welfare Related
99. Demographic Profile of Schedule Caste & Schedule Tribe of States/UTs based on Census 2001 133
100. Demographic Indicators – Health (CBR, CDR, IMR, TFR, MMR, CPR etc.) – States at a Glance – based on 2009 & 2011 Parameters 134
101. Birth Rate, Death Rate, Natural Growth Rate, Infant Mortality Rate & Total Fertility Rate by Residence for States/UTs (1972 to 2011) 136
102. Neo Mortality Rate, IMR, CMR, TFR, Institutional Delivery, Vaccination etc. during NFHS-I, NFHS-II & NFHS-III (92-93, 98-99 & 2009-11) 138
103. SRS Figures at a Glance, India (SRS-2010), April, 2012 : Summary Report (includes, TFR, CBR, CDR, IMR, Sex Ratio and others) 139
104. Percentage Change from 1998-00 to 2008-10 in IMR, TFR, CBR, CDR, IMR and other parameters for India (based on SRS-2011), Oct. , 2012 142
105. SRS Bulletin – Estimated Birth rate, Death rate, Natural Growth rate & IMR State-wise for 2010 - SRS 2011 (October, 2012) 144
106. Death Rate by Sex & Residence, 2011 - (SRS – October, 2012) 146107. Infant Mortality Rate by Sex & Residence, 2011 - (SRS – Oct., 2012) 147
108. Annual Estimates of Birth rate by Residence, India & bigger States 2004-10 (Total, Rural & Urban) – (SRS – October, 2012) 148
109. Annual Estimates of Death rate by Residence, India & bigger States 2004-10 (Total, Rural & Urban) – (SRS – October, 2012) 149
110. Annual Estimates of Infant Mortality rate by Residence, India & bigger States 2004-10 (Total, Rural & Urban) – (SRS – October, 2012) 150
111. Annual Estimates of Total Fertility rate by Residence, India & bigger States 2004-10 (Total, Rural & Urban) – SRS 2010 (April, 2012) 151
112. Sex Ratio at Birth by Residence, India & bigger States 2004-10 (Total, Rural & Urban) – (SRS – October, 2012) 152
113. Sex Ratio of Child (age group 0-4) by Residence, India & bigger States 2004-10 (Total, Rural & Urban) – SRS 2010 (April, 2012) 153
114. Percent of Live Births where the mothers received medical attention of delivery either at Govt. Hospitals or at Private Hospitals, India & Bigger States, 2004-10, (Total, Rural & Urban) – SRS 2011 (October, 2012)
154
115. Percent of Deaths where the medical attention received before death either at Govt. Hospitals or at Private Hospitals, India & Bigger States, 2004-10, (Total, Rural & Urban) – SRS 2011 (October, 2012)
155
116. Sample Registration System (SRS) Estimates of Infant Mortality Rate (IMR) – 1981-2011 (SRS Bulletin – upto October, 2012) 156
117. Infant Mortality Rates for States & UTs – Male, Female & Total (1961, 2006, 2008 & 2011)
157
v
No. Title Page
118. National Family Health Survey (NFHS) Estimates of IMR for States & Union Territories (92-93, 98-99 and 2005-06) 158
119. Maternal Mortality Ratio (MMR) in India – SRS Bulletin 2007-09 upto December, 2011 159
120. SRS Estimates of Total Fertility Rate (TFR) for States & UTs (71 to 10) 160
121. NFHS & District Rapid Household Survey Estimates of Institutional Delivery & Safe Delivery for States & UTs (92-93, 98-99 and 03-04) 161
122. NFHS & District Rapid Household Survey Estimates of Full Vaccination Complete Immunisation for States & UTs (92-93, 98-99, 03-04 & 05-06) 162
123. Selected Key Indicators by State – Coverage Evaluation Report – 2009 by UNICEF 163
124. Life Expectancy at Birth for in India & Major States (1997-2001 and 1997-2002 and 1999-2003, 2002-07) 164
125. Projected Levels of Expectation of Life at Birth in India & Major States (2001-05 to 2021-25) 164
126. State-wise Sex Ratio 1901-2011 as per Census 2011 165
127. Nutritional Status of Children by State - NFHS Estimates (92-93, 98-99 and 05-06) 166
128. Trends in Nutritional Status of Children 167
129. Low Body Mass Index (BMI) and Anaemia in Women (%) by States -NFHS Estimates (98-99 and 05-06) 168
130. NFHS & District Level Household & Facility Survey – Note for DLHS - III 169 Social Sector – Drinking Water & Education
131. Access to Safe Drinking Water in Households for States (81, 91 & 01) 171132. Coverage with Water Supply & Sanitation Facility (61 to 01) 172133. Selected Indicators of Human Development in India for Major States 173134. State-wise Literacy Rates (51 to 11) 174135. Gross Enrolment Ratio at Primary and Middle School Stages (50 to 10) 175136. Gross Enrolment Ratio in Classes I-V; VI-VIII & I-VIII in States (09-10) 176137. Drop-out Rates in Classes I-V, I-VIII and I-X in States (09-10) 177
138. Gross Enrolment and Net Enrolment Ratio at Primary & Upper Primary Level (2007-08 to 2009-10) 178
139. Retention Rate, Gross Completion Rate, Gross and Net Enrolment Ratio at Primary Level (2007-08 to 2009-10) 179
140. Total Number of Recognised Educational Institutes in India (09-10) 180
141. Performance of States in India (Rural) - ACER Report 2009 (% of Children who can Read, Read English & Do Arithmetic) 181
142. Education specific Mean Years of Schooling of Labour Force i.e. LFPR per 1000 for Persons of Age15+according to Usual Status (PS+SS) : 2007-08 (Rural+Urban)
182
143. Population of States in India (1951-2011) – in Thousand 183 World Economy & G-20 Countries Related
144. GDP and PPP-GDP Projections for Some Countries for 2022 184
145. Real GDP Growth Rates for some emerging market economies at Constant Prices - WEO Database, October, 2012 185
146. Real GDP Growth Rates for some emerging market economies from 1970 to 2010 – Summary – WEO Database, October, 2012 186
vi
No. Title Page
147. Real GDP Growth Rates for G-20 Countries from 1999 to 2010 187
148. Gross Domestic Product, Current Prices for G-20 Countries (in US $ Billion) – 1981-2011; October, 2012 190
149. Major Countries : General Government Gross Debt (% of GDP) - 1981-2011 191
150. Gross Domestic Product based on Purchasing-Power-Parity (PPP) valuation of GDP for G-20 Countries (in US $ Billion) – 1981-2011 192
151. Gross Domestic Product on Purchasing-Power-Parity (PPP) per Capita for G-20 Countries (in US $ Billion) – 1981-2011 193
152. Major Countries : GDP based on Purchasing-Power-Parity – Valuation of Country GDP – 1981-2011 194
153. Major Countries : GDP based at Constant Prices (%) – 1981-2011 195
154. Major Countries : Gross National Savings as % of GDP – 1981-2011 196
155. Major Countries : Investment as % of GDP – 1981-2011 197
156. Major Countries : Unemployment Rate as % of Labour Force – 81-2011 198
157. Major Countries : Inflation Average Consumer Prices (%) – 1981-2011 199
158. G20 Economies : Current Account Balance (% of GDP) - WEO database April, 2012 200
159. G20 Economies : General Government Gross Debt (% of GDP) - WEO database April, 2012 2019
160. G20 Economies : General Government Net Debt (% of GDP) - WEO database October, 2012 202
161. G20 Economies : General Government Balance – Net Lending / Borrowings (as % of GDP) WEO database October, 2012 203
162. G20 Economies : General Government Revenue (% of GDP) - WEO database October, 2012 204
163. G20 Economies : General Government Total Expenditure (% of GDP) - WEO database October, 2012 205
164. G20 Economies : Gross Domestic Product based on Purchasing-Power-parity (PPP) as % of world income for G-20 Countries (as % of World Income) – 00-16, WEO Outlook database October, 2012
206
165. G20 Economies : Gross National Savings as Percent of GDP - G20 Economies : Inflation – End of Period Consumer Prices (Percent Change) WEO database October, 2012
207
166. G20 Economies : Inflation – Average Consumer Prices (Percent Change) WEO database October, 2012 208
167. G20 Economies : Inflation – End of Period Consumer Prices (Percent Change) WEO database October, 2012 209
168. G20 Economies : Total Investment as Percent of GDP – WEO database October, 2012 210
169. G20 Economies : Unemployment Rate as Percent of GDP – WEO database October, 2012 211
170. Gross Domestic Product, Constant Prices for G-20 Countries based on Purchasing-Power-Parity (PPP) as % of G-20 Income – 1981-2010 212
vii
No. Title Page
171. G-20 Economies : Gross Domestic Product (GDP) – Percent Change – WEO Database, October, 2012 213
172. G-20 Economies : Gross Domestic Product, Projected at 2010 Prices (in billion US $) 214
173. GDP at 2009 Purchasing Power Parity Projected upto 2022 (in Billion International Dollar) (WEO Database, October, 2012) 215
174. GDP Share of G-20 Countries Projected upto 2022; GDP of Major Countries, World Share and Projection upto 2022 (WEO Database) 216
175. Economic Indicators at a Glance for G20 Countries; WEO Database 218
176. Overview of the World Economic Outlook Projections for 2012 & 2013 & Summary of World Output Projections upto 2016 (February, 2012 – WEO Database)
227
177. Fiscal Indicators, 2008-13 (Source : IMF; July, 2012) 230
178. GDP Growth – Summary Major Groups : 2005-2014 for Advanced Economies, Emerging Countries, G-20 etc. – (WEO Database) 232
179. Economy Ranking of countries based on ease of doing business – June, 2012
233
180. Economy Ranking of countries based on ease of doing business – June, 2011 233
Census 2011 related Demographic & Amenities Tables
181. India at a Glance : Census 2011 Provisional Statistics data State-wise 241
182. Census 2011- Total, Rural, Urban Population Related Tables States-wise 242
183. Sex Ratio at Birth during the period 2006-08, India and States/UTs 244
184. Census 2011 (Provisional)- Demographic details, Literate Population (Total, Rural & Urban), etc. 246
185. Population and Decadal Growth Rate based on Census-2011, etc. 250
186. Houses, Household Amenities & Assets – Census 2011 Figures at a Glance – India (Total, Rural and Urban)
251
187. Census Houses and their Use : Census 2011 – State-wise 256
188. Distribution of Households by material of roof, wall and dwelling rooms etc. : Census 2011 – State-wise 257
189. Household Size, Number of Married Couples : Census 2011 – State-wise 259
190. Distribution of Households by Drinking Water Facility, Source of Lighting, Type of Latrine Facility, Fuels used for Cooking etc. : Census 2011 – State-wise
261
191. Households having Assets such as Computer, Laptop, Telephone and Mobile Facility etc. : Census 2011 – State-wise 265
192. Banking Services and Ownership Status : Census 2011 – State-wise 256
**************
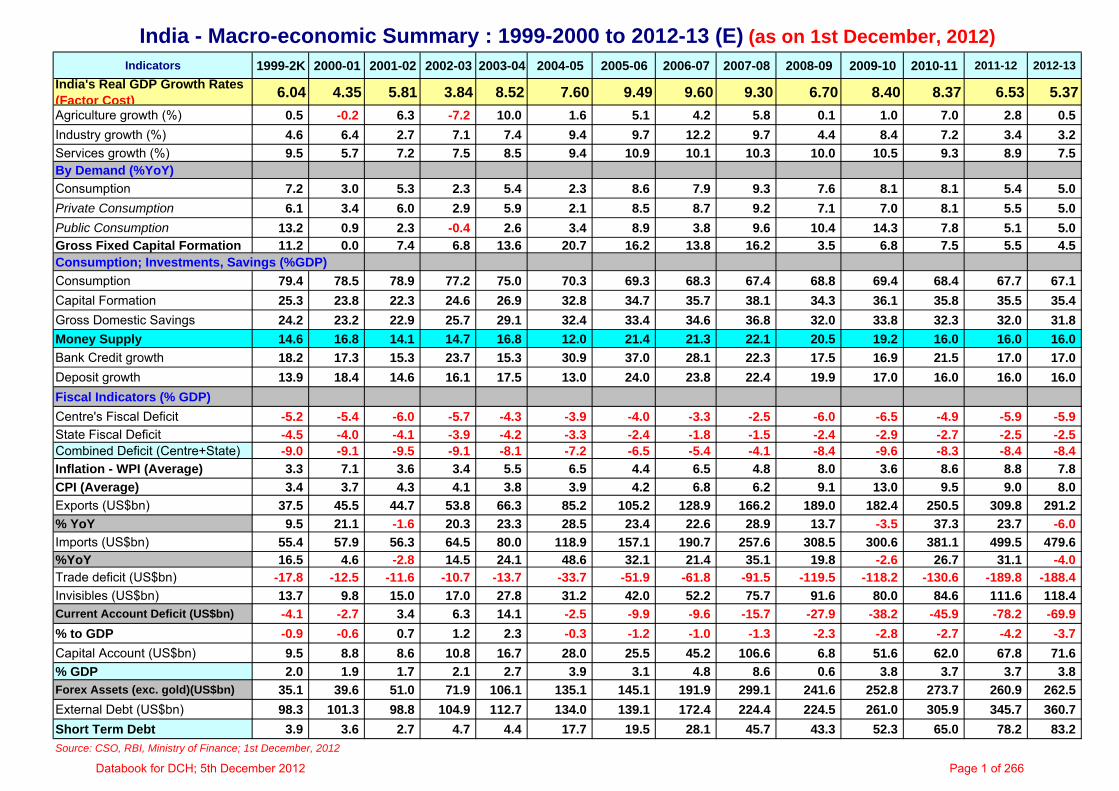
Indicators 1999-2K 2000-01 2001-02 2002-03 2003-04 2004-05 2005-06 2006-07 2007-08 2008-09 2009-10 2010-11 2011-12 2012-13
India's Real GDP Growth Rates
(Factor Cost)6.04 4.35 5.81 3.84 8.52 7.60 9.49 9.60 9.30 6.70 8.40 8.37 6.53 5.37
Agriculture growth (%) 0.5 -0.2 6.3 -7.2 10.0 1.6 5.1 4.2 5.8 0.1 1.0 7.0 2.8 0.5
Industry growth (%) 4.6 6.4 2.7 7.1 7.4 9.4 9.7 12.2 9.7 4.4 8.4 7.2 3.4 3.2
Services growth (%) 9.5 5.7 7.2 7.5 8.5 9.4 10.9 10.1 10.3 10.0 10.5 9.3 8.9 7.5
By Demand (%YoY)
Consumption 7.2 3.0 5.3 2.3 5.4 2.3 8.6 7.9 9.3 7.6 8.1 8.1 5.4 5.0
Private Consumption 6.1 3.4 6.0 2.9 5.9 2.1 8.5 8.7 9.2 7.1 7.0 8.1 5.5 5.0
Public Consumption 13.2 0.9 2.3 -0.4 2.6 3.4 8.9 3.8 9.6 10.4 14.3 7.8 5.1 5.0
Gross Fixed Capital Formation 11.2 0.0 7.4 6.8 13.6 20.7 16.2 13.8 16.2 3.5 6.8 7.5 5.5 4.5
Consumption; Investments, Savings (%GDP)
Consumption 79.4 78.5 78.9 77.2 75.0 70.3 69.3 68.3 67.4 68.8 69.4 68.4 67.7 67.1
Capital Formation 25.3 23.8 22.3 24.6 26.9 32.8 34.7 35.7 38.1 34.3 36.1 35.8 35.5 35.4
Gross Domestic Savings 24.2 23.2 22.9 25.7 29.1 32.4 33.4 34.6 36.8 32.0 33.8 32.3 32.0 31.8
Money Supply 14.6 16.8 14.1 14.7 16.8 12.0 21.4 21.3 22.1 20.5 19.2 16.0 16.0 16.0
Bank Credit growth 18.2 17.3 15.3 23.7 15.3 30.9 37.0 28.1 22.3 17.5 16.9 21.5 17.0 17.0
Deposit growth 13.9 18.4 14.6 16.1 17.5 13.0 24.0 23.8 22.4 19.9 17.0 16.0 16.0 16.0
Fiscal Indicators (% GDP)
Centre's Fiscal Deficit -5.2 -5.4 -6.0 -5.7 -4.3 -3.9 -4.0 -3.3 -2.5 -6.0 -6.5 -4.9 -5.9 -5.9
State Fiscal Deficit -4.5 -4.0 -4.1 -3.9 -4.2 -3.3 -2.4 -1.8 -1.5 -2.4 -2.9 -2.7 -2.5 -2.5
Combined Deficit (Centre+State) -9.0 -9.1 -9.5 -9.1 -8.1 -7.2 -6.5 -5.4 -4.1 -8.4 -9.6 -8.3 -8.4 -8.4
Inflation - WPI (Average) 3.3 7.1 3.6 3.4 5.5 6.5 4.4 6.5 4.8 8.0 3.6 8.6 8.8 7.8
CPI (Average) 3.4 3.7 4.3 4.1 3.8 3.9 4.2 6.8 6.2 9.1 13.0 9.5 9.0 8.0
Exports (US$bn) 37.5 45.5 44.7 53.8 66.3 85.2 105.2 128.9 166.2 189.0 182.4 250.5 309.8 291.2
% YoY 9.5 21.1 -1.6 20.3 23.3 28.5 23.4 22.6 28.9 13.7 -3.5 37.3 23.7 -6.0
Imports (US$bn) 55.4 57.9 56.3 64.5 80.0 118.9 157.1 190.7 257.6 308.5 300.6 381.1 499.5 479.6
%YoY 16.5 4.6 -2.8 14.5 24.1 48.6 32.1 21.4 35.1 19.8 -2.6 26.7 31.1 -4.0
Trade deficit (US$bn) -17.8 -12.5 -11.6 -10.7 -13.7 -33.7 -51.9 -61.8 -91.5 -119.5 -118.2 -130.6 -189.8 -188.4
Invisibles (US$bn) 13.7 9.8 15.0 17.0 27.8 31.2 42.0 52.2 75.7 91.6 80.0 84.6 111.6 118.4
Current Account Deficit (US$bn) -4.1 -2.7 3.4 6.3 14.1 -2.5 -9.9 -9.6 -15.7 -27.9 -38.2 -45.9 -78.2 -69.9
% to GDP -0.9 -0.6 0.7 1.2 2.3 -0.3 -1.2 -1.0 -1.3 -2.3 -2.8 -2.7 -4.2 -3.7
Capital Account (US$bn) 9.5 8.8 8.6 10.8 16.7 28.0 25.5 45.2 106.6 6.8 51.6 62.0 67.8 71.6
% GDP 2.0 1.9 1.7 2.1 2.7 3.9 3.1 4.8 8.6 0.6 3.8 3.7 3.7 3.8
Forex Assets (exc. gold)(US$bn) 35.1 39.6 51.0 71.9 106.1 135.1 145.1 191.9 299.1 241.6 252.8 273.7 260.9 262.5
External Debt (US$bn) 98.3 101.3 98.8 104.9 112.7 134.0 139.1 172.4 224.4 224.5 261.0 305.9 345.7 360.7
Short Term Debt 3.9 3.6 2.7 4.7 4.4 17.7 19.5 28.1 45.7 43.3 52.3 65.0 78.2 83.2
Source: CSO, RBI, Ministry of Finance; 1st December, 2012
India - Macro-economic Summary : 1999-2000 to 2012-13 (E) (as on 1st December, 2012)
Databook for DCH; 5th December 2012 Page 1 of 266
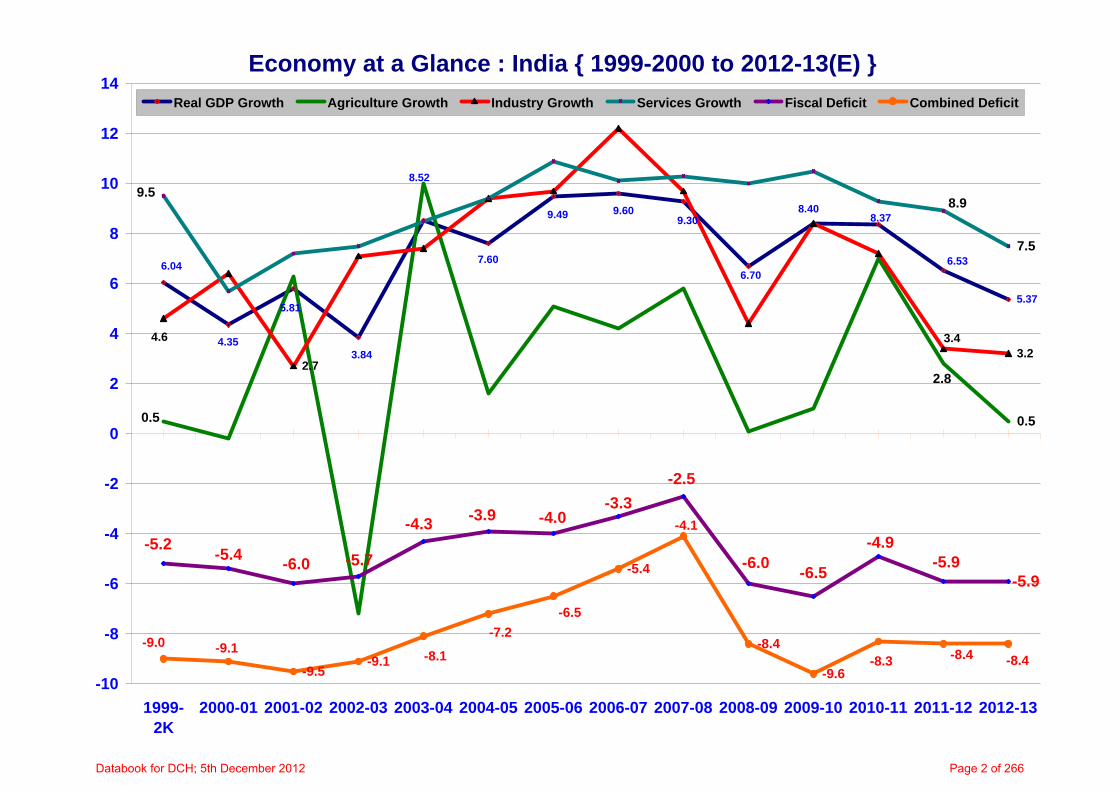
Economy at a Glance : India { 1999-2000 to 2012-13(E) }
5.37
2.73.2
-5.9
-9.5 -9.1
-5.4
-8.4
-9.6
6.536.04
4.35
5.81
3.84
8.52
7.60
9.49 9.609.30
6.70
8.408.37
0.50.5
2.8
4.6 3.4
7.5
9.58.9
-5.9 -5.2
-5.4 -6.0 -5.7
-4.3 -3.9 -4.0
-3.3
-2.5
-6.0 -6.5
-4.9
-8.4
-6.5
-8.1
-7.2
-4.1
-8.4 -8.3
-9.1 -9.0
-10
-8
-6
-4
-2
0
2
4
6
8
10
12
14
1999-
2K
2000-01 2001-02 2002-03 2003-04 2004-05 2005-06 2006-07 2007-08 2008-09 2009-10 2010-11 2011-12 2012-13
Real GDP Growth Agriculture Growth Industry Growth Services Growth Fiscal Deficit Combined Deficit
Databook for DCH; 5th December 2012 Page 2 of 266
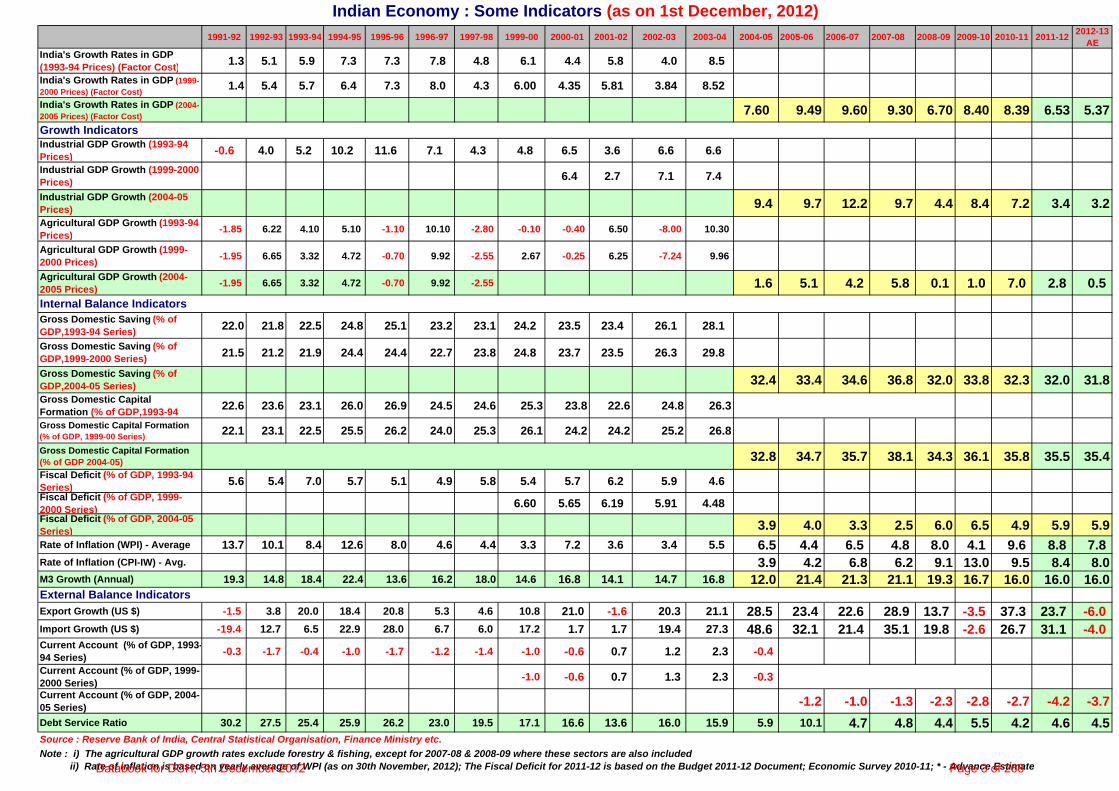
1991-92 1992-93 1993-94 1994-95 1995-96 1996-97 1997-98 1999-00 2000-01 2001-02 2002-03 2003-04 2004-05 2005-06 2006-07 2007-08 2008-09 2009-10 2010-11 2011-122012-13
AE
India's Growth Rates in GDP
(1993-94 Prices) (Factor Cost)1.3 5.1 5.9 7.3 7.3 7.8 4.8 6.1 4.4 5.8 4.0 8.5
India's Growth Rates in GDP (1999-
2000 Prices) (Factor Cost)1.4 5.4 5.7 6.4 7.3 8.0 4.3 6.00 4.35 5.81 3.84 8.52
India's Growth Rates in GDP (2004-
2005 Prices) (Factor Cost)7.60 9.49 9.60 9.30 6.70 8.40 8.39 6.53 5.37
Industrial GDP Growth (1993-94
Prices)-0.6 4.0 5.2 10.2 11.6 7.1 4.3 4.8 6.5 3.6 6.6 6.6
Industrial GDP Growth (1999-2000
Prices)6.4 2.7 7.1 7.4
Industrial GDP Growth (2004-05
Prices)9.4 9.7 12.2 9.7 4.4 8.4 7.2 3.4 3.2
Agricultural GDP Growth (1993-94
Prices)-1.85 6.22 4.10 5.10 -1.10 10.10 -2.80 -0.10 -0.40 6.50 -8.00 10.30
Agricultural GDP Growth (1999-
2000 Prices)-1.95 6.65 3.32 4.72 -0.70 9.92 -2.55 2.67 -0.25 6.25 -7.24 9.96
Agricultural GDP Growth (2004-
2005 Prices)-1.95 6.65 3.32 4.72 -0.70 9.92 -2.55 1.6 5.1 4.2 5.8 0.1 1.0 7.0 2.8 0.5
Gross Domestic Saving (% of
GDP,1993-94 Series)22.0 21.8 22.5 24.8 25.1 23.2 23.1 24.2 23.5 23.4 26.1 28.1
Gross Domestic Saving (% of
GDP,1999-2000 Series)21.5 21.2 21.9 24.4 24.4 22.7 23.8 24.8 23.7 23.5 26.3 29.8
Gross Domestic Saving (% of
GDP,2004-05 Series)32.4 33.4 34.6 36.8 32.0 33.8 32.3 32.0 31.8
Gross Domestic Capital
Formation (% of GDP,1993-94 22.6 23.6 23.1 26.0 26.9 24.5 24.6 25.3 23.8 22.6 24.8 26.3
Gross Domestic Capital Formation
(% of GDP, 1999-00 Series)22.1 23.1 22.5 25.5 26.2 24.0 25.3 26.1 24.2 24.2 25.2 26.8
Gross Domestic Capital Formation
(% of GDP 2004-05)32.8 34.7 35.7 38.1 34.3 36.1 35.8 35.5 35.4
Fiscal Deficit (% of GDP, 1993-94
Series)5.6 5.4 7.0 5.7 5.1 4.9 5.8 5.4 5.7 6.2 5.9 4.6
Fiscal Deficit (% of GDP, 1999-
2000 Series)6.60 5.65 6.19 5.91 4.48
Fiscal Deficit (% of GDP, 2004-05
Series)3.9 4.0 3.3 2.5 6.0 6.5 4.9 5.9 5.9
Rate of Inflation (WPI) - Average 13.7 10.1 8.4 12.6 8.0 4.6 4.4 3.3 7.2 3.6 3.4 5.5 6.5 4.4 6.5 4.8 8.0 4.1 9.6 8.8 7.8
Rate of Inflation (CPI-IW) - Avg. 3.9 4.2 6.8 6.2 9.1 13.0 9.5 8.4 8.0M3 Growth (Annual) 19.3 14.8 18.4 22.4 13.6 16.2 18.0 14.6 16.8 14.1 14.7 16.8 12.0 21.4 21.3 21.1 19.3 16.7 16.0 16.0 16.0
Export Growth (US $) -1.5 3.8 20.0 18.4 20.8 5.3 4.6 10.8 21.0 -1.6 20.3 21.1 28.5 23.4 22.6 28.9 13.7 -3.5 37.3 23.7 -6.0
Import Growth (US $) -19.4 12.7 6.5 22.9 28.0 6.7 6.0 17.2 1.7 1.7 19.4 27.3 48.6 32.1 21.4 35.1 19.8 -2.6 26.7 31.1 -4.0 Current Account (% of GDP, 1993-
94 Series)-0.3 -1.7 -0.4 -1.0 -1.7 -1.2 -1.4 -1.0 -0.6 0.7 1.2 2.3 -0.4
Current Account (% of GDP, 1999-
2000 Series)-1.0 -0.6 0.7 1.3 2.3 -0.3
Current Account (% of GDP, 2004-
05 Series)-1.2 -1.0 -1.3 -2.3 -2.8 -2.7 -4.2 -3.7
Debt Service Ratio 30.2 27.5 25.4 25.9 26.2 23.0 19.5 17.1 16.6 13.6 16.0 15.9 5.9 10.1 4.7 4.8 4.4 5.5 4.2 4.6 4.5
ii) Rate of inflation is based on yearly average of WPI (as on 30th November, 2012); The Fiscal Deficit for 2011-12 is based on the Budget 2011-12 Document; Economic Survey 2010-11; * - Advance EstimateNote : i) The agricultural GDP growth rates exclude forestry & fishing, except for 2007-08 & 2008-09 where these sectors are also included
Indian Economy : Some Indicators (as on 1st December, 2012)
Source : Reserve Bank of India, Central Statistical Organisation, Finance Ministry etc.
Growth Indicators
Internal Balance Indicators
External Balance Indicators
Databook for DCH; 5th December 2012 Page 3 of 266
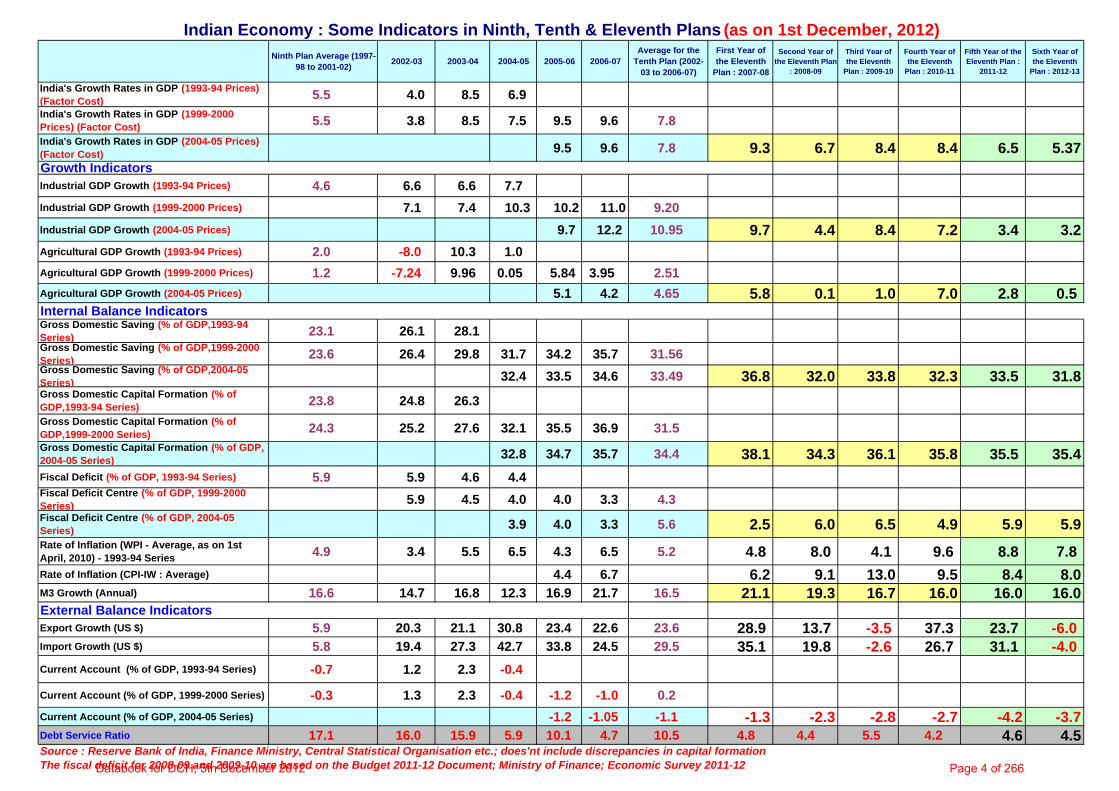
Ninth Plan Average (1997-
98 to 2001-02)2002-03 2003-04 2004-05 2005-06 2006-07
Average for the
Tenth Plan (2002-
03 to 2006-07)
First Year of
the Eleventh
Plan : 2007-08
Second Year of
the Eleventh Plan
: 2008-09
Third Year of
the Eleventh
Plan : 2009-10
Fourth Year of
the Eleventh
Plan : 2010-11
Fifth Year of the
Eleventh Plan :
2011-12
Sixth Year of
the Eleventh
Plan : 2012-13
India's Growth Rates in GDP (1993-94 Prices)
(Factor Cost)5.5 4.0 8.5 6.9
India's Growth Rates in GDP (1999-2000
Prices) (Factor Cost)5.5 3.8 8.5 7.5 9.5 9.6 7.8
India's Growth Rates in GDP (2004-05 Prices)
(Factor Cost)9.5 9.6 7.8 9.3 6.7 8.4 8.4 6.5 5.37
Industrial GDP Growth (1993-94 Prices) 4.6 6.6 6.6 7.7
Industrial GDP Growth (1999-2000 Prices) 7.1 7.4 10.3 10.2 11.0 9.20
Industrial GDP Growth (2004-05 Prices) 9.7 12.2 10.95 9.7 4.4 8.4 7.2 3.4 3.2
Agricultural GDP Growth (1993-94 Prices) 2.0 -8.0 10.3 1.0
Agricultural GDP Growth (1999-2000 Prices) 1.2 -7.24 9.96 0.05 5.84 3.95 2.51
Agricultural GDP Growth (2004-05 Prices) 5.1 4.2 4.65 5.8 0.1 1.0 7.0 2.8 0.5
Gross Domestic Saving (% of GDP,1993-94
Series)23.1 26.1 28.1
Gross Domestic Saving (% of GDP,1999-2000
Series)23.6 26.4 29.8 31.7 34.2 35.7 31.56
Gross Domestic Saving (% of GDP,2004-05
Series)32.4 33.5 34.6 33.49 36.8 32.0 33.8 32.3 33.5 31.8
Gross Domestic Capital Formation (% of
GDP,1993-94 Series)23.8 24.8 26.3
Gross Domestic Capital Formation (% of
GDP,1999-2000 Series)24.3 25.2 27.6 32.1 35.5 36.9 31.5
Gross Domestic Capital Formation (% of GDP,
2004-05 Series)32.8 34.7 35.7 34.4 38.1 34.3 36.1 35.8 35.5 35.4
Fiscal Deficit (% of GDP, 1993-94 Series) 5.9 5.9 4.6 4.4Fiscal Deficit Centre (% of GDP, 1999-2000
Series)5.9 4.5 4.0 4.0 3.3 4.3
Fiscal Deficit Centre (% of GDP, 2004-05
Series)3.9 4.0 3.3 5.6 2.5 6.0 6.5 4.9 5.9 5.9
Rate of Inflation (WPI - Average, as on 1st
April, 2010) - 1993-94 Series4.9 3.4 5.5 6.5 4.3 6.5 5.2 4.8 8.0 4.1 9.6 8.8 7.8
Rate of Inflation (CPI-IW : Average) 4.4 6.7 6.2 9.1 13.0 9.5 8.4 8.0M3 Growth (Annual) 16.6 14.7 16.8 12.3 16.9 21.7 16.5 21.1 19.3 16.7 16.0 16.0 16.0
Export Growth (US $) 5.9 20.3 21.1 30.8 23.4 22.6 23.6 28.9 13.7 -3.5 37.3 23.7 -6.0 Import Growth (US $) 5.8 19.4 27.3 42.7 33.8 24.5 29.5 35.1 19.8 -2.6 26.7 31.1 -4.0
Current Account (% of GDP, 1993-94 Series) -0.7 1.2 2.3 -0.4
Current Account (% of GDP, 1999-2000 Series) -0.3 1.3 2.3 -0.4 -1.2 -1.0 0.2
Current Account (% of GDP, 2004-05 Series) -1.2 -1.05 -1.1 -1.3 -2.3 -2.8 -2.7 -4.2 -3.7Debt Service Ratio 17.1 16.0 15.9 5.9 10.1 4.7 10.5 4.8 4.4 5.5 4.2 4.6 4.5Source : Reserve Bank of India, Finance Ministry, Central Statistical Organisation etc.; does'nt include discrepancies in capital formationThe fiscal deficit for 2008-09 and 2009-10 are based on the Budget 2011-12 Document; Ministry of Finance; Economic Survey 2011-12
Growth Indicators
Internal Balance Indicators
External Balance Indicators
Indian Economy : Some Indicators in Ninth, Tenth & Eleventh Plans (as on 1st December, 2012)
Databook for DCH; 5th December 2012 Page 4 of 266
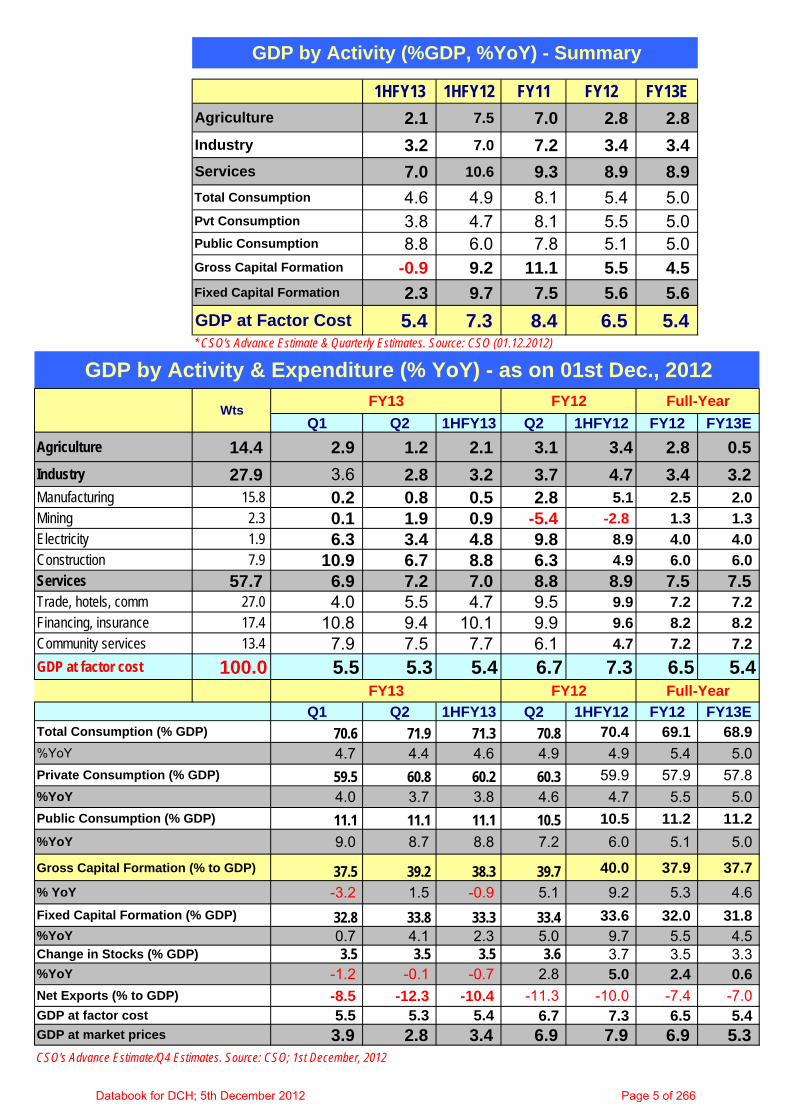
GDP by Activity (%GDP, %YoY) - Summary
1HFY13 1HFY12 FY11 FY12 FY13EAgriculture 2.1 7.5 7.0 2.8 2.8
Industry 3.2 7.0 7.2 3.4 3.4
Services 7.0 10.6 9.3 8.9 8.9
Total Consumption 4.6 4.9 8.1 5.4 5.0Pvt Consumption 3.8 4.7 8.1 5.5 5.0Public Consumption 8.8 6.0 7.8 5.1 5.0Gross Capital Formation -0.9 9.2 11.1 5.5 4.5
Fixed Capital Formation 2.3 9.7 7.5 5.6 5.6
GDP at Factor Cost 5.4 7.3 8.4 6.5 5.4* CSO's Advance Estimate & Quarterly Estimates. Source: CSO (01.12.2012)
GDP by Activity & Expenditure (% YoY) - as on 01st Dec., 2012
WtsFY13 FY12 Full-Year
Q1 Q2 1HFY13 Q2 1HFY12 FY12 FY13E
Agriculture 14.4 2.9 1.2 2.1 3.1 3.4 2.8 0.5
Industry 27.9 3.6 2.8 3.2 3.7 4.7 3.4 3.2
Manufacturing 15.8 0.2 0.8 0.5 2.8 5.1 2.5 2.0
Mining 2.3 0.1 1.9 0.9 -5.4 -2.8 1.3 1.3
Electricity 1.9 6.3 3.4 4.8 9.8 8.9 4.0 4.0
Construction 7.9 10.9 6.7 8.8 6.3 4.9 6.0 6.0
Services 57.7 6.9 7.2 7.0 8.8 8.9 7.5 7.5Trade, hotels, comm 27.0 4.0 5.5 4.7 9.5 9.9 7.2 7.2
Financing, insurance 17.4 10.8 9.4 10.1 9.9 9.6 8.2 8.2
Community services 13.4 7.9 7.5 7.7 6.1 4.7 7.2 7.2
GDP at factor cost 100.0 5.5 5.3 5.4 6.7 7.3 6.5 5.4FY13 FY12 Full-Year
Q1 Q2 1HFY13 Q2 1HFY12 FY12 FY13E
Total Consumption (% GDP) 70.6 71.9 71.3 70.8 70.4 69.1 68.9
%YoY 4.7 4.4 4.6 4.9 4.9 5.4 5.0Private Consumption (% GDP) 59.5 60.8 60.2 60.3 59.9 57.9 57.8%YoY 4.0 3.7 3.8 4.6 4.7 5.5 5.0Public Consumption (% GDP) 11.1 11.1 11.1 10.5 10.5 11.2 11.2
%YoY 9.0 8.7 8.8 7.2 6.0 5.1 5.0
Gross Capital Formation (% to GDP) 37.5 39.2 38.3 39.7 40.0 37.9 37.7
% YoY -3.2 1.5 -0.9 5.1 9.2 5.3 4.6Fixed Capital Formation (% GDP) 32.8 33.8 33.3 33.4 33.6 32.0 31.8
%YoY 0.7 4.1 2.3 5.0 9.7 5.5 4.5Change in Stocks (% GDP) 3.5 3.5 3.5 3.6 3.7 3.5 3.3%YoY -1.2 -0.1 -0.7 2.8 5.0 2.4 0.6
Net Exports (% to GDP) -8.5 -12.3 -10.4 -11.3 -10.0 -7.4 -7.0 GDP at factor cost 5.5 5.3 5.4 6.7 7.3 6.5 5.4
GDP at market prices 3.9 2.8 3.4 6.9 7.9 6.9 5.3
CSO's Advance Estimate/Q4 Estimates. Source: CSO; 1st December, 2012
Databook for DCH; 5th December 2012 Page 5 of 266
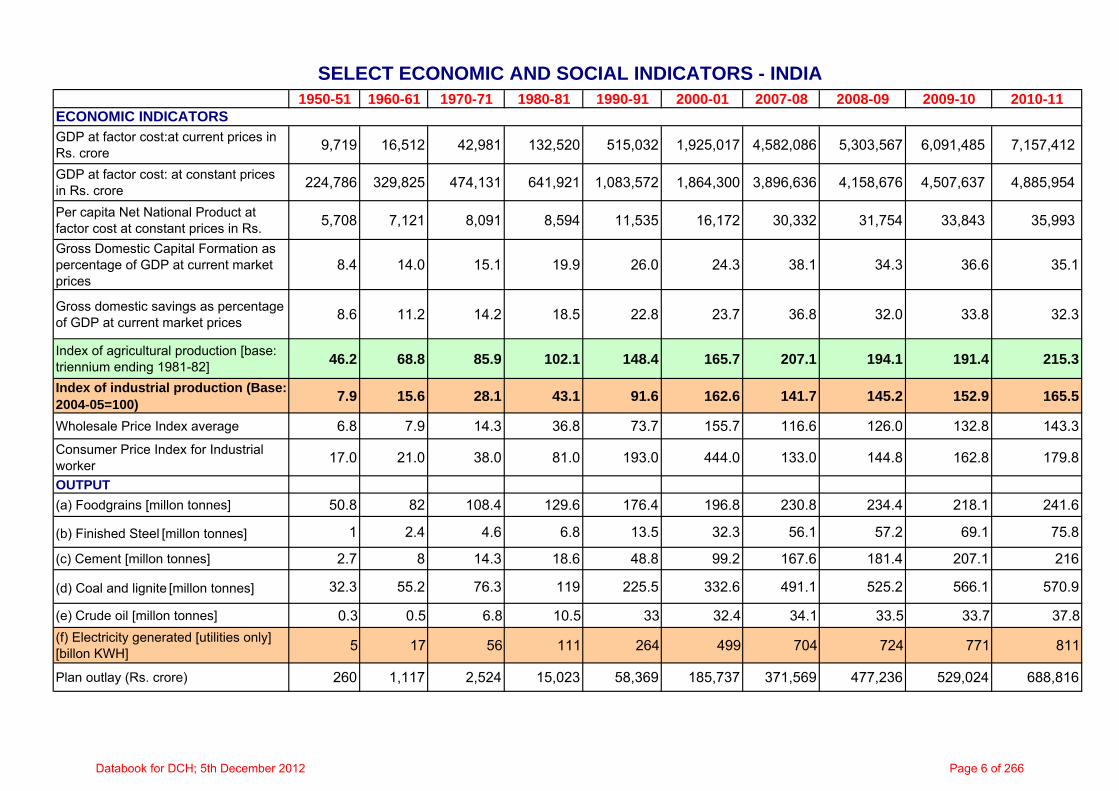
1950-51 1960-61 1970-71 1980-81 1990-91 2000-01 2007-08 2008-09 2009-10 2010-11
GDP at factor cost:at current prices in Rs. crore 9,719 16,512 42,981 132,520 515,032 1,925,017 4,582,086 5,303,567 6,091,485 7,157,412
GDP at factor cost: at constant prices in Rs. crore 224,786 329,825 474,131 641,921 1,083,572 1,864,300 3,896,636 4,158,676 4,507,637 4,885,954
Per capita Net National Product at factor cost at constant prices in Rs. 5,708 7,121 8,091 8,594 11,535 16,172 30,332 31,754 33,843 35,993
Gross Domestic Capital Formation as percentage of GDP at current market prices
8.4 14.0 15.1 19.9 26.0 24.3 38.1 34.3 36.6 35.1
Gross domestic savings as percentage of GDP at current market prices 8.6 11.2 14.2 18.5 22.8 23.7 36.8 32.0 33.8 32.3
Index of agricultural production [base: triennium ending 1981-82] 46.2 68.8 85.9 102.1 148.4 165.7 207.1 194.1 191.4 215.3
Index of industrial production (Base:
2004-05=100)7.9 15.6 28.1 43.1 91.6 162.6 141.7 145.2 152.9 165.5
Wholesale Price Index average 6.8 7.9 14.3 36.8 73.7 155.7 116.6 126.0 132.8 143.3Consumer Price Index for Industrial worker 17.0 21.0 38.0 81.0 193.0 444.0 133.0 144.8 162.8 179.8
OUTPUT
(a) Foodgrains [millon tonnes] 50.8 82 108.4 129.6 176.4 196.8 230.8 234.4 218.1 241.6
(b) Finished Steel [millon tonnes] 1 2.4 4.6 6.8 13.5 32.3 56.1 57.2 69.1 75.8
(c) Cement [millon tonnes] 2.7 8 14.3 18.6 48.8 99.2 167.6 181.4 207.1 216
(d) Coal and lignite [millon tonnes] 32.3 55.2 76.3 119 225.5 332.6 491.1 525.2 566.1 570.9
(e) Crude oil [millon tonnes] 0.3 0.5 6.8 10.5 33 32.4 34.1 33.5 33.7 37.8(f) Electricity generated [utilities only] [billon KWH] 5 17 56 111 264 499 704 724 771 811
Plan outlay (Rs. crore) 260 1,117 2,524 15,023 58,369 185,737 371,569 477,236 529,024 688,816
SELECT ECONOMIC AND SOCIAL INDICATORS - INDIA
ECONOMIC INDICATORS
Databook for DCH; 5th December 2012 Page 6 of 266
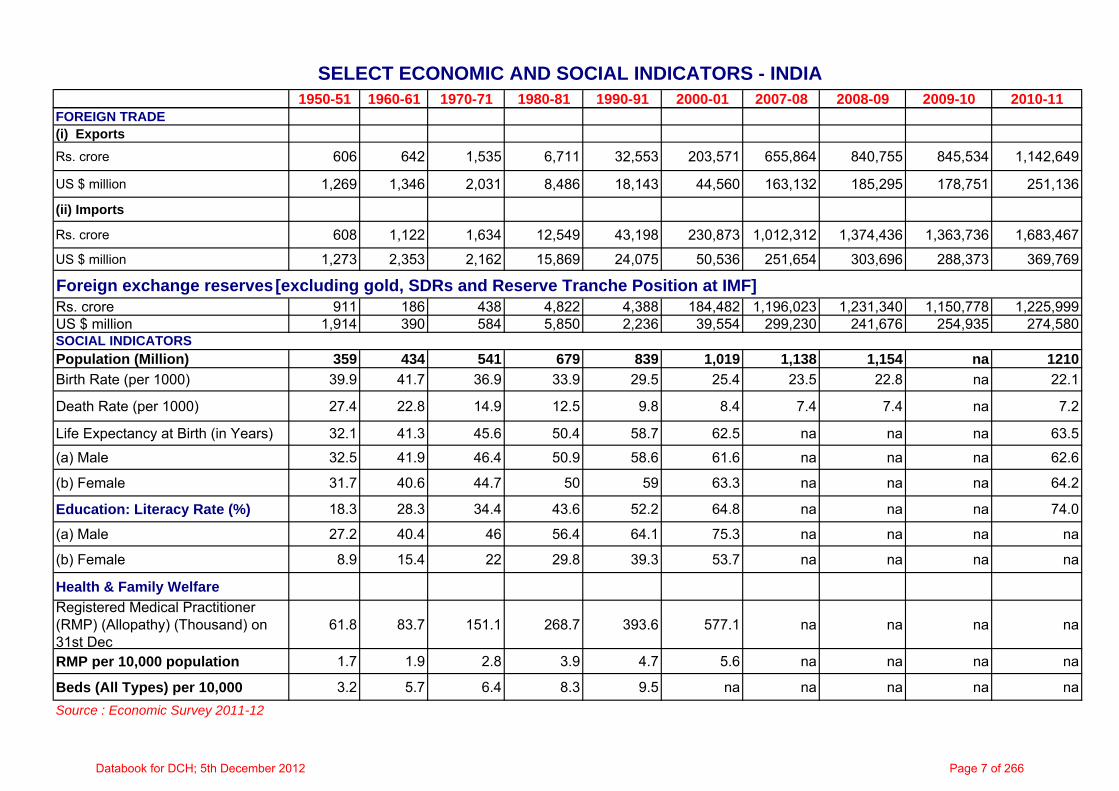
1950-51 1960-61 1970-71 1980-81 1990-91 2000-01 2007-08 2008-09 2009-10 2010-11
SELECT ECONOMIC AND SOCIAL INDICATORS - INDIA
FOREIGN TRADE
(i) Exports
Rs. crore 606 642 1,535 6,711 32,553 203,571 655,864 840,755 845,534 1,142,649
US $ million 1,269 1,346 2,031 8,486 18,143 44,560 163,132 185,295 178,751 251,136
(ii) Imports
Rs. crore 608 1,122 1,634 12,549 43,198 230,873 1,012,312 1,374,436 1,363,736 1,683,467
US $ million 1,273 2,353 2,162 15,869 24,075 50,536 251,654 303,696 288,373 369,769
Rs. crore 911 186 438 4,822 4,388 184,482 1,196,023 1,231,340 1,150,778 1,225,999US $ million 1,914 390 584 5,850 2,236 39,554 299,230 241,676 254,935 274,580
Population (Million) 359 434 541 679 839 1,019 1,138 1,154 na 1210
Birth Rate (per 1000) 39.9 41.7 36.9 33.9 29.5 25.4 23.5 22.8 na 22.1
Death Rate (per 1000) 27.4 22.8 14.9 12.5 9.8 8.4 7.4 7.4 na 7.2
Life Expectancy at Birth (in Years) 32.1 41.3 45.6 50.4 58.7 62.5 na na na 63.5
(a) Male 32.5 41.9 46.4 50.9 58.6 61.6 na na na 62.6
(b) Female 31.7 40.6 44.7 50 59 63.3 na na na 64.2
Education: Literacy Rate (%) 18.3 28.3 34.4 43.6 52.2 64.8 na na na 74.0
(a) Male 27.2 40.4 46 56.4 64.1 75.3 na na na na
(b) Female 8.9 15.4 22 29.8 39.3 53.7 na na na na
Health & Family Welfare
Registered Medical Practitioner (RMP) (Allopathy) (Thousand) on 31st Dec
61.8 83.7 151.1 268.7 393.6 577.1 na na na na
RMP per 10,000 population 1.7 1.9 2.8 3.9 4.7 5.6 na na na na
Beds (All Types) per 10,000 3.2 5.7 6.4 8.3 9.5 na na na na naSource : Economic Survey 2011-12
Foreign exchange reserves [excluding gold, SDRs and Reserve Tranche Position at IMF]
SOCIAL INDICATORS
Databook for DCH; 5th December 2012 Page 7 of 266
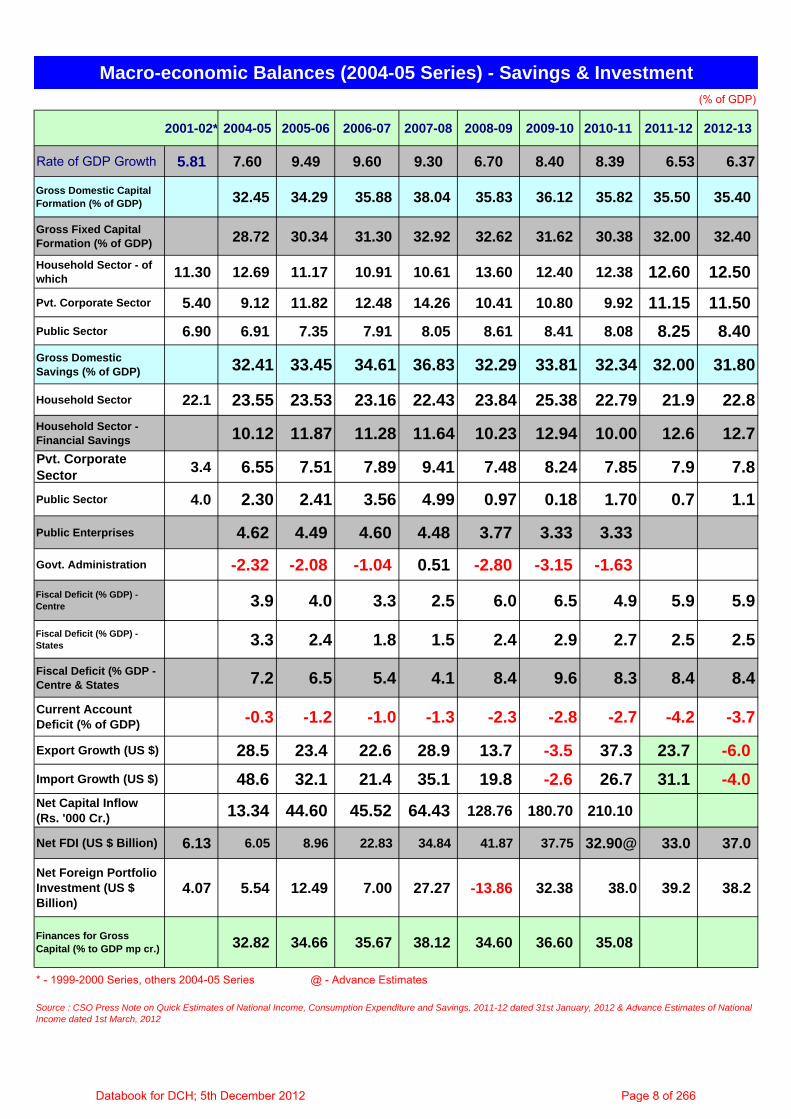
Macro-economic Balances (2004-05 Series) - Savings & Investment
(% of GDP)
2001-02* 2004-05 2005-06 2006-07 2007-08 2008-09 2009-10 2010-11 2011-12 2012-13
Rate of GDP Growth 5.81 7.60 9.49 9.60 9.30 6.70 8.40 8.39 6.53 6.37
Gross Domestic Capital
Formation (% of GDP) 32.45 34.29 35.88 38.04 35.83 36.12 35.82 35.50 35.40
Gross Fixed Capital
Formation (% of GDP) 28.72 30.34 31.30 32.92 32.62 31.62 30.38 32.00 32.40
Household Sector - of
which11.30 12.69 11.17 10.91 10.61 13.60 12.40 12.38 12.60 12.50
Pvt. Corporate Sector 5.40 9.12 11.82 12.48 14.26 10.41 10.80 9.92 11.15 11.50
Public Sector 6.90 6.91 7.35 7.91 8.05 8.61 8.41 8.08 8.25 8.40
Gross Domestic
Savings (% of GDP) 32.41 33.45 34.61 36.83 32.29 33.81 32.34 32.00 31.80
Household Sector 22.1 23.55 23.53 23.16 22.43 23.84 25.38 22.79 21.9 22.8
Household Sector -
Financial Savings 10.12 11.87 11.28 11.64 10.23 12.94 10.00 12.6 12.7
Pvt. Corporate
Sector3.4 6.55 7.51 7.89 9.41 7.48 8.24 7.85 7.9 7.8
Public Sector 4.0 2.30 2.41 3.56 4.99 0.97 0.18 1.70 0.7 1.1
Public Enterprises 4.62 4.49 4.60 4.48 3.77 3.33 3.33
Govt. Administration -2.32 -2.08 -1.04 0.51 -2.80 -3.15 -1.63
Fiscal Deficit (% GDP) -
Centre 3.9 4.0 3.3 2.5 6.0 6.5 4.9 5.9 5.9
Fiscal Deficit (% GDP) -
States 3.3 2.4 1.8 1.5 2.4 2.9 2.7 2.5 2.5
Fiscal Deficit (% GDP -
Centre & States 7.2 6.5 5.4 4.1 8.4 9.6 8.3 8.4 8.4
Current Account
Deficit (% of GDP)-0.3 -1.2 -1.0 -1.3 -2.3 -2.8 -2.7 -4.2 -3.7
Export Growth (US $) 28.5 23.4 22.6 28.9 13.7 -3.5 37.3 23.7 -6.0
Import Growth (US $) 48.6 32.1 21.4 35.1 19.8 -2.6 26.7 31.1 -4.0
Net Capital Inflow
(Rs. '000 Cr.)13.34 44.60 45.52 64.43 128.76 180.70 210.10
Net FDI (US $ Billion) 6.13 6.05 8.96 22.83 34.84 41.87 37.75 32.90@ 33.0 37.0
Net Foreign Portfolio
Investment (US $
Billion)4.07 5.54 12.49 7.00 27.27 -13.86 32.38 38.0 39.2 38.2
Finances for Gross
Capital (% to GDP mp cr.) 32.82 34.66 35.67 38.12 34.60 36.60 35.08
* - 1999-2000 Series, others 2004-05 Series @ - Advance Estimates
Source : CSO Press Note on Quick Estimates of National Income, Consumption Expenditure and Savings, 2011-12 dated 31st January, 2012 & Advance Estimates of National Income dated 1st March, 2012
Databook for DCH; 5th December 2012 Page 8 of 266
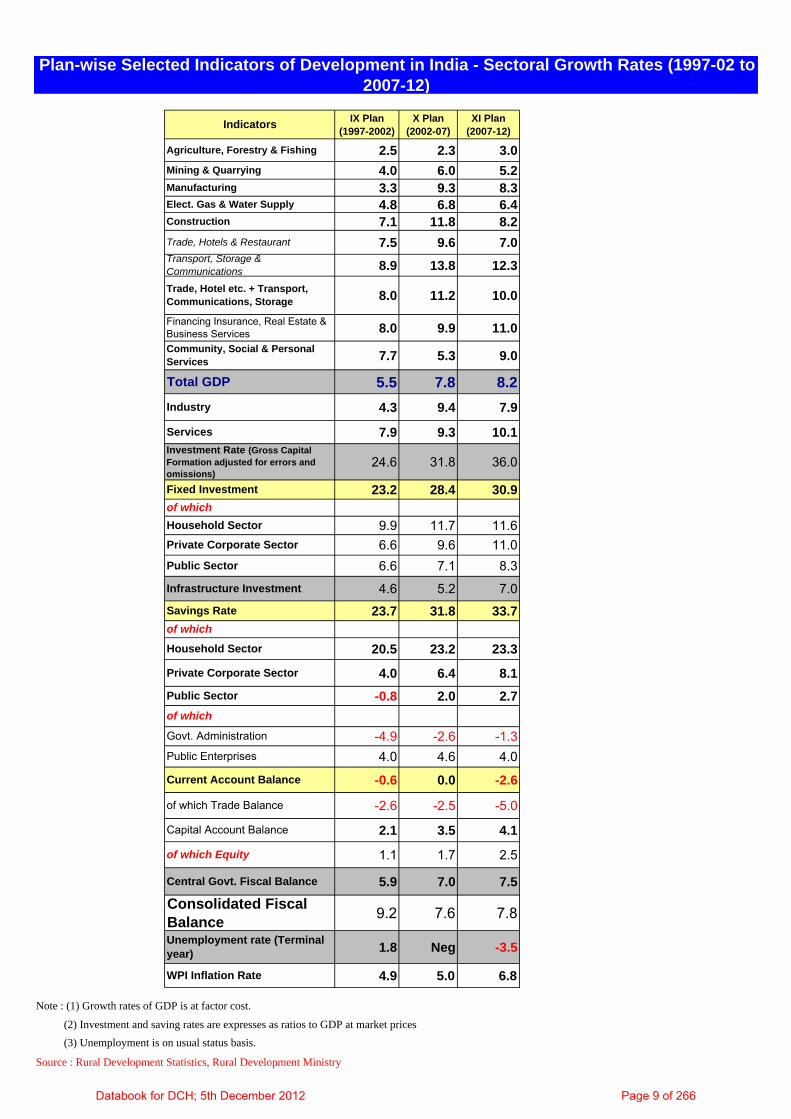
Plan-wise Selected Indicators of Development in India - Sectoral Growth Rates (1997-02 to
2007-12)
IndicatorsIX Plan
(1997-2002)
X Plan
(2002-07)
XI Plan
(2007-12)
Agriculture, Forestry & Fishing 2.5 2.3 3.0
Mining & Quarrying 4.0 6.0 5.2
Manufacturing 3.3 9.3 8.3Elect. Gas & Water Supply 4.8 6.8 6.4
Construction 7.1 11.8 8.2
Trade, Hotels & Restaurant 7.5 9.6 7.0Transport, Storage & Communications 8.9 13.8 12.3
Trade, Hotel etc. + Transport,
Communications, Storage8.0 11.2 10.0
Financing Insurance, Real Estate & Business Services 8.0 9.9 11.0
Community, Social & Personal
Services7.7 5.3 9.0
Total GDP 5.5 7.8 8.2
Industry 4.3 9.4 7.9
Services 7.9 9.3 10.1
Investment Rate (Gross Capital
Formation adjusted for errors and
omissions)24.6 31.8 36.0
Fixed Investment 23.2 28.4 30.9
of whichHousehold Sector 9.9 11.7 11.6 Private Corporate Sector 6.6 9.6 11.0 Public Sector 6.6 7.1 8.3
Infrastructure Investment 4.6 5.2 7.0 Savings Rate 23.7 31.8 33.7
of which
Household Sector 20.5 23.2 23.3
Private Corporate Sector 4.0 6.4 8.1
Public Sector -0.8 2.0 2.7
of which
Govt. Administration -4.9 -2.6 -1.3 Public Enterprises 4.0 4.6 4.0
Current Account Balance -0.6 0.0 -2.6
of which Trade Balance -2.6 -2.5 -5.0
Capital Account Balance 2.1 3.5 4.1
of which Equity 1.1 1.7 2.5
Central Govt. Fiscal Balance 5.9 7.0 7.5
Consolidated Fiscal
Balance9.2 7.6 7.8
Unemployment rate (Terminal
year)1.8 Neg -3.5
WPI Inflation Rate 4.9 5.0 6.8
Note : (1) Growth rates of GDP is at factor cost.
(2) Investment and saving rates are expresses as ratios to GDP at market prices (3) Unemployment is on usual status basis.
Source : Rural Development Statistics, Rural Development Ministry
Databook for DCH; 5th December 2012 Page 9 of 266
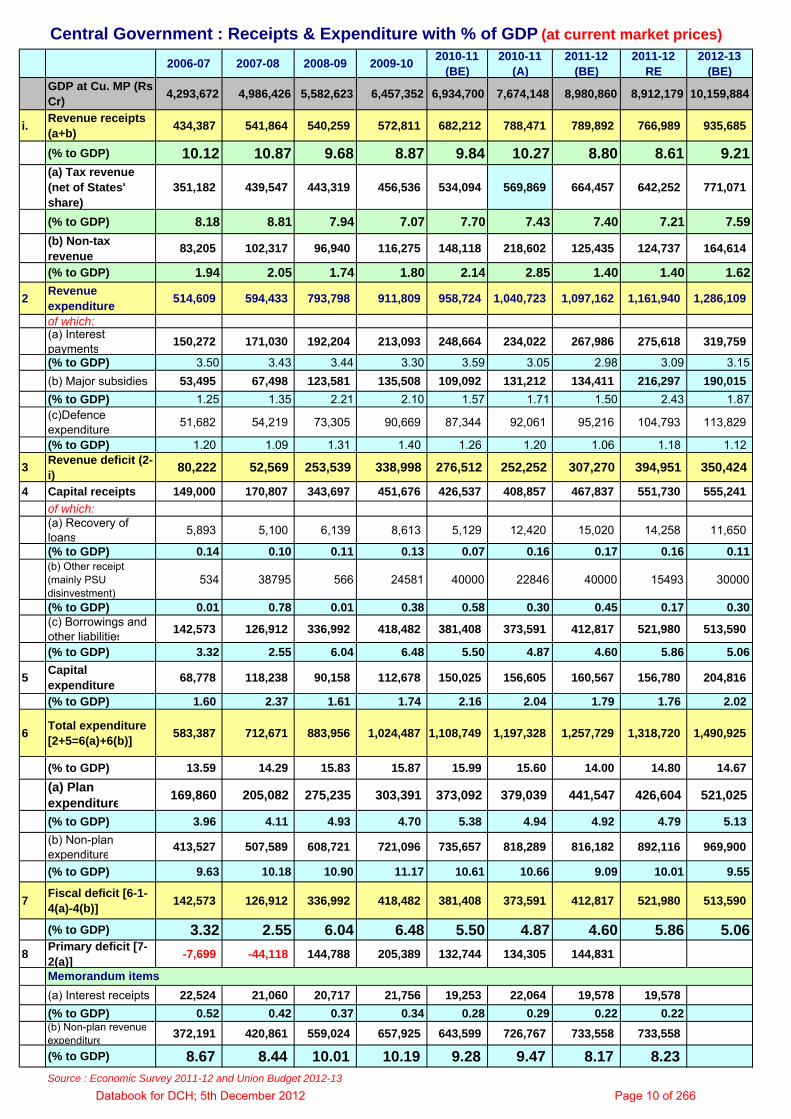
Central Government : Receipts & Expenditure with % of GDP (at current market prices)
2006-07 2007-08 2008-09 2009-102010-11
(BE)
2010-11
(A)
2011-12
(BE)
2011-12
RE
2012-13
(BE)
GDP at Cu. MP (Rs
Cr)4,293,672 4,986,426 5,582,623 6,457,352 6,934,700 7,674,148 8,980,860 8,912,179 10,159,884
i.Revenue receipts
(a+b)434,387 541,864 540,259 572,811 682,212 788,471 789,892 766,989 935,685
(% to GDP) 10.12 10.87 9.68 8.87 9.84 10.27 8.80 8.61 9.21(a) Tax revenue
(net of States'
share)
351,182 439,547 443,319 456,536 534,094 569,869 664,457 642,252 771,071
(% to GDP) 8.18 8.81 7.94 7.07 7.70 7.43 7.40 7.21 7.59
(b) Non-tax
revenue83,205 102,317 96,940 116,275 148,118 218,602 125,435 124,737 164,614
(% to GDP) 1.94 2.05 1.74 1.80 2.14 2.85 1.40 1.40 1.62
2Revenue
expenditure514,609 594,433 793,798 911,809 958,724 1,040,723 1,097,162 1,161,940 1,286,109
of which:(a) Interest payments 150,272 171,030 192,204 213,093 248,664 234,022 267,986 275,618 319,759
(% to GDP) 3.50 3.43 3.44 3.30 3.59 3.05 2.98 3.09 3.15(b) Major subsidies 53,495 67,498 123,581 135,508 109,092 131,212 134,411 216,297 190,015
(% to GDP) 1.25 1.35 2.21 2.10 1.57 1.71 1.50 2.43 1.87(c)Defence expenditure 51,682 54,219 73,305 90,669 87,344 92,061 95,216 104,793 113,829
(% to GDP) 1.20 1.09 1.31 1.40 1.26 1.20 1.06 1.18 1.12
3Revenue deficit (2-
i)80,222 52,569 253,539 338,998 276,512 252,252 307,270 394,951 350,424
4 Capital receipts 149,000 170,807 343,697 451,676 426,537 408,857 467,837 551,730 555,241
of which:(a) Recovery of loans 5,893 5,100 6,139 8,613 5,129 12,420 15,020 14,258 11,650
(% to GDP) 0.14 0.10 0.11 0.13 0.07 0.16 0.17 0.16 0.11
(b) Other receipt (mainly PSU disinvestment)
534 38795 566 24581 40000 22846 40000 15493 30000
(% to GDP) 0.01 0.78 0.01 0.38 0.58 0.30 0.45 0.17 0.30
(c) Borrowings and other liabilities 142,573 126,912 336,992 418,482 381,408 373,591 412,817 521,980 513,590
(% to GDP) 3.32 2.55 6.04 6.48 5.50 4.87 4.60 5.86 5.06
5Capital
expenditure68,778 118,238 90,158 112,678 150,025 156,605 160,567 156,780 204,816
(% to GDP) 1.60 2.37 1.61 1.74 2.16 2.04 1.79 1.76 2.02
6Total expenditure
[2+5=6(a)+6(b)]583,387 712,671 883,956 1,024,487 1,108,749 1,197,328 1,257,729 1,318,720 1,490,925
(% to GDP) 13.59 14.29 15.83 15.87 15.99 15.60 14.00 14.80 14.67
(a) Plan
expenditure169,860 205,082 275,235 303,391 373,092 379,039 441,547 426,604 521,025
(% to GDP) 3.96 4.11 4.93 4.70 5.38 4.94 4.92 4.79 5.13
(b) Non-plan expenditure 413,527 507,589 608,721 721,096 735,657 818,289 816,182 892,116 969,900
(% to GDP) 9.63 10.18 10.90 11.17 10.61 10.66 9.09 10.01 9.55
7Fiscal deficit [6-1-
4(a)-4(b)]142,573 126,912 336,992 418,482 381,408 373,591 412,817 521,980 513,590
(% to GDP) 3.32 2.55 6.04 6.48 5.50 4.87 4.60 5.86 5.06
8Primary deficit [7-
2(a)]-7,699 -44,118 144,788 205,389 132,744 134,305 144,831
Memorandum items
(a) Interest receipts 22,524 21,060 20,717 21,756 19,253 22,064 19,578 19,578
(% to GDP) 0.52 0.42 0.37 0.34 0.28 0.29 0.22 0.22(b) Non-plan revenueexpenditure 372,191 420,861 559,024 657,925 643,599 726,767 733,558 733,558
(% to GDP) 8.67 8.44 10.01 10.19 9.28 9.47 8.17 8.23
Source : Economic Survey 2011-12 and Union Budget 2012-13
Databook for DCH; 5th December 2012 Page 10 of 266
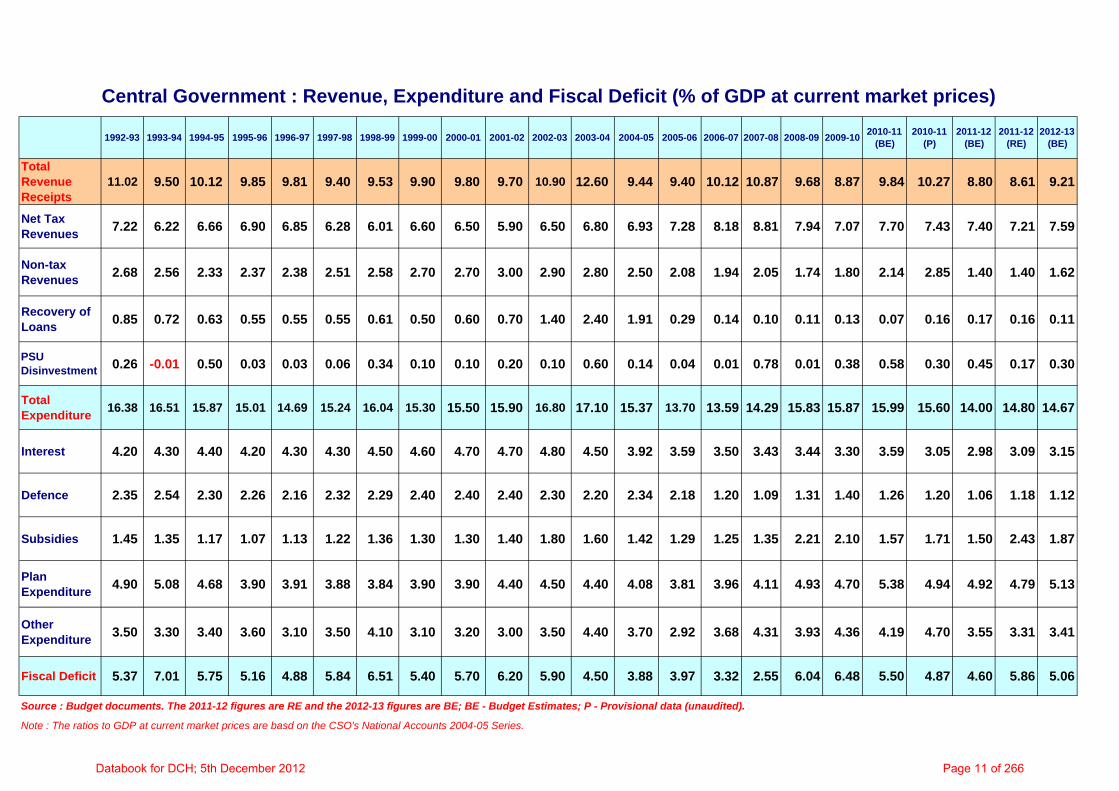
1992-93 1993-94 1994-95 1995-96 1996-97 1997-98 1998-99 1999-00 2000-01 2001-02 2002-03 2003-04 2004-05 2005-06 2006-07 2007-08 2008-09 2009-102010-11
(BE)
2010-11
(P)
2011-12
(BE)
2011-12
(RE)
2012-13
(BE)
Total
Revenue
Receipts
11.02 9.50 10.12 9.85 9.81 9.40 9.53 9.90 9.80 9.70 10.90 12.60 9.44 9.40 10.12 10.87 9.68 8.87 9.84 10.27 8.80 8.61 9.21
Net Tax
Revenues7.22 6.22 6.66 6.90 6.85 6.28 6.01 6.60 6.50 5.90 6.50 6.80 6.93 7.28 8.18 8.81 7.94 7.07 7.70 7.43 7.40 7.21 7.59
Non-tax
Revenues2.68 2.56 2.33 2.37 2.38 2.51 2.58 2.70 2.70 3.00 2.90 2.80 2.50 2.08 1.94 2.05 1.74 1.80 2.14 2.85 1.40 1.40 1.62
Recovery of
Loans 0.85 0.72 0.63 0.55 0.55 0.55 0.61 0.50 0.60 0.70 1.40 2.40 1.91 0.29 0.14 0.10 0.11 0.13 0.07 0.16 0.17 0.16 0.11
PSU
Disinvestment0.26 -0.01 0.50 0.03 0.03 0.06 0.34 0.10 0.10 0.20 0.10 0.60 0.14 0.04 0.01 0.78 0.01 0.38 0.58 0.30 0.45 0.17 0.30
Total
Expenditure16.38 16.51 15.87 15.01 14.69 15.24 16.04 15.30 15.50 15.90 16.80 17.10 15.37 13.70 13.59 14.29 15.83 15.87 15.99 15.60 14.00 14.80 14.67
Interest 4.20 4.30 4.40 4.20 4.30 4.30 4.50 4.60 4.70 4.70 4.80 4.50 3.92 3.59 3.50 3.43 3.44 3.30 3.59 3.05 2.98 3.09 3.15
Defence 2.35 2.54 2.30 2.26 2.16 2.32 2.29 2.40 2.40 2.40 2.30 2.20 2.34 2.18 1.20 1.09 1.31 1.40 1.26 1.20 1.06 1.18 1.12
Subsidies 1.45 1.35 1.17 1.07 1.13 1.22 1.36 1.30 1.30 1.40 1.80 1.60 1.42 1.29 1.25 1.35 2.21 2.10 1.57 1.71 1.50 2.43 1.87
Plan
Expenditure4.90 5.08 4.68 3.90 3.91 3.88 3.84 3.90 3.90 4.40 4.50 4.40 4.08 3.81 3.96 4.11 4.93 4.70 5.38 4.94 4.92 4.79 5.13
Other
Expenditure3.50 3.30 3.40 3.60 3.10 3.50 4.10 3.10 3.20 3.00 3.50 4.40 3.70 2.92 3.68 4.31 3.93 4.36 4.19 4.70 3.55 3.31 3.41
Fiscal Deficit 5.37 7.01 5.75 5.16 4.88 5.84 6.51 5.40 5.70 6.20 5.90 4.50 3.88 3.97 3.32 2.55 6.04 6.48 5.50 4.87 4.60 5.86 5.06
Note : The ratios to GDP at current market prices are basd on the CSO's National Accounts 2004-05 Series.
Source : Budget documents. The 2011-12 figures are RE and the 2012-13 figures are BE; BE - Budget Estimates; P - Provisional data (unaudited).
Central Government : Revenue, Expenditure and Fiscal Deficit (% of GDP at current market prices)
Databook for DCH; 5th December 2012 Page 11 of 266
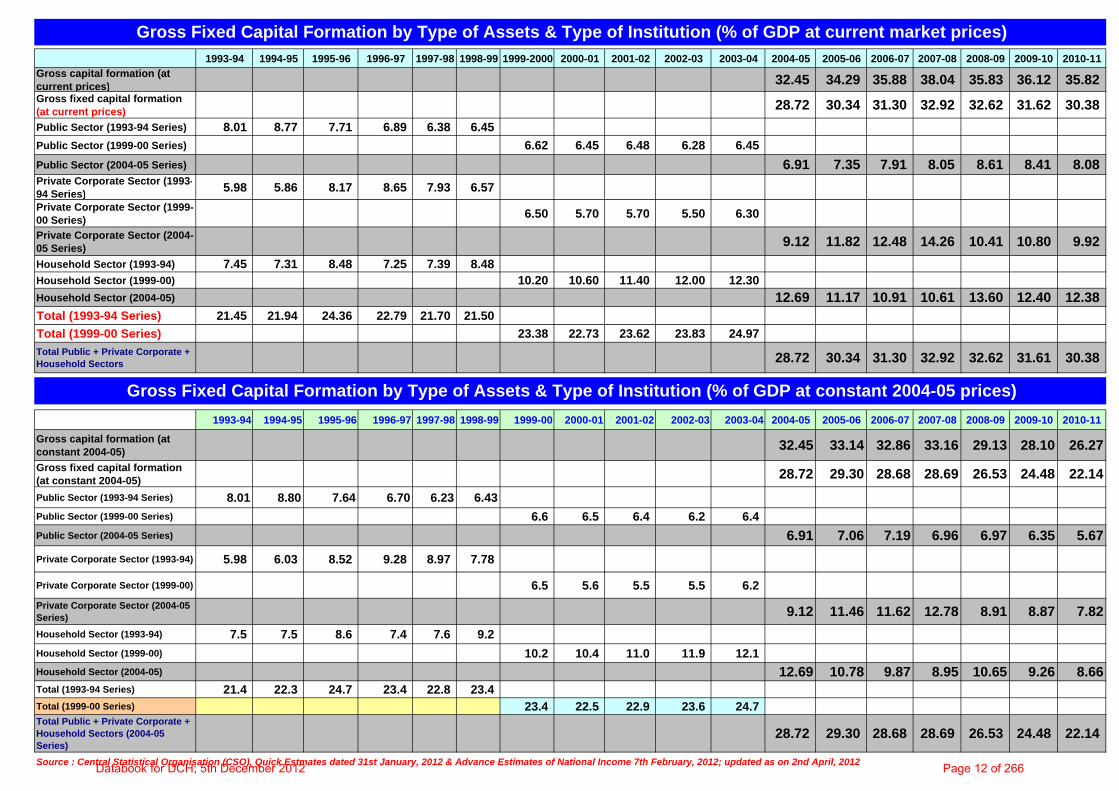
Gross Fixed Capital Formation by Type of Assets & Type of Institution (% of GDP at current market prices)
1993-94 1994-95 1995-96 1996-97 1997-98 1998-99 1999-2000 2000-01 2001-02 2002-03 2003-04 2004-05 2005-06 2006-07 2007-08 2008-09 2009-10 2010-11
Gross capital formation (at
current prices)32.45 34.29 35.88 38.04 35.83 36.12 35.82
Gross fixed capital formation
(at current prices)28.72 30.34 31.30 32.92 32.62 31.62 30.38
Public Sector (1993-94 Series) 8.01 8.77 7.71 6.89 6.38 6.45
Public Sector (1999-00 Series) 6.62 6.45 6.48 6.28 6.45
Public Sector (2004-05 Series) 6.91 7.35 7.91 8.05 8.61 8.41 8.08Private Corporate Sector (1993-
94 Series)5.98 5.86 8.17 8.65 7.93 6.57
Private Corporate Sector (1999-
00 Series)6.50 5.70 5.70 5.50 6.30
Private Corporate Sector (2004-
05 Series)9.12 11.82 12.48 14.26 10.41 10.80 9.92
Household Sector (1993-94) 7.45 7.31 8.48 7.25 7.39 8.48
Household Sector (1999-00) 10.20 10.60 11.40 12.00 12.30
Household Sector (2004-05) 12.69 11.17 10.91 10.61 13.60 12.40 12.38
Total (1993-94 Series) 21.45 21.94 24.36 22.79 21.70 21.50
Total (1999-00 Series) 23.38 22.73 23.62 23.83 24.97
Total Public + Private Corporate +
Household Sectors 28.72 30.34 31.30 32.92 32.62 31.61 30.38
Gross Fixed Capital Formation by Type of Assets & Type of Institution (% of GDP at constant 2004-05 prices)
1993-94 1994-95 1995-96 1996-97 1997-98 1998-99 1999-00 2000-01 2001-02 2002-03 2003-04 2004-05 2005-06 2006-07 2007-08 2008-09 2009-10 2010-11
Gross capital formation (at
constant 2004-05)32.45 33.14 32.86 33.16 29.13 28.10 26.27
Gross fixed capital formation
(at constant 2004-05)28.72 29.30 28.68 28.69 26.53 24.48 22.14
Public Sector (1993-94 Series) 8.01 8.80 7.64 6.70 6.23 6.43
Public Sector (1999-00 Series) 6.6 6.5 6.4 6.2 6.4
Public Sector (2004-05 Series) 6.91 7.06 7.19 6.96 6.97 6.35 5.67
Private Corporate Sector (1993-94) 5.98 6.03 8.52 9.28 8.97 7.78
Private Corporate Sector (1999-00) 6.5 5.6 5.5 5.5 6.2
Private Corporate Sector (2004-05
Series)9.12 11.46 11.62 12.78 8.91 8.87 7.82
Household Sector (1993-94) 7.5 7.5 8.6 7.4 7.6 9.2
Household Sector (1999-00) 10.2 10.4 11.0 11.9 12.1
Household Sector (2004-05) 12.69 10.78 9.87 8.95 10.65 9.26 8.66
Total (1993-94 Series) 21.4 22.3 24.7 23.4 22.8 23.4 Total (1999-00 Series) 23.4 22.5 22.9 23.6 24.7 Total Public + Private Corporate +
Household Sectors (2004-05
Series)28.72 29.30 28.68 28.69 26.53 24.48 22.14
Source : Central Statistical Organisation (CSO), Quick Estmates dated 31st January, 2012 & Advance Estimates of National Income 7th February, 2012; updated as on 2nd April, 2012Databook for DCH; 5th December 2012 Page 12 of 266
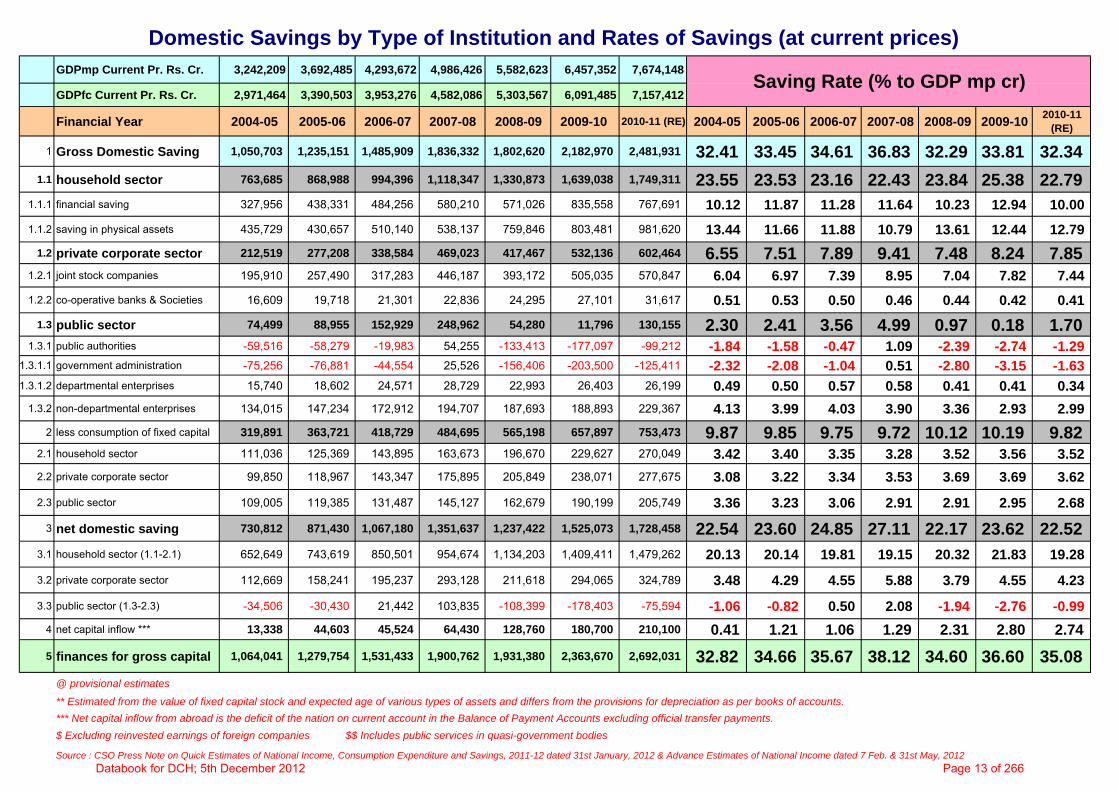
Domestic Savings by Type of Institution and Rates of Savings (at current prices)
GDPmp Current Pr. Rs. Cr. 3,242,209 3,692,485 4,293,672 4,986,426 5,582,623 6,457,352 7,674,148
Saving Rate (% to GDP mp cr)GDPfc Current Pr. Rs. Cr. 2,971,464 3,390,503 3,953,276 4,582,086 5,303,567 6,091,485 7,157,412
Financial Year 2004-05 2005-06 2006-07 2007-08 2008-09 2009-10 2010-11 (RE) 2004-05 2005-06 2006-07 2007-08 2008-09 2009-102010-11
(RE)
1 Gross Domestic Saving 1,050,703 1,235,151 1,485,909 1,836,332 1,802,620 2,182,970 2,481,931 32.41 33.45 34.61 36.83 32.29 33.81 32.34
1.1 household sector 763,685 868,988 994,396 1,118,347 1,330,873 1,639,038 1,749,311 23.55 23.53 23.16 22.43 23.84 25.38 22.79
1.1.1 financial saving 327,956 438,331 484,256 580,210 571,026 835,558 767,691 10.12 11.87 11.28 11.64 10.23 12.94 10.00
1.1.2 saving in physical assets 435,729 430,657 510,140 538,137 759,846 803,481 981,620 13.44 11.66 11.88 10.79 13.61 12.44 12.79
1.2 private corporate sector 212,519 277,208 338,584 469,023 417,467 532,136 602,464 6.55 7.51 7.89 9.41 7.48 8.24 7.851.2.1 joint stock companies 195,910 257,490 317,283 446,187 393,172 505,035 570,847 6.04 6.97 7.39 8.95 7.04 7.82 7.44
1.2.2 co-operative banks & Societies 16,609 19,718 21,301 22,836 24,295 27,101 31,617 0.51 0.53 0.50 0.46 0.44 0.42 0.41
1.3 public sector 74,499 88,955 152,929 248,962 54,280 11,796 130,155 2.30 2.41 3.56 4.99 0.97 0.18 1.701.3.1 public authorities -59,516 -58,279 -19,983 54,255 -133,413 -177,097 -99,212 -1.84 -1.58 -0.47 1.09 -2.39 -2.74 -1.29
1.3.1.1 government administration -75,256 -76,881 -44,554 25,526 -156,406 -203,500 -125,411 -2.32 -2.08 -1.04 0.51 -2.80 -3.15 -1.63
1.3.1.2 departmental enterprises 15,740 18,602 24,571 28,729 22,993 26,403 26,199 0.49 0.50 0.57 0.58 0.41 0.41 0.34
1.3.2 non-departmental enterprises 134,015 147,234 172,912 194,707 187,693 188,893 229,367 4.13 3.99 4.03 3.90 3.36 2.93 2.99
2 less consumption of fixed capital 319,891 363,721 418,729 484,695 565,198 657,897 753,473 9.87 9.85 9.75 9.72 10.12 10.19 9.822.1 household sector 111,036 125,369 143,895 163,673 196,670 229,627 270,049 3.42 3.40 3.35 3.28 3.52 3.56 3.52
2.2 private corporate sector 99,850 118,967 143,347 175,895 205,849 238,071 277,675 3.08 3.22 3.34 3.53 3.69 3.69 3.62
2.3 public sector 109,005 119,385 131,487 145,127 162,679 190,199 205,749 3.36 3.23 3.06 2.91 2.91 2.95 2.68
3 net domestic saving 730,812 871,430 1,067,180 1,351,637 1,237,422 1,525,073 1,728,458 22.54 23.60 24.85 27.11 22.17 23.62 22.52
3.1 household sector (1.1-2.1) 652,649 743,619 850,501 954,674 1,134,203 1,409,411 1,479,262 20.13 20.14 19.81 19.15 20.32 21.83 19.28
3.2 private corporate sector 112,669 158,241 195,237 293,128 211,618 294,065 324,789 3.48 4.29 4.55 5.88 3.79 4.55 4.23
3.3 public sector (1.3-2.3) -34,506 -30,430 21,442 103,835 -108,399 -178,403 -75,594 -1.06 -0.82 0.50 2.08 -1.94 -2.76 -0.99
4 net capital inflow *** 13,338 44,603 45,524 64,430 128,760 180,700 210,100 0.41 1.21 1.06 1.29 2.31 2.80 2.74
5 finances for gross capital 1,064,041 1,279,754 1,531,433 1,900,762 1,931,380 2,363,670 2,692,031 32.82 34.66 35.67 38.12 34.60 36.60 35.08
@ provisional estimates
** Estimated from the value of fixed capital stock and expected age of various types of assets and differs from the provisions for depreciation as per books of accounts.*** Net capital inflow from abroad is the deficit of the nation on current account in the Balance of Payment Accounts excluding official transfer payments.$ Excluding reinvested earnings of foreign companies $$ Includes public services in quasi-government bodies
Source : CSO Press Note on Quick Estimates of National Income, Consumption Expenditure and Savings, 2011-12 dated 31st January, 2012 & Advance Estimates of National Income dated 7 Feb. & 31st May, 2012Databook for DCH; 5th December 2012 Page 13 of 266
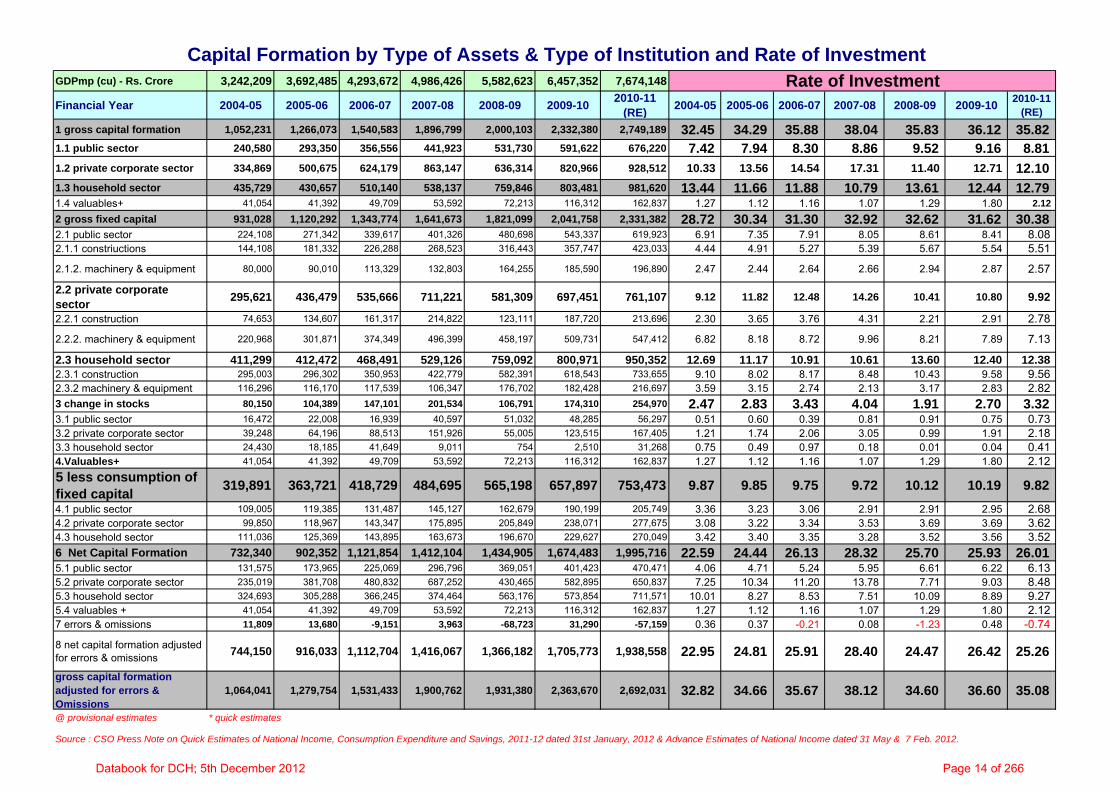
GDPmp (cu) - Rs. Crore 3,242,209 3,692,485 4,293,672 4,986,426 5,582,623 6,457,352 7,674,148
Financial Year 2004-05 2005-06 2006-07 2007-08 2008-09 2009-10 2010-11
(RE)2004-05 2005-06 2006-07 2007-08 2008-09 2009-10
2010-11
(RE)
1 gross capital formation 1,052,231 1,266,073 1,540,583 1,896,799 2,000,103 2,332,380 2,749,189 32.45 34.29 35.88 38.04 35.83 36.12 35.82
1.1 public sector 240,580 293,350 356,556 441,923 531,730 591,622 676,220 7.42 7.94 8.30 8.86 9.52 9.16 8.81
1.2 private corporate sector 334,869 500,675 624,179 863,147 636,314 820,966 928,512 10.33 13.56 14.54 17.31 11.40 12.71 12.10
1.3 household sector 435,729 430,657 510,140 538,137 759,846 803,481 981,620 13.44 11.66 11.88 10.79 13.61 12.44 12.791.4 valuables+ 41,054 41,392 49,709 53,592 72,213 116,312 162,837 1.27 1.12 1.16 1.07 1.29 1.80 2.12
2 gross fixed capital 931,028 1,120,292 1,343,774 1,641,673 1,821,099 2,041,758 2,331,382 28.72 30.34 31.30 32.92 32.62 31.62 30.382.1 public sector 224,108 271,342 339,617 401,326 480,698 543,337 619,923 6.91 7.35 7.91 8.05 8.61 8.41 8.082.1.1 constriuctions 144,108 181,332 226,288 268,523 316,443 357,747 423,033 4.44 4.91 5.27 5.39 5.67 5.54 5.51
2.1.2. machinery & equipment 80,000 90,010 113,329 132,803 164,255 185,590 196,890 2.47 2.44 2.64 2.66 2.94 2.87 2.57
2.2 private corporate
sector295,621 436,479 535,666 711,221 581,309 697,451 761,107 9.12 11.82 12.48 14.26 10.41 10.80 9.92
2.2.1 construction 74,653 134,607 161,317 214,822 123,111 187,720 213,696 2.30 3.65 3.76 4.31 2.21 2.91 2.78
2.2.2. machinery & equipment 220,968 301,871 374,349 496,399 458,197 509,731 547,412 6.82 8.18 8.72 9.96 8.21 7.89 7.13
2.3 household sector 411,299 412,472 468,491 529,126 759,092 800,971 950,352 12.69 11.17 10.91 10.61 13.60 12.40 12.38
2.3.1 construction 295,003 296,302 350,953 422,779 582,391 618,543 733,655 9.10 8.02 8.17 8.48 10.43 9.58 9.562.3.2 machinery & equipment 116,296 116,170 117,539 106,347 176,702 182,428 216,697 3.59 3.15 2.74 2.13 3.17 2.83 2.823 change in stocks 80,150 104,389 147,101 201,534 106,791 174,310 254,970 2.47 2.83 3.43 4.04 1.91 2.70 3.323.1 public sector 16,472 22,008 16,939 40,597 51,032 48,285 56,297 0.51 0.60 0.39 0.81 0.91 0.75 0.733.2 private corporate sector 39,248 64,196 88,513 151,926 55,005 123,515 167,405 1.21 1.74 2.06 3.05 0.99 1.91 2.183.3 household sector 24,430 18,185 41,649 9,011 754 2,510 31,268 0.75 0.49 0.97 0.18 0.01 0.04 0.414.Valuables+ 41,054 41,392 49,709 53,592 72,213 116,312 162,837 1.27 1.12 1.16 1.07 1.29 1.80 2.125 less consumption of
fixed capital319,891 363,721 418,729 484,695 565,198 657,897 753,473 9.87 9.85 9.75 9.72 10.12 10.19 9.82
4.1 public sector 109,005 119,385 131,487 145,127 162,679 190,199 205,749 3.36 3.23 3.06 2.91 2.91 2.95 2.684.2 private corporate sector 99,850 118,967 143,347 175,895 205,849 238,071 277,675 3.08 3.22 3.34 3.53 3.69 3.69 3.624.3 household sector 111,036 125,369 143,895 163,673 196,670 229,627 270,049 3.42 3.40 3.35 3.28 3.52 3.56 3.526 Net Capital Formation 732,340 902,352 1,121,854 1,412,104 1,434,905 1,674,483 1,995,716 22.59 24.44 26.13 28.32 25.70 25.93 26.015.1 public sector 131,575 173,965 225,069 296,796 369,051 401,423 470,471 4.06 4.71 5.24 5.95 6.61 6.22 6.135.2 private corporate sector 235,019 381,708 480,832 687,252 430,465 582,895 650,837 7.25 10.34 11.20 13.78 7.71 9.03 8.485.3 household sector 324,693 305,288 366,245 374,464 563,176 573,854 711,571 10.01 8.27 8.53 7.51 10.09 8.89 9.275.4 valuables + 41,054 41,392 49,709 53,592 72,213 116,312 162,837 1.27 1.12 1.16 1.07 1.29 1.80 2.127 errors & omissions 11,809 13,680 -9,151 3,963 -68,723 31,290 -57,159 0.36 0.37 -0.21 0.08 -1.23 0.48 -0.74
8 net capital formation adjusted for errors & omissions 744,150 916,033 1,112,704 1,416,067 1,366,182 1,705,773 1,938,558 22.95 24.81 25.91 28.40 24.47 26.42 25.26
gross capital formation
adjusted for errors &
Omissions
1,064,041 1,279,754 1,531,433 1,900,762 1,931,380 2,363,670 2,692,031 32.82 34.66 35.67 38.12 34.60 36.60 35.08
@ provisional estimates * quick estimates
Source : CSO Press Note on Quick Estimates of National Income, Consumption Expenditure and Savings, 2011-12 dated 31st January, 2012 & Advance Estimates of National Income dated 31 May & 7 Feb. 2012.
Rate of Investment
Capital Formation by Type of Assets & Type of Institution and Rate of Investment
Databook for DCH; 5th December 2012 Page 14 of 266
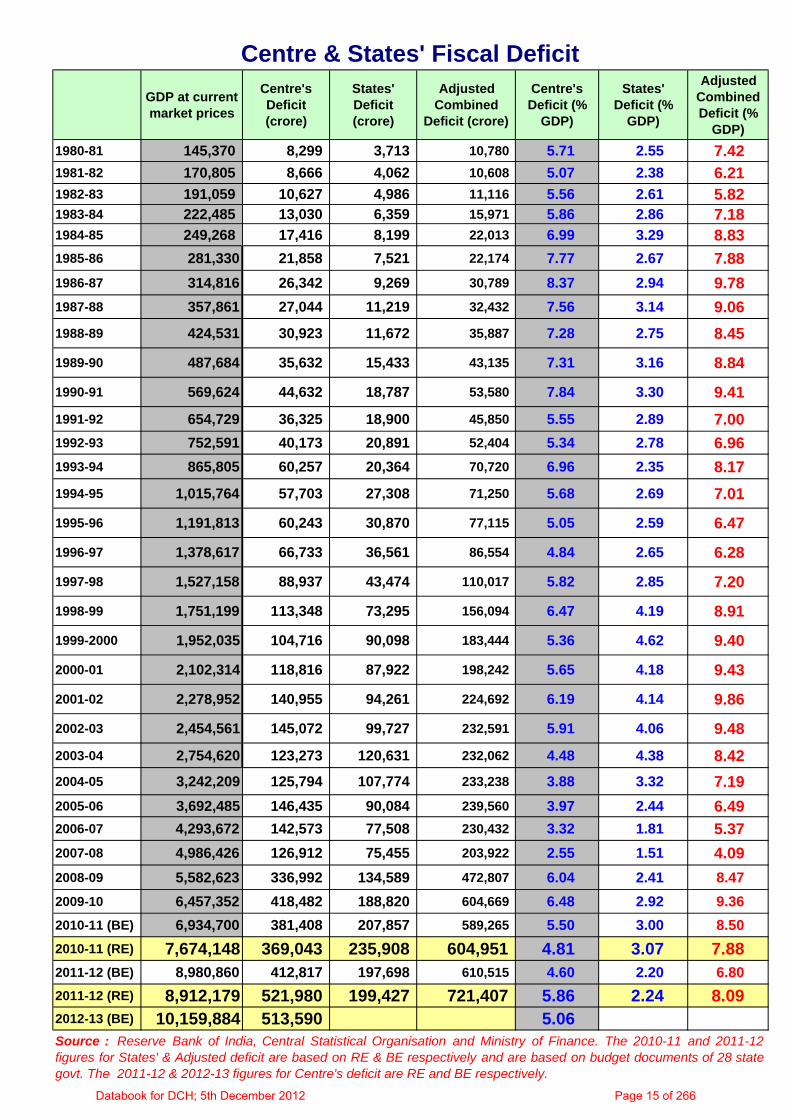
Centre & States' Fiscal Deficit
GDP at current
market prices
Centre's
Deficit
(crore)
States'
Deficit
(crore)
Adjusted
Combined
Deficit (crore)
Centre's
Deficit (%
GDP)
States'
Deficit (%
GDP)
Adjusted
Combined
Deficit (%
GDP)
1980-81 145,370 8,299 3,713 10,780 5.71 2.55 7.42
1981-82 170,805 8,666 4,062 10,608 5.07 2.38 6.21
1982-83 191,059 10,627 4,986 11,116 5.56 2.61 5.82
1983-84 222,485 13,030 6,359 15,971 5.86 2.86 7.18
1984-85 249,268 17,416 8,199 22,013 6.99 3.29 8.83
1985-86 281,330 21,858 7,521 22,174 7.77 2.67 7.88
1986-87 314,816 26,342 9,269 30,789 8.37 2.94 9.78
1987-88 357,861 27,044 11,219 32,432 7.56 3.14 9.06
1988-89 424,531 30,923 11,672 35,887 7.28 2.75 8.45
1989-90 487,684 35,632 15,433 43,135 7.31 3.16 8.84
1990-91 569,624 44,632 18,787 53,580 7.84 3.30 9.41
1991-92 654,729 36,325 18,900 45,850 5.55 2.89 7.00
1992-93 752,591 40,173 20,891 52,404 5.34 2.78 6.96
1993-94 865,805 60,257 20,364 70,720 6.96 2.35 8.17
1994-95 1,015,764 57,703 27,308 71,250 5.68 2.69 7.01
1995-96 1,191,813 60,243 30,870 77,115 5.05 2.59 6.47
1996-97 1,378,617 66,733 36,561 86,554 4.84 2.65 6.28
1997-98 1,527,158 88,937 43,474 110,017 5.82 2.85 7.20
1998-99 1,751,199 113,348 73,295 156,094 6.47 4.19 8.91
1999-2000 1,952,035 104,716 90,098 183,444 5.36 4.62 9.40
2000-01 2,102,314 118,816 87,922 198,242 5.65 4.18 9.43
2001-02 2,278,952 140,955 94,261 224,692 6.19 4.14 9.86
2002-03 2,454,561 145,072 99,727 232,591 5.91 4.06 9.48
2003-04 2,754,620 123,273 120,631 232,062 4.48 4.38 8.42
2004-05 3,242,209 125,794 107,774 233,238 3.88 3.32 7.19
2005-06 3,692,485 146,435 90,084 239,560 3.97 2.44 6.49
2006-07 4,293,672 142,573 77,508 230,432 3.32 1.81 5.37
2007-08 4,986,426 126,912 75,455 203,922 2.55 1.51 4.09
2008-09 5,582,623 336,992 134,589 472,807 6.04 2.41 8.47
2009-10 6,457,352 418,482 188,820 604,669 6.48 2.92 9.36
2010-11 (BE) 6,934,700 381,408 207,857 589,265 5.50 3.00 8.50
2010-11 (RE) 7,674,148 369,043 235,908 604,951 4.81 3.07 7.88
2011-12 (BE) 8,980,860 412,817 197,698 610,515 4.60 2.20 6.80
2011-12 (RE) 8,912,179 521,980 199,427 721,407 5.86 2.24 8.09
2012-13 (BE) 10,159,884 513,590 5.06
Source : Reserve Bank of India, Central Statistical Organisation and Ministry of Finance. The 2010-11 and 2011-12figures for States' & Adjusted deficit are based on RE & BE respectively and are based on budget documents of 28 stategovt. The 2011-12 & 2012-13 figures for Centre's deficit are RE and BE respectively.
Databook for DCH; 5th December 2012 Page 15 of 266
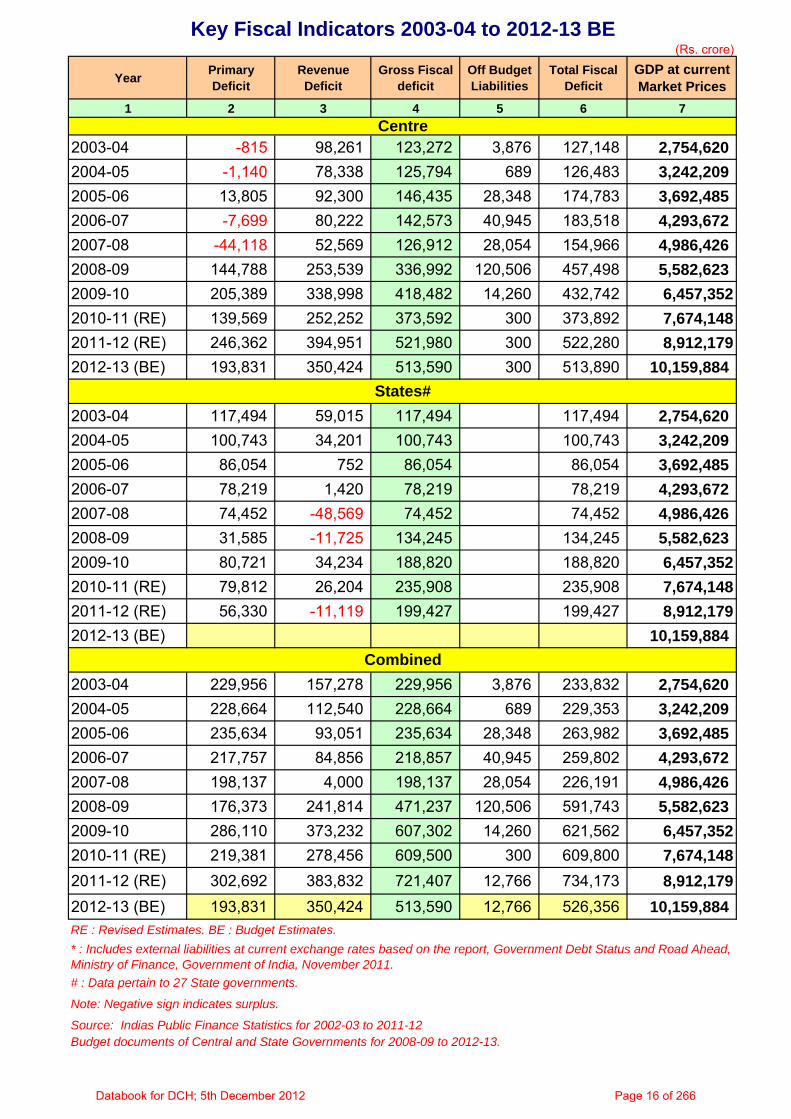
YearPrimary
Deficit
Revenue
Deficit
Gross Fiscal
deficit
Off Budget
Liabilities
Total Fiscal
Deficit
GDP at current
Market Prices
1 2 3 4 5 6 7
2003-04 -815 98,261 123,272 3,876 127,148 2,754,620
2004-05 -1,140 78,338 125,794 689 126,483 3,242,209
2005-06 13,805 92,300 146,435 28,348 174,783 3,692,485
2006-07 -7,699 80,222 142,573 40,945 183,518 4,293,672
2007-08 -44,118 52,569 126,912 28,054 154,966 4,986,426
2008-09 144,788 253,539 336,992 120,506 457,498 5,582,623
2009-10 205,389 338,998 418,482 14,260 432,742 6,457,352
2010-11 (RE) 139,569 252,252 373,592 300 373,892 7,674,148
2011-12 (RE) 246,362 394,951 521,980 300 522,280 8,912,179
2012-13 (BE) 193,831 350,424 513,590 300 513,890 10,159,884
2003-04 117,494 59,015 117,494 117,494 2,754,620
2004-05 100,743 34,201 100,743 100,743 3,242,209
2005-06 86,054 752 86,054 86,054 3,692,485
2006-07 78,219 1,420 78,219 78,219 4,293,672
2007-08 74,452 -48,569 74,452 74,452 4,986,426
2008-09 31,585 -11,725 134,245 134,245 5,582,623
2009-10 80,721 34,234 188,820 188,820 6,457,352
2010-11 (RE) 79,812 26,204 235,908 235,908 7,674,148
2011-12 (RE) 56,330 -11,119 199,427 199,427 8,912,179
2012-13 (BE) 10,159,884
2003-04 229,956 157,278 229,956 3,876 233,832 2,754,620
2004-05 228,664 112,540 228,664 689 229,353 3,242,209
2005-06 235,634 93,051 235,634 28,348 263,982 3,692,485
2006-07 217,757 84,856 218,857 40,945 259,802 4,293,672
2007-08 198,137 4,000 198,137 28,054 226,191 4,986,426
2008-09 176,373 241,814 471,237 120,506 591,743 5,582,623
2009-10 286,110 373,232 607,302 14,260 621,562 6,457,352
2010-11 (RE) 219,381 278,456 609,500 300 609,800 7,674,148
2011-12 (RE) 302,692 383,832 721,407 12,766 734,173 8,912,179
2012-13 (BE) 193,831 350,424 513,590 12,766 526,356 10,159,884
RE : Revised Estimates. BE : Budget Estimates.
# : Data pertain to 27 State governments.
Note: Negative sign indicates surplus.
Source: Indias Public Finance Statistics for 2002-03 to 2011-12Budget documents of Central and State Governments for 2008-09 to 2012-13.
Key Fiscal Indicators 2003-04 to 2012-13 BE(Rs. crore)
* : Includes external liabilities at current exchange rates based on the report, Government Debt Status and Road Ahead, Ministry of Finance, Government of India, November 2011.
Centre
Combined
States#
Databook for DCH; 5th December 2012 Page 16 of 266
Primary
deficit
Revenue
DeficitFiscal deficit Off budget
Total Fiscal
Deficit
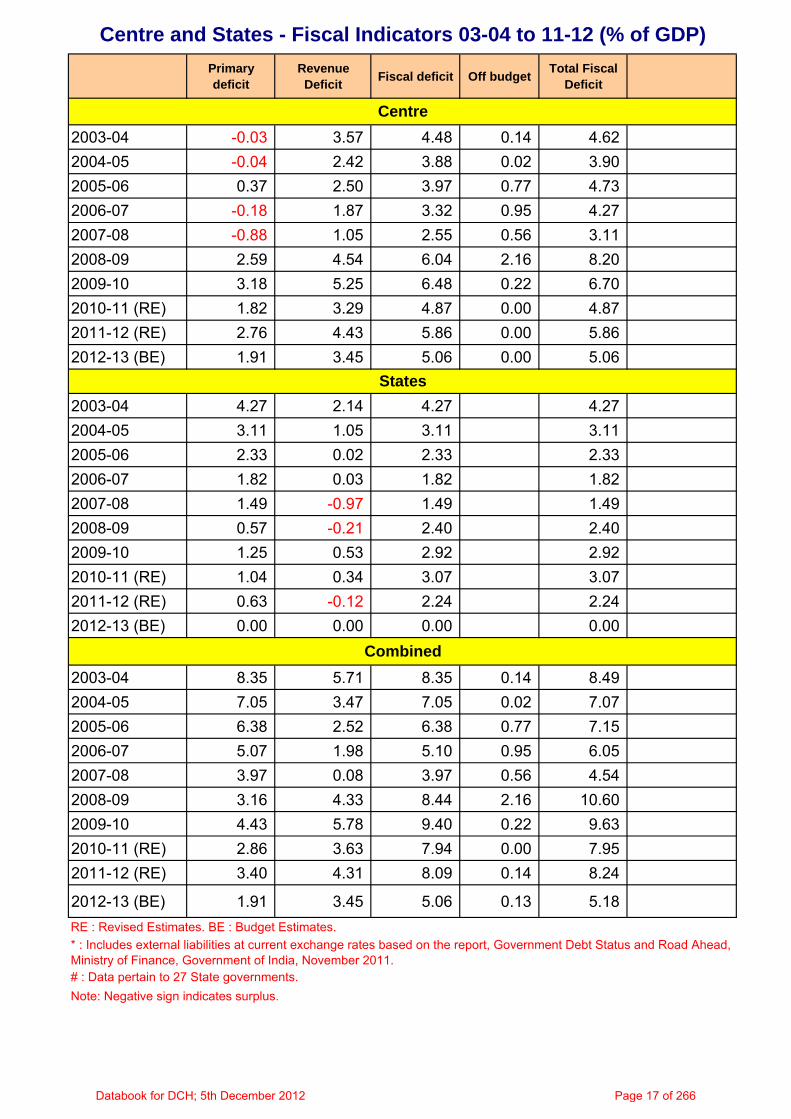
2003-04 -0.03 3.57 4.48 0.14 4.622004-05 -0.04 2.42 3.88 0.02 3.902005-06 0.37 2.50 3.97 0.77 4.732006-07 -0.18 1.87 3.32 0.95 4.272007-08 -0.88 1.05 2.55 0.56 3.112008-09 2.59 4.54 6.04 2.16 8.202009-10 3.18 5.25 6.48 0.22 6.702010-11 (RE) 1.82 3.29 4.87 0.00 4.872011-12 (RE) 2.76 4.43 5.86 0.00 5.862012-13 (BE) 1.91 3.45 5.06 0.00 5.06
2003-04 4.27 2.14 4.27 4.272004-05 3.11 1.05 3.11 3.112005-06 2.33 0.02 2.33 2.332006-07 1.82 0.03 1.82 1.822007-08 1.49 -0.97 1.49 1.492008-09 0.57 -0.21 2.40 2.402009-10 1.25 0.53 2.92 2.922010-11 (RE) 1.04 0.34 3.07 3.072011-12 (RE) 0.63 -0.12 2.24 2.242012-13 (BE) 0.00 0.00 0.00 0.00
2003-04 8.35 5.71 8.35 0.14 8.492004-05 7.05 3.47 7.05 0.02 7.072005-06 6.38 2.52 6.38 0.77 7.152006-07 5.07 1.98 5.10 0.95 6.052007-08 3.97 0.08 3.97 0.56 4.542008-09 3.16 4.33 8.44 2.16 10.602009-10 4.43 5.78 9.40 0.22 9.632010-11 (RE) 2.86 3.63 7.94 0.00 7.952011-12 (RE) 3.40 4.31 8.09 0.14 8.24
2012-13 (BE) 1.91 3.45 5.06 0.13 5.18
* : Includes external liabilities at current exchange rates based on the report, Government Debt Status and Road Ahead, Ministry of Finance, Government of India, November 2011.# : Data pertain to 27 State governments.Note: Negative sign indicates surplus.
Centre and States - Fiscal Indicators 03-04 to 11-12 (% of GDP)
Centre
States
Combined
RE : Revised Estimates. BE : Budget Estimates.
Databook for DCH; 5th December 2012 Page 17 of 266
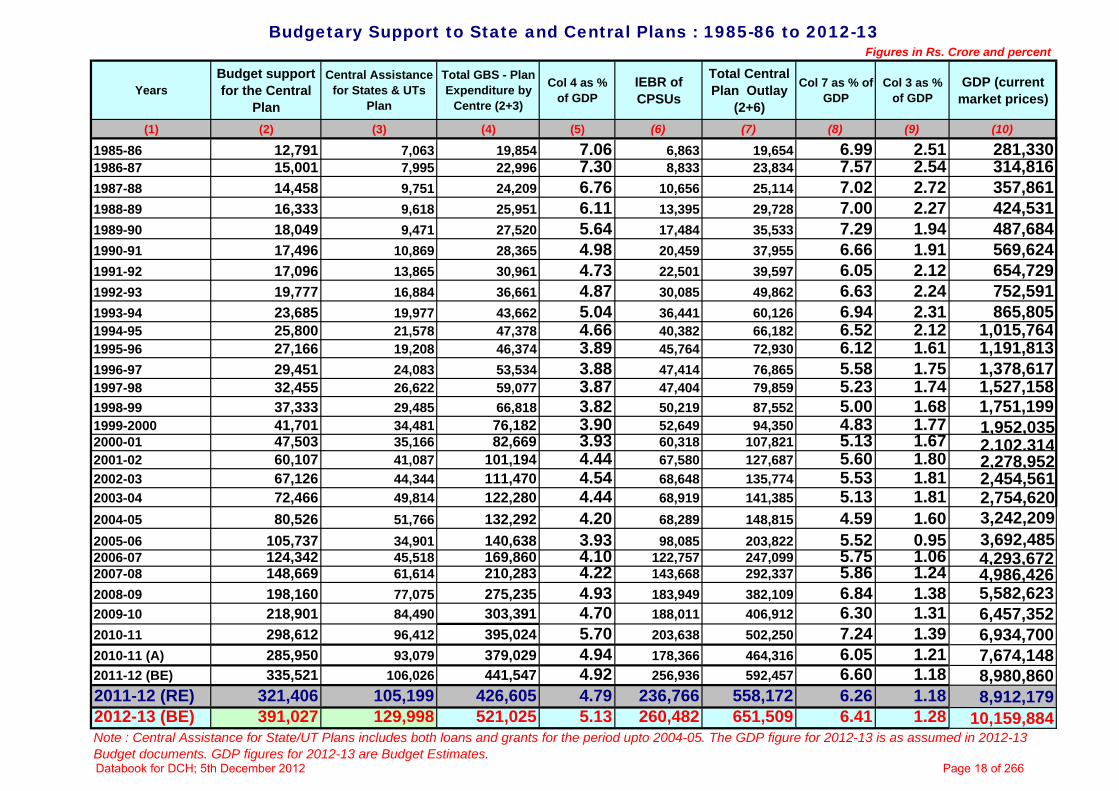
Budgetary Support to State and Central Plans : 1985-86 to 2012-13 Figures in Rs. Crore and percent
Years
Budget support
for the Central
Plan
Central Assistance
for States & UTs
Plan
Total GBS - Plan
Expenditure by
Centre (2+3)
Col 4 as %
of GDP
IEBR of
CPSUs
Total Central
Plan Outlay
(2+6)
Col 7 as % of
GDP
Col 3 as %
of GDP
GDP (current
market prices)
(1) (2) (3) (4) (5) (6) (7) (8) (9) (10)
1985-86 12,791 7,063 19,854 7.06 6,863 19,654 6.99 2.51 281,3301986-87 15,001 7,995 22,996 7.30 8,833 23,834 7.57 2.54 314,816
1987-88 14,458 9,751 24,209 6.76 10,656 25,114 7.02 2.72 357,861
1988-89 16,333 9,618 25,951 6.11 13,395 29,728 7.00 2.27 424,531
1989-90 18,049 9,471 27,520 5.64 17,484 35,533 7.29 1.94 487,684
1990-91 17,496 10,869 28,365 4.98 20,459 37,955 6.66 1.91 569,624
1991-92 17,096 13,865 30,961 4.73 22,501 39,597 6.05 2.12 654,729
1992-93 19,777 16,884 36,661 4.87 30,085 49,862 6.63 2.24 752,591
1993-94 23,685 19,977 43,662 5.04 36,441 60,126 6.94 2.31 865,8051994-95 25,800 21,578 47,378 4.66 40,382 66,182 6.52 2.12 1,015,7641995-96 27,166 19,208 46,374 3.89 45,764 72,930 6.12 1.61 1,191,813
1996-97 29,451 24,083 53,534 3.88 47,414 76,865 5.58 1.75 1,378,6171997-98 32,455 26,622 59,077 3.87 47,404 79,859 5.23 1.74 1,527,158
1998-99 37,333 29,485 66,818 3.82 50,219 87,552 5.00 1.68 1,751,1991999-2000 41,701 34,481 76,182 3.90 52,649 94,350 4.83 1.77 1,952,0352000-01 47,503 35,166 82,669 3.93 60,318 107,821 5.13 1.67 2,102,3142001-02 60,107 41,087 101,194 4.44 67,580 127,687 5.60 1.80 2,278,9522002-03 67,126 44,344 111,470 4.54 68,648 135,774 5.53 1.81 2,454,5612003-04 72,466 49,814 122,280 4.44 68,919 141,385 5.13 1.81 2,754,620
2004-05 80,526 51,766 132,292 4.20 68,289 148,815 4.59 1.60 3,242,209
2005-06 105,737 34,901 140,638 3.93 98,085 203,822 5.52 0.95 3,692,4852006-07 124,342 45,518 169,860 4.10 122,757 247,099 5.75 1.06 4,293,6722007-08 148,669 61,614 210,283 4.22 143,668 292,337 5.86 1.24 4,986,4262008-09 198,160 77,075 275,235 4.93 183,949 382,109 6.84 1.38 5,582,623
2009-10 218,901 84,490 303,391 4.70 188,011 406,912 6.30 1.31 6,457,352
2010-11 298,612 96,412 395,024 5.70 203,638 502,250 7.24 1.39 6,934,700
2010-11 (A) 285,950 93,079 379,029 4.94 178,366 464,316 6.05 1.21 7,674,1482011-12 (BE) 335,521 106,026 441,547 4.92 256,936 592,457 6.60 1.18 8,980,860
2011-12 (RE) 321,406 105,199 426,605 4.79 236,766 558,172 6.26 1.18 8,912,1792012-13 (BE) 391,027 129,998 521,025 5.13 260,482 651,509 6.41 1.28 10,159,884Note : Central Assistance for State/UT Plans includes both loans and grants for the period upto 2004-05. The GDP figure for 2012-13 is as assumed in 2012-13 Budget documents. GDP figures for 2012-13 are Budget Estimates.Databook for DCH; 5th December 2012 Page 18 of 266
GDP at current
market prices (in
Rs. Cr.)
Plan Revenue
Expenditure (in
Rs. Cr.)
Percentage Plan
Expenditure on
Revenue Account
Plan Capital
Outlay
Percentage Plan
Expenditure on
Capital Account
Total Plan
Expenditure (in
Rs. Cr.)
Percentage
Total Plan
Expenditure
Plan Revenue
Expenditure as
% of Total Plan
Expenditure
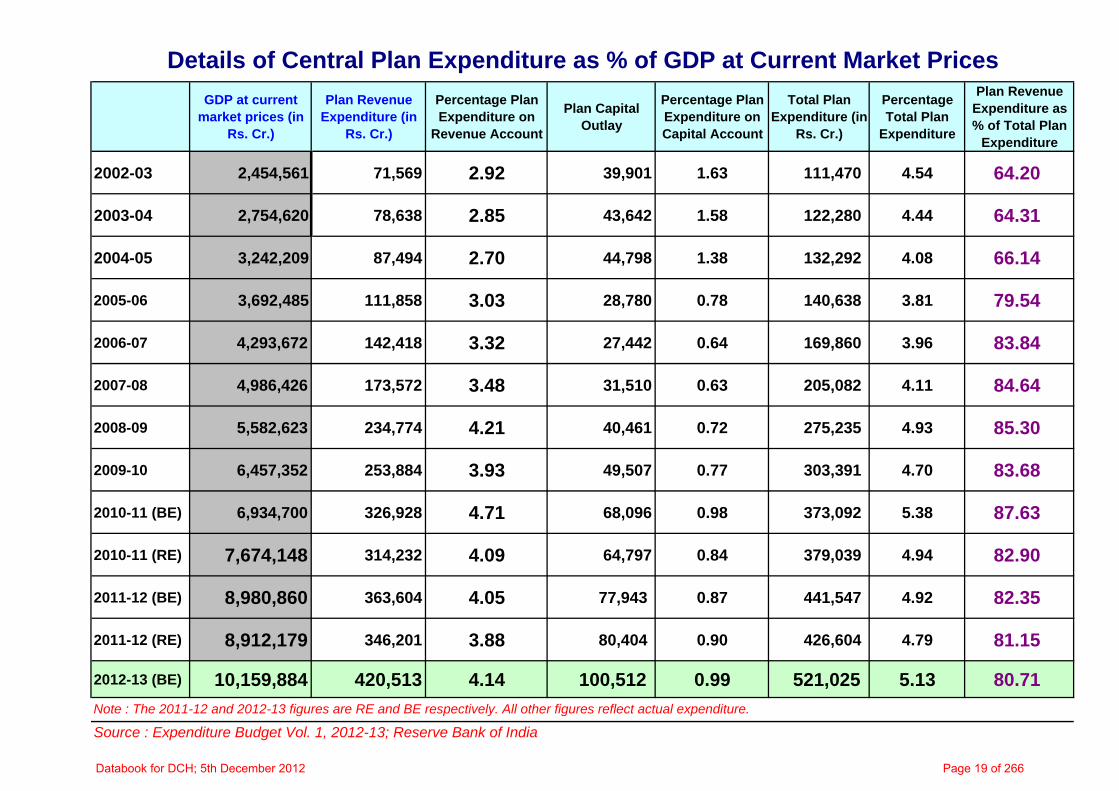
2002-03 2,454,561 71,569 2.92 39,901 1.63 111,470 4.54 64.20
2003-04 2,754,620 78,638 2.85 43,642 1.58 122,280 4.44 64.31
2004-05 3,242,209 87,494 2.70 44,798 1.38 132,292 4.08 66.14
2005-06 3,692,485 111,858 3.03 28,780 0.78 140,638 3.81 79.54
2006-07 4,293,672 142,418 3.32 27,442 0.64 169,860 3.96 83.84
2007-08 4,986,426 173,572 3.48 31,510 0.63 205,082 4.11 84.64
2008-09 5,582,623 234,774 4.21 40,461 0.72 275,235 4.93 85.30
2009-10 6,457,352 253,884 3.93 49,507 0.77 303,391 4.70 83.68
2010-11 (BE) 6,934,700 326,928 4.71 68,096 0.98 373,092 5.38 87.63
2010-11 (RE) 7,674,148 314,232 4.09 64,797 0.84 379,039 4.94 82.90
2011-12 (BE) 8,980,860 363,604 4.05 77,943 0.87 441,547 4.92 82.35
2011-12 (RE) 8,912,179 346,201 3.88 80,404 0.90 426,604 4.79 81.15
2012-13 (BE) 10,159,884 420,513 4.14 100,512 0.99 521,025 5.13 80.71
Details of Central Plan Expenditure as % of GDP at Current Market Prices
Source : Expenditure Budget Vol. 1, 2012-13; Reserve Bank of IndiaNote : The 2011-12 and 2012-13 figures are RE and BE respectively. All other figures reflect actual expenditure.
Databook for DCH; 5th December 2012 Page 19 of 266
GDP at current
market prices (in
Rs. Cr.)
Central
Assistance for
State Plans
Percentage
Central
Assistance for
State Plan
Percentage
Central Plan on
Revenue
Account
Percentage Total
Plan
Expenditure (CA
+ Revenue
Account)
Plan Revenue
Expenditure as
% of Total Plan
Expenditure
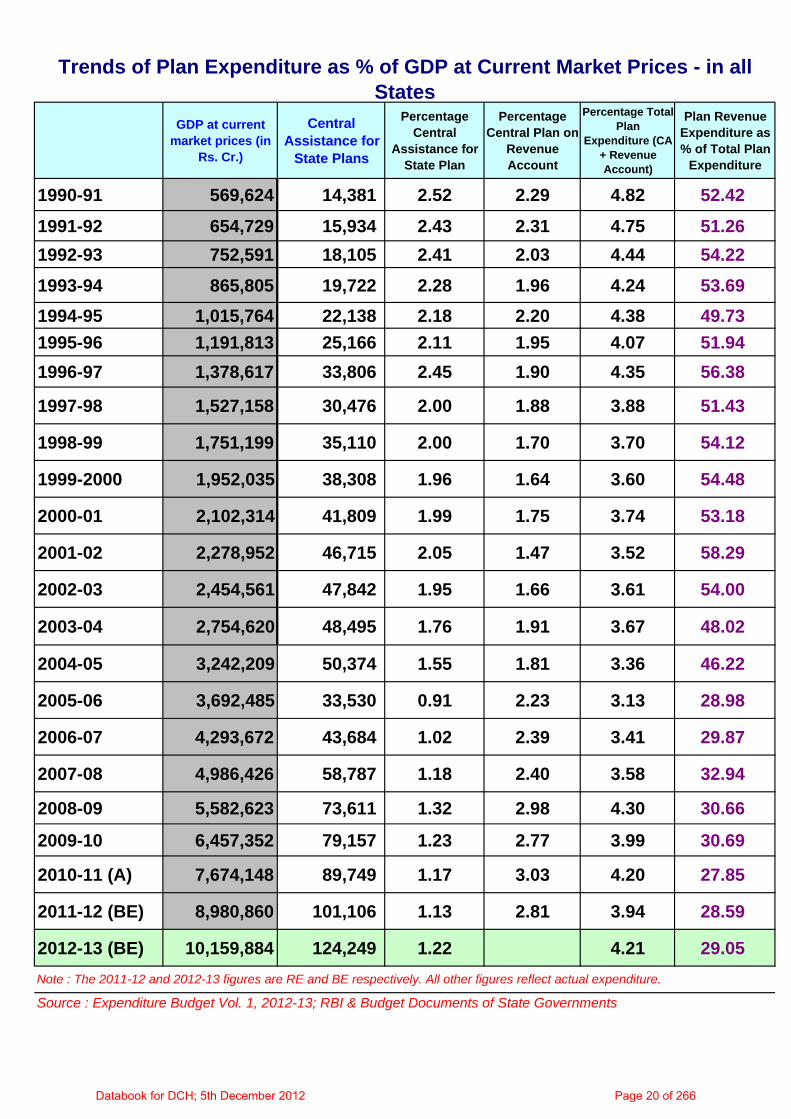
1990-91 569,624 14,381 2.52 2.29 4.82 52.42
1991-92 654,729 15,934 2.43 2.31 4.75 51.26
1992-93 752,591 18,105 2.41 2.03 4.44 54.22
1993-94 865,805 19,722 2.28 1.96 4.24 53.69
1994-95 1,015,764 22,138 2.18 2.20 4.38 49.73
1995-96 1,191,813 25,166 2.11 1.95 4.07 51.94
1996-97 1,378,617 33,806 2.45 1.90 4.35 56.38
1997-98 1,527,158 30,476 2.00 1.88 3.88 51.43
1998-99 1,751,199 35,110 2.00 1.70 3.70 54.12
1999-2000 1,952,035 38,308 1.96 1.64 3.60 54.48
2000-01 2,102,314 41,809 1.99 1.75 3.74 53.18
2001-02 2,278,952 46,715 2.05 1.47 3.52 58.29
2002-03 2,454,561 47,842 1.95 1.66 3.61 54.00
2003-04 2,754,620 48,495 1.76 1.91 3.67 48.02
2004-05 3,242,209 50,374 1.55 1.81 3.36 46.22
2005-06 3,692,485 33,530 0.91 2.23 3.13 28.98
2006-07 4,293,672 43,684 1.02 2.39 3.41 29.87
2007-08 4,986,426 58,787 1.18 2.40 3.58 32.94
2008-09 5,582,623 73,611 1.32 2.98 4.30 30.66
2009-10 6,457,352 79,157 1.23 2.77 3.99 30.69
2010-11 (A) 7,674,148 89,749 1.17 3.03 4.20 27.85
2011-12 (BE) 8,980,860 101,106 1.13 2.81 3.94 28.59
2012-13 (BE) 10,159,884 124,249 1.22 4.21 29.05
Trends of Plan Expenditure as % of GDP at Current Market Prices - in all
States
Source : Expenditure Budget Vol. 1, 2012-13; RBI & Budget Documents of State Governments
Note : The 2011-12 and 2012-13 figures are RE and BE respectively. All other figures reflect actual expenditure.
Databook for DCH; 5th December 2012 Page 20 of 266
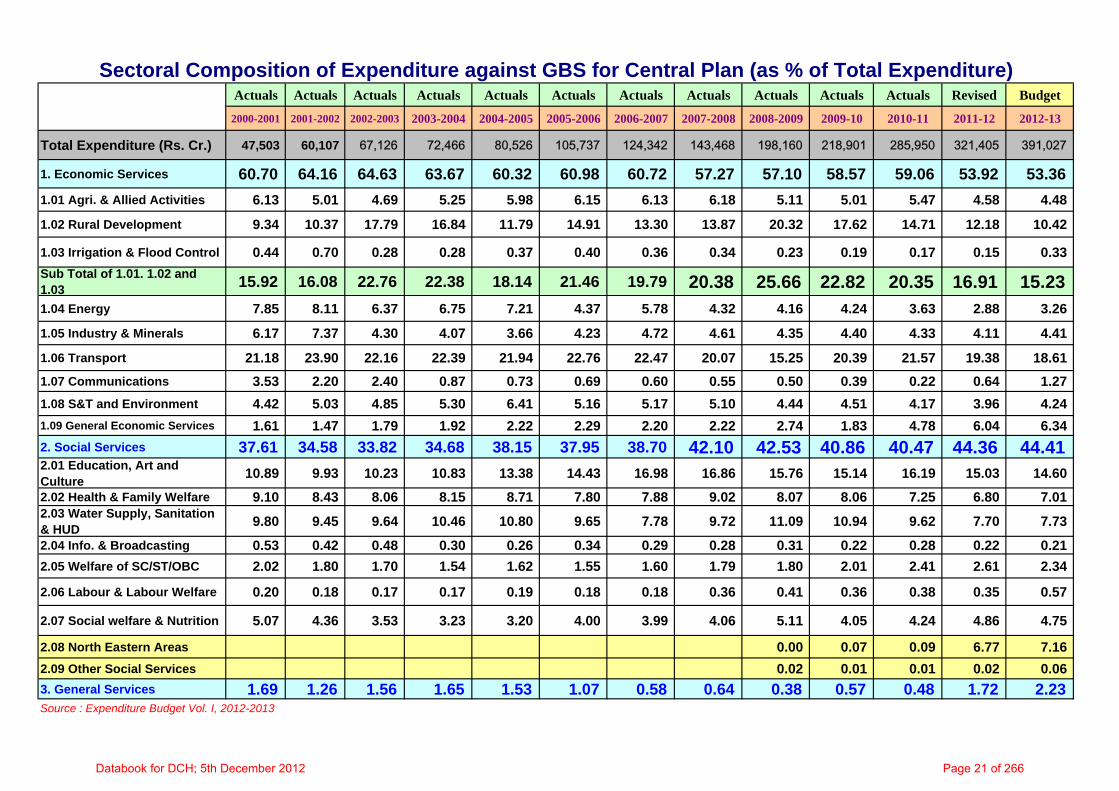
Sectoral Composition of Expenditure against GBS for Central Plan (as % of Total Expenditure)Actuals Actuals Actuals Actuals Actuals Actuals Actuals Actuals Actuals Actuals Actuals Revised Budget
2000-2001 2001-2002 2002-2003 2003-2004 2004-2005 2005-2006 2006-2007 2007-2008 2008-2009 2009-10 2010-11 2011-12 2012-13
Total Expenditure (Rs. Cr.) 47,503 60,107 67,126 72,466 80,526 105,737 124,342 143,468 198,160 218,901 285,950 321,405 391,027
1. Economic Services 60.70 64.16 64.63 63.67 60.32 60.98 60.72 57.27 57.10 58.57 59.06 53.92 53.36
1.01 Agri. & Allied Activities 6.13 5.01 4.69 5.25 5.98 6.15 6.13 6.18 5.11 5.01 5.47 4.58 4.48
1.02 Rural Development 9.34 10.37 17.79 16.84 11.79 14.91 13.30 13.87 20.32 17.62 14.71 12.18 10.42
1.03 Irrigation & Flood Control 0.44 0.70 0.28 0.28 0.37 0.40 0.36 0.34 0.23 0.19 0.17 0.15 0.33
Sub Total of 1.01. 1.02 and
1.0315.92 16.08 22.76 22.38 18.14 21.46 19.79 20.38 25.66 22.82 20.35 16.91 15.23
1.04 Energy 7.85 8.11 6.37 6.75 7.21 4.37 5.78 4.32 4.16 4.24 3.63 2.88 3.26
1.05 Industry & Minerals 6.17 7.37 4.30 4.07 3.66 4.23 4.72 4.61 4.35 4.40 4.33 4.11 4.41
1.06 Transport 21.18 23.90 22.16 22.39 21.94 22.76 22.47 20.07 15.25 20.39 21.57 19.38 18.61
1.07 Communications 3.53 2.20 2.40 0.87 0.73 0.69 0.60 0.55 0.50 0.39 0.22 0.64 1.27
1.08 S&T and Environment 4.42 5.03 4.85 5.30 6.41 5.16 5.17 5.10 4.44 4.51 4.17 3.96 4.24
1.09 General Economic Services 1.61 1.47 1.79 1.92 2.22 2.29 2.20 2.22 2.74 1.83 4.78 6.04 6.34
2. Social Services 37.61 34.58 33.82 34.68 38.15 37.95 38.70 42.10 42.53 40.86 40.47 44.36 44.412.01 Education, Art and
Culture10.89 9.93 10.23 10.83 13.38 14.43 16.98 16.86 15.76 15.14 16.19 15.03 14.60
2.02 Health & Family Welfare 9.10 8.43 8.06 8.15 8.71 7.80 7.88 9.02 8.07 8.06 7.25 6.80 7.01
2.03 Water Supply, Sanitation
& HUD9.80 9.45 9.64 10.46 10.80 9.65 7.78 9.72 11.09 10.94 9.62 7.70 7.73
2.04 Info. & Broadcasting 0.53 0.42 0.48 0.30 0.26 0.34 0.29 0.28 0.31 0.22 0.28 0.22 0.21
2.05 Welfare of SC/ST/OBC 2.02 1.80 1.70 1.54 1.62 1.55 1.60 1.79 1.80 2.01 2.41 2.61 2.34
2.06 Labour & Labour Welfare 0.20 0.18 0.17 0.17 0.19 0.18 0.18 0.36 0.41 0.36 0.38 0.35 0.57
2.07 Social welfare & Nutrition 5.07 4.36 3.53 3.23 3.20 4.00 3.99 4.06 5.11 4.05 4.24 4.86 4.75
2.08 North Eastern Areas 0.00 0.07 0.09 6.77 7.16
2.09 Other Social Services 0.02 0.01 0.01 0.02 0.06
3. General Services 1.69 1.26 1.56 1.65 1.53 1.07 0.58 0.64 0.38 0.57 0.48 1.72 2.23Source : Expenditure Budget Vol. I, 2012-2013
Databook for DCH; 5th December 2012 Page 21 of 266
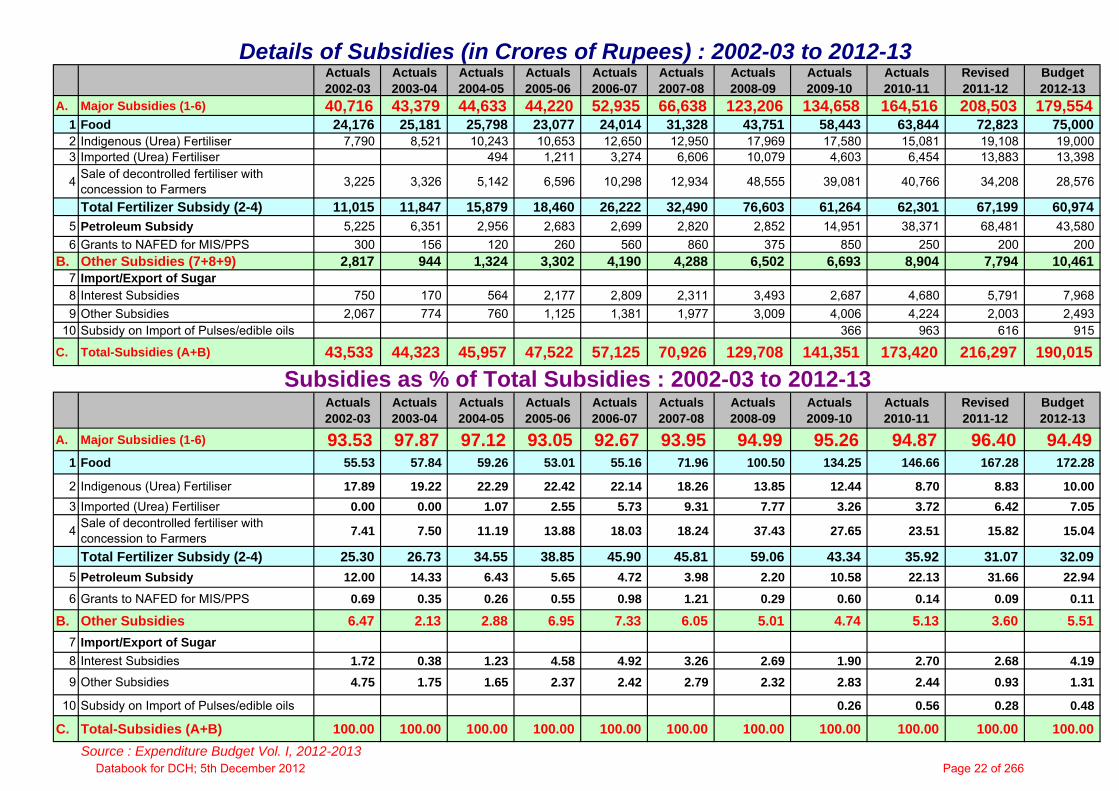
Details of Subsidies (in Crores of Rupees) : 2002-03 to 2012-13Actuals
2002-03
Actuals
2003-04
Actuals
2004-05
Actuals
2005-06
Actuals
2006-07
Actuals
2007-08
Actuals
2008-09
Actuals
2009-10
Actuals
2010-11
Revised
2011-12
Budget
2012-13
A. Major Subsidies (1-6) 40,716 43,379 44,633 44,220 52,935 66,638 123,206 134,658 164,516 208,503 179,5541 Food 24,176 25,181 25,798 23,077 24,014 31,328 43,751 58,443 63,844 72,823 75,000
2 Indigenous (Urea) Fertiliser 7,790 8,521 10,243 10,653 12,650 12,950 17,969 17,580 15,081 19,108 19,0003 Imported (Urea) Fertiliser 494 1,211 3,274 6,606 10,079 4,603 6,454 13,883 13,398
4 Sale of decontrolled fertiliser with concession to Farmers 3,225 3,326 5,142 6,596 10,298 12,934 48,555 39,081 40,766 34,208 28,576
Total Fertilizer Subsidy (2-4) 11,015 11,847 15,879 18,460 26,222 32,490 76,603 61,264 62,301 67,199 60,974
5 Petroleum Subsidy 5,225 6,351 2,956 2,683 2,699 2,820 2,852 14,951 38,371 68,481 43,5806 Grants to NAFED for MIS/PPS 300 156 120 260 560 860 375 850 250 200 200
B. Other Subsidies (7+8+9) 2,817 944 1,324 3,302 4,190 4,288 6,502 6,693 8,904 7,794 10,461
7 Import/Export of Sugar
8 Interest Subsidies 750 170 564 2,177 2,809 2,311 3,493 2,687 4,680 5,791 7,9689 Other Subsidies 2,067 774 760 1,125 1,381 1,977 3,009 4,006 4,224 2,003 2,493
10 Subsidy on Import of Pulses/edible oils 366 963 616 915
C. Total-Subsidies (A+B) 43,533 44,323 45,957 47,522 57,125 70,926 129,708 141,351 173,420 216,297 190,015
Subsidies as % of Total Subsidies : 2002-03 to 2012-13Actuals
2002-03
Actuals
2003-04
Actuals
2004-05
Actuals
2005-06
Actuals
2006-07
Actuals
2007-08
Actuals
2008-09
Actuals
2009-10
Actuals
2010-11
Revised
2011-12
Budget
2012-13
A. Major Subsidies (1-6) 93.53 97.87 97.12 93.05 92.67 93.95 94.99 95.26 94.87 96.40 94.491 Food 55.53 57.84 59.26 53.01 55.16 71.96 100.50 134.25 146.66 167.28 172.28
2 Indigenous (Urea) Fertiliser 17.89 19.22 22.29 22.42 22.14 18.26 13.85 12.44 8.70 8.83 10.00
3 Imported (Urea) Fertiliser 0.00 0.00 1.07 2.55 5.73 9.31 7.77 3.26 3.72 6.42 7.05
4 Sale of decontrolled fertiliser with concession to Farmers 7.41 7.50 11.19 13.88 18.03 18.24 37.43 27.65 23.51 15.82 15.04
Total Fertilizer Subsidy (2-4) 25.30 26.73 34.55 38.85 45.90 45.81 59.06 43.34 35.92 31.07 32.09
5 Petroleum Subsidy 12.00 14.33 6.43 5.65 4.72 3.98 2.20 10.58 22.13 31.66 22.94
6 Grants to NAFED for MIS/PPS 0.69 0.35 0.26 0.55 0.98 1.21 0.29 0.60 0.14 0.09 0.11
B. Other Subsidies 6.47 2.13 2.88 6.95 7.33 6.05 5.01 4.74 5.13 3.60 5.51
7 Import/Export of Sugar
8 Interest Subsidies 1.72 0.38 1.23 4.58 4.92 3.26 2.69 1.90 2.70 2.68 4.19
9 Other Subsidies 4.75 1.75 1.65 2.37 2.42 2.79 2.32 2.83 2.44 0.93 1.31
10 Subsidy on Import of Pulses/edible oils 0.26 0.56 0.28 0.48
C. Total-Subsidies (A+B) 100.00 100.00 100.00 100.00 100.00 100.00 100.00 100.00 100.00 100.00 100.00
Source : Expenditure Budget Vol. I, 2012-2013 Databook for DCH; 5th December 2012 Page 22 of 266
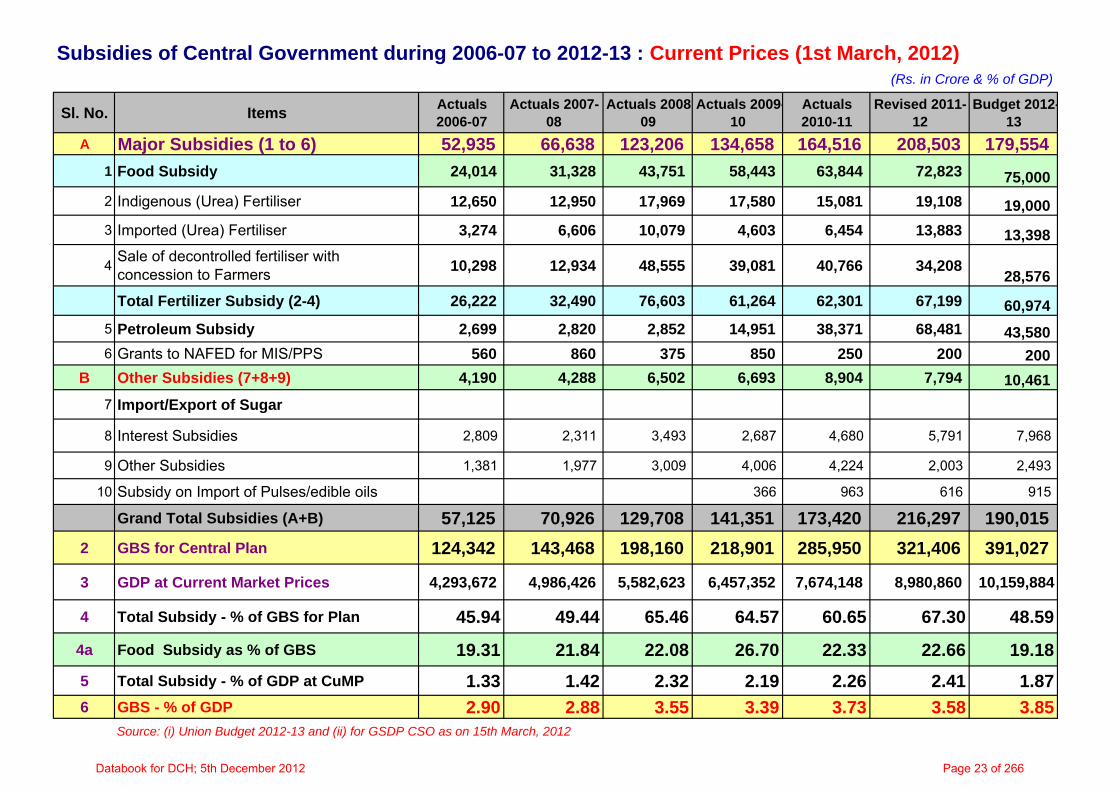
Subsidies of Central Government during 2006-07 to 2012-13 : Current Prices (1st March, 2012)
(Rs. in Crore & % of GDP)
Sl. No. ItemsActuals
2006-07
Actuals 2007-
08
Actuals 2008
09
-Actuals 2009
10
- Actuals
2010-11
Revised 2011-
12
Budget 2012-
13
A Major Subsidies (1 to 6) 52,935 66,638 123,206 134,658 164,516 208,503 179,554
1 Food Subsidy 24,014 31,328 43,751 58,443 63,844 72,823 75,000
2 Indigenous (Urea) Fertiliser 12,650 12,950 17,969 17,580 15,081 19,108 19,000
3 Imported (Urea) Fertiliser 3,274 6,606 10,079 4,603 6,454 13,883 13,398
4 Sale of decontrolled fertiliser with concession to Farmers 10,298 12,934 48,555 39,081 40,766 34,208
28,576
Total Fertilizer Subsidy (2-4) 26,222 32,490 76,603 61,264 62,301 67,199 60,974
5 Petroleum Subsidy 2,699 2,820 2,852 14,951 38,371 68,481 43,580
6 Grants to NAFED for MIS/PPS 560 860 375 850 250 200 200
B Other Subsidies (7+8+9) 4,190 4,288 6,502 6,693 8,904 7,794 10,461
7 Import/Export of Sugar
8 Interest Subsidies 2,809 2,311 3,493 2,687 4,680 5,791 7,968
9 Other Subsidies 1,381 1,977 3,009 4,006 4,224 2,003 2,493
10 Subsidy on Import of Pulses/edible oils 366 963 616 915
Grand Total Subsidies (A+B) 57,125 70,926 129,708 141,351 173,420 216,297 190,015
2 GBS for Central Plan 124,342 143,468 198,160 218,901 285,950 321,406 391,027
3 GDP at Current Market Prices 4,293,672 4,986,426 5,582,623 6,457,352 7,674,148 8,980,860 10,159,884
4 Total Subsidy - % of GBS for Plan 45.94 49.44 65.46 64.57 60.65 67.30 48.59
4a Food Subsidy as % of GBS 19.31 21.84 22.08 26.70 22.33 22.66 19.18
5 Total Subsidy - % of GDP at CuMP 1.33 1.42 2.32 2.19 2.26 2.41 1.87
6 GBS - % of GDP 2.90 2.88 3.55 3.39 3.73 3.58 3.85
Source: (i) Union Budget 2012-13 and (ii) for GSDP CSO as on 15th March, 2012
Databook for DCH; 5th December 2012 Page 23 of 266
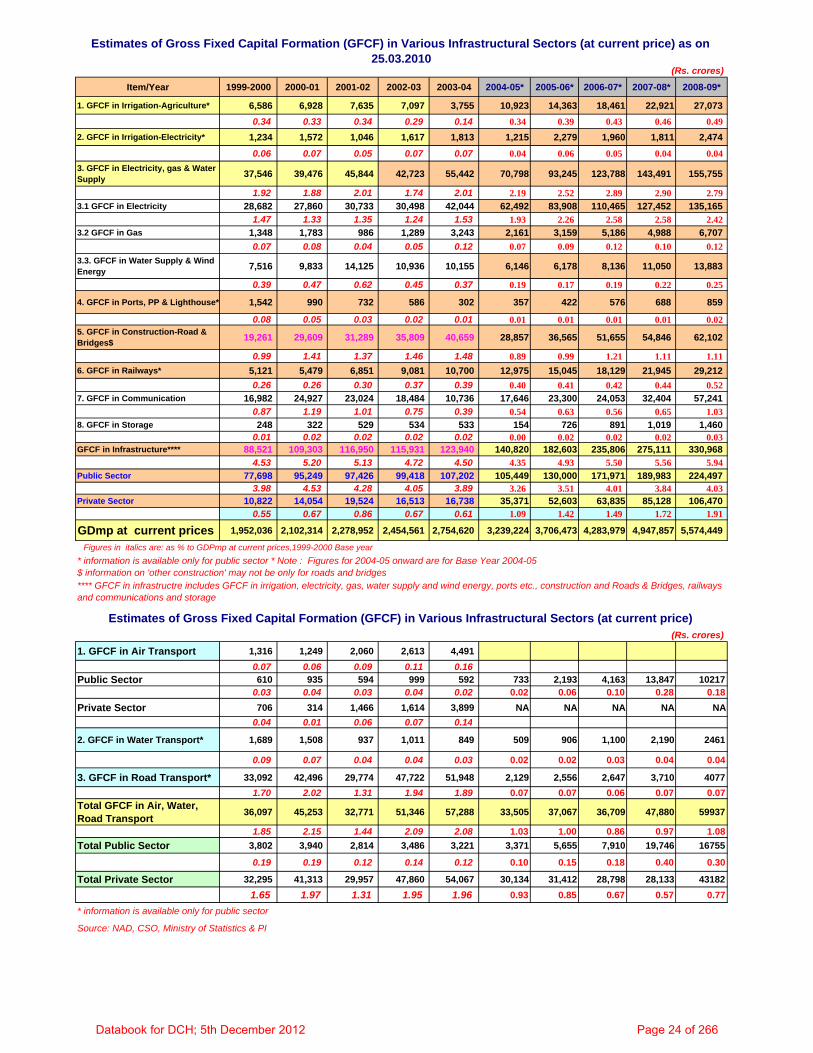
Estimates of Gross Fixed Capital Formation (GFCF) in Various Infrastructural Sectors (at current price) as on 25.03.2010
(Rs. crores)
Item/Year 1999-2000 2000-01 2001-02 2002-03 2003-04 2004-05* 2005-06* 2006-07* 2007-08* 2008-09*
1. GFCF in Irrigation-Agriculture* 6,586 6,928 7,635 7,097 3,755 10,923 14,363 18,461 22,921 27,0730.34 0.33 0.34 0.29 0.14 0.34 0.39 0.43 0.46 0.49
2. GFCF in Irrigation-Electricity* 1,234 1,572 1,046 1,617 1,813 1,215 2,279 1,960 1,811 2,4740.06 0.07 0.05 0.07 0.07 0.04 0.06 0.05 0.04 0.04
3. GFCF in Electricity, gas & Water Supply 37,546 39,476 45,844 42,723 55,442 70,798 93,245 123,788 143,491 155,755
1.92 1.88 2.01 1.74 2.01 2.19 2.52 2.89 2.90 2.793.1 GFCF in Electricity 28,682 27,860 30,733 30,498 42,044 62,492 83,908 110,465 127,452 135,165
1.47 1.33 1.35 1.24 1.53 1.93 2.26 2.58 2.58 2.423.2 GFCF in Gas 1,348 1,783 986 1,289 3,243 2,161 3,159 5,186 4,988 6,707
0.07 0.08 0.04 0.05 0.12 0.07 0.09 0.12 0.10 0.123.3. GFCF in Water Supply & Wind Energy 7,516 9,833 14,125 10,936 10,155 6,146 6,178 8,136 11,050 13,883
0.39 0.47 0.62 0.45 0.37 0.19 0.17 0.19 0.22 0.25
4. GFCF in Ports, PP & Lighthouse* 1,542 990 732 586 302 357 422 576 688 859
0.08 0.05 0.03 0.02 0.01 0.01 0.01 0.01 0.01 0.025. GFCF in Construction-Road & Bridges$ 19,261 29,609 31,289 35,809 40,659 28,857 36,565 51,655 54,846 62,102
0.99 1.41 1.37 1.46 1.48 0.89 0.99 1.21 1.11 1.116. GFCF in Railways* 5,121 5,479 6,851 9,081 10,700 12,975 15,045 18,129 21,945 29,212
0.26 0.26 0.30 0.37 0.39 0.40 0.41 0.42 0.44 0.527. GFCF in Communication 16,982 24,927 23,024 18,484 10,736 17,646 23,300 24,053 32,404 57,241
0.87 1.19 1.01 0.75 0.39 0.54 0.63 0.56 0.65 1.038. GFCF in Storage 248 322 529 534 533 154 726 891 1,019 1,460
0.01 0.02 0.02 0.02 0.02 0.00 0.02 0.02 0.02 0.03GFCF in Infrastructure**** 88,521 109,303 116,950 115,931 123,940 140,820 182,603 235,806 275,111 330,968
4.53 5.20 5.13 4.72 4.50 4.35 4.93 5.50 5.56 5.94Public Sector 77,698 95,249 97,426 99,418 107,202 105,449 130,000 171,971 189,983 224,497
3.98 4.53 4.28 4.05 3.89 3.26 3.51 4.01 3.84 4.03Private Sector 10,822 14,054 19,524 16,513 16,738 35,371 52,603 63,835 85,128 106,470
0.55 0.67 0.86 0.67 0.61 1.09 1.42 1.49 1.72 1.91
GDmp at current prices 1,952,036 2,102,314 2,278,952 2,454,561 2,754,620 3,239,224 3,706,473 4,283,979 4,947,857 5,574,449
Figures in italics are: as % to GDPmp at current prices,1999-2000 Base year* information is available only for public sector * Note : Figures for 2004-05 onward are for Base Year 2004-05$ information on 'other construction' may not be only for roads and bridges**** GFCF in infrastructre includes GFCF in irrigation, electricity, gas, water supply and wind energy, ports etc., construction and Roads & Bridges, railways and communications and storage
Estimates of Gross Fixed Capital Formation (GFCF) in Various Infrastructural Sectors (at current price)(Rs. crores)
1. GFCF in Air Transport 1,316 1,249 2,060 2,613 4,4910.07 0.06 0.09 0.11 0.16
Public Sector 610 935 594 999 592 733 2,193 4,163 13,847 102170.03 0.04 0.03 0.04 0.02 0.02 0.06 0.10 0.28 0.18
Private Sector 706 314 1,466 1,614 3,899 NA NA NA NA NA0.04 0.01 0.06 0.07 0.14
2. GFCF in Water Transport* 1,689 1,508 937 1,011 849 509 906 1,100 2,190 2461
0.09 0.07 0.04 0.04 0.03 0.02 0.02 0.03 0.04 0.04
3. GFCF in Road Transport* 33,092 42,496 29,774 47,722 51,948 2,129 2,556 2,647 3,710 40771.70 2.02 1.31 1.94 1.89 0.07 0.07 0.06 0.07 0.07
Total GFCF in Air, Water, Road Transport 36,097 45,253 32,771 51,346 57,288 33,505 37,067 36,709 47,880 59937
1.85 2.15 1.44 2.09 2.08 1.03 1.00 0.86 0.97 1.08Total Public Sector 3,802 3,940 2,814 3,486 3,221 3,371 5,655 7,910 19,746 16755
0.19 0.19 0.12 0.14 0.12 0.10 0.15 0.18 0.40 0.30
Total Private Sector 32,295 41,313 29,957 47,860 54,067 30,134 31,412 28,798 28,133 431821.65 1.97 1.31 1.95 1.96 0.93 0.85 0.67 0.57 0.77
* information is available only for public sector
Source: NAD, CSO, Ministry of Statistics & PI
Databook for DCH; 5th December 2012 Page 24 of 266
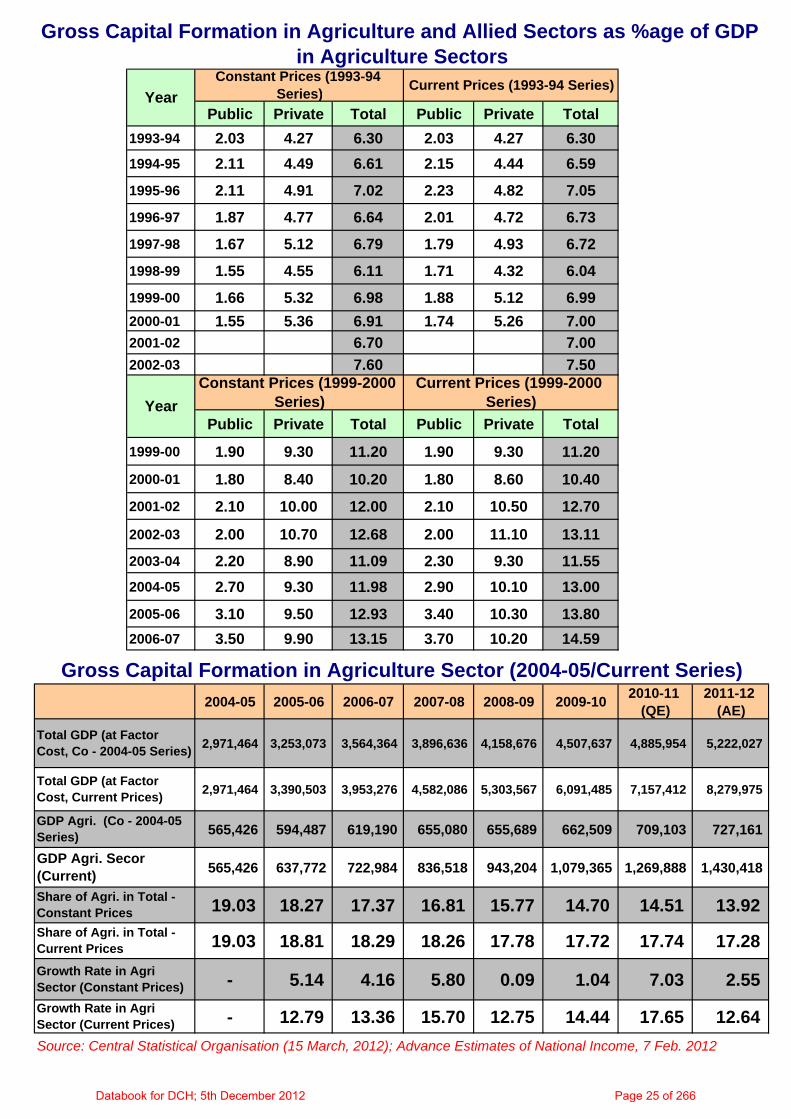
Gross Capital Formation in Agriculture and Allied Sectors as %age of GDP
in Agriculture Sectors
Year
Constant Prices (1993-94
Series)Current Prices (1993-94 Series)
Public Private Total Public Private Total
1993-94 2.03 4.27 6.30 2.03 4.27 6.30
1994-95 2.11 4.49 6.61 2.15 4.44 6.59
1995-96 2.11 4.91 7.02 2.23 4.82 7.05
1996-97 1.87 4.77 6.64 2.01 4.72 6.73
1997-98 1.67 5.12 6.79 1.79 4.93 6.72
1998-99 1.55 4.55 6.11 1.71 4.32 6.04
1999-00 1.66 5.32 6.98 1.88 5.12 6.99
2000-01 1.55 5.36 6.91 1.74 5.26 7.00
2001-02 6.70 7.00
2002-03 7.60 7.50
Year
Constant Prices (1999-2000
Series)
Current Prices (1999-2000
Series)
Public Private Total Public Private Total
1999-00 1.90 9.30 11.20 1.90 9.30 11.20
2000-01 1.80 8.40 10.20 1.80 8.60 10.40
2001-02 2.10 10.00 12.00 2.10 10.50 12.70
2002-03 2.00 10.70 12.68 2.00 11.10 13.11
2003-04 2.20 8.90 11.09 2.30 9.30 11.55
2004-05 2.70 9.30 11.98 2.90 10.10 13.00
2005-06 3.10 9.50 12.93 3.40 10.30 13.80
2006-07 3.50 9.90 13.15 3.70 10.20 14.59
Gross Capital Formation in Agriculture Sector (2004-05/Current Series)
2004-05 2005-06 2006-07 2007-08 2008-09 2009-102010-11
(QE)
2011-12
(AE)
Total GDP (at Factor
Cost, Co - 2004-05 Series)2,971,464 3,253,073 3,564,364 3,896,636 4,158,676 4,507,637 4,885,954 5,222,027
Total GDP (at Factor
Cost, Current Prices)2,971,464 3,390,503 3,953,276 4,582,086 5,303,567 6,091,485 7,157,412 8,279,975
GDP Agri. (Co - 2004-05
Series)565,426 594,487 619,190 655,080 655,689 662,509 709,103 727,161
GDP Agri. Secor
(Current)565,426 637,772 722,984 836,518 943,204 1,079,365 1,269,888 1,430,418
Share of Agri. in Total -
Constant Prices 19.03 18.27 17.37 16.81 15.77 14.70 14.51 13.92
Share of Agri. in Total -
Current Prices 19.03 18.81 18.29 18.26 17.78 17.72 17.74 17.28
Growth Rate in Agri
Sector (Constant Prices) - 5.14 4.16 5.80 0.09 1.04 7.03 2.55
Growth Rate in Agri
Sector (Current Prices) - 12.79 13.36 15.70 12.75 14.44 17.65 12.64
Source: Central Statistical Organisation (15 March, 2012); Advance Estimates of National Income, 7 Feb. 2012
Databook for DCH; 5th December 2012 Page 25 of 266
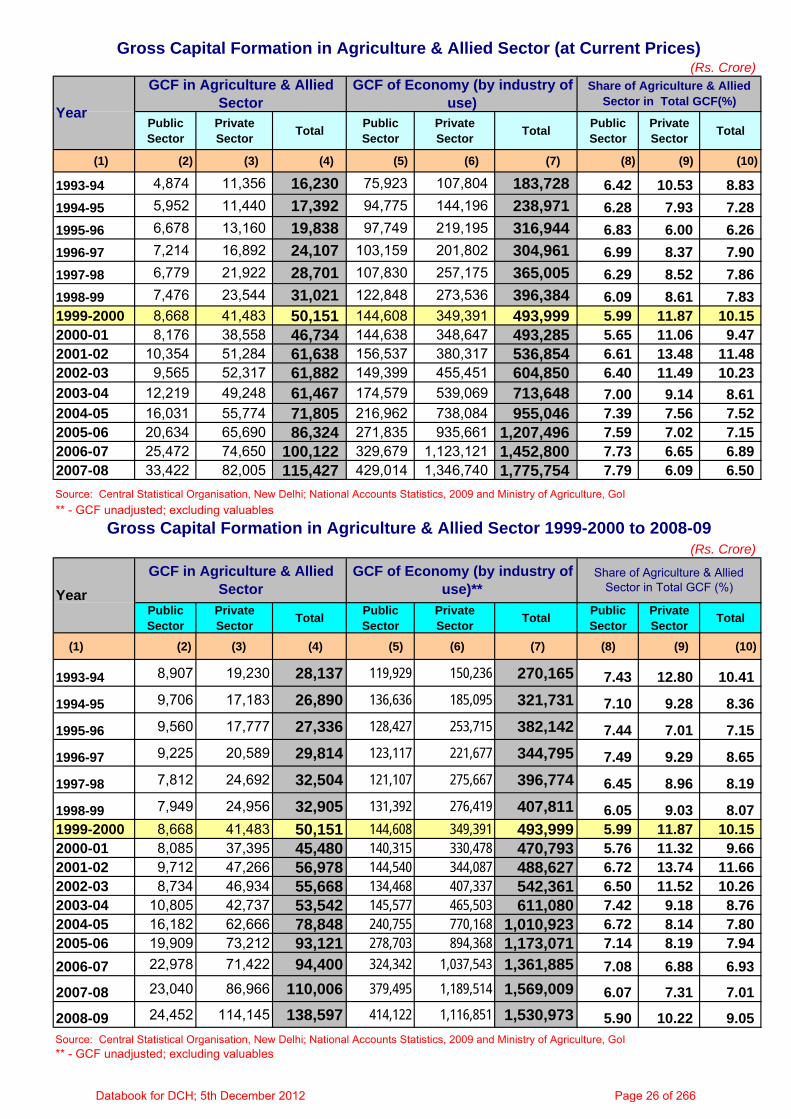
Gross Capital Formation in Agriculture & Allied Sector (at Current Prices)(Rs. Crore)
Year
GCF in Agriculture & Allied
Sector
GCF of Economy (by industry of
use)
Share of Agriculture & Allied
Sector in Total GCF(%)
Public
Sector
Private
SectorTotal
Public
Sector
Private
SectorTotal
Public
Sector
Private
SectorTotal
(1) (2) (3) (4) (5) (6) (7) (8) (9) (10)
1993-94 4,874 11,356 16,230 75,923 107,804 183,728 6.42 10.53 8.83
1994-95 5,952 11,440 17,392 94,775 144,196 238,971 6.28 7.93 7.28
1995-96 6,678 13,160 19,838 97,749 219,195 316,944 6.83 6.00 6.26
1996-97 7,214 16,892 24,107 103,159 201,802 304,961 6.99 8.37 7.90
1997-98 6,779 21,922 28,701 107,830 257,175 365,005 6.29 8.52 7.86
1998-99 7,476 23,544 31,021 122,848 273,536 396,384 6.09 8.61 7.83
1999-2000 8,668 41,483 50,151 144,608 349,391 493,999 5.99 11.87 10.15
2000-01 8,176 38,558 46,734 144,638 348,647 493,285 5.65 11.06 9.47
2001-02 10,354 51,284 61,638 156,537 380,317 536,854 6.61 13.48 11.48
2002-03 9,565 52,317 61,882 149,399 455,451 604,850 6.40 11.49 10.23
2003-04 12,219 49,248 61,467 174,579 539,069 713,648 7.00 9.14 8.61
2004-05 16,031 55,774 71,805 216,962 738,084 955,046 7.39 7.56 7.52
2005-06 20,634 65,690 86,324 271,835 935,661 1,207,496 7.59 7.02 7.15
2006-07 25,472 74,650 100,122 329,679 1,123,121 1,452,800 7.73 6.65 6.89
2007-08 33,422 82,005 115,427 429,014 1,346,740 1,775,754 7.79 6.09 6.50
Source: Central Statistical Organisation, New Delhi; National Accounts Statistics, 2009 and Ministry of Agriculture, GoI** - GCF unadjusted; excluding valuables
Gross Capital Formation in Agriculture & Allied Sector 1999-2000 to 2008-09
(Rs. Crore)
Year
GCF in Agriculture & Allied
Sector
GCF of Economy (by industry of
use)**
Share of Agriculture & Allied Sector in Total GCF (%)
Public
Sector
Private
SectorTotal
Public
Sector
Private
SectorTotal
Public
Sector
Private
SectorTotal
(1) (2) (3) (4) (5) (6) (7) (8) (9) (10)
1993-94 8,907 19,230 28,137 119,929 150,236 270,165 7.43 12.80 10.41
1994-95 9,706 17,183 26,890 136,636 185,095 321,731 7.10 9.28 8.36
1995-96 9,560 17,777 27,336 128,427 253,715 382,142 7.44 7.01 7.15
1996-97 9,225 20,589 29,814 123,117 221,677 344,795 7.49 9.29 8.65
1997-98 7,812 24,692 32,504 121,107 275,667 396,774 6.45 8.96 8.19
1998-99 7,949 24,956 32,905 131,392 276,419 407,811 6.05 9.03 8.07
1999-2000 8,668 41,483 50,151 144,608 349,391 493,999 5.99 11.87 10.15
2000-01 8,085 37,395 45,480 140,315 330,478 470,793 5.76 11.32 9.66
2001-02 9,712 47,266 56,978 144,540 344,087 488,627 6.72 13.74 11.66
2002-03 8,734 46,934 55,668 134,468 407,337 542,361 6.50 11.52 10.26
2003-04 10,805 42,737 53,542 145,577 465,503 611,080 7.42 9.18 8.76
2004-05 16,182 62,666 78,848 240,755 770,168 1,010,923 6.72 8.14 7.80
2005-06 19,909 73,212 93,121 278,703 894,368 1,173,071 7.14 8.19 7.94
2006-07 22,978 71,422 94,400 324,342 1,037,543 1,361,885 7.08 6.88 6.93
2007-08 23,040 86,966 110,006 379,495 1,189,514 1,569,009 6.07 7.31 7.01
2008-09 24,452 114,145 138,597 414,122 1,116,851 1,530,973 5.90 10.22 9.05
Source: Central Statistical Organisation, New Delhi; National Accounts Statistics, 2009 and Ministry of Agriculture, GoI** - GCF unadjusted; excluding valuables
Databook for DCH; 5th December 2012 Page 26 of 266
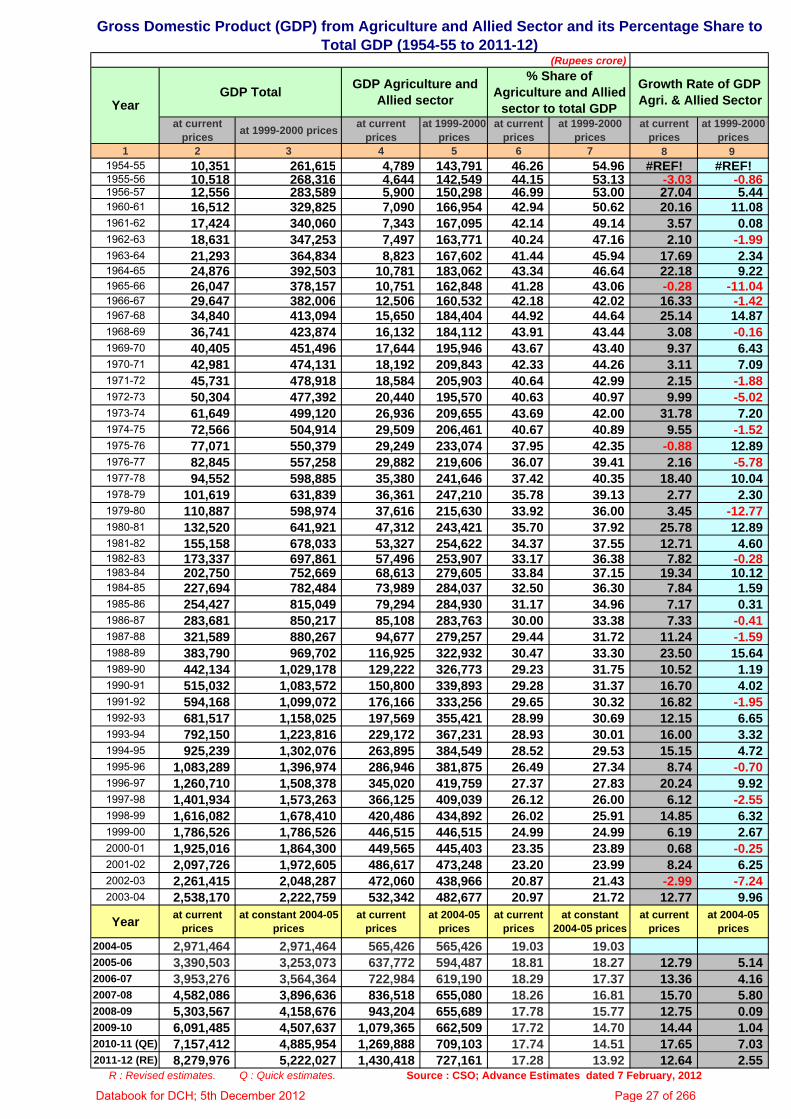
Gross Domestic Product (GDP) from Agriculture and Allied Sector and its Percentage Share to
Total GDP (1954-55 to 2011-12)(Rupees crore)
YearGDP Total
GDP Agriculture and
Allied sector
% Share of
Agriculture and Allied
sector to total GDP
Growth Rate of GDP
Agri. & Allied Sector
at current
pricesat 1999-2000 prices
at current
prices
at 1999-2000
prices
at current
prices
at 1999-2000
prices
at current
prices
at 1999-2000
prices
1 2 3 4 5 6 7 8 9
1954-55 10,351 261,615 4,789 143,791 46.26 54.96 #REF! #REF!1955-56 10,518 268,316 4,644 142,549 44.15 53.13 -3.03 -0.86 1956-57 12,556 283,589 5,900 150,298 46.99 53.00 27.04 5.441960-61 16,512 329,825 7,090 166,954 42.94 50.62 20.16 11.08
1961-62 17,424 340,060 7,343 167,095 42.14 49.14 3.57 0.08
1962-63 18,631 347,253 7,497 163,771 40.24 47.16 2.10 -1.99
1963-64 21,293 364,834 8,823 167,602 41.44 45.94 17.69 2.341964-65 24,876 392,503 10,781 183,062 43.34 46.64 22.18 9.221965-66 26,047 378,157 10,751 162,848 41.28 43.06 -0.28 -11.04 1966-67 29,647 382,006 12,506 160,532 42.18 42.02 16.33 -1.42 1967-68 34,840 413,094 15,650 184,404 44.92 44.64 25.14 14.87
1968-69 36,741 423,874 16,132 184,112 43.91 43.44 3.08 -0.16
1969-70 40,405 451,496 17,644 195,946 43.67 43.40 9.37 6.43
1970-71 42,981 474,131 18,192 209,843 42.33 44.26 3.11 7.09
1971-72 45,731 478,918 18,584 205,903 40.64 42.99 2.15 -1.88
1972-73 50,304 477,392 20,440 195,570 40.63 40.97 9.99 -5.02
1973-74 61,649 499,120 26,936 209,655 43.69 42.00 31.78 7.20
1974-75 72,566 504,914 29,509 206,461 40.67 40.89 9.55 -1.52
1975-76 77,071 550,379 29,249 233,074 37.95 42.35 -0.88 12.89
1976-77 82,845 557,258 29,882 219,606 36.07 39.41 2.16 -5.78
1977-78 94,552 598,885 35,380 241,646 37.42 40.35 18.40 10.04
1978-79 101,619 631,839 36,361 247,210 35.78 39.13 2.77 2.30
1979-80 110,887 598,974 37,616 215,630 33.92 36.00 3.45 -12.77
1980-81 132,520 641,921 47,312 243,421 35.70 37.92 25.78 12.89
1981-82 155,158 678,033 53,327 254,622 34.37 37.55 12.71 4.601982-83 173,337 697,861 57,496 253,907 33.17 36.38 7.82 -0.28 1983-84 202,750 752,669 68,613 279,605 33.84 37.15 19.34 10.121984-85 227,694 782,484 73,989 284,037 32.50 36.30 7.84 1.59
1985-86 254,427 815,049 79,294 284,930 31.17 34.96 7.17 0.31
1986-87 283,681 850,217 85,108 283,763 30.00 33.38 7.33 -0.41
1987-88 321,589 880,267 94,677 279,257 29.44 31.72 11.24 -1.59
1988-89 383,790 969,702 116,925 322,932 30.47 33.30 23.50 15.64
1989-90 442,134 1,029,178 129,222 326,773 29.23 31.75 10.52 1.19
1990-91 515,032 1,083,572 150,800 339,893 29.28 31.37 16.70 4.02
1991-92 594,168 1,099,072 176,166 333,256 29.65 30.32 16.82 -1.95
1992-93 681,517 1,158,025 197,569 355,421 28.99 30.69 12.15 6.65
1993-94 792,150 1,223,816 229,172 367,231 28.93 30.01 16.00 3.32
1994-95 925,239 1,302,076 263,895 384,549 28.52 29.53 15.15 4.72
1995-96 1,083,289 1,396,974 286,946 381,875 26.49 27.34 8.74 -0.70
1996-97 1,260,710 1,508,378 345,020 419,759 27.37 27.83 20.24 9.92
1997-98 1,401,934 1,573,263 366,125 409,039 26.12 26.00 6.12 -2.55
1998-99 1,616,082 1,678,410 420,486 434,892 26.02 25.91 14.85 6.32
1999-00 1,786,526 1,786,526 446,515 446,515 24.99 24.99 6.19 2.67
2000-01 1,925,016 1,864,300 449,565 445,403 23.35 23.89 0.68 -0.25
2001-02 2,097,726 1,972,605 486,617 473,248 23.20 23.99 8.24 6.25
2002-03 2,261,415 2,048,287 472,060 438,966 20.87 21.43 -2.99 -7.24
2003-04 2,538,170 2,222,759 532,342 482,677 20.97 21.72 12.77 9.96
Yearat current
prices
at constant 2004-05
prices
at current
prices
at 2004-05
prices
at current
prices
at constant
2004-05 prices
at current
prices
at 2004-05
prices
2004-05 2,971,464 2,971,464 565,426 565,426 19.03 19.03
2005-06 3,390,503 3,253,073 637,772 594,487 18.81 18.27 12.79 5.14
2006-07 3,953,276 3,564,364 722,984 619,190 18.29 17.37 13.36 4.16
2007-08 4,582,086 3,896,636 836,518 655,080 18.26 16.81 15.70 5.80
2008-09 5,303,567 4,158,676 943,204 655,689 17.78 15.77 12.75 0.09
2009-10 6,091,485 4,507,637 1,079,365 662,509 17.72 14.70 14.44 1.04
2010-11 (QE) 7,157,412 4,885,954 1,269,888 709,103 17.74 14.51 17.65 7.03
2011-12 (RE) 8,279,976 5,222,027 1,430,418 727,161 17.28 13.92 12.64 2.55R : Revised estimates. Q : Quick estimates. Source : CSO; Advance Estimates dated 7 February, 2012
Databook for DCH; 5th December 2012 Page 27 of 266
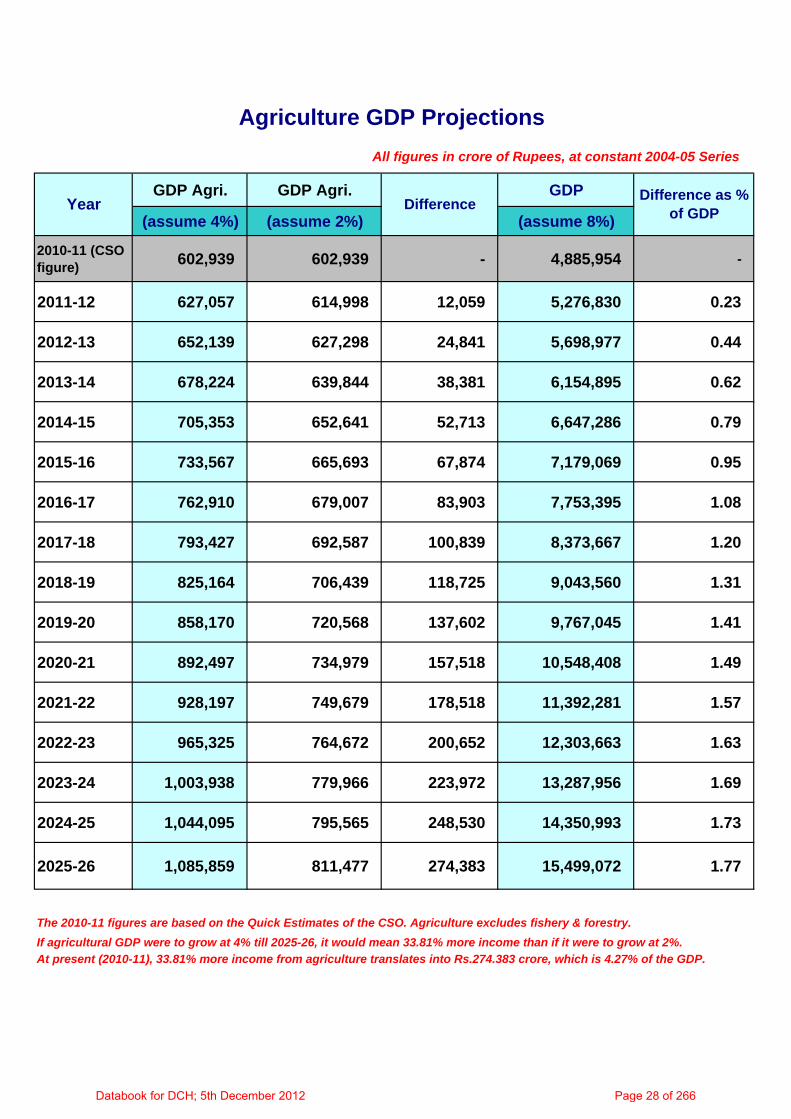
Agriculture GDP Projections
All figures in crore of Rupees, at constant 2004-05 Series
YearGDP Agri. GDP Agri.
DifferenceGDP Difference as %
of GDP (assume 4%) (assume 2%) (assume 8%)
2010-11 (CSO
figure)602,939 602,939 - 4,885,954 -
2011-12 627,057 614,998 12,059 5,276,830 0.23
2012-13 652,139 627,298 24,841 5,698,977 0.44
2013-14 678,224 639,844 38,381 6,154,895 0.62
2014-15 705,353 652,641 52,713 6,647,286 0.79
2015-16 733,567 665,693 67,874 7,179,069 0.95
2016-17 762,910 679,007 83,903 7,753,395 1.08
2017-18 793,427 692,587 100,839 8,373,667 1.20
2018-19 825,164 706,439 118,725 9,043,560 1.31
2019-20 858,170 720,568 137,602 9,767,045 1.41
2020-21 892,497 734,979 157,518 10,548,408 1.49
2021-22 928,197 749,679 178,518 11,392,281 1.57
2022-23 965,325 764,672 200,652 12,303,663 1.63
2023-24 1,003,938 779,966 223,972 13,287,956 1.69
2024-25 1,044,095 795,565 248,530 14,350,993 1.73
2025-26 1,085,859 811,477 274,383 15,499,072 1.77
The 2010-11 figures are based on the Quick Estimates of the CSO. Agriculture excludes fishery & forestry.If agricultural GDP were to grow at 4% till 2025-26, it would mean 33.81% more income than if it were to grow at 2%. At present (2010-11), 33.81% more income from agriculture translates into Rs.274.383 crore, which is 4.27% of the GDP.
Databook for DCH; 5th December 2012 Page 28 of 266
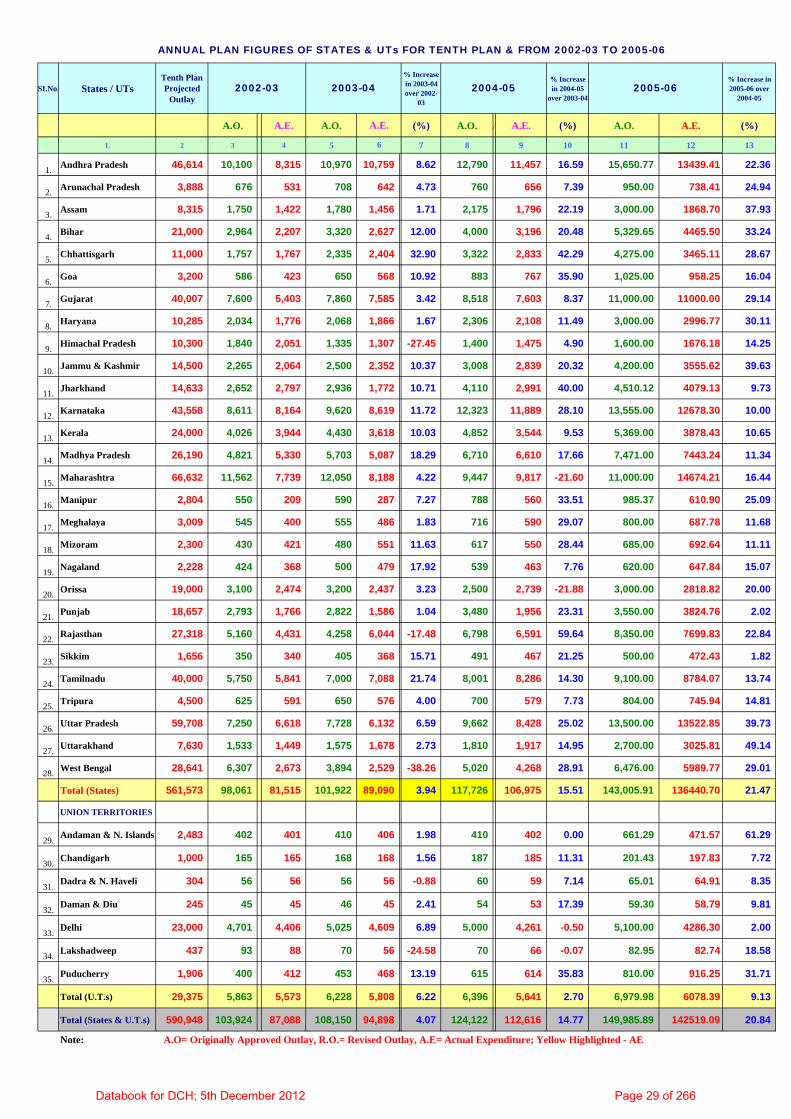
ANNUAL PLAN FIGURES OF STATES & UTs FOR TENTH PLAN & FROM 2002-03 TO 2005-06
SI.No. States / UTsTenth Plan Projected
Outlay
% Increase in 2003-04 over 2002-
03
% Increase in 2004-05
over 2003-04
% Increase in 2005-06 over
2004-05
A.O. A.E. A.O. (%) A.O. A.E. (%) A.O. A.E. (%)
1. 2 3 4 5 7 8 9 10 11 12 13
1. Andhra Pradesh 46,614 10,100 8,315 10,970 10,759 8.62 12,790 11,457 16.59 15,650.77 13439.41 22.36
2. Arunachal Pradesh 3,888 676 531 708 642 4.73 760 656 7.39 950.00 738.41 24.94
3. Assam 8,315 1,750 1,422 1,780 1,456 1.71 2,175 1,796 22.19 3,000.00 1868.70 37.93
4. Bihar 21,000 2,964 2,207 3,320 2,627 12.00 4,000 3,196 20.48 5,329.65 4465.50 33.24
5. Chhattisgarh 11,000 1,757 1,767 2,335 2,404 32.90 3,322 2,833 42.29 4,275.00 3465.11 28.67
6. Goa 3,200 586 423 650 568 10.92 883 767 35.90 1,025.00 958.25 16.04
7. Gujarat 40,007 7,600 5,403 7,860 7,585 3.42 8,518 7,603 8.37 11,000.00 11000.00 29.14
8. Haryana 10,285 2,034 1,776 2,068 1,866 1.67 2,306 2,108 11.49 3,000.00 2996.77 30.11
9. Himachal Pradesh 10,300 1,840 2,051 1,335 1,307 -27.45 1,400 1,475 4.90 1,600.00 1676.18 14.25
10. Jammu & Kashmir 14,500 2,265 2,064 2,500 2,352 10.37 3,008 2,839 20.32 4,200.00 3555.62 39.63
11. Jharkhand 14,633 2,652 2,797 2,936 1,772 10.71 4,110 2,991 40.00 4,510.12 4079.13 9.73
12. Karnataka 43,558 8,611 8,164 9,620 8,619 11.72 12,323 11,889 28.10 13,555.00 12678.30 10.00
13. Kerala 24,000 4,026 3,944 4,430 3,618 10.03 4,852 3,544 9.53 5,369.00 3878.43 10.65
14. Madhya Pradesh 26,190 4,821 5,330 5,703 5,087 18.29 6,710 6,610 17.66 7,471.00 7443.24 11.34
15. Maharashtra 66,632 11,562 7,739 12,050 8,188 4.22 9,447 9,817 -21.60 11,000.00 14674.21 16.44
16. Manipur 2,804 550 209 590 287 7.27 788 560 33.51 985.37 610.90 25.09
17. Meghalaya 3,009 545 400 555 486 1.83 716 590 29.07 800.00 687.78 11.68
18. Mizoram 2,300 430 421 480 551 11.63 617 550 28.44 685.00 692.64 11.11
19. Nagaland 2,228 424 368 500 479 17.92 539 463 7.76 620.00 647.84 15.07
20. Orissa 19,000 3,100 2,474 3,200 2,437 3.23 2,500 2,739 -21.88 3,000.00 2818.82 20.00
21. Punjab 18,657 2,793 1,766 2,822 1,586 1.04 3,480 1,956 23.31 3,550.00 3824.76 2.02
22. Rajasthan 27,318 5,160 4,431 4,258 6,044 -17.48 6,798 6,591 59.64 8,350.00 7699.83 22.84
23. Sikkim 1,656 350 340 405 368 15.71 491 467 21.25 500.00 472.43 1.82
24. Tamilnadu 40,000 5,750 5,841 7,000 7,088 21.74 8,001 8,286 14.30 9,100.00 8784.07 13.74
25. Tripura 4,500 625 591 650 576 4.00 700 579 7.73 804.00 745.94 14.81
26. Uttar Pradesh 59,708 7,250 6,618 7,728 6,132 6.59 9,662 8,428 25.02 13,500.00 13522.85 39.73
27. Uttarakhand 7,630 1,533 1,449 1,575 1,678 2.73 1,810 1,917 14.95 2,700.00 3025.81 49.14
28. West Bengal 28,641 6,307 2,673 3,894 2,529 -38.26 5,020 4,268 28.91 6,476.00 5989.77 29.01
Total (States) 561,573 98,061 81,515 101,922 89,090 3.94 117,726 106,975 15.51 143,005.91 136440.70 21.47
UNION TERRITORIES
29. Andaman & N. Islands 2,483 402 401 410 406 1.98 410 402 0.00 661.29 471.57 61.29
30. Chandigarh 1,000 165 165 168 168 1.56 187 185 11.31 201.43 197.83 7.72
31. Dadra & N. Haveli 304 56 56 56 56 -0.88 60 59 7.14 65.01 64.91 8.35
32. Daman & Diu 245 45 45 46 45 2.41 54 53 17.39 59.30 58.79 9.81
33. Delhi 23,000 4,701 4,406 5,025 4,609 6.89 5,000 4,261 -0.50 5,100.00 4286.30 2.00
34. Lakshadweep 437 93 88 70 56 -24.58 70 66 -0.07 82.95 82.74 18.58
35. Puducherry 1,906 400 412 453 468 13.19 615 614 35.83 810.00 916.25 31.71
Total (U.T.s) 29,375 5,863 5,573 6,228 5,808 6.22 6,396 5,641 2.70 6,979.98 6078.39 9.13
Total (States & U.T.s) 590,948 103,924 87,088 108,150 94,898 4.07 124,122 112,616 14.77 149,985.89 142519.09 20.84
Note: A.O= Originally Approved Outlay, R.O.= Revised Outlay, A.E= Actual Expenditure; Yellow Highlighted - AE
6
.OA.E.
2002-03 2004-05 2005-062003-04
Databook for DCH; 5th December 2012 Page 29 of 266
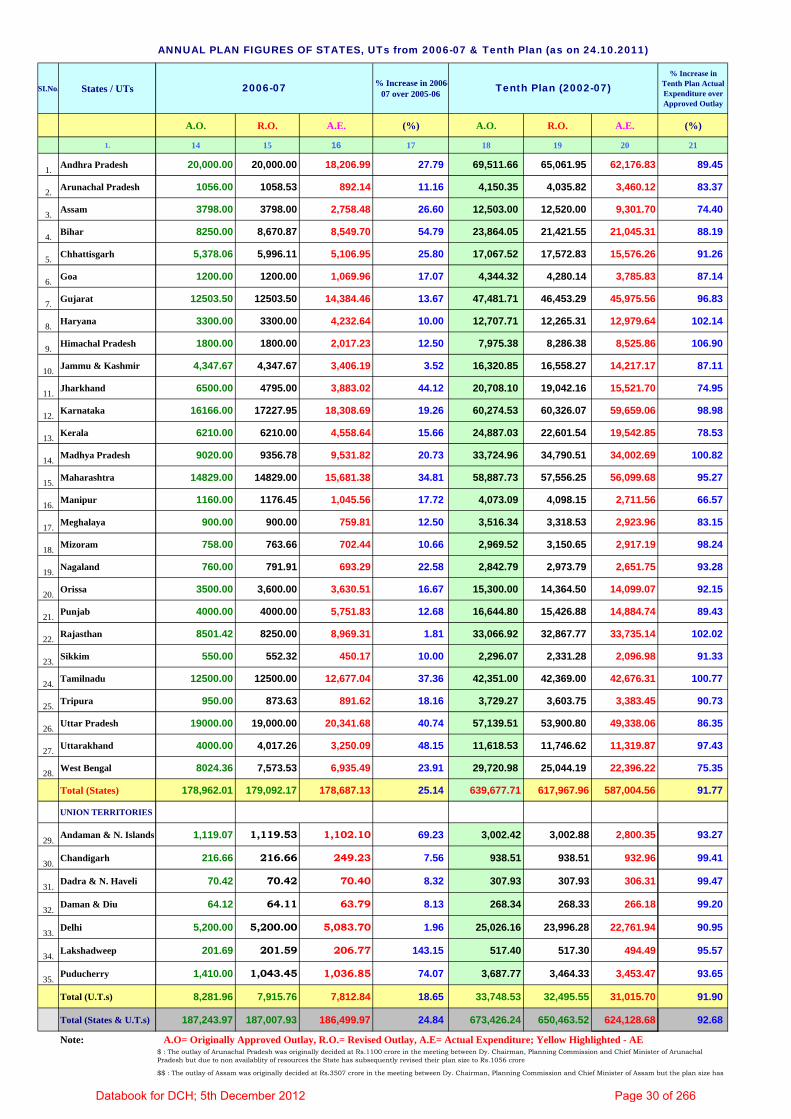
SI.No. States / UTs
1.
1. Andhra Pradesh
2. Arunachal Pradesh
3. Assam
4. Bihar
5. Chhattisgarh
6. Goa
7. Gujarat
8. Haryana
9. Himachal Pradesh
10. Jammu & Kashmir
11. Jharkhand
12. Karnataka
13. Kerala
14. Madhya Pradesh
15. Maharashtra
16. Manipur
17. Meghalaya
18. Mizoram
19. Nagaland
20. Orissa
21. Punjab
22. Rajasthan
23. Sikkim
24. Tamilnadu
25. Tripura
26. Uttar Pradesh
27. Uttarakhand
28. West Bengal
Total (States)
UNION TERRITORIES
29. Andaman & N. Islands
30. Chandigarh
31. Dadra & N. Haveli
32. Daman & Diu
33. Delhi
34. Lakshadweep
35. Puducherry
Total (U.T.s)
Total (States & U.T.s)
Note:
ANNUAL PLAN FIGURES OF STATES, UTs from 2006-07 & Tenth Plan (as on 24.10.2011)
% Increase in 2006-07 over 2005-06
% Increase in Tenth Plan Actual Expenditure over Approved Outlay
A.O. R.O. A.E. (%) A.O. R.O. A.E. (%)
14 15 16 17 18 19 20 21
20,000.00 20,000.00 18,206.99 27.79 69,511.66 65,061.95 62,176.83 89.45
1056.00 1058.53 892.14 11.16 4,150.35 4,035.82 3,460.12 83.37
3798.00 3798.00 2,758.48 26.60 12,503.00 12,520.00 9,301.70 74.40
8250.00 8,670.87 8,549.70 54.79 23,864.05 21,421.55 21,045.31 88.19
5,378.06 5,996.11 5,106.95 25.80 17,067.52 17,572.83 15,576.26 91.26
1200.00 1200.00 1,069.96 17.07 4,344.32 4,280.14 3,785.83 87.14
12503.50 12503.50 14,384.46 13.67 47,481.71 46,453.29 45,975.56 96.83
3300.00 3300.00 4,232.64 10.00 12,707.71 12,265.31 12,979.64 102.14
1800.00 1800.00 2,017.23 12.50 7,975.38 8,286.38 8,525.86 106.90
4,347.67 4,347.67 3,406.19 3.52 16,320.85 16,558.27 14,217.17 87.11
6500.00 4795.00 3,883.02 44.12 20,708.10 19,042.16 15,521.70 74.95
16166.00 17227.95 18,308.69 19.26 60,274.53 60,326.07 59,659.06 98.98
6210.00 6210.00 4,558.64 15.66 24,887.03 22,601.54 19,542.85 78.53
9020.00 9356.78 9,531.82 20.73 33,724.96 34,790.51 34,002.69 100.82
14829.00 14829.00 15,681.38 34.81 58,887.73 57,556.25 56,099.68 95.27
1160.00 1176.45 1,045.56 17.72 4,073.09 4,098.15 2,711.56 66.57
900.00 900.00 759.81 12.50 3,516.34 3,318.53 2,923.96 83.15
758.00 763.66 702.44 10.66 2,969.52 3,150.65 2,917.19 98.24
760.00 791.91 693.29 22.58 2,842.79 2,973.79 2,651.75 93.28
3500.00 3,600.00 3,630.51 16.67 15,300.00 14,364.50 14,099.07 92.15
4000.00 4000.00 5,751.83 12.68 16,644.80 15,426.88 14,884.74 89.43
8501.42 8250.00 8,969.31 1.81 33,066.92 32,867.77 33,735.14 102.02
550.00 552.32 450.17 10.00 2,296.07 2,331.28 2,096.98 91.33
12500.00 12500.00 12,677.04 37.36 42,351.00 42,369.00 42,676.31 100.77
950.00 873.63 891.62 18.16 3,729.27 3,603.75 3,383.45 90.73
19000.00 19,000.00 20,341.68 40.74 57,139.51 53,900.80 49,338.06 86.35
4000.00 4,017.26 3,250.09 48.15 11,618.53 11,746.62 11,319.87 97.43
8024.36 7,573.53 6,935.49 23.91 29,720.98 25,044.19 22,396.22 75.35
178,962.01 179,092.17 178,687.13 25.14 639,677.71 617,967.96 587,004.56 91.77
1,119.07 1,119.53 1,102.10 69.23 3,002.42 3,002.88 2,800.35 93.27
216.66 216.66 249.23 7.56 938.51 938.51 932.96 99.41
70.42 70.42 70.40 8.32 307.93 307.93 306.31 99.47
64.12 64.11 63.79 8.13 268.34 268.33 266.18 99.20
5,200.00 5,200.00 5,083.70 1.96 25,026.16 23,996.28 22,761.94 90.95
201.69 201.59 206.77 143.15 517.40 517.30 494.49 95.57
1,410.00 1,043.45 1,036.85 74.07 3,687.77 3,464.33 3,453.47 93.65
8,281.96 7,915.76 7,812.84 18.65 33,748.53 32,495.55 31,015.70 91.90
187,243.97 187,007.93 186,499.97 24.84 673,426.24 650,463.52 624,128.68 92.68
A.O= Originally Approved Outlay, R.O.= Revised Outlay, A.E= Actual Expenditure; Yellow Highlighted - AE$ : The outlay of Arunachal Pradesh was originally decided at Rs.1100 crore in the meeting between Dy. Chairman, Planning Commission and Chief Minister of Arunachal Pradesh but due to non availablity of resources the State has subsequently revised their plan size to Rs.1056 crore
$$ : The outlay of Assam was originally decided at Rs.3507 crore in the meeting between Dy. Chairman, Planning Commission and Chief Minister of Assam but the plan size has
Tenth Plan (2002-07)2006-07
Databook for DCH; 5th December 2012 Page 30 of 266
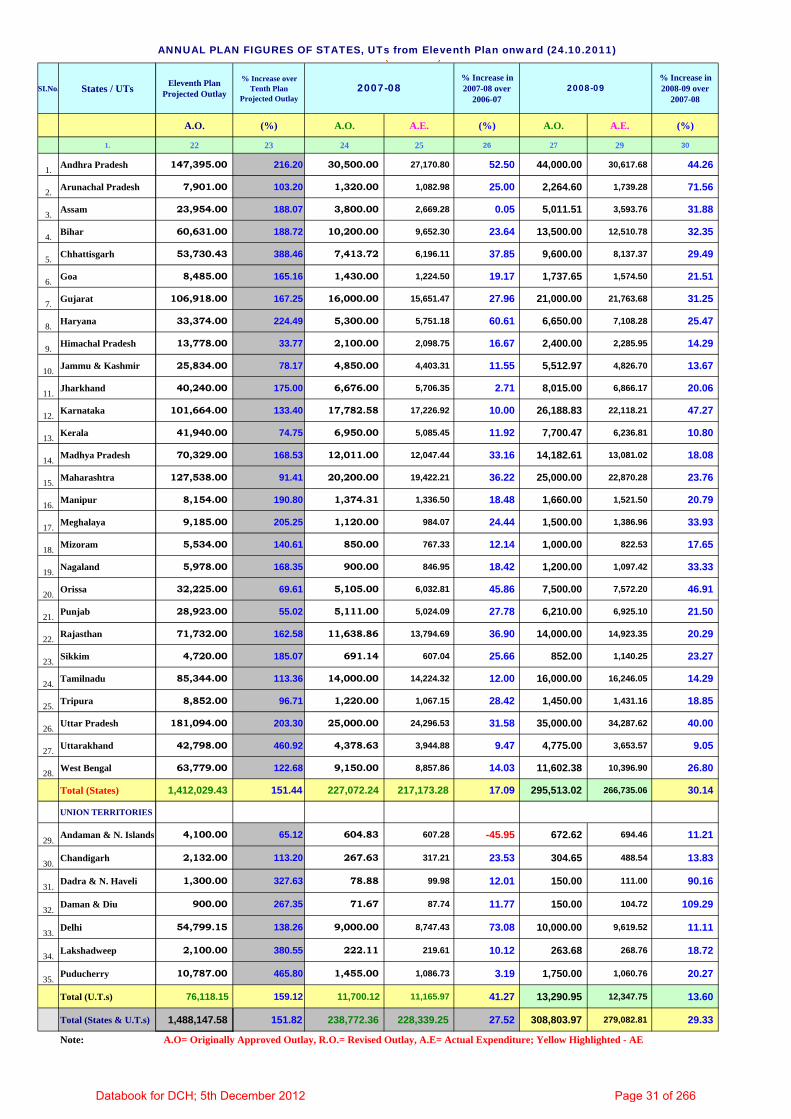
SI.No. States / UTs
1.
1. Andhra Pradesh
2. Arunachal Pradesh
3. Assam
4. Bihar
5. Chhattisgarh
6. Goa
7. Gujarat
8. Haryana
9. Himachal Pradesh
10. Jammu & Kashmir
11. Jharkhand
12. Karnataka
13. Kerala
14. Madhya Pradesh
15. Maharashtra
16. Manipur
17. Meghalaya
18. Mizoram
19. Nagaland
20. Orissa
21. Punjab
22. Rajasthan
23. Sikkim
24. Tamilnadu
25. Tripura
26. Uttar Pradesh
27. Uttarakhand
28. West Bengal
Total (States)
UNION TERRITORIES
29. Andaman & N. Islands
30. Chandigarh
31. Dadra & N. Haveli
32. Daman & Diu
33. Delhi
34. Lakshadweep
35. Puducherry
Total (U.T.s)
Total (States & U.T.s)
Note:
ANNUAL PLAN FIGURES OF STATES, UTs from Eleventh Plan onward (24.10.2011)( )
Eleventh Plan Projected Outlay
% Increase over Tenth Plan
Projected Outlay
% Increase in 2007-08 over
2006-07
% Increase in 2008-09 over
2007-08
A.O. (%) A.O. A.E. (%) A.O. A.E. (%)
22 23 24 25 26 27 29 30
147,395.00 216.20 30,500.00 27,170.80 52.50 44,000.00 30,617.68 44.26
7,901.00 103.20 1,320.00 1,082.98 25.00 2,264.60 1,739.28 71.56
23,954.00 188.07 3,800.00 2,669.28 0.05 5,011.51 3,593.76 31.88
60,631.00 188.72 10,200.00 9,652.30 23.64 13,500.00 12,510.78 32.35
53,730.43 388.46 7,413.72 6,196.11 37.85 9,600.00 8,137.37 29.49
8,485.00 165.16 1,430.00 1,224.50 19.17 1,737.65 1,574.50 21.51
106,918.00 167.25 16,000.00 15,651.47 27.96 21,000.00 21,763.68 31.25
33,374.00 224.49 5,300.00 5,751.18 60.61 6,650.00 7,108.28 25.47
13,778.00 33.77 2,100.00 2,098.75 16.67 2,400.00 2,285.95 14.29
25,834.00 78.17 4,850.00 4,403.31 11.55 5,512.97 4,826.70 13.67
40,240.00 175.00 6,676.00 5,706.35 2.71 8,015.00 6,866.17 20.06
101,664.00 133.40 17,782.58 17,226.92 10.00 26,188.83 22,118.21 47.27
41,940.00 74.75 6,950.00 5,085.45 11.92 7,700.47 6,236.81 10.80
70,329.00 168.53 12,011.00 12,047.44 33.16 14,182.61 13,081.02 18.08
127,538.00 91.41 20,200.00 19,422.21 36.22 25,000.00 22,870.28 23.76
8,154.00 190.80 1,374.31 1,336.50 18.48 1,660.00 1,521.50 20.79
9,185.00 205.25 1,120.00 984.07 24.44 1,500.00 1,386.96 33.93
5,534.00 140.61 850.00 767.33 12.14 1,000.00 822.53 17.65
5,978.00 168.35 900.00 846.95 18.42 1,200.00 1,097.42 33.33
32,225.00 69.61 5,105.00 6,032.81 45.86 7,500.00 7,572.20 46.91
28,923.00 55.02 5,111.00 5,024.09 27.78 6,210.00 6,925.10 21.50
71,732.00 162.58 11,638.86 13,794.69 36.90 14,000.00 14,923.35 20.29
4,720.00 185.07 691.14 607.04 25.66 852.00 1,140.25 23.27
85,344.00 113.36 14,000.00 14,224.32 12.00 16,000.00 16,246.05 14.29
8,852.00 96.71 1,220.00 1,067.15 28.42 1,450.00 1,431.16 18.85
181,094.00 203.30 25,000.00 24,296.53 31.58 35,000.00 34,287.62 40.00
42,798.00 460.92 4,378.63 3,944.88 9.47 4,775.00 3,653.57 9.05
63,779.00 122.68 9,150.00 8,857.86 14.03 11,602.38 10,396.90 26.80
1,412,029.43 151.44 227,072.24 217,173.28 17.09 295,513.02 266,735.06 30.14
4,100.00 65.12 604.83 607.28 -45.95 672.62 694.46 11.21
2,132.00 113.20 267.63 317.21 23.53 304.65 488.54 13.83
1,300.00 327.63 78.88 99.98 12.01 150.00 111.00 90.16
900.00 267.35 71.67 87.74 11.77 150.00 104.72 109.29
54,799.15 138.26 9,000.00 8,747.43 73.08 10,000.00 9,619.52 11.11
2,100.00 380.55 222.11 219.61 10.12 263.68 268.76 18.72
10,787.00 465.80 1,455.00 1,086.73 3.19 1,750.00 1,060.76 20.27
76,118.15 159.12 11,700.12 11,165.97 41.27 13,290.95 12,347.75 13.60
1,488,147.58 151.82 238,772.36 228,339.25 27.52 308,803.97 279,082.81 29.33
A.O= Originally Approved Outlay, R.O.= Revised Outlay, A.E= Actual Expenditure; Yellow Highlighted - AE
2007-08 2008-09
Databook for DCH; 5th December 2012 Page 31 of 266
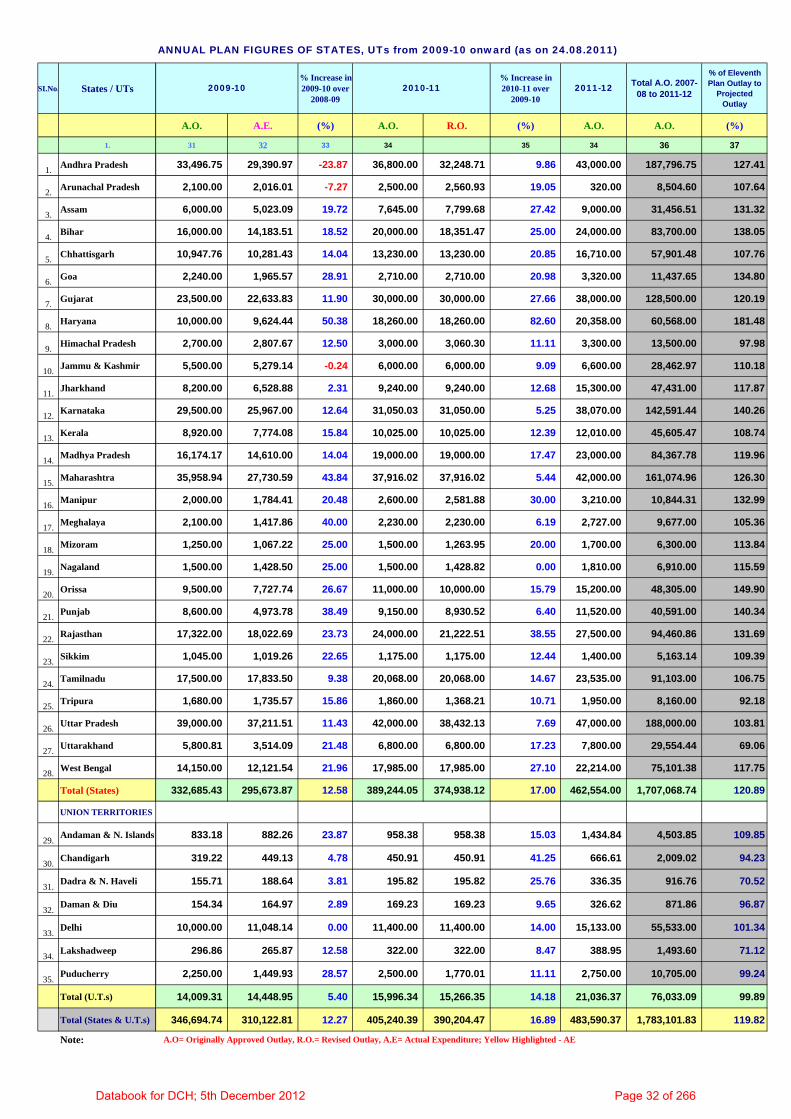
SI.No. States / UTs
1.
1. Andhra Pradesh
2. Arunachal Pradesh
3. Assam
4. Bihar
5. Chhattisgarh
6. Goa
7. Gujarat
8. Haryana
9. Himachal Pradesh
10. Jammu & Kashmir
11. Jharkhand
12. Karnataka
13. Kerala
14. Madhya Pradesh
15. Maharashtra
16. Manipur
17. Meghalaya
18. Mizoram
19. Nagaland
20. Orissa
21. Punjab
22. Rajasthan
23. Sikkim
24. Tamilnadu
25. Tripura
26. Uttar Pradesh
27. Uttarakhand
28. West Bengal
Total (States)
UNION TERRITORIES
29. Andaman & N. Islands
30. Chandigarh
31. Dadra & N. Haveli
32. Daman & Diu
33. Delhi
34. Lakshadweep
35. Puducherry
Total (U.T.s)
Total (States & U.T.s)
Note:
ANNUAL PLAN FIGURES OF STATES, UTs from 2009-10 onward (as on 24.08.2011)
% Increase in 2009-10 over
2008-09
% Increase in 2010-11 over
2009-10
Total A.O. 2007-
08 to 2011-12
% of Eleventh
Plan Outlay to
Projected
Outlay
A.O. A.E. (%) A.O. R.O. (%) A.O. A.O. (%)
31 32 33 34 35 34 36 37
33,496.75 29,390.97 -23.87 36,800.00 32,248.71 9.86 43,000.00 187,796.75 127.41
2,100.00 2,016.01 -7.27 2,500.00 2,560.93 19.05 320.00 8,504.60 107.64
6,000.00 5,023.09 19.72 7,645.00 7,799.68 27.42 9,000.00 31,456.51 131.32
16,000.00 14,183.51 18.52 20,000.00 18,351.47 25.00 24,000.00 83,700.00 138.05
10,947.76 10,281.43 14.04 13,230.00 13,230.00 20.85 16,710.00 57,901.48 107.76
2,240.00 1,965.57 28.91 2,710.00 2,710.00 20.98 3,320.00 11,437.65 134.80
23,500.00 22,633.83 11.90 30,000.00 30,000.00 27.66 38,000.00 128,500.00 120.19
10,000.00 9,624.44 50.38 18,260.00 18,260.00 82.60 20,358.00 60,568.00 181.48
2,700.00 2,807.67 12.50 3,000.00 3,060.30 11.11 3,300.00 13,500.00 97.98
5,500.00 5,279.14 -0.24 6,000.00 6,000.00 9.09 6,600.00 28,462.97 110.18
8,200.00 6,528.88 2.31 9,240.00 9,240.00 12.68 15,300.00 47,431.00 117.87
29,500.00 25,967.00 12.64 31,050.03 31,050.00 5.25 38,070.00 142,591.44 140.26
8,920.00 7,774.08 15.84 10,025.00 10,025.00 12.39 12,010.00 45,605.47 108.74
16,174.17 14,610.00 14.04 19,000.00 19,000.00 17.47 23,000.00 84,367.78 119.96
35,958.94 27,730.59 43.84 37,916.02 37,916.02 5.44 42,000.00 161,074.96 126.30
2,000.00 1,784.41 20.48 2,600.00 2,581.88 30.00 3,210.00 10,844.31 132.99
2,100.00 1,417.86 40.00 2,230.00 2,230.00 6.19 2,727.00 9,677.00 105.36
1,250.00 1,067.22 25.00 1,500.00 1,263.95 20.00 1,700.00 6,300.00 113.84
1,500.00 1,428.50 25.00 1,500.00 1,428.82 0.00 1,810.00 6,910.00 115.59
9,500.00 7,727.74 26.67 11,000.00 10,000.00 15.79 15,200.00 48,305.00 149.90
8,600.00 4,973.78 38.49 9,150.00 8,930.52 6.40 11,520.00 40,591.00 140.34
17,322.00 18,022.69 23.73 24,000.00 21,222.51 38.55 27,500.00 94,460.86 131.69
1,045.00 1,019.26 22.65 1,175.00 1,175.00 12.44 1,400.00 5,163.14 109.39
17,500.00 17,833.50 9.38 20,068.00 20,068.00 14.67 23,535.00 91,103.00 106.75
1,680.00 1,735.57 15.86 1,860.00 1,368.21 10.71 1,950.00 8,160.00 92.18
39,000.00 37,211.51 11.43 42,000.00 38,432.13 7.69 47,000.00 188,000.00 103.81
5,800.81 3,514.09 21.48 6,800.00 6,800.00 17.23 7,800.00 29,554.44 69.06
14,150.00 12,121.54 21.96 17,985.00 17,985.00 27.10 22,214.00 75,101.38 117.75
332,685.43 295,673.87 12.58 389,244.05 374,938.12 17.00 462,554.00 1,707,068.74 120.89
833.18 882.26 23.87 958.38 958.38 15.03 1,434.84 4,503.85 109.85
319.22 449.13 4.78 450.91 450.91 41.25 666.61 2,009.02 94.23
155.71 188.64 3.81 195.82 195.82 25.76 336.35 916.76 70.52
154.34 164.97 2.89 169.23 169.23 9.65 326.62 871.86 96.87
10,000.00 11,048.14 0.00 11,400.00 11,400.00 14.00 15,133.00 55,533.00 101.34
296.86 265.87 12.58 322.00 322.00 8.47 388.95 1,493.60 71.12
2,250.00 1,449.93 28.57 2,500.00 1,770.01 11.11 2,750.00 10,705.00 99.24
14,009.31 14,448.95 5.40 15,996.34 15,266.35 14.18 21,036.37 76,033.09 99.89
346,694.74 310,122.81 12.27 405,240.39 390,204.47 16.89 483,590.37 1,783,101.83 119.82
A.O= Originally Approved Outlay, R.O.= Revised Outlay, A.E= Actual Expenditure; Yellow Highlighted - AE
2011-122010-112009-10
Databook for DCH; 5th December 2012 Page 32 of 266
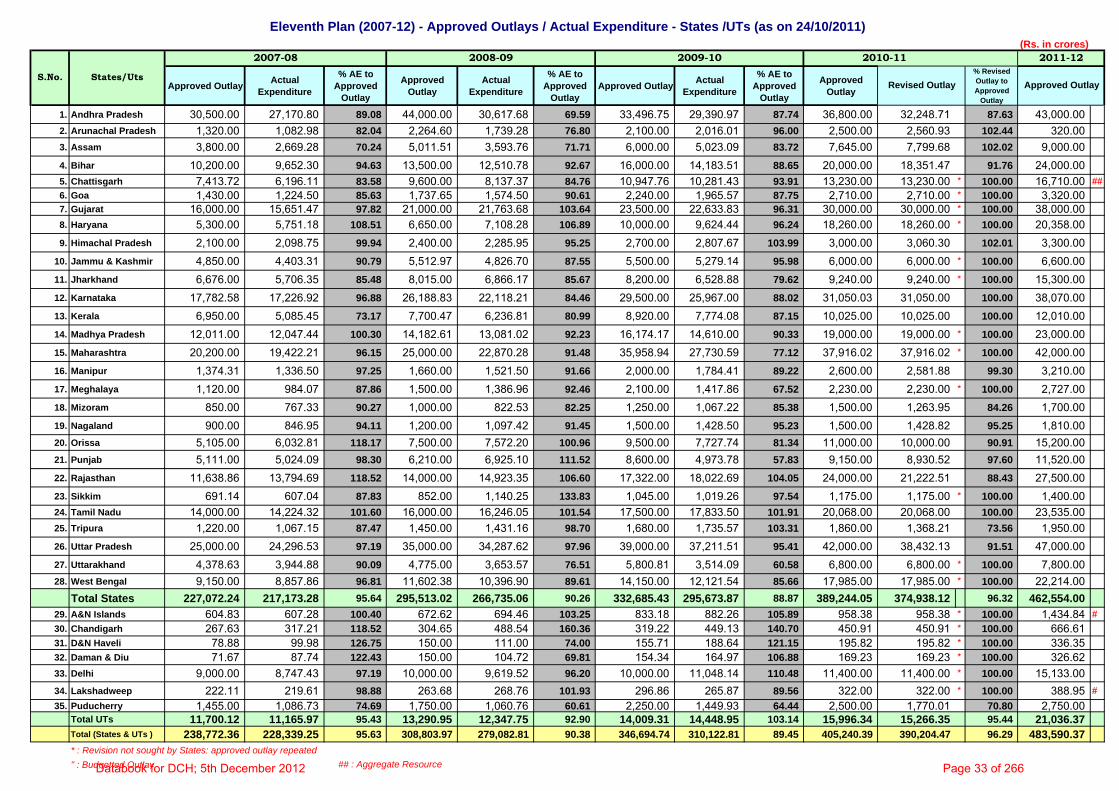
(Rs. in crores)
Approved Outlay Actual
Expenditure
% AE to
Approved
Outlay
Approved
Outlay
Actual
Expenditure
% AE to
Approved
Outlay
Approved Outlay Actual
Expenditure
% AE to
Approved
Outlay
Approved
Outlay
% Revised
Outlay to
Approved
Outlay
1. Andhra Pradesh 30,500.00 27,170.80 89.08 44,000.00 30,617.68 69.59 33,496.75 29,390.97 87.74 36,800.00 32,248.71 87.63 43,000.002. Arunachal Pradesh 1,320.00 1,082.98 82.04 2,264.60 1,739.28 76.80 2,100.00 2,016.01 96.00 2,500.00 2,560.93 102.44 320.003. Assam 3,800.00 2,669.28 70.24 5,011.51 3,593.76 71.71 6,000.00 5,023.09 83.72 7,645.00 7,799.68 102.02 9,000.004. Bihar 10,200.00 9,652.30 94.63 13,500.00 12,510.78 92.67 16,000.00 14,183.51 88.65 20,000.00 18,351.47 91.76 24,000.005. Chattisgarh 7,413.72 6,196.11 83.58 9,600.00 8,137.37 84.76 10,947.76 10,281.43 93.91 13,230.00 13,230.00 * 100.00 16,710.00 ##6. Goa 1,430.00 1,224.50 85.63 1,737.65 1,574.50 90.61 2,240.00 1,965.57 87.75 2,710.00 2,710.00 * 100.00 3,320.007. Gujarat 16,000.00 15,651.47 97.82 21,000.00 21,763.68 103.64 23,500.00 22,633.83 96.31 30,000.00 30,000.00 * 100.00 38,000.008. Haryana 5,300.00 5,751.18 108.51 6,650.00 7,108.28 106.89 10,000.00 9,624.44 96.24 18,260.00 18,260.00 * 100.00 20,358.009. Himachal Pradesh 2,100.00 2,098.75 99.94 2,400.00 2,285.95 95.25 2,700.00 2,807.67 103.99 3,000.00 3,060.30 102.01 3,300.00
10. Jammu & Kashmir 4,850.00 4,403.31 90.79 5,512.97 4,826.70 87.55 5,500.00 5,279.14 95.98 6,000.00 6,000.00 * 100.00 6,600.0011. Jharkhand 6,676.00 5,706.35 85.48 8,015.00 6,866.17 85.67 8,200.00 6,528.88 79.62 9,240.00 9,240.00 * 100.00 15,300.0012. Karnataka 17,782.58 17,226.92 96.88 26,188.83 22,118.21 84.46 29,500.00 25,967.00 88.02 31,050.03 31,050.00 100.00 38,070.0013. Kerala 6,950.00 5,085.45 73.17 7,700.47 6,236.81 80.99 8,920.00 7,774.08 87.15 10,025.00 10,025.00 100.00 12,010.0014. Madhya Pradesh 12,011.00 12,047.44 100.30 14,182.61 13,081.02 92.23 16,174.17 14,610.00 90.33 19,000.00 19,000.00 * 100.00 23,000.0015. Maharashtra 20,200.00 19,422.21 96.15 25,000.00 22,870.28 91.48 35,958.94 27,730.59 77.12 37,916.02 37,916.02 * 100.00 42,000.0016. Manipur 1,374.31 1,336.50 97.25 1,660.00 1,521.50 91.66 2,000.00 1,784.41 89.22 2,600.00 2,581.88 99.30 3,210.0017. Meghalaya 1,120.00 984.07 87.86 1,500.00 1,386.96 92.46 2,100.00 1,417.86 67.52 2,230.00 2,230.00 * 100.00 2,727.0018. Mizoram 850.00 767.33 90.27 1,000.00 822.53 82.25 1,250.00 1,067.22 85.38 1,500.00 1,263.95 84.26 1,700.0019. Nagaland 900.00 846.95 94.11 1,200.00 1,097.42 91.45 1,500.00 1,428.50 95.23 1,500.00 1,428.82 95.25 1,810.0020. Orissa 5,105.00 6,032.81 118.17 7,500.00 7,572.20 100.96 9,500.00 7,727.74 81.34 11,000.00 10,000.00 90.91 15,200.0021. Punjab 5,111.00 5,024.09 98.30 6,210.00 6,925.10 111.52 8,600.00 4,973.78 57.83 9,150.00 8,930.52 97.60 11,520.0022. Rajasthan 11,638.86 13,794.69 118.52 14,000.00 14,923.35 106.60 17,322.00 18,022.69 104.05 24,000.00 21,222.51 88.43 27,500.0023. Sikkim 691.14 607.04 87.83 852.00 1,140.25 133.83 1,045.00 1,019.26 97.54 1,175.00 1,175.00 * 100.00 1,400.0024. Tamil Nadu 14,000.00 14,224.32 101.60 16,000.00 16,246.05 101.54 17,500.00 17,833.50 101.91 20,068.00 20,068.00 100.00 23,535.0025. Tripura 1,220.00 1,067.15 87.47 1,450.00 1,431.16 98.70 1,680.00 1,735.57 103.31 1,860.00 1,368.21 73.56 1,950.0026. Uttar Pradesh 25,000.00 24,296.53 97.19 35,000.00 34,287.62 97.96 39,000.00 37,211.51 95.41 42,000.00 38,432.13 91.51 47,000.0027. Uttarakhand 4,378.63 3,944.88 90.09 4,775.00 3,653.57 76.51 5,800.81 3,514.09 60.58 6,800.00 6,800.00 * 100.00 7,800.0028. West Bengal 9,150.00 8,857.86 96.81 11,602.38 10,396.90 89.61 14,150.00 12,121.54 85.66 17,985.00 17,985.00 * 100.00 22,214.00
Total States 227,072.24 217,173.28 95.64 295,513.02 266,735.06 90.26 332,685.43 295,673.87 88.87 389,244.05 374,938.12 96.32 462,554.00
29. A&N Islands 604.83 607.28 100.40 672.62 694.46 103.25 833.18 882.26 105.89 958.38 958.38 * 100.00 1,434.84 #30. Chandigarh 267.63 317.21 118.52 304.65 488.54 160.36 319.22 449.13 140.70 450.91 450.91 * 100.00 666.6131. D&N Haveli 78.88 99.98 126.75 150.00 111.00 74.00 155.71 188.64 121.15 195.82 195.82 * 100.00 336.3532. Daman & Diu 71.67 87.74 122.43 150.00 104.72 69.81 154.34 164.97 106.88 169.23 169.23 * 100.00 326.6233. Delhi 9,000.00 8,747.43 97.19 10,000.00 9,619.52 96.20 10,000.00 11,048.14 110.48 11,400.00 11,400.00 * 100.00 15,133.0034. Lakshadweep 222.11 219.61 98.88 263.68 268.76 101.93 296.86 265.87 89.56 322.00 322.00 * 100.00 388.95 #35. Puducherry 1,455.00 1,086.73 74.69 1,750.00 1,060.76 60.61 2,250.00 1,449.93 64.44 2,500.00 1,770.01 70.80 2,750.00
Total UTs 11,700.12 11,165.97 95.43 13,290.95 12,347.75 92.90 14,009.31 14,448.95 103.14 15,996.34 15,266.35 95.44 21,036.37
Total (States & UTs ) 238,772.36 228,339.25 95.63 308,803.97 279,082.81 90.38 346,694.74 310,122.81 89.45 405,240.39 390,204.47 96.29 483,590.37
" : Budgetted Outlay* : Revision not sought by States: approved outlay repeated
## : Aggregate Resource
2008-09 2009-10 2011-12
Approved Outlay Revised Outlay
2010-11
Eleventh Plan (2007-12) - Approved Outlays / Actual Expenditure - States /UTs (as on 24/10/2011)
S.No. States/Uts
2007-08
Databook for DCH; 5th December 2012 Page 33 of 266
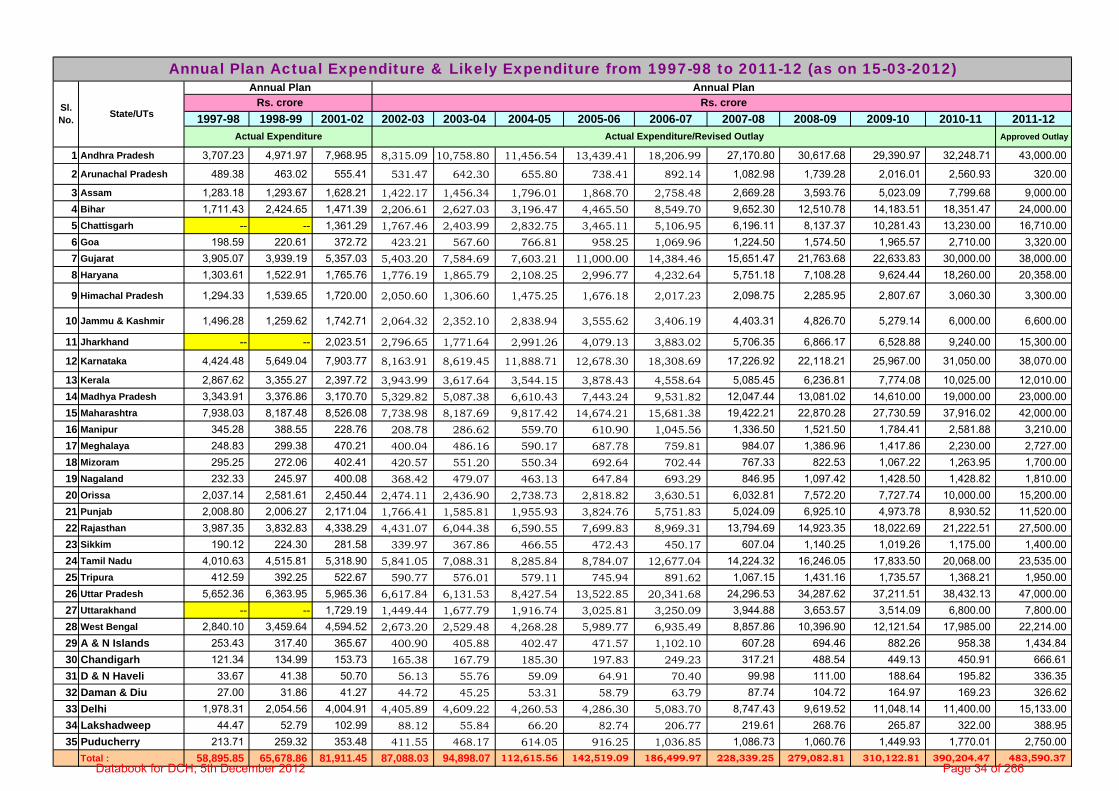
Annual Plan Actual Expenditure & Likely Expenditure from 1997-98 to 2011-12 (as on 15-03-2012)
Sl.
No.State/UTs
Annual Plan Annual Plan
Rs. crore Rs. crore
1997-98 1998-99 2001-02 2002-03 2003-04 2004-05 2005-06 2006-07 2007-08 2008-09 2009-10 2010-11 2011-12
Actual Expenditure Actual Expenditure/Revised Outlay Approved Outlay
1 Andhra Pradesh 3,707.23 4,971.97 7,968.95 8,315.09 10,758.80 11,456.54 13,439.41 18,206.99 27,170.80 30,617.68 29,390.97 32,248.71 43,000.00
2 Arunachal Pradesh 489.38 463.02 555.41 531.47 642.30 655.80 738.41 892.14 1,082.98 1,739.28 2,016.01 2,560.93 320.00
3 Assam 1,283.18 1,293.67 1,628.21 1,422.17 1,456.34 1,796.01 1,868.70 2,758.48 2,669.28 3,593.76 5,023.09 7,799.68 9,000.004 Bihar 1,711.43 2,424.65 1,471.39 2,206.61 2,627.03 3,196.47 4,465.50 8,549.70 9,652.30 12,510.78 14,183.51 18,351.47 24,000.005 Chattisgarh -- -- 1,361.29 1,767.46 2,403.99 2,832.75 3,465.11 5,106.95 6,196.11 8,137.37 10,281.43 13,230.00 16,710.006 Goa 198.59 220.61 372.72 423.21 567.60 766.81 958.25 1,069.96 1,224.50 1,574.50 1,965.57 2,710.00 3,320.007 Gujarat 3,905.07 3,939.19 5,357.03 5,403.20 7,584.69 7,603.21 11,000.00 14,384.46 15,651.47 21,763.68 22,633.83 30,000.00 38,000.008 Haryana 1,303.61 1,522.91 1,765.76 1,776.19 1,865.79 2,108.25 2,996.77 4,232.64 5,751.18 7,108.28 9,624.44 18,260.00 20,358.00
9 Himachal Pradesh 1,294.33 1,539.65 1,720.00 2,050.60 1,306.60 1,475.25 1,676.18 2,017.23 2,098.75 2,285.95 2,807.67 3,060.30 3,300.00
10 Jammu & Kashmir 1,496.28 1,259.62 1,742.71 2,064.32 2,352.10 2,838.94 3,555.62 3,406.19 4,403.31 4,826.70 5,279.14 6,000.00 6,600.00
11 Jharkhand -- -- 2,023.51 2,796.65 1,771.64 2,991.26 4,079.13 3,883.02 5,706.35 6,866.17 6,528.88 9,240.00 15,300.00
12 Karnataka 4,424.48 5,649.04 7,903.77 8,163.91 8,619.45 11,888.71 12,678.30 18,308.69 17,226.92 22,118.21 25,967.00 31,050.00 38,070.00
13 Kerala 2,867.62 3,355.27 2,397.72 3,943.99 3,617.64 3,544.15 3,878.43 4,558.64 5,085.45 6,236.81 7,774.08 10,025.00 12,010.0014 Madhya Pradesh 3,343.91 3,376.86 3,170.70 5,329.82 5,087.38 6,610.43 7,443.24 9,531.82 12,047.44 13,081.02 14,610.00 19,000.00 23,000.0015 Maharashtra 7,938.03 8,187.48 8,526.08 7,738.98 8,187.69 9,817.42 14,674.21 15,681.38 19,422.21 22,870.28 27,730.59 37,916.02 42,000.0016 Manipur 345.28 388.55 228.76 208.78 286.62 559.70 610.90 1,045.56 1,336.50 1,521.50 1,784.41 2,581.88 3,210.0017 Meghalaya 248.83 299.38 470.21 400.04 486.16 590.17 687.78 759.81 984.07 1,386.96 1,417.86 2,230.00 2,727.0018 Mizoram 295.25 272.06 402.41 420.57 551.20 550.34 692.64 702.44 767.33 822.53 1,067.22 1,263.95 1,700.0019 Nagaland 232.33 245.97 400.08 368.42 479.07 463.13 647.84 693.29 846.95 1,097.42 1,428.50 1,428.82 1,810.0020 Orissa 2,037.14 2,581.61 2,450.44 2,474.11 2,436.90 2,738.73 2,818.82 3,630.51 6,032.81 7,572.20 7,727.74 10,000.00 15,200.0021 Punjab 2,008.80 2,006.27 2,171.04 1,766.41 1,585.81 1,955.93 3,824.76 5,751.83 5,024.09 6,925.10 4,973.78 8,930.52 11,520.0022 Rajasthan 3,987.35 3,832.83 4,338.29 4,431.07 6,044.38 6,590.55 7,699.83 8,969.31 13,794.69 14,923.35 18,022.69 21,222.51 27,500.0023 Sikkim 190.12 224.30 281.58 339.97 367.86 466.55 472.43 450.17 607.04 1,140.25 1,019.26 1,175.00 1,400.0024 Tamil Nadu 4,010.63 4,515.81 5,318.90 5,841.05 7,088.31 8,285.84 8,784.07 12,677.04 14,224.32 16,246.05 17,833.50 20,068.00 23,535.0025 Tripura 412.59 392.25 522.67 590.77 576.01 579.11 745.94 891.62 1,067.15 1,431.16 1,735.57 1,368.21 1,950.0026 Uttar Pradesh 5,652.36 6,363.95 5,965.36 6,617.84 6,131.53 8,427.54 13,522.85 20,341.68 24,296.53 34,287.62 37,211.51 38,432.13 47,000.0027 Uttarakhand -- -- 1,729.19 1,449.44 1,677.79 1,916.74 3,025.81 3,250.09 3,944.88 3,653.57 3,514.09 6,800.00 7,800.0028 West Bengal 2,840.10 3,459.64 4,594.52 2,673.20 2,529.48 4,268.28 5,989.77 6,935.49 8,857.86 10,396.90 12,121.54 17,985.00 22,214.0029 A & N Islands 253.43 317.40 365.67 400.90 405.88 402.47 471.57 1,102.10 607.28 694.46 882.26 958.38 1,434.8430 Chandigarh 121.34 134.99 153.73 165.38 167.79 185.30 197.83 249.23 317.21 488.54 449.13 450.91 666.6131 D & N Haveli 33.67 41.38 50.70 56.13 55.76 59.09 64.91 70.40 99.98 111.00 188.64 195.82 336.3532 Daman & Diu 27.00 31.86 41.27 44.72 45.25 53.31 58.79 63.79 87.74 104.72 164.97 169.23 326.6233 Delhi 1,978.31 2,054.56 4,004.91 4,405.89 4,609.22 4,260.53 4,286.30 5,083.70 8,747.43 9,619.52 11,048.14 11,400.00 15,133.0034 Lakshadweep 44.47 52.79 102.99 88.12 55.84 66.20 82.74 206.77 219.61 268.76 265.87 322.00 388.9535 Puducherry 213.71 259.32 353.48 411.55 468.17 614.05 916.25 1,036.85 1,086.73 1,060.76 1,449.93 1,770.01 2,750.00
Total : 58,895.85 65,678.86 81,911.45 87,088.03 94,898.07 112,615.56 142,519.09 186,499.97 228,339.25 279,082.81 310,122.81 390,204.47 483,590.37Databook for DCH; 5th December 2012 Page 34 of 266
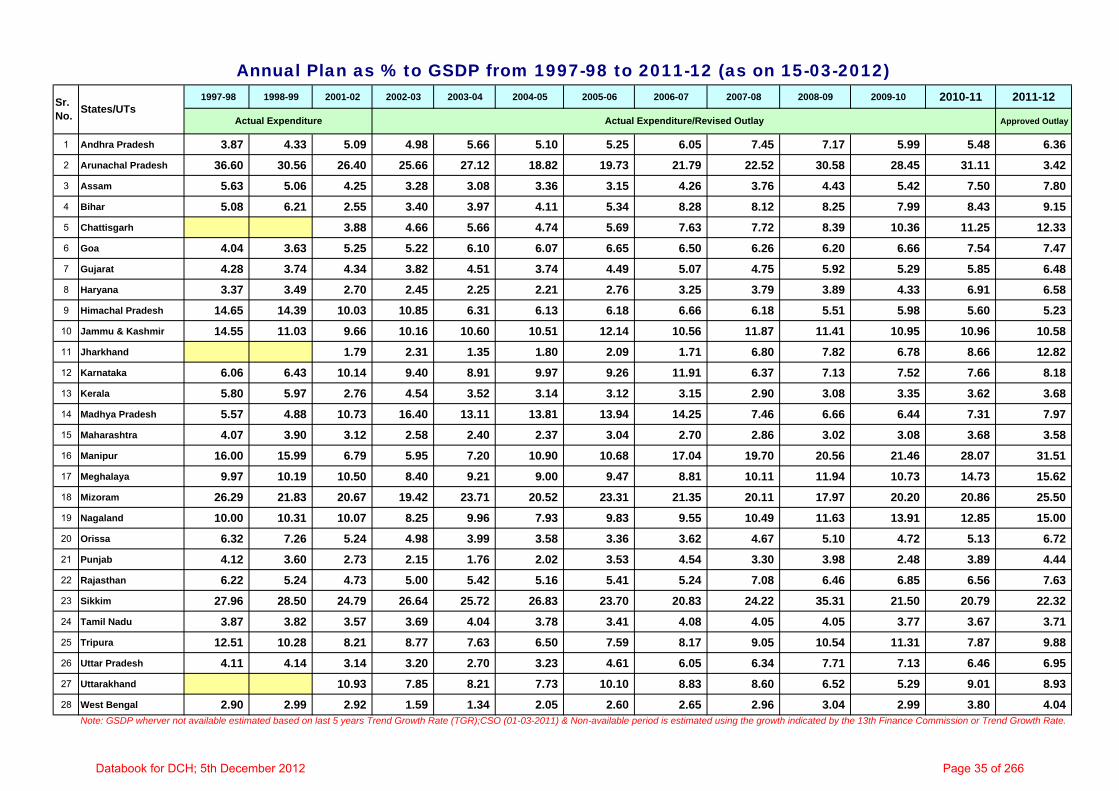
Annual Plan as % to GSDP from 1997-98 to 2011-12 (as on 15-03-2012)Sr.
No.States/UTs
1997-98 1998-99 2001-02 2002-03 2003-04 2004-05 2005-06 2006-07 2007-08 2008-09 2009-10 2010-11 2011-12
Actual Expenditure Actual Expenditure/Revised Outlay Approved Outlay
1 Andhra Pradesh 3.87 4.33 5.09 4.98 5.66 5.10 5.25 6.05 7.45 7.17 5.99 5.48 6.36
2 Arunachal Pradesh 36.60 30.56 26.40 25.66 27.12 18.82 19.73 21.79 22.52 30.58 28.45 31.11 3.42
3 Assam 5.63 5.06 4.25 3.28 3.08 3.36 3.15 4.26 3.76 4.43 5.42 7.50 7.80
4 Bihar 5.08 6.21 2.55 3.40 3.97 4.11 5.34 8.28 8.12 8.25 7.99 8.43 9.15
5 Chattisgarh 3.88 4.66 5.66 4.74 5.69 7.63 7.72 8.39 10.36 11.25 12.33
6 Goa 4.04 3.63 5.25 5.22 6.10 6.07 6.65 6.50 6.26 6.20 6.66 7.54 7.47
7 Gujarat 4.28 3.74 4.34 3.82 4.51 3.74 4.49 5.07 4.75 5.92 5.29 5.85 6.48
8 Haryana 3.37 3.49 2.70 2.45 2.25 2.21 2.76 3.25 3.79 3.89 4.33 6.91 6.58
9 Himachal Pradesh 14.65 14.39 10.03 10.85 6.31 6.13 6.18 6.66 6.18 5.51 5.98 5.60 5.23
10 Jammu & Kashmir 14.55 11.03 9.66 10.16 10.60 10.51 12.14 10.56 11.87 11.41 10.95 10.96 10.58
11 Jharkhand 1.79 2.31 1.35 1.80 2.09 1.71 6.80 7.82 6.78 8.66 12.82
12 Karnataka 6.06 6.43 10.14 9.40 8.91 9.97 9.26 11.91 6.37 7.13 7.52 7.66 8.18
13 Kerala 5.80 5.97 2.76 4.54 3.52 3.14 3.12 3.15 2.90 3.08 3.35 3.62 3.68
14 Madhya Pradesh 5.57 4.88 10.73 16.40 13.11 13.81 13.94 14.25 7.46 6.66 6.44 7.31 7.97
15 Maharashtra 4.07 3.90 3.12 2.58 2.40 2.37 3.04 2.70 2.86 3.02 3.08 3.68 3.58
16 Manipur 16.00 15.99 6.79 5.95 7.20 10.90 10.68 17.04 19.70 20.56 21.46 28.07 31.51
17 Meghalaya 9.97 10.19 10.50 8.40 9.21 9.00 9.47 8.81 10.11 11.94 10.73 14.73 15.62
18 Mizoram 26.29 21.83 20.67 19.42 23.71 20.52 23.31 21.35 20.11 17.97 20.20 20.86 25.50
19 Nagaland 10.00 10.31 10.07 8.25 9.96 7.93 9.83 9.55 10.49 11.63 13.91 12.85 15.00
20 Orissa 6.32 7.26 5.24 4.98 3.99 3.58 3.36 3.62 4.67 5.10 4.72 5.13 6.72
21 Punjab 4.12 3.60 2.73 2.15 1.76 2.02 3.53 4.54 3.30 3.98 2.48 3.89 4.44
22 Rajasthan 6.22 5.24 4.73 5.00 5.42 5.16 5.41 5.24 7.08 6.46 6.85 6.56 7.63
23 Sikkim 27.96 28.50 24.79 26.64 25.72 26.83 23.70 20.83 24.22 35.31 21.50 20.79 22.32
24 Tamil Nadu 3.87 3.82 3.57 3.69 4.04 3.78 3.41 4.08 4.05 4.05 3.77 3.67 3.71
25 Tripura 12.51 10.28 8.21 8.77 7.63 6.50 7.59 8.17 9.05 10.54 11.31 7.87 9.88
26 Uttar Pradesh 4.11 4.14 3.14 3.20 2.70 3.23 4.61 6.05 6.34 7.71 7.13 6.46 6.95
27 Uttarakhand 10.93 7.85 8.21 7.73 10.10 8.83 8.60 6.52 5.29 9.01 8.93
28 West Bengal 2.90 2.99 2.92 1.59 1.34 2.05 2.60 2.65 2.96 3.04 2.99 3.80 4.04
Note: GSDP wherver not available estimated based on last 5 years Trend Growth Rate (TGR);CSO (01-03-2011) & Non-available period is estimated using the growth indicated by the 13th Finance Commission or Trend Growth Rate.
Databook for DCH; 5th December 2012 Page 35 of 266

SI.No. States / UTs
1 2 Approved Outlay Actual Expd.Approved
OutlayActual Expd.
Approved
OutlayActual Expd. Approved Outlay Actual Expd.
Approved
OutlayActual Expd.
Approved
OutlayActual Expd. Approved Outlay Actual Expd.
1. Andhra Pradesh 1,323.00 1,485.54 1,410.00 1,674.53 1,660.00 2,364.04 1,851.00 2,867.46 2,130.00 2,453.47 3,159.00 2,696.03 2,989.00 3,052.26
2. Arunachal Pradesh 183.00 165.89 235.00 206.87 245.00 233.61 290.00 262.14 335.00 353.36 471.00 432.92 520.00 430.93
3. Assam 675.00 596.57 805.00 695.50 960.00 655.44 1,027.00 862.19 1,051.00 1,042.82 1,418.32 1,203.98 1,434.00 1,101.62
4. Bihar 1,805.00 1,257.92 2,251.00 1,031.56 2,202.73 1,149.18 2,300.00 811.70 2,400.00 916.18 2,500.00 981.86 2,143.91 1,549.28
5. Chhattisgarh
6. Goa 130.00 135.39 172.50 158.87 152.50 141.96 170.00 147.94 182.00 157.15 210.00 197.25 250.00 199.12
7. Gujarat 1,451.00 1,566.67 1,755.00 2,021.89 1,875.00 1,939.75 2,137.00 1,930.86 2,240.00 2,001.42 2,610.00 2,598.57 3,378.00 3,080.13
8. Haryana 700.00 615.02 765.00 681.81 830.00 748.36 920.00 806.82 1,025.00 979.36 1,250.00 1,120.06 1,433.65 1,235.29
9. Himachal Pradesh 360.00 377.63 410.00 407.40 486.00 490.98 560.00 570.73 650.00 666.75 750.00 850.91 900.50 918.33
10. Jammu & Kashmir 650.00 556.62 723.00 649.02 820.00 620.00 880.00 653.74 950.00 845.68 1,050.00 1,023.72 1,250.00 1,260.46
11. Jharkhand
12. Karnataka 1,120.00 1,172.70 1,510.00 1,597.25 1,915.00 1,971.41 3,025.00 2,796.95 3,275.00 3,004.15 3,575.00 3,390.85 4,360.00 3,972.54
13. Kerala 635.00 596.05 807.00 672.53 913.00 825.32 1,000.00 1,013.06 1,260.00 1,415.92 1,550.00 1,591.00 2,207.27 2,106.73
14. Madhya Pradesh 2,000.00 1,703.51 2,426.00 1,817.58 2,400.00 1,992.03 2,400.00 2,235.88 2,750.00 2,670.09 2,900.00 2,560.23 3,144.80 2,759.71
15. Maharashtra 2,450.00 2,530.22 2,500.00 2,968.70 3,160.00 3,372.80 3,804.00 3,778.08 4,400.00 5,122.19 5,907.00 6,206.26 8,319.67 6,856.77
16. Manipur 170.00 164.66 200.00 184.50 210.00 170.95 230.00 174.39 240.00 220.68 300.00 286.29 350.00 367.17
17. Meghalaya 175.00 166.25 210.00 187.20 241.00 198.98 281.00 195.99 281.00 179.33 306.52 241.60 370.00 253.88
18. Mizoram 125.00 124.93 152.00 151.67 160.00 165.17 185.00 174.31 207.66 202.15 227.00 233.41 281.00 286.77
19. Nagaland 145.00 142.12 170.00 159.82 185.00 110.55 203.50 163.84 220.00 85.85 240.00 199.94 290.00 265.67
20. Orissa 1,250.00 1,085.75 1,402.00 1,029.74 1,405.00 1,054.33 1,450.00 1,094.74 1,951.00 1,474.47 1,650.00 1,370.52 2,205.50 2,003.97
21. Punjab 905.00 991.06 1,010.00 1,068.14 1,500.00 885.30 1,250.00 1,142.68 1,450.00 1,419.47 1,675.00 1,588.99 1,857.05 1,794.39
22. Rajasthan 956.00 973.22 1,170.00 1,184.44 1,400.00 1,406.67 1,700.00 1,743.32 2,450.00 2,415.75 3,200.00 3,162.42 3,310.49 3,131.41
23. Sikkim 76.00 79.41 96.00 97.38 110.00 102.53 120.00 121.62 135.00 125.31 192.00 165.40 192.00 192.79
24. Tamilnadu 1,450.00 1,495.56 1,605.00 1,651.36 1,751.00 1,934.59 2,101.00 2,234.45 2,750.00 2,845.70 3,200.00 3,282.12 3,719.05 3,726.37
25. Tripura 200.00 201.12 227.00 228.71 282.00 217.94 310.00 224.18 310.00 257.43 350.00 307.31 370.00 369.96
26. Uttar Pradesh 3,200.00 3,026.21 3,710.00 3,513.53 3,853.00 3,457.61 4,050.00 3,249.58 4,562.00 3,800.87 5,477.50 4,211.25 6,549.03 5,674.73
27. Uttarakhand
28. West Bengal 1,328.00 1,150.65 1,486.00 907.26 1,501.00 881.59 1,550.00 1,217.00 1,706.00 1,702.01 2,065.00 2,141.38 3,158.63 2,426.51
Total (States) 23,462.00 22,360.67 27,207.50 24,947.26 30,217.23 27,091.09 33,794.50 30,473.65 38,910.66 36,357.56 46,233.34 42,044.27 54,983.55 49,016.79
UNION TERRITORIES
29. Andaman & N. Islands
30. Chandigarh
31. Dadra & N. Haveli
32. Daman & Diu
33. Delhi
34. Lakshadweep
35. PuducherryTotal (U.T.s)Total (States & U.T.s)
Note: A.O= Originally Approved Outlay, R.O.= Revised Outlay, A.E= Actual Expenditure; Yellow Highlighted - AE
1990-91 1991-92 1992-93 1993-94 1994-95 1995-96 1996-97
ANNUAL PLAN FIGURES OF STATES, UTs from 1998-99 onward (as on 24.10.2011) in Rs. Crore
Databook for DCH; 5th December 2012 Page 36 of 266
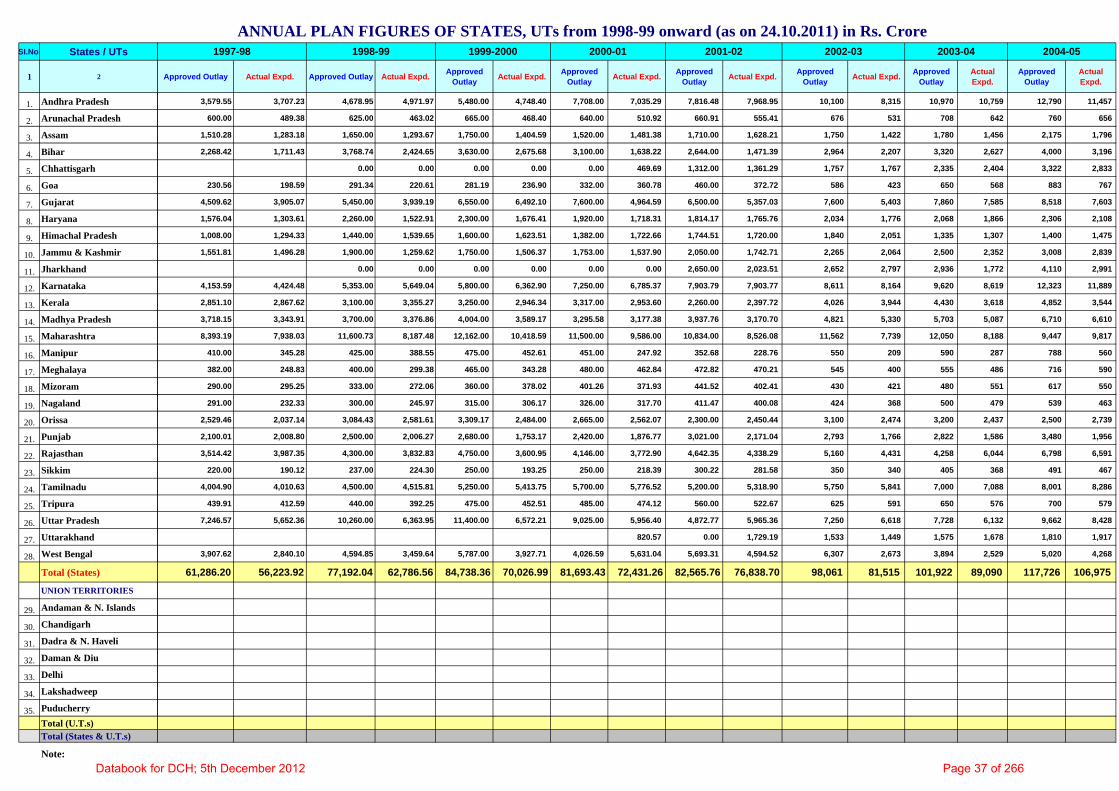
SI.No. States / UTs
1 2
1. Andhra Pradesh
2. Arunachal Pradesh
3. Assam
4. Bihar
5. Chhattisgarh
6. Goa
7. Gujarat
8. Haryana
9. Himachal Pradesh
10. Jammu & Kashmir
11. Jharkhand
12. Karnataka
13. Kerala
14. Madhya Pradesh
15. Maharashtra
16. Manipur
17. Meghalaya
18. Mizoram
19. Nagaland
20. Orissa
21. Punjab
22. Rajasthan
23. Sikkim
24. Tamilnadu
25. Tripura
26. Uttar Pradesh
27. Uttarakhand
28. West Bengal
Total (States)
UNION TERRITORIES
29. Andaman & N. Islands
30. Chandigarh
31. Dadra & N. Haveli
32. Daman & Diu
33. Delhi
34. Lakshadweep
35. PuducherryTotal (U.T.s)Total (States & U.T.s)
Note:
Approved Outlay Actual Expd. Approved Outlay Actual Expd.Approved
OutlayActual Expd.
Approved
OutlayActual Expd.
Approved
OutlayActual Expd.
Approved
OutlayActual Expd.
Approved
Outlay
Actual
Expd.
Approved
Outlay
Actual
Expd.
3,579.55 3,707.23 4,678.95 4,971.97 5,480.00 4,748.40 7,708.00 7,035.29 7,816.48 7,968.95 10,100 8,315 10,970 10,759 12,790 11,457
600.00 489.38 625.00 463.02 665.00 468.40 640.00 510.92 660.91 555.41 676 531 708 642 760 656
1,510.28 1,283.18 1,650.00 1,293.67 1,750.00 1,404.59 1,520.00 1,481.38 1,710.00 1,628.21 1,750 1,422 1,780 1,456 2,175 1,796
2,268.42 1,711.43 3,768.74 2,424.65 3,630.00 2,675.68 3,100.00 1,638.22 2,644.00 1,471.39 2,964 2,207 3,320 2,627 4,000 3,196
0.00 0.00 0.00 0.00 0.00 469.69 1,312.00 1,361.29 1,757 1,767 2,335 2,404 3,322 2,833
230.56 198.59 291.34 220.61 281.19 236.90 332.00 360.78 460.00 372.72 586 423 650 568 883 767
4,509.62 3,905.07 5,450.00 3,939.19 6,550.00 6,492.10 7,600.00 4,964.59 6,500.00 5,357.03 7,600 5,403 7,860 7,585 8,518 7,603
1,576.04 1,303.61 2,260.00 1,522.91 2,300.00 1,676.41 1,920.00 1,718.31 1,814.17 1,765.76 2,034 1,776 2,068 1,866 2,306 2,108
1,008.00 1,294.33 1,440.00 1,539.65 1,600.00 1,623.51 1,382.00 1,722.66 1,744.51 1,720.00 1,840 2,051 1,335 1,307 1,400 1,475
1,551.81 1,496.28 1,900.00 1,259.62 1,750.00 1,506.37 1,753.00 1,537.90 2,050.00 1,742.71 2,265 2,064 2,500 2,352 3,008 2,839
0.00 0.00 0.00 0.00 0.00 0.00 2,650.00 2,023.51 2,652 2,797 2,936 1,772 4,110 2,991
4,153.59 4,424.48 5,353.00 5,649.04 5,800.00 6,362.90 7,250.00 6,785.37 7,903.79 7,903.77 8,611 8,164 9,620 8,619 12,323 11,889
2,851.10 2,867.62 3,100.00 3,355.27 3,250.00 2,946.34 3,317.00 2,953.60 2,260.00 2,397.72 4,026 3,944 4,430 3,618 4,852 3,544
3,718.15 3,343.91 3,700.00 3,376.86 4,004.00 3,589.17 3,295.58 3,177.38 3,937.76 3,170.70 4,821 5,330 5,703 5,087 6,710 6,610
8,393.19 7,938.03 11,600.73 8,187.48 12,162.00 10,418.59 11,500.00 9,586.00 10,834.00 8,526.08 11,562 7,739 12,050 8,188 9,447 9,817
410.00 345.28 425.00 388.55 475.00 452.61 451.00 247.92 352.68 228.76 550 209 590 287 788 560
382.00 248.83 400.00 299.38 465.00 343.28 480.00 462.84 472.82 470.21 545 400 555 486 716 590
290.00 295.25 333.00 272.06 360.00 378.02 401.26 371.93 441.52 402.41 430 421 480 551 617 550
291.00 232.33 300.00 245.97 315.00 306.17 326.00 317.70 411.47 400.08 424 368 500 479 539 463
2,529.46 2,037.14 3,084.43 2,581.61 3,309.17 2,484.00 2,665.00 2,562.07 2,300.00 2,450.44 3,100 2,474 3,200 2,437 2,500 2,739
2,100.01 2,008.80 2,500.00 2,006.27 2,680.00 1,753.17 2,420.00 1,876.77 3,021.00 2,171.04 2,793 1,766 2,822 1,586 3,480 1,956
3,514.42 3,987.35 4,300.00 3,832.83 4,750.00 3,600.95 4,146.00 3,772.90 4,642.35 4,338.29 5,160 4,431 4,258 6,044 6,798 6,591
220.00 190.12 237.00 224.30 250.00 193.25 250.00 218.39 300.22 281.58 350 340 405 368 491 467
4,004.90 4,010.63 4,500.00 4,515.81 5,250.00 5,413.75 5,700.00 5,776.52 5,200.00 5,318.90 5,750 5,841 7,000 7,088 8,001 8,286
439.91 412.59 440.00 392.25 475.00 452.51 485.00 474.12 560.00 522.67 625 591 650 576 700 579
7,246.57 5,652.36 10,260.00 6,363.95 11,400.00 6,572.21 9,025.00 5,956.40 4,872.77 5,965.36 7,250 6,618 7,728 6,132 9,662 8,428
820.57 0.00 1,729.19 1,533 1,449 1,575 1,678 1,810 1,917
3,907.62 2,840.10 4,594.85 3,459.64 5,787.00 3,927.71 4,026.59 5,631.04 5,693.31 4,594.52 6,307 2,673 3,894 2,529 5,020 4,268
61,286.20 56,223.92 77,192.04 62,786.56 84,738.36 70,026.99 81,693.43 72,431.26 82,565.76 76,838.70 98,061 81,515 101,922 89,090 117,726 106,975
1997-98 1998-99 1999-2000 2000-01 2002-032001-02 2003-04 2004-05
ANNUAL PLAN FIGURES OF STATES, UTs from 1998-99 onward (as on 24.10.2011) in Rs. Crore
Databook for DCH; 5th December 2012 Page 37 of 266
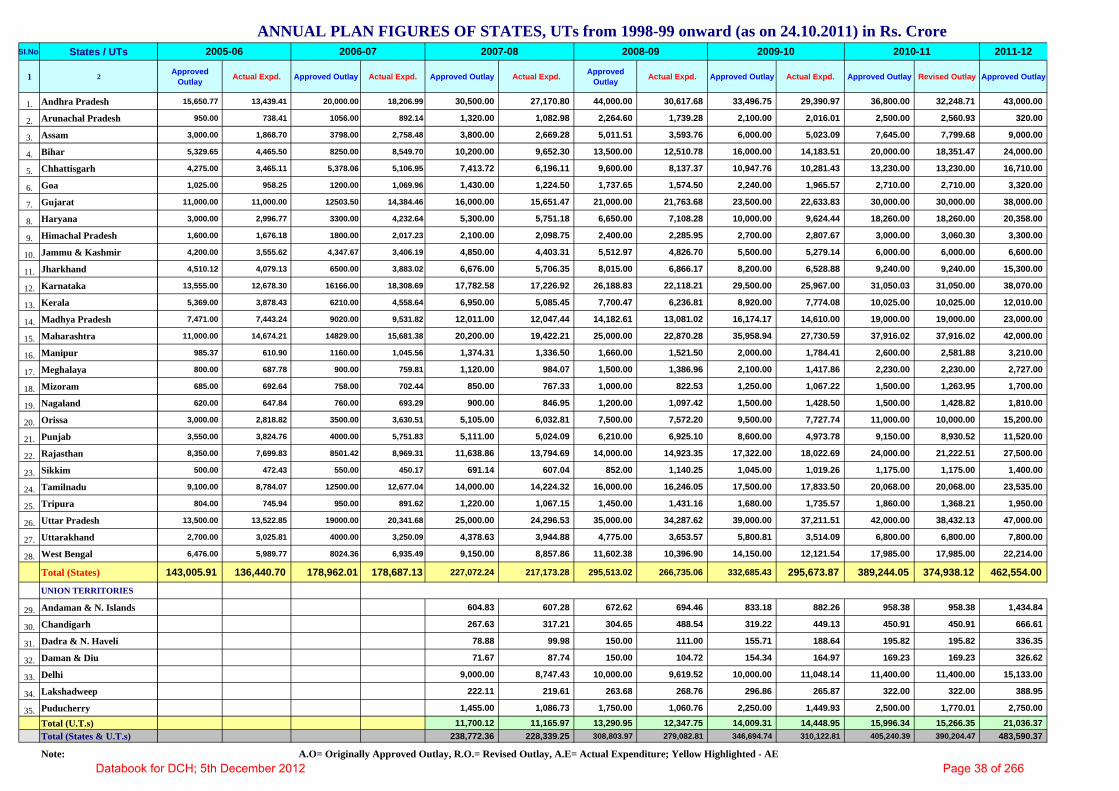
SI.No. States / UTs
1 2
1. Andhra Pradesh
2. Arunachal Pradesh
3. Assam
4. Bihar
5. Chhattisgarh
6. Goa
7. Gujarat
8. Haryana
9. Himachal Pradesh
10. Jammu & Kashmir
11. Jharkhand
12. Karnataka
13. Kerala
14. Madhya Pradesh
15. Maharashtra
16. Manipur
17. Meghalaya
18. Mizoram
19. Nagaland
20. Orissa
21. Punjab
22. Rajasthan
23. Sikkim
24. Tamilnadu
25. Tripura
26. Uttar Pradesh
27. Uttarakhand
28. West Bengal
Total (States)
UNION TERRITORIES
29. Andaman & N. Islands
30. Chandigarh
31. Dadra & N. Haveli
32. Daman & Diu
33. Delhi
34. Lakshadweep
35. PuducherryTotal (U.T.s)Total (States & U.T.s)
Note:
Approved
OutlayActual Expd. Approved Outlay Actual Expd. Approved Outlay Actual Expd.
Approved
OutlayActual Expd. Approved Outlay Actual Expd. Approved Outlay Revised Outlay Approved Outlay
15,650.77 13,439.41 20,000.00 18,206.99 30,500.00 27,170.80 44,000.00 30,617.68 33,496.75 29,390.97 36,800.00 32,248.71 43,000.00
950.00 738.41 1056.00 892.14 1,320.00 1,082.98 2,264.60 1,739.28 2,100.00 2,016.01 2,500.00 2,560.93 320.00
3,000.00 1,868.70 3798.00 2,758.48 3,800.00 2,669.28 5,011.51 3,593.76 6,000.00 5,023.09 7,645.00 7,799.68 9,000.00
5,329.65 4,465.50 8250.00 8,549.70 10,200.00 9,652.30 13,500.00 12,510.78 16,000.00 14,183.51 20,000.00 18,351.47 24,000.00
4,275.00 3,465.11 5,378.06 5,106.95 7,413.72 6,196.11 9,600.00 8,137.37 10,947.76 10,281.43 13,230.00 13,230.00 16,710.00
1,025.00 958.25 1200.00 1,069.96 1,430.00 1,224.50 1,737.65 1,574.50 2,240.00 1,965.57 2,710.00 2,710.00 3,320.00
11,000.00 11,000.00 12503.50 14,384.46 16,000.00 15,651.47 21,000.00 21,763.68 23,500.00 22,633.83 30,000.00 30,000.00 38,000.00
3,000.00 2,996.77 3300.00 4,232.64 5,300.00 5,751.18 6,650.00 7,108.28 10,000.00 9,624.44 18,260.00 18,260.00 20,358.00
1,600.00 1,676.18 1800.00 2,017.23 2,100.00 2,098.75 2,400.00 2,285.95 2,700.00 2,807.67 3,000.00 3,060.30 3,300.00
4,200.00 3,555.62 4,347.67 3,406.19 4,850.00 4,403.31 5,512.97 4,826.70 5,500.00 5,279.14 6,000.00 6,000.00 6,600.00
4,510.12 4,079.13 6500.00 3,883.02 6,676.00 5,706.35 8,015.00 6,866.17 8,200.00 6,528.88 9,240.00 9,240.00 15,300.00
13,555.00 12,678.30 16166.00 18,308.69 17,782.58 17,226.92 26,188.83 22,118.21 29,500.00 25,967.00 31,050.03 31,050.00 38,070.00
5,369.00 3,878.43 6210.00 4,558.64 6,950.00 5,085.45 7,700.47 6,236.81 8,920.00 7,774.08 10,025.00 10,025.00 12,010.00
7,471.00 7,443.24 9020.00 9,531.82 12,011.00 12,047.44 14,182.61 13,081.02 16,174.17 14,610.00 19,000.00 19,000.00 23,000.00
11,000.00 14,674.21 14829.00 15,681.38 20,200.00 19,422.21 25,000.00 22,870.28 35,958.94 27,730.59 37,916.02 37,916.02 42,000.00
985.37 610.90 1160.00 1,045.56 1,374.31 1,336.50 1,660.00 1,521.50 2,000.00 1,784.41 2,600.00 2,581.88 3,210.00
800.00 687.78 900.00 759.81 1,120.00 984.07 1,500.00 1,386.96 2,100.00 1,417.86 2,230.00 2,230.00 2,727.00
685.00 692.64 758.00 702.44 850.00 767.33 1,000.00 822.53 1,250.00 1,067.22 1,500.00 1,263.95 1,700.00
620.00 647.84 760.00 693.29 900.00 846.95 1,200.00 1,097.42 1,500.00 1,428.50 1,500.00 1,428.82 1,810.00
3,000.00 2,818.82 3500.00 3,630.51 5,105.00 6,032.81 7,500.00 7,572.20 9,500.00 7,727.74 11,000.00 10,000.00 15,200.00
3,550.00 3,824.76 4000.00 5,751.83 5,111.00 5,024.09 6,210.00 6,925.10 8,600.00 4,973.78 9,150.00 8,930.52 11,520.00
8,350.00 7,699.83 8501.42 8,969.31 11,638.86 13,794.69 14,000.00 14,923.35 17,322.00 18,022.69 24,000.00 21,222.51 27,500.00
500.00 472.43 550.00 450.17 691.14 607.04 852.00 1,140.25 1,045.00 1,019.26 1,175.00 1,175.00 1,400.00
9,100.00 8,784.07 12500.00 12,677.04 14,000.00 14,224.32 16,000.00 16,246.05 17,500.00 17,833.50 20,068.00 20,068.00 23,535.00
804.00 745.94 950.00 891.62 1,220.00 1,067.15 1,450.00 1,431.16 1,680.00 1,735.57 1,860.00 1,368.21 1,950.00
13,500.00 13,522.85 19000.00 20,341.68 25,000.00 24,296.53 35,000.00 34,287.62 39,000.00 37,211.51 42,000.00 38,432.13 47,000.00
2,700.00 3,025.81 4000.00 3,250.09 4,378.63 3,944.88 4,775.00 3,653.57 5,800.81 3,514.09 6,800.00 6,800.00 7,800.00
6,476.00 5,989.77 8024.36 6,935.49 9,150.00 8,857.86 11,602.38 10,396.90 14,150.00 12,121.54 17,985.00 17,985.00 22,214.00
143,005.91 136,440.70 178,962.01 178,687.13 227,072.24 217,173.28 295,513.02 266,735.06 332,685.43 295,673.87 389,244.05 374,938.12 462,554.00
604.83 607.28 672.62 694.46 833.18 882.26 958.38 958.38 1,434.84
267.63 317.21 304.65 488.54 319.22 449.13 450.91 450.91 666.61
78.88 99.98 150.00 111.00 155.71 188.64 195.82 195.82 336.35
71.67 87.74 150.00 104.72 154.34 164.97 169.23 169.23 326.62
9,000.00 8,747.43 10,000.00 9,619.52 10,000.00 11,048.14 11,400.00 11,400.00 15,133.00
222.11 219.61 263.68 268.76 296.86 265.87 322.00 322.00 388.95
1,455.00 1,086.73 1,750.00 1,060.76 2,250.00 1,449.93 2,500.00 1,770.01 2,750.00
11,700.12 11,165.97 13,290.95 12,347.75 14,009.31 14,448.95 15,996.34 15,266.35 21,036.37
238,772.36 228,339.25 308,803.97 279,082.81 346,694.74 310,122.81 405,240.39 390,204.47 483,590.37
A.O= Originally Approved Outlay, R.O.= Revised Outlay, A.E= Actual Expenditure; Yellow Highlighted - AE
2005-06 2006-07 2011-12
ANNUAL PLAN FIGURES OF STATES, UTs from 1998-99 onward (as on 24.10.2011) in Rs. Crore2009-10 2010-112007-08 2008-09
Databook for DCH; 5th December 2012 Page 38 of 266
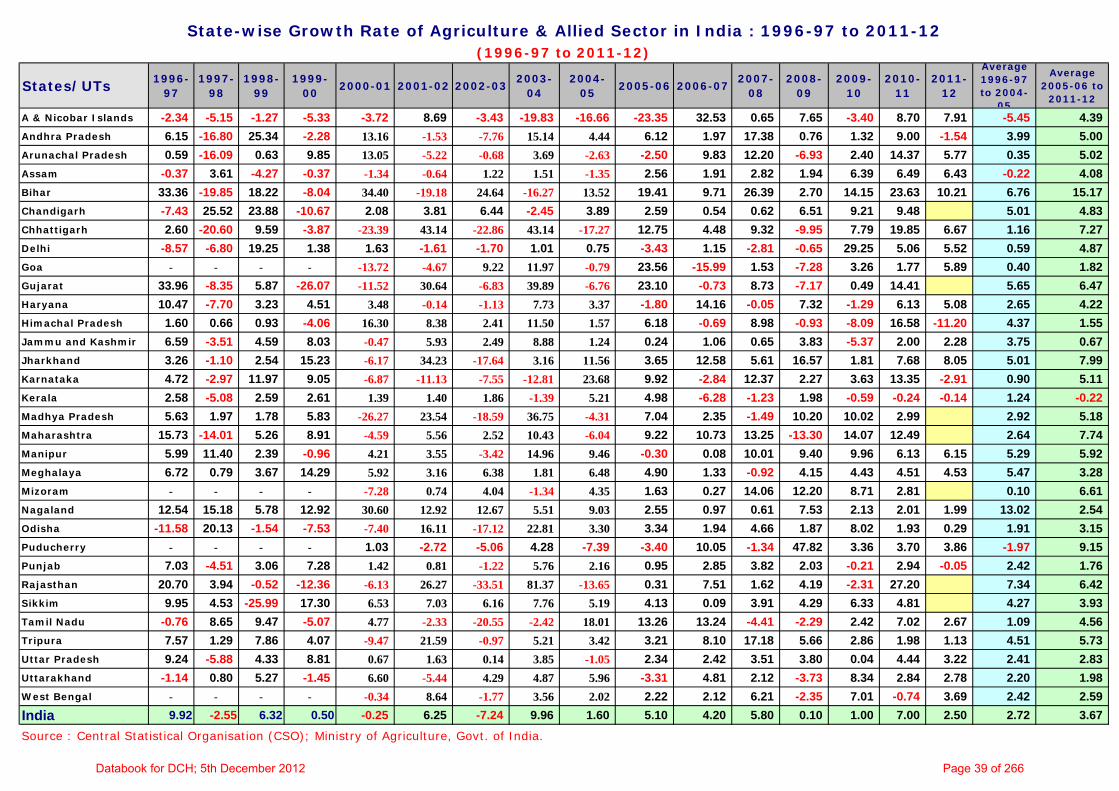
States/UTs 1996-97
1997-98
1998-99
1999-00
2000-01 2001-02 2002-032003-
042004-
052005-06 2006-07
2007-08
2008-09
2009-10
2010-11
2011-12
Average 1996-97 to 2004-
05
Average 2005-06 to
2011-12
A & Nicobar Islands -2.34 -5.15 -1.27 -5.33 -3.72 8.69 -3.43 -19.83 -16.66 -23.35 32.53 0.65 7.65 -3.40 8.70 7.91 -5.45 4.39
Andhra Pradesh 6.15 -16.80 25.34 -2.28 13.16 -1.53 -7.76 15.14 4.44 6.12 1.97 17.38 0.76 1.32 9.00 -1.54 3.99 5.00
Arunachal Pradesh 0.59 -16.09 0.63 9.85 13.05 -5.22 -0.68 3.69 -2.63 -2.50 9.83 12.20 -6.93 2.40 14.37 5.77 0.35 5.02
Assam -0.37 3.61 -4.27 -0.37 -1.34 -0.64 1.22 1.51 -1.35 2.56 1.91 2.82 1.94 6.39 6.49 6.43 -0.22 4.08
Bihar 33.36 -19.85 18.22 -8.04 34.40 -19.18 24.64 -16.27 13.52 19.41 9.71 26.39 2.70 14.15 23.63 10.21 6.76 15.17
Chandigarh -7.43 25.52 23.88 -10.67 2.08 3.81 6.44 -2.45 3.89 2.59 0.54 0.62 6.51 9.21 9.48 5.01 4.83
Chhattigarh 2.60 -20.60 9.59 -3.87 -23.39 43.14 -22.86 43.14 -17.27 12.75 4.48 9.32 -9.95 7.79 19.85 6.67 1.16 7.27
Delhi -8.57 -6.80 19.25 1.38 1.63 -1.61 -1.70 1.01 0.75 -3.43 1.15 -2.81 -0.65 29.25 5.06 5.52 0.59 4.87
Goa - - - - -13.72 -4.67 9.22 11.97 -0.79 23.56 -15.99 1.53 -7.28 3.26 1.77 5.89 0.40 1.82
Gujarat 33.96 -8.35 5.87 -26.07 -11.52 30.64 -6.83 39.89 -6.76 23.10 -0.73 8.73 -7.17 0.49 14.41 5.65 6.47
Haryana 10.47 -7.70 3.23 4.51 3.48 -0.14 -1.13 7.73 3.37 -1.80 14.16 -0.05 7.32 -1.29 6.13 5.08 2.65 4.22
Himachal Pradesh 1.60 0.66 0.93 -4.06 16.30 8.38 2.41 11.50 1.57 6.18 -0.69 8.98 -0.93 -8.09 16.58 -11.20 4.37 1.55
Jammu and Kashmir 6.59 -3.51 4.59 8.03 -0.47 5.93 2.49 8.88 1.24 0.24 1.06 0.65 3.83 -5.37 2.00 2.28 3.75 0.67
Jharkhand 3.26 -1.10 2.54 15.23 -6.17 34.23 -17.64 3.16 11.56 3.65 12.58 5.61 16.57 1.81 7.68 8.05 5.01 7.99
Karnataka 4.72 -2.97 11.97 9.05 -6.87 -11.13 -7.55 -12.81 23.68 9.92 -2.84 12.37 2.27 3.63 13.35 -2.91 0.90 5.11
Kerala 2.58 -5.08 2.59 2.61 1.39 1.40 1.86 -1.39 5.21 4.98 -6.28 -1.23 1.98 -0.59 -0.24 -0.14 1.24 -0.22
Madhya Pradesh 5.63 1.97 1.78 5.83 -26.27 23.54 -18.59 36.75 -4.31 7.04 2.35 -1.49 10.20 10.02 2.99 2.92 5.18
Maharashtra 15.73 -14.01 5.26 8.91 -4.59 5.56 2.52 10.43 -6.04 9.22 10.73 13.25 -13.30 14.07 12.49 2.64 7.74
Manipur 5.99 11.40 2.39 -0.96 4.21 3.55 -3.42 14.96 9.46 -0.30 0.08 10.01 9.40 9.96 6.13 6.15 5.29 5.92
Meghalaya 6.72 0.79 3.67 14.29 5.92 3.16 6.38 1.81 6.48 4.90 1.33 -0.92 4.15 4.43 4.51 4.53 5.47 3.28
Mizoram - - - - -7.28 0.74 4.04 -1.34 4.35 1.63 0.27 14.06 12.20 8.71 2.81 0.10 6.61
Nagaland 12.54 15.18 5.78 12.92 30.60 12.92 12.67 5.51 9.03 2.55 0.97 0.61 7.53 2.13 2.01 1.99 13.02 2.54
Odisha -11.58 20.13 -1.54 -7.53 -7.40 16.11 -17.12 22.81 3.30 3.34 1.94 4.66 1.87 8.02 1.93 0.29 1.91 3.15
Puducherry - - - - 1.03 -2.72 -5.06 4.28 -7.39 -3.40 10.05 -1.34 47.82 3.36 3.70 3.86 -1.97 9.15
Punjab 7.03 -4.51 3.06 7.28 1.42 0.81 -1.22 5.76 2.16 0.95 2.85 3.82 2.03 -0.21 2.94 -0.05 2.42 1.76
Rajasthan 20.70 3.94 -0.52 -12.36 -6.13 26.27 -33.51 81.37 -13.65 0.31 7.51 1.62 4.19 -2.31 27.20 7.34 6.42
Sikkim 9.95 4.53 -25.99 17.30 6.53 7.03 6.16 7.76 5.19 4.13 0.09 3.91 4.29 6.33 4.81 4.27 3.93
Tamil Nadu -0.76 8.65 9.47 -5.07 4.77 -2.33 -20.55 -2.42 18.01 13.26 13.24 -4.41 -2.29 2.42 7.02 2.67 1.09 4.56
Tripura 7.57 1.29 7.86 4.07 -9.47 21.59 -0.97 5.21 3.42 3.21 8.10 17.18 5.66 2.86 1.98 1.13 4.51 5.73
Uttar Pradesh 9.24 -5.88 4.33 8.81 0.67 1.63 0.14 3.85 -1.05 2.34 2.42 3.51 3.80 0.04 4.44 3.22 2.41 2.83
Uttarakhand -1.14 0.80 5.27 -1.45 6.60 -5.44 4.29 4.87 5.96 -3.31 4.81 2.12 -3.73 8.34 2.84 2.78 2.20 1.98
West Bengal - - - - -0.34 8.64 -1.77 3.56 2.02 2.22 2.12 6.21 -2.35 7.01 -0.74 3.69 2.42 2.59
India 9.92 -2.55 6.32 0.50 -0.25 6.25 -7.24 9.96 1.60 5.10 4.20 5.80 0.10 1.00 7.00 2.50 2.72 3.67
Source : Central Statistical Organisation (CSO); Ministry of Agriculture, Govt. of India.
(1996-97 to 2011-12)
State-wise Growth Rate of Agriculture & Allied Sector in India : 1996-97 to 2011-12
Databook for DCH; 5th December 2012 Page 39 of 266
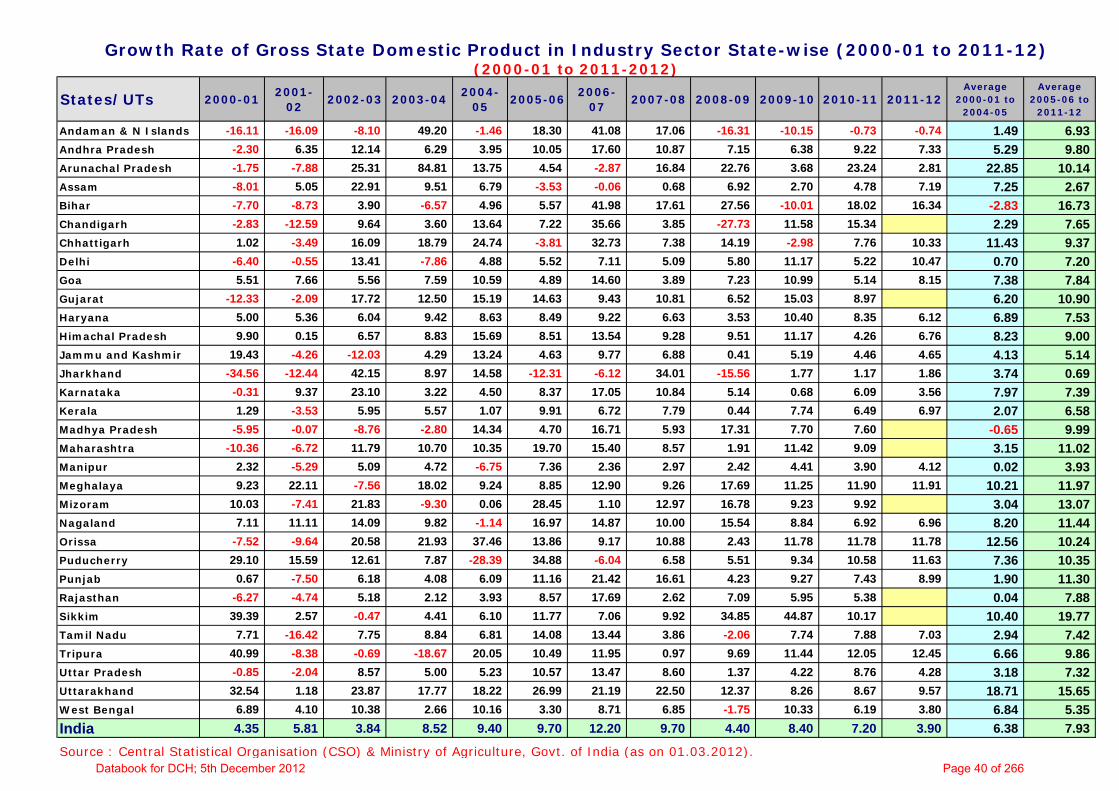
States/UTs 2000-012001-
022002-03 2003-04
2004-05
2005-062006-
072007-08 2008-09 2009-10 2010-11 2011-12
Average 2000-01 to
2004-05
Average 2005-06 to
2011-12
Andaman & N Islands -16.11 -16.09 -8.10 49.20 -1.46 18.30 41.08 17.06 -16.31 -10.15 -0.73 -0.74 1.49 6.93
Andhra Pradesh -2.30 6.35 12.14 6.29 3.95 10.05 17.60 10.87 7.15 6.38 9.22 7.33 5.29 9.80
Arunachal Pradesh -1.75 -7.88 25.31 84.81 13.75 4.54 -2.87 16.84 22.76 3.68 23.24 2.81 22.85 10.14
Assam -8.01 5.05 22.91 9.51 6.79 -3.53 -0.06 0.68 6.92 2.70 4.78 7.19 7.25 2.67
Bihar -7.70 -8.73 3.90 -6.57 4.96 5.57 41.98 17.61 27.56 -10.01 18.02 16.34 -2.83 16.73
Chandigarh -2.83 -12.59 9.64 3.60 13.64 7.22 35.66 3.85 -27.73 11.58 15.34 2.29 7.65
Chhattigarh 1.02 -3.49 16.09 18.79 24.74 -3.81 32.73 7.38 14.19 -2.98 7.76 10.33 11.43 9.37
Delhi -6.40 -0.55 13.41 -7.86 4.88 5.52 7.11 5.09 5.80 11.17 5.22 10.47 0.70 7.20
Goa 5.51 7.66 5.56 7.59 10.59 4.89 14.60 3.89 7.23 10.99 5.14 8.15 7.38 7.84
Gujarat -12.33 -2.09 17.72 12.50 15.19 14.63 9.43 10.81 6.52 15.03 8.97 6.20 10.90
Haryana 5.00 5.36 6.04 9.42 8.63 8.49 9.22 6.63 3.53 10.40 8.35 6.12 6.89 7.53
Himachal Pradesh 9.90 0.15 6.57 8.83 15.69 8.51 13.54 9.28 9.51 11.17 4.26 6.76 8.23 9.00
Jammu and Kashmir 19.43 -4.26 -12.03 4.29 13.24 4.63 9.77 6.88 0.41 5.19 4.46 4.65 4.13 5.14
Jharkhand -34.56 -12.44 42.15 8.97 14.58 -12.31 -6.12 34.01 -15.56 1.77 1.17 1.86 3.74 0.69
Karnataka -0.31 9.37 23.10 3.22 4.50 8.37 17.05 10.84 5.14 0.68 6.09 3.56 7.97 7.39
Kerala 1.29 -3.53 5.95 5.57 1.07 9.91 6.72 7.79 0.44 7.74 6.49 6.97 2.07 6.58
Madhya Pradesh -5.95 -0.07 -8.76 -2.80 14.34 4.70 16.71 5.93 17.31 7.70 7.60 -0.65 9.99
Maharashtra -10.36 -6.72 11.79 10.70 10.35 19.70 15.40 8.57 1.91 11.42 9.09 3.15 11.02
Manipur 2.32 -5.29 5.09 4.72 -6.75 7.36 2.36 2.97 2.42 4.41 3.90 4.12 0.02 3.93
Meghalaya 9.23 22.11 -7.56 18.02 9.24 8.85 12.90 9.26 17.69 11.25 11.90 11.91 10.21 11.97
Mizoram 10.03 -7.41 21.83 -9.30 0.06 28.45 1.10 12.97 16.78 9.23 9.92 3.04 13.07
Nagaland 7.11 11.11 14.09 9.82 -1.14 16.97 14.87 10.00 15.54 8.84 6.92 6.96 8.20 11.44
Orissa -7.52 -9.64 20.58 21.93 37.46 13.86 9.17 10.88 2.43 11.78 11.78 11.78 12.56 10.24
Puducherry 29.10 15.59 12.61 7.87 -28.39 34.88 -6.04 6.58 5.51 9.34 10.58 11.63 7.36 10.35
Punjab 0.67 -7.50 6.18 4.08 6.09 11.16 21.42 16.61 4.23 9.27 7.43 8.99 1.90 11.30
Rajasthan -6.27 -4.74 5.18 2.12 3.93 8.57 17.69 2.62 7.09 5.95 5.38 0.04 7.88
Sikkim 39.39 2.57 -0.47 4.41 6.10 11.77 7.06 9.92 34.85 44.87 10.17 10.40 19.77
Tamil Nadu 7.71 -16.42 7.75 8.84 6.81 14.08 13.44 3.86 -2.06 7.74 7.88 7.03 2.94 7.42
Tripura 40.99 -8.38 -0.69 -18.67 20.05 10.49 11.95 0.97 9.69 11.44 12.05 12.45 6.66 9.86
Uttar Pradesh -0.85 -2.04 8.57 5.00 5.23 10.57 13.47 8.60 1.37 4.22 8.76 4.28 3.18 7.32
Uttarakhand 32.54 1.18 23.87 17.77 18.22 26.99 21.19 22.50 12.37 8.26 8.67 9.57 18.71 15.65
West Bengal 6.89 4.10 10.38 2.66 10.16 3.30 8.71 6.85 -1.75 10.33 6.19 3.80 6.84 5.35
India 4.35 5.81 3.84 8.52 9.40 9.70 12.20 9.70 4.40 8.40 7.20 3.90 6.38 7.93
Source : Central Statistical Organisation (CSO) & Ministry of Agriculture, Govt. of India (as on 01.03.2012).
(2000-01 to 2011-2012)Growth Rate of Gross State Domestic Product in Industry Sector State-wise (2000-01 to 2011-12)
Databook for DCH; 5th December 2012 Page 40 of 266
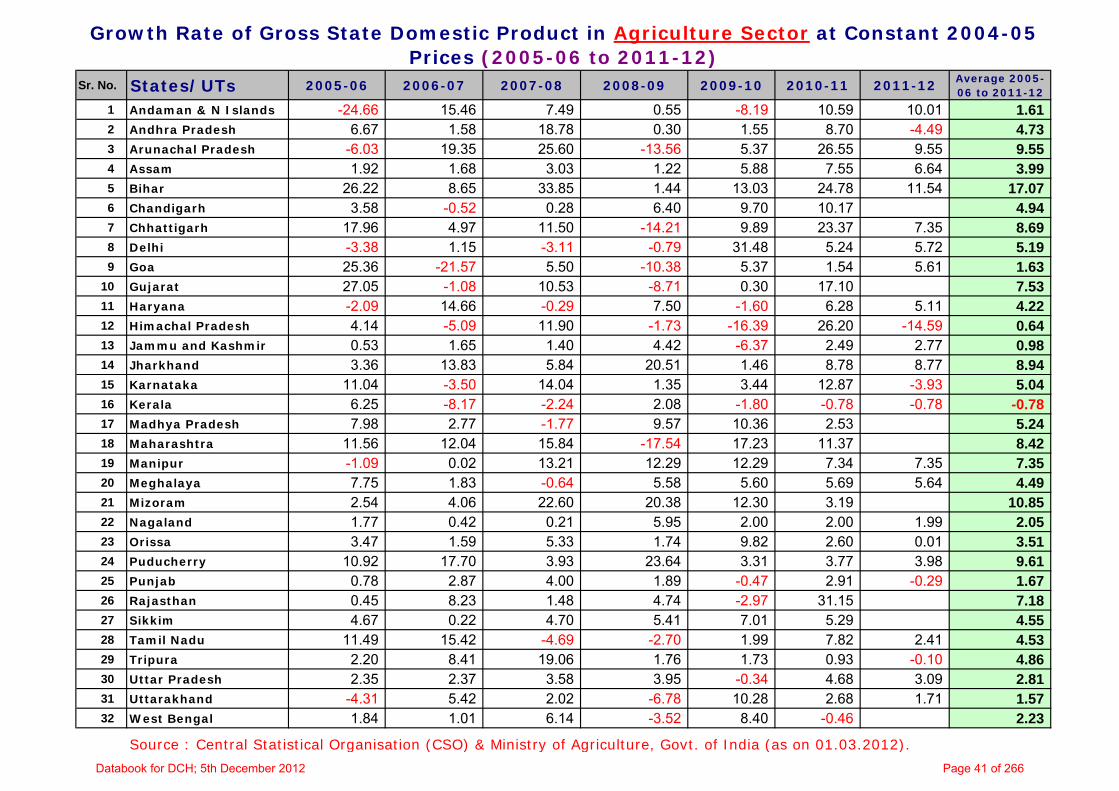
Growth Rate of Gross State Domestic Product in Agriculture Sector at Constant 2004-05 Prices (2005-06 to 2011-12)
Sr. No. States/UTs 2005-06 2006-07 2007-08 2008-09 2009-10 2010-11 2011-12 Average 2005-06 to 2011-12
1 Andaman & N Islands -24.66 15.46 7.49 0.55 -8.19 10.59 10.01 1.61
2 Andhra Pradesh 6.67 1.58 18.78 0.30 1.55 8.70 -4.49 4.73
3 Arunachal Pradesh -6.03 19.35 25.60 -13.56 5.37 26.55 9.55 9.55
4 Assam 1.92 1.68 3.03 1.22 5.88 7.55 6.64 3.99
5 Bihar 26.22 8.65 33.85 1.44 13.03 24.78 11.54 17.07
6 Chandigarh 3.58 -0.52 0.28 6.40 9.70 10.17 4.94
7 Chhattigarh 17.96 4.97 11.50 -14.21 9.89 23.37 7.35 8.69
8 Delhi -3.38 1.15 -3.11 -0.79 31.48 5.24 5.72 5.19
9 Goa 25.36 -21.57 5.50 -10.38 5.37 1.54 5.61 1.63
10 Gujarat 27.05 -1.08 10.53 -8.71 0.30 17.10 7.53
11 Haryana -2.09 14.66 -0.29 7.50 -1.60 6.28 5.11 4.22
12 Himachal Pradesh 4.14 -5.09 11.90 -1.73 -16.39 26.20 -14.59 0.64
13 Jammu and Kashmir 0.53 1.65 1.40 4.42 -6.37 2.49 2.77 0.98
14 Jharkhand 3.36 13.83 5.84 20.51 1.46 8.78 8.77 8.94
15 Karnataka 11.04 -3.50 14.04 1.35 3.44 12.87 -3.93 5.04
16 Kerala 6.25 -8.17 -2.24 2.08 -1.80 -0.78 -0.78 -0.78
17 Madhya Pradesh 7.98 2.77 -1.77 9.57 10.36 2.53 5.24
18 Maharashtra 11.56 12.04 15.84 -17.54 17.23 11.37 8.42
19 Manipur -1.09 0.02 13.21 12.29 12.29 7.34 7.35 7.35
20 Meghalaya 7.75 1.83 -0.64 5.58 5.60 5.69 5.64 4.49
21 Mizoram 2.54 4.06 22.60 20.38 12.30 3.19 10.85
22 Nagaland 1.77 0.42 0.21 5.95 2.00 2.00 1.99 2.05
23 Orissa 3.47 1.59 5.33 1.74 9.82 2.60 0.01 3.51
24 Puducherry 10.92 17.70 3.93 23.64 3.31 3.77 3.98 9.61
25 Punjab 0.78 2.87 4.00 1.89 -0.47 2.91 -0.29 1.67
26 Rajasthan 0.45 8.23 1.48 4.74 -2.97 31.15 7.18
27 Sikkim 4.67 0.22 4.70 5.41 7.01 5.29 4.55
28 Tamil Nadu 11.49 15.42 -4.69 -2.70 1.99 7.82 2.41 4.53
29 Tripura 2.20 8.41 19.06 1.76 1.73 0.93 -0.10 4.86
30 Uttar Pradesh 2.35 2.37 3.58 3.95 -0.34 4.68 3.09 2.81
31 Uttarakhand -4.31 5.42 2.02 -6.78 10.28 2.68 1.71 1.57
32 West Bengal 1.84 1.01 6.14 -3.52 8.40 -0.46 2.23
Source : Central Statistical Organisation (CSO) & Ministry of Agriculture, Govt. of India (as on 01.03.2012).
Databook for DCH; 5th December 2012 Page 41 of 266
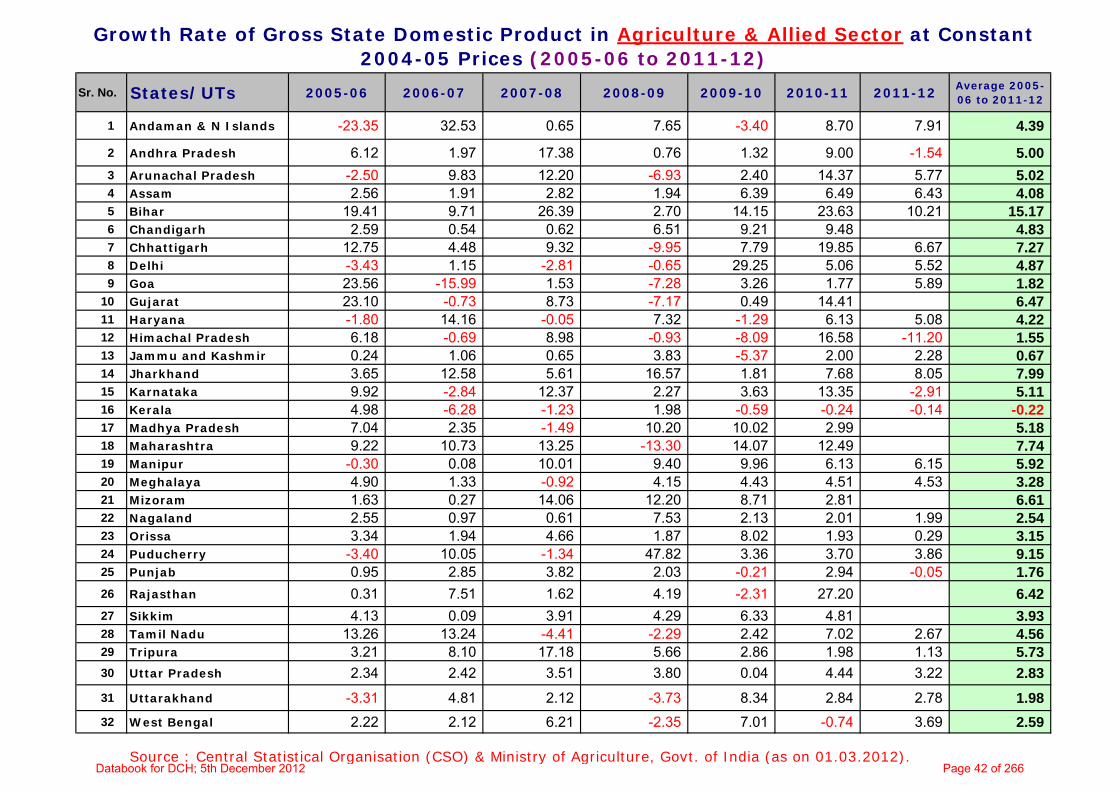
Growth Rate of Gross State Domestic Product in Agriculture & Allied Sector at Constant 2004-05 Prices (2005-06 to 2011-12)
Sr. No. States/UTs 2005-06 2006-07 2007-08 2008-09 2009-10 2010-11 2011-12Average 2005-06 to 2011-12
1 Andaman & N Islands -23.35 32.53 0.65 7.65 -3.40 8.70 7.91 4.39
2 Andhra Pradesh 6.12 1.97 17.38 0.76 1.32 9.00 -1.54 5.00
3 Arunachal Pradesh -2.50 9.83 12.20 -6.93 2.40 14.37 5.77 5.02
4 Assam 2.56 1.91 2.82 1.94 6.39 6.49 6.43 4.08
5 Bihar 19.41 9.71 26.39 2.70 14.15 23.63 10.21 15.17
6 Chandigarh 2.59 0.54 0.62 6.51 9.21 9.48 4.83
7 Chhattigarh 12.75 4.48 9.32 -9.95 7.79 19.85 6.67 7.27
8 Delhi -3.43 1.15 -2.81 -0.65 29.25 5.06 5.52 4.87
9 Goa 23.56 -15.99 1.53 -7.28 3.26 1.77 5.89 1.82
10 Gujarat 23.10 -0.73 8.73 -7.17 0.49 14.41 6.47
11 Haryana -1.80 14.16 -0.05 7.32 -1.29 6.13 5.08 4.22
12 Himachal Pradesh 6.18 -0.69 8.98 -0.93 -8.09 16.58 -11.20 1.55
13 Jammu and Kashmir 0.24 1.06 0.65 3.83 -5.37 2.00 2.28 0.67
14 Jharkhand 3.65 12.58 5.61 16.57 1.81 7.68 8.05 7.99
15 Karnataka 9.92 -2.84 12.37 2.27 3.63 13.35 -2.91 5.11
16 Kerala 4.98 -6.28 -1.23 1.98 -0.59 -0.24 -0.14 -0.22
17 Madhya Pradesh 7.04 2.35 -1.49 10.20 10.02 2.99 5.18
18 Maharashtra 9.22 10.73 13.25 -13.30 14.07 12.49 7.74
19 Manipur -0.30 0.08 10.01 9.40 9.96 6.13 6.15 5.92
20 Meghalaya 4.90 1.33 -0.92 4.15 4.43 4.51 4.53 3.28
21 Mizoram 1.63 0.27 14.06 12.20 8.71 2.81 6.61
22 Nagaland 2.55 0.97 0.61 7.53 2.13 2.01 1.99 2.54
23 Orissa 3.34 1.94 4.66 1.87 8.02 1.93 0.29 3.15
24 Puducherry -3.40 10.05 -1.34 47.82 3.36 3.70 3.86 9.15
25 Punjab 0.95 2.85 3.82 2.03 -0.21 2.94 -0.05 1.76
26 Rajasthan 0.31 7.51 1.62 4.19 -2.31 27.20 6.42
27 Sikkim 4.13 0.09 3.91 4.29 6.33 4.81 3.93
28 Tamil Nadu 13.26 13.24 -4.41 -2.29 2.42 7.02 2.67 4.56
29 Tripura 3.21 8.10 17.18 5.66 2.86 1.98 1.13 5.73
30 Uttar Pradesh 2.34 2.42 3.51 3.80 0.04 4.44 3.22 2.83
31 Uttarakhand -3.31 4.81 2.12 -3.73 8.34 2.84 2.78 1.98
32 West Bengal 2.22 2.12 6.21 -2.35 7.01 -0.74 3.69 2.59
Source : Central Statistical Organisation (CSO) & Ministry of Agriculture, Govt. of India (as on 01.03.2012).Databook for DCH; 5th December 2012 Page 42 of 266
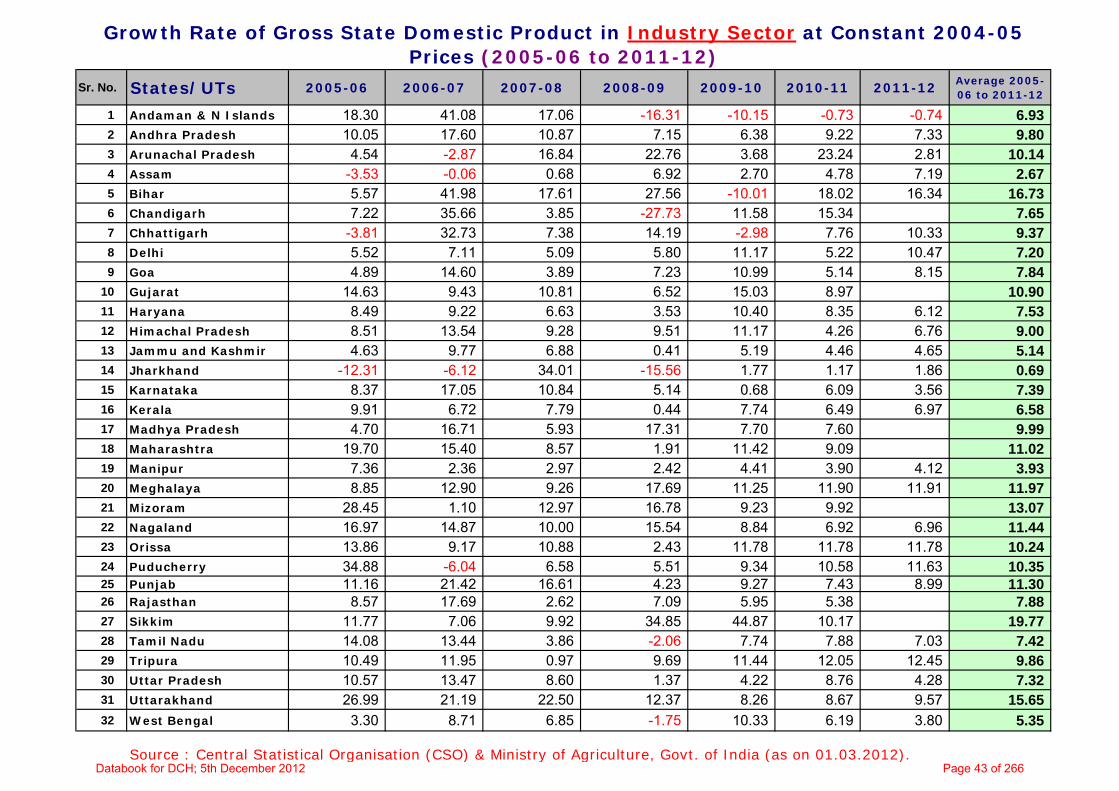
Growth Rate of Gross State Domestic Product in Industry Sector at Constant 2004-05 Prices (2005-06 to 2011-12)
Sr. No. States/UTs 2005-06 2006-07 2007-08 2008-09 2009-10 2010-11 2011-12 Average 2005-06 to 2011-12
1 Andaman & N Islands 18.30 41.08 17.06 -16.31 -10.15 -0.73 -0.74 6.93
2 Andhra Pradesh 10.05 17.60 10.87 7.15 6.38 9.22 7.33 9.80
3 Arunachal Pradesh 4.54 -2.87 16.84 22.76 3.68 23.24 2.81 10.14
4 Assam -3.53 -0.06 0.68 6.92 2.70 4.78 7.19 2.67
5 Bihar 5.57 41.98 17.61 27.56 -10.01 18.02 16.34 16.73
6 Chandigarh 7.22 35.66 3.85 -27.73 11.58 15.34 7.65
7 Chhattigarh -3.81 32.73 7.38 14.19 -2.98 7.76 10.33 9.37
8 Delhi 5.52 7.11 5.09 5.80 11.17 5.22 10.47 7.20
9 Goa 4.89 14.60 3.89 7.23 10.99 5.14 8.15 7.84
10 Gujarat 14.63 9.43 10.81 6.52 15.03 8.97 10.90
11 Haryana 8.49 9.22 6.63 3.53 10.40 8.35 6.12 7.53
12 Himachal Pradesh 8.51 13.54 9.28 9.51 11.17 4.26 6.76 9.00
13 Jammu and Kashmir 4.63 9.77 6.88 0.41 5.19 4.46 4.65 5.14
14 Jharkhand -12.31 -6.12 34.01 -15.56 1.77 1.17 1.86 0.69
15 Karnataka 8.37 17.05 10.84 5.14 0.68 6.09 3.56 7.39
16 Kerala 9.91 6.72 7.79 0.44 7.74 6.49 6.97 6.58
17 Madhya Pradesh 4.70 16.71 5.93 17.31 7.70 7.60 9.99
18 Maharashtra 19.70 15.40 8.57 1.91 11.42 9.09 11.02
19 Manipur 7.36 2.36 2.97 2.42 4.41 3.90 4.12 3.93
20 Meghalaya 8.85 12.90 9.26 17.69 11.25 11.90 11.91 11.97
21 Mizoram 28.45 1.10 12.97 16.78 9.23 9.92 13.07
22 Nagaland 16.97 14.87 10.00 15.54 8.84 6.92 6.96 11.44
23 Orissa 13.86 9.17 10.88 2.43 11.78 11.78 11.78 10.24
24 Puducherry 34.88 -6.04 6.58 5.51 9.34 10.58 11.63 10.35
Punjab 11.16 21.42 16.61 4.23 9.27 7.43 8.9925
26 Rajasthan 8.57 17.69 2.62 7.09 5.95 5.3811.30
7.88
27 Sikkim 11.77 7.06 9.92 34.85 44.87 10.17 19.77
28 Tamil Nadu 14.08 13.44 3.86 -2.06 7.74 7.88 7.03 7.42
29 Tripura 10.49 11.95 0.97 9.69 11.44 12.05 12.45 9.86
30 Uttar Pradesh 10.57 13.47 8.60 1.37 4.22 8.76 4.28 7.32
31 Uttarakhand 26.99 21.19 22.50 12.37 8.26 8.67 9.57 15.65
32 West Bengal 3.30 8.71 6.85 -1.75 10.33 6.19 3.80 5.35
Source : Central Statistical Organisation (CSO) & Ministry of Agriculture, Govt. of India (as on 01.03.2012).Databook for DCH; 5th December 2012 Page 43 of 266
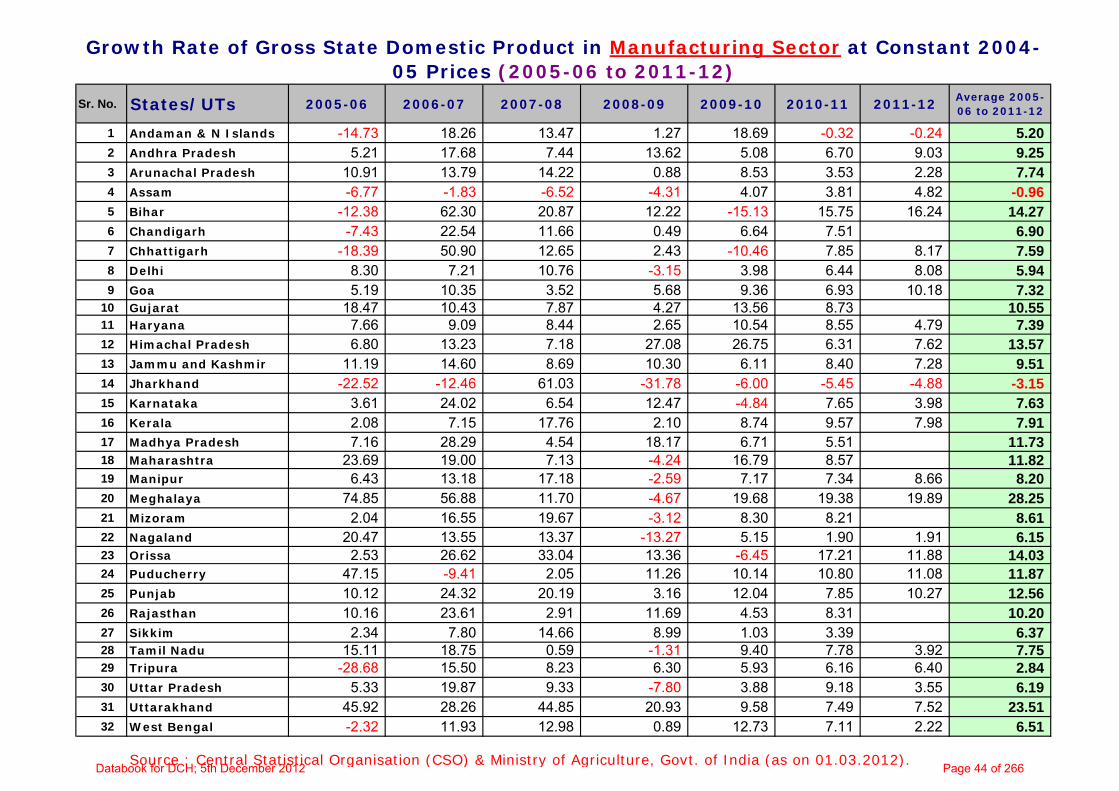
32 West Bengal -2.32 11.93 12.98 0.89 12.73 7.11 2.22 6.51
Source : Central Statistical Organisation (CSO) & Ministry of Agriculture, Govt. of India (as on 01.03.2012).
Growth Rate of Gross State Domestic Product in Manufacturing Sector at Constant 2004-05 Prices (2005-06 to 2011-12)
Sr. No. States/UTs 2005-06 2006-07 2007-08 2008-09 2009-10 2010-11 2011-12Average 2005-06 to 2011-12
1 Andaman & N Islands -14.73 18.26 13.47 1.27 18.69 -0.32 -0.24 5.20
2 Andhra Pradesh 5.21 17.68 7.44 13.62 5.08 6.70 9.03 9.25
3 Arunachal Pradesh 10.91 13.79 14.22 0.88 8.53 3.53 2.28 7.74
4 Assam -6.77 -1.83 -6.52 -4.31 4.07 3.81 4.82 -0.96
5 Bihar -12.38 62.30 20.87 12.22 -15.13 15.75 16.24 14.27
6 Chandigarh -7.43 22.54 11.66 0.49 6.64 7.51 6.90
7 Chhattigarh -18.39 50.90 12.65 2.43 -10.46 7.85 8.17 7.59
8 Delhi 8.30 7.21 10.76 -3.15 3.98 6.44 8.08 5.94
9 Goa 5.19 10.35 3.52 5.68 9.36 6.93 10.18 7.3210
11
GujaratHaryana
18.477.66
10.439.09
7.878.44
4.272.65
13.5610.54
8.738.55 4.79
10.55
7.39
12 Himachal Pradesh 6.80 13.23 7.18 27.08 26.75 6.31 7.62 13.57
13 Jammu and Kashmir 11.19 14.60 8.69 10.30 6.11 8.40 7.28 9.51
14 Jharkhand -22.52 -12.46 61.03 -31.78 -6.00 -5.45 -4.88 -3.15
15 Karnataka 3.61 24.02 6.54 12.47 -4.84 7.65 3.98 7.63
16 Kerala 2.08 7.15 17.76 2.10 8.74 9.57 7.98 7.91
17 Madhya Pradesh 7.16 28.29 4.54 18.17 6.71 5.51 11.73
Maharashtra 23.69 19.00 7.13 -4.24 16.79 8.5718
19 Manipur 6.43 13.18 17.18 -2.59 7.17 7.34 8.6611.82
8.20
20 Meghalaya 74.85 56.88 11.70 -4.67 19.68 19.38 19.89 28.25
21 Mizoram 2.04 16.55 19.67 -3.12 8.30 8.2122 Nagaland 20.47 13.55 13.37 -13.27 5.15 1.90 1.91
8.61
Orissa6.15
23
24 Puducherry
2.5347.15
26.62-9.41
33.042.05
13.3611.26
-6.45 10.14
17.2110.80
11.8811.08
14.03
11.87
25 Punjab 10.12 24.32 20.19 3.16 12.04 7.85 10.27 12.56
Rajasthan 10.16 23.61 2.91 11.69 4.53 8.3126
Sikkim
10.20
27 2.34 7.80 14.66 8.99 1.03 3.39 6.3728 Tamil Nadu
Tripura15.11
-28.68 18.7515.50
0.598.23
-1.31 6.30
9.405.93
7.786.16
3.926.40
7.7529 2.84
30 Uttar Pradesh 5.33 19.87 9.33 -7.80 3.88 9.18 3.55 6.19
31 Uttarakhand 45.92 28.26 44.85 20.93 9.58 7.49 7.52 23.51
Databook for DCH; 5th December 2012 Page 44 of 266
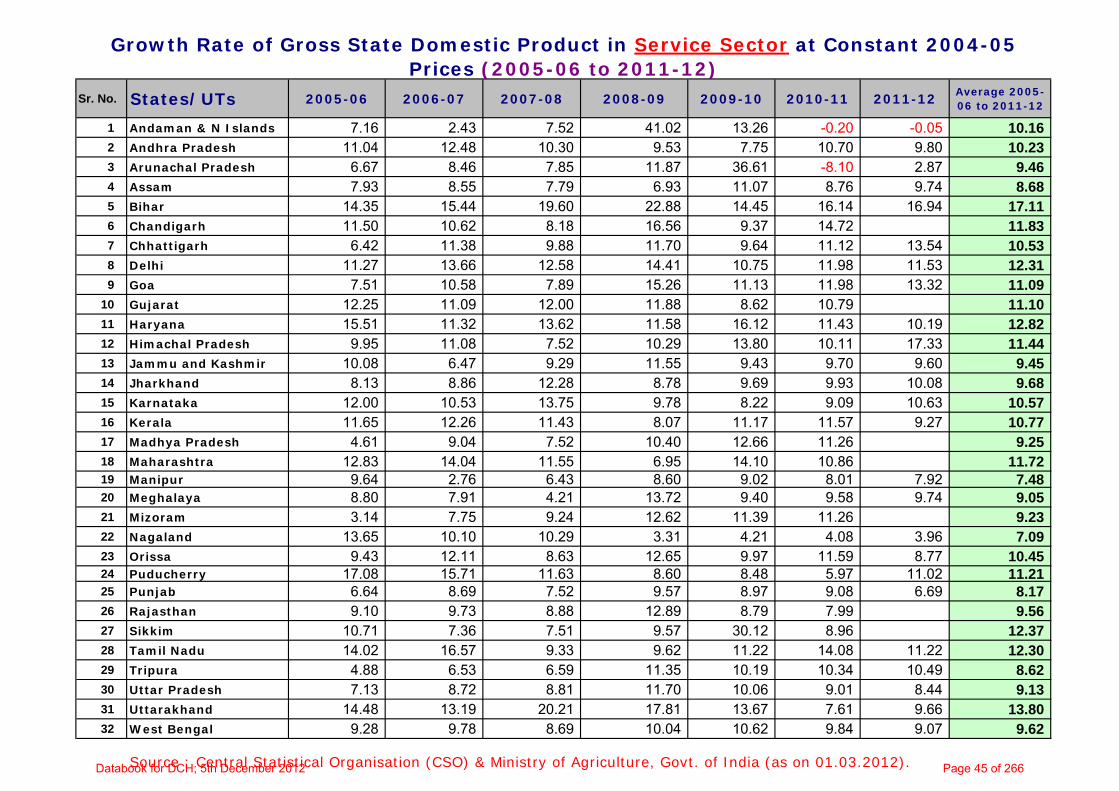
32 West Bengal 9.28 9.78 8.69 10.04 10.62 9.84 9.07 9.62
Source : Central Statistical Organisation (CSO) & Ministry of Agriculture, Govt. of India (as on 01.03.2012).
Growth Rate of Gross State Domestic Product in Service Sector at Constant 2004-05 Prices (2005-06 to 2011-12)
Sr. No. States/UTs 2005-06 2006-07 2007-08 2008-09 2009-10 2010-11 2011-12Average 2005-06 to 2011-12
1 Andaman & N Islands 7.16 2.43 7.52 41.02 13.26 -0.20 -0.05 10.16
2 Andhra Pradesh 11.04 12.48 10.30 9.53 7.75 10.70 9.80 10.23
3 Arunachal Pradesh 6.67 8.46 7.85 11.87 36.61 -8.10 2.87 9.46
4 Assam 7.93 8.55 7.79 6.93 11.07 8.76 9.74 8.68
5 Bihar 14.35 15.44 19.60 22.88 14.45 16.14 16.94 17.11
6 Chandigarh 11.50 10.62 8.18 16.56 9.37 14.72 11.83
7 Chhattigarh 6.42 11.38 9.88 11.70 9.64 11.12 13.54 10.53
8 Delhi 11.27 13.66 12.58 14.41 10.75 11.98 11.53Goa 7.51 10.58 7.89 15.26 11.13 11.98 13.32
12.31
9
Gujarat
11.09
10 12.25 11.09 12.00 11.88 8.62 10.79 11.10
11 Haryana 15.51 11.32 13.62 11.58 16.12 11.43 10.19 12.82
12 Himachal Pradesh 9.95 11.08 7.52 10.29 13.80 10.11 17.33 11.44
13 Jammu and Kashmir 10.08 6.47 9.29 11.55 9.43 9.70 9.60 9.45
14 Jharkhand 8.13 8.86 12.28 8.78 9.69 9.93 10.08 9.68
15 Karnataka 12.00 10.53 13.75 9.78 8.22 9.09 10.63 10.57
16 Kerala 11.65 12.26 11.43 8.07 11.17 11.57 9.27 10.77
17 Madhya Pradesh 4.61 9.04 7.52 10.40 12.66 11.26 9.25
18 Maharashtra 12.83 14.04 11.55 6.95 14.10 10.86 11.72
19 Manipur 9.64 2.76 6.43 8.60 9.02 8.01 7.92 7.48
20 Meghalaya 8.80 7.91 4.21 13.72 9.40 9.58 9.74 9.05
21 Mizoram 3.14 7.75 9.24 12.62 11.39 11.26 9.23
22 Nagaland 13.65 10.10 10.29 3.31 4.21 4.08 3.96 7.09
23 Orissa 9.43 12.11 8.63 12.65 9.97 11.59 8.77 10.4524 Puducherry 17.08 15.71 11.63 8.60 8.48 5.97 11.02 11.2125 Punjab 6.64 8.69 7.52 9.57 8.97 9.08 6.69 8.17
26 Rajasthan 9.10 9.73 8.88 12.89 8.79 7.99 9.56
27 Sikkim 10.71 7.36 7.51 9.57 30.12 8.96 12.37
28 Tamil Nadu 14.02 16.57 9.33 9.62 11.22 14.08 11.22 12.30
29 Tripura 4.88 6.53 6.59 11.35 10.19 10.34 10.49 8.62
30 Uttar Pradesh 7.13 8.72 8.81 11.70 10.06 9.01 8.44 9.13
31 Uttarakhand 14.48 13.19 20.21 17.81 13.67 7.61 9.66 13.80
Databook for DCH; 5th December 2012 Page 45 of 266
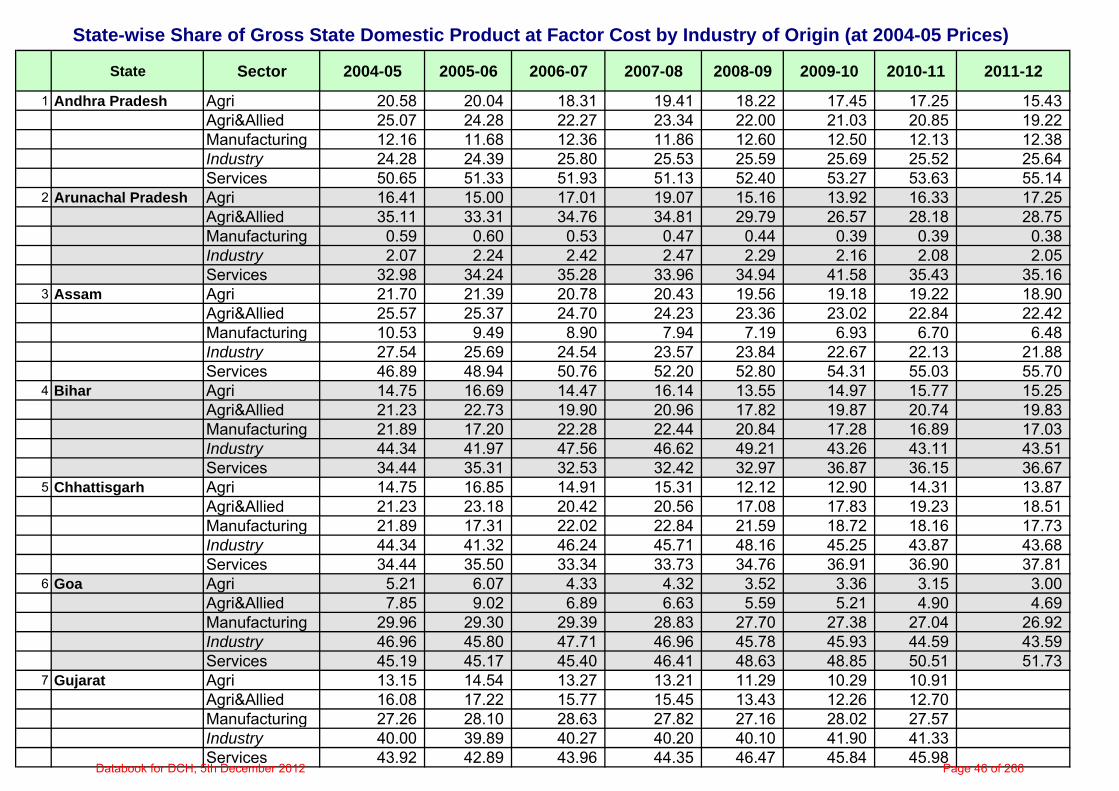
State Sector 2004-05 2005-06 2006-07 2007-08 2008-09 2009-10 2010-11 2011-12
1 Andhra Pradesh Agri 20.58 20.04 18.31 19.41 18.22 17.45 17.25 15.43Agri&Allied 25.07 24.28 22.27 23.34 22.00 21.03 20.85 19.22Manufacturing 12.16 11.68 12.36 11.86 12.60 12.50 12.13 12.38Industry 24.28 24.39 25.80 25.53 25.59 25.69 25.52 25.64Services 50.65 51.33 51.93 51.13 52.40 53.27 53.63 55.14
2 Arunachal Pradesh Agri 16.41 15.00 17.01 19.07 15.16 13.92 16.33 17.25Agri&Allied 35.11 33.31 34.76 34.81 29.79 26.57 28.18 28.75Manufacturing 0.59 0.60 0.53 0.47 0.44 0.39 0.39 0.38Industry 2.07 2.24 2.42 2.47 2.29 2.16 2.08 2.05Services 32.98 34.24 35.28 33.96 34.94 41.58 35.43 35.16
3 Assam Agri 21.70 21.39 20.78 20.43 19.56 19.18 19.22 18.90Agri&Allied 25.57 25.37 24.70 24.23 23.36 23.02 22.84 22.42Manufacturing 10.53 9.49 8.90 7.94 7.19 6.93 6.70 6.48Industry 27.54 25.69 24.54 23.57 23.84 22.67 22.13 21.88Services 46.89 48.94 50.76 52.20 52.80 54.31 55.03 55.70
4 Bihar Agri 14.75 16.69 14.47 16.14 13.55 14.97 15.77 15.25Agri&Allied 21.23 22.73 19.90 20.96 17.82 19.87 20.74 19.83Manufacturing 21.89 17.20 22.28 22.44 20.84 17.28 16.89 17.03Industry 44.34 41.97 47.56 46.62 49.21 43.26 43.11 43.51Services 34.44 35.31 32.53 32.42 32.97 36.87 36.15 36.67
5 Chhattisgarh Agri 14.75 16.85 14.91 15.31 12.12 12.90 14.31 13.87Agri&Allied 21.23 23.18 20.42 20.56 17.08 17.83 19.23 18.51Manufacturing 21.89 17.31 22.02 22.84 21.59 18.72 18.16 17.73Industry 44.34 41.32 46.24 45.71 48.16 45.25 43.87 43.68Services 34.44 35.50 33.34 33.73 34.76 36.91 36.90 37.81
6 Goa Agri 5.21 6.07 4.33 4.32 3.52 3.36 3.15 3.00Agri&Allied 7.85 9.02 6.89 6.63 5.59 5.21 4.90 4.69Manufacturing 29.96 29.30 29.39 28.83 27.70 27.38 27.04 26.92Industry 46.96 45.80 47.71 46.96 45.78 45.93 44.59 43.59Services 45.19 45.17 45.40 46.41 48.63 48.85 50.51 51.73
7 Gujarat Agri 13.15 14.54 13.27 13.21 11.29 10.29 10.91Agri&Allied 16.08 17.22 15.77 15.45 13.43 12.26 12.70Manufacturing 27.26 28.10 28.63 27.82 27.16 28.02 27.57Industry 40.00 39.89 40.27 40.20 40.10 41.90 41.33Services 43.92 42.89 43.96 44.35 46.47 45.84 45.98
State-wise Share of Gross State Domestic Product at Factor Cost by Industry of Origin (at 2004-05 Prices)
Databook for DCH; 5th December 2012 Page 46 of 266
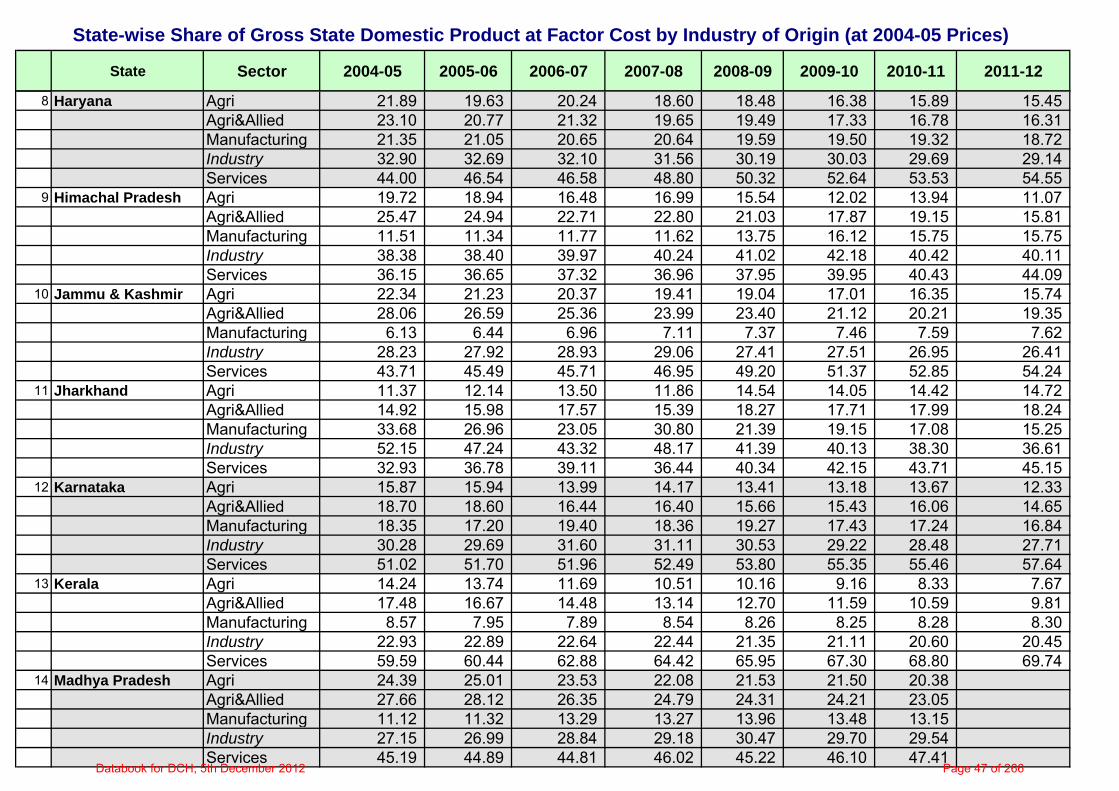
State Sector 2004-05 2005-06 2006-07 2007-08 2008-09 2009-10 2010-11 2011-12
State-wise Share of Gross State Domestic Product at Factor Cost by Industry of Origin (at 2004-05 Prices)
8 Haryana Agri 21.89 19.63 20.24 18.60 18.48 16.38 15.89 15.45Agri&Allied 23.10 20.77 21.32 19.65 19.49 17.33 16.78 16.31Manufacturing 21.35 21.05 20.65 20.64 19.59 19.50 19.32 18.72Industry 32.90 32.69 32.10 31.56 30.19 30.03 29.69 29.14Services 44.00 46.54 46.58 48.80 50.32 52.64 53.53 54.55
9 Himachal Pradesh Agri 19.72 18.94 16.48 16.99 15.54 12.02 13.94 11.07Agri&Allied 25.47 24.94 22.71 22.80 21.03 17.87 19.15 15.81Manufacturing 11.51 11.34 11.77 11.62 13.75 16.12 15.75 15.75Industry 38.38 38.40 39.97 40.24 41.02 42.18 40.42 40.11Services 36.15 36.65 37.32 36.96 37.95 39.95 40.43 44.09
10 Jammu & Kashmir Agri 22.34 21.23 20.37 19.41 19.04 17.01 16.35 15.74Agri&Allied 28.06 26.59 25.36 23.99 23.40 21.12 20.21 19.35Manufacturing 6.13 6.44 6.96 7.11 7.37 7.46 7.59 7.62Industry 28.23 27.92 28.93 29.06 27.41 27.51 26.95 26.41Services 43.71 45.49 45.71 46.95 49.20 51.37 52.85 54.24
11 Jharkhand Agri 11.37 12.14 13.50 11.86 14.54 14.05 14.42 14.72Agri&Allied 14.92 15.98 17.57 15.39 18.27 17.71 17.99 18.24Manufacturing 33.68 26.96 23.05 30.80 21.39 19.15 17.08 15.25Industry 52.15 47.24 43.32 48.17 41.39 40.13 38.30 36.61Services 32.93 36.78 39.11 36.44 40.34 42.15 43.71 45.15
12 Karnataka Agri 15.87 15.94 13.99 14.17 13.41 13.18 13.67 12.33Agri&Allied 18.70 18.60 16.44 16.40 15.66 15.43 16.06 14.65Manufacturing 18.35 17.20 19.40 18.36 19.27 17.43 17.24 16.84Industry 30.28 29.69 31.60 31.11 30.53 29.22 28.48 27.71Services 51.02 51.70 51.96 52.49 53.80 55.35 55.46 57.64
13 Kerala Agri 14.24 13.74 11.69 10.51 10.16 9.16 8.33 7.67Agri&Allied 17.48 16.67 14.48 13.14 12.70 11.59 10.59 9.81Manufacturing 8.57 7.95 7.89 8.54 8.26 8.25 8.28 8.30Industry 22.93 22.89 22.64 22.44 21.35 21.11 20.60 20.45Services 59.59 60.44 62.88 64.42 65.95 67.30 68.80 69.74
14 Madhya Pradesh Agri 24.39 25.01 23.53 22.08 21.53 21.50 20.38Agri&Allied 27.66 28.12 26.35 24.79 24.31 24.21 23.05Manufacturing 11.12 11.32 13.29 13.27 13.96 13.48 13.15Industry 27.15 26.99 28.84 29.18 30.47 29.70 29.54Services 45.19 44.89 44.81 46.02 45.22 46.10 47.41
Databook for DCH; 5th December 2012 Page 47 of 266
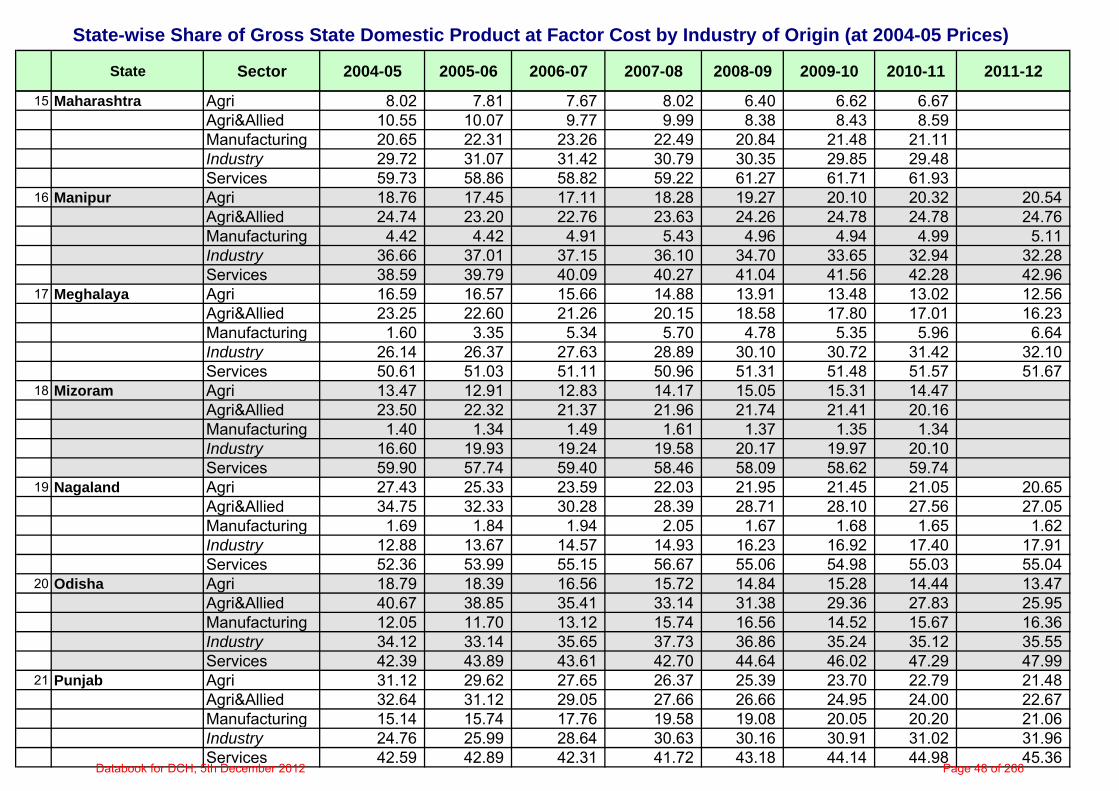
State Sector 2004-05 2005-06 2006-07 2007-08 2008-09 2009-10 2010-11 2011-12
State-wise Share of Gross State Domestic Product at Factor Cost by Industry of Origin (at 2004-05 Prices)
15 Maharashtra Agri 8.02 7.81 7.67 8.02 6.40 6.62 6.67Agri&Allied 10.55 10.07 9.77 9.99 8.38 8.43 8.59Manufacturing 20.65 22.31 23.26 22.49 20.84 21.48 21.11Industry 29.72 31.07 31.42 30.79 30.35 29.85 29.48Services 59.73 58.86 58.82 59.22 61.27 61.71 61.93
16 Manipur Agri 18.76 17.45 17.11 18.28 19.27 20.10 20.32 20.54Agri&Allied 24.74 23.20 22.76 23.63 24.26 24.78 24.78 24.76Manufacturing 4.42 4.42 4.91 5.43 4.96 4.94 4.99 5.11Industry 36.66 37.01 37.15 36.10 34.70 33.65 32.94 32.28Services 38.59 39.79 40.09 40.27 41.04 41.56 42.28 42.96
17 Meghalaya Agri 16.59 16.57 15.66 14.88 13.91 13.48 13.02 12.56Agri&Allied 23.25 22.60 21.26 20.15 18.58 17.80 17.01 16.23Manufacturing 1.60 3.35 5.34 5.70 4.78 5.35 5.96 6.64Industry 26.14 26.37 27.63 28.89 30.10 30.72 31.42 32.10Services 50.61 51.03 51.11 50.96 51.31 51.48 51.57 51.67
18 Mizoram Agri 13.47 12.91 12.83 14.17 15.05 15.31 14.47Agri&Allied 23.50 22.32 21.37 21.96 21.74 21.41 20.16Manufacturing 1.40 1.34 1.49 1.61 1.37 1.35 1.34Industry 16.60 19.93 19.24 19.58 20.17 19.97 20.10Services 59.90 57.74 59.40 58.46 58.09 58.62 59.74
19 Nagaland Agri 27.43 25.33 23.59 22.03 21.95 21.45 21.05 20.65Agri&Allied 34.75 32.33 30.28 28.39 28.71 28.10 27.56 27.05Manufacturing 1.69 1.84 1.94 2.05 1.67 1.68 1.65 1.62Industry 12.88 13.67 14.57 14.93 16.23 16.92 17.40 17.91Services 52.36 53.99 55.15 56.67 55.06 54.98 55.03 55.04
20 Odisha Agri 18.79 18.39 16.56 15.72 14.84 15.28 14.44 13.47Agri&Allied 40.67 38.85 35.41 33.14 31.38 29.36 27.83 25.95Manufacturing 12.05 11.70 13.12 15.74 16.56 14.52 15.67 16.36Industry 34.12 33.14 35.65 37.73 36.86 35.24 35.12 35.55Services 42.39 43.89 43.61 42.70 44.64 46.02 47.29 47.99
21 Punjab Agri 31.12 29.62 27.65 26.37 25.39 23.70 22.79 21.48Agri&Allied 32.64 31.12 29.05 27.66 26.66 24.95 24.00 22.67Manufacturing 15.14 15.74 17.76 19.58 19.08 20.05 20.20 21.06Industry 24.76 25.99 28.64 30.63 30.16 30.91 31.02 31.96Services 42.59 42.89 42.31 41.72 43.18 44.14 44.98 45.36
Databook for DCH; 5th December 2012 Page 48 of 266
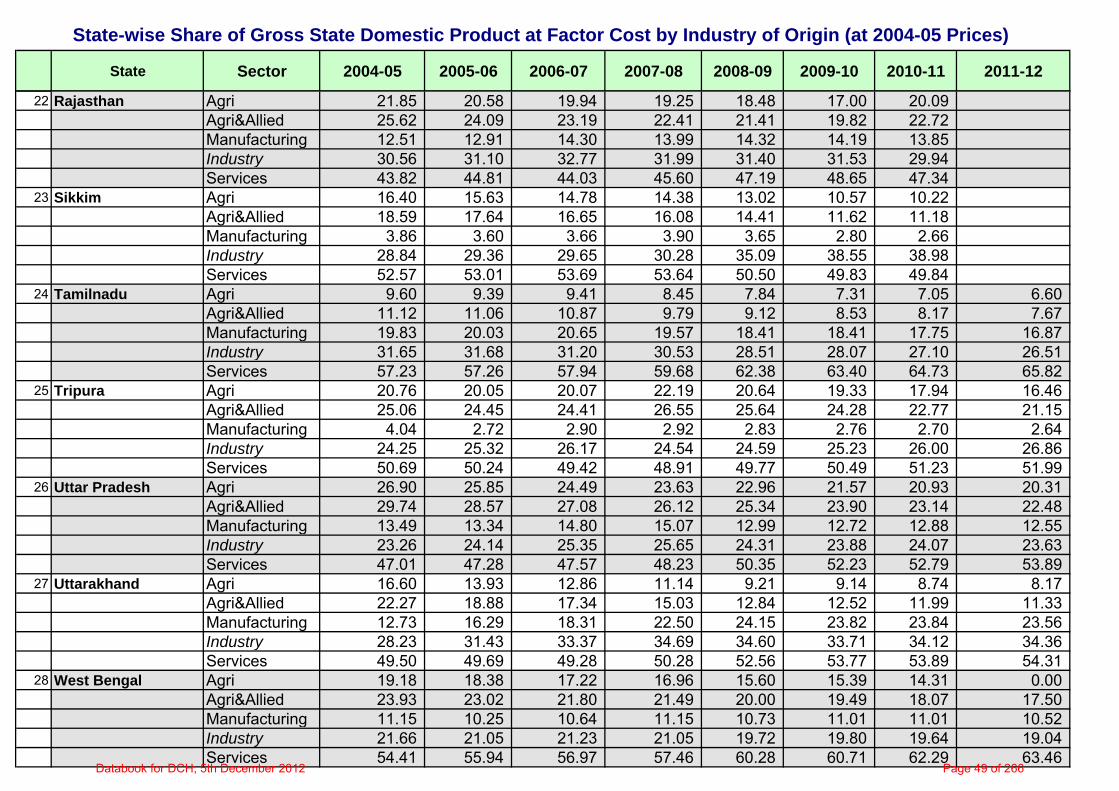
State Sector 2004-05 2005-06 2006-07 2007-08 2008-09 2009-10 2010-11 2011-12
State-wise Share of Gross State Domestic Product at Factor Cost by Industry of Origin (at 2004-05 Prices)
22 Rajasthan Agri 21.85 20.58 19.94 19.25 18.48 17.00 20.09Agri&Allied 25.62 24.09 23.19 22.41 21.41 19.82 22.72Manufacturing 12.51 12.91 14.30 13.99 14.32 14.19 13.85Industry 30.56 31.10 32.77 31.99 31.40 31.53 29.94Services 43.82 44.81 44.03 45.60 47.19 48.65 47.34
23 Sikkim Agri 16.40 15.63 14.78 14.38 13.02 10.57 10.22Agri&Allied 18.59 17.64 16.65 16.08 14.41 11.62 11.18Manufacturing 3.86 3.60 3.66 3.90 3.65 2.80 2.66Industry 28.84 29.36 29.65 30.28 35.09 38.55 38.98Services 52.57 53.01 53.69 53.64 50.50 49.83 49.84
24 Tamilnadu Agri 9.60 9.39 9.41 8.45 7.84 7.31 7.05 6.60Agri&Allied 11.12 11.06 10.87 9.79 9.12 8.53 8.17 7.67Manufacturing 19.83 20.03 20.65 19.57 18.41 18.41 17.75 16.87Industry 31.65 31.68 31.20 30.53 28.51 28.07 27.10 26.51Services 57.23 57.26 57.94 59.68 62.38 63.40 64.73 65.82
25 Tripura Agri 20.76 20.05 20.07 22.19 20.64 19.33 17.94 16.46Agri&Allied 25.06 24.45 24.41 26.55 25.64 24.28 22.77 21.15Manufacturing 4.04 2.72 2.90 2.92 2.83 2.76 2.70 2.64Industry 24.25 25.32 26.17 24.54 24.59 25.23 26.00 26.86Services 50.69 50.24 49.42 48.91 49.77 50.49 51.23 51.99
26 Uttar Pradesh Agri 26.90 25.85 24.49 23.63 22.96 21.57 20.93 20.31Agri&Allied 29.74 28.57 27.08 26.12 25.34 23.90 23.14 22.48Manufacturing 13.49 13.34 14.80 15.07 12.99 12.72 12.88 12.55Industry 23.26 24.14 25.35 25.65 24.31 23.88 24.07 23.63Services 47.01 47.28 47.57 48.23 50.35 52.23 52.79 53.89
27 Uttarakhand Agri 16.60 13.93 12.86 11.14 9.21 9.14 8.74 8.17Agri&Allied 22.27 18.88 17.34 15.03 12.84 12.52 11.99 11.33Manufacturing 12.73 16.29 18.31 22.50 24.15 23.82 23.84 23.56Industry 28.23 31.43 33.37 34.69 34.60 33.71 34.12 34.36Services 49.50 49.69 49.28 50.28 52.56 53.77 53.89 54.31
28 West Bengal Agri 19.18 18.38 17.22 16.96 15.60 15.39 14.31 0.00Agri&Allied 23.93 23.02 21.80 21.49 20.00 19.49 18.07 17.50Manufacturing 11.15 10.25 10.64 11.15 10.73 11.01 11.01 10.52Industry 21.66 21.05 21.23 21.05 19.72 19.80 19.64 19.04Services 54.41 55.94 56.97 57.46 60.28 60.71 62.29 63.46
Databook for DCH; 5th December 2012 Page 49 of 266
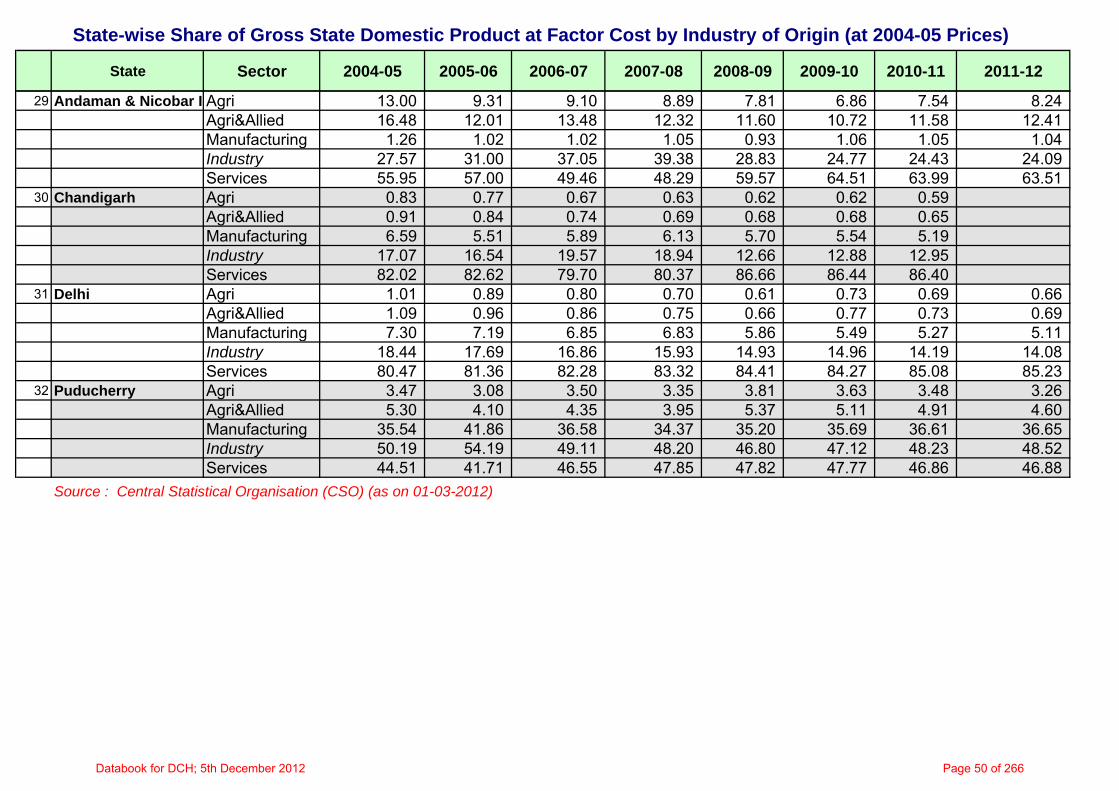
State Sector 2004-05 2005-06 2006-07 2007-08 2008-09 2009-10 2010-11 2011-12
State-wise Share of Gross State Domestic Product at Factor Cost by Industry of Origin (at 2004-05 Prices)
29 Andaman & Nicobar I Agri 13.00 9.31 9.10 8.89 7.81 6.86 7.54 8.24Agri&Allied 16.48 12.01 13.48 12.32 11.60 10.72 11.58 12.41Manufacturing 1.26 1.02 1.02 1.05 0.93 1.06 1.05 1.04Industry 27.57 31.00 37.05 39.38 28.83 24.77 24.43 24.09Services 55.95 57.00 49.46 48.29 59.57 64.51 63.99 63.51
30 Chandigarh Agri 0.83 0.77 0.67 0.63 0.62 0.62 0.59Agri&Allied 0.91 0.84 0.74 0.69 0.68 0.68 0.65Manufacturing 6.59 5.51 5.89 6.13 5.70 5.54 5.19Industry 17.07 16.54 19.57 18.94 12.66 12.88 12.95Services 82.02 82.62 79.70 80.37 86.66 86.44 86.40
31 Delhi Agri 1.01 0.89 0.80 0.70 0.61 0.73 0.69 0.66Agri&Allied 1.09 0.96 0.86 0.75 0.66 0.77 0.73 0.69Manufacturing 7.30 7.19 6.85 6.83 5.86 5.49 5.27 5.11Industry 18.44 17.69 16.86 15.93 14.93 14.96 14.19 14.08Services 80.47 81.36 82.28 83.32 84.41 84.27 85.08 85.23
32 Puducherry Agri 3.47 3.08 3.50 3.35 3.81 3.63 3.48 3.26Agri&Allied 5.30 4.10 4.35 3.95 5.37 5.11 4.91 4.60Manufacturing 35.54 41.86 36.58 34.37 35.20 35.69 36.61 36.65Industry 50.19 54.19 49.11 48.20 46.80 47.12 48.23 48.52Services 44.51 41.71 46.55 47.85 47.82 47.77 46.86 46.88
Source : Central Statistical Organisation (CSO) (as on 01-03-2012)
Databook for DCH; 5th December 2012 Page 50 of 266
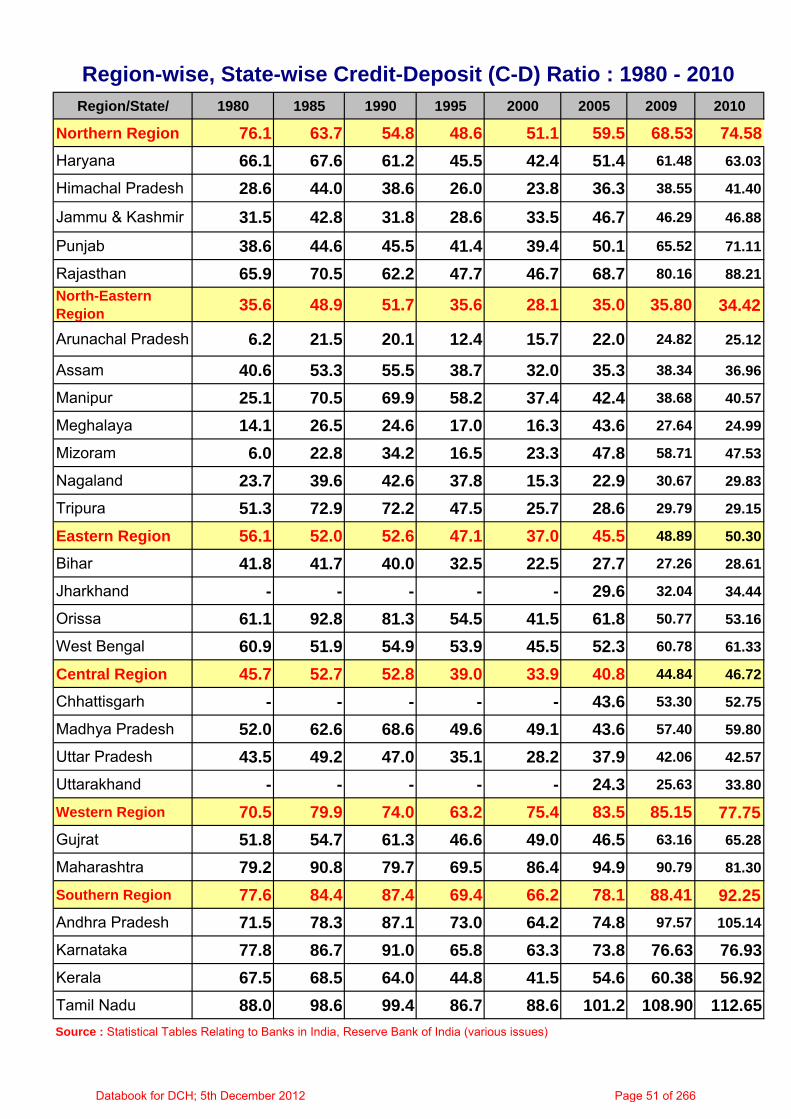
Region-wise, State-wise Credit-Deposit (C-D) Ratio : 1980 - 2010
Region/State/ 1980 1985 1990 1995 2000 2005 2009 2010
Northern Region 76.1 63.7 54.8 48.6 51.1 59.5 68.53 74.58
Haryana 66.1 67.6 61.2 45.5 42.4 51.4 61.48 63.03
Himachal Pradesh 28.6 44.0 38.6 26.0 23.8 36.3 38.55 41.40
Jammu & Kashmir 31.5 42.8 31.8 28.6 33.5 46.7 46.29 46.88
Punjab 38.6 44.6 45.5 41.4 39.4 50.1 65.52 71.11
Rajasthan 65.9 70.5 62.2 47.7 46.7 68.7 80.16 88.21North-Eastern
Region35.6 48.9 51.7 35.6 28.1 35.0 35.80 34.42
Arunachal Pradesh 6.2 21.5 20.1 12.4 15.7 22.0 24.82 25.12
Assam 40.6 53.3 55.5 38.7 32.0 35.3 38.34 36.96
Manipur 25.1 70.5 69.9 58.2 37.4 42.4 38.68 40.57
Meghalaya 14.1 26.5 24.6 17.0 16.3 43.6 27.64 24.99
Mizoram 6.0 22.8 34.2 16.5 23.3 47.8 58.71 47.53
Nagaland 23.7 39.6 42.6 37.8 15.3 22.9 30.67 29.83
Tripura 51.3 72.9 72.2 47.5 25.7 28.6 29.79 29.15
Eastern Region 56.1 52.0 52.6 47.1 37.0 45.5 48.89 50.30
Bihar 41.8 41.7 40.0 32.5 22.5 27.7 27.26 28.61
Jharkhand - - - - - 29.6 32.04 34.44
Orissa 61.1 92.8 81.3 54.5 41.5 61.8 50.77 53.16
West Bengal 60.9 51.9 54.9 53.9 45.5 52.3 60.78 61.33
Central Region 45.7 52.7 52.8 39.0 33.9 40.8 44.84 46.72
Chhattisgarh - - - - - 43.6 53.30 52.75
Madhya Pradesh 52.0 62.6 68.6 49.6 49.1 43.6 57.40 59.80
Uttar Pradesh 43.5 49.2 47.0 35.1 28.2 37.9 42.06 42.57
Uttarakhand - - - - - 24.3 25.63 33.80
Western Region 70.5 79.9 74.0 63.2 75.4 83.5 85.15 77.75Gujrat 51.8 54.7 61.3 46.6 49.0 46.5 63.16 65.28
Maharashtra 79.2 90.8 79.7 69.5 86.4 94.9 90.79 81.30
Southern Region 77.6 84.4 87.4 69.4 66.2 78.1 88.41 92.25Andhra Pradesh 71.5 78.3 87.1 73.0 64.2 74.8 97.57 105.14
Karnataka 77.8 86.7 91.0 65.8 63.3 73.8 76.63 76.93
Kerala 67.5 68.5 64.0 44.8 41.5 54.6 60.38 56.92
Tamil Nadu 88.0 98.6 99.4 86.7 88.6 101.2 108.90 112.65
Source : Statistical Tables Relating to Banks in India, Reserve Bank of India (various issues)
Databook for DCH; 5th December 2012 Page 51 of 266
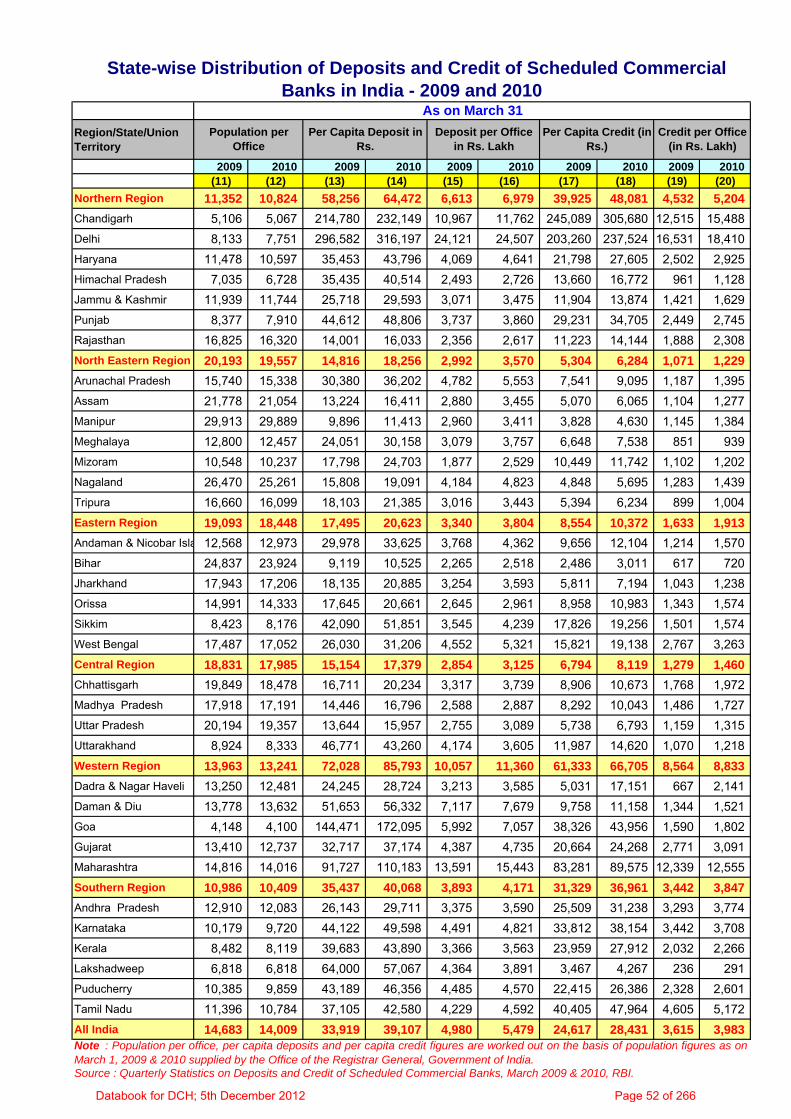
a
State-wise Distribution of Deposits and Credit of Scheduled Commercial
Banks in India - 2009 and 2010As on March 31
Region/State/Union
Territory
Population per
Office
Per Capita Deposit in
Rs.
Deposit per Office
in Rs. Lakh
Per Capita Credit (in
Rs.)
Credit per Office
(in Rs. Lakh)
2009 2010 2009 2010 2009 2010 2009 2010 2009 2010
(11) (12) (13) (14) (15) (16) (17) (18) (19) (20)
Northern Region 11,352 10,824 58,256 64,472 6,613 6,979 39,925 48,081 4,532 5,204
Chandigarh 5,106 5,067 214,780 232,149 10,967 11,762 245,089 305,680 12,515 15,488Delhi 8,133 7,751 296,582 316,197 24,121 24,507 203,260 237,524 16,531 18,410Haryana 11,478 10,597 35,453 43,796 4,069 4,641 21,798 27,605 2,502 2,925Himachal Pradesh 7,035 6,728 35,435 40,514 2,493 2,726 13,660 16,772 961 1,128Jammu & Kashmir 11,939 11,744 25,718 29,593 3,071 3,475 11,904 13,874 1,421 1,629Punjab 8,377 7,910 44,612 48,806 3,737 3,860 29,231 34,705 2,449 2,745Rajasthan 16,825 16,320 14,001 16,033 2,356 2,617 11,223 14,144 1,888 2,308North Eastern Region 20,193 19,557 14,816 18,256 2,992 3,570 5,304 6,284 1,071 1,229
Arunachal Pradesh 15,740 15,338 30,380 36,202 4,782 5,553 7,541 9,095 1,187 1,395Assam 21,778 21,054 13,224 16,411 2,880 3,455 5,070 6,065 1,104 1,277Manipur 29,913 29,889 9,896 11,413 2,960 3,411 3,828 4,630 1,145 1,384Meghalaya 12,800 12,457 24,051 30,158 3,079 3,757 6,648 7,538 851 939Mizoram 10,548 10,237 17,798 24,703 1,877 2,529 10,449 11,742 1,102 1,202Nagaland 26,470 25,261 15,808 19,091 4,184 4,823 4,848 5,695 1,283 1,439Tripura 16,660 16,099 18,103 21,385 3,016 3,443 5,394 6,234 899 1,004Eastern Region 19,093 18,448 17,495 20,623 3,340 3,804 8,554 10,372 1,633 1,913
Andaman & Nicobar Isl 12,568 12,973 29,978 33,625 3,768 4,362 9,656 12,104 1,214 1,570Bihar 24,837 23,924 9,119 10,525 2,265 2,518 2,486 3,011 617 720Jharkhand 17,943 17,206 18,135 20,885 3,254 3,593 5,811 7,194 1,043 1,238Orissa 14,991 14,333 17,645 20,661 2,645 2,961 8,958 10,983 1,343 1,574Sikkim 8,423 8,176 42,090 51,851 3,545 4,239 17,826 19,256 1,501 1,574West Bengal 17,487 17,052 26,030 31,206 4,552 5,321 15,821 19,138 2,767 3,263Central Region 18,831 17,985 15,154 17,379 2,854 3,125 6,794 8,119 1,279 1,460
Chhattisgarh 19,849 18,478 16,711 20,234 3,317 3,739 8,906 10,673 1,768 1,972Madhya Pradesh 17,918 17,191 14,446 16,796 2,588 2,887 8,292 10,043 1,486 1,727Uttar Pradesh 20,194 19,357 13,644 15,957 2,755 3,089 5,738 6,793 1,159 1,315Uttarakhand 8,924 8,333 46,771 43,260 4,174 3,605 11,987 14,620 1,070 1,218Western Region 13,963 13,241 72,028 85,793 10,057 11,360 61,333 66,705 8,564 8,833
Dadra & Nagar Haveli 13,250 12,481 24,245 28,724 3,213 3,585 5,031 17,151 667 2,141Daman & Diu 13,778 13,632 51,653 56,332 7,117 7,679 9,758 11,158 1,344 1,521Goa 4,148 4,100 144,471 172,095 5,992 7,057 38,326 43,956 1,590 1,802Gujarat 13,410 12,737 32,717 37,174 4,387 4,735 20,664 24,268 2,771 3,091Maharashtra 14,816 14,016 91,727 110,183 13,591 15,443 83,281 89,575 12,339 12,555Southern Region 10,986 10,409 35,437 40,068 3,893 4,171 31,329 36,961 3,442 3,847
Andhra Pradesh 12,910 12,083 26,143 29,711 3,375 3,590 25,509 31,238 3,293 3,774Karnataka 10,179 9,720 44,122 49,598 4,491 4,821 33,812 38,154 3,442 3,708Kerala 8,482 8,119 39,683 43,890 3,366 3,563 23,959 27,912 2,032 2,266Lakshadweep 6,818 6,818 64,000 57,067 4,364 3,891 3,467 4,267 236 291Puducherry 10,385 9,859 43,189 46,356 4,485 4,570 22,415 26,386 2,328 2,601Tamil Nadu 11,396 10,784 37,105 42,580 4,229 4,592 40,405 47,964 4,605 5,172All India 14,683 14,009 33,919 39,107 4,980 5,479 24,617 28,431 3,615 3,983
Note : Population per office, per capita deposits and per capita credit figures are worked out on the basis of population figures as onMarch 1, 2009 & 2010 supplied by the Office of the Registrar General, Government of India.Source : Quarterly Statistics on Deposits and Credit of Scheduled Commercial Banks, March 2009 & 2010, RBI.
Databook for DCH; 5th December 2012 Page 52 of 266
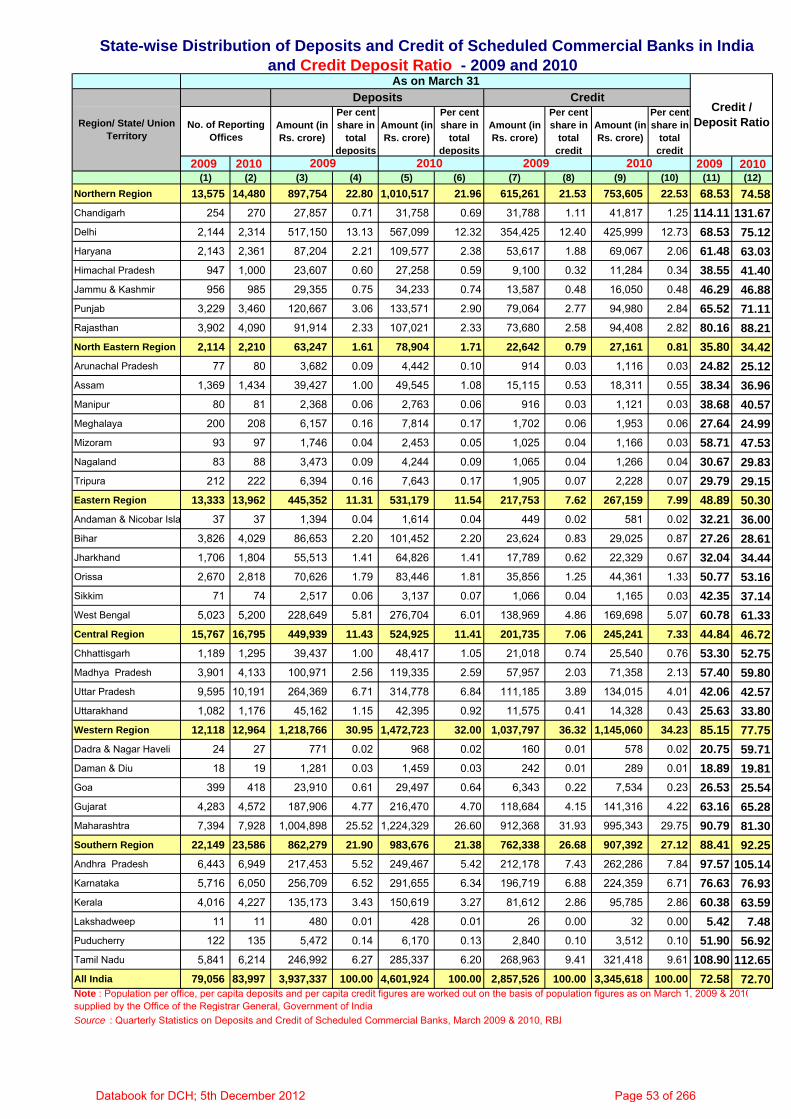
State-wise Distribution of Deposits and Credit of Scheduled Commercial Banks in India
and Credit Deposit Ratio - 2009 and 2010As on March 31
Credit /
Deposit RatioRegion/ State/ Union
Territory
Deposits Credit
No. of Reporting
Offices
Amount (in
Rs. crore)
Per cent
share in
total
deposits
Amount (in
Rs. crore)
Per cent
share in
total
deposits
Amount (in
Rs. crore)
Per cent
share in
total
credit
Amount (in
Rs. crore)
Per cent
share in
total
credit
2009 2010 2009 2010 2009 2010 2009 2010(1) (2) (3) (4) (5) (6) (7) (8) (9) (10) (11) (12)
Northern Region 13,575 14,480 897,754 22.80 1,010,517 21.96 615,261 21.53 753,605 22.53 68.53 74.58Chandigarh 254 270 27,857 0.71 31,758 0.69 31,788 1.11 41,817 1.25 114.11 131.67Delhi 2,144 2,314 517,150 13.13 567,099 12.32 354,425 12.40 425,999 12.73 68.53 75.12Haryana 2,143 2,361 87,204 2.21 109,577 2.38 53,617 1.88 69,067 2.06 61.48 63.03Himachal Pradesh 947 1,000 23,607 0.60 27,258 0.59 9,100 0.32 11,284 0.34 38.55 41.40Jammu & Kashmir 956 985 29,355 0.75 34,233 0.74 13,587 0.48 16,050 0.48 46.29 46.88Punjab 3,229 3,460 120,667 3.06 133,571 2.90 79,064 2.77 94,980 2.84 65.52 71.11Rajasthan 3,902 4,090 91,914 2.33 107,021 2.33 73,680 2.58 94,408 2.82 80.16 88.21North Eastern Region 2,114 2,210 63,247 1.61 78,904 1.71 22,642 0.79 27,161 0.81 35.80 34.42Arunachal Pradesh 77 80 3,682 0.09 4,442 0.10 914 0.03 1,116 0.03 24.82 25.12Assam 1,369 1,434 39,427 1.00 49,545 1.08 15,115 0.53 18,311 0.55 38.34 36.96Manipur 80 81 2,368 0.06 2,763 0.06 916 0.03 1,121 0.03 38.68 40.57Meghalaya 200 208 6,157 0.16 7,814 0.17 1,702 0.06 1,953 0.06 27.64 24.99Mizoram 93 97 1,746 0.04 2,453 0.05 1,025 0.04 1,166 0.03 58.71 47.53Nagaland 83 88 3,473 0.09 4,244 0.09 1,065 0.04 1,266 0.04 30.67 29.83Tripura 212 222 6,394 0.16 7,643 0.17 1,905 0.07 2,228 0.07 29.79 29.15Eastern Region 13,333 13,962 445,352 11.31 531,179 11.54 217,753 7.62 267,159 7.99 48.89 50.30Andaman & Nicobar Isla 37 37 1,394 0.04 1,614 0.04 449 0.02 581 0.02 32.21 36.00Bihar 3,826 4,029 86,653 2.20 101,452 2.20 23,624 0.83 29,025 0.87 27.26 28.61Jharkhand 1,706 1,804 55,513 1.41 64,826 1.41 17,789 0.62 22,329 0.67 32.04 34.44Orissa 2,670 2,818 70,626 1.79 83,446 1.81 35,856 1.25 44,361 1.33 50.77 53.16Sikkim 71 74 2,517 0.06 3,137 0.07 1,066 0.04 1,165 0.03 42.35 37.14West Bengal 5,023 5,200 228,649 5.81 276,704 6.01 138,969 4.86 169,698 5.07 60.78 61.33Central Region 15,767 16,795 449,939 11.43 524,925 11.41 201,735 7.06 245,241 7.33 44.84 46.72Chhattisgarh 1,189 1,295 39,437 1.00 48,417 1.05 21,018 0.74 25,540 0.76 53.30 52.75Madhya Pradesh 3,901 4,133 100,971 2.56 119,335 2.59 57,957 2.03 71,358 2.13 57.40 59.80Uttar Pradesh 9,595 10,191 264,369 6.71 314,778 6.84 111,185 3.89 134,015 4.01 42.06 42.57Uttarakhand 1,082 1,176 45,162 1.15 42,395 0.92 11,575 0.41 14,328 0.43 25.63 33.80Western Region 12,118 12,964 1,218,766 30.95 1,472,723 32.00 1,037,797 36.32 1,145,060 34.23 85.15 77.75Dadra & Nagar Haveli 24 27 771 0.02 968 0.02 160 0.01 578 0.02 20.75 59.71Daman & Diu 18 19 1,281 0.03 1,459 0.03 242 0.01 289 0.01 18.89 19.81Goa 399 418 23,910 0.61 29,497 0.64 6,343 0.22 7,534 0.23 26.53 25.54Gujarat 4,283 4,572 187,906 4.77 216,470 4.70 118,684 4.15 141,316 4.22 63.16 65.28Maharashtra 7,394 7,928 1,004,898 25.52 1,224,329 26.60 912,368 31.93 995,343 29.75 90.79 81.30Southern Region 22,149 23,586 862,279 21.90 983,676 21.38 762,338 26.68 907,392 27.12 88.41 92.25Andhra Pradesh 6,443 6,949 217,453 5.52 249,467 5.42 212,178 7.43 262,286 7.84 97.57 105.14Karnataka 5,716 6,050 256,709 6.52 291,655 6.34 196,719 6.88 224,359 6.71 76.63 76.93Kerala 4,016 4,227 135,173 3.43 150,619 3.27 81,612 2.86 95,785 2.86 60.38 63.59Lakshadweep 11 11 480 0.01 428 0.01 26 0.00 32 0.00 5.42 7.48Puducherry 122 135 5,472 0.14 6,170 0.13 2,840 0.10 3,512 0.10 51.90 56.92Tamil Nadu 5,841 6,214 246,992 6.27 285,337 6.20 268,963 9.41 321,418 9.61 108.90 112.65All India 79,056 83,997 3,937,337 100.00 4,601,924 100.00 2,857,526 100.00 3,345,618 100.00 72.58 72.70Note : Population per office, per capita deposits and per capita credit figures are worked out on the basis of population figures as on March 1, 2009 & 2010supplied by the Office of the Registrar General, Government of IndiaSource : Quarterly Statistics on Deposits and Credit of Scheduled Commercial Banks, March 2009 & 2010, RBI.
Databook for DCH; 5th December 2012 Page 53 of 266
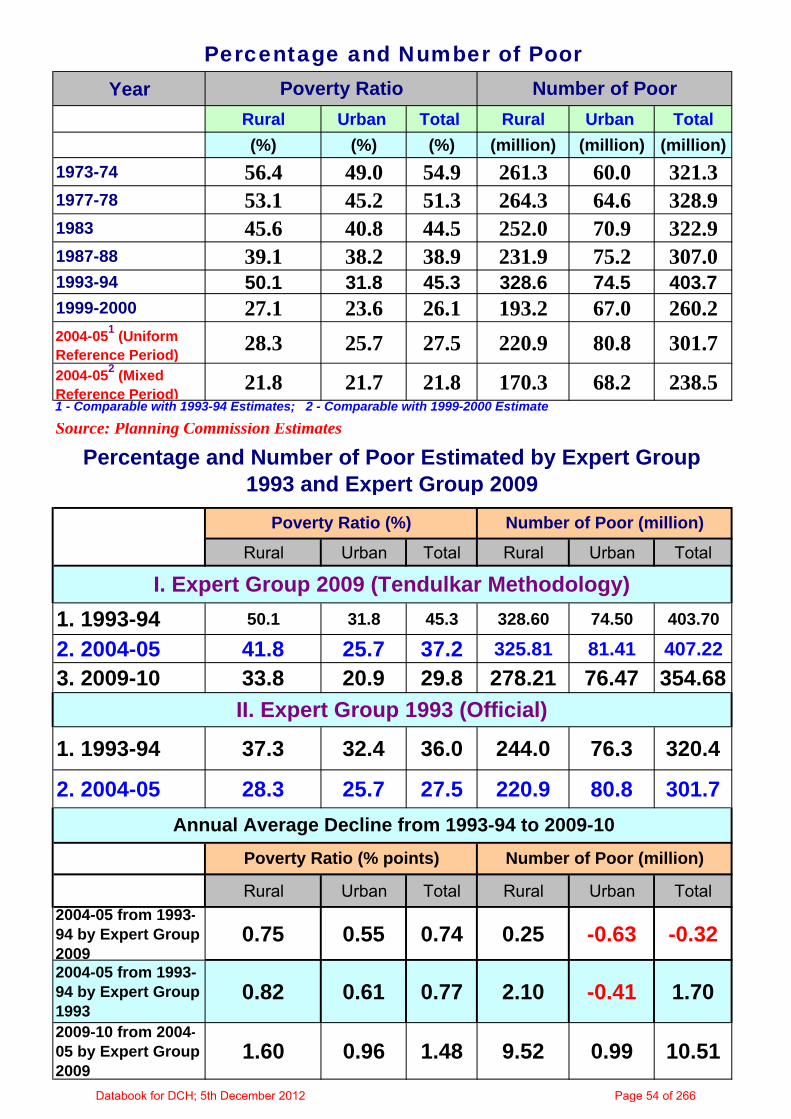
Percentage and Number of PoorYear Poverty Ratio Number of Poor
Rural Urban Total Rural Urban Total
(%) (%) (%) (million) (million) (million)
1973-74 56.4 49.0 54.9 261.3 60.0 321.31977-78 53.1 45.2 51.3 264.3 64.6 328.91983 45.6 40.8 44.5 252.0 70.9 322.91987-88 39.1 38.2 38.9 231.9 75.2 307.01993-94 50.1 31.8 45.3 328.6 74.5 403.7
1999-2000 27.1 23.6 26.1 193.2 67.0 260.22004-05
1 (Uniform
Reference Period)28.3 25.7 27.5 220.9 80.8 301.7
2004-052 (Mixed
Reference Period)21.8 21.7 21.8 170.3 68.2 238.5
1 - Comparable with 1993-94 Estimates; 2 - Comparable with 1999-2000 Estimates
Source: Planning Commission Estimates
Percentage and Number of Poor Estimated by Expert Group
1993 and Expert Group 2009
Poverty Ratio (%) Number of Poor (million)
Rural Urban Total Rural Urban Total
I. Expert Group 2009 (Tendulkar Methodology)
1. 1993-94 50.1 31.8 45.3 328.60 74.50 403.70
2. 2004-05 41.8 25.7 37.2 325.81 81.41 407.22
3. 2009-10 33.8 20.9 29.8 278.21 76.47 354.68
II. Expert Group 1993 (Official)
1. 1993-94 37.3 32.4 36.0 244.0 76.3 320.4
2. 2004-05 28.3 25.7 27.5 220.9 80.8 301.7
Annual Average Decline from 1993-94 to 2009-10
Poverty Ratio (% points) Number of Poor (million)
Rural Urban Total Rural Urban Total2004-05 from 1993-
94 by Expert Group
20090.75 0.55 0.74 0.25 -0.63 -0.32
2004-05 from 1993-
94 by Expert Group
19930.82 0.61 0.77 2.10 -0.41 1.70
2009-10 from 2004-
05 by Expert Group
20091.60 0.96 1.48 9.52 0.99 10.51
Databook for DCH; 5th December 2012 Page 54 of 266
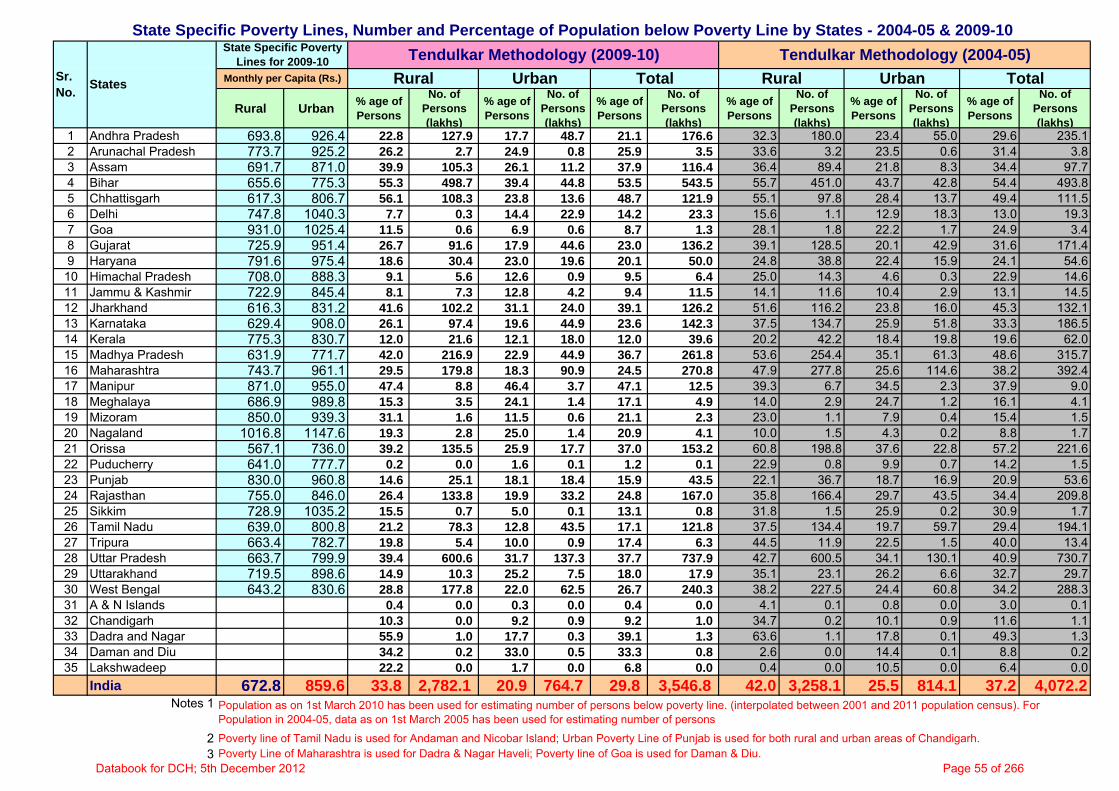
State Specific Poverty Lines, Number and Percentage of Population below Poverty Line by States - 2004-05 & 2009-10
Sr.
No.States
State Specific Poverty
Lines for 2009-10Tendulkar Methodology (2009-10) Tendulkar Methodology (2004-05)
Monthly per Capita (Rs.) Rural Urban Total Rural Urban Total
Rural Urban% age of
Persons
No. of
Persons
(lakhs)
% age of
Persons
No. of
Persons
(lakhs)
% age of
Persons
No. of
Persons
(lakhs)
% age of
Persons
No. of
Persons
(lakhs)
% age of
Persons
No. of
Persons
(lakhs)
% age of
Persons
No. of
Persons
(lakhs)
1 Andhra Pradesh 693.8 926.4 22.8 127.9 17.7 48.7 21.1 176.6 32.3 180.0 23.4 55.0 29.6 235.12 Arunachal Pradesh 773.7 925.2 26.2 2.7 24.9 0.8 25.9 3.5 33.6 3.2 23.5 0.6 31.4 3.83 Assam 691.7 871.0 39.9 105.3 26.1 11.2 37.9 116.4 36.4 89.4 21.8 8.3 34.4 97.74 Bihar 655.6 775.3 55.3 498.7 39.4 44.8 53.5 543.5 55.7 451.0 43.7 42.8 54.4 493.85 Chhattisgarh 617.3 806.7 56.1 108.3 23.8 13.6 48.7 121.9 55.1 97.8 28.4 13.7 49.4 111.56 Delhi 747.8 1040.3 7.7 0.3 14.4 22.9 14.2 23.3 15.6 1.1 12.9 18.3 13.0 19.37 Goa 931.0 1025.4 11.5 0.6 6.9 0.6 8.7 1.3 28.1 1.8 22.2 1.7 24.9 3.48 Gujarat 725.9 951.4 26.7 91.6 17.9 44.6 23.0 136.2 39.1 128.5 20.1 42.9 31.6 171.49 Haryana 791.6 975.4 18.6 30.4 23.0 19.6 20.1 50.0 24.8 38.8 22.4 15.9 24.1 54.610 Himachal Pradesh 708.0 888.3 9.1 5.6 12.6 0.9 9.5 6.4 25.0 14.3 4.6 0.3 22.9 14.611 Jammu & Kashmir 722.9 845.4 8.1 7.3 12.8 4.2 9.4 11.5 14.1 11.6 10.4 2.9 13.1 14.512 Jharkhand 616.3 831.2 41.6 102.2 31.1 24.0 39.1 126.2 51.6 116.2 23.8 16.0 45.3 132.113 Karnataka 629.4 908.0 26.1 97.4 19.6 44.9 23.6 142.3 37.5 134.7 25.9 51.8 33.3 186.514 Kerala 775.3 830.7 12.0 21.6 12.1 18.0 12.0 39.6 20.2 42.2 18.4 19.8 19.6 62.015 Madhya Pradesh 631.9 771.7 42.0 216.9 22.9 44.9 36.7 261.8 53.6 254.4 35.1 61.3 48.6 315.716 Maharashtra 743.7 961.1 29.5 179.8 18.3 90.9 24.5 270.8 47.9 277.8 25.6 114.6 38.2 392.417 Manipur 871.0 955.0 47.4 8.8 46.4 3.7 47.1 12.5 39.3 6.7 34.5 2.3 37.9 9.018 Meghalaya 686.9 989.8 15.3 3.5 24.1 1.4 17.1 4.9 14.0 2.9 24.7 1.2 16.1 4.119 Mizoram 850.0 939.3 31.1 1.6 11.5 0.6 21.1 2.3 23.0 1.1 7.9 0.4 15.4 1.520 Nagaland 1016.8 1147.6 19.3 2.8 25.0 1.4 20.9 4.1 10.0 1.5 4.3 0.2 8.8 1.721 Orissa 567.1 736.0 39.2 135.5 25.9 17.7 37.0 153.2 60.8 198.8 37.6 22.8 57.2 221.622 Puducherry 641.0 777.7 0.2 0.0 1.6 0.1 1.2 0.1 22.9 0.8 9.9 0.7 14.2 1.523 Punjab 830.0 960.8 14.6 25.1 18.1 18.4 15.9 43.5 22.1 36.7 18.7 16.9 20.9 53.624 Rajasthan 755.0 846.0 26.4 133.8 19.9 33.2 24.8 167.0 35.8 166.4 29.7 43.5 34.4 209.825 Sikkim 728.9 1035.2 15.5 0.7 5.0 0.1 13.1 0.8 31.8 1.5 25.9 0.2 30.9 1.726 Tamil Nadu 639.0 800.8 21.2 78.3 12.8 43.5 17.1 121.8 37.5 134.4 19.7 59.7 29.4 194.127 Tripura 663.4 782.7 19.8 5.4 10.0 0.9 17.4 6.3 44.5 11.9 22.5 1.5 40.0 13.428 Uttar Pradesh 663.7 799.9 39.4 600.6 31.7 137.3 37.7 737.9 42.7 600.5 34.1 130.1 40.9 730.729 Uttarakhand 719.5 898.6 14.9 10.3 25.2 7.5 18.0 17.9 35.1 23.1 26.2 6.6 32.7 29.730 West Bengal 643.2 830.6 28.8 177.8 22.0 62.5 26.7 240.3 38.2 227.5 24.4 60.8 34.2 288.331 A & N Islands 0.4 0.0 0.3 0.0 0.4 0.0 4.1 0.1 0.8 0.0 3.0 0.132 Chandigarh 10.3 0.0 9.2 0.9 9.2 1.0 34.7 0.2 10.1 0.9 11.6 1.133 Dadra and Nagar 55.9 1.0 17.7 0.3 39.1 1.3 63.6 1.1 17.8 0.1 49.3 1.334 Daman and Diu 34.2 0.2 33.0 0.5 33.3 0.8 2.6 0.0 14.4 0.1 8.8 0.235 Lakshwadeep 22.2 0.0 1.7 0.0 6.8 0.0 0.4 0.0 10.5 0.0 6.4 0.0
India 672.8 859.6 33.8 2,782.1 20.9 764.7 29.8 3,546.8 42.0 3,258.1 25.5 814.1 37.2 4,072.2Notes 1 Population as on 1st March 2010 has been used for estimating number of persons below poverty line. (interpolated between 2001 and 2011 population census). For
Population in 2004-05, data as on 1st March 2005 has been used for estimating number of persons
2 Poverty line of Tamil Nadu is used for Andaman and Nicobar Island; Urban Poverty Line of Punjab is used for both rural and urban areas of Chandigarh.3 Poverty Line of Maharashtra is used for Dadra & Nagar Haveli; Poverty line of Goa is used for Daman & Diu.
Databook for DCH; 5th December 2012 Page 55 of 266
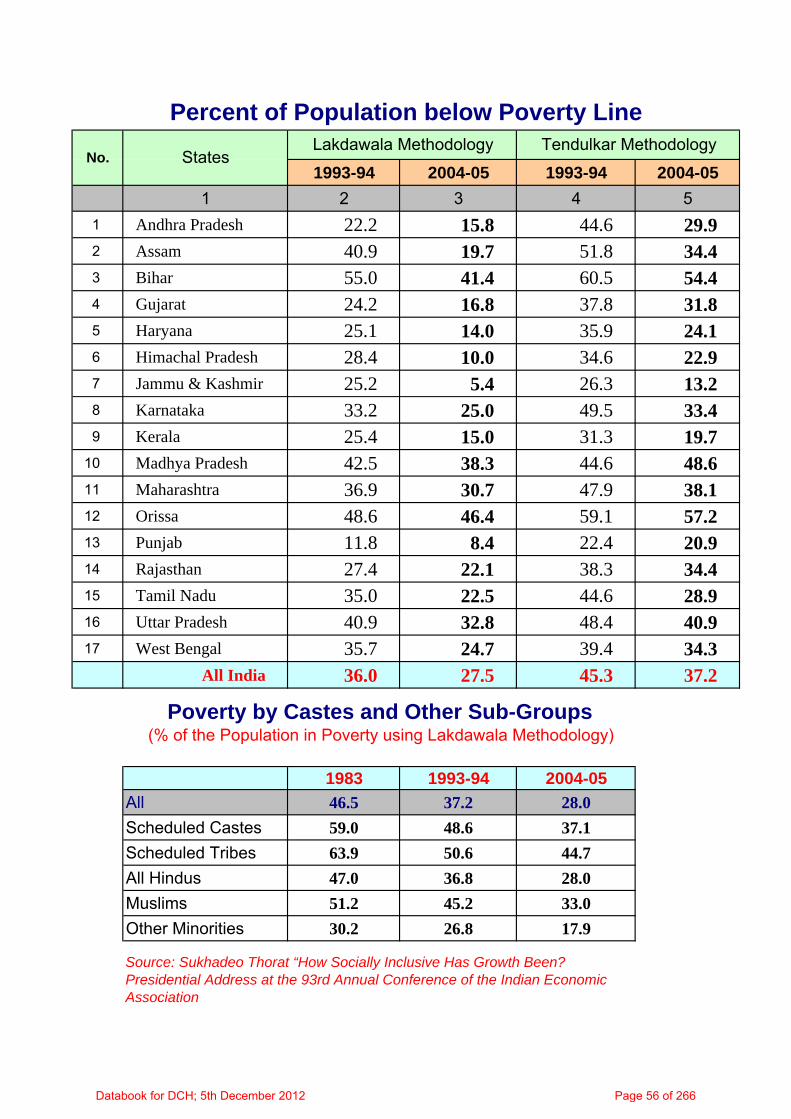
Percent of Population below Poverty Line
No. StatesLakdawala Methodology Tendulkar Methodology
1993-94 2004-05 1993-94 2004-051 2 3 4 5
1 Andhra Pradesh 22.2 15.8 44.6 29.9 2 Assam 40.9 19.7 51.8 34.4 3 Bihar 55.0 41.4 60.5 54.4 4 Gujarat 24.2 16.8 37.8 31.8 5 Haryana 25.1 14.0 35.9 24.1 6 Himachal Pradesh 28.4 10.0 34.6 22.9 7 Jammu & Kashmir 25.2 5.4 26.3 13.2 8 Karnataka 33.2 25.0 49.5 33.4 9 Kerala 25.4 15.0 31.3 19.7
10 Madhya Pradesh 42.5 38.3 44.6 48.6 11 Maharashtra 36.9 30.7 47.9 38.1 12 Orissa 48.6 46.4 59.1 57.2 13 Punjab 11.8 8.4 22.4 20.9 14 Rajasthan 27.4 22.1 38.3 34.4 15 Tamil Nadu 35.0 22.5 44.6 28.9 16 Uttar Pradesh 40.9 32.8 48.4 40.9 17 West Bengal 35.7 24.7 39.4 34.3
All India 36.0 27.5 45.3 37.2
Poverty by Castes and Other Sub-Groups(% of the Population in Poverty using Lakdawala Methodology)
1983 1993-94 2004-05All 46.5 37.2 28.0Scheduled Castes 59.0 48.6 37.1Scheduled Tribes 63.9 50.6 44.7All Hindus 47.0 36.8 28.0Muslims 51.2 45.2 33.0Other Minorities 30.2 26.8 17.9
Source: Sukhadeo Thorat “How Socially Inclusive Has Growth Been? Presidential Address at the 93rd Annual Conference of the Indian Economic Association
Databook for DCH; 5th December 2012 Page 56 of 266
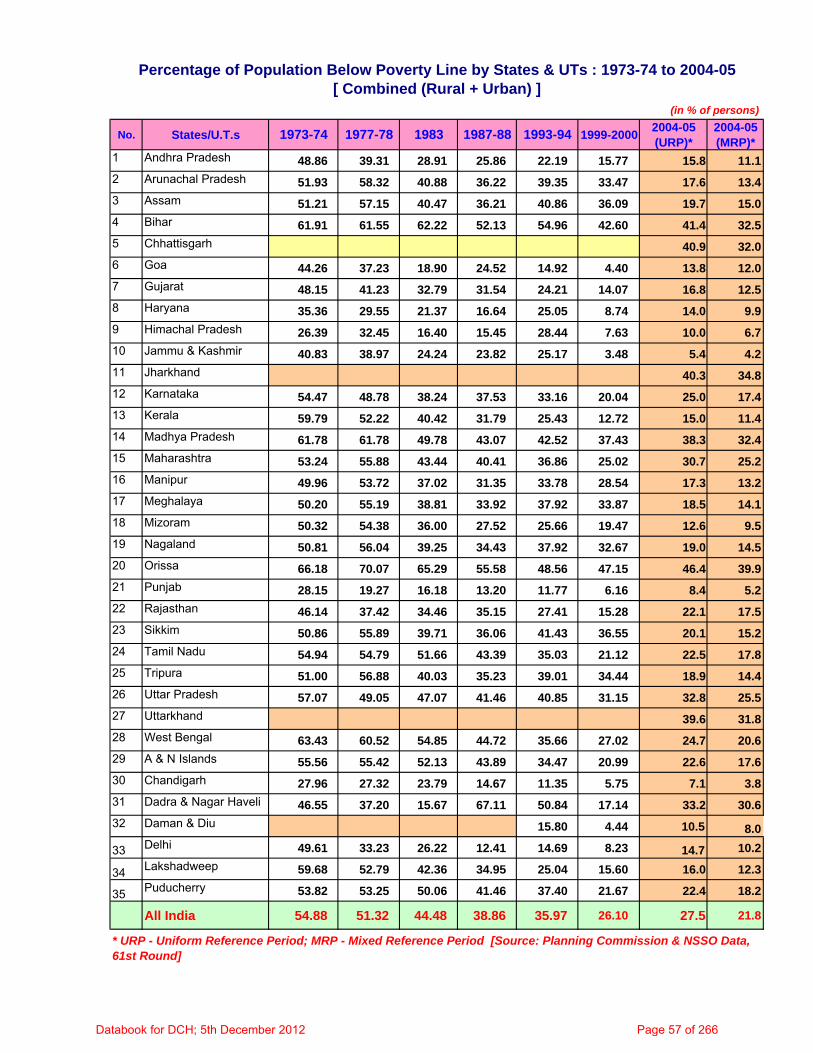
No. States/U.T.s 1999-2000 2004-05 (URP)*
2004-05 (MRP)*
1 Andhra Pradesh 48.86 39.31 28.91 25.86 22.19 15.77 15.8 11.12 Arunachal Pradesh 51.93 58.32 40.88 36.22 39.35 33.47 17.6 13.43 Assam 51.21 57.15 40.47 36.21 40.86 36.09 19.7 15.04 Bihar 61.91 61.55 62.22 52.13 54.96 42.60 41.4 32.55 Chhattisgarh 40.9 32.06 Goa 44.26 37.23 18.90 24.52 14.92 4.40 13.8 12.07 Gujarat 48.15 41.23 32.79 31.54 24.21 14.07 16.8 12.58 Haryana 35.36 29.55 21.37 16.64 25.05 8.74 14.0 9.99 Himachal Pradesh 26.39 32.45 16.40 15.45 28.44 7.63 10.0 6.710 Jammu & Kashmir 40.83 38.97 24.24 23.82 25.17 3.48 5.4 4.211 Jharkhand 40.3 34.812 Karnataka 54.47 48.78 38.24 37.53 33.16 20.04 25.0 17.413 Kerala 59.79 52.22 40.42 31.79 25.43 12.72 15.0 11.414 Madhya Pradesh 61.78 61.78 49.78 43.07 42.52 37.43 38.3 32.415 Maharashtra 53.24 55.88 43.44 40.41 36.86 25.02 30.7 25.216 Manipur 49.96 53.72 37.02 31.35 33.78 28.54 17.3 13.217 Meghalaya 50.20 55.19 38.81 33.92 37.92 33.87 18.5 14.118 Mizoram 50.32 54.38 36.00 27.52 25.66 19.47 12.6 9.519 Nagaland 50.81 56.04 39.25 34.43 37.92 32.67 19.0 14.520 Orissa 66.18 70.07 65.29 55.58 48.56 47.15 46.4 39.921 Punjab 28.15 19.27 16.18 13.20 11.77 6.16 8.4 5.222 Rajasthan 46.14 37.42 34.46 35.15 27.41 15.28 22.1 17.523 Sikkim 50.86 55.89 39.71 36.06 41.43 36.55 20.1 15.224 Tamil Nadu 54.94 54.79 51.66 43.39 35.03 21.12 22.5 17.825 Tripura 51.00 56.88 40.03 35.23 39.01 34.44 18.9 14.426 Uttar Pradesh 57.07 49.05 47.07 41.46 40.85 31.15 32.8 25.527 Uttarkhand 39.6 31.828 West Bengal 63.43 60.52 54.85 44.72 35.66 27.02 24.7 20.629 A & N Islands 55.56 55.42 52.13 43.89 34.47 20.99 22.6 17.630 Chandigarh 27.96 27.32 23.79 14.67 11.35 5.75 7.1 3.831 Dadra & Nagar Haveli 46.55 37.20 15.67 67.11 50.84 17.14 33.2 30.632 Daman & Diu 15.80 4.44 10.5 8.0
33 Delhi 49.61 33.23 26.22 12.41 14.69 8.23 14.7 10.2
34 Lakshadweep 59.68 52.79 42.36 34.95 25.04 15.60 16.0 12.3
35 Puducherry 53.82 53.25 50.06 41.46 37.40 21.67 22.4 18.2
All India 54.88 51.32 44.48 38.86 35.97 26.10 27.5 21.8
1987-88 1993-941973-74 1977-78 1983
* URP - Uniform Reference Period; MRP - Mixed Reference Period [Source: Planning Commission & NSSO Data, 61st Round]
Percentage of Population Below Poverty Line by States & UTs : 1973-74 to 2004-05 [ Combined (Rural + Urban) ]
(in % of persons)
Databook for DCH; 5th December 2012 Page 57 of 266
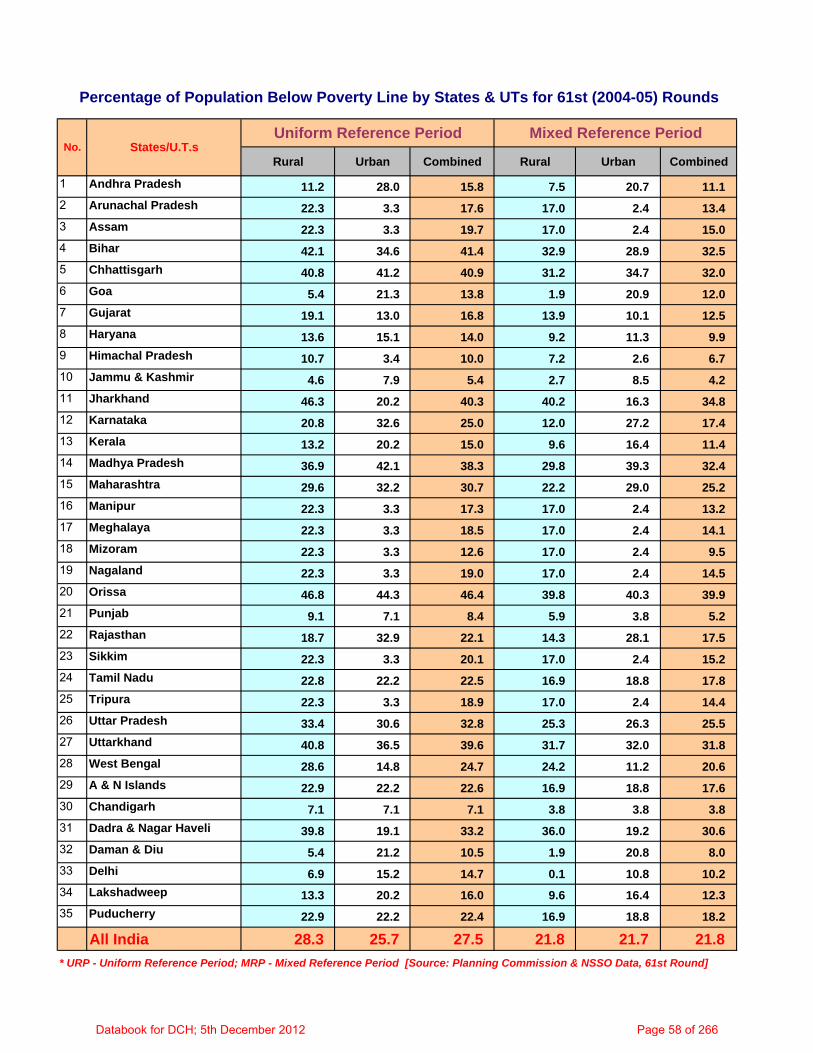
Rural Urban Combined Rural Urban Combined
1 Andhra Pradesh 11.2 28.0 15.8 7.5 20.7 11.12 Arunachal Pradesh 22.3 3.3 17.6 17.0 2.4 13.43 Assam 22.3 3.3 19.7 17.0 2.4 15.04 Bihar 42.1 34.6 41.4 32.9 28.9 32.55 Chhattisgarh 40.8 41.2 40.9 31.2 34.7 32.06 Goa 5.4 21.3 13.8 1.9 20.9 12.07 Gujarat 19.1 13.0 16.8 13.9 10.1 12.58 Haryana 13.6 15.1 14.0 9.2 11.3 9.99 Himachal Pradesh 10.7 3.4 10.0 7.2 2.6 6.710 Jammu & Kashmir 4.6 7.9 5.4 2.7 8.5 4.211 Jharkhand 46.3 20.2 40.3 40.2 16.3 34.812 Karnataka 20.8 32.6 25.0 12.0 27.2 17.413 Kerala 13.2 20.2 15.0 9.6 16.4 11.414 Madhya Pradesh 36.9 42.1 38.3 29.8 39.3 32.415 Maharashtra 29.6 32.2 30.7 22.2 29.0 25.216 Manipur 22.3 3.3 17.3 17.0 2.4 13.217 Meghalaya 22.3 3.3 18.5 17.0 2.4 14.118 Mizoram 22.3 3.3 12.6 17.0 2.4 9.519 Nagaland 22.3 3.3 19.0 17.0 2.4 14.520 Orissa 46.8 44.3 46.4 39.8 40.3 39.921 Punjab 9.1 7.1 8.4 5.9 3.8 5.222 Rajasthan 18.7 32.9 22.1 14.3 28.1 17.523 Sikkim 22.3 3.3 20.1 17.0 2.4 15.224 Tamil Nadu 22.8 22.2 22.5 16.9 18.8 17.825 Tripura 22.3 3.3 18.9 17.0 2.4 14.426 Uttar Pradesh 33.4 30.6 32.8 25.3 26.3 25.527 Uttarkhand 40.8 36.5 39.6 31.7 32.0 31.828 West Bengal 28.6 14.8 24.7 24.2 11.2 20.629 A & N Islands 22.9 22.2 22.6 16.9 18.8 17.630 Chandigarh 7.1 7.1 7.1 3.8 3.8 3.831 Dadra & Nagar Haveli 39.8 19.1 33.2 36.0 19.2 30.632 Daman & Diu 5.4 21.2 10.5 1.9 20.8 8.033 Delhi 6.9 15.2 14.7 0.1 10.8 10.234 Lakshadweep 13.3 20.2 16.0 9.6 16.4 12.335 Puducherry 22.9 22.2 22.4 16.9 18.8 18.2
All India 28.3 25.7 27.5 21.8 21.7 21.8
Percentage of Population Below Poverty Line by States & UTs for 61st (2004-05) Rounds
* URP - Uniform Reference Period; MRP - Mixed Reference Period [Source: Planning Commission & NSSO Data, 61st Round]
No. States/U.T.sUniform Reference Period Mixed Reference Period
Databook for DCH; 5th December 2012 Page 58 of 266
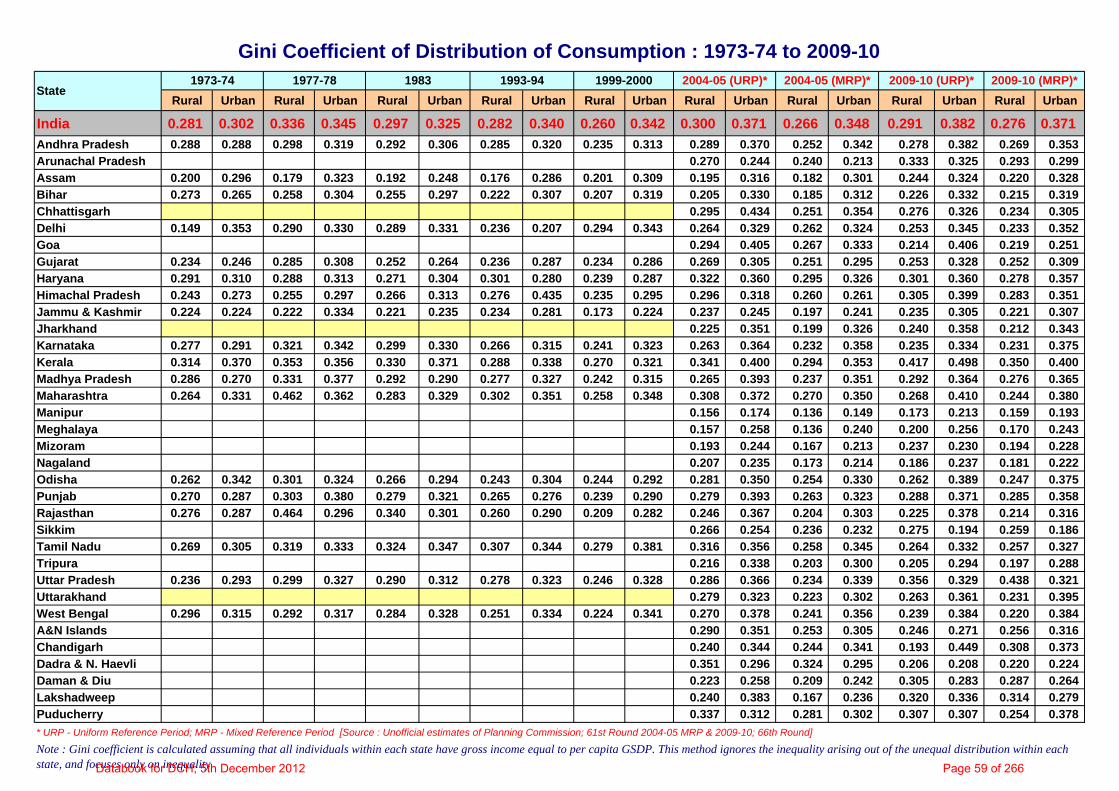
Gini Coefficient of Distribution of Consumption : 1973-74 to 2009-10
State1973-74 1977-78 1983 1993-94 1999-2000 2004-05 (URP)* 2004-05 (MRP)* 2009-10 (URP)* 2009-10 (MRP)*
Rural Urban Rural Urban Rural Urban Rural Urban Rural Urban Rural Urban Rural Urban Rural Urban Rural Urban
India 0.281 0.302 0.336 0.345 0.297 0.325 0.282 0.340 0.260 0.342 0.300 0.371 0.266 0.348 0.291 0.382 0.276 0.371
Andhra Pradesh 0.288 0.288 0.298 0.319 0.292 0.306 0.285 0.320 0.235 0.313 0.289 0.370 0.252 0.342 0.278 0.382 0.269 0.353
Arunachal Pradesh 0.270 0.244 0.240 0.213 0.333 0.325 0.293 0.299
Assam 0.200 0.296 0.179 0.323 0.192 0.248 0.176 0.286 0.201 0.309 0.195 0.316 0.182 0.301 0.244 0.324 0.220 0.328
Bihar 0.273 0.265 0.258 0.304 0.255 0.297 0.222 0.307 0.207 0.319 0.205 0.330 0.185 0.312 0.226 0.332 0.215 0.319
Chhattisgarh 0.295 0.434 0.251 0.354 0.276 0.326 0.234 0.305
Delhi 0.149 0.353 0.290 0.330 0.289 0.331 0.236 0.207 0.294 0.343 0.264 0.329 0.262 0.324 0.253 0.345 0.233 0.352
Goa 0.294 0.405 0.267 0.333 0.214 0.406 0.219 0.251
Gujarat 0.234 0.246 0.285 0.308 0.252 0.264 0.236 0.287 0.234 0.286 0.269 0.305 0.251 0.295 0.253 0.328 0.252 0.309
Haryana 0.291 0.310 0.288 0.313 0.271 0.304 0.301 0.280 0.239 0.287 0.322 0.360 0.295 0.326 0.301 0.360 0.278 0.357
Himachal Pradesh 0.243 0.273 0.255 0.297 0.266 0.313 0.276 0.435 0.235 0.295 0.296 0.318 0.260 0.261 0.305 0.399 0.283 0.351
Jammu & Kashmir 0.224 0.224 0.222 0.334 0.221 0.235 0.234 0.281 0.173 0.224 0.237 0.245 0.197 0.241 0.235 0.305 0.221 0.307
Jharkhand 0.225 0.351 0.199 0.326 0.240 0.358 0.212 0.343
Karnataka 0.277 0.291 0.321 0.342 0.299 0.330 0.266 0.315 0.241 0.323 0.263 0.364 0.232 0.358 0.235 0.334 0.231 0.375
Kerala 0.314 0.370 0.353 0.356 0.330 0.371 0.288 0.338 0.270 0.321 0.341 0.400 0.294 0.353 0.417 0.498 0.350 0.400
Madhya Pradesh 0.286 0.270 0.331 0.377 0.292 0.290 0.277 0.327 0.242 0.315 0.265 0.393 0.237 0.351 0.292 0.364 0.276 0.365
Maharashtra 0.264 0.331 0.462 0.362 0.283 0.329 0.302 0.351 0.258 0.348 0.308 0.372 0.270 0.350 0.268 0.410 0.244 0.380
Manipur 0.156 0.174 0.136 0.149 0.173 0.213 0.159 0.193
Meghalaya 0.157 0.258 0.136 0.240 0.200 0.256 0.170 0.243
Mizoram 0.193 0.244 0.167 0.213 0.237 0.230 0.194 0.228
Nagaland 0.207 0.235 0.173 0.214 0.186 0.237 0.181 0.222
Odisha 0.262 0.342 0.301 0.324 0.266 0.294 0.243 0.304 0.244 0.292 0.281 0.350 0.254 0.330 0.262 0.389 0.247 0.375
Punjab 0.270 0.287 0.303 0.380 0.279 0.321 0.265 0.276 0.239 0.290 0.279 0.393 0.263 0.323 0.288 0.371 0.285 0.358
Rajasthan 0.276 0.287 0.464 0.296 0.340 0.301 0.260 0.290 0.209 0.282 0.246 0.367 0.204 0.303 0.225 0.378 0.214 0.316
Sikkim 0.266 0.254 0.236 0.232 0.275 0.194 0.259 0.186
Tamil Nadu 0.269 0.305 0.319 0.333 0.324 0.347 0.307 0.344 0.279 0.381 0.316 0.356 0.258 0.345 0.264 0.332 0.257 0.327
Tripura 0.216 0.338 0.203 0.300 0.205 0.294 0.197 0.288
Uttar Pradesh 0.236 0.293 0.299 0.327 0.290 0.312 0.278 0.323 0.246 0.328 0.286 0.366 0.234 0.339 0.356 0.329 0.438 0.321
Uttarakhand 0.279 0.323 0.223 0.302 0.263 0.361 0.231 0.395
West Bengal 0.296 0.315 0.292 0.317 0.284 0.328 0.251 0.334 0.224 0.341 0.270 0.378 0.241 0.356 0.239 0.384 0.220 0.384
A&N Islands 0.290 0.351 0.253 0.305 0.246 0.271 0.256 0.316
Chandigarh 0.240 0.344 0.244 0.341 0.193 0.449 0.308 0.373
Dadra & N. Haevli 0.351 0.296 0.324 0.295 0.206 0.208 0.220 0.224
Daman & Diu 0.223 0.258 0.209 0.242 0.305 0.283 0.287 0.264
Lakshadweep 0.240 0.383 0.167 0.236 0.320 0.336 0.314 0.279
Puducherry 0.337 0.312 0.281 0.302 0.307 0.307 0.254 0.378
* URP - Uniform Reference Period; MRP - Mixed Reference Period [Source : Unofficial estimates of Planning Commission; 61st Round 2004-05 MRP & 2009-10; 66th Round]
Note : Gini coefficient is calculated assuming that all individuals within each state have gross income equal to per capita GSDP. This method ignores the inequality arising out of the unequal distribution within each state, and focuses only on inequality Databook for DCH; 5th December 2012 Page 59 of 266
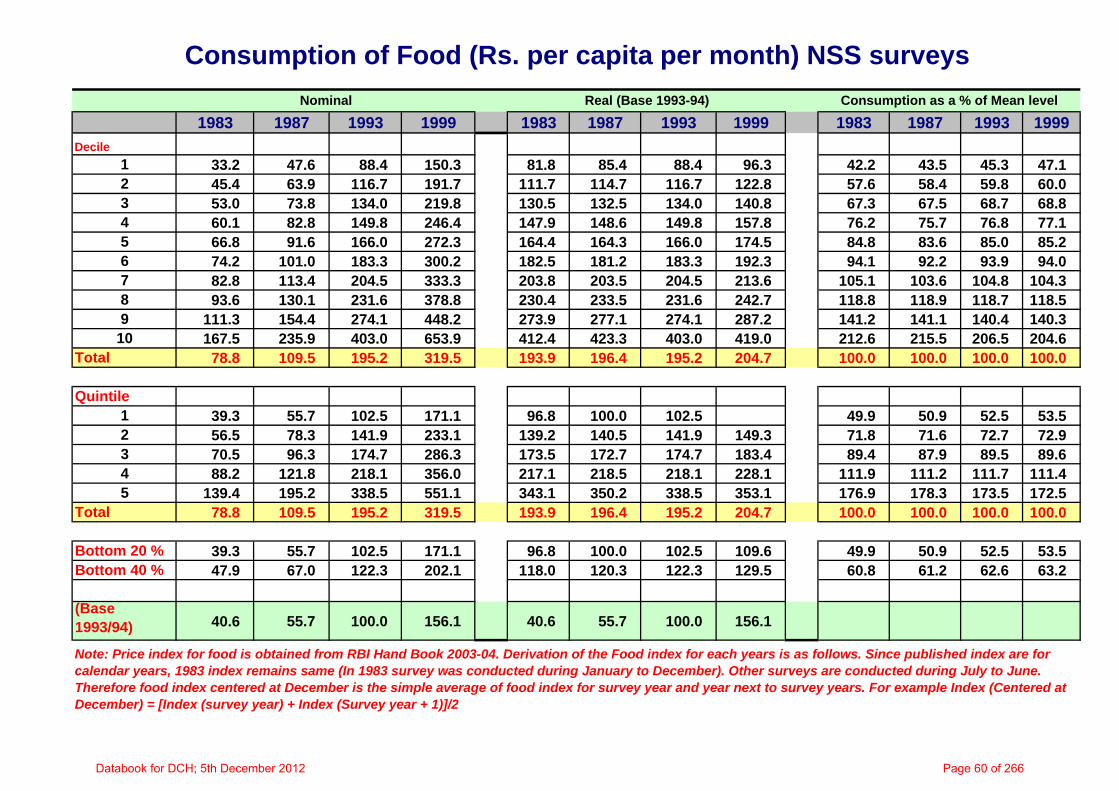
Consumption of Food (Rs. per capita per month) NSS surveys
Nominal Real (Base 1993-94) Consumption as a % of Mean level
1983 1987 1993 1999 1983 1987 1993 1999 1983 1987 1993 1999
Decile
1 33.2 47.6 88.4 150.3 81.8 85.4 88.4 96.3 42.2 43.5 45.3 47.1
2 45.4 63.9 116.7 191.7 111.7 114.7 116.7 122.8 57.6 58.4 59.8 60.0
3 53.0 73.8 134.0 219.8 130.5 132.5 134.0 140.8 67.3 67.5 68.7 68.8
4 60.1 82.8 149.8 246.4 147.9 148.6 149.8 157.8 76.2 75.7 76.8 77.1
5 66.8 91.6 166.0 272.3 164.4 164.3 166.0 174.5 84.8 83.6 85.0 85.2
6 74.2 101.0 183.3 300.2 182.5 181.2 183.3 192.3 94.1 92.2 93.9 94.0
7 82.8 113.4 204.5 333.3 203.8 203.5 204.5 213.6 105.1 103.6 104.8 104.3
8 93.6 130.1 231.6 378.8 230.4 233.5 231.6 242.7 118.8 118.9 118.7 118.5
9 111.3 154.4 274.1 448.2 273.9 277.1 274.1 287.2 141.2 141.1 140.4 140.3
10 167.5 235.9 403.0 653.9 412.4 423.3 403.0 419.0 212.6 215.5 206.5 204.6
Total 78.8 109.5 195.2 319.5 193.9 196.4 195.2 204.7 100.0 100.0 100.0 100.0
Quintile
1 39.3 55.7 102.5 171.1 96.8 100.0 102.5 49.9 50.9 52.5 53.5
2 56.5 78.3 141.9 233.1 139.2 140.5 141.9 149.3 71.8 71.6 72.7 72.9
3 70.5 96.3 174.7 286.3 173.5 172.7 174.7 183.4 89.4 87.9 89.5 89.6
4 88.2 121.8 218.1 356.0 217.1 218.5 218.1 228.1 111.9 111.2 111.7 111.4
5 139.4 195.2 338.5 551.1 343.1 350.2 338.5 353.1 176.9 178.3 173.5 172.5
Total 78.8 109.5 195.2 319.5 193.9 196.4 195.2 204.7 100.0 100.0 100.0 100.0
Bottom 20 % 39.3 55.7 102.5 171.1 96.8 100.0 102.5 109.6 49.9 50.9 52.5 53.5
Bottom 40 % 47.9 67.0 122.3 202.1 118.0 120.3 122.3 129.5 60.8 61.2 62.6 63.2
(Base
1993/94) 40.6 55.7 100.0 156.1 40.6 55.7 100.0 156.1
Note: Price index for food is obtained from RBI Hand Book 2003-04. Derivation of the Food index for each years is as follows. Since published index are for calendar years, 1983 index remains same (In 1983 survey was conducted during January to December). Other surveys are conducted during July to June. Therefore food index centered at December is the simple average of food index for survey year and year next to survey years. For example Index (Centered at December) = [Index (survey year) + Index (Survey year + 1)]/2
Databook for DCH; 5th December 2012 Page 60 of 266
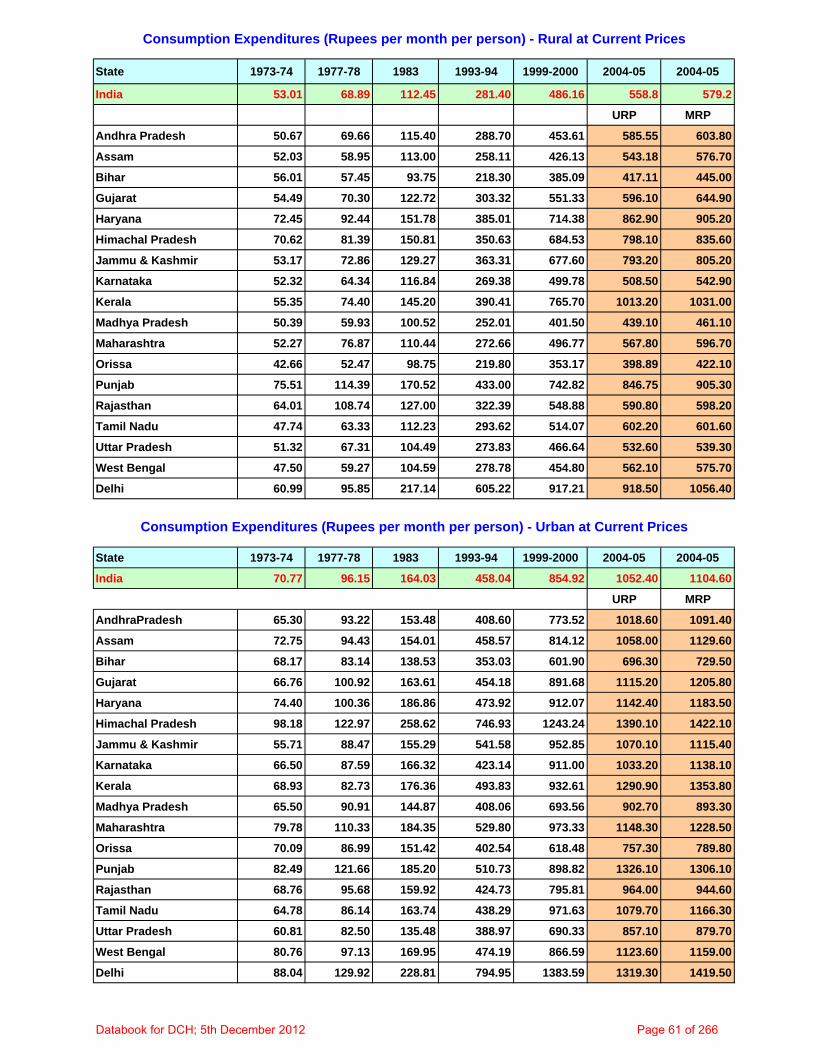
State 1973-74 1977-78 1983 1993-94 1999-2000 2004-05 2004-05
India 53.01 68.89 112.45 281.40 486.16 558.8 579.2
URP MRP
Andhra Pradesh 50.67 69.66 115.40 288.70 453.61 585.55 603.80
Assam 52.03 58.95 113.00 258.11 426.13 543.18 576.70
Bihar 56.01 57.45 93.75 218.30 385.09 417.11 445.00
Gujarat 54.49 70.30 122.72 303.32 551.33 596.10 644.90
Haryana 72.45 92.44 151.78 385.01 714.38 862.90 905.20
Himachal Pradesh 70.62 81.39 150.81 350.63 684.53 798.10 835.60
Jammu & Kashmir 53.17 72.86 129.27 363.31 677.60 793.20 805.20
Karnataka 52.32 64.34 116.84 269.38 499.78 508.50 542.90
Kerala 55.35 74.40 145.20 390.41 765.70 1013.20 1031.00
Madhya Pradesh 50.39 59.93 100.52 252.01 401.50 439.10 461.10
Maharashtra 52.27 76.87 110.44 272.66 496.77 567.80 596.70
Orissa 42.66 52.47 98.75 219.80 353.17 398.89 422.10
Punjab 75.51 114.39 170.52 433.00 742.82 846.75 905.30
Rajasthan 64.01 108.74 127.00 322.39 548.88 590.80 598.20
Tamil Nadu 47.74 63.33 112.23 293.62 514.07 602.20 601.60
Uttar Pradesh 51.32 67.31 104.49 273.83 466.64 532.60 539.30
West Bengal 47.50 59.27 104.59 278.78 454.80 562.10 575.70
Delhi 60.99 95.85 217.14 605.22 917.21 918.50 1056.40
State 1973-74 1977-78 1983 1993-94 1999-2000 2004-05 2004-05
India 70.77 96.15 164.03 458.04 854.92 1052.40 1104.60
URP MRP
AndhraPradesh 65.30 93.22 153.48 408.60 773.52 1018.60 1091.40
Assam 72.75 94.43 154.01 458.57 814.12 1058.00 1129.60
Bihar 68.17 83.14 138.53 353.03 601.90 696.30 729.50
Gujarat 66.76 100.92 163.61 454.18 891.68 1115.20 1205.80
Haryana 74.40 100.36 186.86 473.92 912.07 1142.40 1183.50
Himachal Pradesh 98.18 122.97 258.62 746.93 1243.24 1390.10 1422.10
Jammu & Kashmir 55.71 88.47 155.29 541.58 952.85 1070.10 1115.40
Karnataka 66.50 87.59 166.32 423.14 911.00 1033.20 1138.10
Kerala 68.93 82.73 176.36 493.83 932.61 1290.90 1353.80
Madhya Pradesh 65.50 90.91 144.87 408.06 693.56 902.70 893.30
Maharashtra 79.78 110.33 184.35 529.80 973.33 1148.30 1228.50
Orissa 70.09 86.99 151.42 402.54 618.48 757.30 789.80
Punjab 82.49 121.66 185.20 510.73 898.82 1326.10 1306.10
Rajasthan 68.76 95.68 159.92 424.73 795.81 964.00 944.60
Tamil Nadu 64.78 86.14 163.74 438.29 971.63 1079.70 1166.30
Uttar Pradesh 60.81 82.50 135.48 388.97 690.33 857.10 879.70
West Bengal 80.76 97.13 169.95 474.19 866.59 1123.60 1159.00
Delhi 88.04 129.92 228.81 794.95 1383.59 1319.30 1419.50
Consumption Expenditures (Rupees per month per person) - Rural at Current Prices
Consumption Expenditures (Rupees per month per person) - Urban at Current Prices
Databook for DCH; 5th December 2012 Page 61 of 266
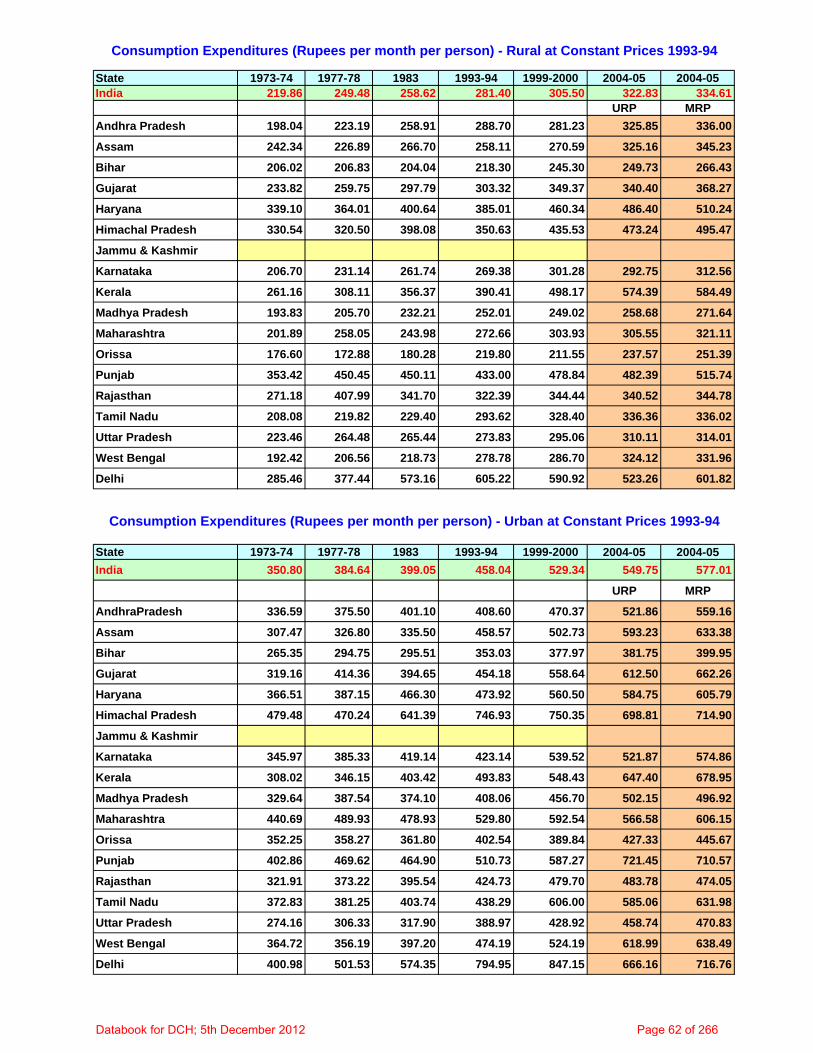
State 1973-74 1977-78 1983 1993-94 1999-2000 2004-05 2004-05India 219.86 249.48 258.62 281.40 305.50 322.83 334.61
URP MRPAndhra Pradesh 198.04 223.19 258.91 288.70 281.23 325.85 336.00
Assam 242.34 226.89 266.70 258.11 270.59 325.16 345.23
Bihar 206.02 206.83 204.04 218.30 245.30 249.73 266.43
Gujarat 233.82 259.75 297.79 303.32 349.37 340.40 368.27
Haryana 339.10 364.01 400.64 385.01 460.34 486.40 510.24
Himachal Pradesh 330.54 320.50 398.08 350.63 435.53 473.24 495.47
Jammu & Kashmir
Karnataka 206.70 231.14 261.74 269.38 301.28 292.75 312.56
Kerala 261.16 308.11 356.37 390.41 498.17 574.39 584.49
Madhya Pradesh 193.83 205.70 232.21 252.01 249.02 258.68 271.64
Maharashtra 201.89 258.05 243.98 272.66 303.93 305.55 321.11
Orissa 176.60 172.88 180.28 219.80 211.55 237.57 251.39
Punjab 353.42 450.45 450.11 433.00 478.84 482.39 515.74
Rajasthan 271.18 407.99 341.70 322.39 344.44 340.52 344.78
Tamil Nadu 208.08 219.82 229.40 293.62 328.40 336.36 336.02
Uttar Pradesh 223.46 264.48 265.44 273.83 295.06 310.11 314.01
West Bengal 192.42 206.56 218.73 278.78 286.70 324.12 331.96
Delhi 285.46 377.44 573.16 605.22 590.92 523.26 601.82
State 1973-74 1977-78 1983 1993-94 1999-2000 2004-05 2004-05India 350.80 384.64 399.05 458.04 529.34 549.75 577.01
URP MRP
AndhraPradesh 336.59 375.50 401.10 408.60 470.37 521.86 559.16
Assam 307.47 326.80 335.50 458.57 502.73 593.23 633.38
Bihar 265.35 294.75 295.51 353.03 377.97 381.75 399.95
Gujarat 319.16 414.36 394.65 454.18 558.64 612.50 662.26
Haryana 366.51 387.15 466.30 473.92 560.50 584.75 605.79
Himachal Pradesh 479.48 470.24 641.39 746.93 750.35 698.81 714.90
Jammu & Kashmir
Karnataka 345.97 385.33 419.14 423.14 539.52 521.87 574.86
Kerala 308.02 346.15 403.42 493.83 548.43 647.40 678.95
Madhya Pradesh 329.64 387.54 374.10 408.06 456.70 502.15 496.92
Maharashtra 440.69 489.93 478.93 529.80 592.54 566.58 606.15
Orissa 352.25 358.27 361.80 402.54 389.84 427.33 445.67
Punjab 402.86 469.62 464.90 510.73 587.27 721.45 710.57
Rajasthan 321.91 373.22 395.54 424.73 479.70 483.78 474.05
Tamil Nadu 372.83 381.25 403.74 438.29 606.00 585.06 631.98
Uttar Pradesh 274.16 306.33 317.90 388.97 428.92 458.74 470.83
West Bengal 364.72 356.19 397.20 474.19 524.19 618.99 638.49
Delhi 400.98 501.53 574.35 794.95 847.15 666.16 716.76
Consumption Expenditures (Rupees per month per person) - Rural at Constant Prices 1993-94
Consumption Expenditures (Rupees per month per person) - Urban at Constant Prices 1993-94
Databook for DCH; 5th December 2012 Page 62 of 266
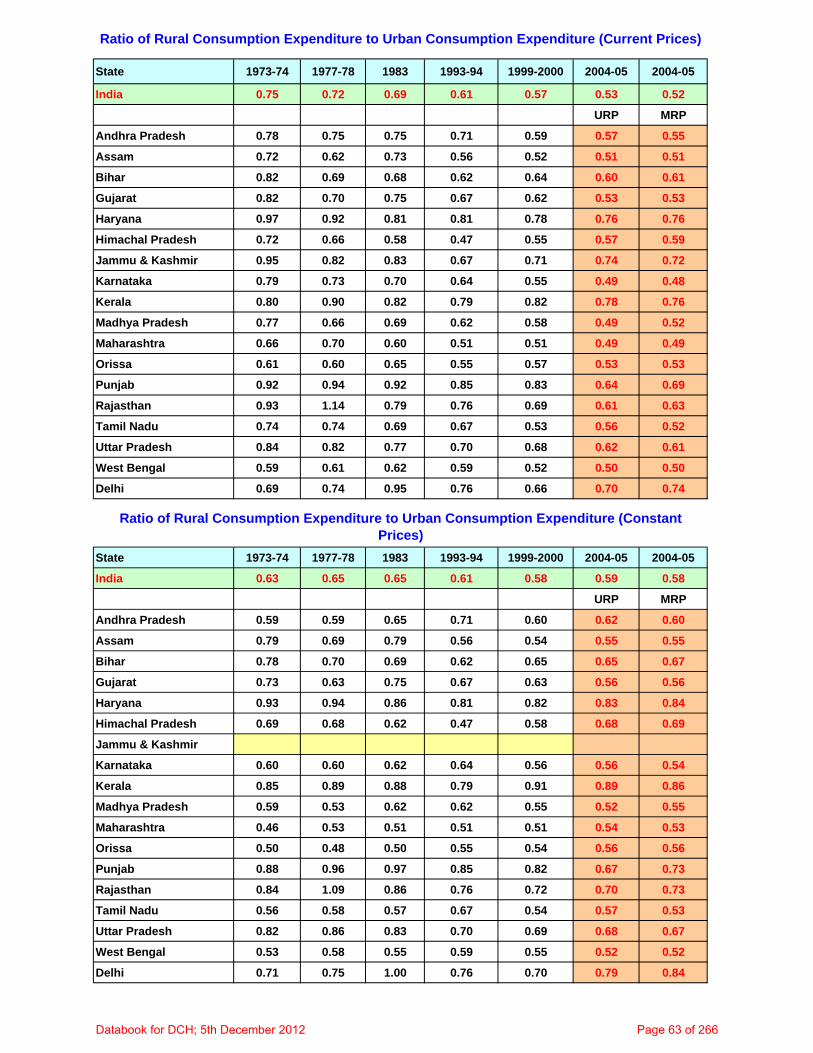
State 1973-74 1977-78 1983 1993-94 1999-2000 2004-05 2004-05
India 0.75 0.72 0.69 0.61 0.57 0.53 0.52
URP MRP
Andhra Pradesh 0.78 0.75 0.75 0.71 0.59 0.57 0.55
Assam 0.72 0.62 0.73 0.56 0.52 0.51 0.51
Bihar 0.82 0.69 0.68 0.62 0.64 0.60 0.61
Gujarat 0.82 0.70 0.75 0.67 0.62 0.53 0.53
Haryana 0.97 0.92 0.81 0.81 0.78 0.76 0.76
Himachal Pradesh 0.72 0.66 0.58 0.47 0.55 0.57 0.59
Jammu & Kashmir 0.95 0.82 0.83 0.67 0.71 0.74 0.72
Karnataka 0.79 0.73 0.70 0.64 0.55 0.49 0.48
Kerala 0.80 0.90 0.82 0.79 0.82 0.78 0.76
Madhya Pradesh 0.77 0.66 0.69 0.62 0.58 0.49 0.52
Maharashtra 0.66 0.70 0.60 0.51 0.51 0.49 0.49
Orissa 0.61 0.60 0.65 0.55 0.57 0.53 0.53
Punjab 0.92 0.94 0.92 0.85 0.83 0.64 0.69
Rajasthan 0.93 1.14 0.79 0.76 0.69 0.61 0.63
Tamil Nadu 0.74 0.74 0.69 0.67 0.53 0.56 0.52
Uttar Pradesh 0.84 0.82 0.77 0.70 0.68 0.62 0.61
West Bengal 0.59 0.61 0.62 0.59 0.52 0.50 0.50
Delhi 0.69 0.74 0.95 0.76 0.66 0.70 0.74
State 1973-74 1977-78 1983 1993-94 1999-2000 2004-05 2004-05
India 0.63 0.65 0.65 0.61 0.58 0.59 0.58
URP MRP
Andhra Pradesh 0.59 0.59 0.65 0.71 0.60 0.62 0.60
Assam 0.79 0.69 0.79 0.56 0.54 0.55 0.55
Bihar 0.78 0.70 0.69 0.62 0.65 0.65 0.67
Gujarat 0.73 0.63 0.75 0.67 0.63 0.56 0.56
Haryana 0.93 0.94 0.86 0.81 0.82 0.83 0.84
Himachal Pradesh 0.69 0.68 0.62 0.47 0.58 0.68 0.69
Jammu & Kashmir
Karnataka 0.60 0.60 0.62 0.64 0.56 0.56 0.54
Kerala 0.85 0.89 0.88 0.79 0.91 0.89 0.86
Madhya Pradesh 0.59 0.53 0.62 0.62 0.55 0.52 0.55
Maharashtra 0.46 0.53 0.51 0.51 0.51 0.54 0.53
Orissa 0.50 0.48 0.50 0.55 0.54 0.56 0.56
Punjab 0.88 0.96 0.97 0.85 0.82 0.67 0.73
Rajasthan 0.84 1.09 0.86 0.76 0.72 0.70 0.73
Tamil Nadu 0.56 0.58 0.57 0.67 0.54 0.57 0.53
Uttar Pradesh 0.82 0.86 0.83 0.70 0.69 0.68 0.67
West Bengal 0.53 0.58 0.55 0.59 0.55 0.52 0.52
Delhi 0.71 0.75 1.00 0.76 0.70 0.79 0.84
Ratio of Rural Consumption Expenditure to Urban Consumption Expenditure (Current Prices)
Ratio of Rural Consumption Expenditure to Urban Consumption Expenditure (Constant Prices)
Databook for DCH; 5th December 2012 Page 63 of 266
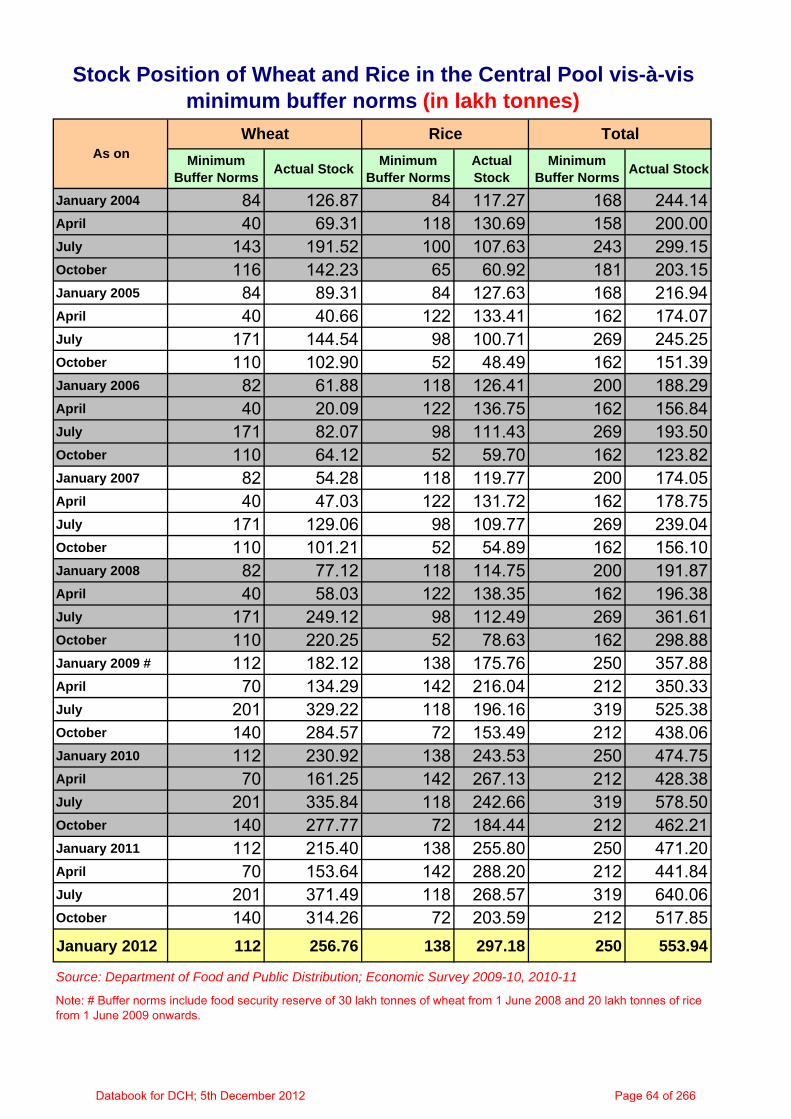
Stock Position of Wheat and Rice in the Central Pool vis-à-vis
minimum buffer norms (in lakh tonnes)
As on
Wheat Rice Total
Minimum
Buffer NormsActual Stock
Minimum
Buffer Norms
Actual
Stock
Minimum
Buffer NormsActual Stock
January 2004 84 126.87 84 117.27 168 244.14April 40 69.31 118 130.69 158 200.00July 143 191.52 100 107.63 243 299.15October 116 142.23 65 60.92 181 203.15January 2005 84 89.31 84 127.63 168 216.94April 40 40.66 122 133.41 162 174.07July 171 144.54 98 100.71 269 245.25October 110 102.90 52 48.49 162 151.39January 2006 82 61.88 118 126.41 200 188.29April 40 20.09 122 136.75 162 156.84July 171 82.07 98 111.43 269 193.50October 110 64.12 52 59.70 162 123.82January 2007 82 54.28 118 119.77 200 174.05April 40 47.03 122 131.72 162 178.75July 171 129.06 98 109.77 269 239.04October 110 101.21 52 54.89 162 156.10January 2008 82 77.12 118 114.75 200 191.87April 40 58.03 122 138.35 162 196.38July 171 249.12 98 112.49 269 361.61October 110 220.25 52 78.63 162 298.88January 2009 # 112 182.12 138 175.76 250 357.88April 70 134.29 142 216.04 212 350.33July 201 329.22 118 196.16 319 525.38October 140 284.57 72 153.49 212 438.06January 2010 112 230.92 138 243.53 250 474.75April 70 161.25 142 267.13 212 428.38July 201 335.84 118 242.66 319 578.50October 140 277.77 72 184.44 212 462.21January 2011 112 215.40 138 255.80 250 471.20April 70 153.64 142 288.20 212 441.84July 201 371.49 118 268.57 319 640.06October 140 314.26 72 203.59 212 517.85January 2012 112 256.76 138 297.18 250 553.94
Source: Department of Food and Public Distribution; Economic Survey 2009-10, 2010-11
Note: # Buffer norms include food security reserve of 30 lakh tonnes of wheat from 1 June 2008 and 20 lakh tonnes of rice from 1 June 2009 onwards.
Databook for DCH; 5th December 2012 Page 64 of 266
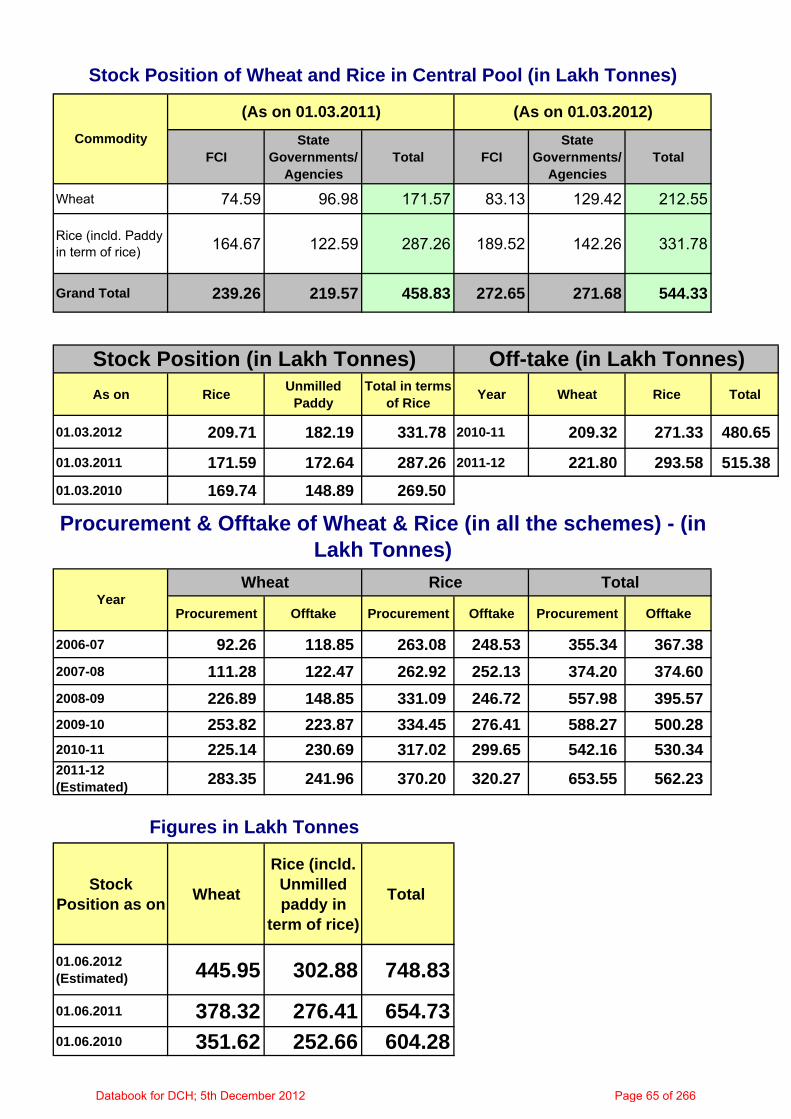
Stock Position of Wheat and Rice in Central Pool (in Lakh Tonnes)
Commodity
(As on 01.03.2011) (As on 01.03.2012)
FCI
State
Governments/
Agencies
Total FCI
State
Governments/
Agencies
Total
Wheat 74.59 96.98 171.57 83.13 129.42 212.55
Rice (incld. Paddy in term of rice) 164.67 122.59 287.26 189.52 142.26 331.78
Grand Total 239.26 219.57 458.83 272.65 271.68 544.33
Stock Position (in Lakh Tonnes) Off-take (in Lakh Tonnes)
As on RiceUnmilled
Paddy
Total in terms
of RiceYear Wheat Rice Total
01.03.2012 209.71 182.19 331.78 2010-11 209.32 271.33 480.65
01.03.2011 171.59 172.64 287.26 2011-12 221.80 293.58 515.38
01.03.2010 169.74 148.89 269.50
Procurement & Offtake of Wheat & Rice (in all the schemes) - (in
Lakh Tonnes)
Year
Wheat Rice Total
Procurement Offtake Procurement Offtake Procurement Offtake
2006-07 92.26 118.85 263.08 248.53 355.34 367.38
2007-08 111.28 122.47 262.92 252.13 374.20 374.60
2008-09 226.89 148.85 331.09 246.72 557.98 395.57
2009-10 253.82 223.87 334.45 276.41 588.27 500.28
2010-11 225.14 230.69 317.02 299.65 542.16 530.34
2011-12
(Estimated)283.35 241.96 370.20 320.27 653.55 562.23
Figures in Lakh Tonnes
Stock
Position as onWheat
Rice (incld.
Unmilled
paddy in
term of rice)
Total
01.06.2012
(Estimated) 445.95 302.88 748.83
01.06.2011 378.32 276.41 654.73
01.06.2010 351.62 252.66 604.28
Databook for DCH; 5th December 2012 Page 65 of 266
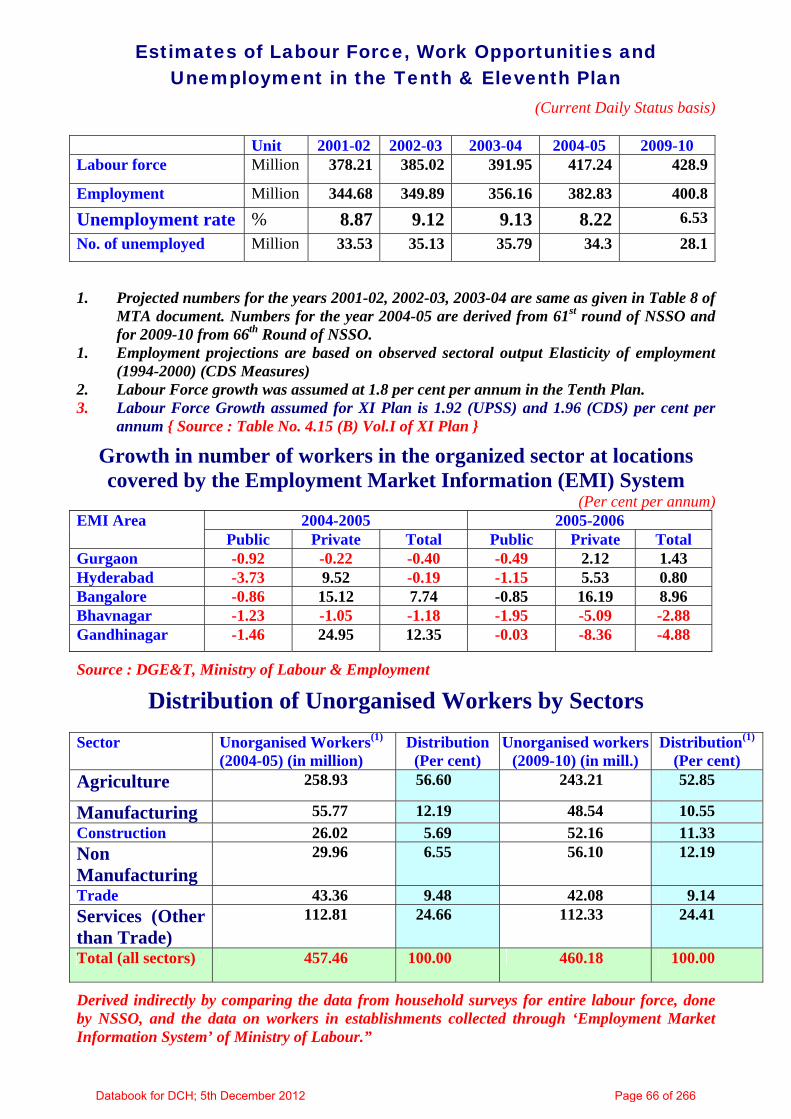
Estimates of Labour Force, Work Opportunities and Unemployment in the Tenth & Eleventh Plan
(Current Daily Status basis)
Unit 2001-02 2002-03 2003-04 2004-05 2009-10 Labour force Million 378.21 385.02 391.95 417.24 428.9
Employment Million 344.68 349.89 356.16 382.83 400.8
Unemployment rate % 8.87 9.12 9.13 8.22 6.53No. of unemployed Million 33.53 35.13 35.79 34.3 28.1
1. Projected numbers for the years 2001-02, 2002-03, 2003-04 are same as given in Table 8 of
MTA document. Numbers for the year 2004-05 are derived from 61st round of NSSO and for 2009-10 from 66th Round of NSSO.
1. Employment projections are based on observed sectoral output Elasticity of employment (1994-2000) (CDS Measures)
2. Labour Force growth was assumed at 1.8 per cent per annum in the Tenth Plan. 3. Labour Force Growth assumed for XI Plan is 1.92 (UPSS) and 1.96 (CDS) per cent per
annum { Source : Table No. 4.15 (B) Vol.I of XI Plan }
Growth in number of workers in the organized sector at locations covered by the Employment Market Information (EMI) System
(Per cent per annum) 2004-2005 2005-2006 EMI Area
Public Private Total Public Private Total Gurgaon -0.92 -0.22 -0.40 -0.49 2.12 1.43 Hyderabad -3.73 9.52 -0.19 -1.15 5.53 0.80 Bangalore -0.86 15.12 7.74 -0.85 16.19 8.96 Bhavnagar -1.23 -1.05 -1.18 -1.95 -5.09 -2.88 Gandhinagar -1.46 24.95 12.35 -0.03 -8.36 -4.88
Source : DGE&T, Ministry of Labour & Employment
Distribution of Unorganised Workers by Sectors
Sector Unorganised Workers(1)
(2004-05) (in million) Distribution
(Per cent) Unorganised workers
(2009-10) (in mill.) Distribution(1)
(Per cent) Agriculture 258.93 56.60 243.21 52.85
Manufacturing 55.77 12.19 48.54 10.55 Construction 26.02 5.69 52.16 11.33 Non Manufacturing
29.96 6.55 56.10 12.19
Trade 43.36 9.48 42.08 9.14 Services (Other than Trade)
112.81 24.66 112.33 24.41
Total (all sectors) 457.46 100.00 460.18 100.00
Derived indirectly by comparing the data from household surveys for entire labour force, done by NSSO, and the data on workers in establishments collected through ‘Employment Market Information System’ of Ministry of Labour.”
Databook for DCH; 5th December 2012 Page 66 of 266
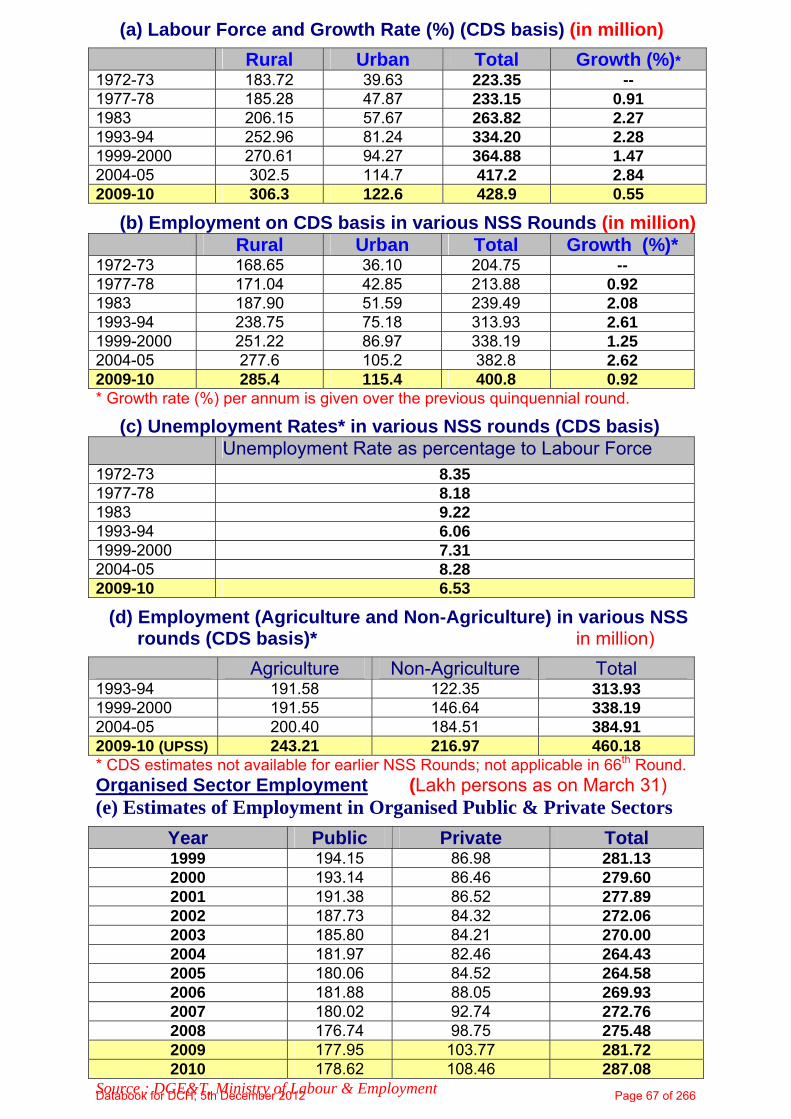
(a) Labour Force and Growth Rate (%) (CDS basis) (in million)
Rural Urban Total Growth (%)* 1972-73 183.72 39.63 223.35 --
1977-78 185.28 47.87 233.15 0.91
1983 206.15 57.67 263.82 2.27
1993-94 252.96 81.24 334.20 2.28
1999-2000 270.61 94.27 364.88 1.47
2004-05 302.5 114.7 417.2 2.84
2009-10 306.3 122.6 428.9 0.55
(b) Employment on CDS basis in various NSS Rounds (in million) Rural Urban Total Growth (%)*
1972-73 168.65 36.10 204.75 --
1977-78 171.04 42.85 213.88 0.92
1983 187.90 51.59 239.49 2.08
1993-94 238.75 75.18 313.93 2.61
1999-2000 251.22 86.97 338.19 1.25
2004-05 277.6 105.2 382.8 2.62
2009-10 285.4 115.4 400.8 0.92
* Growth rate (%) per annum is given over the previous quinquennial round.
(c) Unemployment Rates* in various NSS rounds (CDS basis) Unemployment Rate as percentage to Labour Force 1972-73 8.35
1977-78 8.18
1983 9.22
1993-94 6.06
1999-2000 7.31
2004-05 8.28
2009-10 6.53
(d) Employment (Agriculture and Non-Agriculture) in various NSS rounds (CDS basis)* in million)
Agriculture Non-Agriculture Total 1993-94 191.58 122.35 313.93
1999-2000 191.55 146.64 338.19
2004-05 200.40 184.51 384.91
2009-10 (UPSS) 243.21 216.97 460.18
* CDS estimates not available for earlier NSS Rounds; not applicable in 66th Round. Organised Sector Employment (Lakh persons as on March 31) (e) Estimates of Employment in Organised Public & Private Sectors
Year Public Private Total 1999 194.15 86.98 281.13
2000 193.14 86.46 279.60
2001 191.38 86.52 277.89
2002 187.73 84.32 272.06
2003 185.80 84.21 270.00
2004 181.97 82.46 264.43
2005 180.06 84.52 264.58
2006 181.88 88.05 269.93
2007 180.02 92.74 272.76
2008 176.74 98.75 275.48
2009 177.95 103.77 281.72
2010 178.62 108.46 287.08
Source : DGE&T, Ministry of Labour & Employment Databook for DCH; 5th December 2012 Page 67 of 266
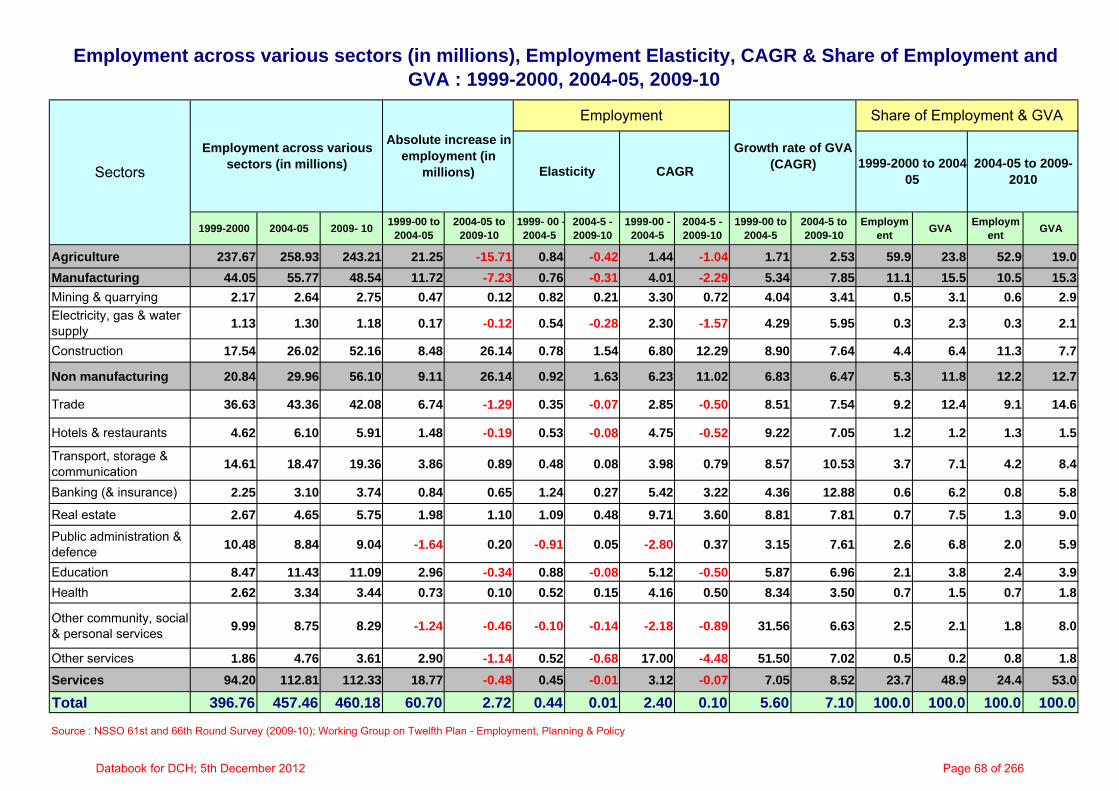
-
Employment across various sectors (in millions), Employment Elasticity, CAGR & Share of Employment and
GVA : 1999-2000, 2004-05, 2009-10
Sectors
Employment across various
sectors (in millions)
Absolute increase in
employment (in
millions)
Employment
Growth rate of GVA
(CAGR)
Share of Employment & GVA
Elasticity CAGR1999-2000 to 2004
05
- 2004-05 to 2009-
2010
1999-2000 2004-05 2009- 101999-00 to
2004-05
2004-05 to
2009-10
1999- 00
2004-5
2004-5 -
2009-10
1999-00 -
2004-5
2004-5 -
2009-10
1999-00 to
2004-5
2004-5 to
2009-10
Employm
entGVA
Employm
entGVA
Agriculture 237.67 258.93 243.21 21.25 -15.71 0.84 -0.42 1.44 -1.04 1.71 2.53 59.9 23.8 52.9 19.0
Manufacturing 44.05 55.77 48.54 11.72 -7.23 0.76 -0.31 4.01 -2.29 5.34 7.85 11.1 15.5 10.5 15.3
Mining & quarrying 2.17 2.64 2.75 0.47 0.12 0.82 0.21 3.30 0.72 4.04 3.41 0.5 3.1 0.6 2.9
Electricity, gas & water supply 1.13 1.30 1.18 0.17 -0.12 0.54 -0.28 2.30 -1.57 4.29 5.95 0.3 2.3 0.3 2.1
Construction 17.54 26.02 52.16 8.48 26.14 0.78 1.54 6.80 12.29 8.90 7.64 4.4 6.4 11.3 7.7
Non manufacturing 20.84 29.96 56.10 9.11 26.14 0.92 1.63 6.23 11.02 6.83 6.47 5.3 11.8 12.2 12.7
Trade 36.63 43.36 42.08 6.74 -1.29 0.35 -0.07 2.85 -0.50 8.51 7.54 9.2 12.4 9.1 14.6
Hotels & restaurants 4.62 6.10 5.91 1.48 -0.19 0.53 -0.08 4.75 -0.52 9.22 7.05 1.2 1.2 1.3 1.5
Transport, storage & communication 14.61 18.47 19.36 3.86 0.89 0.48 0.08 3.98 0.79 8.57 10.53 3.7 7.1 4.2 8.4
Banking (& insurance) 2.25 3.10 3.74 0.84 0.65 1.24 0.27 5.42 3.22 4.36 12.88 0.6 6.2 0.8 5.8
Real estate 2.67 4.65 5.75 1.98 1.10 1.09 0.48 9.71 3.60 8.81 7.81 0.7 7.5 1.3 9.0
Public administration & defence 10.48 8.84 9.04 -1.64 0.20 -0.91 0.05 -2.80 0.37 3.15 7.61 2.6 6.8 2.0 5.9
Education 8.47 11.43 11.09 2.96 -0.34 0.88 -0.08 5.12 -0.50 5.87 6.96 2.1 3.8 2.4 3.9
Health 2.62 3.34 3.44 0.73 0.10 0.52 0.15 4.16 0.50 8.34 3.50 0.7 1.5 0.7 1.8
Other community, social & personal services 9.99 8.75 8.29 -1.24 -0.46 -0.10 -0.14 -2.18 -0.89 31.56 6.63 2.5 2.1 1.8 8.0
Other services 1.86 4.76 3.61 2.90 -1.14 0.52 -0.68 17.00 -4.48 51.50 7.02 0.5 0.2 0.8 1.8
Services 94.20 112.81 112.33 18.77 -0.48 0.45 -0.01 3.12 -0.07 7.05 8.52 23.7 48.9 24.4 53.0
Total 396.76 457.46 460.18 60.70 2.72 0.44 0.01 2.40 0.10 5.60 7.10 100.0 100.0 100.0 100.0
Source : NSSO 61st and 66th Round Survey (2009-10); Working Group on Twelfth Plan - Employment, Planning & Policy
Databook for DCH; 5th December 2012 Page 68 of 266
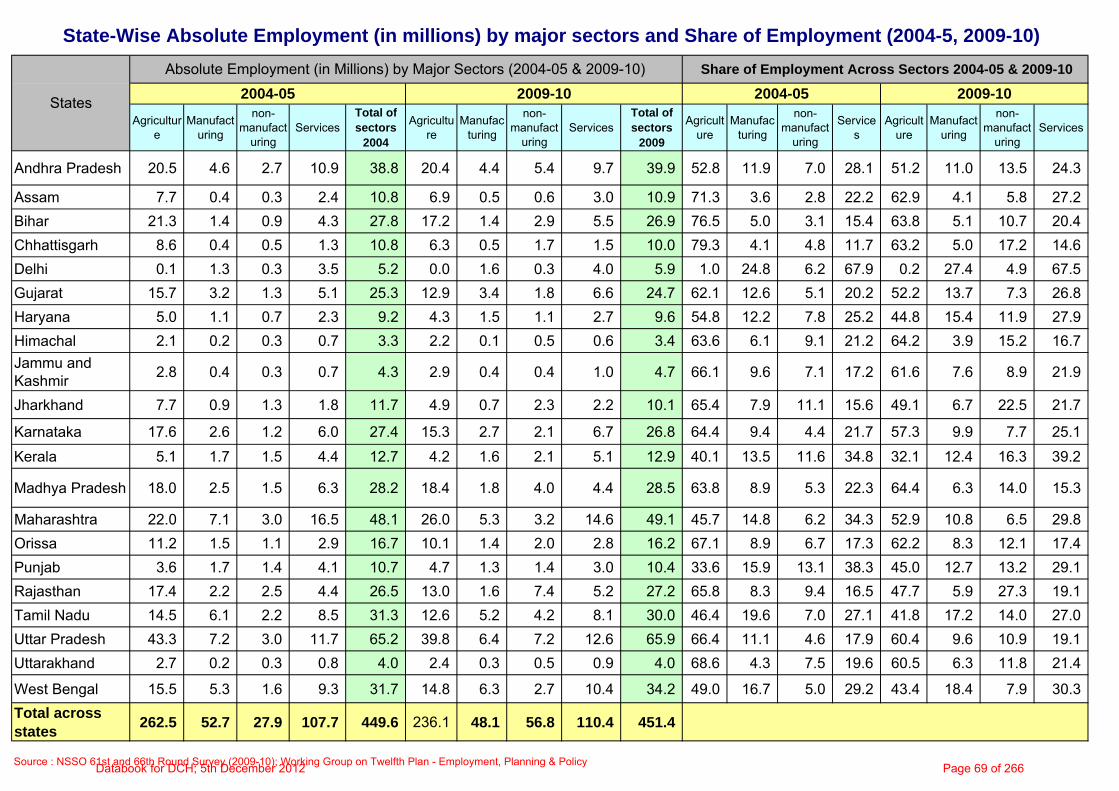
State-Wise Absolute Employment (in millions) by major sectors and Share of Employment (2004-5, 2009-10)
States
Absolute Employment (in Millions) by Major Sectors (2004-05 & 2009-10) Share of Employment Across Sectors 2004-05 & 2009-10
2004-05 2009-10 2004-05 2009-10
Agriculture
Manufacturing
non-manufact
uringServices
Total of
sectors
2004
Agriculture
Manufacturing
non-manufact
uringServices
Total of
sectors
2009
Agriculture
Manufacturing
non-manufact
uring
Services
Agriculture
Manufacturing
non-manufact
uringServices
Andhra Pradesh 20.5 4.6 2.7 10.9 38.8 20.4 4.4 5.4 9.7 39.9 52.8 11.9 7.0 28.1 51.2 11.0 13.5 24.3
Assam 7.7 0.4 0.3 2.4 10.8 6.9 0.5 0.6 3.0 10.9 71.3 3.6 2.8 22.2 62.9 4.1 5.8 27.2Bihar 21.3 1.4 0.9 4.3 27.8 17.2 1.4 2.9 5.5 26.9 76.5 5.0 3.1 15.4 63.8 5.1 10.7 20.4Chhattisgarh 8.6 0.4 0.5 1.3 10.8 6.3 0.5 1.7 1.5 10.0 79.3 4.1 4.8 11.7 63.2 5.0 17.2 14.6Delhi 0.1 1.3 0.3 3.5 5.2 0.0 1.6 0.3 4.0 5.9 1.0 24.8 6.2 67.9 0.2 27.4 4.9 67.5Gujarat 15.7 3.2 1.3 5.1 25.3 12.9 3.4 1.8 6.6 24.7 62.1 12.6 5.1 20.2 52.2 13.7 7.3 26.8Haryana 5.0 1.1 0.7 2.3 9.2 4.3 1.5 1.1 2.7 9.6 54.8 12.2 7.8 25.2 44.8 15.4 11.9 27.9Himachal 2.1 0.2 0.3 0.7 3.3 2.2 0.1 0.5 0.6 3.4 63.6 6.1 9.1 21.2 64.2 3.9 15.2 16.7Jammu and Kashmir 2.8 0.4 0.3 0.7 4.3 2.9 0.4 0.4 1.0 4.7 66.1 9.6 7.1 17.2 61.6 7.6 8.9 21.9
Jharkhand 7.7 0.9 1.3 1.8 11.7 4.9 0.7 2.3 2.2 10.1 65.4 7.9 11.1 15.6 49.1 6.7 22.5 21.7
Karnataka 17.6 2.6 1.2 6.0 27.4 15.3 2.7 2.1 6.7 26.8 64.4 9.4 4.4 21.7 57.3 9.9 7.7 25.1
Kerala 5.1 1.7 1.5 4.4 12.7 4.2 1.6 2.1 5.1 12.9 40.1 13.5 11.6 34.8 32.1 12.4 16.3 39.2
Madhya Pradesh 18.0 2.5 1.5 6.3 28.2 18.4 1.8 4.0 4.4 28.5 63.8 8.9 5.3 22.3 64.4 6.3 14.0 15.3
Maharashtra 22.0 7.1 3.0 16.5 48.1 26.0 5.3 3.2 14.6 49.1 45.7 14.8 6.2 34.3 52.9 10.8 6.5 29.8Orissa 11.2 1.5 1.1 2.9 16.7 10.1 1.4 2.0 2.8 16.2 67.1 8.9 6.7 17.3 62.2 8.3 12.1 17.4Punjab 3.6 1.7 1.4 4.1 10.7 4.7 1.3 1.4 3.0 10.4 33.6 15.9 13.1 38.3 45.0 12.7 13.2 29.1Rajasthan 17.4 2.2 2.5 4.4 26.5 13.0 1.6 7.4 5.2 27.2 65.8 8.3 9.4 16.5 47.7 5.9 27.3 19.1Tamil Nadu 14.5 6.1 2.2 8.5 31.3 12.6 5.2 4.2 8.1 30.0 46.4 19.6 7.0 27.1 41.8 17.2 14.0 27.0Uttar Pradesh 43.3 7.2 3.0 11.7 65.2 39.8 6.4 7.2 12.6 65.9 66.4 11.1 4.6 17.9 60.4 9.6 10.9 19.1Uttarakhand 2.7 0.2 0.3 0.8 4.0 2.4 0.3 0.5 0.9 4.0 68.6 4.3 7.5 19.6 60.5 6.3 11.8 21.4
West Bengal 15.5 5.3 1.6 9.3 31.7 14.8 6.3 2.7 10.4 34.2 49.0 16.7 5.0 29.2 43.4 18.4 7.9 30.3Total across
states262.5 52.7 27.9 107.7 449.6 236.1 48.1 56.8 110.4 451.4
Source : NSSO 61st and 66th Round Survey (2009-10); Working Group on Twelfth Plan - Employment, Planning & PolicyDatabook for DCH; 5th December 2012 Page 69 of 266
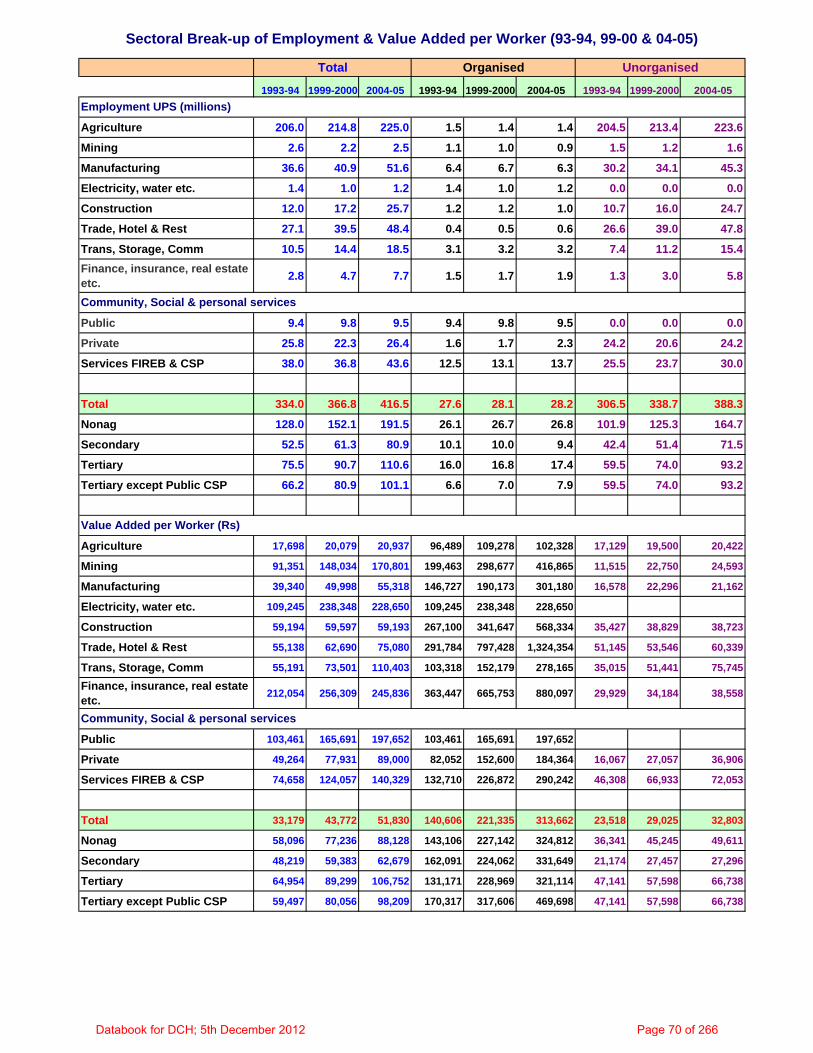
Sectoral Break-up of Employment & Value Added per Worker (93-94, 99-00 & 04-05)
Total Organised Unorganised
1993-94 1999-2000 2004-05 1993-94 1999-2000 2004-05 1993-94 1999-2000 2004-05Employment UPS (millions)
Agriculture 206.0 214.8 225.0 1.5 1.4 1.4 204.5 213.4 223.6
Mining 2.6 2.2 2.5 1.1 1.0 0.9 1.5 1.2 1.6
Manufacturing 36.6 40.9 51.6 6.4 6.7 6.3 30.2 34.1 45.3
Electricity, water etc. 1.4 1.0 1.2 1.4 1.0 1.2 0.0 0.0 0.0
Construction 12.0 17.2 25.7 1.2 1.2 1.0 10.7 16.0 24.7
Trade, Hotel & Rest 27.1 39.5 48.4 0.4 0.5 0.6 26.6 39.0 47.8
Trans, Storage, Comm 10.5 14.4 18.5 3.1 3.2 3.2 7.4 11.2 15.4Finance, insurance, real estate etc. 2.8 4.7 7.7 1.5 1.7 1.9 1.3 3.0 5.8
Community, Social & personal services
Public 9.4 9.8 9.5 9.4 9.8 9.5 0.0 0.0 0.0
Private 25.8 22.3 26.4 1.6 1.7 2.3 24.2 20.6 24.2
Services FIREB & CSP 38.0 36.8 43.6 12.5 13.1 13.7 25.5 23.7 30.0
Total 334.0 366.8 416.5 27.6 28.1 28.2 306.5 338.7 388.3
Nonag 128.0 152.1 191.5 26.1 26.7 26.8 101.9 125.3 164.7
Secondary 52.5 61.3 80.9 10.1 10.0 9.4 42.4 51.4 71.5
Tertiary 75.5 90.7 110.6 16.0 16.8 17.4 59.5 74.0 93.2
Tertiary except Public CSP 66.2 80.9 101.1 6.6 7.0 7.9 59.5 74.0 93.2
Value Added per Worker (Rs)
Agriculture 17,698 20,079 20,937 96,489 109,278 102,328 17,129 19,500 20,422
Mining 91,351 148,034 170,801 199,463 298,677 416,865 11,515 22,750 24,593
Manufacturing 39,340 49,998 55,318 146,727 190,173 301,180 16,578 22,296 21,162
Electricity, water etc. 109,245 238,348 228,650 109,245 238,348 228,650
Construction 59,194 59,597 59,193 267,100 341,647 568,334 35,427 38,829 38,723
Trade, Hotel & Rest 55,138 62,690 75,080 291,784 797,428 1,324,354 51,145 53,546 60,339
Trans, Storage, Comm 55,191 73,501 110,403 103,318 152,179 278,165 35,015 51,441 75,745
Finance, insurance, real estate etc. 212,054 256,309 245,836 363,447 665,753 880,097 29,929 34,184 38,558
Community, Social & personal services
Public 103,461 165,691 197,652 103,461 165,691 197,652
Private 49,264 77,931 89,000 82,052 152,600 184,364 16,067 27,057 36,906
Services FIREB & CSP 74,658 124,057 140,329 132,710 226,872 290,242 46,308 66,933 72,053
Total 33,179 43,772 51,830 140,606 221,335 313,662 23,518 29,025 32,803
Nonag 58,096 77,236 88,128 143,106 227,142 324,812 36,341 45,245 49,611
Secondary 48,219 59,383 62,679 162,091 224,062 331,649 21,174 27,457 27,296
Tertiary 64,954 89,299 106,752 131,171 228,969 321,114 47,141 57,598 66,738
Tertiary except Public CSP 59,497 80,056 98,209 170,317 317,606 469,698 47,141 57,598 66,738
Databook for DCH; 5th December 2012 Page 70 of 266
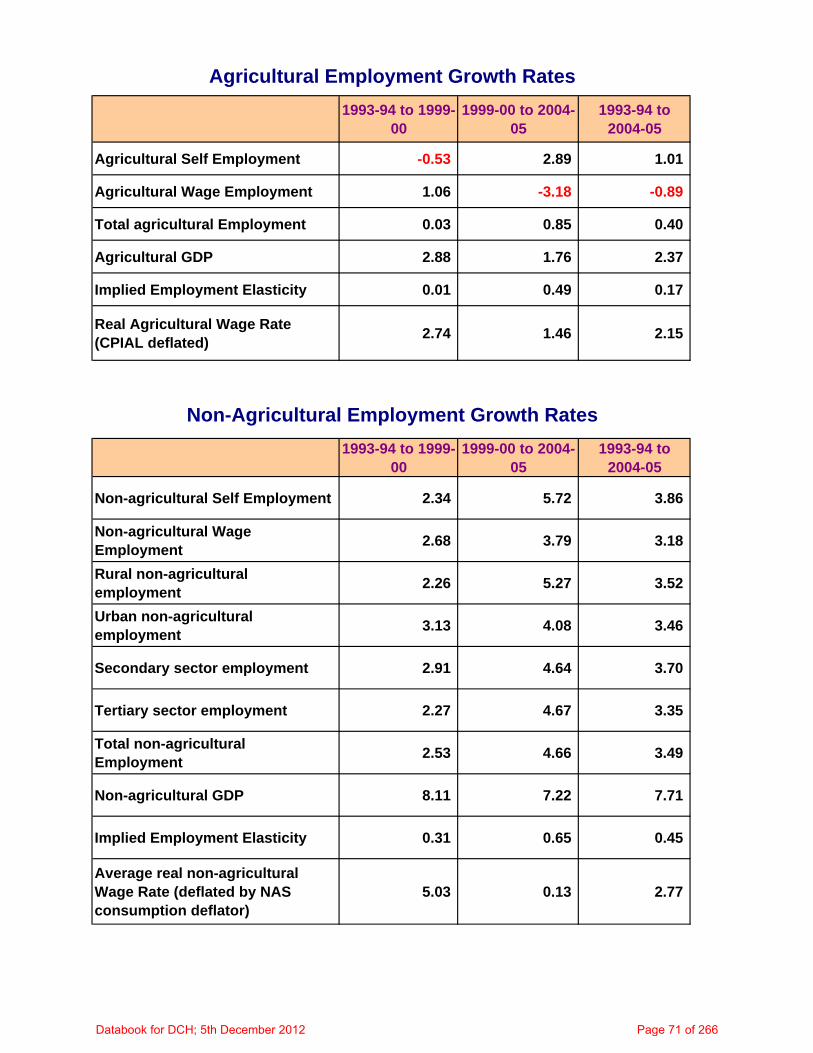
Agricultural Employment Growth Rates1993-94 to 1999-
001999-00 to 2004-
051993-94 to
2004-05
Agricultural Self Employment -0.53 2.89 1.01
Agricultural Wage Employment 1.06 -3.18 -0.89
Total agricultural Employment 0.03 0.85 0.40
Agricultural GDP 2.88 1.76 2.37
Implied Employment Elasticity 0.01 0.49 0.17
Real Agricultural Wage Rate (CPIAL deflated) 2.74 1.46 2.15
Non-Agricultural Employment Growth Rates1993-94 to 1999-
001999-00 to 2004-
051993-94 to
2004-05
Non-agricultural Self Employment 2.34 5.72 3.86
Non-agricultural Wage Employment 2.68 3.79 3.18
Rural non-agricultural employment 2.26 5.27 3.52
Urban non-agricultural employment 3.13 4.08 3.46
Secondary sector employment 2.91 4.64 3.70
Tertiary sector employment 2.27 4.67 3.35
Total non-agricultural Employment 2.53 4.66 3.49
Non-agricultural GDP 8.11 7.22 7.71
Implied Employment Elasticity 0.31 0.65 0.45
Average real non-agricultural Wage Rate (deflated by NAS consumption deflator)
5.03 0.13 2.77
Databook for DCH; 5th December 2012 Page 71 of 266
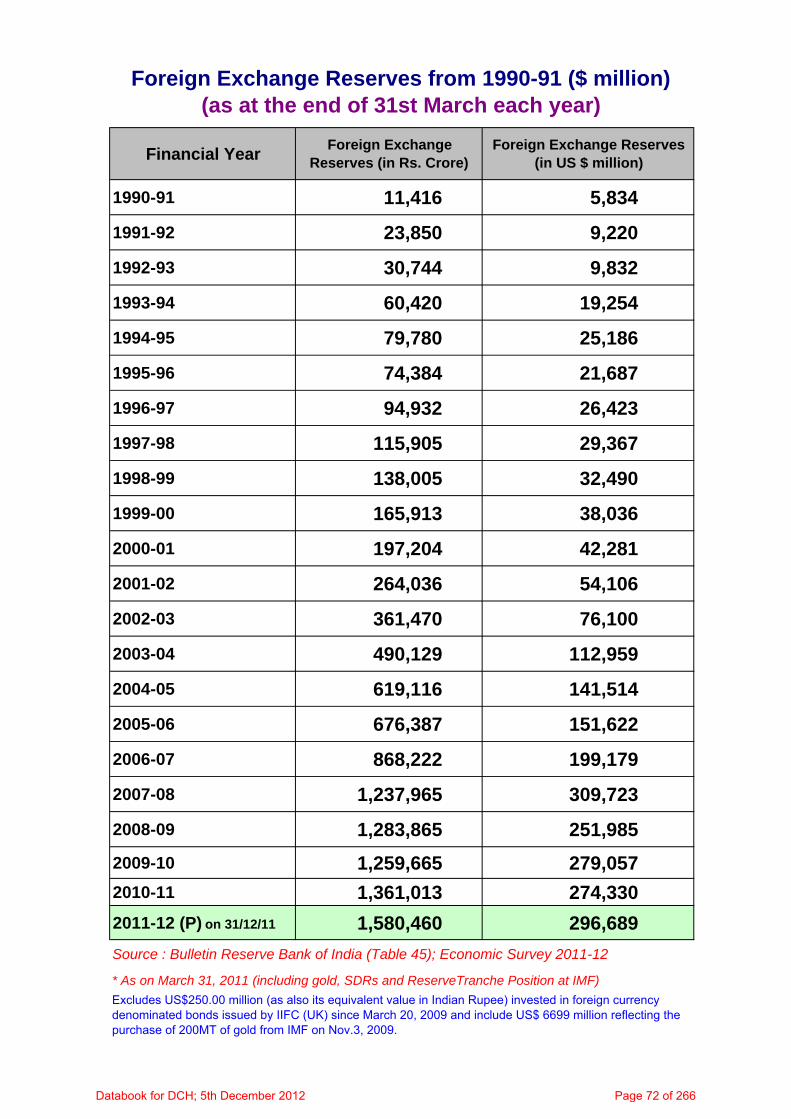
Foreign Exchange Reserves from 1990-91 ($ million)
(as at the end of 31st March each year)
Financial YearForeign Exchange
Reserves (in Rs. Crore)
Foreign Exchange Reserves
(in US $ million)
1990-91 11,416 5,834
1991-92 23,850 9,220
1992-93 30,744 9,832
1993-94 60,420 19,254
1994-95 79,780 25,186
1995-96 74,384 21,687
1996-97 94,932 26,423
1997-98 115,905 29,367
1998-99 138,005 32,490
1999-00 165,913 38,036
2000-01 197,204 42,281
2001-02 264,036 54,106
2002-03 361,470 76,100
2003-04 490,129 112,959
2004-05 619,116 141,514
2005-06 676,387 151,622
2006-07 868,222 199,179
2007-08 1,237,965 309,723
2008-09 1,283,865 251,985
2009-10 1,259,665 279,057
2010-11 1,361,013 274,330
2011-12 (P) on 31/12/11 1,580,460 296,689
Source : Bulletin Reserve Bank of India (Table 45); Economic Survey 2011-12
* As on March 31, 2011 (including gold, SDRs and ReserveTranche Position at IMF)Excludes US$250.00 million (as also its equivalent value in Indian Rupee) invested in foreign currency denominated bonds issued by IIFC (UK) since March 20, 2009 and include US$ 6699 million reflecting the purchase of 200MT of gold from IMF on Nov.3, 2009.
Databook for DCH; 5th December 2012 Page 72 of 266
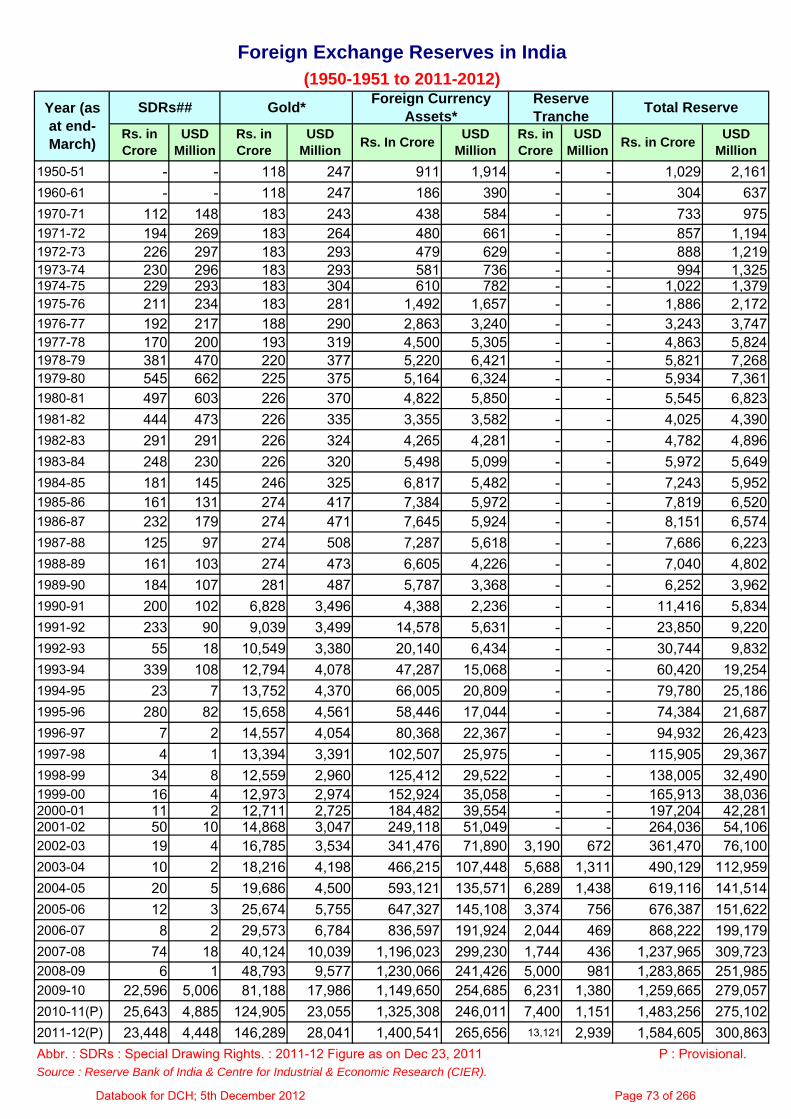
1950-51 - - 118 247 911 1,914 - - 1,029 2,161 1960-61 - - 118 247 186 390 - - 304 637 1970-71 112 148 183 243 438 584 - - 733 975 1971-72 194 269 183 264 480 661 - - 857 1,194 1972-73 226 297 183 293 479 629 - - 888 1,219 1973-74 230 296 183 293 581 736 - - 994 1,325 1974-75 229 293 183 304 610 782 - - 1,022 1,379 1975-76 211 234 183 281 1,492 1,657 - - 1,886 2,172 1976-77 192 217 188 290 2,863 3,240 - - 3,243 3,747 1977-78 170 200 193 319 4,500 5,305 - - 4,863 5,824 1978-79 381 470 220 377 5,220 6,421 - - 5,821 7,268 1979-80 545 662 225 375 5,164 6,324 - - 5,934 7,361 1980-81 497 603 226 370 4,822 5,850 - - 5,545 6,823 1981-82 444 473 226 335 3,355 3,582 - - 4,025 4,390 1982-83 291 291 226 324 4,265 4,281 - - 4,782 4,896 1983-84 248 230 226 320 5,498 5,099 - - 5,972 5,649 1984-85 181 145 246 325 6,817 5,482 - - 7,243 5,952 1985-86 161 131 274 417 7,384 5,972 - - 7,819 6,520 1986-87 232 179 274 471 7,645 5,924 - - 8,151 6,574 1987-88 125 97 274 508 7,287 5,618 - - 7,686 6,223 1988-89 161 103 274 473 6,605 4,226 - - 7,040 4,802 1989-90 184 107 281 487 5,787 3,368 - - 6,252 3,962 1990-91 200 102 6,828 3,496 4,388 2,236 - - 11,416 5,834 1991-92 233 90 9,039 3,499 14,578 5,631 - - 23,850 9,220 1992-93 55 18 10,549 3,380 20,140 6,434 - - 30,744 9,832 1993-94 339 108 12,794 4,078 47,287 15,068 - - 60,420 19,254 1994-95 23 7 13,752 4,370 66,005 20,809 - - 79,780 25,186 1995-96 280 82 15,658 4,561 58,446 17,044 - - 74,384 21,687 1996-97 7 2 14,557 4,054 80,368 22,367 - - 94,932 26,423 1997-98 4 1 13,394 3,391 102,507 25,975 - - 115,905 29,367 1998-99 34 8 12,559 2,960 125,412 29,522 - - 138,005 32,490 1999-00 16 4 12,973 2,974 152,924 35,058 - - 165,913 38,036 2000-01 11 2 12,711 2,725 184,482 39,554 - - 197,204 42,281 2001-02 50 10 14,868 3,047 249,118 51,049 - - 264,036 54,106 2002-03 19 4 16,785 3,534 341,476 71,890 3,190 672 361,470 76,100 2003-04 10 2 18,216 4,198 466,215 107,448 5,688 1,311 490,129 112,959 2004-05 20 5 19,686 4,500 593,121 135,571 6,289 1,438 619,116 141,514 2005-06 12 3 25,674 5,755 647,327 145,108 3,374 756 676,387 151,622 2006-07 8 2 29,573 6,784 836,597 191,924 2,044 469 868,222 199,179 2007-08 74 18 40,124 10,039 1,196,023 299,230 1,744 436 1,237,965 309,723 2008-09 6 1 48,793 9,577 1,230,066 241,426 5,000 981 1,283,865 251,985 2009-10 22,596 5,006 81,188 17,986 1,149,650 254,685 6,231 1,380 1,259,665 279,057 2010-11(P) 25,643 4,885 124,905 23,055 1,325,308 246,011 7,400 1,151 1,483,256 275,102 2011-12(P) 23,448 4,448 146,289 28,041 1,400,541 265,656 13,121 2,939 1,584,605 300,863 Abbr. : SDRs : Special Drawing Rights. : 2011-12 Figure as on Dec 23, 2011 P : Provisional.Source : Reserve Bank of India & Centre for Industrial & Economic Research (CIER).
Foreign Exchange Reserves in India
(1950-1951 to 2011-2012)
Year (as
at end-
March)
SDRs## Gold*Foreign Currency
Assets*
Reserve
Tranche Total Reserve
Rs. in
Crore
USD
Million
USD
MillionRs. in Crore
USD
Million
Rs. in
Crore
USD
Million
USD
Million
Rs. in
CroreRs. In Crore
Databook for DCH; 5th December 2012 Page 73 of 266
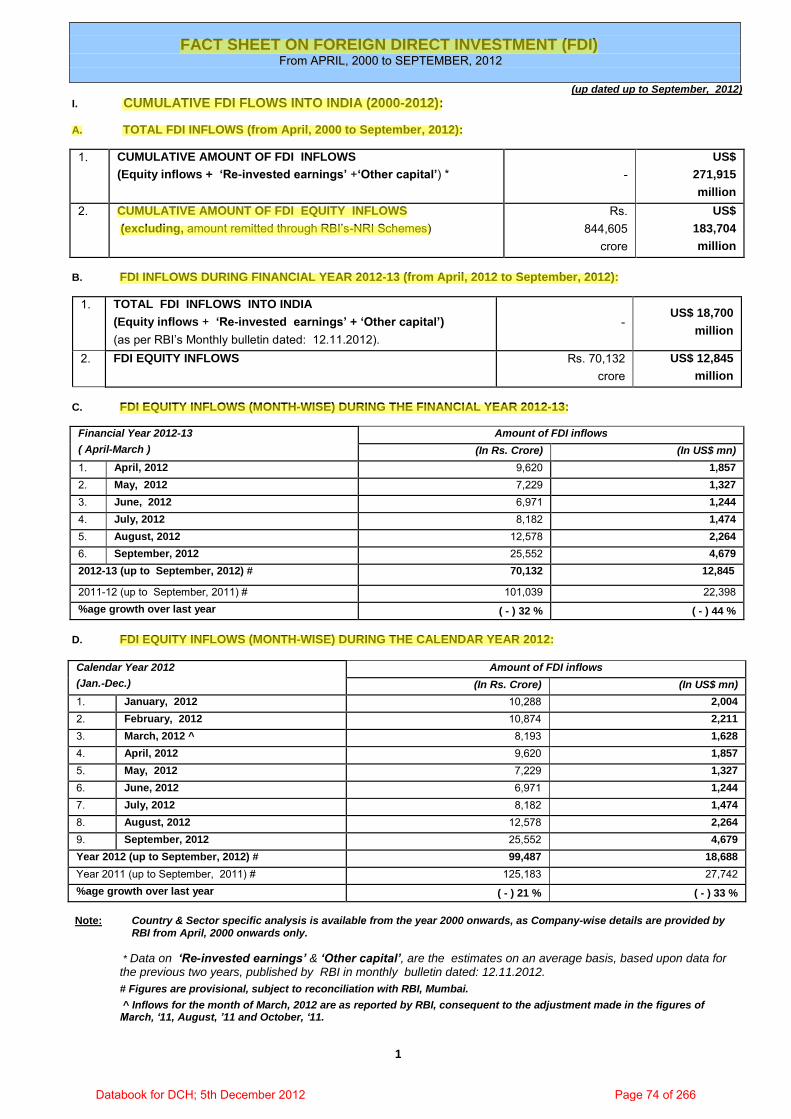
1
FFAACCTT SSHHEEEETT OONN FFOORREEIIGGNN DDIIRREECCTT IINNVVEESSTTMMEENNTT ((FFDDII)) FFrroomm AAPPRRIILL,, 22000000 ttoo SSEEPPTTEEMMBBEERR,, 22001122
(up dated up to September, 2012)
I. CUMULATIVE FDI FLOWS INTO INDIA (2000-2012):
A. TOTAL FDI INFLOWS (from April, 2000 to September, 2012):
1. CUMULATIVE AMOUNT OF FDI INFLOWS
(Equity inflows + ‘Re-invested earnings’ +‘Other capital’) *
- US$
271,915
million
2. CUMULATIVE AMOUNT OF FDI EQUITY INFLOWS
(excluding, amount remitted through RBI’s-NRI Schemes)
Rs. 844,605
crore
US$
183,704
million
B. FDI INFLOWS DURING FINANCIAL YEAR 2012-13 (from April, 2012 to September, 2012):
1. TOTAL FDI INFLOWS INTO INDIA
(Equity inflows + ‘Re-invested earnings’ + ‘Other capital’) (as per RBI’s Monthly bulletin dated: 12.11.2012).
- US$ 18,700
million
2.
FDI EQUITY INFLOWS
Rs. 70,132 crore
US$ 12,845
million
C. FDI EQUITY INFLOWS (MONTH-WISE) DURING THE FINANCIAL YEAR 2012-13:
Financial Year 2012-13
( April-March )
Amount of FDI inflows
(In Rs. Crore) (In US$ mn)
1. April, 2012 9,620 1,857
2. May, 2012 7,229 1,327
3. June, 2012 6,971 1,244
4. July, 2012 8,182 1,474
5. August, 2012 12,578 2,264
6. September, 2012 25,552 4,679
2012-13 (up to September, 2012) # 70,132 12,845
2011-12 (up to September, 2011) # 101,039 22,398 %age growth over last year ( - ) 32 % ( - ) 44 %
D. FDI EQUITY INFLOWS (MONTH-WISE) DURING THE CALENDAR YEAR 2012: Calendar Year 2012
(Jan.-Dec.)
Amount of FDI inflows
(In Rs. Crore) (In US$ mn)
1. January, 2012 10,288 2,004
2. February, 2012 10,874 2,211
3. March, 2012 ^ 8,193 1,628
4. April, 2012 9,620 1,857
5. May, 2012 7,229 1,327
6. June, 2012 6,971 1,244
7. July, 2012 8,182 1,474
8. August, 2012 12,578 2,264
9. September, 2012 25,552 4,679
Year 2012 (up to September, 2012) # 99,487 18,688
Year 2011 (up to September, 2011) # 125,183 27,742 %age growth over last year ( - ) 21 % ( - ) 33 %
Note: Country & Sector specific analysis is available from the year 2000 onwards, as Company-wise details are provided by
RBI from April, 2000 onwards only.
* Data on „Re-invested earnings‟ & „Other capital‟, are the estimates on an average basis, based upon data for the previous two years, published by RBI in monthly bulletin dated: 12.11.2012.
# Figures are provisional, subject to reconciliation with RBI, Mumbai.
^ Inflows for the month of March, 2012 are as reported by RBI, consequent to the adjustment made in the figures of March, „11, August, ‟11 and October, „11.
Databook for DCH; 5th December 2012 Page 74 of 266
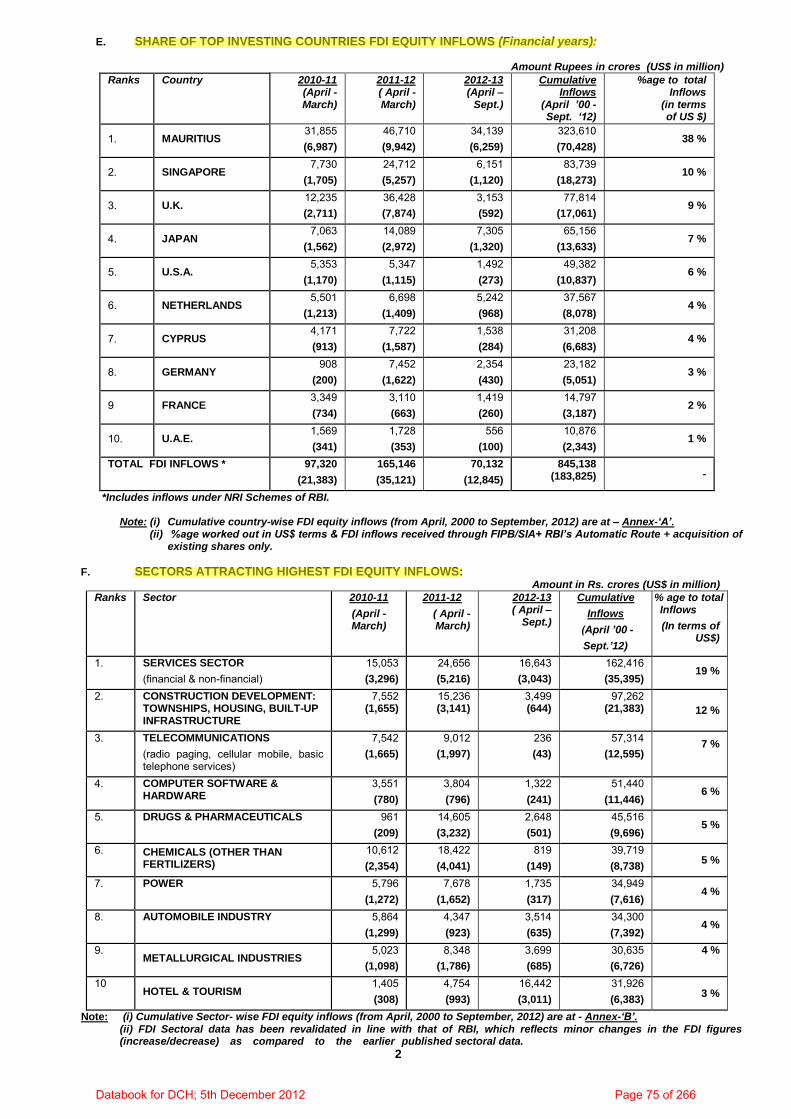
2
E. SHARE OF TOP INVESTING COUNTRIES FDI EQUITY INFLOWS (Financial years):
Amount Rupees in crores (US$ in million)
Ranks Country 2010-11 (April - March)
2011-12 ( April - March)
2012-13 (April –
Sept.)
Cumulative Inflows
(April ‟00 - Sept. „12)
%age to total Inflows
(in terms of US $)
1. MAURITIUS 31,855 (6,987)
46,710 (9,942)
34,139 (6,259)
323,610 (70,428)
38 %
2. SINGAPORE 7,730
(1,705)
24,712 (5,257)
6,151 (1,120)
83,739 (18,273)
10 %
3. U.K. 12,235 (2,711)
36,428 (7,874)
3,153 (592)
77,814 (17,061)
9 %
4. JAPAN 7,063
(1,562)
14,089 (2,972)
7,305 (1,320)
65,156 (13,633)
7 %
5. U.S.A. 5,353
(1,170)
5,347 (1,115)
1,492 (273)
49,382 (10,837)
6 %
6. NETHERLANDS 5,501
(1,213)
6,698 (1,409)
5,242 (968)
37,567 (8,078)
4 %
7. CYPRUS 4,171 (913)
7,722 (1,587)
1,538 (284)
31,208 (6,683)
4 %
8. GERMANY 908
(200)
7,452 (1,622)
2,354 (430)
23,182 (5,051)
3 %
9 FRANCE 3,349 (734)
3,110 (663)
1,419 (260)
14,797 (3,187)
2 %
10. U.A.E. 1,569 (341)
1,728 (353)
556 (100)
10,876 (2,343)
1 %
TOTAL FDI INFLOWS * 97,320
(21,383)
165,146
(35,121)
70,132
(12,845)
845,138 (183,825) -
*Includes inflows under NRI Schemes of RBI. Note: (i) Cumulative country-wise FDI equity inflows (from April, 2000 to September, 2012) are at – Annex-„A‟.
(ii) %age worked out in US$ terms & FDI inflows received through FIPB/SIA+ RBI‟s Automatic Route + acquisition of existing shares only.
F. SECTORS ATTRACTING HIGHEST FDI EQUITY INFLOWS: Amount in Rs. crores (US$ in million) Ranks Sector 2010-11
(April -March)
2011-12
( April - March)
2012-13 ( April –
Sept.)
Cumulative
Inflows
(April ‟00 -
Sept.‟12)
% age to total Inflows
(In terms of US$)
1. SERVICES SECTOR
(financial & non-financial) 15,053 (3,296)
24,656 (5,216)
16,643 (3,043)
162,416 (35,395)
19 %
2. CONSTRUCTION DEVELOPMENT: TOWNSHIPS, HOUSING, BUILT-UP INFRASTRUCTURE
7,552 (1,655)
15,236 (3,141)
3,499 (644)
97,262 (21,383) 12 %
3. TELECOMMUNICATIONS
(radio paging, cellular mobile, basic telephone services)
7,542 (1,665)
9,012 (1,997)
236 (43)
57,314 (12,595)
7 %
4. COMPUTER SOFTWARE & HARDWARE
3,551 (780)
3,804 (796)
1,322 (241)
51,440 (11,446)
6 %
5. DRUGS & PHARMACEUTICALS 961 (209)
14,605 (3,232)
2,648 (501)
45,516 (9,696)
5 %
6. CHEMICALS (OTHER THAN FERTILIZERS)
10,612 (2,354)
18,422 (4,041)
819 (149)
39,719 (8,738)
5 %
7. POWER 5,796 (1,272)
7,678 (1,652)
1,735 (317)
34,949 (7,616)
4 %
8. AUTOMOBILE INDUSTRY
5,864 (1,299)
4,347 (923)
3,514 (635)
34,300 (7,392)
4 %
9. METALLURGICAL INDUSTRIES
5,023 (1,098)
8,348 (1,786)
3,699 (685)
30,635 (6,726)
4 %
10 HOTEL & TOURISM
1,405 (308)
4,754 (993)
16,442 (3,011)
31,926 (6,383)
3 %
Note: (i) Cumulative Sector- wise FDI equity inflows (from April, 2000 to September, 2012) are at - Annex-„B‟. (ii) FDI Sectoral data has been revalidated in line with that of RBI, which reflects minor changes in the FDI figures (increase/decrease) as compared to the earlier published sectoral data.
Databook for DCH; 5th December 2012 Page 75 of 266
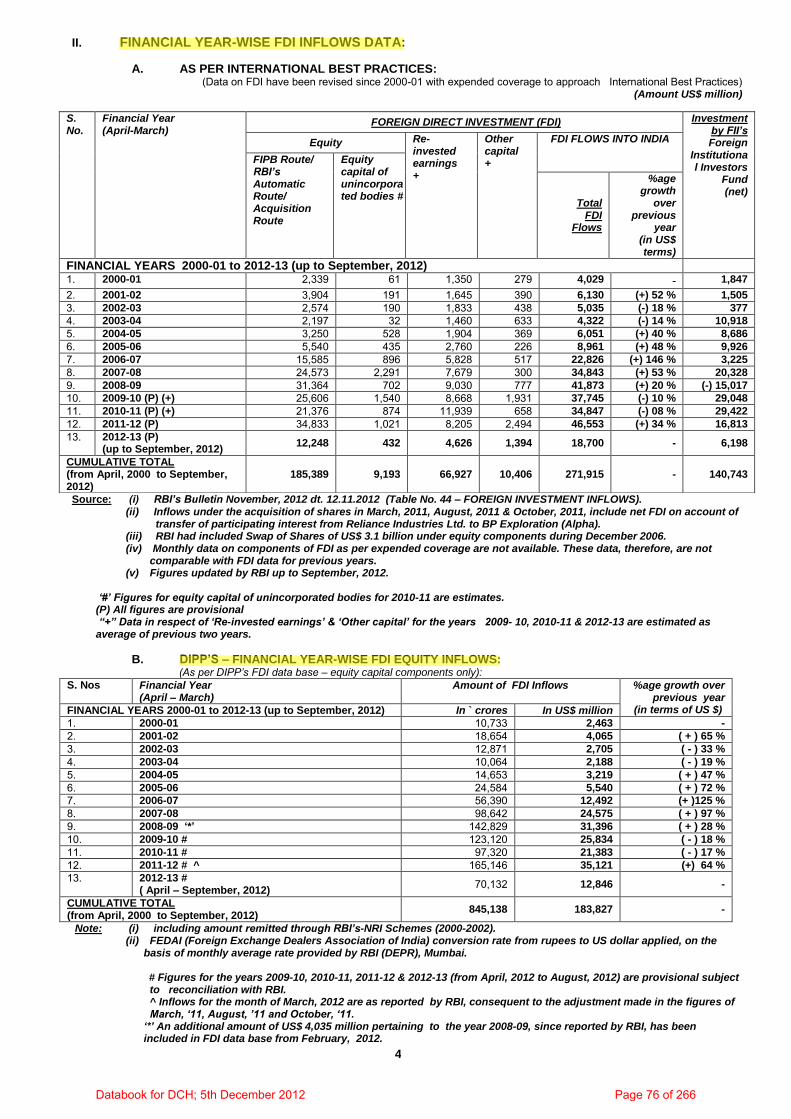
4
II. FINANCIAL YEAR-WISE FDI INFLOWS DATA:
A. AS PER INTERNATIONAL BEST PRACTICES: (Data on FDI have been revised since 2000-01 with expended coverage to approach International Best Practices)
(Amount US$ million)
Source: (i) RBI‟s Bulletin November, 2012 dt. 12.11.2012 (Table No. 44 – FOREIGN INVESTMENT INFLOWS). (ii) Inflows under the acquisition of shares in March, 2011, August, 2011 & October, 2011, include net FDI on account of
transfer of participating interest from Reliance Industries Ltd. to BP Exploration (Alpha). (iii) RBI had included Swap of Shares of US$ 3.1 billion under equity components during December 2006. (iv) Monthly data on components of FDI as per expended coverage are not available. These data, therefore, are not
comparable with FDI data for previous years. (v) Figures updated by RBI up to September, 2012.
„#‟ Figures for equity capital of unincorporated bodies for 2010-11 are estimates. (P) All figures are provisional “+” Data in respect of „Re-invested earnings‟ & „Other capital‟ for the years 2009- 10, 2010-11 & 2012-13 are estimated as average of previous two years.
B. DIPP’S – FINANCIAL YEAR-WISE FDI EQUITY INFLOWS: (As per DIPP’s FDI data base – equity capital components only):
S. Nos S. No. Financial Year (April – March)
Amount of FDI Inflows %age growth over previous year
(in terms of US $) FINANCIAL YEARS 2000-01 to 2012-13 (up to September, 2012) In ` crores In US$ million
1. 2000-01 10,733 2,463 -
2. 2001-02 18,654 4,065 ( + ) 65 %
3. 2002-03 12,871 2,705 ( - ) 33 %
4. 2003-04 10,064 2,188 ( - ) 19 %
5. 2004-05 14,653 3,219 ( + ) 47 %
6. 2005-06 24,584 5,540 ( + ) 72 %
7. 2006-07 56,390 12,492 (+ )125 % 8. 2007-08 98,642 24,575 ( + ) 97 %
9. 2008-09 ‘*’ 142,829 31,396 ( + ) 28 %
10. 2009-10 # 123,120 25,834 ( - ) 18 %
11. 2010-11 # 97,320 21,383 ( - ) 17 %
12. 2011-12 # ^ 165,146 35,121 (+) 64 %
13. 2012-13 # ( April – September, 2012)
70,132 12,846 -
CUMULATIVE TOTAL (from April, 2000 to September, 2012)
845,138 183,827 -
Note: (i) including amount remitted through RBI‟s-NRI Schemes (2000-2002). (ii) FEDAI (Foreign Exchange Dealers Association of India) conversion rate from rupees to US dollar applied, on the
basis of monthly average rate provided by RBI (DEPR), Mumbai.
# Figures for the years 2009-10, 2010-11, 2011-12 & 2012-13 (from April, 2012 to August, 2012) are provisional subject to reconciliation with RBI.
^ Inflows for the month of March, 2012 are as reported by RBI, consequent to the adjustment made in the figures of March, „11, August, ‟11 and October, „11.
„*‟ An additional amount of US$ 4,035 million pertaining to the year 2008-09, since reported by RBI, has been included in FDI data base from February, 2012.
S. No.
Financial Year (April-March)
FOREIGN DIRECT INVESTMENT (FDI) Investment by FII‟s Foreign
Institutional Investors
Fund (net)
Equity Re-invested earnings +
Other capital +
FDI FLOWS INTO INDIA
FIPB Route/ RBI‟s Automatic Route/ Acquisition Route
Equity capital of unincorporated bodies #
Total FDI
Flows
%age growth
over previous
year (in US$ terms)
FINANCIAL YEARS 2000-01 to 2012-13 (up to September, 2012)
1. 2000-01 2,339 61 1,350 279 4,029 - 1,847
2. 2001-02 3,904 191 1,645 390 6,130 (+) 52 % 1,505
3. 2002-03 2,574 190 1,833 438 5,035 (-) 18 % 377
4. 2003-04 2,197 32 1,460 633 4,322 (-) 14 % 10,918
5. 2004-05 3,250 528 1,904 369 6,051 (+) 40 % 8,686
6. 2005-06 5,540 435 2,760 226 8,961 (+) 48 % 9,926
7. 2006-07 15,585 896 5,828 517 22,826 (+) 146 % 3,225
8. 2007-08 24,573 2,291 7,679 300 34,843 (+) 53 % 20,328
9. 2008-09 31,364 702 9,030 777 41,873 (+) 20 % (-) 15,017
10. 2009-10 (P) (+) 25,606 1,540 8,668 1,931 37,745 (-) 10 % 29,048
11. 2010-11 (P) (+) 21,376 874 11,939 658 34,847 (-) 08 % 29,422
12. 2011-12 (P) 34,833 1,021 8,205 2,494 46,553 (+) 34 % 16,813
13. 2012-13 (P) (up to September, 2012)
12,248 432 4,626 1,394 18,700 - 6,198
CUMULATIVE TOTAL (from April, 2000 to September, 2012)
185,389 9,193 66,927 10,406 271,915 - 140,743
Databook for DCH; 5th December 2012 Page 76 of 266
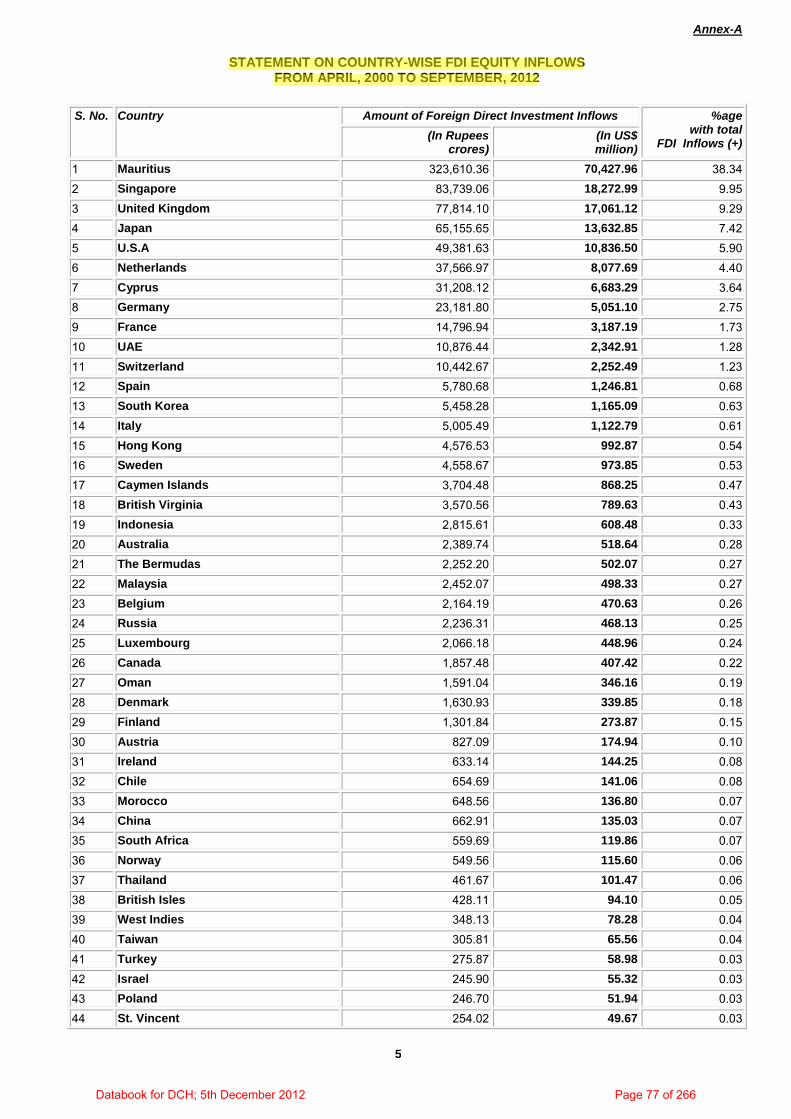
5
Annex-A
STATEMENT ON COUNTRY-WISE FDI EQUITY INFLOWS FROM APRIL, 2000 TO SEPTEMBER, 2012
S. No.
Country
Amount of Foreign Direct Investment Inflows %age with total
FDI Inflows (+) (In Rupees
crores) (In US$ million)
1 Mauritius 323,610.36 70,427.96 38.34 2 Singapore 83,739.06 18,272.99 9.95 3 United Kingdom 77,814.10 17,061.12 9.29 4 Japan 65,155.65 13,632.85 7.42 5 U.S.A 49,381.63 10,836.50 5.90 6 Netherlands 37,566.97 8,077.69 4.40 7 Cyprus 31,208.12 6,683.29 3.64 8 Germany 23,181.80 5,051.10 2.75 9 France 14,796.94 3,187.19 1.73 10 UAE 10,876.44 2,342.91 1.28 11 Switzerland 10,442.67 2,252.49 1.23 12 Spain 5,780.68 1,246.81 0.68 13 South Korea 5,458.28 1,165.09 0.63 14 Italy 5,005.49 1,122.79 0.61 15 Hong Kong 4,576.53 992.87 0.54 16 Sweden 4,558.67 973.85 0.53 17 Caymen Islands 3,704.48 868.25 0.47 18 British Virginia 3,570.56 789.63 0.43 19 Indonesia 2,815.61 608.48 0.33 20 Australia 2,389.74 518.64 0.28 21 The Bermudas 2,252.20 502.07 0.27 22 Malaysia 2,452.07 498.33 0.27 23 Belgium 2,164.19 470.63 0.26 24 Russia 2,236.31 468.13 0.25 25 Luxembourg 2,066.18 448.96 0.24 26 Canada 1,857.48 407.42 0.22 27 Oman 1,591.04 346.16 0.19 28 Denmark 1,630.93 339.85 0.18 29 Finland 1,301.84 273.87 0.15 30 Austria 827.09 174.94 0.10 31 Ireland 633.14 144.25 0.08 32 Chile 654.69 141.06 0.08 33 Morocco 648.56 136.80 0.07 34 China 662.91 135.03 0.07 35 South Africa 559.69 119.86 0.07 36 Norway 549.56 115.60 0.06 37 Thailand 461.67 101.47 0.06 38 British Isles 428.11 94.10 0.05 39 West Indies 348.13 78.28 0.04 40 Taiwan 305.81 65.56 0.04 41 Turkey 275.87 58.98 0.03 42 Israel 245.90 55.32 0.03 43 Poland 246.70 51.94 0.03 44 St. Vincent 254.02 49.67 0.03
Databook for DCH; 5th December 2012 Page 77 of 266
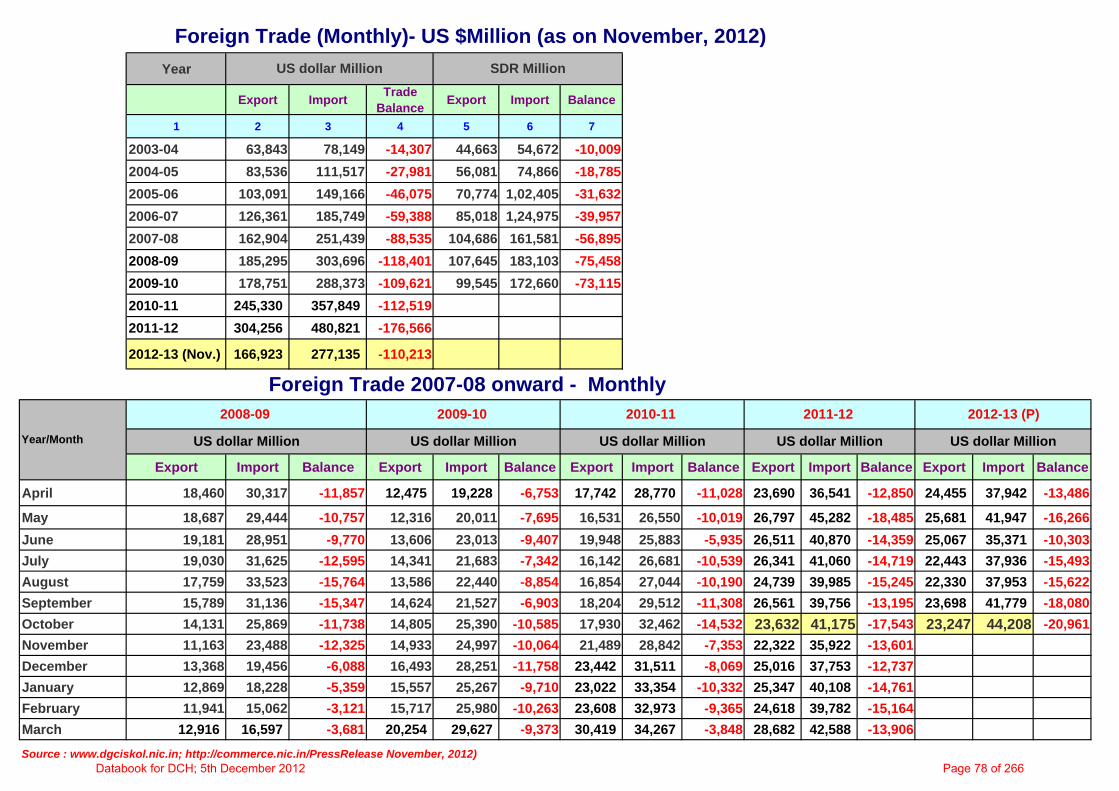
Year
Export ImportTrade
BalanceExport Import Balance
1 2 3 4 5 6 7
2003-04 63,843 78,149 -14,307 44,663 54,672 -10,009
2004-05 83,536 111,517 -27,981 56,081 74,866 -18,785
2005-06 103,091 149,166 -46,075 70,774 1,02,405 -31,632
2006-07 126,361 185,749 -59,388 85,018 1,24,975 -39,957
2007-08 162,904 251,439 -88,535 104,686 161,581 -56,895
2008-09 185,295 303,696 -118,401 107,645 183,103 -75,458
2009-10 178,751 288,373 -109,621 99,545 172,660 -73,115
2010-11 245,330 357,849 -112,519
2011-12 304,256 480,821 -176,566
2012-13 (Nov.) 166,923 277,135 -110,213
Export Import Balance Export Import Balance Export Import Balance Export Import Balance Export Import Balance
April 18,460 30,317 -11,857 12,475 19,228 -6,753 17,742 28,770 -11,028 23,690 36,541 -12,850 24,455 37,942 -13,486
May 18,687 29,444 -10,757 12,316 20,011 -7,695 16,531 26,550 -10,019 26,797 45,282 -18,485 25,681 41,947 -16,266
June 19,181 28,951 -9,770 13,606 23,013 -9,407 19,948 25,883 -5,935 26,511 40,870 -14,359 25,067 35,371 -10,303
July 19,030 31,625 -12,595 14,341 21,683 -7,342 16,142 26,681 -10,539 26,341 41,060 -14,719 22,443 37,936 -15,493
August 17,759 33,523 -15,764 13,586 22,440 -8,854 16,854 27,044 -10,190 24,739 39,985 -15,245 22,330 37,953 -15,622
September 15,789 31,136 -15,347 14,624 21,527 -6,903 18,204 29,512 -11,308 26,561 39,756 -13,195 23,698 41,779 -18,080
October 14,131 25,869 -11,738 14,805 25,390 -10,585 17,930 32,462 -14,532 23,632 41,175 -17,543 23,247 44,208 -20,961
November 11,163 23,488 -12,325 14,933 24,997 -10,064 21,489 28,842 -7,353 22,322 35,922 -13,601
December 13,368 19,456 -6,088 16,493 28,251 -11,758 23,442 31,511 -8,069 25,016 37,753 -12,737
January 12,869 18,228 -5,359 15,557 25,267 -9,710 23,022 33,354 -10,332 25,347 40,108 -14,761
February 11,941 15,062 -3,121 15,717 25,980 -10,263 23,608 32,973 -9,365 24,618 39,782 -15,164
March 12,916 16,597 -3,681 20,254 29,627 -9,373 30,419 34,267 -3,848 28,682 42,588 -13,906
2012-13 (P)
US dollar Million
Foreign Trade (Monthly)- US $Million (as on November, 2012)
Foreign Trade 2007-08 onward - Monthly
2011-12
US dollar MillionUS dollar Million
2008-09
US dollar Million
Source : www.dgciskol.nic.in; http://commerce.nic.in/PressRelease November, 2012)
Year/Month
2009-10
US dollar Million
2010-11
US dollar Million SDR Million
Databook for DCH; 5th December 2012 Page 78 of 266
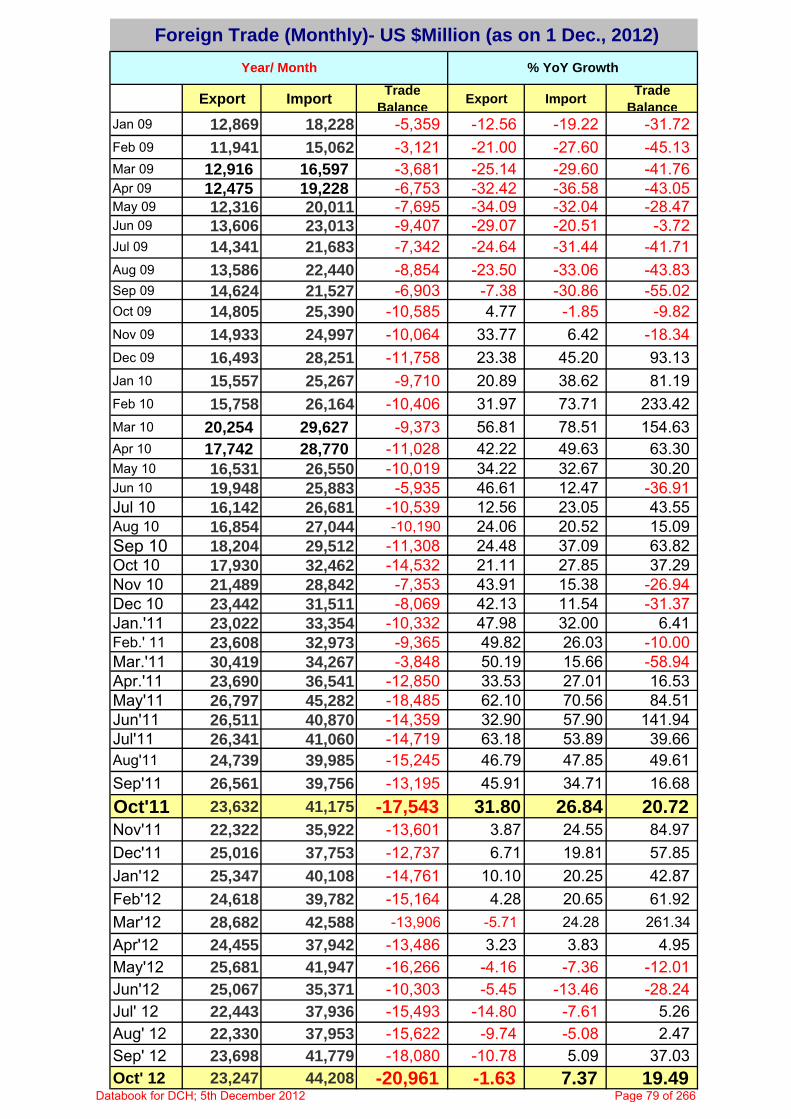
Export ImportTrade
BalanceExport Import
Trade
Balance
Jan 09 12,869 18,228 -5,359 -12.56 -19.22 -31.72 Feb 09 11,941 15,062 -3,121 -21.00 -27.60 -45.13 Mar 09 12,916 16,597 -3,681 -25.14 -29.60 -41.76 Apr 09 12,475 19,228 -6,753 -32.42 -36.58 -43.05 May 09 12,316 20,011 -7,695 -34.09 -32.04 -28.47 Jun 09 13,606 23,013 -9,407 -29.07 -20.51 -3.72 Jul 09 14,341 21,683 -7,342 -24.64 -31.44 -41.71 Aug 09 13,586 22,440 -8,854 -23.50 -33.06 -43.83 Sep 09 14,624 21,527 -6,903 -7.38 -30.86 -55.02 Oct 09 14,805 25,390 -10,585 4.77 -1.85 -9.82 Nov 09 14,933 24,997 -10,064 33.77 6.42 -18.34 Dec 09 16,493 28,251 -11,758 23.38 45.20 93.13Jan 10 15,557 25,267 -9,710 20.89 38.62 81.19Feb 10 15,758 26,164 -10,406 31.97 73.71 233.42Mar 10 20,254 29,627 -9,373 56.81 78.51 154.63Apr 10 17,742 28,770 -11,028 42.22 49.63 63.30May 10 16,531 26,550 -10,019 34.22 32.67 30.20Jun 10 19,948 25,883 -5,935 46.61 12.47 -36.91 Jul 10 16,142 26,681 -10,539 12.56 23.05 43.55Aug 10 16,854 27,044 -10,190 24.06 20.52 15.09Sep 10 18,204 29,512 -11,308 24.48 37.09 63.82Oct 10 17,930 32,462 -14,532 21.11 27.85 37.29Nov 10 21,489 28,842 -7,353 43.91 15.38 -26.94 Dec 10 23,442 31,511 -8,069 42.13 11.54 -31.37 Jan.'11 23,022 33,354 -10,332 47.98 32.00 6.41Feb.' 11 23,608 32,973 -9,365 49.82 26.03 -10.00 Mar.'11 30,419 34,267 -3,848 50.19 15.66 -58.94 Apr.'11 23,690 36,541 -12,850 33.53 27.01 16.53May'11 26,797 45,282 -18,485 62.10 70.56 84.51Jun'11 26,511 40,870 -14,359 32.90 57.90 141.94Jul'11 26,341 41,060 -14,719 63.18 53.89 39.66Aug'11 24,739 39,985 -15,245 46.79 47.85 49.61Sep'11 26,561 39,756 -13,195 45.91 34.71 16.68Oct'11 23,632 41,175 -17,543 31.80 26.84 20.72
Nov'11 22,322 35,922 -13,601 3.87 24.55 84.97Dec'11 25,016 37,753 -12,737 6.71 19.81 57.85Jan'12 25,347 40,108 -14,761 10.10 20.25 42.87Feb'12 24,618 39,782 -15,164 4.28 20.65 61.92Mar'12 28,682 42,588 -13,906 -5.71 24.28 261.34Apr'12 24,455 37,942 -13,486 3.23 3.83 4.95May'12 25,681 41,947 -16,266 -4.16 -7.36 -12.01 Jun'12 25,067 35,371 -10,303 -5.45 -13.46 -28.24 Jul' 12 22,443 37,936 -15,493 -14.80 -7.61 5.26Aug' 12 22,330 37,953 -15,622 -9.74 -5.08 2.47Sep' 12 23,698 41,779 -18,080 -10.78 5.09 37.03Oct' 12 23,247 44,208 -20,961 -1.63 7.37 19.49
Year/ Month
Foreign Trade (Monthly)- US $Million (as on 1 Dec., 2012)
% YoY Growth
Databook for DCH; 5th December 2012 Page 79 of 266
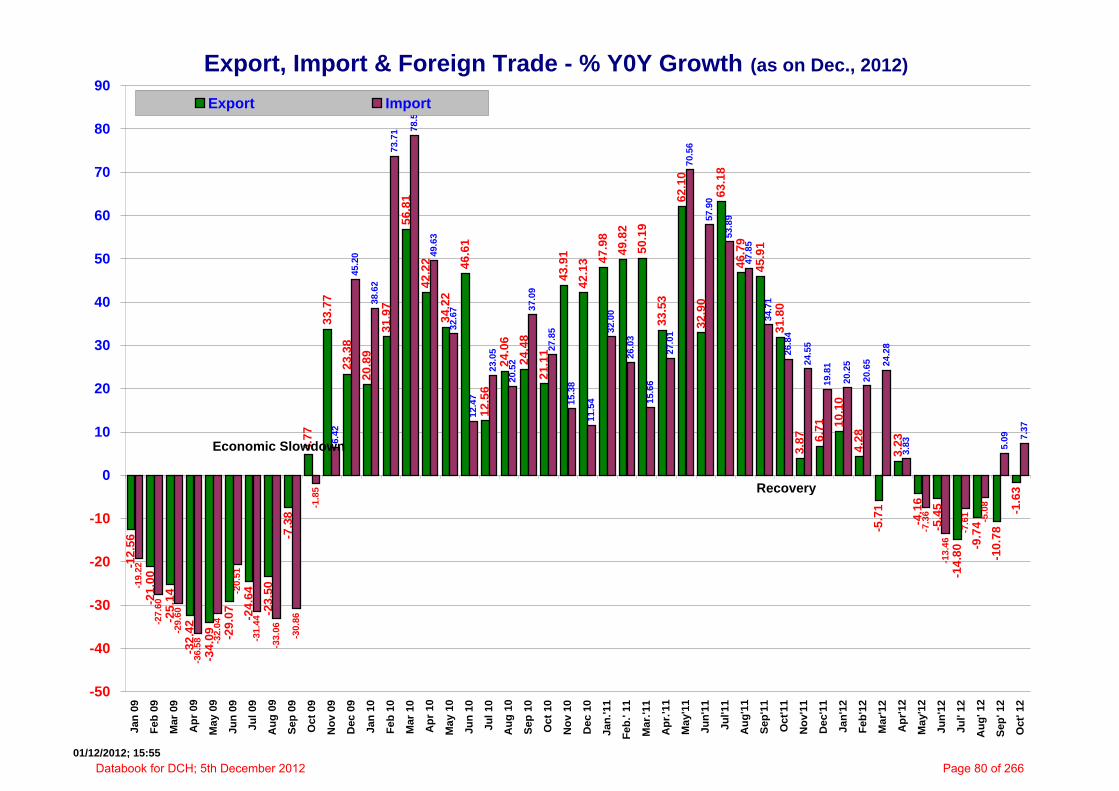
01/12/2012; 15:55
Export, Import & Foreign Trade - % Y0Y Growth (as on Dec., 2012)
-12
.56
-21
.00
-25
.14
-32
.42
-34
.09
-29
.07
-24
.64
-23
.50
-7.3
8
4.7
7
33
.77
23
.38
20
.89
31
.97
56
.81
42
.22
34
.22
46
.61
12
.56
24
.06
24
.48
21
.11
43
.91
42
.13 4
7.9
8
49
.82
50
.19
33
.53
62
.10
32
.90
63
.18
46
.79
45
.91
31
.80
3.8
7 6.7
1 10
.10
4.2
8
-5.7
1
3.2
3
-4.1
6
-5.4
5
-14
.80
-9.7
4
-10
.78
-1.6
3
-19.2
2
-27.6
0
-29.6
0
-36.5
8
-32.0
4
-20.5
1
-31.4
4
-33.0
6
-30.8
6
-1.8
5
6.4
2
45.2
0
38.6
2
73.7
1 78.5
1
49.6
3
32.6
7
12.4
7
23.0
5
20.5
2
37.0
9
27.8
5
15.3
8
11.5
4
32.0
0
26.0
3
15.6
6
27.0
1
70.5
6
57.9
0
53.8
9
47.8
5
34.7
1
26.8
4
24.5
5
19.8
1
20.2
5
20.6
5 24.2
8
3.8
3
-7.3
6
-13.4
6
-7.6
1
-5.0
8
5.0
9 7.3
7
-50
-40
-30
-20
-10
0
10
20
30
40
50
60
70
80
90
Jan
09
Feb
09
Mar
09
Ap
r 09
May 0
9
Ju
n 0
9
Ju
l 09
Au
g 0
9
Sep
09
Oct
09
No
v 0
9
Dec 0
9
Jan
10
Feb
10
Mar
10
Ap
r 10
May 1
0
Ju
n 1
0
Ju
l 10
Au
g 1
0
Sep
10
Oct
10
No
v 1
0
Dec 1
0
Jan
.'11
Feb
.' 1
1
Mar.
'11
Ap
r.'1
1
May'1
1
Ju
n'1
1
Ju
l'11
Au
g'1
1
Sep
'11
Oct'
11
No
v'1
1
Dec'1
1
Jan
'12
Feb
'12
Mar'
12
Ap
r'12
May'1
2
Ju
n'1
2
Ju
l' 1
2
Au
g' 1
2
Sep
' 12
Oct'
12
Export Import
Economic Slowdown
Recovery
Databook for DCH; 5th December 2012 Page 80 of 266
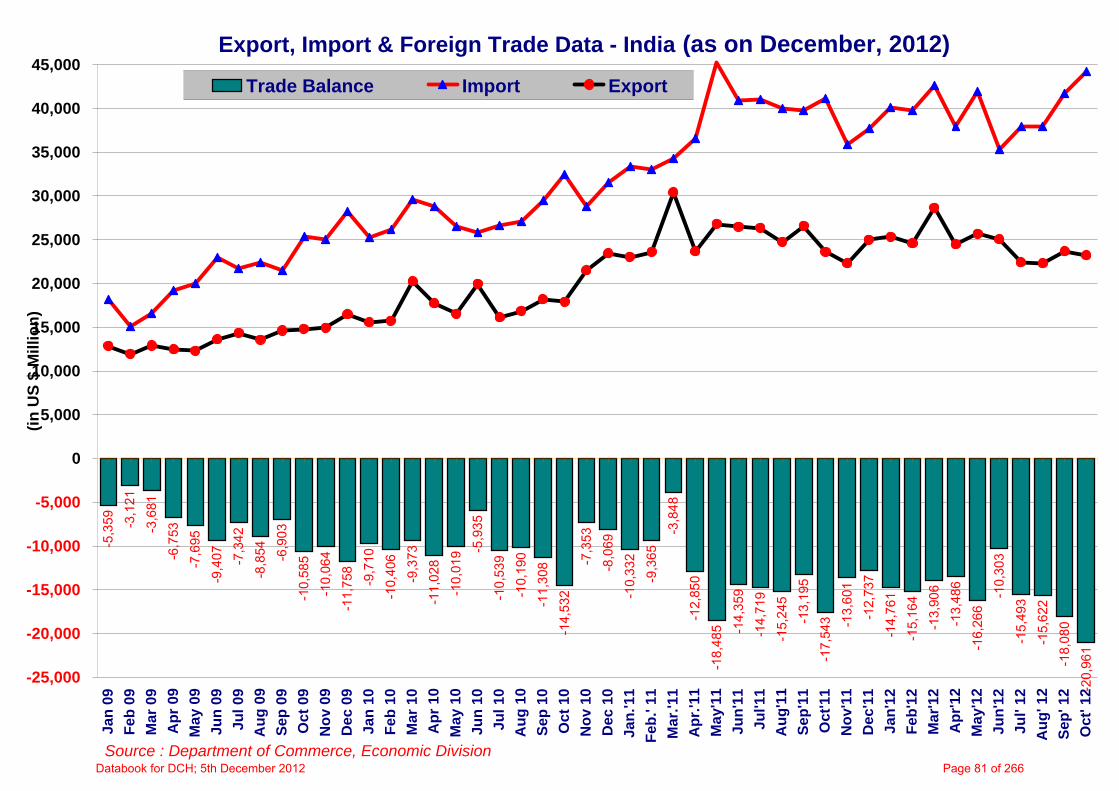
Export, Import & Foreign Trade Data - India (as on December, 2012)
-5,3
59
-3,1
21
-3,6
81
-6,7
53
-7,6
95
-9,4
07
-7,3
42
-8,8
54
-6,9
03
-10,
585
-10,
064
-11,
758
-9,7
10
-10,
406
-9,3
73
-11,
028
-10,
019 -5
,935
-1
0,53
9 -1
0,19
0 -1
1,30
8 -1
4,53
2 -7
,353
-8
,069
-1
0,33
2 -9
,365
-3
,848
-1
2,85
0 -1
8,48
5 -14,
359
-14,
719
-15,
245
-13,
195
-17,
543 -1
3,60
1 -1
2,73
7 -1
4,76
1 -1
5,16
4 -1
3,90
6 -1
3,48
6 -1
6,26
6 -1
0,30
3 -1
5,49
3 -1
5,62
2 -1
8,08
0 -2
0,96
1
-25,000
-20,000
-15,000
-10,000
-5,000
0
5,000
10,000
15,000
20,000
25,000
30,000
35,000
40,000
45,000
Jan
09
Feb
09
Mar
09
Ap
r 09
May 0
9
Ju
n 0
9
Ju
l 09
Au
g 0
9
Sep
09
Oct
09
No
v 0
9
Dec 0
9
Jan
10
Feb
10
Mar
10
Ap
r 10
May 1
0
Ju
n 1
0
Ju
l 10
Au
g 1
0
Sep
10
Oct
10
No
v 1
0
Dec 1
0
Jan
.'11
Feb
.' 1
1
Mar.
'11
Ap
r.'1
1
May'1
1
Ju
n'1
1
Ju
l'11
Au
g'1
1
Sep
'11
Oct'
11
No
v'1
1
Dec'1
1
Jan
'12
Feb
'12
Mar'
12
Ap
r'12
May'1
2
Ju
n'1
2
Ju
l' 1
2
Au
g' 12
Sep
' 12
Oct'
12
(in
US
$ M
illi
on
)
Trade Balance Import Export
Source : Department of Commerce, Economic Division Databook for DCH; 5th December 2012 Page 81 of 266
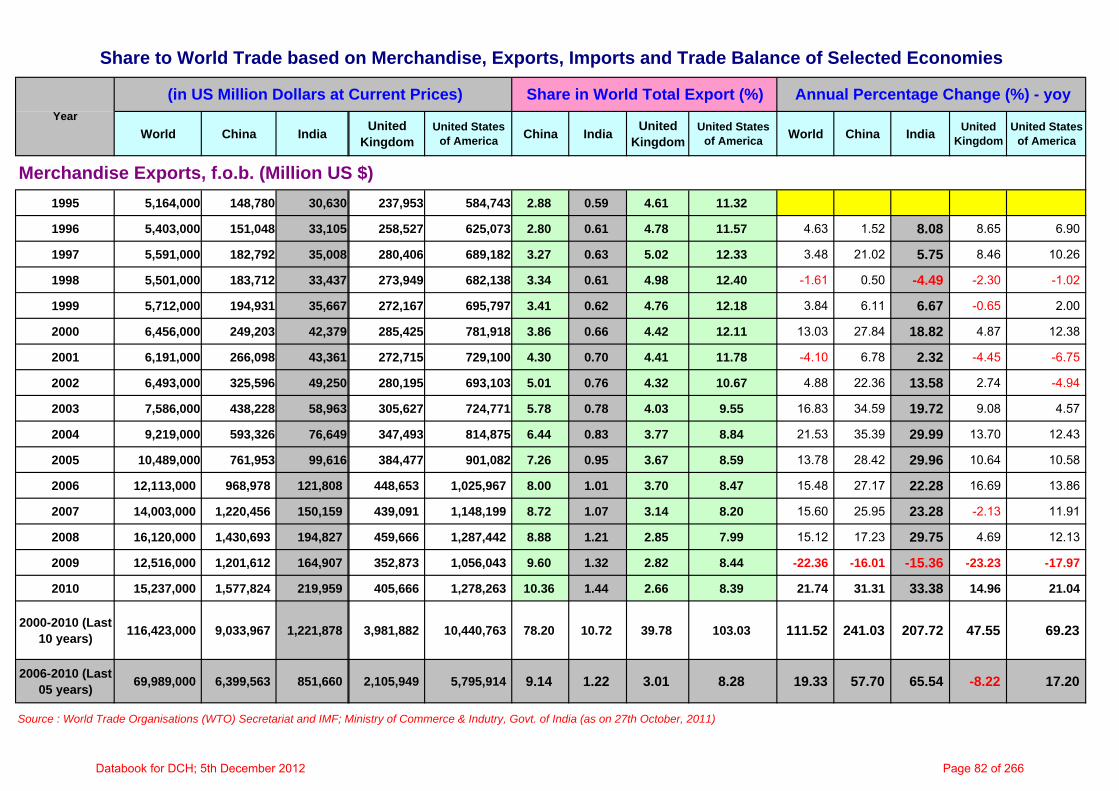
World China IndiaUnited
Kingdom
United States
of AmericaChina India
United
Kingdom
United States
of AmericaWorld China India
United
Kingdom
United States
of America
1995 5,164,000 148,780 30,630 237,953 584,743 2.88 0.59 4.61 11.32
1996 5,403,000 151,048 33,105 258,527 625,073 2.80 0.61 4.78 11.57 4.63 1.52 8.08 8.65 6.90
1997 5,591,000 182,792 35,008 280,406 689,182 3.27 0.63 5.02 12.33 3.48 21.02 5.75 8.46 10.26
1998 5,501,000 183,712 33,437 273,949 682,138 3.34 0.61 4.98 12.40 -1.61 0.50 -4.49 -2.30 -1.02
1999 5,712,000 194,931 35,667 272,167 695,797 3.41 0.62 4.76 12.18 3.84 6.11 6.67 -0.65 2.00
2000 6,456,000 249,203 42,379 285,425 781,918 3.86 0.66 4.42 12.11 13.03 27.84 18.82 4.87 12.38
2001 6,191,000 266,098 43,361 272,715 729,100 4.30 0.70 4.41 11.78 -4.10 6.78 2.32 -4.45 -6.75
2002 6,493,000 325,596 49,250 280,195 693,103 5.01 0.76 4.32 10.67 4.88 22.36 13.58 2.74 -4.94
2003 7,586,000 438,228 58,963 305,627 724,771 5.78 0.78 4.03 9.55 16.83 34.59 19.72 9.08 4.57
2004 9,219,000 593,326 76,649 347,493 814,875 6.44 0.83 3.77 8.84 21.53 35.39 29.99 13.70 12.43
2005 10,489,000 761,953 99,616 384,477 901,082 7.26 0.95 3.67 8.59 13.78 28.42 29.96 10.64 10.58
2006 12,113,000 968,978 121,808 448,653 1,025,967 8.00 1.01 3.70 8.47 15.48 27.17 22.28 16.69 13.86
2007 14,003,000 1,220,456 150,159 439,091 1,148,199 8.72 1.07 3.14 8.20 15.60 25.95 23.28 -2.13 11.91
2008 16,120,000 1,430,693 194,827 459,666 1,287,442 8.88 1.21 2.85 7.99 15.12 17.23 29.75 4.69 12.13
2009 12,516,000 1,201,612 164,907 352,873 1,056,043 9.60 1.32 2.82 8.44 -22.36 -16.01 -15.36 -23.23 -17.97
2010 15,237,000 1,577,824 219,959 405,666 1,278,263 10.36 1.44 2.66 8.39 21.74 31.31 33.38 14.96 21.04
2000-2010 (Last
10 years)116,423,000 9,033,967 1,221,878 3,981,882 10,440,763 78.20 10.72 39.78 103.03 111.52 241.03 207.72 47.55 69.23
2006-2010 (Last
05 years)69,989,000 6,399,563 851,660 2,105,949 5,795,914 9.14 1.22 3.01 8.28 19.33 57.70 65.54 -8.22 17.20
Source : World Trade Organisations (WTO) Secretariat and IMF; Ministry of Commerce & Indutry, Govt. of India (as on 27th October, 2011)
Annual Percentage Change (%) - yoy
Year
Share to World Trade based on Merchandise, Exports, Imports and Trade Balance of Selected Economies
(in US Million Dollars at Current Prices) Share in World Total Export (%)
Merchandise Exports, f.o.b. (Million US $)
Databook for DCH; 5th December 2012 Page 82 of 266
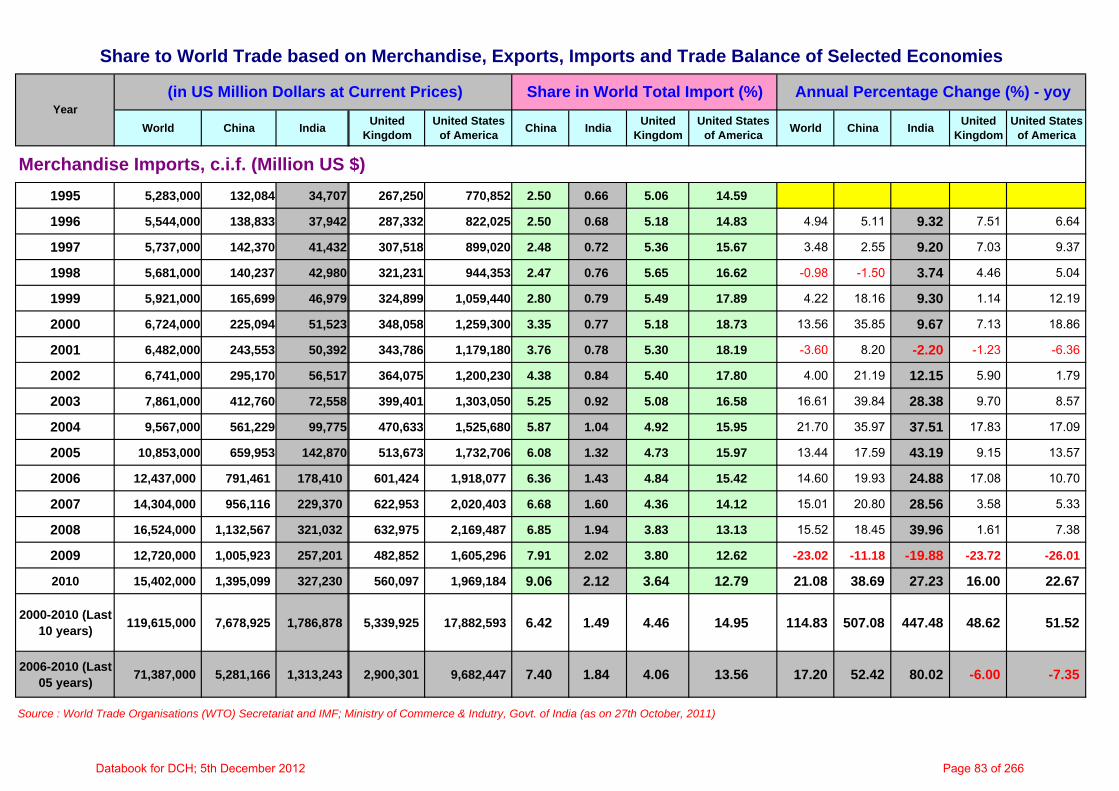
World China IndiaUnited
Kingdom
United States
of AmericaChina India
United
Kingdom
United States
of AmericaWorld China India
United
Kingdom
United States
of America
1995 5,283,000 132,084 34,707 267,250 770,852 2.50 0.66 5.06 14.59
1996 5,544,000 138,833 37,942 287,332 822,025 2.50 0.68 5.18 14.83 4.94 5.11 9.32 7.51 6.64
1997 5,737,000 142,370 41,432 307,518 899,020 2.48 0.72 5.36 15.67 3.48 2.55 9.20 7.03 9.37
1998 5,681,000 140,237 42,980 321,231 944,353 2.47 0.76 5.65 16.62 -0.98 -1.50 3.74 4.46 5.04
1999 5,921,000 165,699 46,979 324,899 1,059,440 2.80 0.79 5.49 17.89 4.22 18.16 9.30 1.14 12.19
2000 6,724,000 225,094 51,523 348,058 1,259,300 3.35 0.77 5.18 18.73 13.56 35.85 9.67 7.13 18.86
2001 6,482,000 243,553 50,392 343,786 1,179,180 3.76 0.78 5.30 18.19 -3.60 8.20 -2.20 -1.23 -6.36
2002 6,741,000 295,170 56,517 364,075 1,200,230 4.38 0.84 5.40 17.80 4.00 21.19 12.15 5.90 1.79
2003 7,861,000 412,760 72,558 399,401 1,303,050 5.25 0.92 5.08 16.58 16.61 39.84 28.38 9.70 8.57
2004 9,567,000 561,229 99,775 470,633 1,525,680 5.87 1.04 4.92 15.95 21.70 35.97 37.51 17.83 17.09
2005 10,853,000 659,953 142,870 513,673 1,732,706 6.08 1.32 4.73 15.97 13.44 17.59 43.19 9.15 13.57
2006 12,437,000 791,461 178,410 601,424 1,918,077 6.36 1.43 4.84 15.42 14.60 19.93 24.88 17.08 10.70
2007 14,304,000 956,116 229,370 622,953 2,020,403 6.68 1.60 4.36 14.12 15.01 20.80 28.56 3.58 5.33
2008 16,524,000 1,132,567 321,032 632,975 2,169,487 6.85 1.94 3.83 13.13 15.52 18.45 39.96 1.61 7.38
2009 12,720,000 1,005,923 257,201 482,852 1,605,296 7.91 2.02 3.80 12.62 -23.02 -11.18 -19.88 -23.72 -26.01
2010 15,402,000 1,395,099 327,230 560,097 1,969,184 9.06 2.12 3.64 12.79 21.08 38.69 27.23 16.00 22.67
2000-2010 (Last
10 years)119,615,000 7,678,925 1,786,878 5,339,925 17,882,593 6.42 1.49 4.46 14.95 114.83 507.08 447.48 48.62 51.52
2006-2010 (Last
05 years)71,387,000 5,281,166 1,313,243 2,900,301 9,682,447 7.40 1.84 4.06 13.56 17.20 52.42 80.02 -6.00 -7.35
Source : World Trade Organisations (WTO) Secretariat and IMF; Ministry of Commerce & Indutry, Govt. of India (as on 27th October, 2011)
Merchandise Imports, c.i.f. (Million US $)
Share to World Trade based on Merchandise, Exports, Imports and Trade Balance of Selected Economies
Year
(in US Million Dollars at Current Prices) Share in World Total Import (%) Annual Percentage Change (%) - yoy
Databook for DCH; 5th December 2012 Page 83 of 266
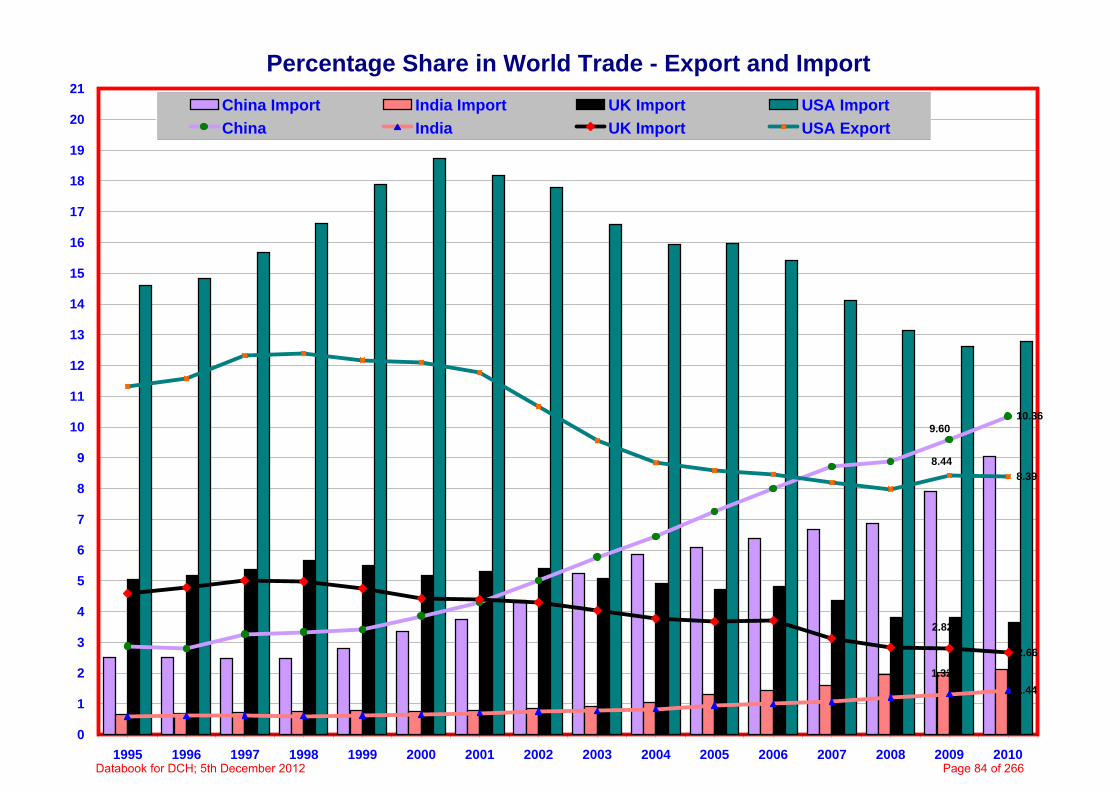
Percentage Share in World Trade - Export and Import
10.36
9.60
1.44
1.32
2.66
2.82
8.39
8.44
0
1
2
3
4
5
6
7
8
9
10
11
12
13
14
15
16
17
18
19
20
21
1995 1996 1997 1998 1999 2000 2001 2002 2003 2004 2005 2006 2007 2008 2009 2010
China Import India Import UK Import USA Import
China India UK Import USA Export
Databook for DCH; 5th December 2012 Page 84 of 266
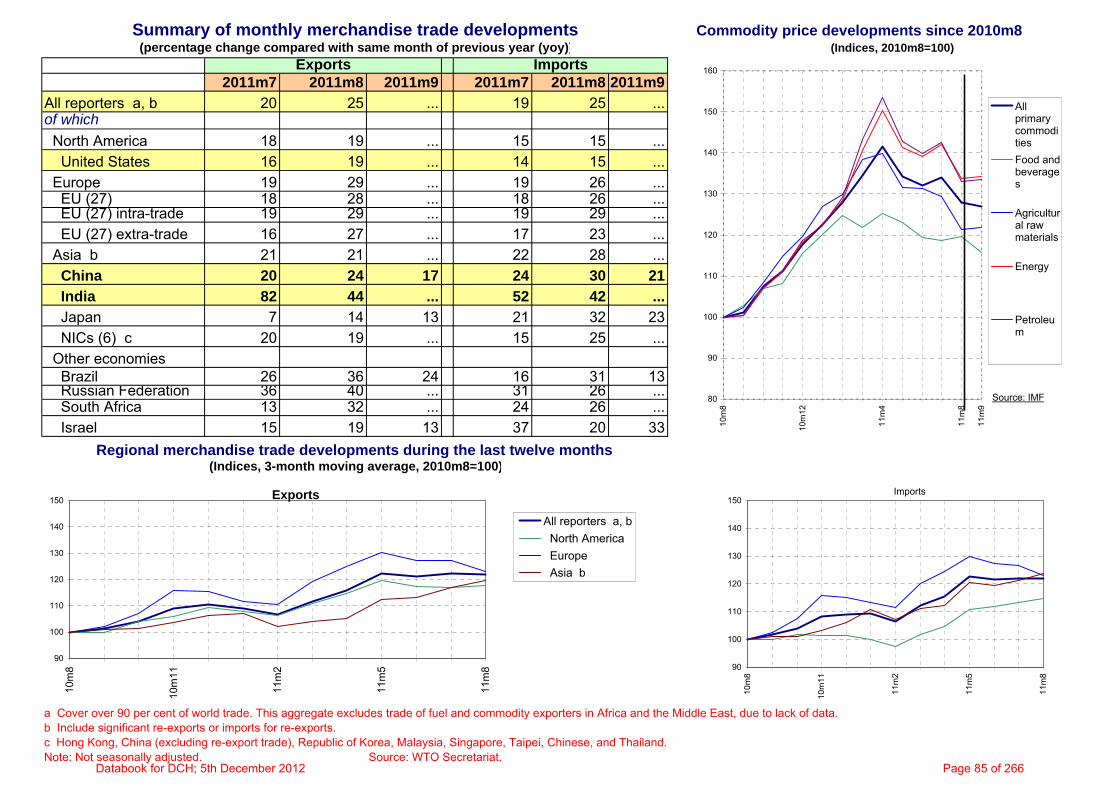
Commodity price developments since 2010m8
Exports Imports
2011m7 2011m8 2011m9 2011m7 2011m8 2011m9
All reporters a, b 20 25 ... 19 25 ...of which North America 18 19 ... 15 15 ... United States 16 19 ... 14 15 ... Europe 19 29 ... 19 26 ... EU (27) 18 28 ... 18 26 ... EU (27) intra-trade 19 29 ... 19 29 ... EU (27) extra-trade 16 27 ... 17 23 ... Asia b 21 21 ... 22 28 ... China 20 24 17 24 30 21
India 82 44 ... 52 42 ...
Japan 7 14 13 21 32 23 NICs (6) c 20 19 ... 15 25 ... Other economies Brazil 26 36 24 16 31 13 Russian Federation 36 40 ... 31 26 ... South Africa 13 32 ... 24 26 ... Israel 15 19 13 37 20 33
a Cover over 90 per cent of world trade. This aggregate excludes trade of fuel and commodity exporters in Africa and the Middle East, due to lack of data.b Include significant re-exports or imports for re-exports.c Hong Kong, China (excluding re-export trade), Republic of Korea, Malaysia, Singapore, Taipei, Chinese, and Thailand.Note: Not seasonally adjusted. Source: WTO Secretariat.
Summary of monthly merchandise trade developments(percentage change compared with same month of previous year (yoy)) (Indices, 2010m8=100)
Regional merchandise trade developments during the last twelve months(Indices, 3-month moving average, 2010m8=100)
80
90
100
110
120
130
140
150
160
10m
8
10m
12
11m
4
11m
8
11m
9
AllprimarycommoditiesFood andbeverages
Agricultural rawmaterials
Energy
Petroleum
Exports
90
100
110
120
130
140
150
10m
8
10m
11
11m
2
11m
5
11m
8
All reporters a, b North America Europe Asia b
Imports
90
100
110
120
130
140
150
10m
8
10m
11
11m
2
11m
5
11m
8
Source: IMF
Databook for DCH; 5th December 2012 Page 85 of 266
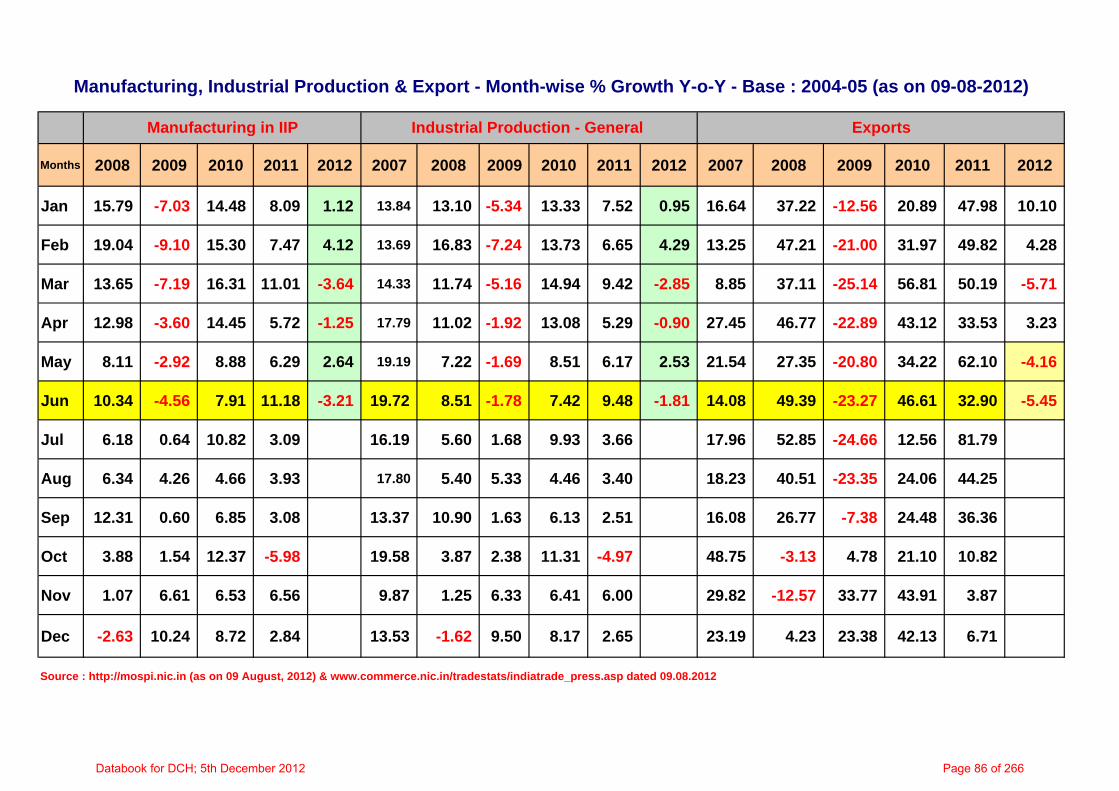
Months 2008 2009 2010 2011 2012 2007 2008 2009 2010 2011 2012 2007 2008 2009 2010 2011 2012
Jan 15.79 -7.03 14.48 8.09 1.12 13.84 13.10 -5.34 13.33 7.52 0.95 16.64 37.22 -12.56 20.89 47.98 10.10
Feb 19.04 -9.10 15.30 7.47 4.12 13.69 16.83 -7.24 13.73 6.65 4.29 13.25 47.21 -21.00 31.97 49.82 4.28
Mar 13.65 -7.19 16.31 11.01 -3.64 14.33 11.74 -5.16 14.94 9.42 -2.85 8.85 37.11 -25.14 56.81 50.19 -5.71
Apr 12.98 -3.60 14.45 5.72 -1.25 17.79 11.02 -1.92 13.08 5.29 -0.90 27.45 46.77 -22.89 43.12 33.53 3.23
May 8.11 -2.92 8.88 6.29 2.64 19.19 7.22 -1.69 8.51 6.17 2.53 21.54 27.35 -20.80 34.22 62.10 -4.16
Jun 10.34 -4.56 7.91 11.18 -3.21 19.72 8.51 -1.78 7.42 9.48 -1.81 14.08 49.39 -23.27 46.61 32.90 -5.45
Jul 6.18 0.64 10.82 3.09 16.19 5.60 1.68 9.93 3.66 17.96 52.85 -24.66 12.56 81.79
Aug 6.34 4.26 4.66 3.93 17.80 5.40 5.33 4.46 3.40 18.23 40.51 -23.35 24.06 44.25
Sep 12.31 0.60 6.85 3.08 13.37 10.90 1.63 6.13 2.51 16.08 26.77 -7.38 24.48 36.36
Oct 3.88 1.54 12.37 -5.98 19.58 3.87 2.38 11.31 -4.97 48.75 -3.13 4.78 21.10 10.82
Nov 1.07 6.61 6.53 6.56 9.87 1.25 6.33 6.41 6.00 29.82 -12.57 33.77 43.91 3.87
Dec -2.63 10.24 8.72 2.84 13.53 -1.62 9.50 8.17 2.65 23.19 4.23 23.38 42.13 6.71
Manufacturing, Industrial Production & Export - Month-wise % Growth Y-o-Y - Base : 2004-05 (as on 09-08-2012)
Source : http://mospi.nic.in (as on 09 August, 2012) & www.commerce.nic.in/tradestats/indiatrade_press.asp dated 09.08.2012
Industrial Production - General ExportsManufacturing in IIP
Databook for DCH; 5th December 2012 Page 86 of 266
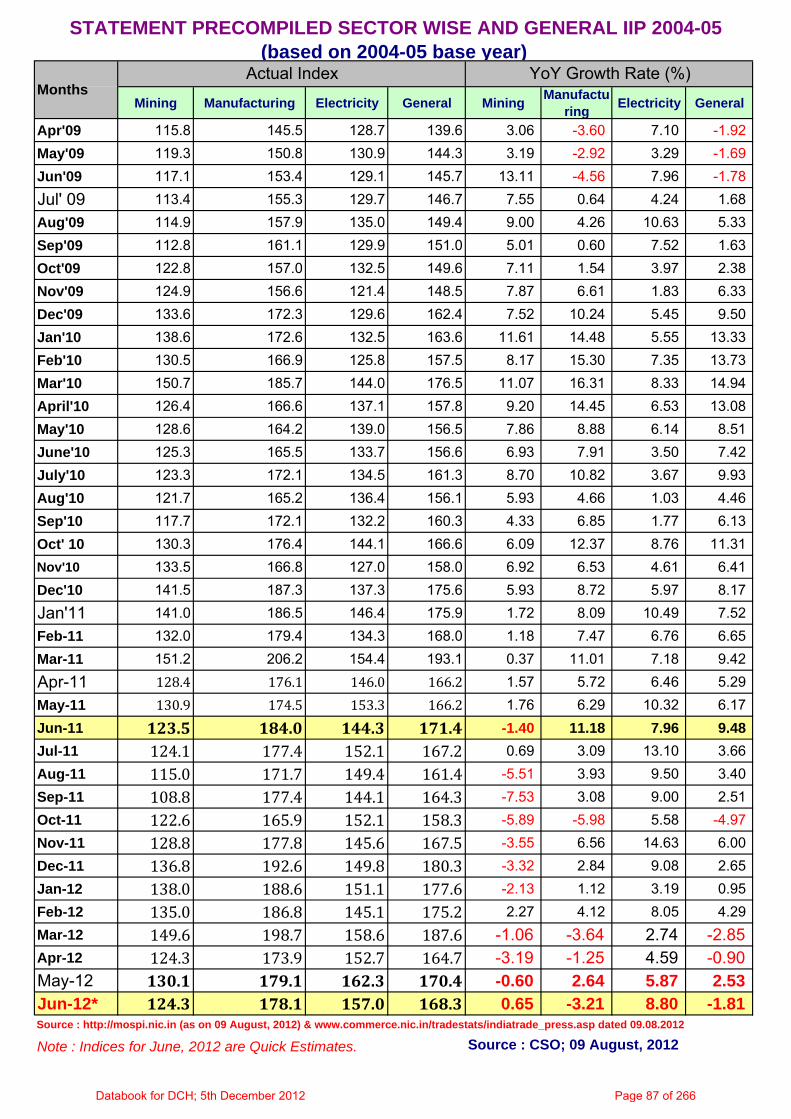
Mining Manufacturing Electricity General MiningManufactu
ringElectricity General
Apr'09 115.8 145.5 128.7 139.6 3.06 -3.60 7.10 -1.92 May'09 119.3 150.8 130.9 144.3 3.19 -2.92 3.29 -1.69 Jun'09 117.1 153.4 129.1 145.7 13.11 -4.56 7.96 -1.78 Jul' 09 113.4 155.3 129.7 146.7 7.55 0.64 4.24 1.68Aug'09 114.9 157.9 135.0 149.4 9.00 4.26 10.63 5.33Sep'09 112.8 161.1 129.9 151.0 5.01 0.60 7.52 1.63Oct'09 122.8 157.0 132.5 149.6 7.11 1.54 3.97 2.38Nov'09 124.9 156.6 121.4 148.5 7.87 6.61 1.83 6.33Dec'09 133.6 172.3 129.6 162.4 7.52 10.24 5.45 9.50Jan'10 138.6 172.6 132.5 163.6 11.61 14.48 5.55 13.33Feb'10 130.5 166.9 125.8 157.5 8.17 15.30 7.35 13.73Mar'10 150.7 185.7 144.0 176.5 11.07 16.31 8.33 14.94April'10 126.4 166.6 137.1 157.8 9.20 14.45 6.53 13.08May'10 128.6 164.2 139.0 156.5 7.86 8.88 6.14 8.51June'10 125.3 165.5 133.7 156.6 6.93 7.91 3.50 7.42July'10 123.3 172.1 134.5 161.3 8.70 10.82 3.67 9.93Aug'10 121.7 165.2 136.4 156.1 5.93 4.66 1.03 4.46Sep'10 117.7 172.1 132.2 160.3 4.33 6.85 1.77 6.13Oct' 10 130.3 176.4 144.1 166.6 6.09 12.37 8.76 11.31Nov'10 133.5 166.8 127.0 158.0 6.92 6.53 4.61 6.41Dec'10 141.5 187.3 137.3 175.6 5.93 8.72 5.97 8.17Jan'11 141.0 186.5 146.4 175.9 1.72 8.09 10.49 7.52Feb-11 132.0 179.4 134.3 168.0 1.18 7.47 6.76 6.65Mar-11 151.2 206.2 154.4 193.1 0.37 11.01 7.18 9.42Apr-11 128.4 176.1 146.0 166.2 1.57 5.72 6.46 5.29May-11 130.9 174.5 153.3 166.2 1.76 6.29 10.32 6.17Jun-11 123.5 184.0 144.3 171.4 -1.40 11.18 7.96 9.48
Jul-11 124.1 177.4 152.1 167.2 0.69 3.09 13.10 3.66Aug-11 115.0 171.7 149.4 161.4 -5.51 3.93 9.50 3.40Sep-11 108.8 177.4 144.1 164.3 -7.53 3.08 9.00 2.51Oct-11 122.6 165.9 152.1 158.3 -5.89 -5.98 5.58 -4.97 Nov-11 128.8 177.8 145.6 167.5 -3.55 6.56 14.63 6.00Dec-11 136.8 192.6 149.8 180.3 -3.32 2.84 9.08 2.65Jan-12 138.0 188.6 151.1 177.6 -2.13 1.12 3.19 0.95Feb-12 135.0 186.8 145.1 175.2 2.27 4.12 8.05 4.29Mar-12 149.6 198.7 158.6 187.6 -1.06 -3.64 2.74 -2.85 Apr-12 124.3 173.9 152.7 164.7 -3.19 -1.25 4.59 -0.90 May-12 130.1 179.1 162.3 170.4 -0.60 2.64 5.87 2.53
Jun-12* 124.3 178.1 157.0 168.3 0.65 -3.21 8.80 -1.81 Source : http://mospi.nic.in (as on 09 August, 2012) & www.commerce.nic.in/tradestats/indiatrade_press.asp dated 09.08.2012
Note : Indices for June, 2012 are Quick Estimates. Source : CSO; 09 August, 2012
Actual Index YoY Growth Rate (%)
STATEMENT PRECOMPILED SECTOR WISE AND GENERAL IIP 2004-05
(based on 2004-05 base year)
Months
Databook for DCH; 5th December 2012 Page 87 of 266
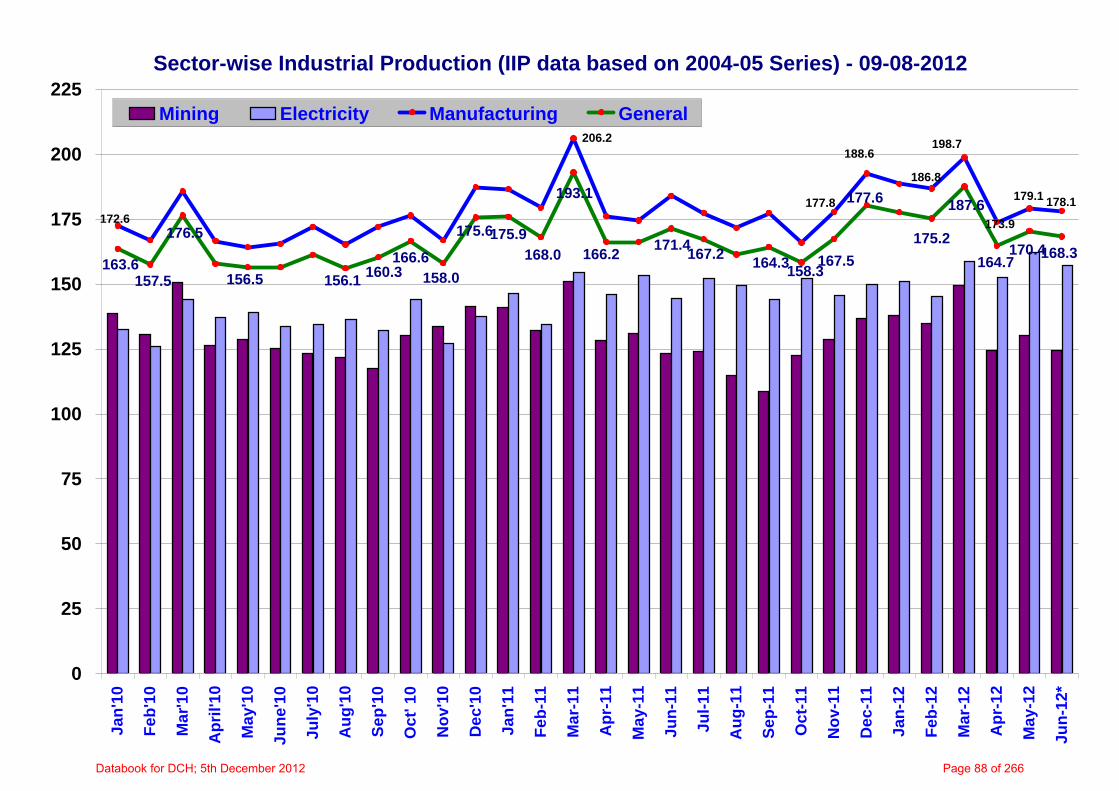
Sector-wise Industrial Production (IIP data based on 2004-05 Series) - 09-08-2012
178.1179.1
173.9
198.7
186.8
188.6
177.8
172.6
206.2
168.3170.4164.7
187.6
175.2
177.6
167.5158.3
164.3167.2
171.4
163.6157.5
176.5
156.5 156.1160.3
166.6
158.0
175.6175.9
168.0
193.1
166.2
0
25
50
75
100
125
150
175
200
225
Ja
n'1
0
Fe
b'1
0
Ma
r'1
0
Ap
ril'1
0
Ma
y'1
0
Ju
ne
'10
Ju
ly'1
0
Au
g'1
0
Se
p'1
0
Oc
t' 1
0
No
v'1
0
De
c'1
0
Ja
n'1
1
Fe
b-1
1
Ma
r-1
1
Ap
r-1
1
Ma
y-1
1
Ju
n-1
1
Ju
l-1
1
Au
g-1
1
Se
p-1
1
Oc
t-1
1
No
v-1
1
De
c-1
1
Ja
n-1
2
Fe
b-1
2
Ma
r-1
2
Ap
r-1
2
Ma
y-1
2
Ju
n-1
2*
Mining Electricity Manufacturing General
Databook for DCH; 5th December 2012 Page 88 of 266
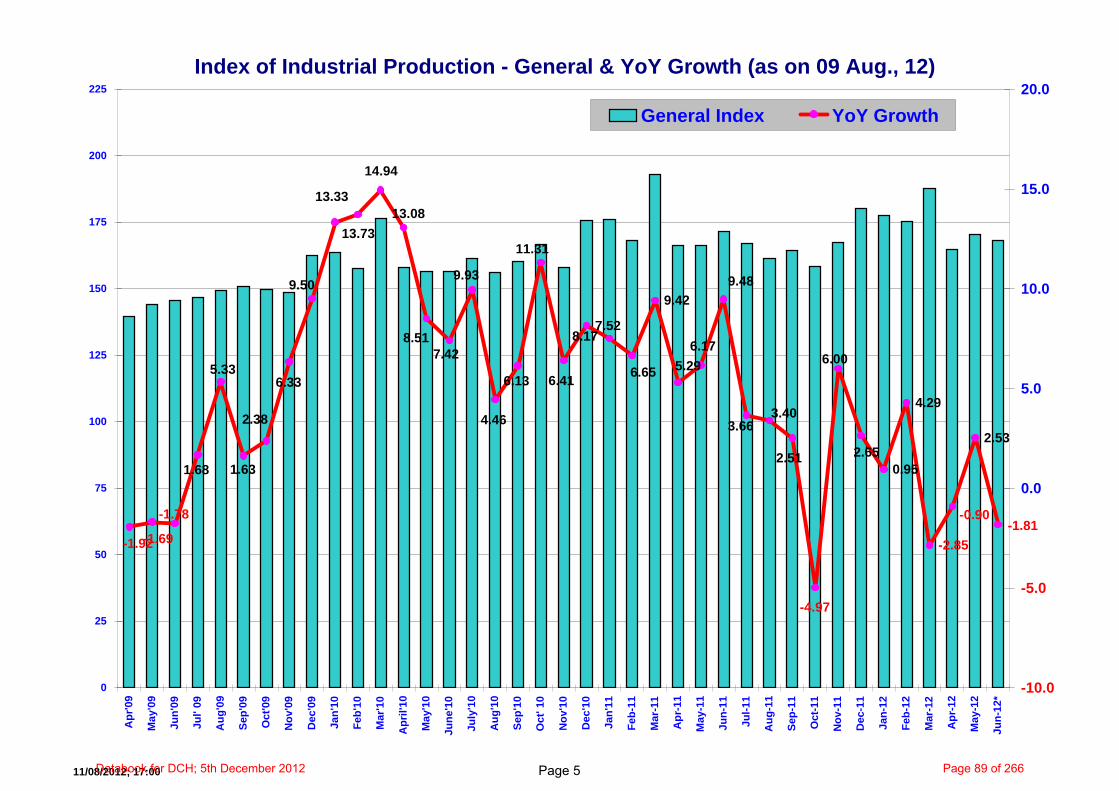
11/08/2012; 17:00 Page 5
Index of Industrial Production - General & YoY Growth (as on 09 Aug., 12)
9.42
0.95
4.29
-2.85
-1.81
2.53
-0.90
2.65
6.176.00
-4.97
3.663.40
2.51
9.48
5.296.65
6.13
11.31
4.46
9.93
7.42
8.51
13.08
14.94
13.73
13.33
9.50
6.33
2.38
1.63
5.33
1.68
-1.78
-1.69 -1.92
6.41
8.177.52
0
25
50
75
100
125
150
175
200
225
Ap
r'09
May'0
9
Ju
n'0
9
Ju
l' 0
9
Au
g'0
9
Sep
'09
Oct'
09
No
v'0
9
Dec'0
9
Jan
'10
Feb
'10
Mar'
10
Ap
ril'10
May'1
0
Ju
ne'1
0
Ju
ly'1
0
Au
g'1
0
Sep
'10
Oct'
10
No
v'1
0
Dec'1
0
Jan
'11
Feb
-11
Mar-
11
Ap
r-11
May-1
1
Ju
n-1
1
Ju
l-11
Au
g-1
1
Sep
-11
Oct-
11
No
v-1
1
Dec-1
1
Jan
-12
Feb
-12
Mar-
12
Ap
r-12
May-1
2
Ju
n-1
2*
-10.0
-5.0
0.0
5.0
10.0
15.0
20.0
General Index YoY Growth
Databook for DCH; 5th December 2012 Page 89 of 266
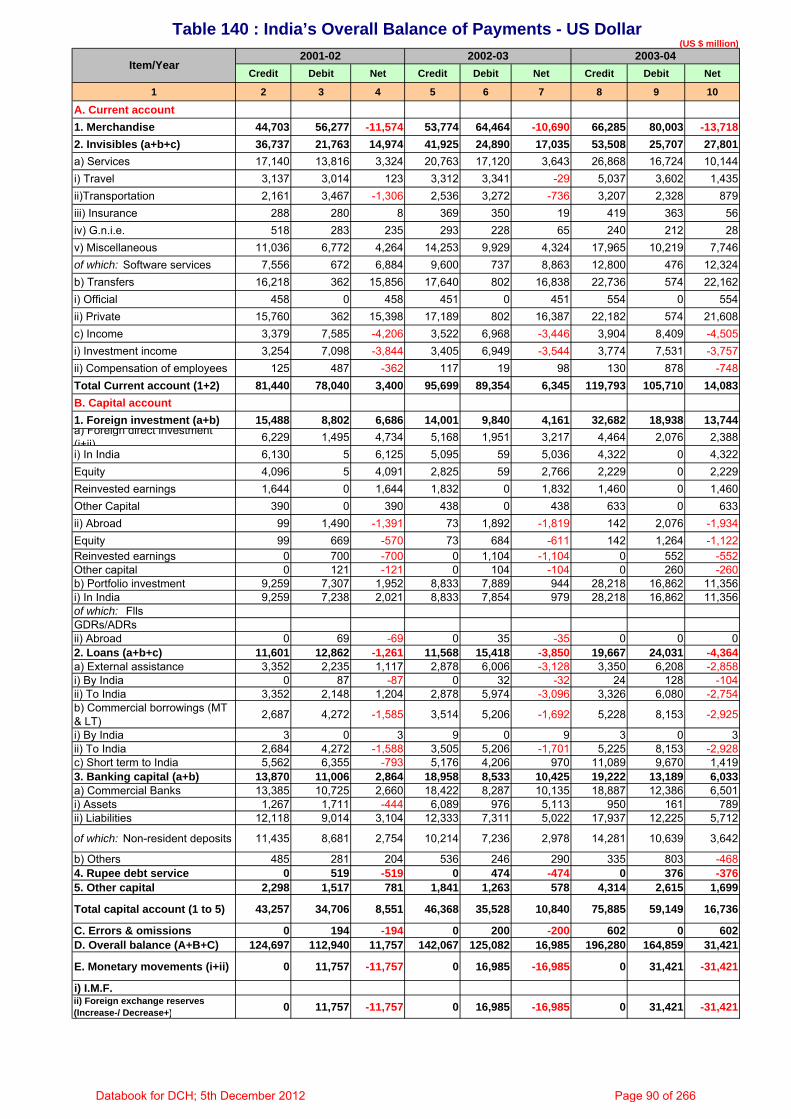
)
Table 140 : India’s Overall Balance of Payments - US Dollar(US $ million
Item/Year2001-02 2002-03 2003-04
Credit Debit Net Credit Debit Net Credit Debit Net
1 2 3 4 5 6 7 8 9 10
A. Current account
1. Merchandise 44,703 56,277 -11,574 53,774 64,464 -10,690 66,285 80,003 -13,718
2. Invisibles (a+b+c) 36,737 21,763 14,974 41,925 24,890 17,035 53,508 25,707 27,801
a) Services 17,140 13,816 3,324 20,763 17,120 3,643 26,868 16,724 10,144 i) Travel 3,137 3,014 123 3,312 3,341 -29 5,037 3,602 1,435 ii)Transportation 2,161 3,467 -1,306 2,536 3,272 -736 3,207 2,328 879 iii) Insurance 288 280 8 369 350 19 419 363 56 iv) G.n.i.e. 518 283 235 293 228 65 240 212 28 v) Miscellaneous 11,036 6,772 4,264 14,253 9,929 4,324 17,965 10,219 7,746 of which: Software services 7,556 672 6,884 9,600 737 8,863 12,800 476 12,324 b) Transfers 16,218 362 15,856 17,640 802 16,838 22,736 574 22,162 i) Official 458 0 458 451 0 451 554 0 554 ii) Private 15,760 362 15,398 17,189 802 16,387 22,182 574 21,608 c) Income 3,379 7,585 -4,206 3,522 6,968 -3,446 3,904 8,409 -4,505 i) Investment income 3,254 7,098 -3,844 3,405 6,949 -3,544 3,774 7,531 -3,757 ii) Compensation of employees 125 487 -362 117 19 98 130 878 -748 Total Current account (1+2) 81,440 78,040 3,400 95,699 89,354 6,345 119,793 105,710 14,083
B. Capital account
1. Foreign investment (a+b) 15,488 8,802 6,686 14,001 9,840 4,161 32,682 18,938 13,744 a) Foreign direct investment 6,229 1,495 4,734 5,168 1,951 3,217 4,464 2,076 2,388 (i+ii)i) In India 6,130 5 6,125 5,095 59 5,036 4,322 0 4,322 Equity 4,096 5 4,091 2,825 59 2,766 2,229 0 2,229 Reinvested earnings 1,644 0 1,644 1,832 0 1,832 1,460 0 1,460 Other Capital 390 0 390 438 0 438 633 0 633 ii) Abroad 99 1,490 -1,391 73 1,892 -1,819 142 2,076 -1,934 Equity 99 669 -570 73 684 -611 142 1,264 -1,122 Reinvested earnings 0 700 -700 0 1,104 -1,104 0 552 -552 Other capital 0 121 -121 0 104 -104 0 260 -260 b) Portfolio investment 9,259 7,307 1,952 8,833 7,889 944 28,218 16,862 11,356 i) In India 9,259 7,238 2,021 8,833 7,854 979 28,218 16,862 11,356 of which: FllsGDRs/ADRsii) Abroad 0 69 -69 0 35 -35 0 0 0 2. Loans (a+b+c) 11,601 12,862 -1,261 11,568 15,418 -3,850 19,667 24,031 -4,364
a) External assistance 3,352 2,235 1,117 2,878 6,006 -3,128 3,350 6,208 -2,858 i) By India 0 87 -87 0 32 -32 24 128 -104 ii) To India 3,352 2,148 1,204 2,878 5,974 -3,096 3,326 6,080 -2,754 b) Commercial borrowings (MT & LT) 2,687 4,272 -1,585 3,514 5,206 -1,692 5,228 8,153 -2,925
i) By India 3 0 3 9 0 9 3 0 3 ii) To India 2,684 4,272 -1,588 3,505 5,206 -1,701 5,225 8,153 -2,928 c) Short term to India 5,562 6,355 -793 5,176 4,206 970 11,089 9,670 1,419 3. Banking capital (a+b) 13,870 11,006 2,864 18,958 8,533 10,425 19,222 13,189 6,033
a) Commercial Banks 13,385 10,725 2,660 18,422 8,287 10,135 18,887 12,386 6,501 i) Assets 1,267 1,711 -444 6,089 976 5,113 950 161 789 ii) Liabilities 12,118 9,014 3,104 12,333 7,311 5,022 17,937 12,225 5,712
of which: Non-resident deposits 11,435 8,681 2,754 10,214 7,236 2,978 14,281 10,639 3,642
b) Others 485 281 204 536 246 290 335 803 -468 4. Rupee debt service 0 519 -519 0 474 -474 0 376 -376
5. Other capital 2,298 1,517 781 1,841 1,263 578 4,314 2,615 1,699
Total capital account (1 to 5) 43,257 34,706 8,551 46,368 35,528 10,840 75,885 59,149 16,736
C. Errors & omissions 0 194 -194 0 200 -200 602 0 602
D. Overall balance (A+B+C) 124,697 112,940 11,757 142,067 125,082 16,985 196,280 164,859 31,421
E. Monetary movements (i+ii) 0 11,757 -11,757 0 16,985 -16,985 0 31,421 -31,421
i) I.M.F.ii) Foreign exchange reserves
(Increase-/ Decrease+)0 11,757 -11,757 0 16,985 -16,985 0 31,421 -31,421
Databook for DCH; 5th December 2012 Page 90 of 266
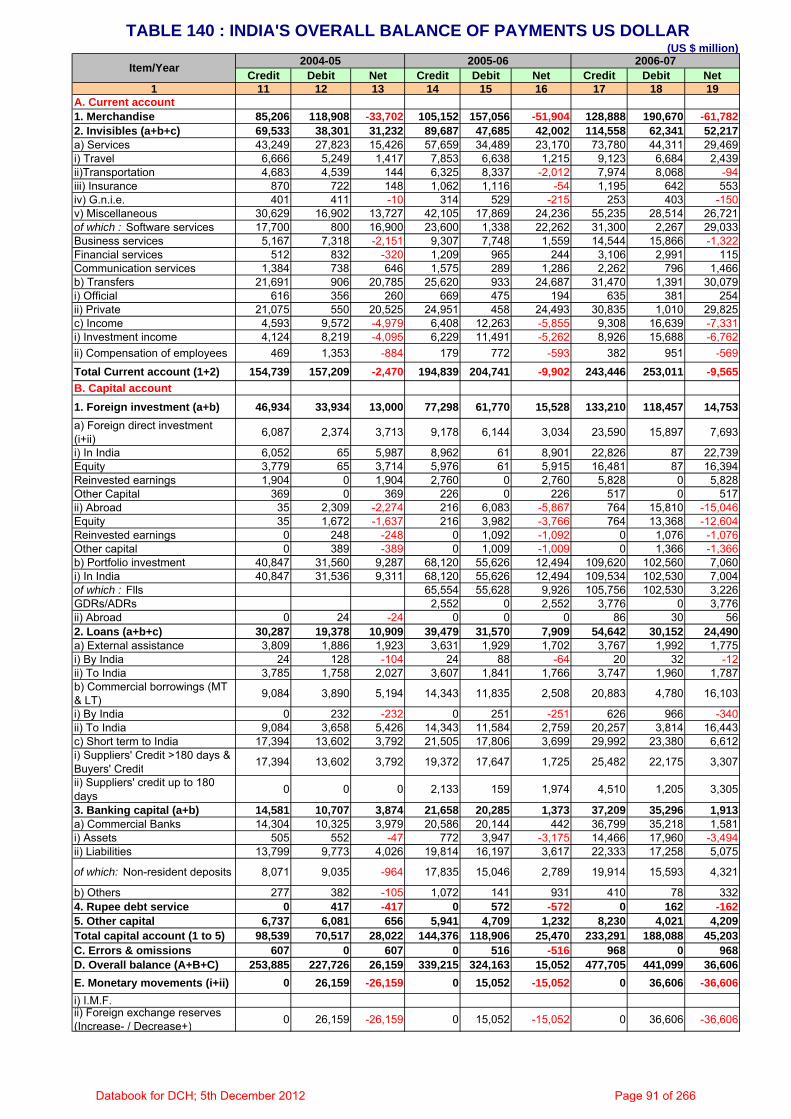
)
TABLE 140 : INDIA'S OVERALL BALANCE OF PAYMENTS US DOLLAR (US $ million
Item/Year2004-05 2005-06 2006-07
Credit Debit Net Credit Debit Net Credit Debit Net
1 11 12 13 14 15 16 17 18 19
A. Current account
1. Merchandise 85,206 118,908 -33,702 105,152 157,056 -51,904 128,888 190,670 -61,782
2. Invisibles (a+b+c) 69,533 38,301 31,232 89,687 47,685 42,002 114,558 62,341 52,217
a) Services 43,249 27,823 15,426 57,659 34,489 23,170 73,780 44,311 29,469 i) Travel 6,666 5,249 1,417 7,853 6,638 1,215 9,123 6,684 2,439 ii)Transportation 4,683 4,539 144 6,325 8,337 -2,012 7,974 8,068 -94 iii) Insurance 870 722 148 1,062 1,116 -54 1,195 642 553 iv) G.n.i.e. 401 411 -10 314 529 -215 253 403 -150 v) Miscellaneous 30,629 16,902 13,727 42,105 17,869 24,236 55,235 28,514 26,721 of which : Software services 17,700 800 16,900 23,600 1,338 22,262 31,300 2,267 29,033 Business services 5,167 7,318 -2,151 9,307 7,748 1,559 14,544 15,866 -1,322 Financial services 512 832 -320 1,209 965 244 3,106 2,991 115 Communication services 1,384 738 646 1,575 289 1,286 2,262 796 1,466 b) Transfers 21,691 906 20,785 25,620 933 24,687 31,470 1,391 30,079 i) Official 616 356 260 669 475 194 635 381 254 ii) Private 21,075 550 20,525 24,951 458 24,493 30,835 1,010 29,825 c) Income 4,593 9,572 -4,979 6,408 12,263 -5,855 9,308 16,639 -7,331 i) Investment income 4,124 8,219 -4,095 6,229 11,491 -5,262 8,926 15,688 -6,762 ii) Compensation of employees 469 1,353 -884 179 772 -593 382 951 -569
Total Current account (1+2) 154,739 157,209 -2,470 194,839 204,741 -9,902 243,446 253,011 -9,565
B. Capital account
1. Foreign investment (a+b) 46,934 33,934 13,000 77,298 61,770 15,528 133,210 118,457 14,753
a) Foreign direct investment (i+ii) 6,087 2,374 3,713 9,178 6,144 3,034 23,590 15,897 7,693
i) In India 6,052 65 5,987 8,962 61 8,901 22,826 87 22,739 Equity 3,779 65 3,714 5,976 61 5,915 16,481 87 16,394 Reinvested earnings 1,904 0 1,904 2,760 0 2,760 5,828 0 5,828 Other Capital 369 0 369 226 0 226 517 0 517 ii) Abroad 35 2,309 -2,274 216 6,083 -5,867 764 15,810 -15,046 Equity 35 1,672 -1,637 216 3,982 -3,766 764 13,368 -12,604 Reinvested earnings 0 248 -248 0 1,092 -1,092 0 1,076 -1,076 Other capital 0 389 -389 0 1,009 -1,009 0 1,366 -1,366 b) Portfolio investment 40,847 31,560 9,287 68,120 55,626 12,494 109,620 102,560 7,060 i) In India 40,847 31,536 9,311 68,120 55,626 12,494 109,534 102,530 7,004 of which : Flls 65,554 55,628 9,926 105,756 102,530 3,226 GDRs/ADRs 2,552 0 2,552 3,776 0 3,776 ii) Abroad 0 24 -24 0 0 0 86 30 56 2. Loans (a+b+c) 30,287 19,378 10,909 39,479 31,570 7,909 54,642 30,152 24,490
a) External assistance 3,809 1,886 1,923 3,631 1,929 1,702 3,767 1,992 1,775 i) By India 24 128 -104 24 88 -64 20 32 -12 ii) To India 3,785 1,758 2,027 3,607 1,841 1,766 3,747 1,960 1,787 b) Commercial borrowings (MT & LT) 9,084 3,890 5,194 14,343 11,835 2,508 20,883 4,780 16,103
i) By India 0 232 -232 0 251 -251 626 966 -340 ii) To India 9,084 3,658 5,426 14,343 11,584 2,759 20,257 3,814 16,443 c) Short term to India 17,394 13,602 3,792 21,505 17,806 3,699 29,992 23,380 6,612 i) Suppliers' Credit >180 days & Buyers' Credit 17,394 13,602 3,792 19,372 17,647 1,725 25,482 22,175 3,307
ii) Suppliers' credit up to 180 days 0 0 0 2,133 159 1,974 4,510 1,205 3,305
3. Banking capital (a+b) 14,581 10,707 3,874 21,658 20,285 1,373 37,209 35,296 1,913
a) Commercial Banks 14,304 10,325 3,979 20,586 20,144 442 36,799 35,218 1,581 i) Assets 505 552 -47 772 3,947 -3,175 14,466 17,960 -3,494 ii) Liabilities 13,799 9,773 4,026 19,814 16,197 3,617 22,333 17,258 5,075
of which: Non-resident deposits 8,071 9,035 -964 17,835 15,046 2,789 19,914 15,593 4,321
b) Others 277 382 -105 1,072 141 931 410 78 332 4. Rupee debt service 0 417 -417 0 572 -572 0 162 -162
5. Other capital 6,737 6,081 656 5,941 4,709 1,232 8,230 4,021 4,209
Total capital account (1 to 5) 98,539 70,517 28,022 144,376 118,906 25,470 233,291 188,088 45,203
C. Errors & omissions 607 0 607 0 516 -516 968 0 968
D. Overall balance (A+B+C) 253,885 227,726 26,159 339,215 324,163 15,052 477,705 441,099 36,606
E. Monetary movements (i+ii) 0 26,159 -26,159 0 15,052 -15,052 0 36,606 -36,606
i) I.M.F.ii) Foreign exchange reserves (Increase- / Decrease+) 0 26,159 -26,159 0 15,052 -15,052 0 36,606 -36,606
Databook for DCH; 5th December 2012 Page 91 of 266
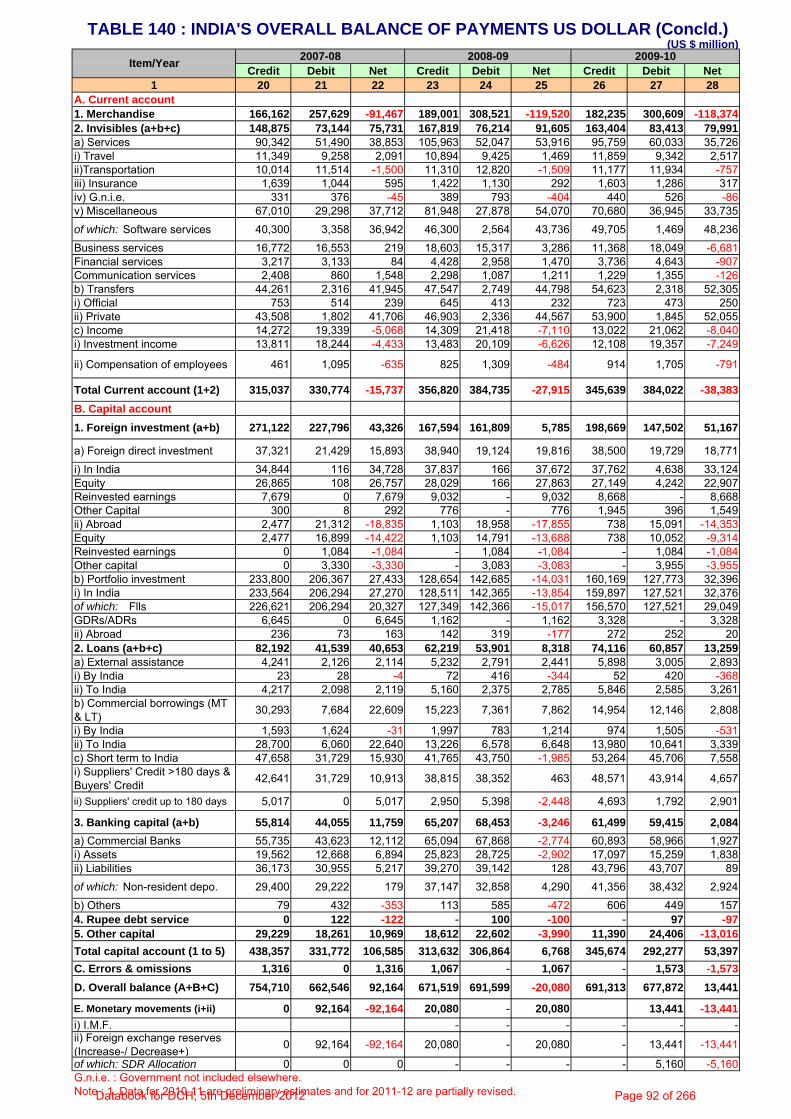
)
TABLE 140 : INDIA'S OVERALL BALANCE OF PAYMENTS US DOLLAR (Concld.)(US $ million
Item/Year2007-08 2008-09 2009-10
Credit Debit Net Credit Debit Net Credit Debit Net
1 20 21 22 23 24 25 26 27 28
A. Current account
1. Merchandise 166,162 257,629 -91,467 189,001 308,521 -119,520 182,235 300,609 -118,374
2. Invisibles (a+b+c) 148,875 73,144 75,731 167,819 76,214 91,605 163,404 83,413 79,991
a) Services 90,342 51,490 38,853 105,963 52,047 53,916 95,759 60,033 35,726 i) Travel 11,349 9,258 2,091 10,894 9,425 1,469 11,859 9,342 2,517 ii)Transportation 10,014 11,514 -1,500 11,310 12,820 -1,509 11,177 11,934 -757 iii) Insurance 1,639 1,044 595 1,422 1,130 292 1,603 1,286 317 iv) G.n.i.e. 331 376 -45 389 793 -404 440 526 -86 v) Miscellaneous 67,010 29,298 37,712 81,948 27,878 54,070 70,680 36,945 33,735 of which: Software services 40,300 3,358 36,942 46,300 2,564 43,736 49,705 1,469 48,236 Business services 16,772 16,553 219 18,603 15,317 3,286 11,368 18,049 -6,681 Financial services 3,217 3,133 84 4,428 2,958 1,470 3,736 4,643 -907 Communication services 2,408 860 1,548 2,298 1,087 1,211 1,229 1,355 -126 b) Transfers 44,261 2,316 41,945 47,547 2,749 44,798 54,623 2,318 52,305 i) Official 753 514 239 645 413 232 723 473 250 ii) Private 43,508 1,802 41,706 46,903 2,336 44,567 53,900 1,845 52,055 c) Income 14,272 19,339 -5,068 14,309 21,418 -7,110 13,022 21,062 -8,040 i) Investment income 13,811 18,244 -4,433 13,483 20,109 -6,626 12,108 19,357 -7,249
ii) Compensation of employees 461 1,095 -635 825 1,309 -484 914 1,705 -791
Total Current account (1+2) 315,037 330,774 -15,737 356,820 384,735 -27,915 345,639 384,022 -38,383
B. Capital account
1. Foreign investment (a+b) 271,122 227,796 43,326 167,594 161,809 5,785 198,669 147,502 51,167
a) Foreign direct investment 37,321 21,429 15,893 38,940 19,124 19,816 38,500 19,729 18,771 i) In India 34,844 116 34,728 37,837 166 37,672 37,762 4,638 33,124 Equity 26,865 108 26,757 28,029 166 27,863 27,149 4,242 22,907 Reinvested earnings 7,679 0 7,679 9,032 - 9,032 8,668 - 8,668 Other Capital 300 8 292 776 - 776 1,945 396 1,549 ii) Abroad 2,477 21,312 -18,835 1,103 18,958 -17,855 738 15,091 -14,353 Equity 2,477 16,899 -14,422 1,103 14,791 -13,688 738 10,052 -9,314 Reinvested earnings 0 1,084 -1,084 - 1,084 -1,084 - 1,084 -1,084 Other capital 0 3,330 -3,330 - 3,083 -3,083 - 3,955 -3,955 b) Portfolio investment 233,800 206,367 27,433 128,654 142,685 -14,031 160,169 127,773 32,396 i) In India 233,564 206,294 27,270 128,511 142,365 -13,854 159,897 127,521 32,376 of which: Flls 226,621 206,294 20,327 127,349 142,366 -15,017 156,570 127,521 29,049 GDRs/ADRs 6,645 0 6,645 1,162 - 1,162 3,328 - 3,328 ii) Abroad 236 73 163 142 319 -177 272 252 20 2. Loans (a+b+c) 82,192 41,539 40,653 62,219 53,901 8,318 74,116 60,857 13,259
a) External assistance 4,241 2,126 2,114 5,232 2,791 2,441 5,898 3,005 2,893 i) By India 23 28 -4 72 416 -344 52 420 -368 ii) To India 4,217 2,098 2,119 5,160 2,375 2,785 5,846 2,585 3,261 b) Commercial borrowings (MT & LT) 30,293 7,684 22,609 15,223 7,361 7,862 14,954 12,146 2,808
i) By India 1,593 1,624 -31 1,997 783 1,214 974 1,505 -531 ii) To India 28,700 6,060 22,640 13,226 6,578 6,648 13,980 10,641 3,339 c) Short term to India 47,658 31,729 15,930 41,765 43,750 -1,985 53,264 45,706 7,558 i) Suppliers' Credit >180 days & Buyers' Credit 42,641 31,729 10,913 38,815 38,352 463 48,571 43,914 4,657
ii) Suppliers' credit up to 180 days 5,017 0 5,017 2,950 5,398 -2,448 4,693 1,792 2,901
3. Banking capital (a+b) 55,814 44,055 11,759 65,207 68,453 -3,246 61,499 59,415 2,084
a) Commercial Banks 55,735 43,623 12,112 65,094 67,868 -2,774 60,893 58,966 1,927 i) Assets 19,562 12,668 6,894 25,823 28,725 -2,902 17,097 15,259 1,838 ii) Liabilities 36,173 30,955 5,217 39,270 39,142 128 43,796 43,707 89 of which: Non-resident depo. 29,400 29,222 179 37,147 32,858 4,290 41,356 38,432 2,924 b) Others 79 432 -353 113 585 -472 606 449 157 4. Rupee debt service 0 122 -122 - 100 -100 - 97 -97
5. Other capital 29,229 18,261 10,969 18,612 22,602 -3,990 11,390 24,406 -13,016
Total capital account (1 to 5) 438,357 331,772 106,585 313,632 306,864 6,768 345,674 292,277 53,397
C. Errors & omissions 1,316 0 1,316 1,067 - 1,067 - 1,573 -1,573
D. Overall balance (A+B+C) 754,710 662,546 92,164 671,519 691,599 -20,080 691,313 677,872 13,441
E. Monetary movements (i+ii) 0 92,164 -92,164 20,080 - 20,080 13,441 -13,441
i) I.M.F. - - - - - -ii) Foreign exchange reserves (Increase-/ Decrease+) 0 92,164 -92,164 20,080 - 20,080 - 13,441 -13,441
of which: SDR Allocation 0 0 0 - - - - 5,160 -5,160 G.n.i.e. : Government not included elsewhere.Note : 1. Data for 2010-11 are preliminary estimates and for 2011-12 are partially revised.Databook for DCH; 5th December 2012 Page 92 of 266
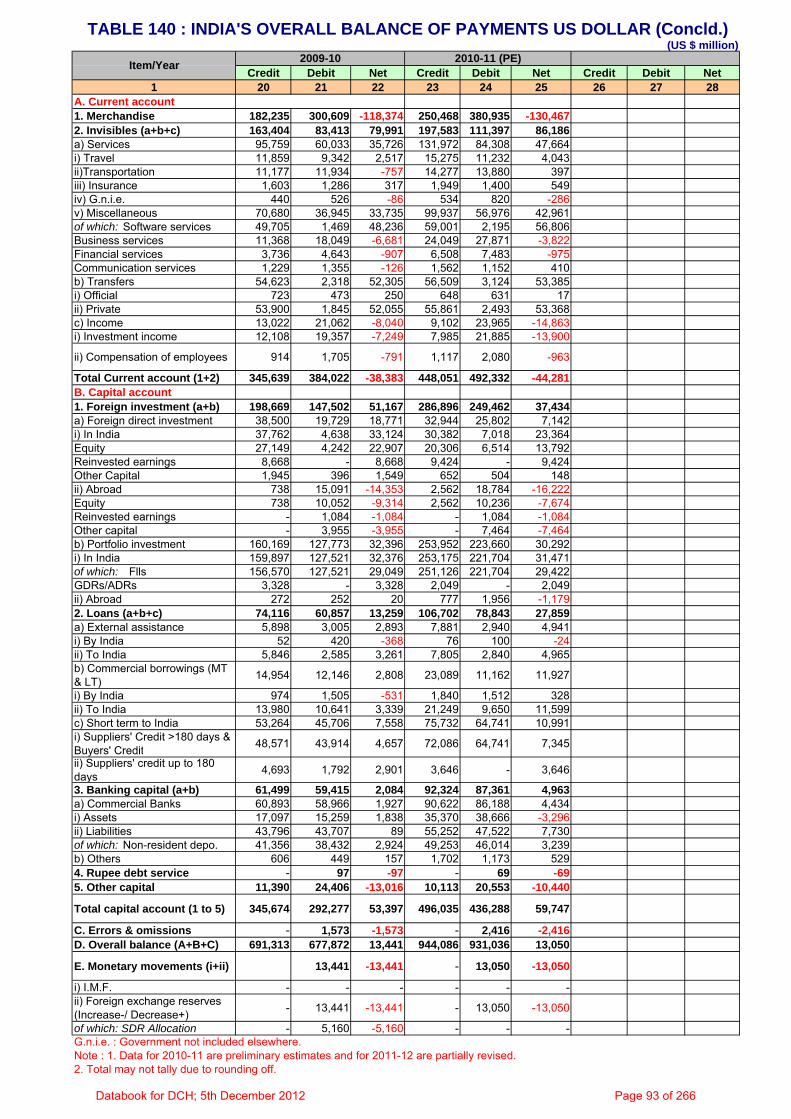
2. Total may not tally due to rounding off.
)
TABLE 140 : INDIA'S OVERALL BALANCE OF PAYMENTS US DOLLAR (Concld.)
Item/Year
(US $ million2009-10 2010-11 (PE)
Credit Debit Net Credit Debit Net Credit Debit Net
1 20 21 22 23 24 25 26 27 28
A. Current account
1. Merchandise 182,235 300,609 -118,374 250,468 380,935 -130,467
2. Invisibles (a+b+c) 163,404 83,413 79,991 197,583 111,397 86,186
a) Services 95,759 60,033 35,726 131,972 84,308 47,664 i) Travel 11,859 9,342 2,517 15,275 11,232 4,043 ii)Transportation 11,177 11,934 -757 14,277 13,880 397 iii) Insurance 1,603 1,286 317 1,949 1,400 549 iv) G.n.i.e. 440 526 -86 534 820 -286 v) Miscellaneous 70,680 36,945 33,735 99,937 56,976 42,961 of which: Software services 49,705 1,469 48,236 59,001 2,195 56,806 Business services 11,368 18,049 -6,681 24,049 27,871 -3,822 Financial services 3,736 4,643 -907 6,508 7,483 -975 Communication services 1,229 1,355 -126 1,562 1,152 410 b) Transfers 54,623 2,318 52,305 56,509 3,124 53,385 i) Official 723 473 250 648 631 17 ii) Private 53,900 1,845 52,055 55,861 2,493 53,368 c) Income 13,022 21,062 -8,040 9,102 23,965 -14,863 i) Investment income
ii) Compensation of employees
12,108
914
19,357
1,705
-7,249
-791
7,985
1,117
21,885
2,080
-13,900
-963
Total Current account (1+2) 345,639 384,022 -38,383 448,051 492,332 -44,281
B. Capital account
1. Foreign investment (a+b) 198,669 147,502 51,167 286,896 249,462 37,434
a) Foreign direct investment 38,500 19,729 18,771 32,944 25,802 7,142 i) In India 37,762 4,638 33,124 30,382 7,018 23,364 Equity 27,149 4,242 22,907 20,306 6,514 13,792 Reinvested earnings 8,668 - 8,668 9,424 - 9,424 Other Capital 1,945 396 1,549 652 504 148 ii) Abroad 738 15,091 -14,353 2,562 18,784 -16,222 Equity 738 10,052 -9,314 2,562 10,236 -7,674 Reinvested earnings - 1,084 -1,084 - 1,084 -1,084 Other capital - 3,955 -3,955 - 7,464 -7,464 b) Portfolio investment 160,169 127,773 32,396 253,952 223,660 30,292 i) In India 159,897 127,521 32,376 253,175 221,704 31,471 of which: Flls 156,570 127,521 29,049 251,126 221,704 29,422 GDRs/ADRs 3,328 - 3,328 2,049 - 2,049 ii) Abroad 272 252 20 777 1,956 -1,179 2. Loans (a+b+c) 74,116 60,857 13,259 106,702 78,843 27,859
a) External assistance 5,898 3,005 2,893 7,881 2,940 4,941 i) By India 52 420 -368 76 100 -24 ii) To Indiab) Commercial borrowings (MT
5,846
14,954
2,585
12,146
3,261
2,808
7,805
23,089
2,840
11,162
4,965
11,927 & LT)i) By India 974 1,505 -531 1,840 1,512 328 ii) To India 13,980 10,641 3,339 21,249 9,650 11,599 c) Short term to Indiai) Suppliers' Credit >180 days &
53,264
48,571
45,706
43,914
7,558
4,657
75,732
72,086
64,741
64,741
10,991
7,345 Buyers' Creditii) Suppliers' credit up to 180 4,693 1,792 2,901 3,646 - 3,646 days3. Banking capital (a+b) 61,499 59,415 2,084 92,324 87,361 4,963
a) Commercial Banks 60,893 58,966 1,927 90,622 86,188 4,434 i) Assets 17,097 15,259 1,838 35,370 38,666 -3,296 ii) Liabilities 43,796 43,707 89 55,252 47,522 7,730 of which: Non-resident depo. 41,356 38,432 2,924 49,253 46,014 3,239 b) Others 606 449 157 1,702 1,173 529 4. Rupee debt service - 97 -97 - 69 -69
5. Other capital
Total capital account (1 to 5)
11,390
345,674
24,406
292,277
-13,016
53,397
10,113
496,035
20,553
436,288
-10,440
59,747
C. Errors & omissions - 1,573 -1,573 - 2,416 -2,416
D. Overall balance (A+B+C) 691,313
E. Monetary movements (i+ii)
677,872
13,441
13,441
-13,441
944,086
-
931,036
13,050
13,050
-13,050
i) I.M.F.ii) Foreign exchange reserves
-
-
-
13,441
-
-13,441
-
-
-
13,050
-
-13,050 (Increase-/ Decrease+)of which: SDR Allocation - 5,160 -5,160 - - -G.n.i.e. : Government not included elsewhere.Note : 1. Data for 2010-11 are preliminary estimates and for 2011-12 are partially revised.
Databook for DCH; 5th December 2012 Page 93 of 266
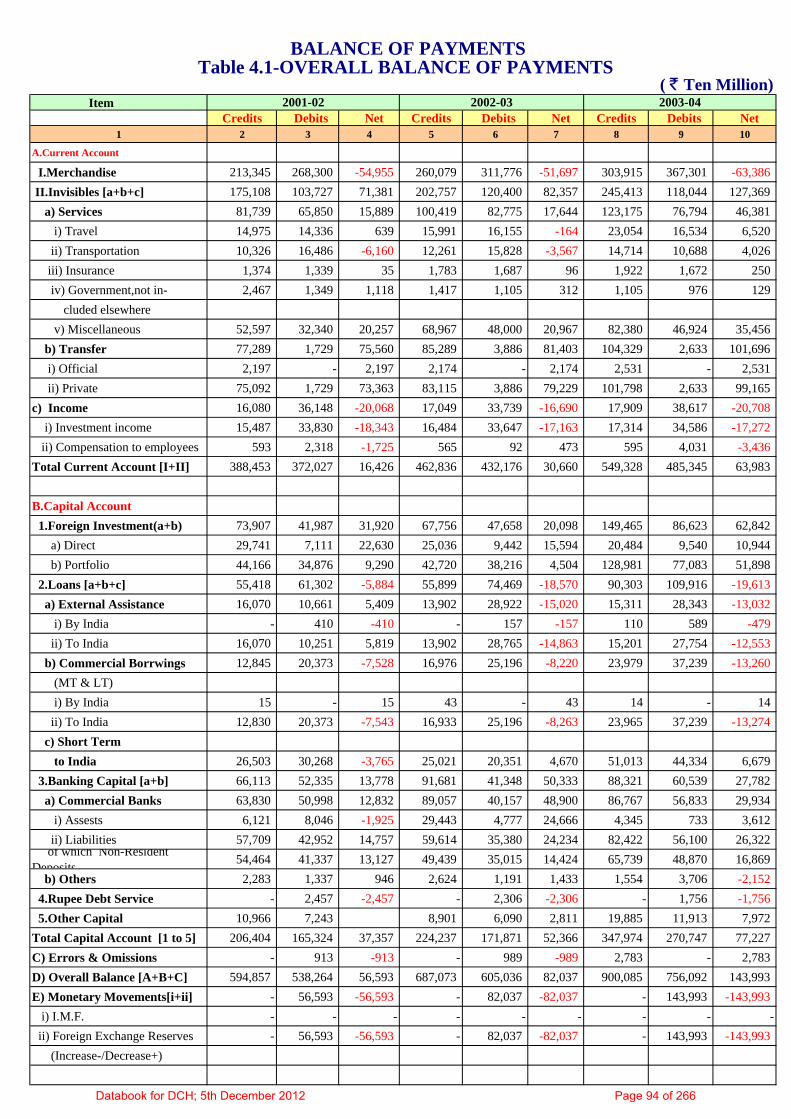
BALANCE OF PAYMENTS Table 4.1-OVERALL BALANCE OF PAYMENTS
( ` Ten Million) Item 2001-02 2002-03 2003-04
Credits Debits Net Credits Debits Net Credits Debits Net1 2 3 4 5 6 7 8 9 10
A.Current Account
I.Merchandise 213,345 268,300 -54,955 260,079 311,776 -51,697 303,915 367,301 -63,386 II.Invisibles [a+b+c] 175,108 103,727 71,381 202,757 120,400 82,357 245,413 118,044 127,369 a) Services 81,739 65,850 15,889 100,419 82,775 17,644 123,175 76,794 46,381 i) Travel 14,975 14,336 639 15,991 16,155 -164 23,054 16,534 6,520 ii) Transportation 10,326 16,486 -6,160 12,261 15,828 -3,567 14,714 10,688 4,026 iii) Insurance 1,374 1,339 35 1,783 1,687 96 1,922 1,672 250 iv) Government,not in- 2,467 1,349 1,118 1,417 1,105 312 1,105 976 129 cluded elsewhere v) Miscellaneous 52,597 32,340 20,257 68,967 48,000 20,967 82,380 46,924 35,456 b) Transfer 77,289 1,729 75,560 85,289 3,886 81,403 104,329 2,633 101,696 i) Official 2,197 - 2,197 2,174 - 2,174 2,531 - 2,531 ii) Private 75,092 1,729 73,363 83,115 3,886 79,229 101,798 2,633 99,165c) Income 16,080 36,148 -20,068 17,049 33,739 -16,690 17,909 38,617 -20,708 i) Investment income 15,487 33,830 -18,343 16,484 33,647 -17,163 17,314 34,586 -17,272 ii) Compensation to employees 593 2,318 -1,725 565 92 473 595 4,031 -3,436 Total Current Account [I+II] 388,453 372,027 16,426 462,836 432,176 30,660 549,328 485,345 63,983
B.Capital Account 1.Foreign Investment(a+b) 73,907 41,987 31,920 67,756 47,658 20,098 149,465 86,623 62,842 a) Direct 29,741 7,111 22,630 25,036 9,442 15,594 20,484 9,540 10,944 b) Portfolio 44,166 34,876 9,290 42,720 38,216 4,504 128,981 77,083 51,898 2.Loans [a+b+c] 55,418 61,302 -5,884 55,899 74,469 -18,570 90,303 109,916 -19,613 a) External Assistance 16,070 10,661 5,409 13,902 28,922 -15,020 15,311 28,343 -13,032 i) By India - 410 -410 - 157 -157 110 589 -479 ii) To India 16,070 10,251 5,819 13,902 28,765 -14,863 15,201 27,754 -12,553 b) Commercial Borrwings 12,845 20,373 -7,528 16,976 25,196 -8,220 23,979 37,239 -13,260 (MT & LT) i) By India 15 - 15 43 - 43 14 - 14 ii) To India 12,830 20,373 -7,543 16,933 25,196 -8,263 23,965 37,239 -13,274 c) Short Term to India 26,503 30,268 -3,765 25,021 20,351 4,670 51,013 44,334 6,679 3.Banking Capital [a+b] 66,113 52,335 13,778 91,681 41,348 50,333 88,321 60,539 27,782 a) Commercial Banks 63,830 50,998 12,832 89,057 40,157 48,900 86,767 56,833 29,934 i) Assests 6,121 8,046 -1,925 29,443 4,777 24,666 4,345 733 3,612 ii) Liabilities 57,709 42,952 14,757 59,614 35,380 24,234 82,422 56,100 26,322 of which Non-Resident 54,464 41,337 13,127 49,439 35,015 14,424 65,739 48,870 16,869Deposits b) Others 2,283 1,337 946 2,624 1,191 1,433 1,554 3,706 -2,152 4.Rupee Debt Service - 2,457 -2,457 - 2,306 -2,306 - 1,756 -1,756 5.Other Capital 10,966 7,243 8,901 6,090 2,811 19,885 11,913 7,972Total Capital Account [1 to 5] 206,404 165,324 37,357 224,237 171,871 52,366 347,974 270,747 77,227C) Errors & Omissions - 913 -913 - 989 -989 2,783 - 2,783D) Overall Balance [A+B+C] 594,857 538,264 56,593 687,073 605,036 82,037 900,085 756,092 143,993E) Monetary Movements[i+ii] - 56,593 -56,593 - 82,037 -82,037 - 143,993 -143,993 i) I.M.F. - - - - - - - - - ii) Foreign Exchange Reserves - 56,593 -56,593 - 82,037 -82,037 - 143,993 -143,993 (Increase-/Decrease+)
Databook for DCH; 5th December 2012 Page 94 of 266
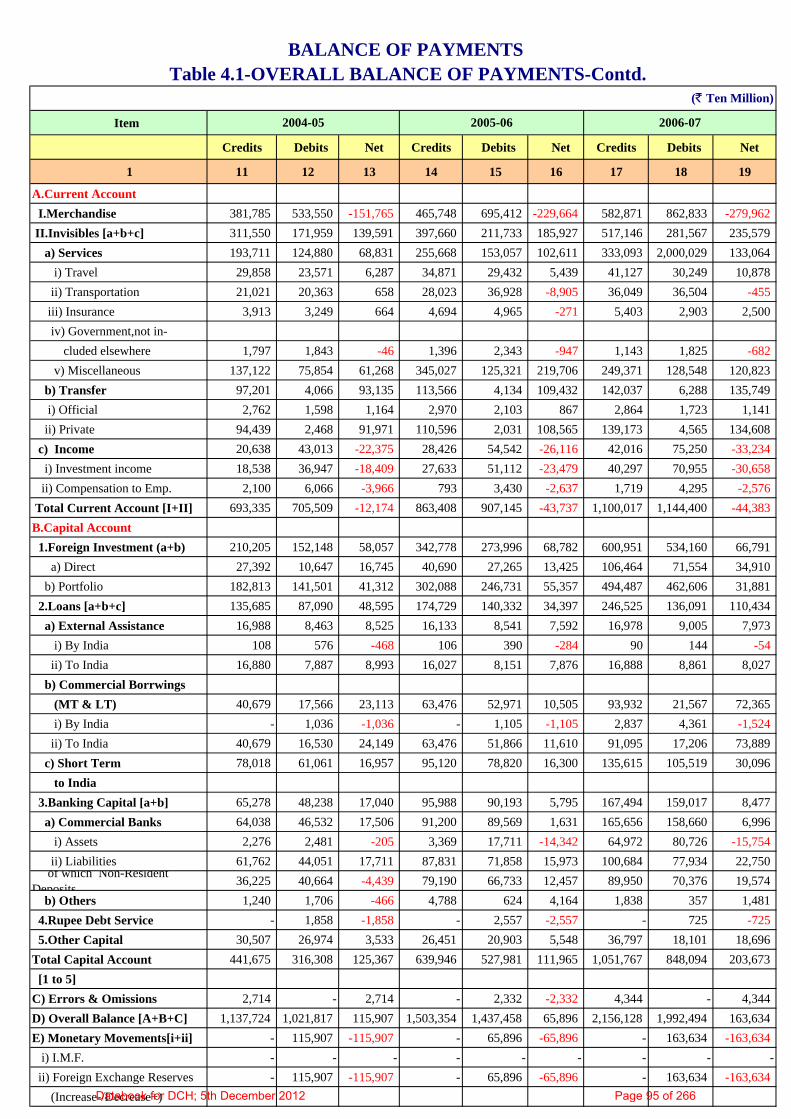
BALANCE OF PAYMENTS Table 4.1-OVERALL BALANCE OF PAYMENTS-Contd.
(` Ten Million)
Item 2004-05 2005-06 2006-07
Credits Debits Net Credits Debits Net Credits Debits Net
1 11 12 13 14 15 16 17 18 19
A.Current Account I.Merchandise 381,785 533,550 -151,765 465,748 695,412 -229,664 582,871 862,833 -279,962 II.Invisibles [a+b+c] 311,550 171,959 139,591 397,660 211,733 185,927 517,146 281,567 235,579 a) Services 193,711 124,880 68,831 255,668 153,057 102,611 333,093 2,000,029 133,064 i) Travel 29,858 23,571 6,287 34,871 29,432 5,439 41,127 30,249 10,878 ii) Transportation 21,021 20,363 658 28,023 36,928 -8,905 36,049 36,504 -455 iii) Insurance 3,913 3,249 664 4,694 4,965 -271 5,403 2,903 2,500 iv) Government,not in- cluded elsewhere 1,797 1,843 -46 1,396 2,343 -947 1,143 1,825 -682 v) Miscellaneous 137,122 75,854 61,268 345,027 125,321 219,706 249,371 128,548 120,823 b) Transfer 97,201 4,066 93,135 113,566 4,134 109,432 142,037 6,288 135,749 i) Official 2,762 1,598 1,164 2,970 2,103 867 2,864 1,723 1,141 ii) Private 94,439 2,468 91,971 110,596 2,031 108,565 139,173 4,565 134,608 c) Income 20,638 43,013 -22,375 28,426 54,542 -26,116 42,016 75,250 -33,234 i) Investment income 18,538 36,947 -18,409 27,633 51,112 -23,479 40,297 70,955 -30,658 ii) Compensation to Emp. 2,100 6,066 -3,966 793 3,430 -2,637 1,719 4,295 -2,576 Total Current Account [I+II] 693,335 705,509 -12,174 863,408 907,145 -43,737 1,100,017 1,144,400 -44,383 B.Capital Account 1.Foreign Investment (a+b) 210,205 152,148 58,057 342,778 273,996 68,782 600,951 534,160 66,791 a) Direct 27,392 10,647 16,745 40,690 27,265 13,425 106,464 71,554 34,910 b) Portfolio 182,813 141,501 41,312 302,088 246,731 55,357 494,487 462,606 31,881 2.Loans [a+b+c] 135,685 87,090 48,595 174,729 140,332 34,397 246,525 136,091 110,434 a) External Assistance 16,988 8,463 8,525 16,133 8,541 7,592 16,978 9,005 7,973 i) By India 108 576 -468 106 390 -284 90 144 -54 ii) To India 16,880 7,887 8,993 16,027 8,151 7,876 16,888 8,861 8,027 b) Commercial Borrwings (MT & LT) 40,679 17,566 23,113 63,476 52,971 10,505 93,932 21,567 72,365 i) By India - 1,036 -1,036 - 1,105 -1,105 2,837 4,361 -1,524 ii) To India 40,679 16,530 24,149 63,476 51,866 11,610 91,095 17,206 73,889 c) Short Term 78,018 61,061 16,957 95,120 78,820 16,300 135,615 105,519 30,096 to India 3.Banking Capital [a+b] 65,278 48,238 17,040 95,988 90,193 5,795 167,494 159,017 8,477 a) Commercial Banks 64,038 46,532 17,506 91,200 89,569 1,631 165,656 158,660 6,996 i) Assets 2,276 2,481 -205 3,369 17,711 -14,342 64,972 80,726 -15,754 ii) Liabilities 61,762 44,051 17,711 87,831 71,858 15,973 100,684 77,934 22,750 of which Non-Resident 36,225 40,664 -4,439 79,190 66,733 12,457 89,950 70,376 19,574Deposits b) Others 1,240 1,706 -466 4,788 624 4,164 1,838 357 1,481 4.Rupee Debt Service - 1,858 -1,858 - 2,557 -2,557 - 725 -725 5.Other Capital 30,507 26,974 3,533 26,451 20,903 5,548 36,797 18,101 18,696Total Capital Account 441,675 316,308 125,367 639,946 527,981 111,965 1,051,767 848,094 203,673 [1 to 5]C) Errors & Omissions 2,714 - 2,714 - 2,332 -2,332 4,344 - 4,344D) Overall Balance [A+B+C] 1,137,724 1,021,817 115,907 1,503,354 1,437,458 65,896 2,156,128 1,992,494 163,634E) Monetary Movements[i+ii] - 115,907 -115,907 - 65,896 -65,896 - 163,634 -163,634 i) I.M.F. - - - - - - - - - ii) Foreign Exchange Reserves - 115,907 -115,907 - 65,896 -65,896 - 163,634 -163,634 (Increase-/Decrease+)Databook for DCH; 5th December 2012 Page 95 of 266
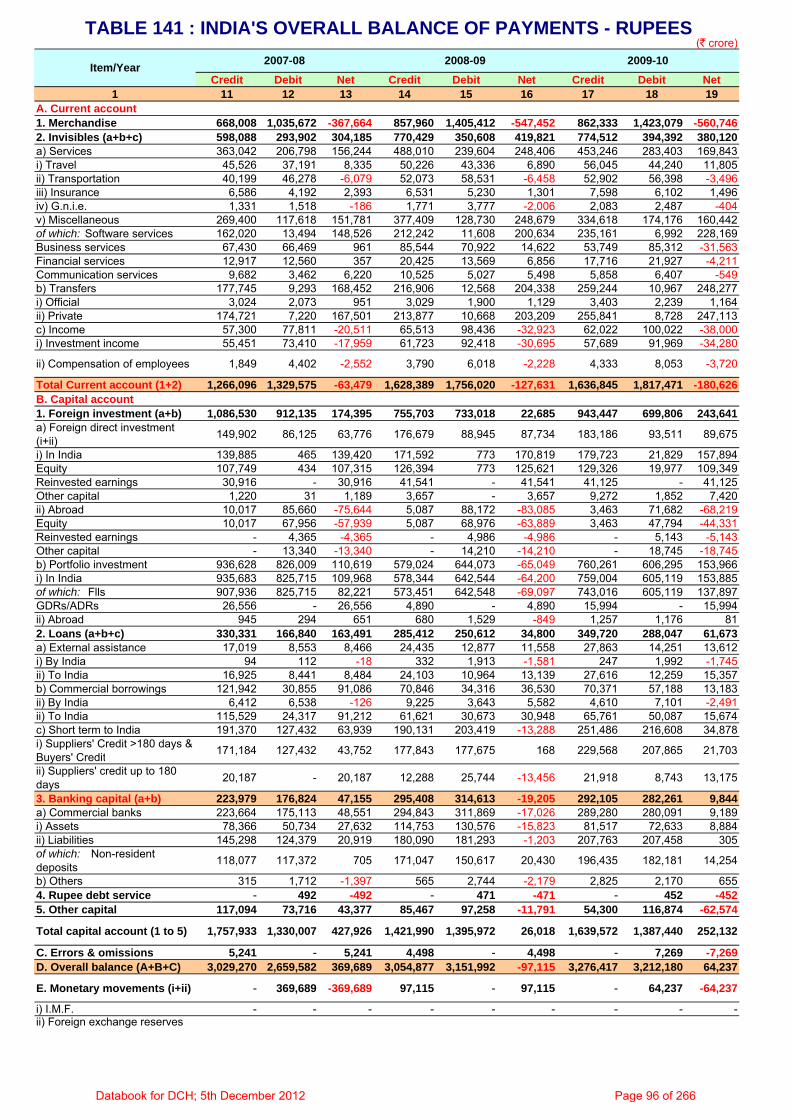
)TABLE 141 : INDIA'S OVERALL BALANCE OF PAYMENTS - RUPEES
Item/Year
(` crore2007-08 2008-09 2009-10
Credit Debit Net Credit Debit Net Credit Debit Net
1 11 12 13 14 15 16 17 18 19
A. Current account
1. Merchandise 668,008 1,035,672 -367,664 857,960 1,405,412 -547,452 862,333 1,423,079 -560,746
2. Invisibles (a+b+c) 598,088 293,902 304,185 770,429 350,608 419,821 774,512 394,392 380,120
a) Services 363,042 206,798 156,244 488,010 239,604 248,406 453,246 283,403 169,843 i) Travel 45,526 37,191 8,335 50,226 43,336 6,890 56,045 44,240 11,805 ii) Transportation 40,199 46,278 -6,079 52,073 58,531 -6,458 52,902 56,398 -3,496 iii) Insurance 6,586 4,192 2,393 6,531 5,230 1,301 7,598 6,102 1,496 iv) G.n.i.e. 1,331 1,518 -186 1,771 3,777 -2,006 2,083 2,487 -404 v) Miscellaneous 269,400 117,618 151,781 377,409 128,730 248,679 334,618 174,176 160,442 of which: Software services 162,020 13,494 148,526 212,242 11,608 200,634 235,161 6,992 228,169 Business services 67,430 66,469 961 85,544 70,922 14,622 53,749 85,312 -31,563 Financial services 12,917 12,560 357 20,425 13,569 6,856 17,716 21,927 -4,211 Communication services 9,682 3,462 6,220 10,525 5,027 5,498 5,858 6,407 -549 b) Transfers 177,745 9,293 168,452 216,906 12,568 204,338 259,244 10,967 248,277 i) Official 3,024 2,073 951 3,029 1,900 1,129 3,403 2,239 1,164 ii) Private 174,721 7,220 167,501 213,877 10,668 203,209 255,841 8,728 247,113 c) Income 57,300 77,811 -20,511 65,513 98,436 -32,923 62,022 100,022 -38,000 i) Investment income 55,451 73,410 -17,959 61,723 92,418 -30,695 57,689 91,969 -34,280
ii) Compensation of employees 1,849 4,402 -2,552 3,790 6,018 -2,228 4,333 8,053 -3,720
Total Current account (1+2) 1,266,096 1,329,575 -63,479 1,628,389 1,756,020 -127,631 1,636,845 1,817,471 -180,626
B. Capital account
1. Foreign investment (a+b)
a) Foreign direct investment 1,086,530 912,135 174,395 755,703 733,018 22,685 943,447 699,806 243,641
(i+ii) 149,902 86,125 63,776 176,679 88,945 87,734 183,186 93,511 89,675
i) In India 139,885 465 139,420 171,592 773 170,819 179,723 21,829 157,894 Equity 107,749 434 107,315 126,394 773 125,621 129,326 19,977 109,349 Reinvested earnings 30,916 - 30,916 41,541 - 41,541 41,125 - 41,125 Other capital 1,220 31 1,189 3,657 - 3,657 9,272 1,852 7,420 ii) Abroad 10,017 85,660 -75,644 5,087 88,172 -83,085 3,463 71,682 -68,219 Equity 10,017 67,956 -57,939 5,087 68,976 -63,889 3,463 47,794 -44,331 Reinvested earnings - 4,365 -4,365 - 4,986 -4,986 - 5,143 -5,143 Other capital - 13,340 -13,340 - 14,210 -14,210 - 18,745 -18,745 b) Portfolio investment 936,628 826,009 110,619 579,024 644,073 -65,049 760,261 606,295 153,966 i) In India 935,683 825,715 109,968 578,344 642,544 -64,200 759,004 605,119 153,885 of which: Flls 907,936 825,715 82,221 573,451 642,548 -69,097 743,016 605,119 137,897 GDRs/ADRs 26,556 - 26,556 4,890 - 4,890 15,994 - 15,994 ii) Abroad 945 294 651 680 1,529 -849 1,257 1,176 81 2. Loans (a+b+c) 330,331 166,840 163,491 285,412 250,612 34,800 349,720 288,047 61,673
a) External assistance 17,019 8,553 8,466 24,435 12,877 11,558 27,863 14,251 13,612 i) By India 94 112 -18 332 1,913 -1,581 247 1,992 -1,745 ii) To India 16,925 8,441 8,484 24,103 10,964 13,139 27,616 12,259 15,357 b) Commercial borrowings 121,942 30,855 91,086 70,846 34,316 36,530 70,371 57,188 13,183 ii) By India 6,412 6,538 -126 9,225 3,643 5,582 4,610 7,101 -2,491 ii) To India 115,529 24,317 91,212 61,621 30,673 30,948 65,761 50,087 15,674 c) Short term to Indiai) Suppliers' Credit >180 days &
191,370 127,432 63,939 190,131 203,419 -13,288 251,486 216,608 34,878
Buyers' Creditii) Suppliers' credit up to 180
171,184 127,432 43,752 177,843 177,675 168 229,568 207,865 21,703
days 20,187 - 20,187 12,288 25,744 -13,456 21,918 8,743 13,175
3. Banking capital (a+b) 223,979 176,824 47,155 295,408 314,613 -19,205 292,105 282,261 9,844
a) Commercial banks 223,664 175,113 48,551 294,843 311,869 -17,026 289,280 280,091 9,189 i) Assets 78,366 50,734 27,632 114,753 130,576 -15,823 81,517 72,633 8,884 ii) Liabilitiesof which: Non-resident
145,298 124,379 20,919 180,090 181,293 -1,203 207,763 207,458 305
deposits 118,077 117,372 705 171,047 150,617 20,430 196,435 182,181 14,254
b) Others 315 1,712 -1,397 565 2,744 -2,179 2,825 2,170 655 4. Rupee debt service - 492 -492 - 471 -471 - 452 -452
5. Other capital 117,094 73,716 43,377 85,467 97,258 -11,791 54,300 116,874 -62,574
Total capital account (1 to 5) 1,757,933 1,330,007 427,926 1,421,990 1,395,972 26,018 1,639,572 1,387,440 252,132
C. Errors & omissions 5,241 - 5,241 4,498 - 4,498 - 7,269 -7,269
D. Overall balance (A+B+C) 3,029,270 2,659,582 369,689 3,054,877 3,151,992 -97,115 3,276,417 3,212,180 64,237
E. Monetary movements (i+ii) - 369,689 -369,689 97,115 - 97,115 - 64,237 -64,237
i) I.M.F.ii) Foreign exchange reserves
- - - - - - - - -
Databook for DCH; 5th December 2012 Page 96 of 266
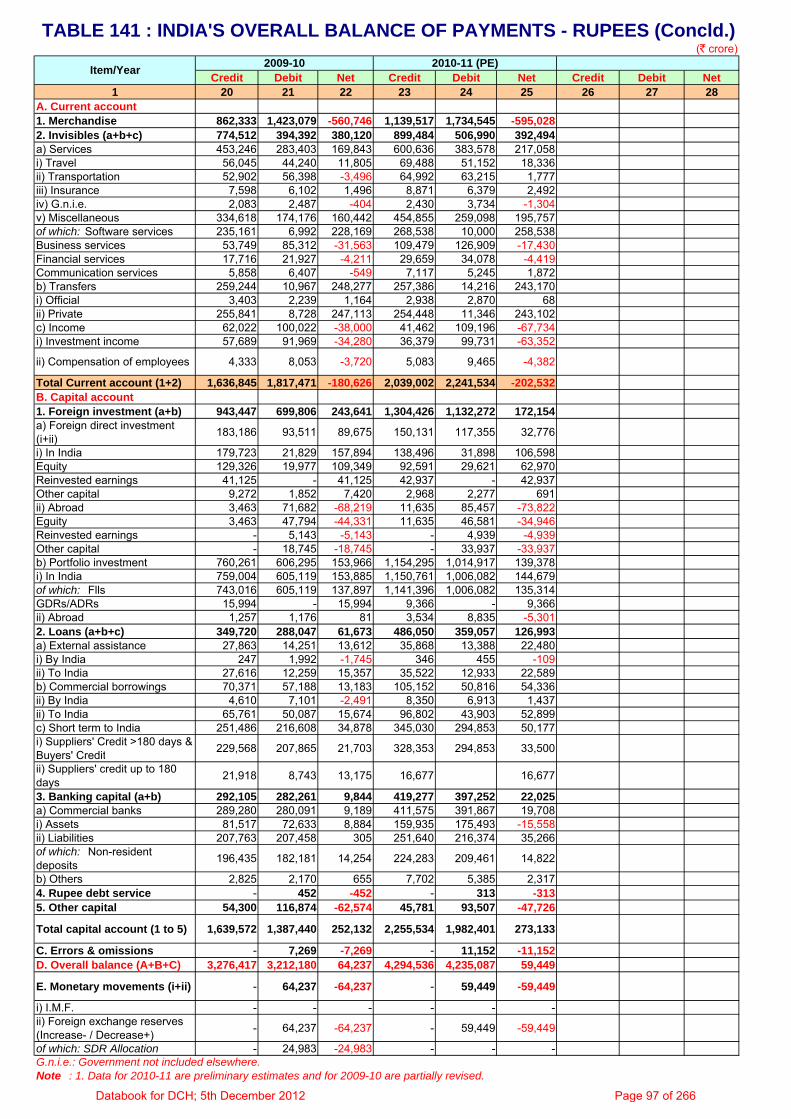
TABLE 141 : INDIA'S OVERALL BALANCE OF PAYMENTS - RUPEES (Concld.)(` crore)
2009-10 2010-11 (PE)Item/Year
Credit Debit Net Credit Debit Net Credit Debit Net
1 20 21 22 23 24 25 26 27 28
A. Current account
1. Merchandise 862,333 1,423,079 -560,746 1,139,517 1,734,545 -595,028
2. Invisibles (a+b+c) 774,512 394,392 380,120 899,484 506,990 392,494
a) Services 453,246 283,403 169,843 600,636 383,578 217,058 i) Travel 56,045 44,240 11,805 69,488 51,152 18,336 ii) Transportation 52,902 56,398 -3,496 64,992 63,215 1,777 iii) Insurance 7,598 6,102 1,496 8,871 6,379 2,492 iv) G.n.i.e. 2,083 2,487 -404 2,430 3,734 -1,304 v) Miscellaneous 334,618 174,176 160,442 454,855 259,098 195,757 of which: Software services 235,161 6,992 228,169 268,538 10,000 258,538 Business services 53,749 85,312 -31,563 109,479 126,909 -17,430 Financial services 17,716 21,927 -4,211 29,659 34,078 -4,419 Communication services 5,858 6,407 -549 7,117 5,245 1,872 b) Transfers 259,244 10,967 248,277 257,386 14,216 243,170 i) Official 3,403 2,239 1,164 2,938 2,870 68 ii) Private 255,841 8,728 247,113 254,448 11,346 243,102 c) Income 62,022 100,022 -38,000 41,462 109,196 -67,734 i) Investment income 57,689 91,969 -34,280 36,379 99,731 -63,352
ii) Compensation of employees 4,333 8,053 -3,720 5,083 9,465 -4,382
Total Current account (1+2) 1,636,845 1,817,471 -180,626 2,039,002 2,241,534 -202,532
B. Capital account
1. Foreign investment (a+b)
a) Foreign direct investment 943,447 699,806 243,641 1,304,426 1,132,272 172,154
(i+ii) 183,186 93,511 89,675 150,131 117,355 32,776
i) In India 179,723 21,829 157,894 138,496 31,898 106,598 Equity 129,326 19,977 109,349 92,591 29,621 62,970 Reinvested earnings 41,125 - 41,125 42,937 - 42,937 Other capital 9,272 1,852 7,420 2,968 2,277 691 ii) Abroad 3,463 71,682 -68,219 11,635 85,457 -73,822 Eguity 3,463 47,794 -44,331 11,635 46,581 -34,946 Reinvested earnings - 5,143 -5,143 - 4,939 -4,939 Other capital - 18,745 -18,745 - 33,937 -33,937 b) Portfolio investment 760,261 606,295 153,966 1,154,295 1,014,917 139,378 i) In India 759,004 605,119 153,885 1,150,761 1,006,082 144,679 of which: Flls 743,016 605,119 137,897 1,141,396 1,006,082 135,314 GDRs/ADRs 15,994 - 15,994 9,366 - 9,366 ii) Abroad 1,257 1,176 81 3,534 8,835 -5,301 2. Loans (a+b+c) 349,720 288,047 61,673 486,050 359,057 126,993
a) External assistance 27,863 14,251 13,612 35,868 13,388 22,480 i) By India 247 1,992 -1,745 346 455 -109 ii) To India 27,616 12,259 15,357 35,522 12,933 22,589 b) Commercial borrowings 70,371 57,188 13,183 105,152 50,816 54,336 ii) By India 4,610 7,101 -2,491 8,350 6,913 1,437 ii) To India 65,761 50,087 15,674 96,802 43,903 52,899 c) Short term to Indiai) Suppliers' Credit >180 days &
251,486 216,608 34,878 345,030 294,853 50,177
Buyers' Creditii) Suppliers' credit up to 180
229,568 207,865 21,703 328,353 294,853 33,500
days 21,918 8,743 13,175 16,677 16,677
3. Banking capital (a+b) 292,105 282,261 9,844 419,277 397,252 22,025
a) Commercial banks 289,280 280,091 9,189 411,575 391,867 19,708 i) Assets 81,517 72,633 8,884 159,935 175,493 -15,558 ii) Liabilitiesof which: Non-resident
207,763 207,458 305 251,640 216,374 35,266
deposits 196,435 182,181 14,254 224,283 209,461 14,822
b) Others 2,825 2,170 655 7,702 5,385 2,317 4. Rupee debt service - 452 -452 - 313 -313
5. Other capital 54,300 116,874 -62,574 45,781 93,507 -47,726
Total capital account (1 to 5) 1,639,572 1,387,440 252,132 2,255,534 1,982,401 273,133
C. Errors & omissions - 7,269 -7,269 - 11,152 -11,152
D. Overall balance (A+B+C) 3,276,417 3,212,180 64,237 4,294,536 4,235,087 59,449
E. Monetary movements (i+ii) - 64,237 -64,237 - 59,449 -59,449
i) I.M.F.ii) Foreign exchange reserves
- - - - - -
(Increase- / Decrease+) - 64,237 -64,237 - 59,449 -59,449
of which: SDR Allocation - 24,983 -24,983 - - -G.n.i.e.: Government not included elsewhere.Note : 1. Data for 2010-11 are preliminary estimates and for 2009-10 are partially revised.
Databook for DCH; 5th December 2012 Page 97 of 266
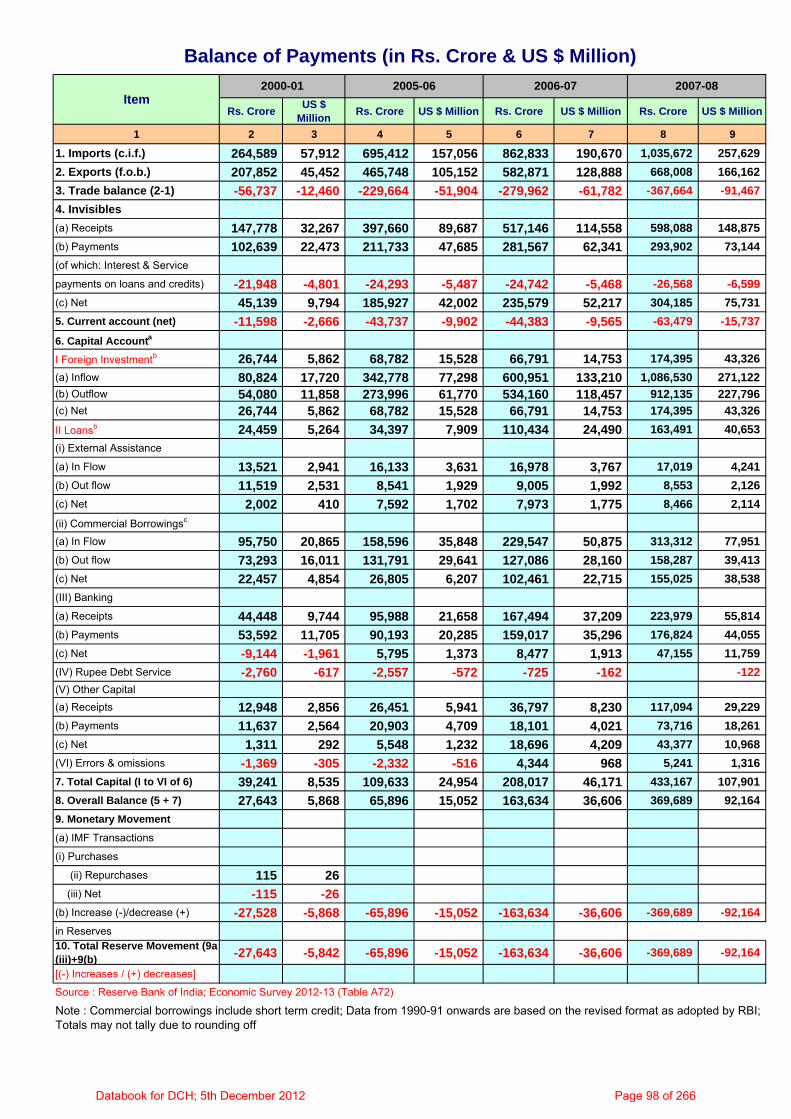
Balance of Payments (in Rs. Crore & US $ Million)
Item2000-01 2005-06 2006-07 2007-08
Rs. CroreUS $
MillionRs. Crore US $ Million Rs. Crore US $ Million Rs. Crore US $ Million
1 2 3 4 5 6 7 8 9
1. Imports (c.i.f.) 264,589 57,912 695,412 157,056 862,833 190,670 1,035,672 257,629
2. Exports (f.o.b.) 207,852 45,452 465,748 105,152 582,871 128,888 668,008 166,162
3. Trade balance (2-1) -56,737 -12,460 -229,664 -51,904 -279,962 -61,782 -367,664 -91,467
4. Invisibles
(a) Receipts 147,778 32,267 397,660 89,687 517,146 114,558 598,088 148,875
(b) Payments 102,639 22,473 211,733 47,685 281,567 62,341 293,902 73,144
(of which: Interest & Service
payments on loans and credits) -21,948 -4,801 -24,293 -5,487 -24,742 -5,468 -26,568 -6,599
(c) Net 45,139 9,794 185,927 42,002 235,579 52,217 304,185 75,731
5. Current account (net) -11,598 -2,666 -43,737 -9,902 -44,383 -9,565 -63,479 -15,737
6. Capital Accounta
I Foreign Investmentb 26,744 5,862 68,782 15,528 66,791 14,753 174,395 43,326
(a) Inflow 80,824 17,720 342,778 77,298 600,951 133,210 1,086,530 271,122
(b) Outflow 54,080 11,858 273,996 61,770 534,160 118,457 912,135 227,796
(c) Net 26,744 5,862 68,782 15,528 66,791 14,753 174,395 43,326
II Loansb 24,459 5,264 34,397 7,909 110,434 24,490 163,491 40,653
(i) External Assistance
(a) In Flow 13,521 2,941 16,133 3,631 16,978 3,767 17,019 4,241
(b) Out flow 11,519 2,531 8,541 1,929 9,005 1,992 8,553 2,126
(c) Net 2,002 410 7,592 1,702 7,973 1,775 8,466 2,114
(ii) Commercial Borrowingsc
(a) In Flow 95,750 20,865 158,596 35,848 229,547 50,875 313,312 77,951
(b) Out flow 73,293 16,011 131,791 29,641 127,086 28,160 158,287 39,413
(c) Net 22,457 4,854 26,805 6,207 102,461 22,715 155,025 38,538
(III) Banking
(a) Receipts 44,448 9,744 95,988 21,658 167,494 37,209 223,979 55,814
(b) Payments 53,592 11,705 90,193 20,285 159,017 35,296 176,824 44,055
(c) Net -9,144 -1,961 5,795 1,373 8,477 1,913 47,155 11,759
(IV) Rupee Debt Service -2,760 -617 -2,557 -572 -725 -162 -122
(V) Other Capital(a) Receipts 12,948 2,856 26,451 5,941 36,797 8,230 117,094 29,229
(b) Payments 11,637 2,564 20,903 4,709 18,101 4,021 73,716 18,261
(c) Net 1,311 292 5,548 1,232 18,696 4,209 43,377 10,968
(VI) Errors & omissions -1,369 -305 -2,332 -516 4,344 968 5,241 1,316
7. Total Capital (I to VI of 6) 39,241 8,535 109,633 24,954 208,017 46,171 433,167 107,901
8. Overall Balance (5 + 7) 27,643 5,868 65,896 15,052 163,634 36,606 369,689 92,164
9. Monetary Movement
(a) IMF Transactions
(i) Purchases
(ii) Repurchases 115 26
(iii) Net -115 -26
(b) Increase (-)/decrease (+) -27,528 -5,868 -65,896 -15,052 -163,634 -36,606 -369,689 -92,164
in Reserves10. Total Reserve Movement (9a
(iii)+9(b)-27,643 -5,842 -65,896 -15,052 -163,634 -36,606 -369,689 -92,164
[(-) Increases / (+) decreases]
Source : Reserve Bank of India; Economic Survey 2012-13 (Table A72)
Note : Commercial borrowings include short term credit; Data from 1990-91 onwards are based on the revised format as adopted by RBI; Totals may not tally due to rounding off
Databook for DCH; 5th December 2012 Page 98 of 266
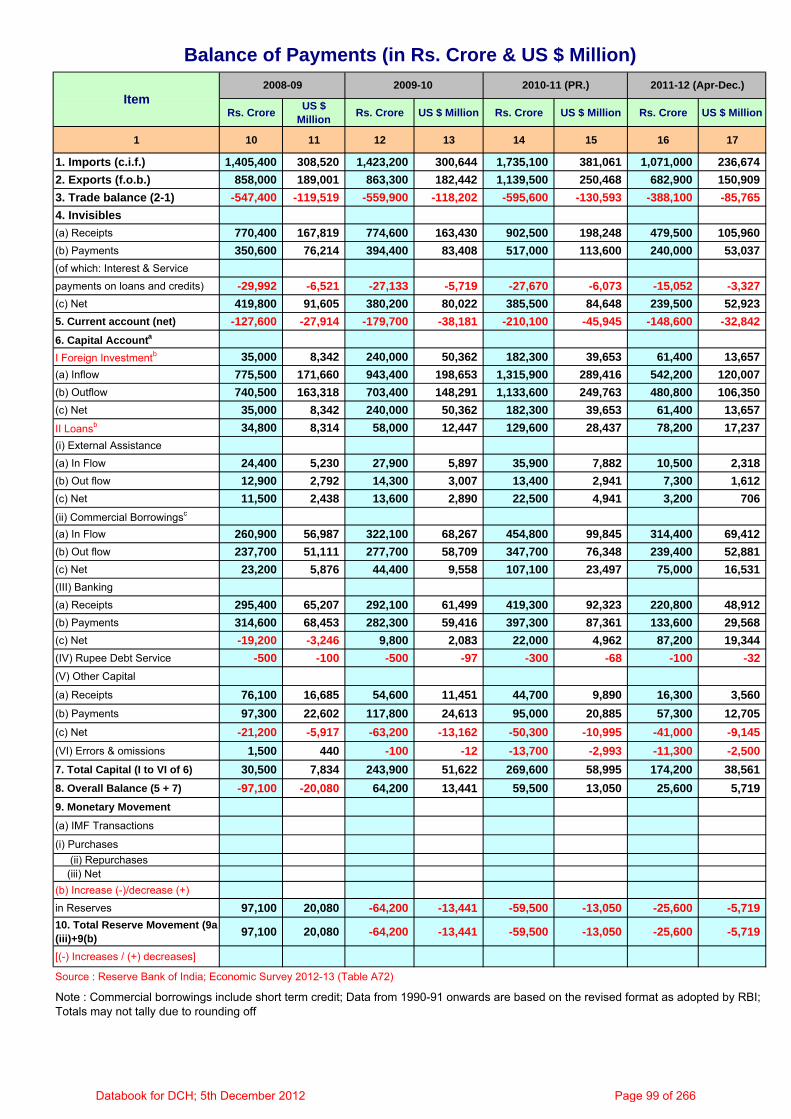
Balance of Payments (in Rs. Crore & US $ Million)
Item2008-09 2009-10 2010-11 (PR.) 2011-12 (Apr-Dec.)
Rs. CroreUS $
MillionRs. Crore US $ Million Rs. Crore US $ Million Rs. Crore US $ Million
1 10 11 12 13 14 15 16 17
1. Imports (c.i.f.) 1,405,400 308,520 1,423,200 300,644 1,735,100 381,061 1,071,000 236,674
2. Exports (f.o.b.) 858,000 189,001 863,300 182,442 1,139,500 250,468 682,900 150,909
3. Trade balance (2-1) -547,400 -119,519 -559,900 -118,202 -595,600 -130,593 -388,100 -85,765
4. Invisibles
(a) Receipts 770,400 167,819 774,600 163,430 902,500 198,248 479,500 105,960
(b) Payments 350,600 76,214 394,400 83,408 517,000 113,600 240,000 53,037
(of which: Interest & Servicepayments on loans and credits) -29,992 -6,521 -27,133 -5,719 -27,670 -6,073 -15,052 -3,327
(c) Net 419,800 91,605 380,200 80,022 385,500 84,648 239,500 52,923
5. Current account (net) -127,600 -27,914 -179,700 -38,181 -210,100 -45,945 -148,600 -32,842
6. Capital Accounta
I Foreign Investmentb 35,000 8,342 240,000 50,362 182,300 39,653 61,400 13,657
(a) Inflow 775,500 171,660 943,400 198,653 1,315,900 289,416 542,200 120,007
(b) Outflow 740,500 163,318 703,400 148,291 1,133,600 249,763 480,800 106,350
(c) Net 35,000 8,342 240,000 50,362 182,300 39,653 61,400 13,657
II Loansb 34,800 8,314 58,000 12,447 129,600 28,437 78,200 17,237
(i) External Assistance(a) In Flow 24,400 5,230 27,900 5,897 35,900 7,882 10,500 2,318
(b) Out flow 12,900 2,792 14,300 3,007 13,400 2,941 7,300 1,612
(c) Net 11,500 2,438 13,600 2,890 22,500 4,941 3,200 706c(ii) Commercial Borrowings
(a) In Flow 260,900 56,987 322,100 68,267 454,800 99,845 314,400 69,412
(b) Out flow 237,700 51,111 277,700 58,709 347,700 76,348 239,400 52,881
(c) Net 23,200 5,876 44,400 9,558 107,100 23,497 75,000 16,531
(III) Banking(a) Receipts 295,400 65,207 292,100 61,499 419,300 92,323 220,800 48,912
(b) Payments 314,600 68,453 282,300 59,416 397,300 87,361 133,600 29,568
(c) Net -19,200 -3,246 9,800 2,083 22,000 4,962 87,200 19,344
(IV) Rupee Debt Service -500 -100 -500 -97 -300 -68 -100 -32
(V) Other Capital
(a) Receipts 76,100 16,685 54,600 11,451 44,700 9,890 16,300 3,560
(b) Payments
(c) Net
97,300 22,602 117,800 24,613 95,000 20,885 57,300 12,705
(VI) Errors & omissions
-21,200
1,500
-5,917
440
-63,200
-100
-13,162
-12
-50,300 -10,995
-13,700
-41,000
-2,993
-9,145
-11,300 -2,500
7. Total Capital (I to VI of 6) 30,500 7,834 243,900 51,622 269,600 58,995 174,200 38,561
8. Overall Balance (5 + 7) -97,100 -20,080 64,200 13,441 59,500 13,050 25,600 5,719
9. Monetary Movement
(a) IMF Transactions
(i) Purchases (ii) Repurchases (iii) Net(b) Increase (-)/decrease (+)
in Reserves 97,100 20,080 -64,200 -13,441 -59,500 -13,050 -25,600 -5,719
10. Total Reserve Movement (9a
(iii)+9(b)97,100 20,080 -64,200 -13,441 -59,500 -13,050 -25,600 -5,719
[(-) Increases / (+) decreases]
Source : Reserve Bank of India; Economic Survey 2012-13 (Table A72)
Note : Commercial borrowings include short term credit; Data from 1990-91 onwards are based on the revised format as adopted by RBI; Totals may not tally due to rounding off
Databook for DCH; 5th December 2012 Page 99 of 266
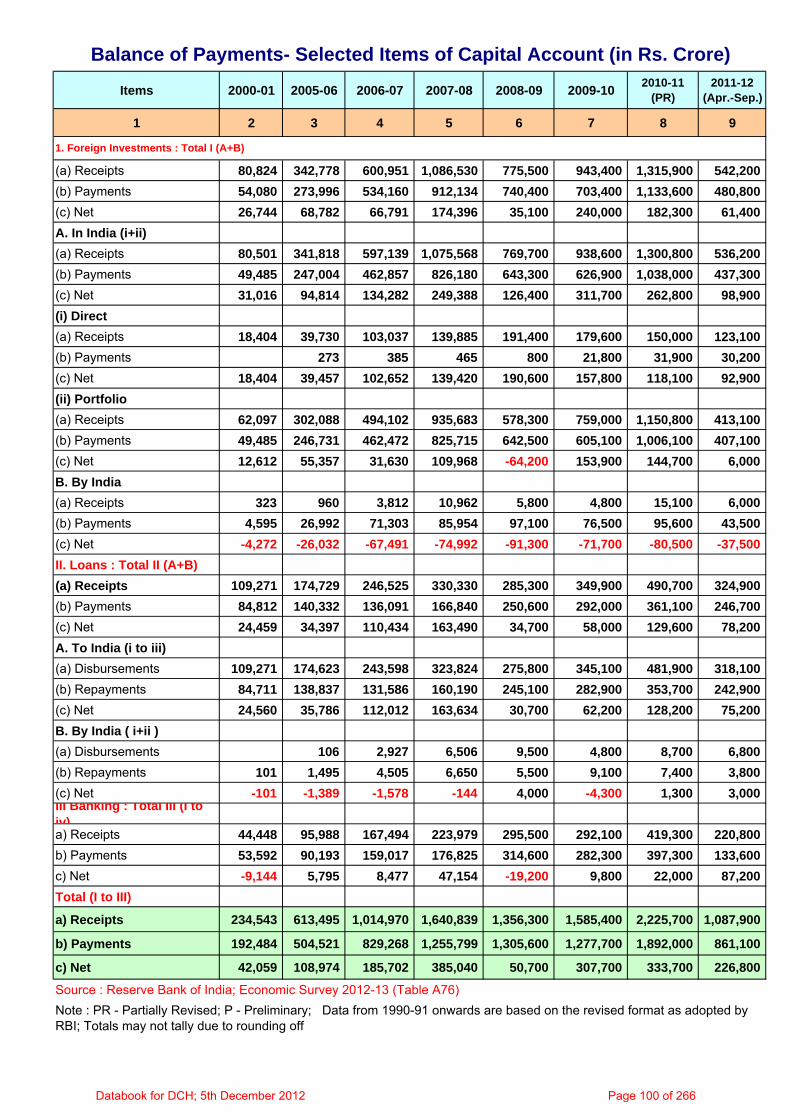
Balance of Payments- Selected Items of Capital Account (in Rs. Crore)
Items 2000-01 2005-06 2006-07 2007-08 2008-09 2009-102010-11
(PR)
2011-12
(Apr.-Sep.)
1 2 3 4 5 6 7 8 9
1. Foreign Investments : Total I (A+B)
(a) Receipts 80,824 342,778 600,951 1,086,530 775,500 943,400 1,315,900 542,200
(b) Payments 54,080 273,996 534,160 912,134 740,400 703,400 1,133,600 480,800
(c) Net 26,744 68,782 66,791 174,396 35,100 240,000 182,300 61,400
A. In India (i+ii)
(a) Receipts 80,501 341,818 597,139 1,075,568 769,700 938,600 1,300,800 536,200
(b) Payments 49,485 247,004 462,857 826,180 643,300 626,900 1,038,000 437,300
(c) Net 31,016 94,814 134,282 249,388 126,400 311,700 262,800 98,900
(i) Direct
(a) Receipts 18,404 39,730 103,037 139,885 191,400 179,600 150,000 123,100
(b) Payments 273 385 465 800 21,800 31,900 30,200
(c) Net 18,404 39,457 102,652 139,420 190,600 157,800 118,100 92,900
(ii) Portfolio
(a) Receipts 62,097 302,088 494,102 935,683 578,300 759,000 1,150,800 413,100
(b) Payments 49,485 246,731 462,472 825,715 642,500 605,100 1,006,100 407,100
(c) Net 12,612 55,357 31,630 109,968 -64,200 153,900 144,700 6,000
B. By India
(a) Receipts 323 960 3,812 10,962 5,800 4,800 15,100 6,000
(b) Payments 4,595 26,992 71,303 85,954 97,100 76,500 95,600 43,500
(c) Net -4,272 -26,032 -67,491 -74,992 -91,300 -71,700 -80,500 -37,500
II. Loans : Total II (A+B)
(a) Receipts 109,271 174,729 246,525 330,330 285,300 349,900 490,700 324,900
(b) Payments 84,812 140,332 136,091 166,840 250,600 292,000 361,100 246,700
(c) Net 24,459 34,397 110,434 163,490 34,700 58,000 129,600 78,200
A. To India (i to iii)
(a) Disbursements 109,271 174,623 243,598 323,824 275,800 345,100 481,900 318,100
(b) Repayments 84,711 138,837 131,586 160,190 245,100 282,900 353,700 242,900
(c) Net 24,560 35,786 112,012 163,634 30,700 62,200 128,200 75,200
B. By India ( i+ii )
(a) Disbursements 106 2,927 6,506 9,500 4,800 8,700 6,800
(b) Repayments 101 1,495 4,505 6,650 5,500 9,100 7,400 3,800
(c) Net -101 -1,389 -1,578 -144 4,000 -4,300 1,300 3,000III Banking : Total III (I to
iv)a) Receipts 44,448 95,988 167,494 223,979 295,500 292,100 419,300 220,800
b) Payments 53,592 90,193 159,017 176,825 314,600 282,300 397,300 133,600
c) Net -9,144 5,795 8,477 47,154 -19,200 9,800 22,000 87,200
Total (I to III)
a) Receipts 234,543 613,495 1,014,970 1,640,839 1,356,300 1,585,400 2,225,700 1,087,900
b) Payments 192,484 504,521 829,268 1,255,799 1,305,600 1,277,700 1,892,000 861,100
c) Net 42,059 108,974 185,702 385,040 50,700 307,700 333,700 226,800
Source : Reserve Bank of India; Economic Survey 2012-13 (Table A76)Note : PR - Partially Revised; P - Preliminary; Data from 1990-91 onwards are based on the revised format as adopted by RBI; Totals may not tally due to rounding off
Databook for DCH; 5th December 2012 Page 100 of 266
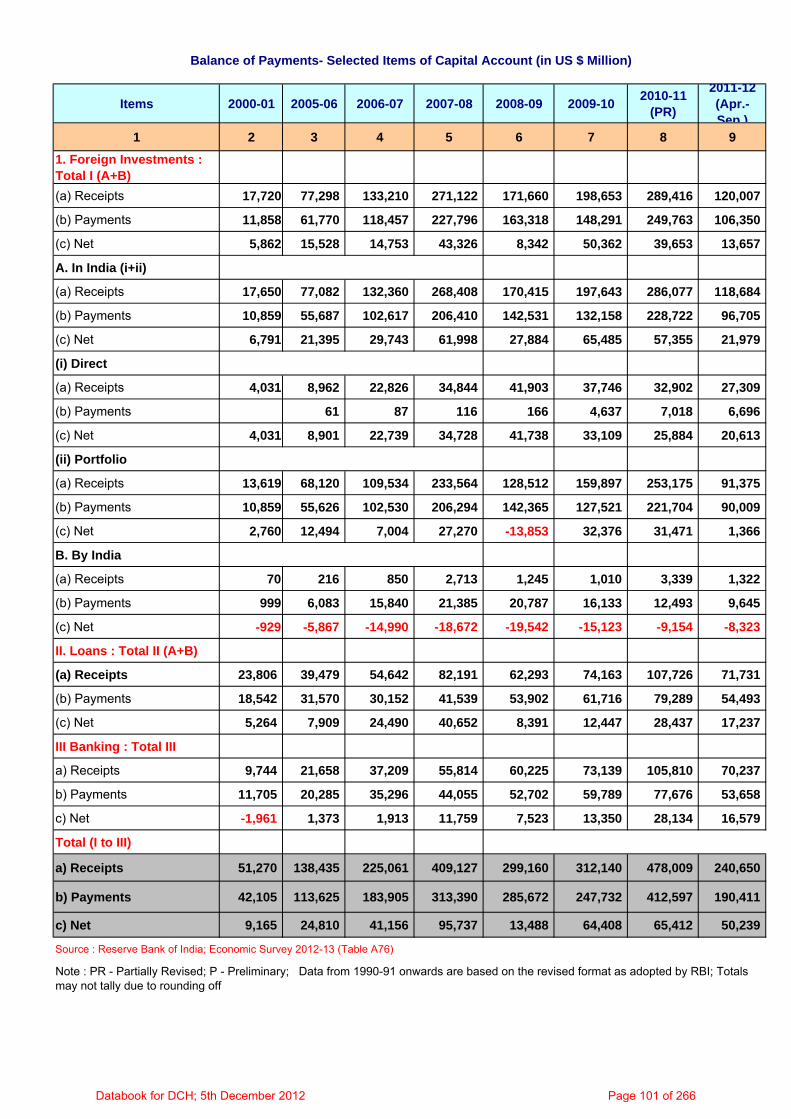
Balance of Payments- Selected Items of Capital Account (in US $ Million)
Items 2000-01 2005-06 2006-07 2007-08 2008-09 2009-102010-11
(PR)
2011-12
(Apr.-
1 2 3 4 5 6 7 8
Sep )
9
1. Foreign Investments :
Total I (A+B)
(a) Receipts 17,720 77,298 133,210 271,122 171,660 198,653 289,416 120,007
(b) Payments 11,858 61,770 118,457 227,796 163,318 148,291 249,763 106,350
(c) Net 5,862 15,528 14,753 43,326 8,342 50,362 39,653 13,657
A. In India (i+ii)
(a) Receipts 17,650 77,082 132,360 268,408 170,415 197,643 286,077 118,684
(b) Payments 10,859 55,687 102,617 206,410 142,531 132,158 228,722 96,705
(c) Net 6,791 21,395 29,743 61,998 27,884 65,485 57,355 21,979
(i) Direct
(a) Receipts 4,031 8,962 22,826 34,844 41,903 37,746 32,902 27,309
(b) Payments 61 87 116 166 4,637 7,018 6,696
(c) Net 4,031 8,901 22,739 34,728 41,738 33,109 25,884 20,613
(ii) Portfolio
(a) Receipts 13,619 68,120 109,534 233,564 128,512 159,897 253,175 91,375
(b) Payments 10,859 55,626 102,530 206,294 142,365 127,521 221,704 90,009
(c) Net 2,760 12,494 7,004 27,270 -13,853 32,376 31,471 1,366
B. By India
(a) Receipts 70 216 850 2,713 1,245 1,010 3,339 1,322
(b) Payments 999 6,083 15,840 21,385 20,787 16,133 12,493 9,645
(c) Net -929 -5,867 -14,990 -18,672 -19,542 -15,123 -9,154 -8,323
II. Loans : Total II (A+B)
(a) Receipts 23,806 39,479 54,642 82,191 62,293 74,163 107,726 71,731
(b) Payments 18,542 31,570 30,152 41,539 53,902 61,716 79,289 54,493
(c) Net 5,264 7,909 24,490 40,652 8,391 12,447 28,437 17,237
III Banking : Total III
a) Receipts 9,744 21,658 37,209 55,814 60,225 73,139 105,810 70,237
b) Payments 11,705 20,285 35,296 44,055 52,702 59,789 77,676 53,658
c) Net -1,961 1,373 1,913 11,759 7,523 13,350 28,134 16,579
Total (I to III)
a) Receipts 51,270 138,435 225,061 409,127 299,160 312,140 478,009 240,650
b) Payments 42,105 113,625 183,905 313,390 285,672 247,732 412,597 190,411
c) Net 9,165 24,810 41,156 95,737 13,488 64,408 65,412 50,239
Source : Reserve Bank of India; Economic Survey 2012-13 (Table A76)
Note : PR - Partially Revised; P - Preliminary; Data from 1990-91 onwards are based on the revised format as adopted by RBI; Totals may not tally due to rounding off
Databook for DCH; 5th December 2012 Page 101 of 266
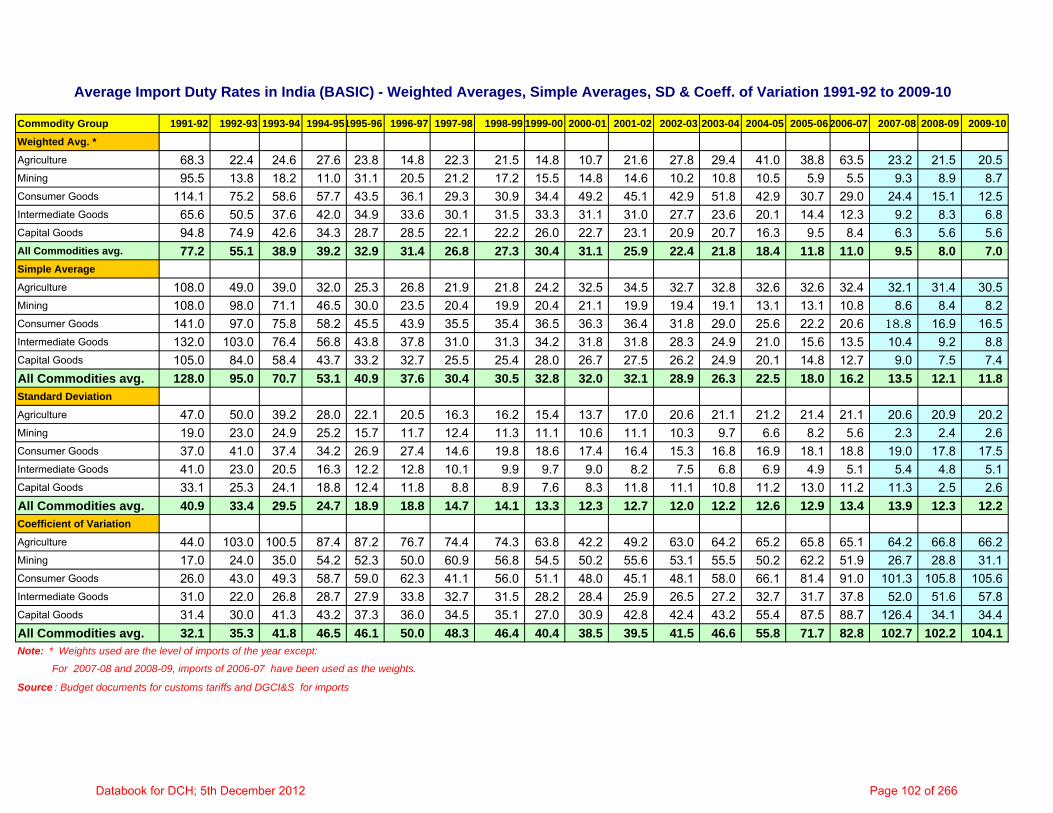
1
Average Import Duty Rates in India (BASIC) - Weighted Averages, Simple Averages, SD & Coeff. of Variation 1991-92 to 2009-10
Commodity Group 1991-92 1992-93 1993-94 1994-95 995-96 1996-97 1997-98 1998-99 1999-00 2000-01 2001-02 2002-03 2003-04 2004-05 2005-06 2006-07 2007-08 2008-09 2009-10
Weighted Avg. *
Agriculture 68.3 22.4 24.6 27.6 23.8 14.8 22.3 21.5 14.8 10.7 21.6 27.8 29.4 41.0 38.8 63.5 23.2 21.5 20.5Mining 95.5 13.8 18.2 11.0 31.1 20.5 21.2 17.2 15.5 14.8 14.6 10.2 10.8 10.5 5.9 5.5 9.3 8.9 8.7Consumer Goods 114.1 75.2 58.6 57.7 43.5 36.1 29.3 30.9 34.4 49.2 45.1 42.9 51.8 42.9 30.7 29.0 24.4 15.1 12.5Intermediate Goods 65.6 50.5 37.6 42.0 34.9 33.6 30.1 31.5 33.3 31.1 31.0 27.7 23.6 20.1 14.4 12.3 9.2 8.3 6.8Capital Goods 94.8 74.9 42.6 34.3 28.7 28.5 22.1 22.2 26.0 22.7 23.1 20.9 20.7 16.3 9.5 8.4 6.3 5.6 5.6All Commodities avg. 77.2 55.1 38.9 39.2 32.9 31.4 26.8 27.3 30.4 31.1 25.9 22.4 21.8 18.4 11.8 11.0 9.5 8.0 7.0Simple Average
Agriculture 108.0 49.0 39.0 32.0 25.3 26.8 21.9 21.8 24.2 32.5 34.5 32.7 32.8 32.6 32.6 32.4 32.1 31.4 30.5Mining 108.0 98.0 71.1 46.5 30.0 23.5 20.4 19.9 20.4 21.1 19.9 19.4 19.1 13.1 13.1 10.8 8.6 8.4 8.2Consumer Goods 141.0 97.0 75.8 58.2 45.5 43.9 35.5 35.4 36.5 36.3 36.4 31.8 29.0 25.6 22.2 20.6 18.8 16.9 16.5Intermediate Goods 132.0 103.0 76.4 56.8 43.8 37.8 31.0 31.3 34.2 31.8 31.8 28.3 24.9 21.0 15.6 13.5 10.4 9.2 8.8Capital Goods 105.0 84.0 58.4 43.7 33.2 32.7 25.5 25.4 28.0 26.7 27.5 26.2 24.9 20.1 14.8 12.7 9.0 7.5 7.4All Commodities avg. 128.0 95.0 70.7 53.1 40.9 37.6 30.4 30.5 32.8 32.0 32.1 28.9 26.3 22.5 18.0 16.2 13.5 12.1 11.8Standard Deviation
Agriculture 47.0 50.0 39.2 28.0 22.1 20.5 16.3 16.2 15.4 13.7 17.0 20.6 21.1 21.2 21.4 21.1 20.6 20.9 20.2Mining 19.0 23.0 24.9 25.2 15.7 11.7 12.4 11.3 11.1 10.6 11.1 10.3 9.7 6.6 8.2 5.6 2.3 2.4 2.6Consumer Goods 37.0 41.0 37.4 34.2 26.9 27.4 14.6 19.8 18.6 17.4 16.4 15.3 16.8 16.9 18.1 18.8 19.0 17.8 17.5Intermediate Goods 41.0 23.0 20.5 16.3 12.2 12.8 10.1 9.9 9.7 9.0 8.2 7.5 6.8 6.9 4.9 5.1 5.4 4.8 5.1Capital Goods 33.1 25.3 24.1 18.8 12.4 11.8 8.8 8.9 7.6 8.3 11.8 11.1 10.8 11.2 13.0 11.2 11.3 2.5 2.6All Commodities avg. 40.9 33.4 29.5 24.7 18.9 18.8 14.7 14.1 13.3 12.3 12.7 12.0 12.2 12.6 12.9 13.4 13.9 12.3 12.2Coefficient of Variation
Agriculture 44.0 103.0 100.5 87.4 87.2 76.7 74.4 74.3 63.8 42.2 49.2 63.0 64.2 65.2 65.8 65.1 64.2 66.8 66.2Mining 17.0 24.0 35.0 54.2 52.3 50.0 60.9 56.8 54.5 50.2 55.6 53.1 55.5 50.2 62.2 51.9 26.7 28.8 31.1Consumer Goods 26.0 43.0 49.3 58.7 59.0 62.3 41.1 56.0 51.1 48.0 45.1 48.1 58.0 66.1 81.4 91.0 101.3 105.8 105.6Intermediate Goods 31.0 22.0 26.8 28.7 27.9 33.8 32.7 31.5 28.2 28.4 25.9 26.5 27.2 32.7 31.7 37.8 52.0 51.6 57.8Capital Goods 31.4 30.0 41.3 43.2 37.3 36.0 34.5 35.1 27.0 30.9 42.8 42.4 43.2 55.4 87.5 88.7 126.4 34.1 34.4All Commodities avg. 32.1 35.3 41.8 46.5 46.1 50.0 48.3 46.4 40.4 38.5 39.5 41.5 46.6 55.8 71.7 82.8 102.7 102.2 104.1Note: * Weights used are the level of imports of the year except:
For 2007-08 and 2008-09, imports of 2006-07 have been used as the weights.
Source : Budget documents for customs tariffs and DGCI&S for imports
Databook for DCH; 5th December 2012 Page 102 of 266
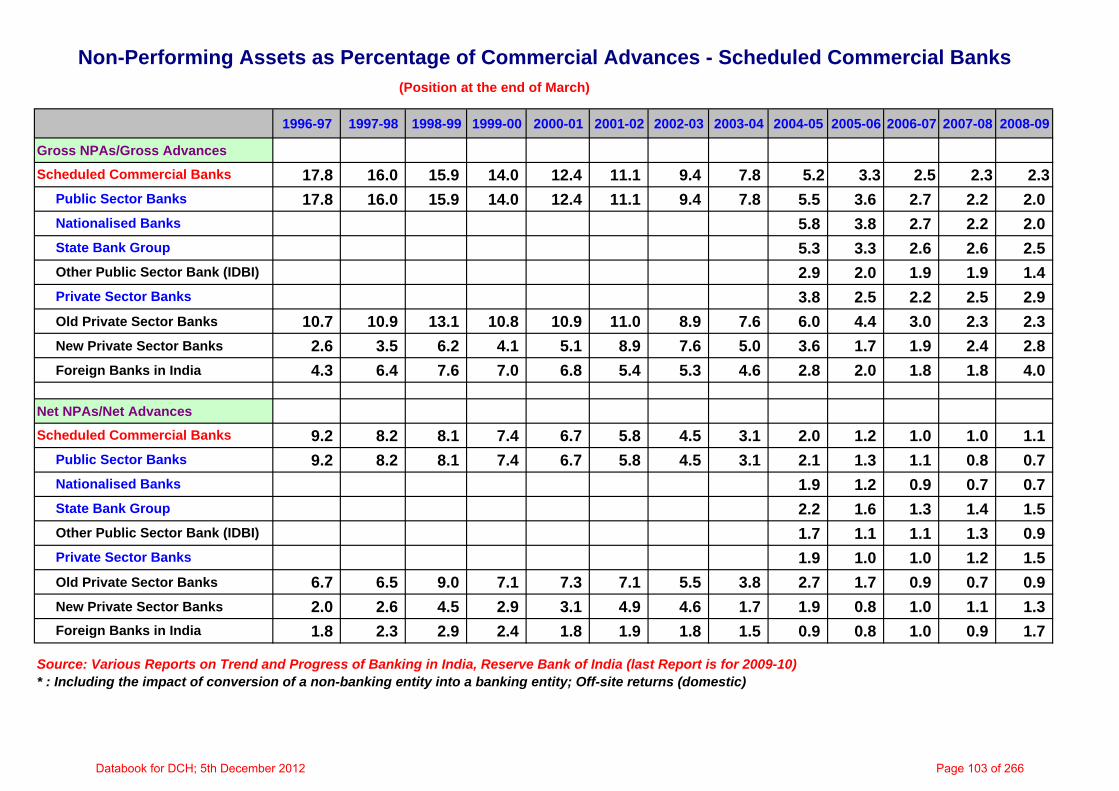
Non-Performing Assets as Percentage of Commercial Advances - Scheduled Commercial Banks (Position at the end of March)
1996-97 1997-98 1998-99 1999-00 2000-01 2001-02 2002-03 2003-04 2004-05 2005-06 2006-07 2007-08 2008-09
Gross NPAs/Gross Advances
Scheduled Commercial Banks 17.8 16.0 15.9 14.0 12.4 11.1 9.4 7.8 5.2 3.3 2.5 2.3 2.3 Public Sector Banks 17.8 16.0 15.9 14.0 12.4 11.1 9.4 7.8 5.5 3.6 2.7 2.2 2.0 Nationalised Banks 5.8 3.8 2.7 2.2 2.0 State Bank Group 5.3 3.3 2.6 2.6 2.5 Other Public Sector Bank (IDBI) 2.9 2.0 1.9 1.9 1.4 Private Sector Banks 3.8 2.5 2.2 2.5 2.9 Old Private Sector Banks 10.7 10.9 13.1 10.8 10.9 11.0 8.9 7.6 6.0 4.4 3.0 2.3 2.3 New Private Sector Banks 2.6 3.5 6.2 4.1 5.1 8.9 7.6 5.0 3.6 1.7 1.9 2.4 2.8 Foreign Banks in India 4.3 6.4 7.6 7.0 6.8 5.4 5.3 4.6 2.8 2.0 1.8 1.8 4.0
Net NPAs/Net Advances
Scheduled Commercial Banks 9.2 8.2 8.1 7.4 6.7 5.8 4.5 3.1 2.0 1.2 1.0 1.0 1.1 Public Sector Banks 9.2 8.2 8.1 7.4 6.7 5.8 4.5 3.1 2.1 1.3 1.1 0.8 0.7 Nationalised Banks 1.9 1.2 0.9 0.7 0.7 State Bank Group 2.2 1.6 1.3 1.4 1.5 Other Public Sector Bank (IDBI) 1.7 1.1 1.1 1.3 0.9 Private Sector Banks 1.9 1.0 1.0 1.2 1.5 Old Private Sector Banks 6.7 6.5 9.0 7.1 7.3 7.1 5.5 3.8 2.7 1.7 0.9 0.7 0.9 New Private Sector Banks 2.0 2.6 4.5 2.9 3.1 4.9 4.6 1.7 1.9 0.8 1.0 1.1 1.3 Foreign Banks in India 1.8 2.3 2.9 2.4 1.8 1.9 1.8 1.5 0.9 0.8 1.0 0.9 1.7
Source: Various Reports on Trend and Progress of Banking in India, Reserve Bank of India (last Report is for 2009-10)* : Including the impact of conversion of a non-banking entity into a banking entity; Off-site returns (domestic)
Databook for DCH; 5th December 2012 Page 103 of 266
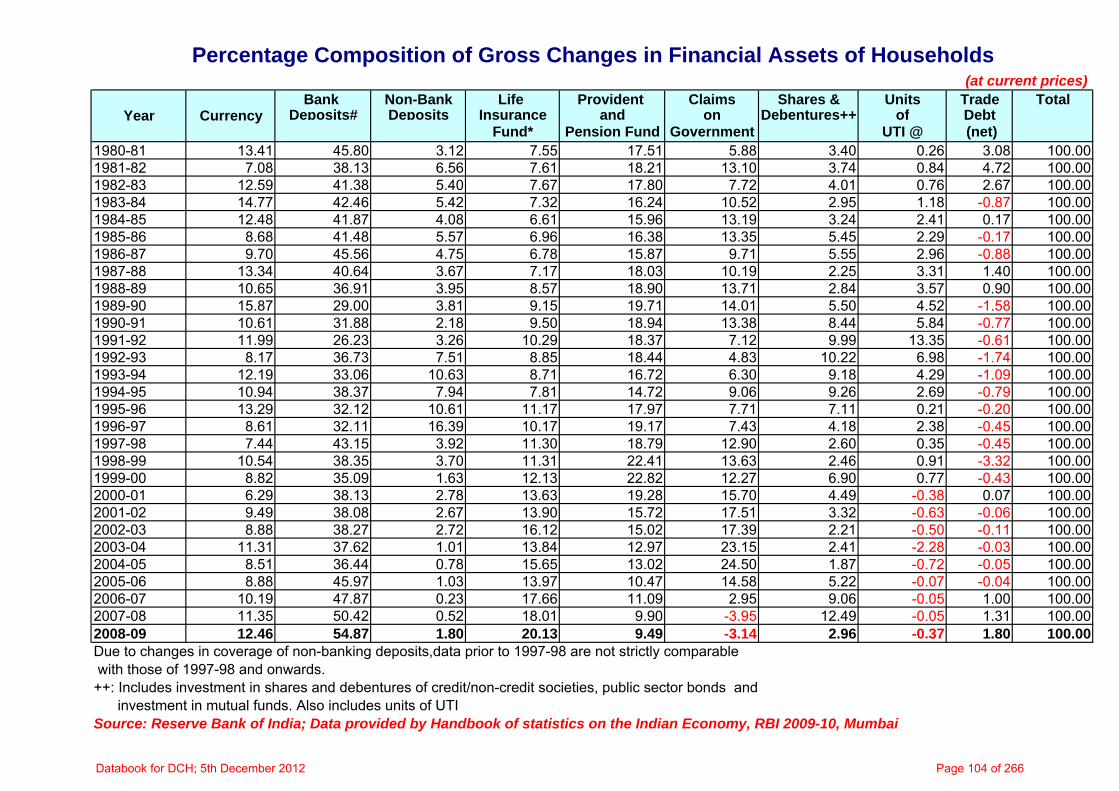
Percentage Composition of Gross Changes in Financial Assets of Households(at current prices)
Year CurrencyBank Non-Bank Life Provident Claims Shares & Units Trade Total
Deposits# Deposits Insurance and on Debentures++ of DebtFund* Pension Fund Government UTI @ (net)
1980-81 13.41 45.80 3.12 7.55 17.51 5.88 3.40 0.26 3.08 100.00 1981-82 7.08 38.13 6.56 7.61 18.21 13.10 3.74 0.84 4.72 100.00 1982-83 12.59 41.38 5.40 7.67 17.80 7.72 4.01 0.76 2.67 100.00 1983-84 14.77 42.46 5.42 7.32 16.24 10.52 2.95 1.18 -0.87 100.00 1984-85 12.48 41.87 4.08 6.61 15.96 13.19 3.24 2.41 0.17 100.00 1985-86 8.68 41.48 5.57 6.96 16.38 13.35 5.45 2.29 -0.17 100.00 1986-87 9.70 45.56 4.75 6.78 15.87 9.71 5.55 2.96 -0.88 100.00 1987-88 13.34 40.64 3.67 7.17 18.03 10.19 2.25 3.31 1.40 100.00 1988-89 10.65 36.91 3.95 8.57 18.90 13.71 2.84 3.57 0.90 100.00 1989-90 15.87 29.00 3.81 9.15 19.71 14.01 5.50 4.52 -1.58 100.00 1990-91 10.61 31.88 2.18 9.50 18.94 13.38 8.44 5.84 -0.77 100.00 1991-92 11.99 26.23 3.26 10.29 18.37 7.12 9.99 13.35 -0.61 100.00 1992-93 8.17 36.73 7.51 8.85 18.44 4.83 10.22 6.98 -1.74 100.00 1993-94 12.19 33.06 10.63 8.71 16.72 6.30 9.18 4.29 -1.09 100.00 1994-95 10.94 38.37 7.94 7.81 14.72 9.06 9.26 2.69 -0.79 100.00 1995-96 13.29 32.12 10.61 11.17 17.97 7.71 7.11 0.21 -0.20 100.00 1996-97 8.61 32.11 16.39 10.17 19.17 7.43 4.18 2.38 -0.45 100.00 1997-98 7.44 43.15 3.92 11.30 18.79 12.90 2.60 0.35 -0.45 100.00 1998-99 10.54 38.35 3.70 11.31 22.41 13.63 2.46 0.91 -3.32 100.00 1999-00 8.82 35.09 1.63 12.13 22.82 12.27 6.90 0.77 -0.43 100.00 2000-01 6.29 38.13 2.78 13.63 19.28 15.70 4.49 -0.38 0.07 100.00 2001-02 9.49 38.08 2.67 13.90 15.72 17.51 3.32 -0.63 -0.06 100.00 2002-03 8.88 38.27 2.72 16.12 15.02 17.39 2.21 -0.50 -0.11 100.00 2003-04 11.31 37.62 1.01 13.84 12.97 23.15 2.41 -2.28 -0.03 100.00 2004-05 8.51 36.44 0.78 15.65 13.02 24.50 1.87 -0.72 -0.05 100.00 2005-06 8.88 45.97 1.03 13.97 10.47 14.58 5.22 -0.07 -0.04 100.00 2006-07 10.19 47.87 0.23 17.66 11.09 2.95 9.06 -0.05 1.00 100.00 2007-08 11.35 50.42 0.52 18.01 9.90 -3.95 12.49 -0.05 1.31 100.00 2008-09 12.46 54.87 1.80 20.13 9.49 -3.14 2.96 -0.37 1.80 100.00 Due to changes in coverage of non-banking deposits,data prior to 1997-98 are not strictly comparable with those of 1997-98 and onwards.++: Includes investment in shares and debentures of credit/non-credit societies, public sector bonds and investment in mutual funds. Also includes units of UTISource: Reserve Bank of India; Data provided by Handbook of statistics on the Indian Economy, RBI 2009-10, Mumbai
Databook for DCH; 5th December 2012 Page 104 of 266
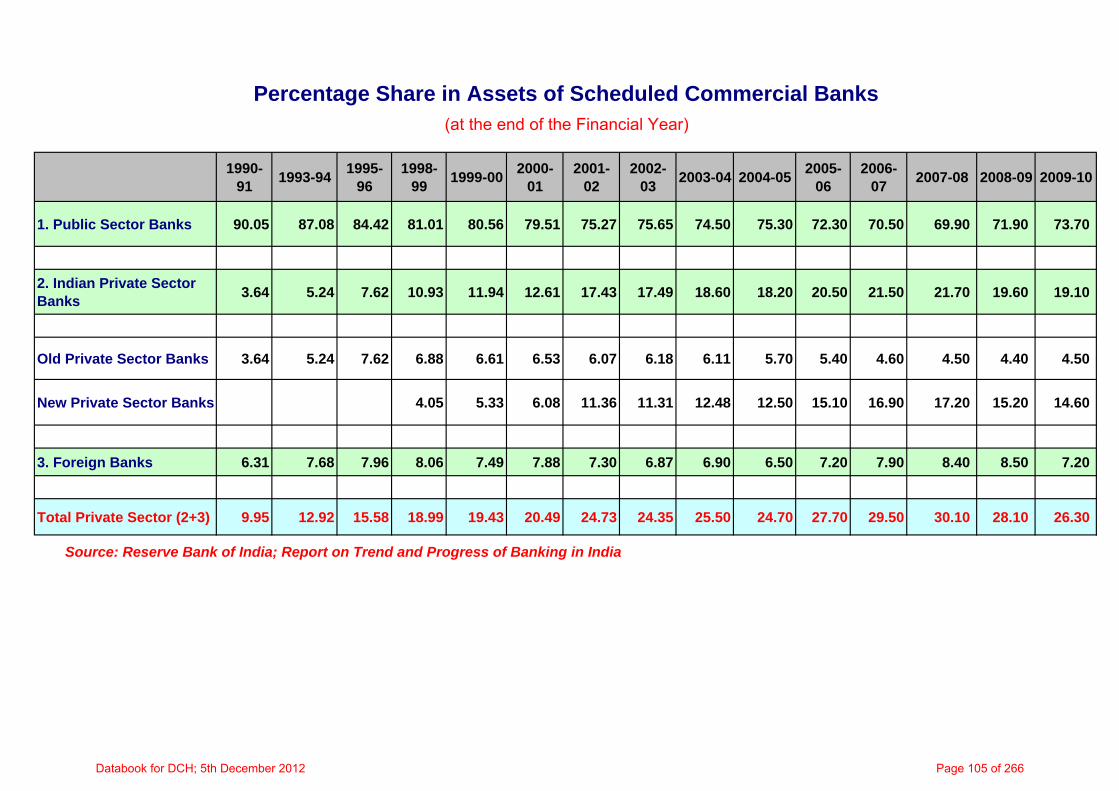
Percentage Share in Assets of Scheduled Commercial Banks (at the end of the Financial Year)
1990-91 1993-94 1995-
961998-
99 1999-00 2000-01
2001-02
2002-03 2003-04 2004-05 2005-
062006-
07 2007-08 2008-09 2009-10
1. Public Sector Banks 90.05 87.08 84.42 81.01 80.56 79.51 75.27 75.65 74.50 75.30 72.30 70.50 69.90 71.90 73.70
2. Indian Private Sector Banks 3.64 5.24 7.62 10.93 11.94 12.61 17.43 17.49 18.60 18.20 20.50 21.50 21.70 19.60 19.10
Old Private Sector Banks 3.64 5.24 7.62 6.88 6.61 6.53 6.07 6.18 6.11 5.70 5.40 4.60 4.50 4.40 4.50
New Private Sector Banks 4.05 5.33 6.08 11.36 11.31 12.48 12.50 15.10 16.90 17.20 15.20 14.60
3. Foreign Banks 6.31 7.68 7.96 8.06 7.49 7.88 7.30 6.87 6.90 6.50 7.20 7.90 8.40 8.50 7.20
Total Private Sector (2+3) 9.95 12.92 15.58 18.99 19.43 20.49 24.73 24.35 25.50 24.70 27.70 29.50 30.10 28.10 26.30
Source: Reserve Bank of India; Report on Trend and Progress of Banking in India
Databook for DCH; 5th December 2012 Page 105 of 266
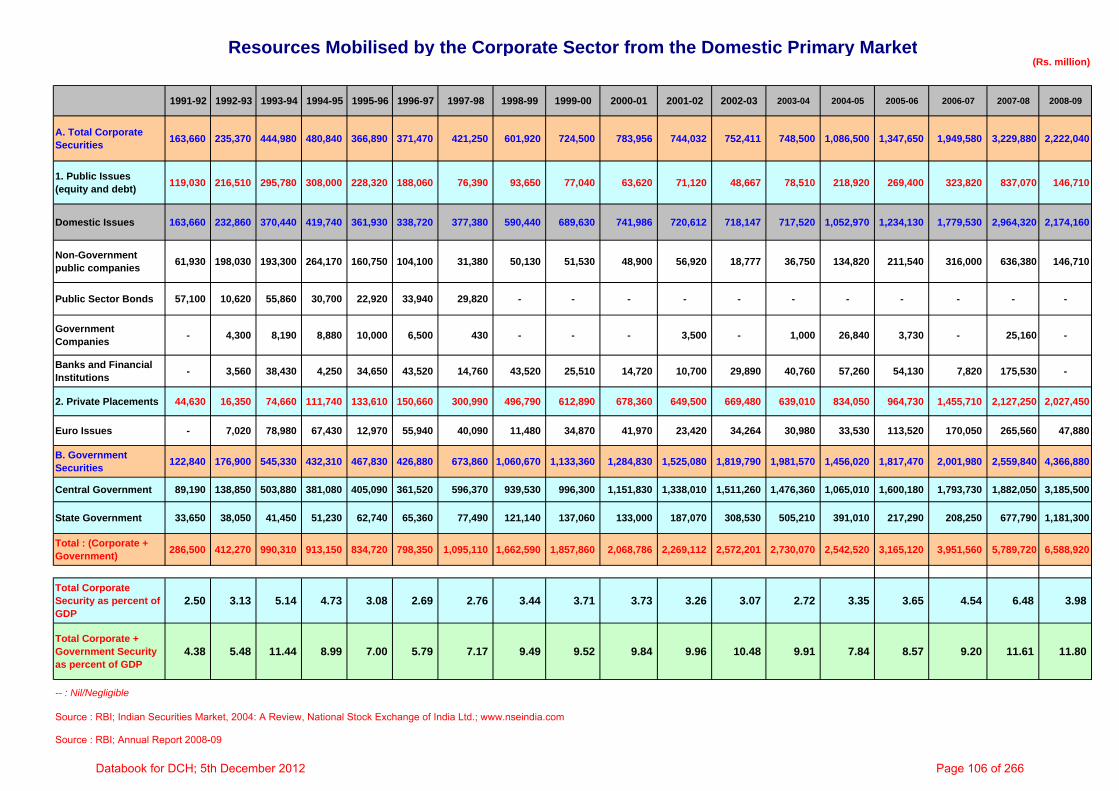
Resources Mobilised by the Corporate Sector from the Domestic Primary Market(Rs. million)
1991-92 1992-93 1993-94 1994-95 1995-96 1996-97 1997-98 1998-99 1999-00 2000-01 2001-02 2002-03 2003-04 2004-05 2005-06 2006-07 2007-08 2008-09
A. Total Corporate Securities 163,660 235,370 444,980 480,840 366,890 371,470 421,250 601,920 724,500 783,956 744,032 752,411 748,500 1,086,500 1,347,650 1,949,580 3,229,880 2,222,040
1. Public Issues (equity and debt) 119,030 216,510 295,780 308,000 228,320 188,060 76,390 93,650 77,040 63,620 71,120 48,667 78,510 218,920 269,400 323,820 837,070 146,710
Domestic Issues 163,660 232,860 370,440 419,740 361,930 338,720 377,380 590,440 689,630 741,986 720,612 718,147 717,520 1,052,970 1,234,130 1,779,530 2,964,320 2,174,160
Non-Government public companies 61,930 198,030 193,300 264,170 160,750 104,100 31,380 50,130 51,530 48,900 56,920 18,777 36,750 134,820 211,540 316,000 636,380 146,710
Public Sector Bonds 57,100 10,620 55,860 30,700 22,920 33,940 29,820 - - - - - - - - - - -
Government Companies - 4,300 8,190 8,880 10,000 6,500 430 - - - 3,500 - 1,000 26,840 3,730 - 25,160 -
Banks and Financial Institutions - 3,560 38,430 4,250 34,650 43,520 14,760 43,520 25,510 14,720 10,700 29,890 40,760 57,260 54,130 7,820 175,530 -
2. Private Placements 44,630 16,350 74,660 111,740 133,610 150,660 300,990 496,790 612,890 678,360 649,500 669,480 639,010 834,050 964,730 1,455,710 2,127,250 2,027,450
Euro Issues - 7,020 78,980 67,430 12,970 55,940 40,090 11,480 34,870 41,970 23,420 34,264 30,980 33,530 113,520 170,050 265,560 47,880
B. Government Securities 122,840 176,900 545,330 432,310 467,830 426,880 673,860 1,060,670 1,133,360 1,284,830 1,525,080 1,819,790 1,981,570 1,456,020 1,817,470 2,001,980 2,559,840 4,366,880
Central Government 89,190 138,850 503,880 381,080 405,090 361,520 596,370 939,530 996,300 1,151,830 1,338,010 1,511,260 1,476,360 1,065,010 1,600,180 1,793,730 1,882,050 3,185,500
State Government 33,650 38,050 41,450 51,230 62,740 65,360 77,490 121,140 137,060 133,000 187,070 308,530 505,210 391,010 217,290 208,250 677,790 1,181,300
Total : (Corporate + Government) 286,500 412,270 990,310 913,150 834,720 798,350 1,095,110 1,662,590 1,857,860 2,068,786 2,269,112 2,572,201 2,730,070 2,542,520 3,165,120 3,951,560 5,789,720 6,588,920
Total Corporate Security as percent of GDP
2.50 3.13 5.14 4.73 3.08 2.69 2.76 3.44 3.71 3.73 3.26 3.07 2.72 3.35 3.65 4.54 6.48 3.98
Total Corporate + Government Security as percent of GDP
4.38 5.48 11.44 8.99 7.00 5.79 7.17 9.49 9.52 9.84 9.96 10.48 9.91 7.84 8.57 9.20 11.61 11.80
-- : Nil/Negligible
Source : RBI; Indian Securities Market, 2004: A Review, National Stock Exchange of India Ltd.; www.nseindia.com
Source : RBI; Annual Report 2008-09
Databook for DCH; 5th December 2012 Page 106 of 266
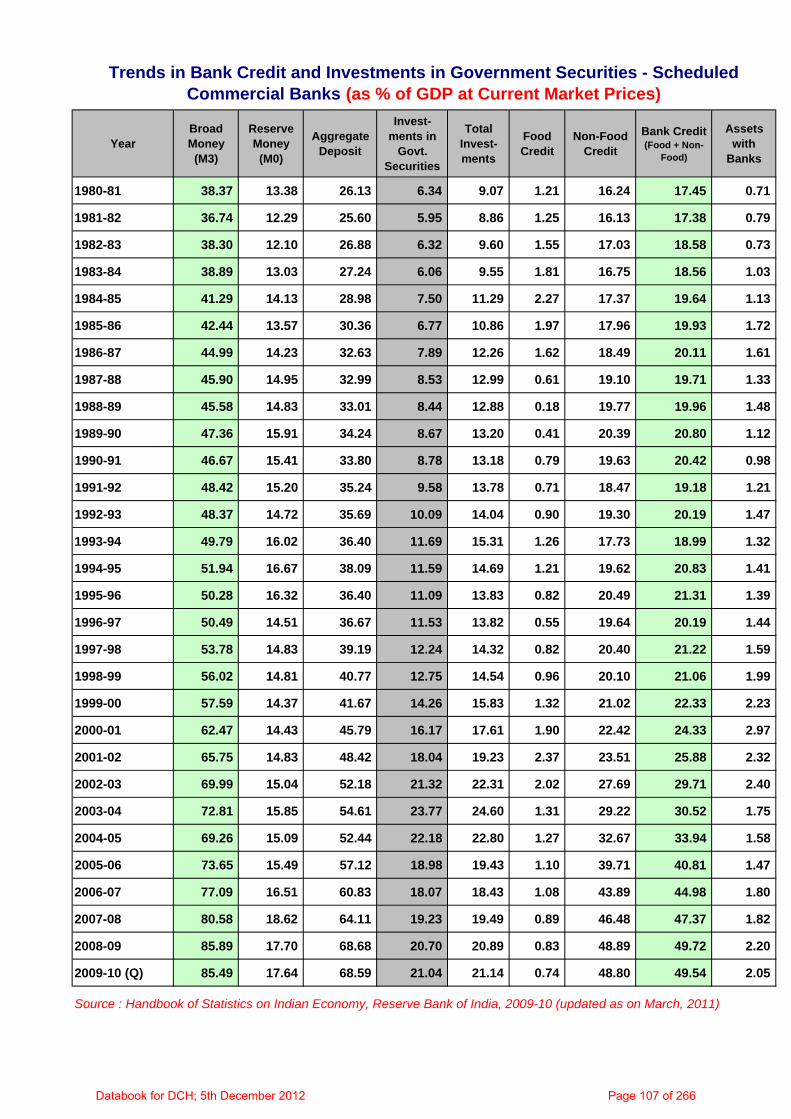
Trends in Bank Credit and Investments in Government Securities - Scheduled Commercial Banks (as % of GDP at Current Market Prices)
YearBroad Money (M3)
Reserve Money (M0)
Aggregate Deposit
Invest-ments in
Govt. Securities
Total Invest-ments
Food Credit
Non-Food Credit
Bank Credit (Food + Non-
Food)
Assets with
Banks
1980-81 38.37 13.38 26.13 6.34 9.07 1.21 16.24 17.45 0.71
1981-82 36.74 12.29 25.60 5.95 8.86 1.25 16.13 17.38 0.79
1982-83 38.30 12.10 26.88 6.32 9.60 1.55 17.03 18.58 0.73
1983-84 38.89 13.03 27.24 6.06 9.55 1.81 16.75 18.56 1.03
1984-85 41.29 14.13 28.98 7.50 11.29 2.27 17.37 19.64 1.13
1985-86 42.44 13.57 30.36 6.77 10.86 1.97 17.96 19.93 1.72
1986-87 44.99 14.23 32.63 7.89 12.26 1.62 18.49 20.11 1.61
1987-88 45.90 14.95 32.99 8.53 12.99 0.61 19.10 19.71 1.33
1988-89 45.58 14.83 33.01 8.44 12.88 0.18 19.77 19.96 1.48
1989-90 47.36 15.91 34.24 8.67 13.20 0.41 20.39 20.80 1.12
1990-91 46.67 15.41 33.80 8.78 13.18 0.79 19.63 20.42 0.98
1991-92 48.42 15.20 35.24 9.58 13.78 0.71 18.47 19.18 1.21
1992-93 48.37 14.72 35.69 10.09 14.04 0.90 19.30 20.19 1.47
1993-94 49.79 16.02 36.40 11.69 15.31 1.26 17.73 18.99 1.32
1994-95 51.94 16.67 38.09 11.59 14.69 1.21 19.62 20.83 1.41
1995-96 50.28 16.32 36.40 11.09 13.83 0.82 20.49 21.31 1.39
1996-97 50.49 14.51 36.67 11.53 13.82 0.55 19.64 20.19 1.44
1997-98 53.78 14.83 39.19 12.24 14.32 0.82 20.40 21.22 1.59
1998-99 56.02 14.81 40.77 12.75 14.54 0.96 20.10 21.06 1.99
1999-00 57.59 14.37 41.67 14.26 15.83 1.32 21.02 22.33 2.23
2000-01 62.47 14.43 45.79 16.17 17.61 1.90 22.42 24.33 2.97
2001-02 65.75 14.83 48.42 18.04 19.23 2.37 23.51 25.88 2.32
2002-03 69.99 15.04 52.18 21.32 22.31 2.02 27.69 29.71 2.40
2003-04 72.81 15.85 54.61 23.77 24.60 1.31 29.22 30.52 1.75
2004-05 69.26 15.09 52.44 22.18 22.80 1.27 32.67 33.94 1.58
2005-06 73.65 15.49 57.12 18.98 19.43 1.10 39.71 40.81 1.47
2006-07 77.09 16.51 60.83 18.07 18.43 1.08 43.89 44.98 1.80
2007-08 80.58 18.62 64.11 19.23 19.49 0.89 46.48 47.37 1.82
2008-09 85.89 17.70 68.68 20.70 20.89 0.83 48.89 49.72 2.20
2009-10 (Q) 85.49 17.64 68.59 21.04 21.14 0.74 48.80 49.54 2.05
Source : Handbook of Statistics on Indian Economy, Reserve Bank of India, 2009-10 (updated as on March, 2011)
Databook for DCH; 5th December 2012 Page 107 of 266
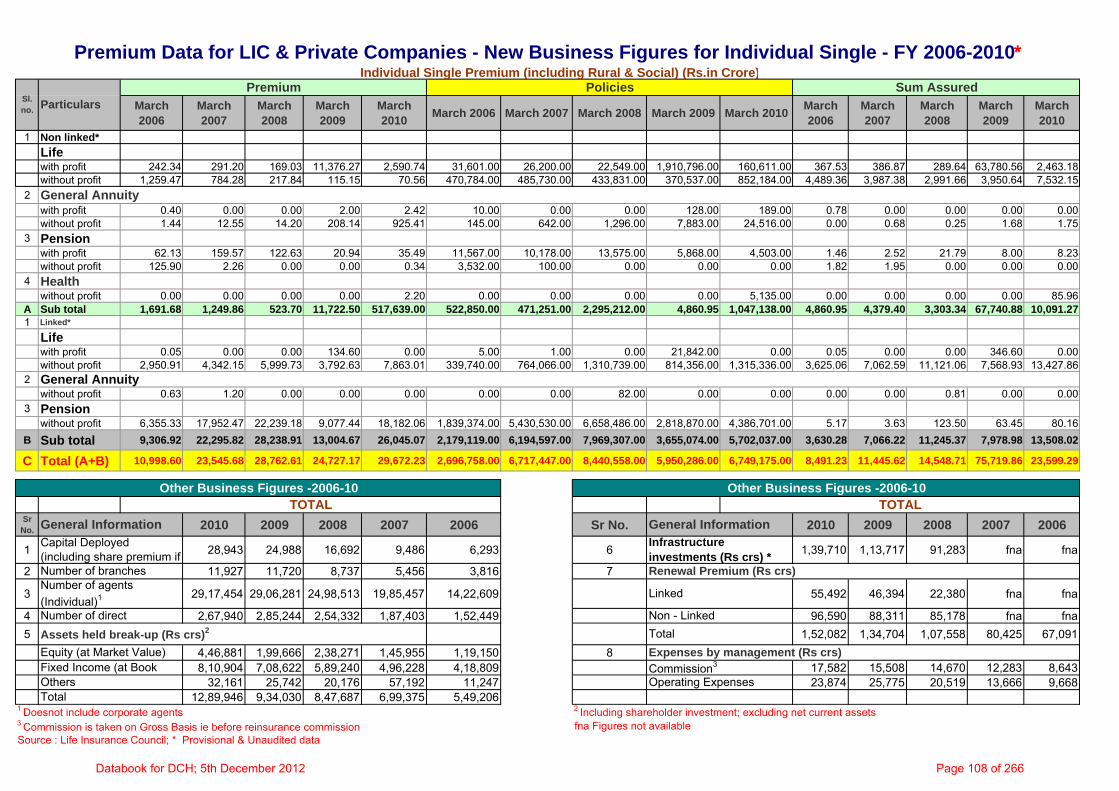
Premium Data for LIC & Private Companies - New Business Figures for Individual Single - FY 2006-2010*Individual Single Premium (including Rural & Social) (Rs.in Crore)
Sl. no. Particulars
Premium Policies Sum AssuredMarch 2006
March 2007
March 2008
March 2009
March 2010 March 2006 March 2007 March 2008 March 2009 March 2010 March
2006March 2007
March 2008
March 2009
March 2010
1 Non linked*Lifewith profit 242.34 291.20 169.03 11,376.27 2,590.74 31,601.00 26,200.00 22,549.00 1,910,796.00 160,611.00 367.53 386.87 289.64 63,780.56 2,463.18 without profit 1,259.47 784.28 217.84 115.15 70.56 470,784.00 485,730.00 433,831.00 370,537.00 852,184.00 4,489.36 3,987.38 2,991.66 3,950.64 7,532.15
2 General Annuitywith profit 0.40 0.00 0.00 2.00 2.42 10.00 0.00 0.00 128.00 189.00 0.78 0.00 0.00 0.00 0.00 without profit 1.44 12.55 14.20 208.14 925.41 145.00 642.00 1,296.00 7,883.00 24,516.00 0.00 0.68 0.25 1.68 1.75
3 Pensionwith profit 62.13 159.57 122.63 20.94 35.49 11,567.00 10,178.00 13,575.00 5,868.00 4,503.00 1.46 2.52 21.79 8.00 8.23 without profit 125.90 2.26 0.00 0.00 0.34 3,532.00 100.00 0.00 0.00 0.00 1.82 1.95 0.00 0.00 0.00
4 Healthwithout profit 0.00 0.00 0.00 0.00 2.20 0.00 0.00 0.00 0.00 5,135.00 0.00 0.00 0.00 0.00 85.96
A Sub total 1,691.68 1,249.86 523.70 11,722.50 517,639.00 522,850.00 471,251.00 2,295,212.00 4,860.95 1,047,138.00 4,860.95 4,379.40 3,303.34 67,740.88 10,091.27 1 Linked*
Lifewith profit 0.05 0.00 0.00 134.60 0.00 5.00 1.00 0.00 21,842.00 0.00 0.05 0.00 0.00 346.60 0.00 without profit 2,950.91 4,342.15 5,999.73 3,792.63 7,863.01 339,740.00 764,066.00 1,310,739.00 814,356.00 1,315,336.00 3,625.06 7,062.59 11,121.06 7,568.93 13,427.86
2 General Annuitywithout profit 0.63 1.20 0.00 0.00 0.00 0.00 0.00 82.00 0.00 0.00 0.00 0.00 0.81 0.00 0.00
3 Pensionwithout profit 6,355.33 17,952.47 22,239.18 9,077.44 18,182.06 1,839,374.00 5,430,530.00 6,658,486.00 2,818,870.00 4,386,701.00 5.17 3.63 123.50 63.45 80.16
B Sub total 9,306.92 22,295.82 28,238.91 13,004.67 26,045.07 2,179,119.00 6,194,597.00 7,969,307.00 3,655,074.00 5,702,037.00 3,630.28 7,066.22 11,245.37 7,978.98 13,508.02
C Total (A+B) 10,998.60 23,545.68 28,762.61 24,727.17 29,672.23 2,696,758.00 6,717,447.00 8,440,558.00 5,950,286.00 6,749,175.00 8,491.23 11,445.62 14,548.71 75,719.86 23,599.29
Other Business Figures -2006-10 Other Business Figures -2006-10 TOTAL TOTAL
Sr No. General Information 2010 2009 2008 2007 2006 Sr No. General Information 2010 2009 2008 2007 2006
1 Capital Deployed (including share premium if 28,943 24,988 16,692 9,486 6,293 6
Infrastructure investments (Rs crs) * 1,39,710 1,13,717 91,283 fna fna
2 Number of branches 11,927 11,720 8,737 5,456 3,816 7 Renewal Premium (Rs crs)
3Number of agents (Individual)1 29,17,454 29,06,281 24,98,513 19,85,457 14,22,609 Linked 55,492 46,394 22,380 fna fna
4 Number of direct 2,67,940 2,85,244 2,54,332 1,87,403 1,52,449 Non - Linked 96,590 88,311 85,178 fna fna5 Assets held break-up (Rs crs)2 Total 1,52,082 1,34,704 1,07,558 80,425 67,091
Equity (at Market Value) 4,46,881 1,99,666 2,38,271 1,45,955 1,19,150 8 Expenses by management (Rs crs)Fixed Income (at Book 8,10,904 7,08,622 5,89,240 4,96,228 4,18,809 Commission3 17,582 15,508 14,670 12,283 8,643Others 32,161 25,742 20,176 57,192 11,247 Operating Expenses 23,874 25,775 20,519 13,666 9,668Total 12,89,946 9,34,030 8,47,687 6,99,375 5,49,206
1 Doesnot include corporate agents 2 Including shareholder investment; excluding net current assets3 Commission is taken on Gross Basis ie before reinsurance commission fna Figures not availableSource : Life Insurance Council; * Provisional & Unaudited data
Databook for DCH; 5th December 2012 Page 108 of 266
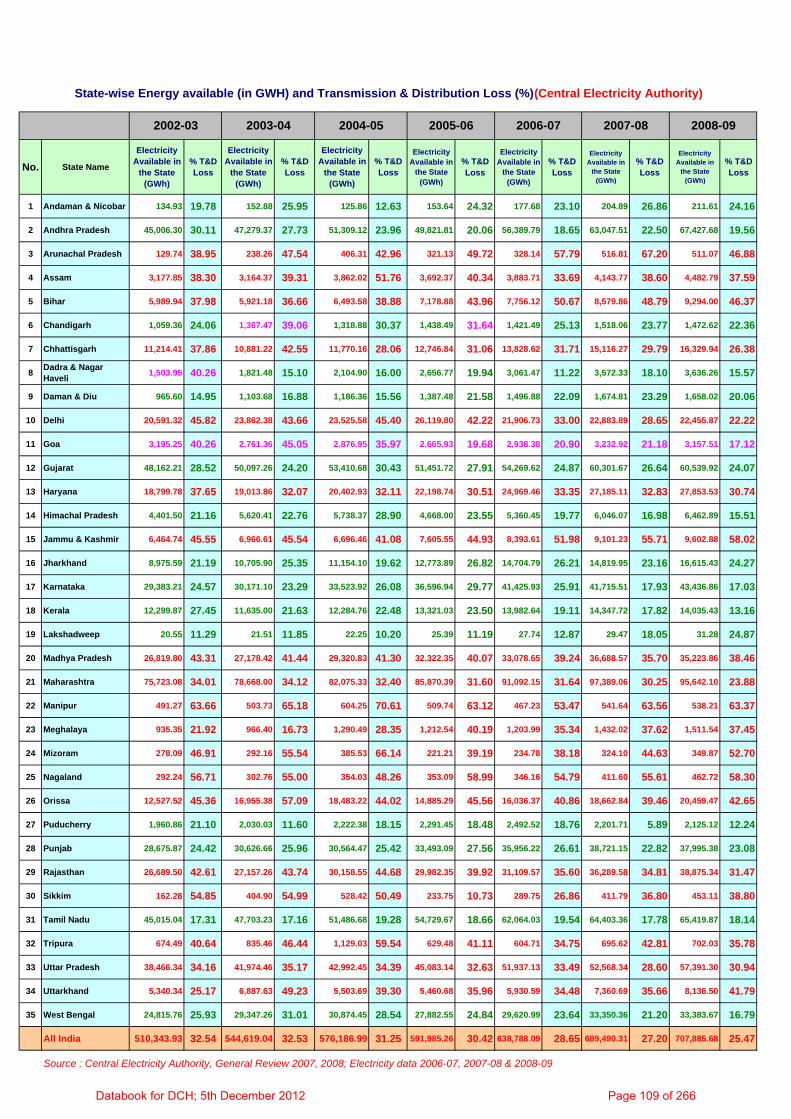
No. State Name
Electricity Available in
the State (GWh)
% T&D Loss
Electricity Available in
the State (GWh)
% T&D Loss
Electricity Available in
the State (GWh)
% T&D Loss
Electricity Available in
the State (GWh)
% T&D Loss
Electricity Available in
the State (GWh)
% T&D Loss
Electricity Available in
the State (GWh)
% T&D Loss
Electricity Available in
the State (GWh)
% T&D Loss
1 Andaman & Nicobar 134.93 19.78 152.88 25.95 125.86 12.63 153.64 24.32 177.68 23.10 204.89 26.86 211.61 24.16
2 Andhra Pradesh 45,006.30 30.11 47,279.37 27.73 51,309.12 23.96 49,821.81 20.06 56,389.79 18.65 63,047.51 22.50 67,427.68 19.56
3 Arunachal Pradesh 129.74 38.95 238.26 47.54 406.31 42.96 321.13 49.72 328.14 57.79 516.81 67.20 511.07 46.88
4 Assam 3,177.85 38.30 3,164.37 39.31 3,862.02 51.76 3,692.37 40.34 3,883.71 33.69 4,143.77 38.60 4,482.79 37.59
5 Bihar 5,989.94 37.98 5,921.18 36.66 6,493.58 38.88 7,178.88 43.96 7,756.12 50.67 8,579.86 48.79 9,294.00 46.37
6 Chandigarh 1,059.36 24.06 1,367.47 39.06 1,318.88 30.37 1,438.49 31.64 1,421.49 25.13 1,518.06 23.77 1,472.62 22.36
7 Chhattisgarh 11,214.41 37.86 10,881.22 42.55 11,770.16 28.06 12,746.84 31.06 13,828.62 31.71 15,116.27 29.79 16,329.94 26.38
8 Dadra & Nagar Haveli 1,503.95 40.26 1,821.48 15.10 2,104.90 16.00 2,656.77 19.94 3,061.47 11.22 3,572.33 18.10 3,636.26 15.57
9 Daman & Diu 965.60 14.95 1,103.68 16.88 1,186.36 15.56 1,387.48 21.58 1,496.88 22.09 1,674.81 23.29 1,658.02 20.06
10 Delhi 20,591.32 45.82 23,862.38 43.66 23,525.58 45.40 26,119.80 42.22 21,906.73 33.00 22,883.89 28.65 22,455.87 22.22
11 Goa 3,195.25 40.26 2,761.36 45.05 2,876.95 35.97 2,665.93 19.68 2,938.38 20.90 3,232.92 21.18 3,157.51 17.12
12 Gujarat 48,162.21 28.52 50,097.26 24.20 53,410.68 30.43 51,451.72 27.91 54,269.62 24.87 60,301.67 26.64 60,539.92 24.07
13 Haryana 18,799.78 37.65 19,013.86 32.07 20,402.93 32.11 22,198.74 30.51 24,969.46 33.35 27,185.11 32.83 27,853.53 30.74
14 Himachal Pradesh 4,401.50 21.16 5,620.41 22.76 5,738.37 28.90 4,668.00 23.55 5,360.45 19.77 6,046.07 16.98 6,462.89 15.51
15 Jammu & Kashmir 6,464.74 45.55 6,966.61 45.54 6,696.46 41.08 7,605.55 44.93 8,393.61 51.98 9,101.23 55.71 9,602.88 58.02
16 Jharkhand 8,975.59 21.19 10,705.90 25.35 11,154.10 19.62 12,773.89 26.82 14,704.79 26.21 14,819.95 23.16 16,615.43 24.27
17 Karnataka 29,383.21 24.57 30,171.10 23.29 33,523.92 26.08 36,596.94 29.77 41,425.93 25.91 41,715.51 17.93 43,436.86 17.03
18 Kerala 12,299.87 27.45 11,635.00 21.63 12,284.76 22.48 13,321.03 23.50 13,982.64 19.11 14,347.72 17.82 14,035.43 13.16
19 Lakshadweep 20.55 11.29 21.51 11.85 22.25 10.20 25.39 11.19 27.74 12.87 29.47 18.05 31.28 24.87
20 Madhya Pradesh 26,819.80 43.31 27,178.42 41.44 29,320.83 41.30 32,322.35 40.07 33,078.65 39.24 36,688.57 35.70 35,223.86 38.46
21 Maharashtra 75,723.08 34.01 78,668.00 34.12 82,075.33 32.40 85,870.39 31.60 91,092.15 31.64 97,389.06 30.25 95,642.10 23.88
22 Manipur 491.27 63.66 503.73 65.18 604.25 70.61 509.74 63.12 467.23 53.47 541.64 63.56 538.21 63.37
23 Meghalaya 935.35 21.92 966.40 16.73 1,290.49 28.35 1,212.54 40.19 1,203.99 35.34 1,432.02 37.62 1,511.54 37.45
24 Mizoram 278.09 46.91 292.16 55.54 385.53 66.14 221.21 39.19 234.78 38.18 324.10 44.63 349.87 52.70
25 Nagaland 292.24 56.71 302.76 55.00 354.03 48.26 353.09 58.99 346.16 54.79 411.60 55.61 462.72 58.30
26 Orissa 12,527.52 45.36 16,955.38 57.09 18,483.22 44.02 14,885.29 45.56 16,036.37 40.86 18,662.84 39.46 20,459.47 42.65
27 Puducherry 1,960.86 21.10 2,030.03 11.60 2,222.38 18.15 2,291.45 18.48 2,492.52 18.76 2,201.71 5.89 2,125.12 12.24
28 Punjab 28,675.87 24.42 30,626.66 25.96 30,564.47 25.42 33,493.09 27.56 35,956.22 26.61 38,721.15 22.82 37,995.38 23.08
29 Rajasthan 26,689.50 42.61 27,157.26 43.74 30,158.55 44.68 29,982.35 39.92 31,109.57 35.60 36,289.58 34.81 38,875.34 31.47
30 Sikkim 162.28 54.85 404.90 54.99 528.42 50.49 233.75 10.73 289.75 26.86 411.79 36.80 453.11 38.80
31 Tamil Nadu 45,015.04 17.31 47,703.23 17.16 51,486.68 19.28 54,729.67 18.66 62,064.03 19.54 64,403.36 17.78 65,419.87 18.14
32 Tripura 674.49 40.64 835.46 46.44 1,129.03 59.54 629.48 41.11 604.71 34.75 695.62 42.81 702.03 35.78
33 Uttar Pradesh 38,466.34 34.16 41,974.46 35.17 42,992.45 34.39 45,083.14 32.63 51,937.13 33.49 52,568.34 28.60 57,391.30 30.94
34 Uttarkhand 5,340.34 25.17 6,887.63 49.23 5,503.69 39.30 5,460.68 35.96 5,930.59 34.48 7,360.69 35.66 8,136.50 41.79
35 West Bengal 24,815.76 25.93 29,347.26 31.01 30,874.45 28.54 27,882.55 24.84 29,620.99 23.64 33,350.36 21.20 33,383.67 16.79
All India 510,343.93 32.54 544,619.04 32.53 576,186.99 31.25 591,985.26 30.42 638,788.09 28.65 689,490.31 27.20 707,885.68 25.47
Source : Central Electricity Authority, General Review 2007, 2008; Electricity data 2006-07, 2007-08 & 2008-09
2007-08
State-wise Energy available (in GWH) and Transmission & Distribution Loss (%) (Central Electricity Authority)
2008-092002-03 2003-04 2004-05 2005-06 2006-07
Databook for DCH; 5th December 2012 Page 109 of 266
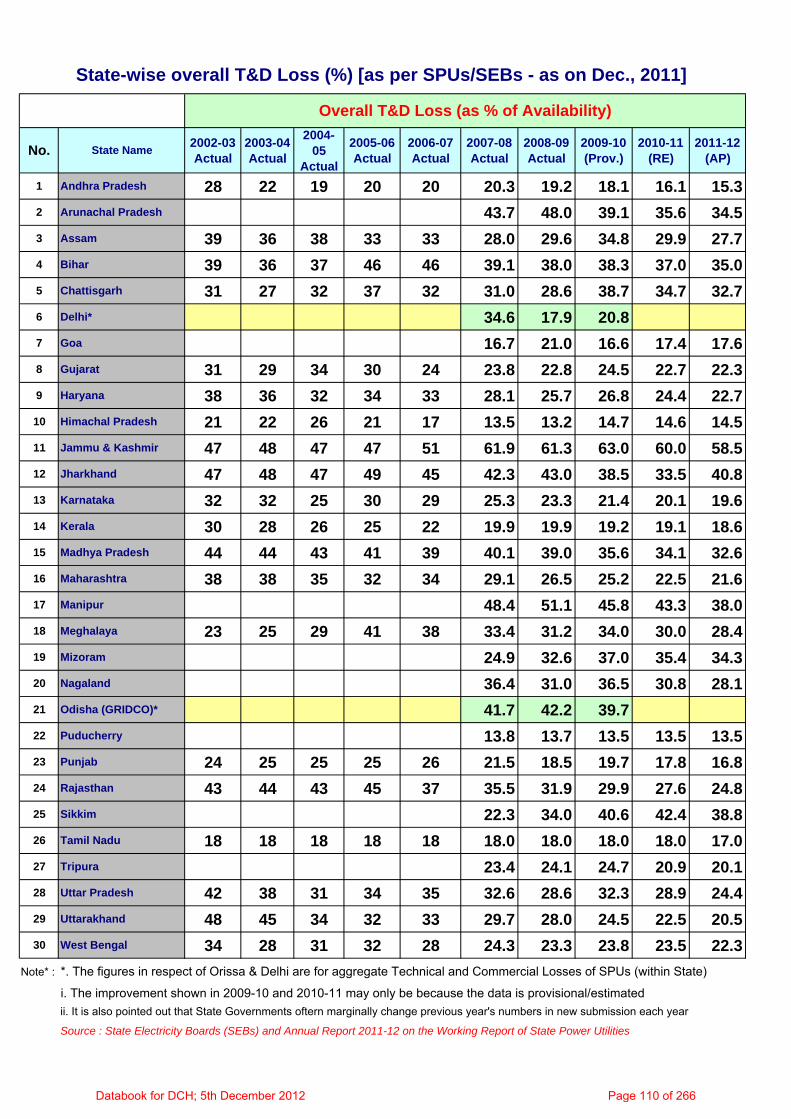
State-wise overall T&D Loss (%) [as per SPUs/SEBs - as on Dec., 2011]
Overall T&D Loss (as % of Availability)
No. State Name2002-03
Actual
2003-04
Actual
2004-
05
Actual
2005-06
Actual
2006-07
Actual
2007-08
Actual
2008-09
Actual
2009-10
(Prov.)
2010-11
(RE)
2011-12
(AP)
1 Andhra Pradesh 28 22 19 20 20 20.3 19.2 18.1 16.1 15.3
2 Arunachal Pradesh 43.7 48.0 39.1 35.6 34.5
3 Assam 39 36 38 33 33 28.0 29.6 34.8 29.9 27.7
4 Bihar 39 36 37 46 46 39.1 38.0 38.3 37.0 35.0
5 Chattisgarh 31 27 32 37 32 31.0 28.6 38.7 34.7 32.7
6 Delhi* 34.6 17.9 20.8
7 Goa 16.7 21.0 16.6 17.4 17.6
8 Gujarat 31 29 34 30 24 23.8 22.8 24.5 22.7 22.3
9 Haryana 38 36 32 34 33 28.1 25.7 26.8 24.4 22.7
10 Himachal Pradesh 21 22 26 21 17 13.5 13.2 14.7 14.6 14.5
11 Jammu & Kashmir 47 48 47 47 51 61.9 61.3 63.0 60.0 58.5
12 Jharkhand 47 48 47 49 45 42.3 43.0 38.5 33.5 40.8
13 Karnataka 32 32 25 30 29 25.3 23.3 21.4 20.1 19.6
14 Kerala 30 28 26 25 22 19.9 19.9 19.2 19.1 18.6
15 Madhya Pradesh 44 44 43 41 39 40.1 39.0 35.6 34.1 32.6
16 Maharashtra 38 38 35 32 34 29.1 26.5 25.2 22.5 21.6
17 Manipur 48.4 51.1 45.8 43.3 38.0
18 Meghalaya 23 25 29 41 38 33.4 31.2 34.0 30.0 28.4
19 Mizoram 24.9 32.6 37.0 35.4 34.3
20 Nagaland 36.4 31.0 36.5 30.8 28.1
21 Odisha (GRIDCO)* 41.7 42.2 39.7
22 Puducherry 13.8 13.7 13.5 13.5 13.5
23 Punjab 24 25 25 25 26 21.5 18.5 19.7 17.8 16.8
24 Rajasthan 43 44 43 45 37 35.5 31.9 29.9 27.6 24.8
25 Sikkim 22.3 34.0 40.6 42.4 38.8
26 Tamil Nadu 18 18 18 18 18 18.0 18.0 18.0 18.0 17.0
27 Tripura 23.4 24.1 24.7 20.9 20.1
28 Uttar Pradesh 42 38 31 34 35 32.6 28.6 32.3 28.9 24.4
29 Uttarakhand 48 45 34 32 33 29.7 28.0 24.5 22.5 20.5
30 West Bengal 34 28 31 32 28 24.3 23.3 23.8 23.5 22.3
Note* : *. The figures in respect of Orissa & Delhi are for aggregate Technical and Commercial Losses of SPUs (within State)
i. The improvement shown in 2009-10 and 2010-11 may only be because the data is provisional/estimatedii. It is also pointed out that State Governments oftern marginally change previous year's numbers in new submission each year
Source : State Electricity Boards (SEBs) and Annual Report 2011-12 on the Working Report of State Power Utilities
Databook for DCH; 5th December 2012 Page 110 of 266
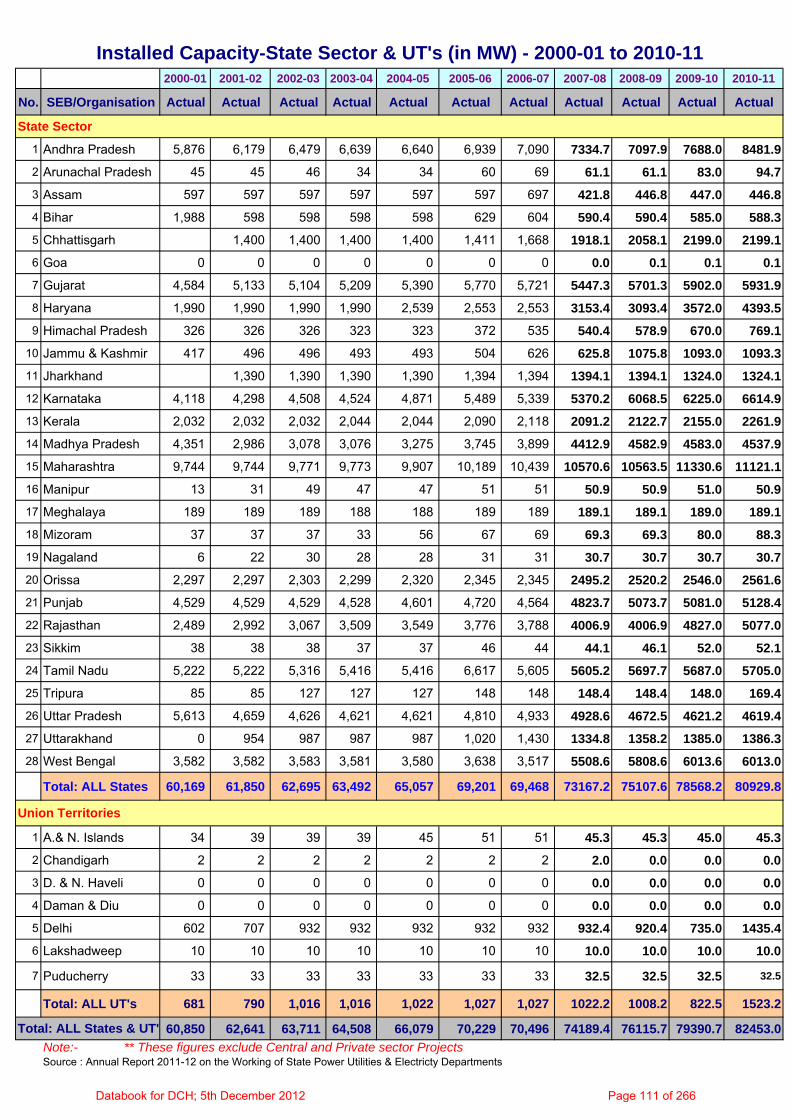
Installed Capacity-State Sector & UT's (in MW) - 2000-01 to 2010-11
2000-01 2001-02 2002-03 2003-04 2004-05 2005-06 2006-07 2007-08 2008-09 2009-10 2010-11
No. SEB/Organisation Actual Actual Actual Actual Actual Actual Actual Actual Actual Actual Actual
State Sector
1 Andhra Pradesh 5,876 6,179 6,479 6,639 6,640 6,939 7,090 7334.7 7097.9 7688.0 8481.9
2 Arunachal Pradesh 45 45 46 34 34 60 69 61.1 61.1 83.0 94.7
3 Assam 597 597 597 597 597 597 697 421.8 446.8 447.0 446.8
4 Bihar 1,988 598 598 598 598 629 604 590.4 590.4 585.0 588.3
5 Chhattisgarh 1,400 1,400 1,400 1,400 1,411 1,668 1918.1 2058.1 2199.0 2199.1
6 Goa 0 0 0 0 0 0 0 0.0 0.1 0.1 0.1
7 Gujarat 4,584 5,133 5,104 5,209 5,390 5,770 5,721 5447.3 5701.3 5902.0 5931.9
8 Haryana 1,990 1,990 1,990 1,990 2,539 2,553 2,553 3153.4 3093.4 3572.0 4393.5
9 Himachal Pradesh 326 326 326 323 323 372 535 540.4 578.9 670.0 769.1
10 Jammu & Kashmir 417 496 496 493 493 504 626 625.8 1075.8 1093.0 1093.3
11 Jharkhand 1,390 1,390 1,390 1,390 1,394 1,394 1394.1 1394.1 1324.0 1324.1
12 Karnataka 4,118 4,298 4,508 4,524 4,871 5,489 5,339 5370.2 6068.5 6225.0 6614.9
13 Kerala 2,032 2,032 2,032 2,044 2,044 2,090 2,118 2091.2 2122.7 2155.0 2261.9
14 Madhya Pradesh 4,351 2,986 3,078 3,076 3,275 3,745 3,899 4412.9 4582.9 4583.0 4537.9
15 Maharashtra 9,744 9,744 9,771 9,773 9,907 10,189 10,439 10570.6 10563.5 11330.6 11121.1
16 Manipur 13 31 49 47 47 51 51 50.9 50.9 51.0 50.9
17 Meghalaya 189 189 189 188 188 189 189 189.1 189.1 189.0 189.1
18 Mizoram 37 37 37 33 56 67 69 69.3 69.3 80.0 88.3
19 Nagaland 6 22 30 28 28 31 31 30.7 30.7 30.7 30.7
20 Orissa 2,297 2,297 2,303 2,299 2,320 2,345 2,345 2495.2 2520.2 2546.0 2561.6
21 Punjab 4,529 4,529 4,529 4,528 4,601 4,720 4,564 4823.7 5073.7 5081.0 5128.4
22 Rajasthan 2,489 2,992 3,067 3,509 3,549 3,776 3,788 4006.9 4006.9 4827.0 5077.0
23 Sikkim 38 38 38 37 37 46 44 44.1 46.1 52.0 52.1
24 Tamil Nadu 5,222 5,222 5,316 5,416 5,416 6,617 5,605 5605.2 5697.7 5687.0 5705.0
25 Tripura 85 85 127 127 127 148 148 148.4 148.4 148.0 169.4
26 Uttar Pradesh 5,613 4,659 4,626 4,621 4,621 4,810 4,933 4928.6 4672.5 4621.2 4619.4
27 Uttarakhand 0 954 987 987 987 1,020 1,430 1334.8 1358.2 1385.0 1386.3
28 West Bengal 3,582 3,582 3,583 3,581 3,580 3,638 3,517 5508.6 5808.6 6013.6 6013.0
Total: ALL States 60,169 61,850 62,695 63,492 65,057 69,201 69,468 73167.2 75107.6 78568.2 80929.8
Union Territories
1 A.& N. Islands 34 39 39 39 45 51 51 45.3 45.3 45.0 45.3
2 Chandigarh 2 2 2 2 2 2 2 2.0 0.0 0.0 0.0
3 D. & N. Haveli 0 0 0 0 0 0 0 0.0 0.0 0.0 0.0
4 Daman & Diu 0 0 0 0 0 0 0 0.0 0.0 0.0 0.0
5 Delhi 602 707 932 932 932 932 932 932.4 920.4 735.0 1435.4
6 Lakshadweep 10 10 10 10 10 10 10 10.0 10.0 10.0 10.0
7 Puducherry 33 33 33 33 33 33 33 32.5 32.5 32.5 32.5
Total: ALL UT's 681 790 1,016 1,016 1,022 1,027 1,027 1022.2 1008.2 822.5 1523.2
Total: ALL States & UT' 60,850s 62,641 63,711 64,508 66,079 70,229 70,496 74189.4 76115.7 79390.7 82453.0
Note:- ** These figures exclude Central and Private sector ProjectsSource : Annual Report 2011-12 on the Working of State Power Utilities & Electricty Departments
Databook for DCH; 5th December 2012 Page 111 of 266
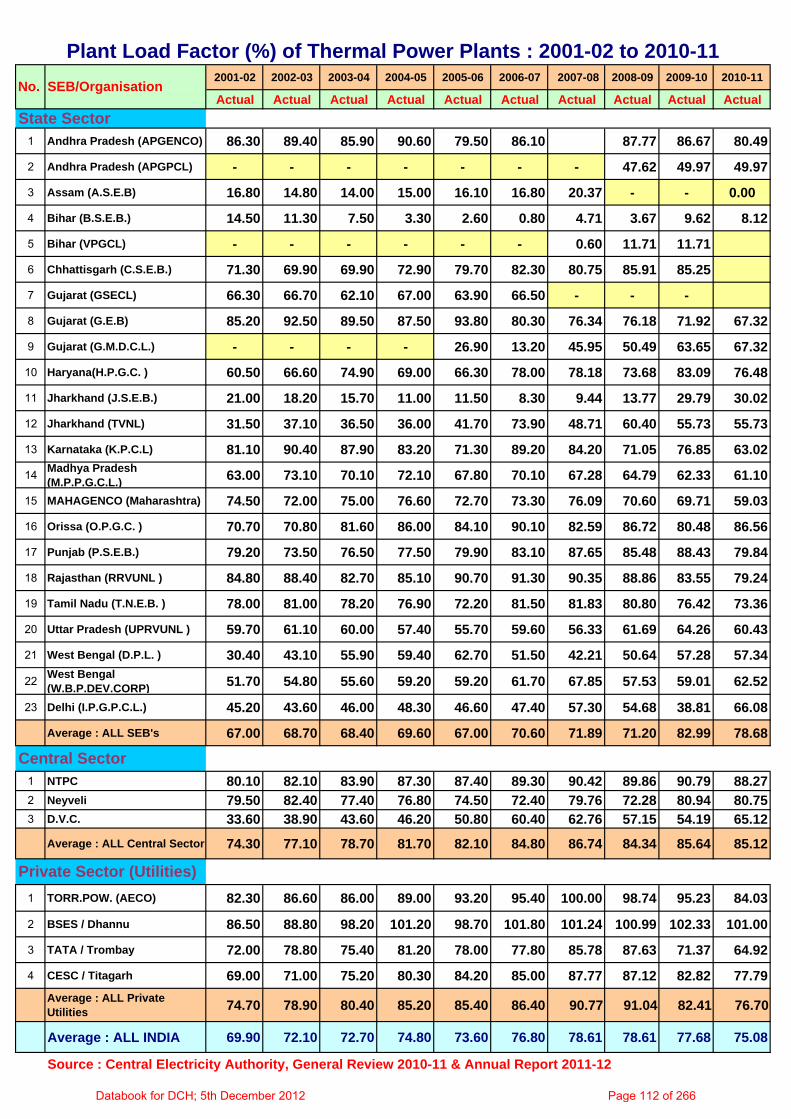
Plant Load Factor (%) of Thermal Power Plants : 2001-02 to 2010-11
No. SEB/Organisation2001-02 2002-03 2003-04 2004-05 2005-06 2006-07 2007-08 2008-09 2009-10 2010-11
Actual Actual Actual Actual Actual Actual Actual Actual Actual Actual
State Sector
1 Andhra Pradesh (APGENCO) 86.30 89.40 85.90 90.60 79.50 86.10 87.77 86.67 80.49
2 Andhra Pradesh (APGPCL) - - - - - - - 47.62 49.97 49.97
3 Assam (A.S.E.B) 16.80 14.80 14.00 15.00 16.10 16.80 20.37 - - 0.00
4 Bihar (B.S.E.B.) 14.50 11.30 7.50 3.30 2.60 0.80 4.71 3.67 9.62 8.12
5 Bihar (VPGCL) - - - - - - 0.60 11.71 11.71
6 Chhattisgarh (C.S.E.B.) 71.30 69.90 69.90 72.90 79.70 82.30 80.75 85.91 85.25
7 Gujarat (GSECL) 66.30 66.70 62.10 67.00 63.90 66.50 - - -
8 Gujarat (G.E.B) 85.20 92.50 89.50 87.50 93.80 80.30 76.34 76.18 71.92 67.32
9 Gujarat (G.M.D.C.L.) - - - - 26.90 13.20 45.95 50.49 63.65 67.32
10 Haryana(H.P.G.C. ) 60.50 66.60 74.90 69.00 66.30 78.00 78.18 73.68 83.09 76.48
11 Jharkhand (J.S.E.B.) 21.00 18.20 15.70 11.00 11.50 8.30 9.44 13.77 29.79 30.02
12 Jharkhand (TVNL) 31.50 37.10 36.50 36.00 41.70 73.90 48.71 60.40 55.73 55.73
13 Karnataka (K.P.C.L) 81.10 90.40 87.90 83.20 71.30 89.20 84.20 71.05 76.85 63.02
14 Madhya Pradesh
(M.P.P.G.C.L.)63.00 73.10 70.10 72.10 67.80 70.10 67.28 64.79 62.33 61.10
15 MAHAGENCO (Maharashtra) 74.50 72.00 75.00 76.60 72.70 73.30 76.09 70.60 69.71 59.03
16 Orissa (O.P.G.C. ) 70.70 70.80 81.60 86.00 84.10 90.10 82.59 86.72 80.48 86.56
17 Punjab (P.S.E.B.) 79.20 73.50 76.50 77.50 79.90 83.10 87.65 85.48 88.43 79.84
18 Rajasthan (RRVUNL ) 84.80 88.40 82.70 85.10 90.70 91.30 90.35 88.86 83.55 79.24
19 Tamil Nadu (T.N.E.B. ) 78.00 81.00 78.20 76.90 72.20 81.50 81.83 80.80 76.42 73.36
20 Uttar Pradesh (UPRVUNL ) 59.70 61.10 60.00 57.40 55.70 59.60 56.33 61.69 64.26 60.43
21 West Bengal (D.P.L. ) 30.40 43.10 55.90 59.40 62.70 51.50 42.21 50.64 57.28 57.34
22 West Bengal
(W.B.P.DEV.CORP)51.70 54.80 55.60 59.20 59.20 61.70 67.85 57.53 59.01 62.52
23 Delhi (I.P.G.P.C.L.) 45.20 43.60 46.00 48.30 46.60 47.40 57.30 54.68 38.81 66.08
Average : ALL SEB's 67.00 68.70 68.40 69.60 67.00 70.60 71.89 71.20 82.99 78.68
Central Sector
1 NTPC 80.10 82.10 83.90 87.30 87.40 89.30 90.42 89.86 90.79 88.27
2 Neyveli 79.50 82.40 77.40 76.80 74.50 72.40 79.76 72.28 80.94 80.75
3 D.V.C. 33.60 38.90 43.60 46.20 50.80 60.40 62.76 57.15 54.19 65.12
Average : ALL Central Sector 74.30 77.10 78.70 81.70 82.10 84.80 86.74 84.34 85.64 85.12
Private Sector (Utilities)
1 TORR.POW. (AECO) 82.30 86.60 86.00 89.00 93.20 95.40 100.00 98.74 95.23 84.03
2 BSES / Dhannu 86.50 88.80 98.20 101.20 98.70 101.80 101.24 100.99 102.33 101.00
3 TATA / Trombay 72.00 78.80 75.40 81.20 78.00 77.80 85.78 87.63 71.37 64.92
4 CESC / Titagarh 69.00 71.00 75.20 80.30 84.20 85.00 87.77 87.12 82.82 77.79
Average : ALL Private
Utilities74.70 78.90 80.40 85.20 85.40 86.40 90.77 91.04 82.41 76.70
Average : ALL INDIA 69.90 72.10 72.70 74.80 73.60 76.80 78.61 78.61 77.68 75.08
Source : Central Electricity Authority, General Review 2010-11 & Annual Report 2011-12
Databook for DCH; 5th December 2012 Page 112 of 266
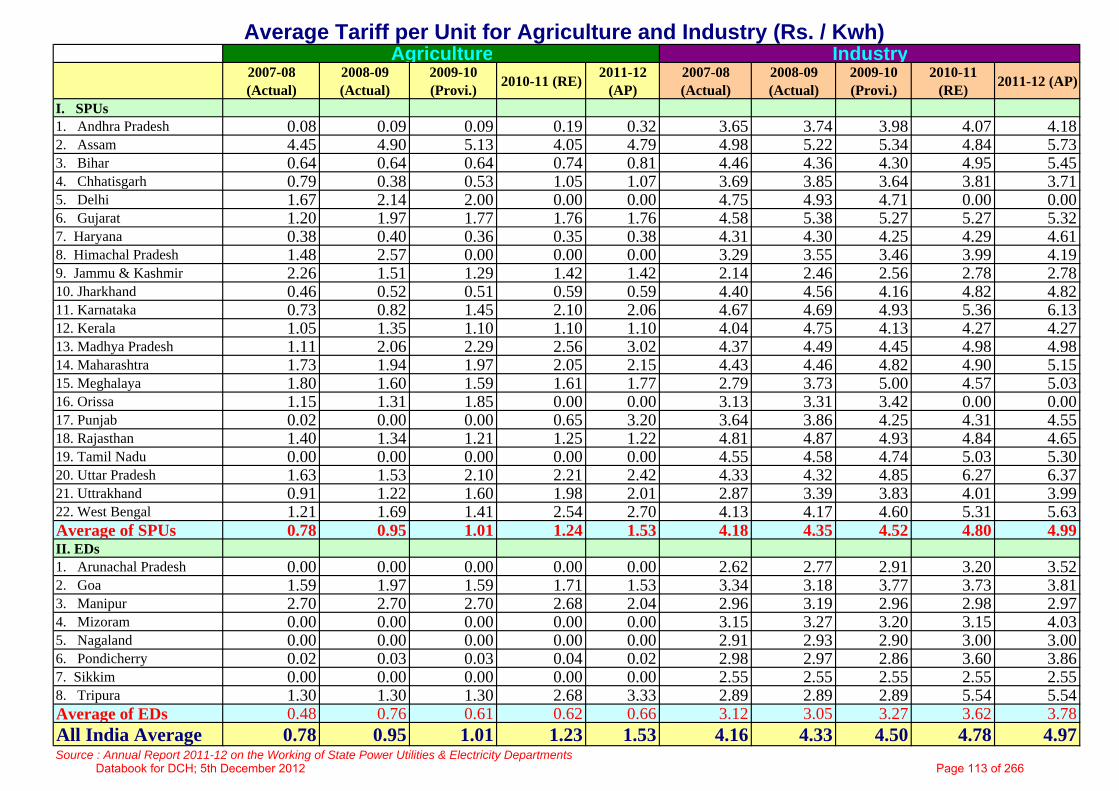
Average Tariff per Unit for Agriculture and Industry (Rs. / Kwh) Agriculture Industry
2007-08 (Actual)
2008-09 (Actual)
2009-10 (Provi.) 2010-11 (RE) 2011-12
(AP)2007-08 (Actual)
2008-09 (Actual)
2009-10 (Provi.)
2010-11 (RE) 2011-12 (AP)
I. SPUs1. Andhra Pradesh 0.08 0.09 0.09 0.19 0.32 3.65 3.74 3.98 4.07 4.182. Assam 4.45 4.90 5.13 4.05 4.79 4.98 5.22 5.34 4.84 5.733. Bihar 0.64 0.64 0.64 0.74 0.81 4.46 4.36 4.30 4.95 5.454. Chhatisgarh 0.79 0.38 0.53 1.05 1.07 3.69 3.85 3.64 3.81 3.715. Delhi 1.67 2.14 2.00 0.00 0.00 4.75 4.93 4.71 0.00 0.006. Gujarat 1.20 1.97 1.77 1.76 1.76 4.58 5.38 5.27 5.27 5.327. Haryana 0.38 0.40 0.36 0.35 0.38 4.31 4.30 4.25 4.29 4.618. Himachal Pradesh 1.48 2.57 0.00 0.00 0.00 3.29 3.55 3.46 3.99 4.199. Jammu & Kashmir 2.26 1.51 1.29 1.42 1.42 2.14 2.46 2.56 2.78 2.7810. Jharkhand 0.46 0.52 0.51 0.59 0.59 4.40 4.56 4.16 4.82 4.8211. Karnataka 0.73 0.82 1.45 2.10 2.06 4.67 4.69 4.93 5.36 6.1312. Kerala 1.05 1.35 1.10 1.10 1.10 4.04 4.75 4.13 4.27 4.2713. Madhya Pradesh 1.11 2.06 2.29 2.56 3.02 4.37 4.49 4.45 4.98 4.9814. Maharashtra 1.73 1.94 1.97 2.05 2.15 4.43 4.46 4.82 4.90 5.1515. Meghalaya 1.80 1.60 1.59 1.61 1.77 2.79 3.73 5.00 4.57 5.0316. Orissa 1.15 1.31 1.85 0.00 0.00 3.13 3.31 3.42 0.00 0.0017. Punjab 0.02 0.00 0.00 0.65 3.20 3.64 3.86 4.25 4.31 4.5518. Rajasthan 1.40 1.34 1.21 1.25 1.22 4.81 4.87 4.93 4.84 4.6519. Tamil Nadu 0.00 0.00 0.00 0.00 0.00 4.55 4.58 4.74 5.03 5.3020. Uttar Pradesh 1.63 1.53 2.10 2.21 2.42 4.33 4.32 4.85 6.27 6.3721. Uttrakhand 0.91 1.22 1.60 1.98 2.01 2.87 3.39 3.83 4.01 3.9922. West Bengal 1.21 1.69 1.41 2.54 2.70 4.13 4.17 4.60 5.31 5.63Average of SPUs 0.78 0.95 1.01 1.24 1.53 4.18 4.35 4.52 4.80 4.99II. EDs1. Arunachal Pradesh 0.00 0.00 0.00 0.00 0.00 2.62 2.77 2.91 3.20 3.522. Goa 1.59 1.97 1.59 1.71 1.53 3.34 3.18 3.77 3.73 3.813. Manipur 2.70 2.70 2.70 2.68 2.04 2.96 3.19 2.96 2.98 2.974. Mizoram 0.00 0.00 0.00 0.00 0.00 3.15 3.27 3.20 3.15 4.035. Nagaland 0.00 0.00 0.00 0.00 0.00 2.91 2.93 2.90 3.00 3.006. Pondicherry 0.02 0.03 0.03 0.04 0.02 2.98 2.97 2.86 3.60 3.867. Sikkim 0.00 0.00 0.00 0.00 0.00 2.55 2.55 2.55 2.55 2.558. Tripura 1.30 1.30 1.30 2.68 3.33 2.89 2.89 2.89 5.54 5.54Average of EDs 0.48 0.76 0.61 0.62 0.66 3.12 3.05 3.27 3.62 3.78All India Average 0.78 0.95 1.01 1.23 1.53 4.16 4.33 4.50 4.78 4.97Source : Annual Report 2011-12 on the Working of State Power Utilities & Electricity Departments
Databook for DCH; 5th December 2012 Page 113 of 266
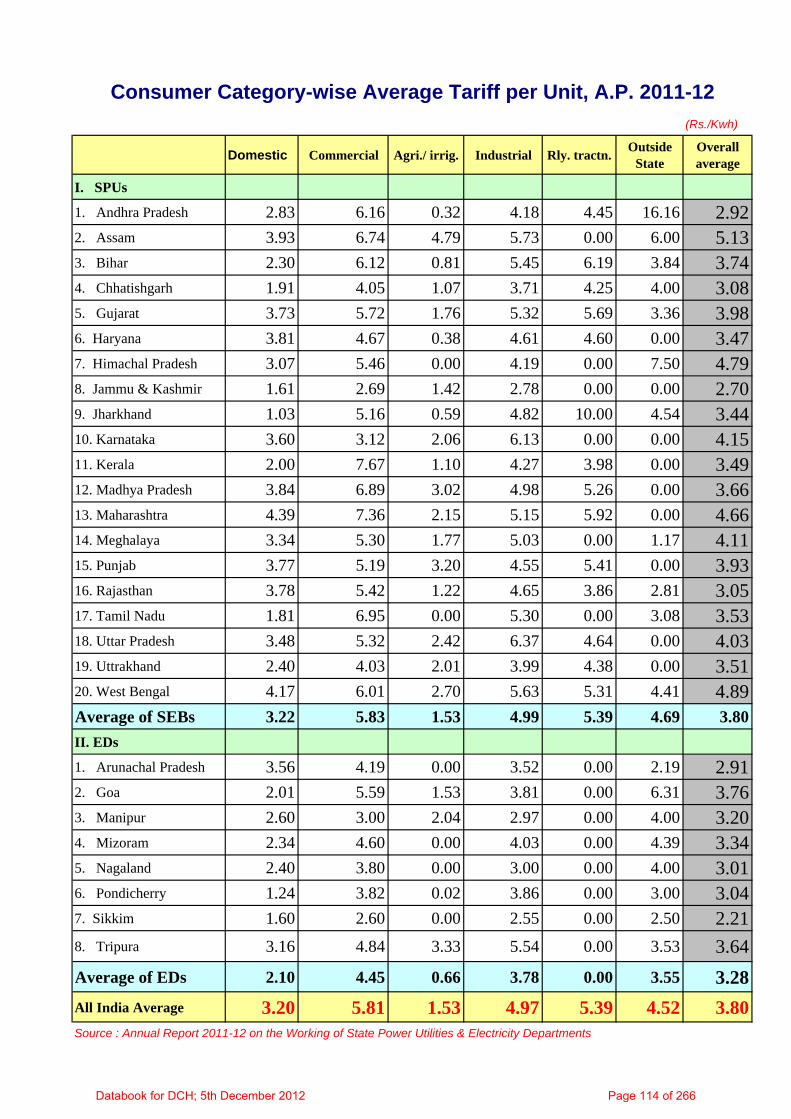
Consumer Category-wise Average Tariff per Unit, A.P. 2011-12
(Rs./Kwh)
Domestic Commercial Agri./ irrig. Industrial Rly. tractn. Outside State
Overall average
I. SPUs
1. Andhra Pradesh 2.83 6.16 0.32 4.18 4.45 16.16 2.922. Assam 3.93 6.74 4.79 5.73 0.00 6.00 5.133. Bihar 2.30 6.12 0.81 5.45 6.19 3.84 3.744. Chhatishgarh 1.91 4.05 1.07 3.71 4.25 4.00 3.085. Gujarat 3.73 5.72 1.76 5.32 5.69 3.36 3.986. Haryana 3.81 4.67 0.38 4.61 4.60 0.00 3.477. Himachal Pradesh 3.07 5.46 0.00 4.19 0.00 7.50 4.798. Jammu & Kashmir 1.61 2.69 1.42 2.78 0.00 0.00 2.709. Jharkhand 1.03 5.16 0.59 4.82 10.00 4.54 3.4410. Karnataka 3.60 3.12 2.06 6.13 0.00 0.00 4.1511. Kerala 2.00 7.67 1.10 4.27 3.98 0.00 3.4912. Madhya Pradesh 3.84 6.89 3.02 4.98 5.26 0.00 3.6613. Maharashtra 4.39 7.36 2.15 5.15 5.92 0.00 4.6614. Meghalaya 3.34 5.30 1.77 5.03 0.00 1.17 4.1115. Punjab 3.77 5.19 3.20 4.55 5.41 0.00 3.9316. Rajasthan 3.78 5.42 1.22 4.65 3.86 2.81 3.0517. Tamil Nadu 1.81 6.95 0.00 5.30 0.00 3.08 3.5318. Uttar Pradesh 3.48 5.32 2.42 6.37 4.64 0.00 4.0319. Uttrakhand 2.40 4.03 2.01 3.99 4.38 0.00 3.5120. West Bengal 4.17 6.01 2.70 5.63 5.31 4.41 4.89Average of SEBs 3.22 5.83 1.53 4.99 5.39 4.69 3.80II. EDs
1. Arunachal Pradesh 3.56 4.19 0.00 3.52 0.00 2.19 2.912. Goa 2.01 5.59 1.53 3.81 0.00 6.31 3.763. Manipur 2.60 3.00 2.04 2.97 0.00 4.00 3.204. Mizoram 2.34 4.60 0.00 4.03 0.00 4.39 3.345. Nagaland 2.40 3.80 0.00 3.00 0.00 4.00 3.016. Pondicherry 1.24 3.82 0.02 3.86 0.00 3.00 3.047. Sikkim 1.60 2.60 0.00 2.55 0.00 2.50 2.218. Tripura 3.16 4.84 3.33 5.54 0.00 3.53 3.64Average of EDs 2.10 4.45 0.66 3.78 0.00 3.55 3.28All India Average 3.20 5.81 1.53 4.97 5.39 4.52 3.80Source : Annual Report 2011-12 on the Working of State Power Utilities & Electricity Departments
Databook for DCH; 5th December 2012 Page 114 of 266
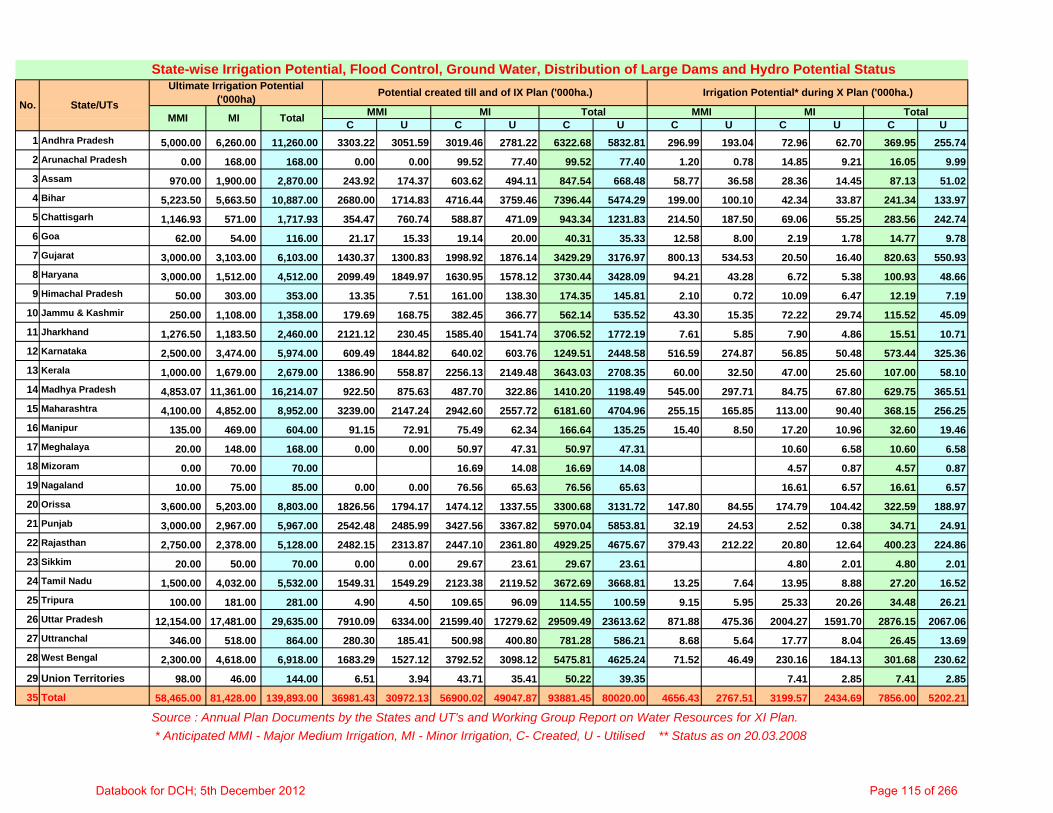
State-wise Irrigation Potential, Flood Control, Ground Water, Distribution of Large Dams and Hydro Potential Status
C U C U C U C U C U C U1 Andhra Pradesh 5,000.00 6,260.00 11,260.00 3303.22 3051.59 3019.46 2781.22 6322.68 5832.81 296.99 193.04 72.96 62.70 369.95 255.742 Arunachal Pradesh 0.00 168.00 168.00 0.00 0.00 99.52 77.40 99.52 77.40 1.20 0.78 14.85 9.21 16.05 9.993 Assam 970.00 1,900.00 2,870.00 243.92 174.37 603.62 494.11 847.54 668.48 58.77 36.58 28.36 14.45 87.13 51.024 Bihar 5,223.50 5,663.50 10,887.00 2680.00 1714.83 4716.44 3759.46 7396.44 5474.29 199.00 100.10 42.34 33.87 241.34 133.975 Chattisgarh 1,146.93 571.00 1,717.93 354.47 760.74 588.87 471.09 943.34 1231.83 214.50 187.50 69.06 55.25 283.56 242.746 Goa 62.00 54.00 116.00 21.17 15.33 19.14 20.00 40.31 35.33 12.58 8.00 2.19 1.78 14.77 9.787 Gujarat 3,000.00 3,103.00 6,103.00 1430.37 1300.83 1998.92 1876.14 3429.29 3176.97 800.13 534.53 20.50 16.40 820.63 550.938 Haryana 3,000.00 1,512.00 4,512.00 2099.49 1849.97 1630.95 1578.12 3730.44 3428.09 94.21 43.28 6.72 5.38 100.93 48.669 Himachal Pradesh 50.00 303.00 353.00 13.35 7.51 161.00 138.30 174.35 145.81 2.10 0.72 10.09 6.47 12.19 7.19
10 Jammu & Kashmir 250.00 1,108.00 1,358.00 179.69 168.75 382.45 366.77 562.14 535.52 43.30 15.35 72.22 29.74 115.52 45.0911 Jharkhand 1,276.50 1,183.50 2,460.00 2121.12 230.45 1585.40 1541.74 3706.52 1772.19 7.61 5.85 7.90 4.86 15.51 10.7112 Karnataka 2,500.00 3,474.00 5,974.00 609.49 1844.82 640.02 603.76 1249.51 2448.58 516.59 274.87 56.85 50.48 573.44 325.3613 Kerala 1,000.00 1,679.00 2,679.00 1386.90 558.87 2256.13 2149.48 3643.03 2708.35 60.00 32.50 47.00 25.60 107.00 58.1014 Madhya Pradesh 4,853.07 11,361.00 16,214.07 922.50 875.63 487.70 322.86 1410.20 1198.49 545.00 297.71 84.75 67.80 629.75 365.5115 Maharashtra 4,100.00 4,852.00 8,952.00 3239.00 2147.24 2942.60 2557.72 6181.60 4704.96 255.15 165.85 113.00 90.40 368.15 256.2516 Manipur 135.00 469.00 604.00 91.15 72.91 75.49 62.34 166.64 135.25 15.40 8.50 17.20 10.96 32.60 19.4617 Meghalaya 20.00 148.00 168.00 0.00 0.00 50.97 47.31 50.97 47.31 10.60 6.58 10.60 6.5818 Mizoram 0.00 70.00 70.00 16.69 14.08 16.69 14.08 4.57 0.87 4.57 0.8719 Nagaland 10.00 75.00 85.00 0.00 0.00 76.56 65.63 76.56 65.63 16.61 6.57 16.61 6.5720 Orissa 3,600.00 5,203.00 8,803.00 1826.56 1794.17 1474.12 1337.55 3300.68 3131.72 147.80 84.55 174.79 104.42 322.59 188.9721 Punjab 3,000.00 2,967.00 5,967.00 2542.48 2485.99 3427.56 3367.82 5970.04 5853.81 32.19 24.53 2.52 0.38 34.71 24.9122 Rajasthan 2,750.00 2,378.00 5,128.00 2482.15 2313.87 2447.10 2361.80 4929.25 4675.67 379.43 212.22 20.80 12.64 400.23 224.8623 Sikkim 20.00 50.00 70.00 0.00 0.00 29.67 23.61 29.67 23.61 4.80 2.01 4.80 2.0124 Tamil Nadu 1,500.00 4,032.00 5,532.00 1549.31 1549.29 2123.38 2119.52 3672.69 3668.81 13.25 7.64 13.95 8.88 27.20 16.5225 Tripura 100.00 181.00 281.00 4.90 4.50 109.65 96.09 114.55 100.59 9.15 5.95 25.33 20.26 34.48 26.2126 Uttar Pradesh 12,154.00 17,481.00 29,635.00 7910.09 6334.00 21599.40 17279.62 29509.49 23613.62 871.88 475.36 2004.27 1591.70 2876.15 2067.0627 Uttranchal 346.00 518.00 864.00 280.30 185.41 500.98 400.80 781.28 586.21 8.68 5.64 17.77 8.04 26.45 13.6928 West Bengal 2,300.00 4,618.00 6,918.00 1683.29 1527.12 3792.52 3098.12 5475.81 4625.24 71.52 46.49 230.16 184.13 301.68 230.62
29 Union Territories 98.00 46.00 144.00 6.51 3.94 43.71 35.41 50.22 39.35 7.41 2.85 7.41 2.85
35 Total 58,465.00 81,428.00 139,893.00 36981.43 30972.13 56900.02 49047.87 93881.45 80020.00 4656.43 2767.51 3199.57 2434.69 7856.00 5202.21
Source : Annual Plan Documents by the States and UT's and Working Group Report on Water Resources for XI Plan. * Anticipated MMI - Major Medium Irrigation, MI - Minor Irrigation, C- Created, U - Utilised ** Status as on 20.03.2008
No. State/UTs
Ultimate Irrigation Potential ('000ha) Potential created till and of IX Plan ('000ha.)
MMI MI Total Total
Irrigation Potential* during X Plan ('000ha.)
MMI MI MMI MITotal
Databook for DCH; 5th December 2012 Page 115 of 266
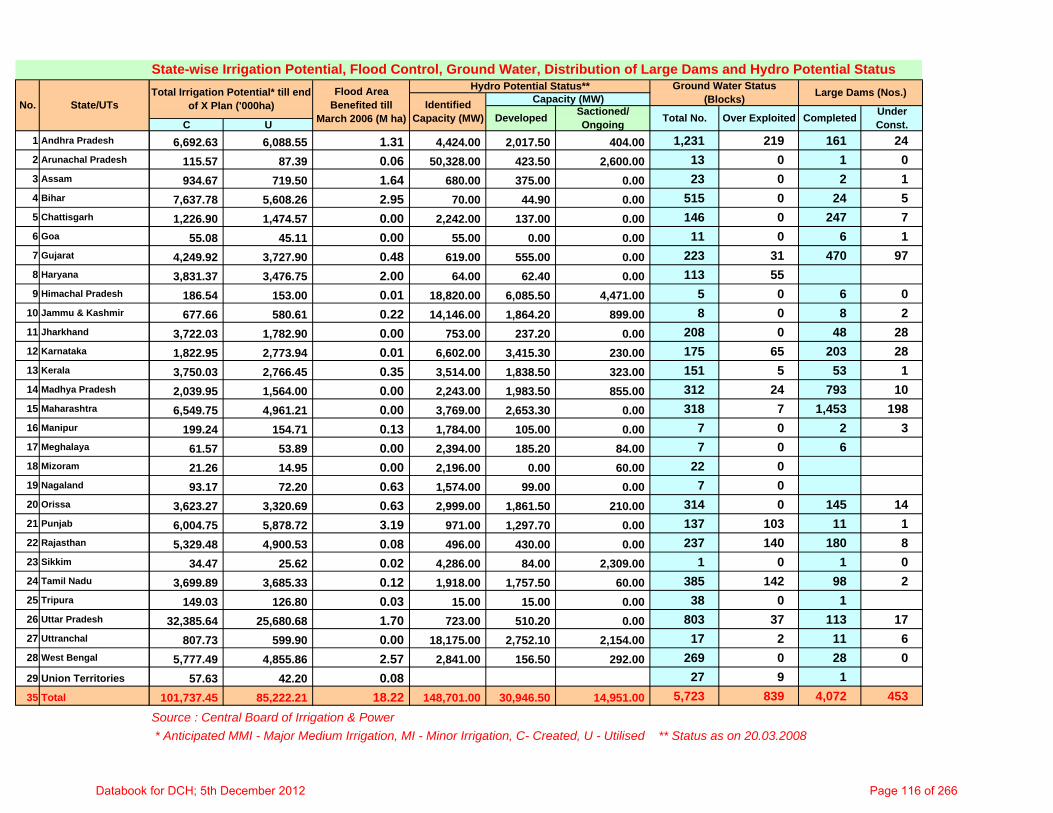
1 Andhra Pradesh
2 Arunachal Pradesh
3 Assam
4 Bihar
5 Chattisgarh
6 Goa
7 Gujarat
8 Haryana
9 Himachal Pradesh
10 Jammu & Kashmir
11 Jharkhand
12 Karnataka
13 Kerala
14 Madhya Pradesh
15 Maharashtra
16 Manipur
17 Meghalaya
18 Mizoram
19 Nagaland
20 Orissa
21 Punjab
22 Rajasthan
23 Sikkim
24 Tamil Nadu
25 Tripura
26 Uttar Pradesh
27 Uttranchal
28 West Bengal
29 Union Territories
35 Total
No. State/UTs
C U6,692.63 6,088.55 1.31 4,424.00 2,017.50 404.00 1,231 219 161 24
115.57 87.39 0.06 50,328.00 423.50 2,600.00 13 0 1 0934.67 719.50 1.64 680.00 375.00 0.00 23 0 2 1
7,637.78 5,608.26 2.95 70.00 44.90 0.00 515 0 24 51,226.90 1,474.57 0.00 2,242.00 137.00 0.00 146 0 247 7
55.08 45.11 0.00 55.00 0.00 0.00 11 0 6 14,249.92 3,727.90 0.48 619.00 555.00 0.00 223 31 470 973,831.37 3,476.75 2.00 64.00 62.40 0.00 113 55
186.54 153.00 0.01 18,820.00 6,085.50 4,471.00 5 0 6 0677.66 580.61 0.22 14,146.00 1,864.20 899.00 8 0 8 2
3,722.03 1,782.90 0.00 753.00 237.20 0.00 208 0 48 281,822.95 2,773.94 0.01 6,602.00 3,415.30 230.00 175 65 203 283,750.03 2,766.45 0.35 3,514.00 1,838.50 323.00 151 5 53 12,039.95 1,564.00 0.00 2,243.00 1,983.50 855.00 312 24 793 106,549.75 4,961.21 0.00 3,769.00 2,653.30 0.00 318 7 1,453 198
199.24 154.71 0.13 1,784.00 105.00 0.00 7 0 2 361.57 53.89 0.00 2,394.00 185.20 84.00 7 0 621.26 14.95 0.00 2,196.00 0.00 60.00 22 093.17 72.20 0.63 1,574.00 99.00 0.00 7 0
3,623.27 3,320.69 0.63 2,999.00 1,861.50 210.00 314 0 145 146,004.75 5,878.72 3.19 971.00 1,297.70 0.00 137 103 11 15,329.48 4,900.53 0.08 496.00 430.00 0.00 237 140 180 8
34.47 25.62 0.02 4,286.00 84.00 2,309.00 1 0 1 03,699.89 3,685.33 0.12 1,918.00 1,757.50 60.00 385 142 98 2
149.03 126.80 0.03 15.00 15.00 0.00 38 0 132,385.64 25,680.68 1.70 723.00 510.20 0.00 803 37 113 17
807.73 599.90 0.00 18,175.00 2,752.10 2,154.00 17 2 11 65,777.49 4,855.86 2.57 2,841.00 156.50 292.00 269 0 28 0
57.63 42.20 0.08 27 9 1101,737.45 85,222.21 18.22 148,701.00 30,946.50 14,951.00 5,723 839 4,072 453
Source : Central Board of Irrigation & Power * Anticipated MMI - Major Medium Irrigation, MI - Minor Irrigation, C- Created, U - Utilised ** Status as on 20.03.2008
Completed
Large Dams (Nos.)
Sactioned/ Ongoing
Under Const.
State-wise Irrigation Potential, Flood Control, Ground Water, Distribution of Large Dams and Hydro Potential StatusTotal Irrigation Potential* till end
of X Plan ('000ha)Flood Area
Benefited till March 2006 (M ha)
Hydro Potential Status**
Identified Capacity (MW)
Capacity (MW)
Developed
Ground Water Status (Blocks)
Total No. Over Exploited
Databook for DCH; 5th December 2012 Page 116 of 266
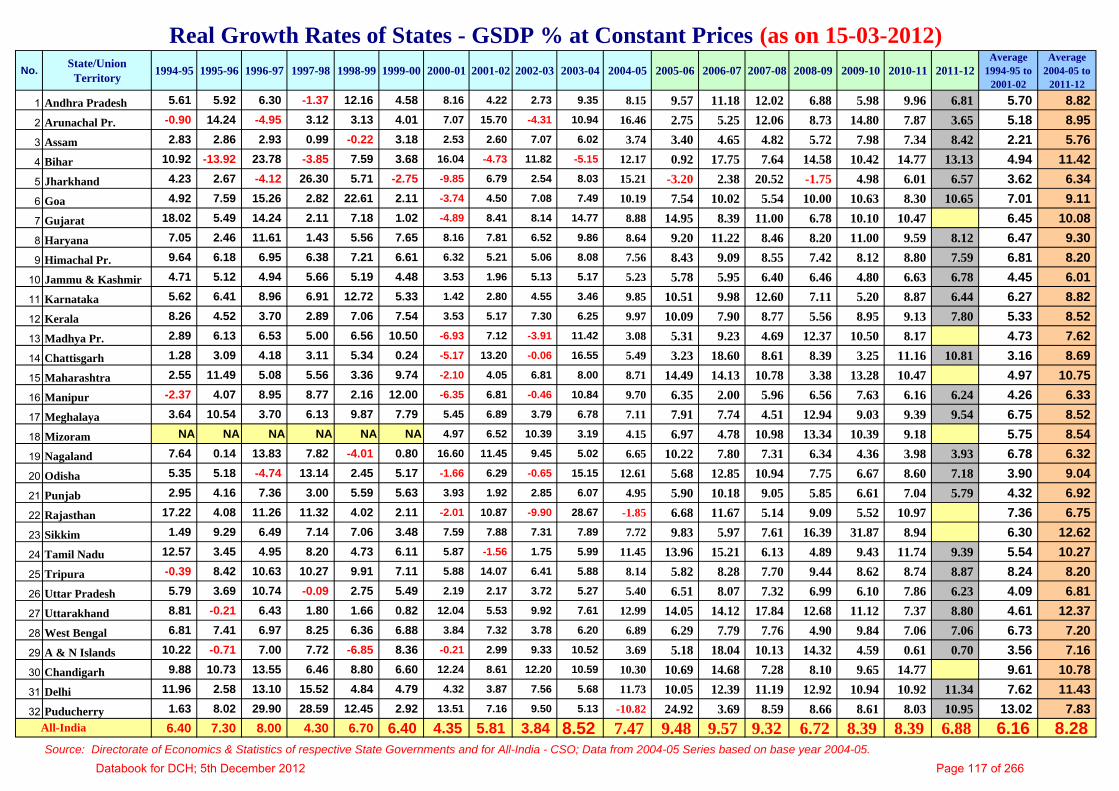
Real Growth Rates of States - GSDP % at Constant Prices (as on 15-03-2012)No.
State/Union Territory 1994-95 1995-96 1996-97 1997-98 1998-99 1999-00 2000-01 2001-02 2002-03 2003-04 2004-05 2005-06 2006-07 2007-08 2008-09 2009-10 2010-11 2011-12
Average 1994-95 to
2001-02
Average 2004-05 to
2011-12
1 Andhra Pradesh 5.61 5.92 6.30 -1.37 12.16 4.58 8.16 4.22 2.73 9.35 8.15 9.57 11.18 12.02 6.88 5.98 9.96 6.81 5.70 8.82
2 Arunachal Pr. -0.90 14.24 -4.95 3.12 3.13 4.01 7.07 15.70 -4.31 10.94 16.46 2.75 5.25 12.06 8.73 14.80 7.87 3.65 5.18 8.95
3 Assam 2.83 2.86 2.93 0.99 -0.22 3.18 2.53 2.60 7.07 6.02 3.74 3.40 4.65 4.82 5.72 7.98 7.34 8.42 2.21 5.76
4 Bihar 10.92 -13.92 23.78 -3.85 7.59 3.68 16.04 -4.73 11.82 -5.15 12.17 0.92 17.75 7.64 14.58 10.42 14.77 13.13 4.94 11.42
5 Jharkhand 4.23 2.67 -4.12 26.30 5.71 -2.75 -9.85 6.79 2.54 8.03 15.21 -3.20 2.38 20.52 -1.75 4.98 6.01 6.57 3.62 6.34
6 Goa 4.92 7.59 15.26 2.82 22.61 2.11 -3.74 4.50 7.08 7.49 10.19 7.54 10.02 5.54 10.00 10.63 8.30 10.65 7.01 9.11
7 Gujarat 18.02 5.49 14.24 2.11 7.18 1.02 -4.89 8.41 8.14 14.77 8.88 14.95 8.39 11.00 6.78 10.10 10.47 6.45 10.08
8 Haryana 7.05 2.46 11.61 1.43 5.56 7.65 8.16 7.81 6.52 9.86 8.64 9.20 11.22 8.46 8.20 11.00 9.59 8.12 6.47 9.30
9 Himachal Pr. 9.64 6.18 6.95 6.38 7.21 6.61 6.32 5.21 5.06 8.08 7.56 8.43 9.09 8.55 7.42 8.12 8.80 7.59 6.81 8.20
10 Jammu & Kashmir 4.71 5.12 4.94 5.66 5.19 4.48 3.53 1.96 5.13 5.17 5.23 5.78 5.95 6.40 6.46 4.80 6.63 6.78 4.45 6.01
11 Karnataka 5.62 6.41 8.96 6.91 12.72 5.33 1.42 2.80 4.55 3.46 9.85 10.51 9.98 12.60 7.11 5.20 8.87 6.44 6.27 8.82
12 Kerala 8.26 4.52 3.70 2.89 7.06 7.54 3.53 5.17 7.30 6.25 9.97 10.09 7.90 8.77 5.56 8.95 9.13 7.80 5.33 8.52
13 Madhya Pr. 2.89 6.13 6.53 5.00 6.56 10.50 -6.93 7.12 -3.91 11.42 3.08 5.31 9.23 4.69 12.37 10.50 8.17 4.73 7.62
14 Chattisgarh 1.28 3.09 4.18 3.11 5.34 0.24 -5.17 13.20 -0.06 16.55 5.49 3.23 18.60 8.61 8.39 3.25 11.16 10.81 3.16 8.69
15 Maharashtra 2.55 11.49 5.08 5.56 3.36 9.74 -2.10 4.05 6.81 8.00 8.71 14.49 14.13 10.78 3.38 13.28 10.47 4.97 10.75
16 Manipur -2.37 4.07 8.95 8.77 2.16 12.00 -6.35 6.81 -0.46 10.84 9.70 6.35 2.00 5.96 6.56 7.63 6.16 6.24 4.26 6.33
17 Meghalaya 3.64 10.54 3.70 6.13 9.87 7.79 5.45 6.89 3.79 6.78 7.11 7.91 7.74 4.51 12.94 9.03 9.39 9.54 6.75 8.52
18 Mizoram NA NA NA NA NA NA 4.97 6.52 10.39 3.19 4.15 6.97 4.78 10.98 13.34 10.39 9.18 5.75 8.54
19 Nagaland 7.64 0.14 13.83 7.82 -4.01 0.80 16.60 11.45 9.45 5.02 6.65 10.22 7.80 7.31 6.34 4.36 3.98 3.93 6.78 6.32
20 Odisha 5.35 5.18 -4.74 13.14 2.45 5.17 -1.66 6.29 -0.65 15.15 12.61 5.68 12.85 10.94 7.75 6.67 8.60 7.18 3.90 9.04
21 Punjab 2.95 4.16 7.36 3.00 5.59 5.63 3.93 1.92 2.85 6.07 4.95 5.90 10.18 9.05 5.85 6.61 7.04 5.79 4.32 6.92
22 Rajasthan 17.22 4.08 11.26 11.32 4.02 2.11 -2.01 10.87 -9.90 28.67 -1.85 6.68 11.67 5.14 9.09 5.52 10.97 7.36 6.75
23 Sikkim 1.49 9.29 6.49 7.14 7.06 3.48 7.59 7.88 7.31 7.89 7.72 9.83 5.97 7.61 16.39 31.87 8.94 6.30 12.62
24 Tamil Nadu 12.57 3.45 4.95 8.20 4.73 6.11 5.87 -1.56 1.75 5.99 11.45 13.96 15.21 6.13 4.89 9.43 11.74 9.39 5.54 10.27
25 Tripura -0.39 8.42 10.63 10.27 9.91 7.11 5.88 14.07 6.41 5.88 8.14 5.82 8.28 7.70 9.44 8.62 8.74 8.87 8.24 8.20
26 Uttar Pradesh 5.79 3.69 10.74 -0.09 2.75 5.49 2.19 2.17 3.72 5.27 5.40 6.51 8.07 7.32 6.99 6.10 7.86 6.23 4.09 6.81
27 Uttarakhand 8.81 -0.21 6.43 1.80 1.66 0.82 12.04 5.53 9.92 7.61 12.99 14.05 14.12 17.84 12.68 11.12 7.37 8.80 4.61 12.37
28 West Bengal 6.81 7.41 6.97 8.25 6.36 6.88 3.84 7.32 3.78 6.20 6.89 6.29 7.79 7.76 4.90 9.84 7.06 7.06 6.73 7.20
29 A & N Islands 10.22 -0.71 7.00 7.72 -6.85 8.36 -0.21 2.99 9.33 10.52 3.69 5.18 18.04 10.13 14.32 4.59 0.61 0.70 3.56 7.16
30 Chandigarh 9.88 10.73 13.55 6.46 8.80 6.60 12.24 8.61 12.20 10.59 10.30 10.69 14.68 7.28 8.10 9.65 14.77 9.61 10.78
31 Delhi 11.96 2.58 13.10 15.52 4.84 4.79 4.32 3.87 7.56 5.68 11.73 10.05 12.39 11.19 12.92 10.94 10.92 11.34 7.62 11.43
32 Puducherry 1.63 8.02 29.90 28.59 12.45 2.92 13.51 7.16 9.50 5.13 -10.82 24.92 3.69 8.59 8.66 8.61 8.03 10.95 13.02 7.83
All-India 6.40 7.30 8.00 4.30 6.70 6.40 4.35 5.81 3.84 8.52 7.47 9.48 9.57 9.32 6.72 8.39 8.39 6.88 6.16 8.28Source: Directorate of Economics & Statistics of respective State Governments and for All-India - CSO; Data from 2004-05 Series based on base year 2004-05.
Databook for DCH; 5th December 2012 Page 117 of 266
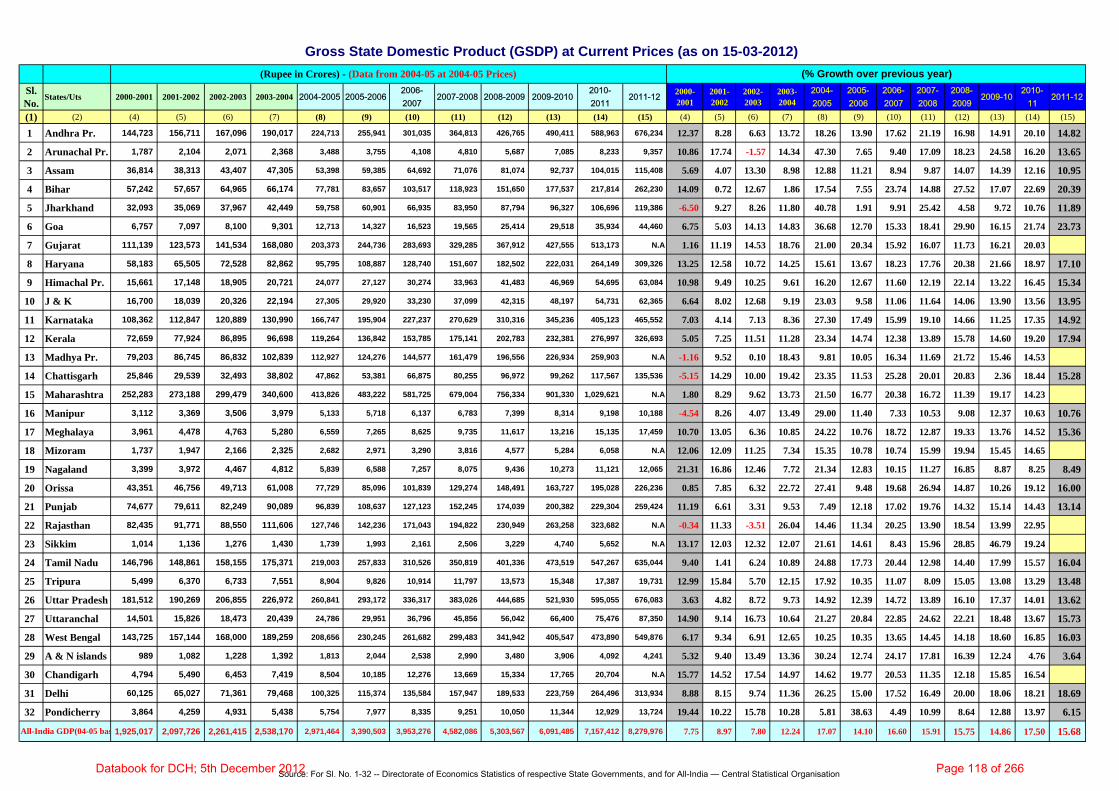
Sl. No.
States/Uts 2000-2001 2001-2002 2002-2003 2003-2004 2004-2005 2005-20062006-2007
2007-2008 2008-2009 2009-20102010-2011
2011-12 2000-2001
2001-2002
2002-2003
2003-2004
2004-2005
2005-2006
2006-2007
2007-2008
2008-2009
2009-102010-11
2011-12
(1) (2) (4) (5) (6) (7) (8) (9) (10) (11) (12) (13) (14) (15) (4) (5) (6) (7) (8) (9) (10) (11) (12) (13) (14) (15)
1 Andhra Pr. 144,723 156,711 167,096 190,017 224,713 255,941 301,035 364,813 426,765 490,411 588,963 676,234 12.37 8.28 6.63 13.72 18.26 13.90 17.62 21.19 16.98 14.91 20.10 14.82
2 Arunachal Pr. 1,787 2,104 2,071 2,368 3,488 3,755 4,108 4,810 5,687 7,085 8,233 9,357 10.86 17.74 -1.57 14.34 47.30 7.65 9.40 17.09 18.23 24.58 16.20 13.65
3 Assam 36,814 38,313 43,407 47,305 53,398 59,385 64,692 71,076 81,074 92,737 104,015 115,408 5.69 4.07 13.30 8.98 12.88 11.21 8.94 9.87 14.07 14.39 12.16 10.95
4 Bihar 57,242 57,657 64,965 66,174 77,781 83,657 103,517 118,923 151,650 177,537 217,814 262,230 14.09 0.72 12.67 1.86 17.54 7.55 23.74 14.88 27.52 17.07 22.69 20.39
5 Jharkhand 32,093 35,069 37,967 42,449 59,758 60,901 66,935 83,950 87,794 96,327 106,696 119,386 -6.50 9.27 8.26 11.80 40.78 1.91 9.91 25.42 4.58 9.72 10.76 11.89
6 Goa 6,757 7,097 8,100 9,301 12,713 14,327 16,523 19,565 25,414 29,518 35,934 44,460 6.75 5.03 14.13 14.83 36.68 12.70 15.33 18.41 29.90 16.15 21.74 23.73
7 Gujarat 111,139 123,573 141,534 168,080 203,373 244,736 283,693 329,285 367,912 427,555 513,173 N.A 1.16 11.19 14.53 18.76 21.00 20.34 15.92 16.07 11.73 16.21 20.03
8 Haryana 58,183 65,505 72,528 82,862 95,795 108,887 128,740 151,607 182,502 222,031 264,149 309,326 13.25 12.58 10.72 14.25 15.61 13.67 18.23 17.76 20.38 21.66 18.97 17.10
9 Himachal Pr. 15,661 17,148 18,905 20,721 24,077 27,127 30,274 33,963 41,483 46,969 54,695 63,084 10.98 9.49 10.25 9.61 16.20 12.67 11.60 12.19 22.14 13.22 16.45 15.34
10 J & K 16,700 18,039 20,326 22,194 27,305 29,920 33,230 37,099 42,315 48,197 54,731 62,365 6.64 8.02 12.68 9.19 23.03 9.58 11.06 11.64 14.06 13.90 13.56 13.95
11 Karnataka 108,362 112,847 120,889 130,990 166,747 195,904 227,237 270,629 310,316 345,236 405,123 465,552 7.03 4.14 7.13 8.36 27.30 17.49 15.99 19.10 14.66 11.25 17.35 14.92
12 Kerala 72,659 77,924 86,895 96,698 119,264 136,842 153,785 175,141 202,783 232,381 276,997 326,693 5.05 7.25 11.51 11.28 23.34 14.74 12.38 13.89 15.78 14.60 19.20 17.94
13 Madhya Pr. 79,203 86,745 86,832 102,839 112,927 124,276 144,577 161,479 196,556 226,934 259,903 N.A -1.16 9.52 0.10 18.43 9.81 10.05 16.34 11.69 21.72 15.46 14.53
14 Chattisgarh 25,846 29,539 32,493 38,802 47,862 53,381 66,875 80,255 96,972 99,262 117,567 135,536 -5.15 14.29 10.00 19.42 23.35 11.53 25.28 20.01 20.83 2.36 18.44 15.28
15 Maharashtra 252,283 273,188 299,479 340,600 413,826 483,222 581,725 679,004 756,334 901,330 1,029,621 N.A 1.80 8.29 9.62 13.73 21.50 16.77 20.38 16.72 11.39 19.17 14.23
16 Manipur 3,112 3,369 3,506 3,979 5,133 5,718 6,137 6,783 7,399 8,314 9,198 10,188 -4.54 8.26 4.07 13.49 29.00 11.40 7.33 10.53 9.08 12.37 10.63 10.76
17 Meghalaya 3,961 4,478 4,763 5,280 6,559 7,265 8,625 9,735 11,617 13,216 15,135 17,459 10.70 13.05 6.36 10.85 24.22 10.76 18.72 12.87 19.33 13.76 14.52 15.36
18 Mizoram 1,737 1,947 2,166 2,325 2,682 2,971 3,290 3,816 4,577 5,284 6,058 N.A 12.06 12.09 11.25 7.34 15.35 10.78 10.74 15.99 19.94 15.45 14.65
19 Nagaland 3,399 3,972 4,467 4,812 5,839 6,588 7,257 8,075 9,436 10,273 11,121 12,065 21.31 16.86 12.46 7.72 21.34 12.83 10.15 11.27 16.85 8.87 8.25 8.49
20 Orissa 43,351 46,756 49,713 61,008 77,729 85,096 101,839 129,274 148,491 163,727 195,028 226,236 0.85 7.85 6.32 22.72 27.41 9.48 19.68 26.94 14.87 10.26 19.12 16.00
21 Punjab 74,677 79,611 82,249 90,089 96,839 108,637 127,123 152,245 174,039 200,382 229,304 259,424 11.19 6.61 3.31 9.53 7.49 12.18 17.02 19.76 14.32 15.14 14.43 13.14
22 Rajasthan 82,435 91,771 88,550 111,606 127,746 142,236 171,043 194,822 230,949 263,258 323,682 N.A -0.34 11.33 -3.51 26.04 14.46 11.34 20.25 13.90 18.54 13.99 22.95
23 Sikkim 1,014 1,136 1,276 1,430 1,739 1,993 2,161 2,506 3,229 4,740 5,652 N.A 13.17 12.03 12.32 12.07 21.61 14.61 8.43 15.96 28.85 46.79 19.24
24 Tamil Nadu 146,796 148,861 158,155 175,371 219,003 257,833 310,526 350,819 401,336 473,519 547,267 635,044 9.40 1.41 6.24 10.89 24.88 17.73 20.44 12.98 14.40 17.99 15.57 16.04
25 Tripura 5,499 6,370 6,733 7,551 8,904 9,826 10,914 11,797 13,573 15,348 17,387 19,731 12.99 15.84 5.70 12.15 17.92 10.35 11.07 8.09 15.05 13.08 13.29 13.48
26 Uttar Pradesh 181,512 190,269 206,855 226,972 260,841 293,172 336,317 383,026 444,685 521,930 595,055 676,083 3.63 4.82 8.72 9.73 14.92 12.39 14.72 13.89 16.10 17.37 14.01 13.62
27 Uttaranchal 14,501 15,826 18,473 20,439 24,786 29,951 36,796 45,856 56,042 66,400 75,476 87,350 14.90 9.14 16.73 10.64 21.27 20.84 22.85 24.62 22.21 18.48 13.67 15.73
28 West Bengal 143,725 157,144 168,000 189,259 208,656 230,245 261,682 299,483 341,942 405,547 473,890 549,876 6.17 9.34 6.91 12.65 10.25 10.35 13.65 14.45 14.18 18.60 16.85 16.03
29 A & N islands 989 1,082 1,228 1,392 1,813 2,044 2,538 2,990 3,480 3,906 4,092 4,241 5.32 9.40 13.49 13.36 30.24 12.74 24.17 17.81 16.39 12.24 4.76 3.64
30 Chandigarh 4,794 5,490 6,453 7,419 8,504 10,185 12,276 13,669 15,334 17,765 20,704 N.A 15.77 14.52 17.54 14.97 14.62 19.77 20.53 11.35 12.18 15.85 16.54
31 Delhi 60,125 65,027 71,361 79,468 100,325 115,374 135,584 157,947 189,533 223,759 264,496 313,934 8.88 8.15 9.74 11.36 26.25 15.00 17.52 16.49 20.00 18.06 18.21 18.69
32 Pondicherry 3,864 4,259 4,931 5,438 5,754 7,977 8,335 9,251 10,050 11,344 12,929 13,724 19.44 10.22 15.78 10.28 5.81 38.63 4.49 10.99 8.64 12.88 13.97 6.15
1,925,017 2,097,726 2,261,415 2,538,170 2,971,464 3,390,503 3,953,276 4,582,086 5,303,567 6,091,485 7,157,412 8,279,976 7.75 8.97 7.80 12.24 17.07 14.10 16.60 15.91 15.75 14.86 17.50 15.68
Gross State Domestic Product (GSDP) at Current Prices (as on 15-03-2012)
All-India GDP(04-05 bas
(% Growth over previous year)(Rupee in Crores) - (Data from 2004-05 at 2004-05 Prices)
Source: For Sl. No. 1-32 -- Directorate of Economics Statistics of respective State Governments, and for All-India — Central Statistical OrganisationDatabook for DCH; 5th December 2012 Page 118 of 266
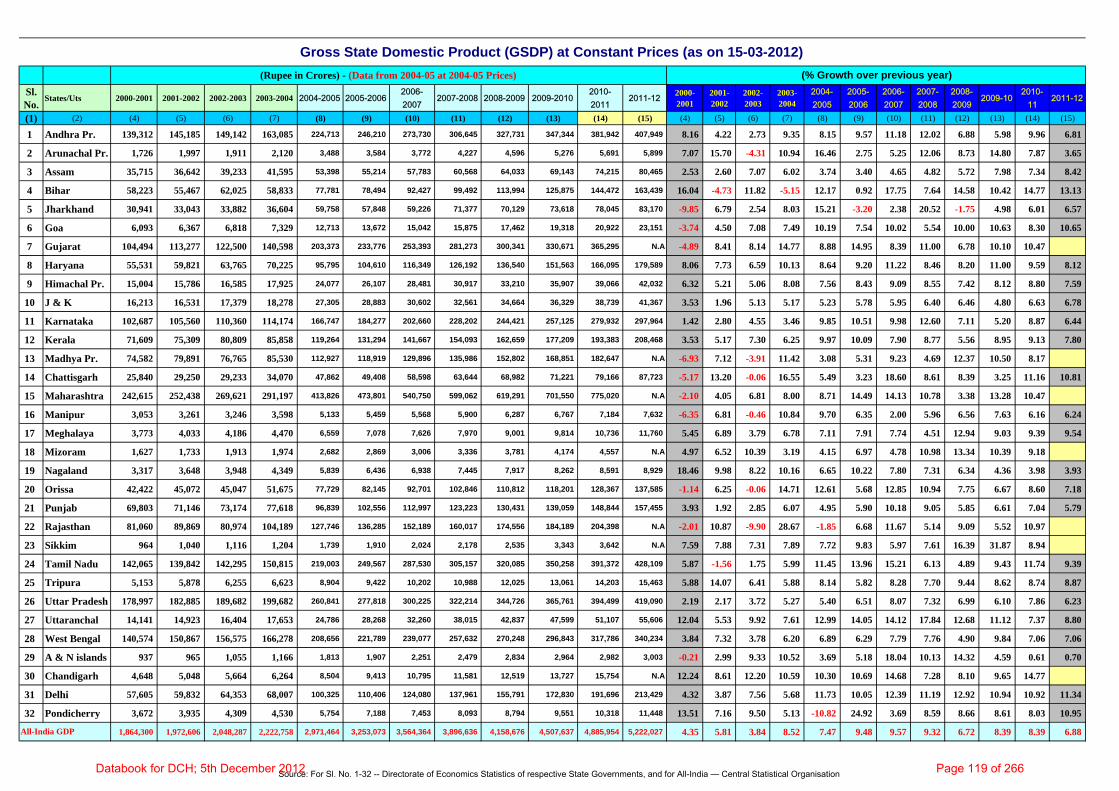
Sl. No.
States/Uts 2000-2001 2001-2002 2002-2003 2003-2004 2004-2005 2005-20062006-2007
2007-2008 2008-2009 2009-20102010-2011
2011-12 2000-2001
2001-2002
2002-2003
2003-2004
2004-2005
2005-2006
2006-2007
2007-2008
2008-2009
2009-102010-11
2011-12
(1) (2) (4) (5) (6) (7) (8) (9) (10) (11) (12) (13) (14) (15) (4) (5) (6) (7) (8) (9) (10) (11) (12) (13) (14) (15)
1 Andhra Pr. 139,312 145,185 149,142 163,085 224,713 246,210 273,730 306,645 327,731 347,344 381,942 407,949 8.16 4.22 2.73 9.35 8.15 9.57 11.18 12.02 6.88 5.98 9.96 6.81
2 Arunachal Pr. 1,726 1,997 1,911 2,120 3,488 3,584 3,772 4,227 4,596 5,276 5,691 5,899 7.07 15.70 -4.31 10.94 16.46 2.75 5.25 12.06 8.73 14.80 7.87 3.65
3 Assam 35,715 36,642 39,233 41,595 53,398 55,214 57,783 60,568 64,033 69,143 74,215 80,465 2.53 2.60 7.07 6.02 3.74 3.40 4.65 4.82 5.72 7.98 7.34 8.42
4 Bihar 58,223 55,467 62,025 58,833 77,781 78,494 92,427 99,492 113,994 125,875 144,472 163,439 16.04 -4.73 11.82 -5.15 12.17 0.92 17.75 7.64 14.58 10.42 14.77 13.13
5 Jharkhand 30,941 33,043 33,882 36,604 59,758 57,848 59,226 71,377 70,129 73,618 78,045 83,170 -9.85 6.79 2.54 8.03 15.21 -3.20 2.38 20.52 -1.75 4.98 6.01 6.57
6 Goa 6,093 6,367 6,818 7,329 12,713 13,672 15,042 15,875 17,462 19,318 20,922 23,151 -3.74 4.50 7.08 7.49 10.19 7.54 10.02 5.54 10.00 10.63 8.30 10.65
7 Gujarat 104,494 113,277 122,500 140,598 203,373 233,776 253,393 281,273 300,341 330,671 365,295 N.A -4.89 8.41 8.14 14.77 8.88 14.95 8.39 11.00 6.78 10.10 10.47
8 Haryana 55,531 59,821 63,765 70,225 95,795 104,610 116,349 126,192 136,540 151,563 166,095 179,589 8.06 7.73 6.59 10.13 8.64 9.20 11.22 8.46 8.20 11.00 9.59 8.12
9 Himachal Pr. 15,004 15,786 16,585 17,925 24,077 26,107 28,481 30,917 33,210 35,907 39,066 42,032 6.32 5.21 5.06 8.08 7.56 8.43 9.09 8.55 7.42 8.12 8.80 7.59
10 J & K 16,213 16,531 17,379 18,278 27,305 28,883 30,602 32,561 34,664 36,329 38,739 41,367 3.53 1.96 5.13 5.17 5.23 5.78 5.95 6.40 6.46 4.80 6.63 6.78
11 Karnataka 102,687 105,560 110,360 114,174 166,747 184,277 202,660 228,202 244,421 257,125 279,932 297,964 1.42 2.80 4.55 3.46 9.85 10.51 9.98 12.60 7.11 5.20 8.87 6.44
12 Kerala 71,609 75,309 80,809 85,858 119,264 131,294 141,667 154,093 162,659 177,209 193,383 208,468 3.53 5.17 7.30 6.25 9.97 10.09 7.90 8.77 5.56 8.95 9.13 7.80
13 Madhya Pr. 74,582 79,891 76,765 85,530 112,927 118,919 129,896 135,986 152,802 168,851 182,647 N.A -6.93 7.12 -3.91 11.42 3.08 5.31 9.23 4.69 12.37 10.50 8.17
14 Chattisgarh 25,840 29,250 29,233 34,070 47,862 49,408 58,598 63,644 68,982 71,221 79,166 87,723 -5.17 13.20 -0.06 16.55 5.49 3.23 18.60 8.61 8.39 3.25 11.16 10.81
15 Maharashtra 242,615 252,438 269,621 291,197 413,826 473,801 540,750 599,062 619,291 701,550 775,020 N.A -2.10 4.05 6.81 8.00 8.71 14.49 14.13 10.78 3.38 13.28 10.47
16 Manipur 3,053 3,261 3,246 3,598 5,133 5,459 5,568 5,900 6,287 6,767 7,184 7,632 -6.35 6.81 -0.46 10.84 9.70 6.35 2.00 5.96 6.56 7.63 6.16 6.24
17 Meghalaya 3,773 4,033 4,186 4,470 6,559 7,078 7,626 7,970 9,001 9,814 10,736 11,760 5.45 6.89 3.79 6.78 7.11 7.91 7.74 4.51 12.94 9.03 9.39 9.54
18 Mizoram 1,627 1,733 1,913 1,974 2,682 2,869 3,006 3,336 3,781 4,174 4,557 N.A 4.97 6.52 10.39 3.19 4.15 6.97 4.78 10.98 13.34 10.39 9.18
19 Nagaland 3,317 3,648 3,948 4,349 5,839 6,436 6,938 7,445 7,917 8,262 8,591 8,929 18.46 9.98 8.22 10.16 6.65 10.22 7.80 7.31 6.34 4.36 3.98 3.93
20 Orissa 42,422 45,072 45,047 51,675 77,729 82,145 92,701 102,846 110,812 118,201 128,367 137,585 -1.14 6.25 -0.06 14.71 12.61 5.68 12.85 10.94 7.75 6.67 8.60 7.18
21 Punjab 69,803 71,146 73,174 77,618 96,839 102,556 112,997 123,223 130,431 139,059 148,844 157,455 3.93 1.92 2.85 6.07 4.95 5.90 10.18 9.05 5.85 6.61 7.04 5.79
22 Rajasthan 81,060 89,869 80,974 104,189 127,746 136,285 152,189 160,017 174,556 184,189 204,398 N.A -2.01 10.87 -9.90 28.67 -1.85 6.68 11.67 5.14 9.09 5.52 10.97
23 Sikkim 964 1,040 1,116 1,204 1,739 1,910 2,024 2,178 2,535 3,343 3,642 N.A 7.59 7.88 7.31 7.89 7.72 9.83 5.97 7.61 16.39 31.87 8.94
24 Tamil Nadu 142,065 139,842 142,295 150,815 219,003 249,567 287,530 305,157 320,085 350,258 391,372 428,109 5.87 -1.56 1.75 5.99 11.45 13.96 15.21 6.13 4.89 9.43 11.74 9.39
25 Tripura 5,153 5,878 6,255 6,623 8,904 9,422 10,202 10,988 12,025 13,061 14,203 15,463 5.88 14.07 6.41 5.88 8.14 5.82 8.28 7.70 9.44 8.62 8.74 8.87
26 Uttar Pradesh 178,997 182,885 189,682 199,682 260,841 277,818 300,225 322,214 344,726 365,761 394,499 419,090 2.19 2.17 3.72 5.27 5.40 6.51 8.07 7.32 6.99 6.10 7.86 6.23
27 Uttaranchal 14,141 14,923 16,404 17,653 24,786 28,268 32,260 38,015 42,837 47,599 51,107 55,606 12.04 5.53 9.92 7.61 12.99 14.05 14.12 17.84 12.68 11.12 7.37 8.80
28 West Bengal 140,574 150,867 156,575 166,278 208,656 221,789 239,077 257,632 270,248 296,843 317,786 340,234 3.84 7.32 3.78 6.20 6.89 6.29 7.79 7.76 4.90 9.84 7.06 7.06
29 A & N islands 937 965 1,055 1,166 1,813 1,907 2,251 2,479 2,834 2,964 2,982 3,003 -0.21 2.99 9.33 10.52 3.69 5.18 18.04 10.13 14.32 4.59 0.61 0.70
30 Chandigarh 4,648 5,048 5,664 6,264 8,504 9,413 10,795 11,581 12,519 13,727 15,754 N.A 12.24 8.61 12.20 10.59 10.30 10.69 14.68 7.28 8.10 9.65 14.77
31 Delhi 57,605 59,832 64,353 68,007 100,325 110,406 124,080 137,961 155,791 172,830 191,696 213,429 4.32 3.87 7.56 5.68 11.73 10.05 12.39 11.19 12.92 10.94 10.92 11.34
32 Pondicherry 3,672 3,935 4,309 4,530 5,754 7,188 7,453 8,093 8,794 9,551 10,318 11,448 13.51 7.16 9.50 5.13 -10.82 24.92 3.69 8.59 8.66 8.61 8.03 10.95
1,864,300 1,972,606 2,048,287 2,222,758 2,971,464 3,253,073 3,564,364 3,896,636 4,158,676 4,507,637 4,885,954 5,222,027 4.35 5.81 3.84 8.52 7.47 9.48 9.57 9.32 6.72 8.39 8.39 6.88All-India GDP
(% Growth over previous year)
Gross State Domestic Product (GSDP) at Constant Prices (as on 15-03-2012)
(Rupee in Crores) - (Data from 2004-05 at 2004-05 Prices)
Source: For Sl. No. 1-32 -- Directorate of Economics Statistics of respective State Governments, and for All-India — Central Statistical OrganisationDatabook for DCH; 5th December 2012 Page 119 of 266
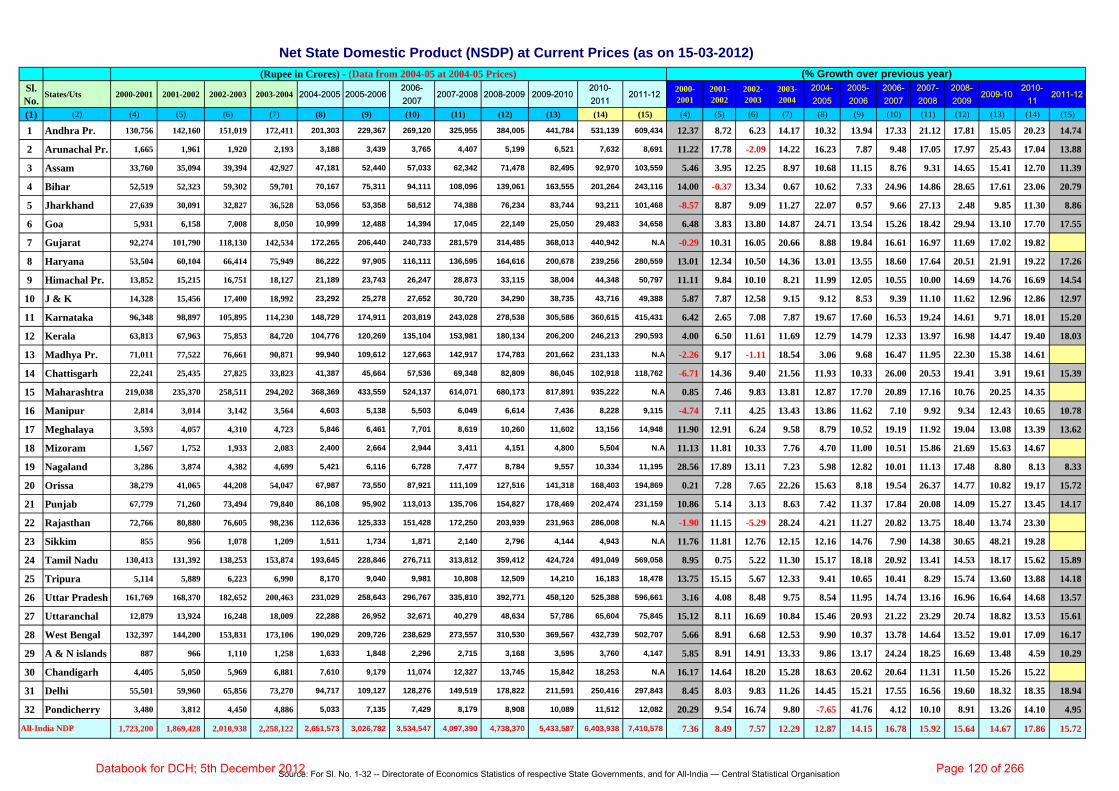
Sl. No.
States/Uts 2000-2001 2001-2002 2002-2003 2003-2004 2004-2005 2005-20062006-2007
2007-2008 2008-2009 2009-20102010-2011
2011-12 2000-2001
2001-2002
2002-2003
2003-2004
2004-2005
2005-2006
2006-2007
2007-2008
2008-2009
2009-102010-11
2011-12
(1) (2) (4) (5) (6) (7) (8) (9) (10) (11) (12) (13) (14) (15) (4) (5) (6) (7) (8) (9) (10) (11) (12) (13) (14) (15)
1 Andhra Pr. 130,756 142,160 151,019 172,411 201,303 229,367 269,120 325,955 384,005 441,784 531,139 609,434 12.37 8.72 6.23 14.17 10.32 13.94 17.33 21.12 17.81 15.05 20.23 14.74
2 Arunachal Pr. 1,665 1,961 1,920 2,193 3,188 3,439 3,765 4,407 5,199 6,521 7,632 8,691 11.22 17.78 -2.09 14.22 16.23 7.87 9.48 17.05 17.97 25.43 17.04 13.88
3 Assam 33,760 35,094 39,394 42,927 47,181 52,440 57,033 62,342 71,478 82,495 92,970 103,559 5.46 3.95 12.25 8.97 10.68 11.15 8.76 9.31 14.65 15.41 12.70 11.39
4 Bihar 52,519 52,323 59,302 59,701 70,167 75,311 94,111 108,096 139,061 163,555 201,264 243,116 14.00 -0.37 13.34 0.67 10.62 7.33 24.96 14.86 28.65 17.61 23.06 20.79
5 Jharkhand 27,639 30,091 32,827 36,528 53,056 53,358 58,512 74,388 76,234 83,744 93,211 101,468 -8.57 8.87 9.09 11.27 22.07 0.57 9.66 27.13 2.48 9.85 11.30 8.86
6 Goa 5,931 6,158 7,008 8,050 10,999 12,488 14,394 17,045 22,149 25,050 29,483 34,658 6.48 3.83 13.80 14.87 24.71 13.54 15.26 18.42 29.94 13.10 17.70 17.55
7 Gujarat 92,274 101,790 118,130 142,534 172,265 206,440 240,733 281,579 314,485 368,013 440,942 N.A -0.29 10.31 16.05 20.66 8.88 19.84 16.61 16.97 11.69 17.02 19.82
8 Haryana 53,504 60,104 66,414 75,949 86,222 97,905 116,111 136,595 164,616 200,678 239,256 280,559 13.01 12.34 10.50 14.36 13.01 13.55 18.60 17.64 20.51 21.91 19.22 17.26
9 Himachal Pr. 13,852 15,215 16,751 18,127 21,189 23,743 26,247 28,873 33,115 38,004 44,348 50,797 11.11 9.84 10.10 8.21 11.99 12.05 10.55 10.00 14.69 14.76 16.69 14.54
10 J & K 14,328 15,456 17,400 18,992 23,292 25,278 27,652 30,720 34,290 38,735 43,716 49,388 5.87 7.87 12.58 9.15 9.12 8.53 9.39 11.10 11.62 12.96 12.86 12.97
11 Karnataka 96,348 98,897 105,895 114,230 148,729 174,911 203,819 243,028 278,538 305,586 360,615 415,431 6.42 2.65 7.08 7.87 19.67 17.60 16.53 19.24 14.61 9.71 18.01 15.20
12 Kerala 63,813 67,963 75,853 84,720 104,776 120,269 135,104 153,981 180,134 206,200 246,213 290,593 4.00 6.50 11.61 11.69 12.79 14.79 12.33 13.97 16.98 14.47 19.40 18.03
13 Madhya Pr. 71,011 77,522 76,661 90,871 99,940 109,612 127,663 142,917 174,783 201,662 231,133 N.A -2.26 9.17 -1.11 18.54 3.06 9.68 16.47 11.95 22.30 15.38 14.61
14 Chattisgarh 22,241 25,435 27,825 33,823 41,387 45,664 57,536 69,348 82,809 86,045 102,918 118,762 -6.71 14.36 9.40 21.56 11.93 10.33 26.00 20.53 19.41 3.91 19.61 15.39
15 Maharashtra 219,038 235,370 258,511 294,202 368,369 433,559 524,137 614,071 680,173 817,891 935,222 N.A 0.85 7.46 9.83 13.81 12.87 17.70 20.89 17.16 10.76 20.25 14.35
16 Manipur 2,814 3,014 3,142 3,564 4,603 5,138 5,503 6,049 6,614 7,436 8,228 9,115 -4.74 7.11 4.25 13.43 13.86 11.62 7.10 9.92 9.34 12.43 10.65 10.78
17 Meghalaya 3,593 4,057 4,310 4,723 5,846 6,461 7,701 8,619 10,260 11,602 13,156 14,948 11.90 12.91 6.24 9.58 8.79 10.52 19.19 11.92 19.04 13.08 13.39 13.62
18 Mizoram 1,567 1,752 1,933 2,083 2,400 2,664 2,944 3,411 4,151 4,800 5,504 N.A 11.13 11.81 10.33 7.76 4.70 11.00 10.51 15.86 21.69 15.63 14.67
19 Nagaland 3,286 3,874 4,382 4,699 5,421 6,116 6,728 7,477 8,784 9,557 10,334 11,195 28.56 17.89 13.11 7.23 5.98 12.82 10.01 11.13 17.48 8.80 8.13 8.33
20 Orissa 38,279 41,065 44,208 54,047 67,987 73,550 87,921 111,109 127,516 141,318 168,403 194,869 0.21 7.28 7.65 22.26 15.63 8.18 19.54 26.37 14.77 10.82 19.17 15.72
21 Punjab 67,779 71,260 73,494 79,840 86,108 95,902 113,013 135,706 154,827 178,469 202,474 231,159 10.86 5.14 3.13 8.63 7.42 11.37 17.84 20.08 14.09 15.27 13.45 14.17
22 Rajasthan 72,766 80,880 76,605 98,236 112,636 125,333 151,428 172,250 203,939 231,963 286,008 N.A -1.90 11.15 -5.29 28.24 4.21 11.27 20.82 13.75 18.40 13.74 23.30
23 Sikkim 855 956 1,078 1,209 1,511 1,734 1,871 2,140 2,796 4,144 4,943 N.A 11.76 11.81 12.76 12.15 12.16 14.76 7.90 14.38 30.65 48.21 19.28
24 Tamil Nadu 130,413 131,392 138,253 153,874 193,645 228,846 276,711 313,812 359,412 424,724 491,049 569,058 8.95 0.75 5.22 11.30 15.17 18.18 20.92 13.41 14.53 18.17 15.62 15.89
25 Tripura 5,114 5,889 6,223 6,990 8,170 9,040 9,981 10,808 12,509 14,210 16,183 18,478 13.75 15.15 5.67 12.33 9.41 10.65 10.41 8.29 15.74 13.60 13.88 14.18
26 Uttar Pradesh 161,769 168,370 182,652 200,463 231,029 258,643 296,767 335,810 392,771 458,120 525,388 596,661 3.16 4.08 8.48 9.75 8.54 11.95 14.74 13.16 16.96 16.64 14.68 13.57
27 Uttaranchal 12,879 13,924 16,248 18,009 22,288 26,952 32,671 40,279 48,634 57,786 65,604 75,845 15.12 8.11 16.69 10.84 15.46 20.93 21.22 23.29 20.74 18.82 13.53 15.61
28 West Bengal 132,397 144,200 153,831 173,106 190,029 209,726 238,629 273,557 310,530 369,567 432,739 502,707 5.66 8.91 6.68 12.53 9.90 10.37 13.78 14.64 13.52 19.01 17.09 16.17
29 A & N islands 887 966 1,110 1,258 1,633 1,848 2,296 2,715 3,168 3,595 3,760 4,147 5.85 8.91 14.91 13.33 9.86 13.17 24.24 18.25 16.69 13.48 4.59 10.29
30 Chandigarh 4,405 5,050 5,969 6,881 7,610 9,179 11,074 12,327 13,745 15,842 18,253 N.A 16.17 14.64 18.20 15.28 18.63 20.62 20.64 11.31 11.50 15.26 15.22
31 Delhi 55,501 59,960 65,856 73,270 94,717 109,127 128,276 149,519 178,822 211,591 250,416 297,843 8.45 8.03 9.83 11.26 14.45 15.21 17.55 16.56 19.60 18.32 18.35 18.94
32 Pondicherry 3,480 3,812 4,450 4,886 5,033 7,135 7,429 8,179 8,908 10,089 11,512 12,082 20.29 9.54 16.74 9.80 -7.65 41.76 4.12 10.10 8.91 13.26 14.10 4.95
1,723,200 1,869,428 2,010,938 2,258,122 2,651,573 3,026,782 3,534,547 4,097,390 4,738,370 5,433,587 6,403,938 7,410,578 7.36 8.49 7.57 12.29 12.87 14.15 16.78 15.92 15.64 14.67 17.86 15.72
(Rupee in Crores) - (Data from 2004-05 at 2004-05 Prices)
Net State Domestic Product (NSDP) at Current Prices (as on 15-03-2012)
All-India NDP
(% Growth over previous year)
Source: For Sl. No. 1-32 -- Directorate of Economics Statistics of respective State Governments, and for All-India — Central Statistical OrganisationDatabook for DCH; 5th December 2012 Page 120 of 266
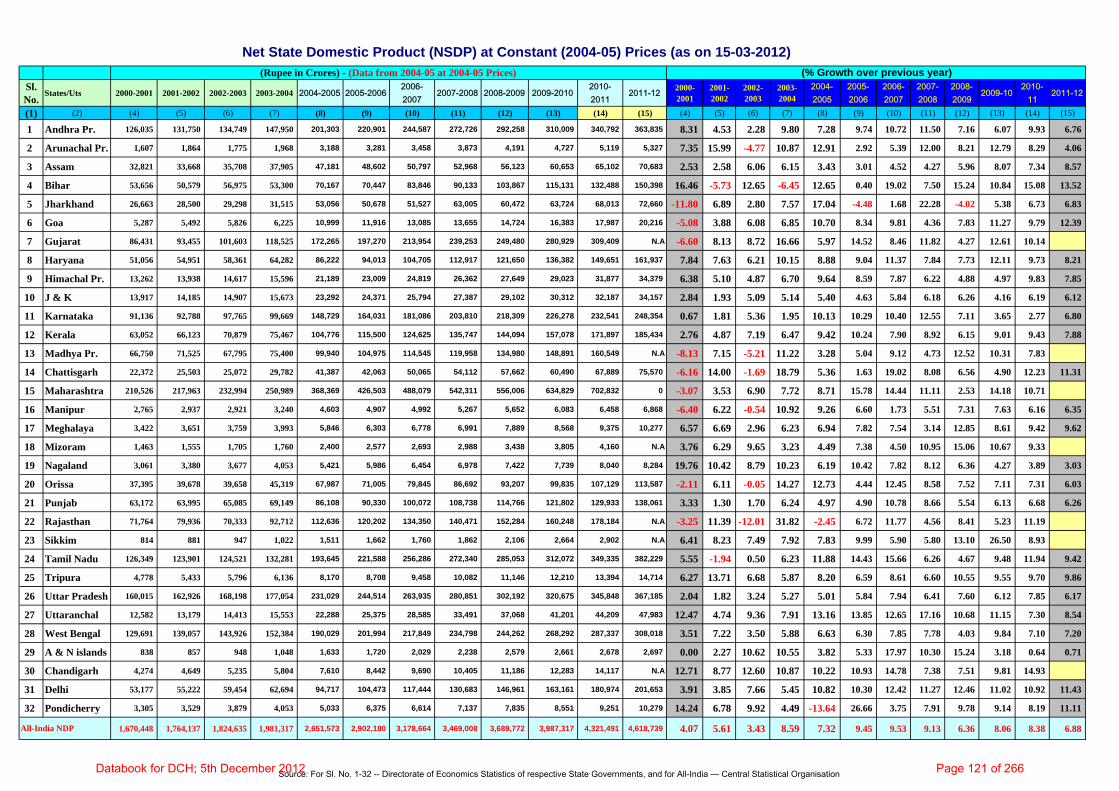
Sl. No.
States/Uts 2000-2001 2001-2002 2002-2003 2003-2004 2004-2005 2005-20062006-2007
2007-2008 2008-2009 2009-20102010-2011
2011-12 2000-2001
2001-2002
2002-2003
2003-2004
2004-2005
2005-2006
2006-2007
2007-2008
2008-2009
2009-102010-11
2011-12
(1) (2) (4) (5) (6) (7) (8) (9) (10) (11) (12) (13) (14) (15) (4) (5) (6) (7) (8) (9) (10) (11) (12) (13) (14) (15)
1 Andhra Pr. 126,035 131,750 134,749 147,950 201,303 220,901 244,587 272,726 292,258 310,009 340,792 363,835 8.31 4.53 2.28 9.80 7.28 9.74 10.72 11.50 7.16 6.07 9.93 6.76
2 Arunachal Pr. 1,607 1,864 1,775 1,968 3,188 3,281 3,458 3,873 4,191 4,727 5,119 5,327 7.35 15.99 -4.77 10.87 12.91 2.92 5.39 12.00 8.21 12.79 8.29 4.06
3 Assam 32,821 33,668 35,708 37,905 47,181 48,602 50,797 52,968 56,123 60,653 65,102 70,683 2.53 2.58 6.06 6.15 3.43 3.01 4.52 4.27 5.96 8.07 7.34 8.57
4 Bihar 53,656 50,579 56,975 53,300 70,167 70,447 83,846 90,133 103,867 115,131 132,488 150,398 16.46 -5.73 12.65 -6.45 12.65 0.40 19.02 7.50 15.24 10.84 15.08 13.52
5 Jharkhand 26,663 28,500 29,298 31,515 53,056 50,678 51,527 63,005 60,472 63,724 68,013 72,660 -11.80 6.89 2.80 7.57 17.04 -4.48 1.68 22.28 -4.02 5.38 6.73 6.83
6 Goa 5,287 5,492 5,826 6,225 10,999 11,916 13,085 13,655 14,724 16,383 17,987 20,216 -5.08 3.88 6.08 6.85 10.70 8.34 9.81 4.36 7.83 11.27 9.79 12.39
7 Gujarat 86,431 93,455 101,603 118,525 172,265 197,270 213,954 239,253 249,480 280,929 309,409 N.A -6.60 8.13 8.72 16.66 5.97 14.52 8.46 11.82 4.27 12.61 10.14
8 Haryana 51,056 54,951 58,361 64,282 86,222 94,013 104,705 112,917 121,650 136,382 149,651 161,937 7.84 7.63 6.21 10.15 8.88 9.04 11.37 7.84 7.73 12.11 9.73 8.21
9 Himachal Pr. 13,262 13,938 14,617 15,596 21,189 23,009 24,819 26,362 27,649 29,023 31,877 34,379 6.38 5.10 4.87 6.70 9.64 8.59 7.87 6.22 4.88 4.97 9.83 7.85
10 J & K 13,917 14,185 14,907 15,673 23,292 24,371 25,794 27,387 29,102 30,312 32,187 34,157 2.84 1.93 5.09 5.14 5.40 4.63 5.84 6.18 6.26 4.16 6.19 6.12
11 Karnataka 91,136 92,788 97,765 99,669 148,729 164,031 181,086 203,810 218,309 226,278 232,541 248,354 0.67 1.81 5.36 1.95 10.13 10.29 10.40 12.55 7.11 3.65 2.77 6.80
12 Kerala 63,052 66,123 70,879 75,467 104,776 115,500 124,625 135,747 144,094 157,078 171,897 185,434 2.76 4.87 7.19 6.47 9.42 10.24 7.90 8.92 6.15 9.01 9.43 7.88
13 Madhya Pr. 66,750 71,525 67,795 75,400 99,940 104,975 114,545 119,958 134,980 148,891 160,549 N.A -8.13 7.15 -5.21 11.22 3.28 5.04 9.12 4.73 12.52 10.31 7.83
14 Chattisgarh 22,372 25,503 25,072 29,782 41,387 42,063 50,065 54,112 57,662 60,490 67,889 75,570 -6.16 14.00 -1.69 18.79 5.36 1.63 19.02 8.08 6.56 4.90 12.23 11.31
15 Maharashtra 210,526 217,963 232,994 250,989 368,369 426,503 488,079 542,311 556,006 634,829 702,832 0 -3.07 3.53 6.90 7.72 8.71 15.78 14.44 11.11 2.53 14.18 10.71
16 Manipur 2,765 2,937 2,921 3,240 4,603 4,907 4,992 5,267 5,652 6,083 6,458 6,868 -6.40 6.22 -0.54 10.92 9.26 6.60 1.73 5.51 7.31 7.63 6.16 6.35
17 Meghalaya 3,422 3,651 3,759 3,993 5,846 6,303 6,778 6,991 7,889 8,568 9,375 10,277 6.57 6.69 2.96 6.23 6.94 7.82 7.54 3.14 12.85 8.61 9.42 9.62
18 Mizoram 1,463 1,555 1,705 1,760 2,400 2,577 2,693 2,988 3,438 3,805 4,160 N.A 3.76 6.29 9.65 3.23 4.49 7.38 4.50 10.95 15.06 10.67 9.33
19 Nagaland 3,061 3,380 3,677 4,053 5,421 5,986 6,454 6,978 7,422 7,739 8,040 8,284 19.76 10.42 8.79 10.23 6.19 10.42 7.82 8.12 6.36 4.27 3.89 3.03
20 Orissa 37,395 39,678 39,658 45,319 67,987 71,005 79,845 86,692 93,207 99,835 107,129 113,587 -2.11 6.11 -0.05 14.27 12.73 4.44 12.45 8.58 7.52 7.11 7.31 6.03
21 Punjab 63,172 63,995 65,085 69,149 86,108 90,330 100,072 108,738 114,766 121,802 129,933 138,061 3.33 1.30 1.70 6.24 4.97 4.90 10.78 8.66 5.54 6.13 6.68 6.26
22 Rajasthan 71,764 79,936 70,333 92,712 112,636 120,202 134,350 140,471 152,284 160,248 178,184 N.A -3.25 11.39 -12.01 31.82 -2.45 6.72 11.77 4.56 8.41 5.23 11.19
23 Sikkim 814 881 947 1,022 1,511 1,662 1,760 1,862 2,106 2,664 2,902 N.A 6.41 8.23 7.49 7.92 7.83 9.99 5.90 5.80 13.10 26.50 8.93
24 Tamil Nadu 126,349 123,901 124,521 132,281 193,645 221,588 256,286 272,340 285,053 312,072 349,335 382,229 5.55 -1.94 0.50 6.23 11.88 14.43 15.66 6.26 4.67 9.48 11.94 9.42
25 Tripura 4,778 5,433 5,796 6,136 8,170 8,708 9,458 10,082 11,146 12,210 13,394 14,714 6.27 13.71 6.68 5.87 8.20 6.59 8.61 6.60 10.55 9.55 9.70 9.86
26 Uttar Pradesh 160,015 162,926 168,198 177,054 231,029 244,514 263,935 280,851 302,192 320,675 345,848 367,185 2.04 1.82 3.24 5.27 5.01 5.84 7.94 6.41 7.60 6.12 7.85 6.17
27 Uttaranchal 12,582 13,179 14,413 15,553 22,288 25,375 28,585 33,491 37,068 41,201 44,209 47,983 12.47 4.74 9.36 7.91 13.16 13.85 12.65 17.16 10.68 11.15 7.30 8.54
28 West Bengal 129,691 139,057 143,926 152,384 190,029 201,994 217,849 234,798 244,262 268,292 287,337 308,018 3.51 7.22 3.50 5.88 6.63 6.30 7.85 7.78 4.03 9.84 7.10 7.20
29 A & N islands 838 857 948 1,048 1,633 1,720 2,029 2,238 2,579 2,661 2,678 2,697 0.00 2.27 10.62 10.55 3.82 5.33 17.97 10.30 15.24 3.18 0.64 0.71
30 Chandigarh 4,274 4,649 5,235 5,804 7,610 8,442 9,690 10,405 11,186 12,283 14,117 N.A 12.71 8.77 12.60 10.87 10.22 10.93 14.78 7.38 7.51 9.81 14.93
31 Delhi 53,177 55,222 59,454 62,694 94,717 104,473 117,444 130,683 146,961 163,161 180,974 201,653 3.91 3.85 7.66 5.45 10.82 10.30 12.42 11.27 12.46 11.02 10.92 11.43
32 Pondicherry 3,305 3,529 3,879 4,053 5,033 6,375 6,614 7,137 7,835 8,551 9,251 10,279 14.24 6.78 9.92 4.49 -13.64 26.66 3.75 7.91 9.78 9.14 8.19 11.11
1,670,448 1,764,137 1,824,635 1,981,317 2,651,573 2,902,180 3,178,664 3,469,008 3,689,772 3,987,317 4,321,491 4,618,739 4.07 5.61 3.43 8.59 7.32 9.45 9.53 9.13 6.36 8.06 8.38 6.88
(Rupee in Crores) - (Data from 2004-05 at 2004-05 Prices)
All-India NDP
Net State Domestic Product (NSDP) at Constant (2004-05) Prices (as on 15-03-2012)
(% Growth over previous year)
Source: For Sl. No. 1-32 -- Directorate of Economics Statistics of respective State Governments, and for All-India — Central Statistical OrganisationDatabook for DCH; 5th December 2012 Page 121 of 266
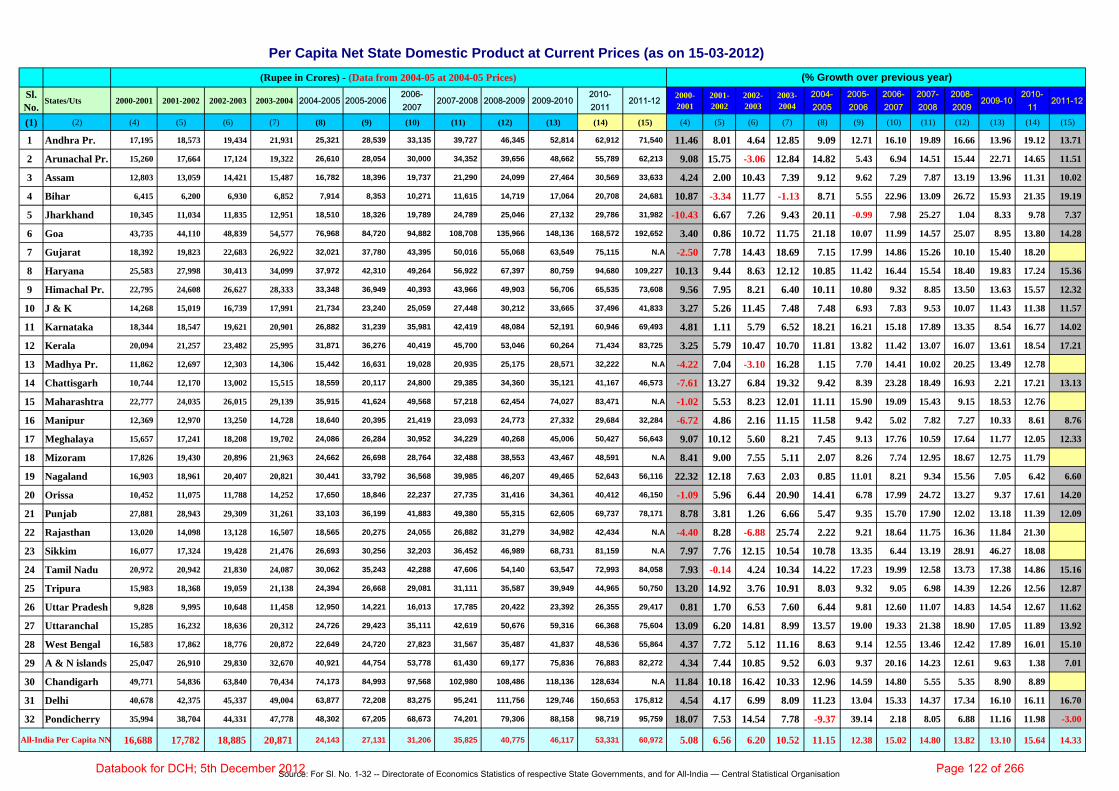
Sl. No.
States/Uts 2000-2001 2001-2002 2002-2003 2003-2004 2004-2005 2005-20062006-2007
2007-2008 2008-2009 2009-20102010-2011
2011-12 2000-2001
2001-2002
2002-2003
2003-2004
2004-2005
2005-2006
2006-2007
2007-2008
2008-2009
2009-102010-11
2011-12
(1) (2) (4) (5) (6) (7) (8) (9) (10) (11) (12) (13) (14) (15) (4) (5) (6) (7) (8) (9) (10) (11) (12) (13) (14) (15)
1 Andhra Pr. 17,195 18,573 19,434 21,931 25,321 28,539 33,135 39,727 46,345 52,814 62,912 71,540 11.46 8.01 4.64 12.85 9.09 12.71 16.10 19.89 16.66 13.96 19.12 13.71
2 Arunachal Pr. 15,260 17,664 17,124 19,322 26,610 28,054 30,000 34,352 39,656 48,662 55,789 62,213 9.08 15.75 -3.06 12.84 14.82 5.43 6.94 14.51 15.44 22.71 14.65 11.51
3 Assam 12,803 13,059 14,421 15,487 16,782 18,396 19,737 21,290 24,099 27,464 30,569 33,633 4.24 2.00 10.43 7.39 9.12 9.62 7.29 7.87 13.19 13.96 11.31 10.02
4 Bihar 6,415 6,200 6,930 6,852 7,914 8,353 10,271 11,615 14,719 17,064 20,708 24,681 10.87 -3.34 11.77 -1.13 8.71 5.55 22.96 13.09 26.72 15.93 21.35 19.19
5 Jharkhand 10,345 11,034 11,835 12,951 18,510 18,326 19,789 24,789 25,046 27,132 29,786 31,982 -10.43 6.67 7.26 9.43 20.11 -0.99 7.98 25.27 1.04 8.33 9.78 7.37
6 Goa 43,735 44,110 48,839 54,577 76,968 84,720 94,882 108,708 135,966 148,136 168,572 192,652 3.40 0.86 10.72 11.75 21.18 10.07 11.99 14.57 25.07 8.95 13.80 14.28
7 Gujarat 18,392 19,823 22,683 26,922 32,021 37,780 43,395 50,016 55,068 63,549 75,115 N.A -2.50 7.78 14.43 18.69 7.15 17.99 14.86 15.26 10.10 15.40 18.20
8 Haryana 25,583 27,998 30,413 34,099 37,972 42,310 49,264 56,922 67,397 80,759 94,680 109,227 10.13 9.44 8.63 12.12 10.85 11.42 16.44 15.54 18.40 19.83 17.24 15.36
9 Himachal Pr. 22,795 24,608 26,627 28,333 33,348 36,949 40,393 43,966 49,903 56,706 65,535 73,608 9.56 7.95 8.21 6.40 10.11 10.80 9.32 8.85 13.50 13.63 15.57 12.32
10 J & K 14,268 15,019 16,739 17,991 21,734 23,240 25,059 27,448 30,212 33,665 37,496 41,833 3.27 5.26 11.45 7.48 7.48 6.93 7.83 9.53 10.07 11.43 11.38 11.57
11 Karnataka 18,344 18,547 19,621 20,901 26,882 31,239 35,981 42,419 48,084 52,191 60,946 69,493 4.81 1.11 5.79 6.52 18.21 16.21 15.18 17.89 13.35 8.54 16.77 14.02
12 Kerala 20,094 21,257 23,482 25,995 31,871 36,276 40,419 45,700 53,046 60,264 71,434 83,725 3.25 5.79 10.47 10.70 11.81 13.82 11.42 13.07 16.07 13.61 18.54 17.21
13 Madhya Pr. 11,862 12,697 12,303 14,306 15,442 16,631 19,028 20,935 25,175 28,571 32,222 N.A -4.22 7.04 -3.10 16.28 1.15 7.70 14.41 10.02 20.25 13.49 12.78
14 Chattisgarh 10,744 12,170 13,002 15,515 18,559 20,117 24,800 29,385 34,360 35,121 41,167 46,573 -7.61 13.27 6.84 19.32 9.42 8.39 23.28 18.49 16.93 2.21 17.21 13.13
15 Maharashtra 22,777 24,035 26,015 29,139 35,915 41,624 49,568 57,218 62,454 74,027 83,471 N.A -1.02 5.53 8.23 12.01 11.11 15.90 19.09 15.43 9.15 18.53 12.76
16 Manipur 12,369 12,970 13,250 14,728 18,640 20,395 21,419 23,093 24,773 27,332 29,684 32,284 -6.72 4.86 2.16 11.15 11.58 9.42 5.02 7.82 7.27 10.33 8.61 8.76
17 Meghalaya 15,657 17,241 18,208 19,702 24,086 26,284 30,952 34,229 40,268 45,006 50,427 56,643 9.07 10.12 5.60 8.21 7.45 9.13 17.76 10.59 17.64 11.77 12.05 12.33
18 Mizoram 17,826 19,430 20,896 21,963 24,662 26,698 28,764 32,488 38,553 43,467 48,591 N.A 8.41 9.00 7.55 5.11 2.07 8.26 7.74 12.95 18.67 12.75 11.79
19 Nagaland 16,903 18,961 20,407 20,821 30,441 33,792 36,568 39,985 46,207 49,465 52,643 56,116 22.32 12.18 7.63 2.03 0.85 11.01 8.21 9.34 15.56 7.05 6.42 6.60
20 Orissa 10,452 11,075 11,788 14,252 17,650 18,846 22,237 27,735 31,416 34,361 40,412 46,150 -1.09 5.96 6.44 20.90 14.41 6.78 17.99 24.72 13.27 9.37 17.61 14.20
21 Punjab 27,881 28,943 29,309 31,261 33,103 36,199 41,883 49,380 55,315 62,605 69,737 78,171 8.78 3.81 1.26 6.66 5.47 9.35 15.70 17.90 12.02 13.18 11.39 12.09
22 Rajasthan 13,020 14,098 13,128 16,507 18,565 20,275 24,055 26,882 31,279 34,982 42,434 N.A -4.40 8.28 -6.88 25.74 2.22 9.21 18.64 11.75 16.36 11.84 21.30
23 Sikkim 16,077 17,324 19,428 21,476 26,693 30,256 32,203 36,452 46,989 68,731 81,159 N.A 7.97 7.76 12.15 10.54 10.78 13.35 6.44 13.19 28.91 46.27 18.08
24 Tamil Nadu 20,972 20,942 21,830 24,087 30,062 35,243 42,288 47,606 54,140 63,547 72,993 84,058 7.93 -0.14 4.24 10.34 14.22 17.23 19.99 12.58 13.73 17.38 14.86 15.16
25 Tripura 15,983 18,368 19,059 21,138 24,394 26,668 29,081 31,111 35,587 39,949 44,965 50,750 13.20 14.92 3.76 10.91 8.03 9.32 9.05 6.98 14.39 12.26 12.56 12.87
26 Uttar Pradesh 9,828 9,995 10,648 11,458 12,950 14,221 16,013 17,785 20,422 23,392 26,355 29,417 0.81 1.70 6.53 7.60 6.44 9.81 12.60 11.07 14.83 14.54 12.67 11.62
27 Uttaranchal 15,285 16,232 18,636 20,312 24,726 29,423 35,111 42,619 50,676 59,316 66,368 75,604 13.09 6.20 14.81 8.99 13.57 19.00 19.33 21.38 18.90 17.05 11.89 13.92
28 West Bengal 16,583 17,862 18,776 20,872 22,649 24,720 27,823 31,567 35,487 41,837 48,536 55,864 4.37 7.72 5.12 11.16 8.63 9.14 12.55 13.46 12.42 17.89 16.01 15.10
29 A & N islands 25,047 26,910 29,830 32,670 40,921 44,754 53,778 61,430 69,177 75,836 76,883 82,272 4.34 7.44 10.85 9.52 6.03 9.37 20.16 14.23 12.61 9.63 1.38 7.01
30 Chandigarh 49,771 54,836 63,840 70,434 74,173 84,993 97,568 102,980 108,486 118,136 128,634 N.A 11.84 10.18 16.42 10.33 12.96 14.59 14.80 5.55 5.35 8.90 8.89
31 Delhi 40,678 42,375 45,337 49,004 63,877 72,208 83,275 95,241 111,756 129,746 150,653 175,812 4.54 4.17 6.99 8.09 11.23 13.04 15.33 14.37 17.34 16.10 16.11 16.70
32 Pondicherry 35,994 38,704 44,331 47,778 48,302 67,205 68,673 74,201 79,306 88,158 98,719 95,759 18.07 7.53 14.54 7.78 -9.37 39.14 2.18 8.05 6.88 11.16 11.98 -3.00
16,688 17,782 18,885 20,871 24,143 27,131 31,206 35,825 40,775 46,117 53,331 60,972 5.08 6.56 6.20 10.52 11.15 12.38 15.02 14.80 13.82 13.10 15.64 14.33
(Rupee in Crores) - (Data from 2004-05 at 2004-05 Prices)
All-India Per Capita NN
(% Growth over previous year)
Per Capita Net State Domestic Product at Current Prices (as on 15-03-2012)
Source: For Sl. No. 1-32 -- Directorate of Economics Statistics of respective State Governments, and for All-India — Central Statistical OrganisationDatabook for DCH; 5th December 2012 Page 122 of 266
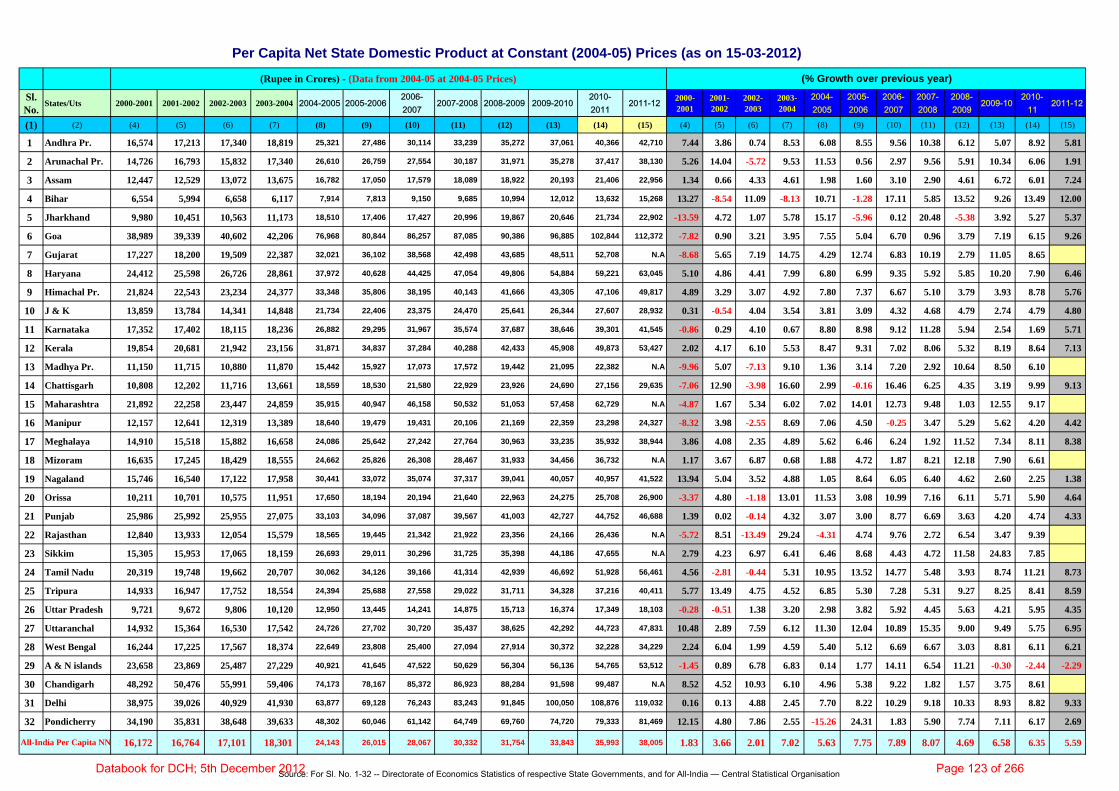
Sl. No.
States/Uts 2000-2001 2001-2002 2002-2003 2003-2004 2004-2005 2005-20062006-2007
2007-2008 2008-2009 2009-20102010-2011
2011-12 2000-2001
2001-2002
2002-2003
2003-2004
2004-2005
2005-2006
2006-2007
2007-2008
2008-2009
2009-102010-11
2011-12
(1) (2) (4) (5) (6) (7) (8) (9) (10) (11) (12) (13) (14) (15) (4) (5) (6) (7) (8) (9) (10) (11) (12) (13) (14) (15)
1 Andhra Pr. 16,574 17,213 17,340 18,819 25,321 27,486 30,114 33,239 35,272 37,061 40,366 42,710 7.44 3.86 0.74 8.53 6.08 8.55 9.56 10.38 6.12 5.07 8.92 5.81
2 Arunachal Pr. 14,726 16,793 15,832 17,340 26,610 26,759 27,554 30,187 31,971 35,278 37,417 38,130 5.26 14.04 -5.72 9.53 11.53 0.56 2.97 9.56 5.91 10.34 6.06 1.91
3 Assam 12,447 12,529 13,072 13,675 16,782 17,050 17,579 18,089 18,922 20,193 21,406 22,956 1.34 0.66 4.33 4.61 1.98 1.60 3.10 2.90 4.61 6.72 6.01 7.24
4 Bihar 6,554 5,994 6,658 6,117 7,914 7,813 9,150 9,685 10,994 12,012 13,632 15,268 13.27 -8.54 11.09 -8.13 10.71 -1.28 17.11 5.85 13.52 9.26 13.49 12.00
5 Jharkhand 9,980 10,451 10,563 11,173 18,510 17,406 17,427 20,996 19,867 20,646 21,734 22,902 -13.59 4.72 1.07 5.78 15.17 -5.96 0.12 20.48 -5.38 3.92 5.27 5.37
6 Goa 38,989 39,339 40,602 42,206 76,968 80,844 86,257 87,085 90,386 96,885 102,844 112,372 -7.82 0.90 3.21 3.95 7.55 5.04 6.70 0.96 3.79 7.19 6.15 9.26
7 Gujarat 17,227 18,200 19,509 22,387 32,021 36,102 38,568 42,498 43,685 48,511 52,708 N.A -8.68 5.65 7.19 14.75 4.29 12.74 6.83 10.19 2.79 11.05 8.65
8 Haryana 24,412 25,598 26,726 28,861 37,972 40,628 44,425 47,054 49,806 54,884 59,221 63,045 5.10 4.86 4.41 7.99 6.80 6.99 9.35 5.92 5.85 10.20 7.90 6.46
9 Himachal Pr. 21,824 22,543 23,234 24,377 33,348 35,806 38,195 40,143 41,666 43,305 47,106 49,817 4.89 3.29 3.07 4.92 7.80 7.37 6.67 5.10 3.79 3.93 8.78 5.76
10 J & K 13,859 13,784 14,341 14,848 21,734 22,406 23,375 24,470 25,641 26,344 27,607 28,932 0.31 -0.54 4.04 3.54 3.81 3.09 4.32 4.68 4.79 2.74 4.79 4.80
11 Karnataka 17,352 17,402 18,115 18,236 26,882 29,295 31,967 35,574 37,687 38,646 39,301 41,545 -0.86 0.29 4.10 0.67 8.80 8.98 9.12 11.28 5.94 2.54 1.69 5.71
12 Kerala 19,854 20,681 21,942 23,156 31,871 34,837 37,284 40,288 42,433 45,908 49,873 53,427 2.02 4.17 6.10 5.53 8.47 9.31 7.02 8.06 5.32 8.19 8.64 7.13
13 Madhya Pr. 11,150 11,715 10,880 11,870 15,442 15,927 17,073 17,572 19,442 21,095 22,382 N.A -9.96 5.07 -7.13 9.10 1.36 3.14 7.20 2.92 10.64 8.50 6.10
14 Chattisgarh 10,808 12,202 11,716 13,661 18,559 18,530 21,580 22,929 23,926 24,690 27,156 29,635 -7.06 12.90 -3.98 16.60 2.99 -0.16 16.46 6.25 4.35 3.19 9.99 9.13
15 Maharashtra 21,892 22,258 23,447 24,859 35,915 40,947 46,158 50,532 51,053 57,458 62,729 N.A -4.87 1.67 5.34 6.02 7.02 14.01 12.73 9.48 1.03 12.55 9.17
16 Manipur 12,157 12,641 12,319 13,389 18,640 19,479 19,431 20,106 21,169 22,359 23,298 24,327 -8.32 3.98 -2.55 8.69 7.06 4.50 -0.25 3.47 5.29 5.62 4.20 4.42
17 Meghalaya 14,910 15,518 15,882 16,658 24,086 25,642 27,242 27,764 30,963 33,235 35,932 38,944 3.86 4.08 2.35 4.89 5.62 6.46 6.24 1.92 11.52 7.34 8.11 8.38
18 Mizoram 16,635 17,245 18,429 18,555 24,662 25,826 26,308 28,467 31,933 34,456 36,732 N.A 1.17 3.67 6.87 0.68 1.88 4.72 1.87 8.21 12.18 7.90 6.61
19 Nagaland 15,746 16,540 17,122 17,958 30,441 33,072 35,074 37,317 39,041 40,057 40,957 41,522 13.94 5.04 3.52 4.88 1.05 8.64 6.05 6.40 4.62 2.60 2.25 1.38
20 Orissa 10,211 10,701 10,575 11,951 17,650 18,194 20,194 21,640 22,963 24,275 25,708 26,900 -3.37 4.80 -1.18 13.01 11.53 3.08 10.99 7.16 6.11 5.71 5.90 4.64
21 Punjab 25,986 25,992 25,955 27,075 33,103 34,096 37,087 39,567 41,003 42,727 44,752 46,688 1.39 0.02 -0.14 4.32 3.07 3.00 8.77 6.69 3.63 4.20 4.74 4.33
22 Rajasthan 12,840 13,933 12,054 15,579 18,565 19,445 21,342 21,922 23,356 24,166 26,436 N.A -5.72 8.51 -13.49 29.24 -4.31 4.74 9.76 2.72 6.54 3.47 9.39
23 Sikkim 15,305 15,953 17,065 18,159 26,693 29,011 30,296 31,725 35,398 44,186 47,655 N.A 2.79 4.23 6.97 6.41 6.46 8.68 4.43 4.72 11.58 24.83 7.85
24 Tamil Nadu 20,319 19,748 19,662 20,707 30,062 34,126 39,166 41,314 42,939 46,692 51,928 56,461 4.56 -2.81 -0.44 5.31 10.95 13.52 14.77 5.48 3.93 8.74 11.21 8.73
25 Tripura 14,933 16,947 17,752 18,554 24,394 25,688 27,558 29,022 31,711 34,328 37,216 40,411 5.77 13.49 4.75 4.52 6.85 5.30 7.28 5.31 9.27 8.25 8.41 8.59
26 Uttar Pradesh 9,721 9,672 9,806 10,120 12,950 13,445 14,241 14,875 15,713 16,374 17,349 18,103 -0.28 -0.51 1.38 3.20 2.98 3.82 5.92 4.45 5.63 4.21 5.95 4.35
27 Uttaranchal 14,932 15,364 16,530 17,542 24,726 27,702 30,720 35,437 38,625 42,292 44,723 47,831 10.48 2.89 7.59 6.12 11.30 12.04 10.89 15.35 9.00 9.49 5.75 6.95
28 West Bengal 16,244 17,225 17,567 18,374 22,649 23,808 25,400 27,094 27,914 30,372 32,228 34,229 2.24 6.04 1.99 4.59 5.40 5.12 6.69 6.67 3.03 8.81 6.11 6.21
29 A & N islands 23,658 23,869 25,487 27,229 40,921 41,645 47,522 50,629 56,304 56,136 54,765 53,512 -1.45 0.89 6.78 6.83 0.14 1.77 14.11 6.54 11.21 -0.30 -2.44 -2.29
30 Chandigarh 48,292 50,476 55,991 59,406 74,173 78,167 85,372 86,923 88,284 91,598 99,487 N.A 8.52 4.52 10.93 6.10 4.96 5.38 9.22 1.82 1.57 3.75 8.61
31 Delhi 38,975 39,026 40,929 41,930 63,877 69,128 76,243 83,243 91,845 100,050 108,876 119,032 0.16 0.13 4.88 2.45 7.70 8.22 10.29 9.18 10.33 8.93 8.82 9.33
32 Pondicherry 34,190 35,831 38,648 39,633 48,302 60,046 61,142 64,749 69,760 74,720 79,333 81,469 12.15 4.80 7.86 2.55 -15.26 24.31 1.83 5.90 7.74 7.11 6.17 2.69
16,172 16,764 17,101 18,301 24,143 26,015 28,067 30,332 31,754 33,843 35,993 38,005 1.83 3.66 2.01 7.02 5.63 7.75 7.89 8.07 4.69 6.58 6.35 5.59
(Rupee in Crores) - (Data from 2004-05 at 2004-05 Prices)
All-India Per Capita NN
(% Growth over previous year)
Per Capita Net State Domestic Product at Constant (2004-05) Prices (as on 15-03-2012)
Source: For Sl. No. 1-32 -- Directorate of Economics Statistics of respective State Governments, and for All-India — Central Statistical OrganisationDatabook for DCH; 5th December 2012 Page 123 of 266
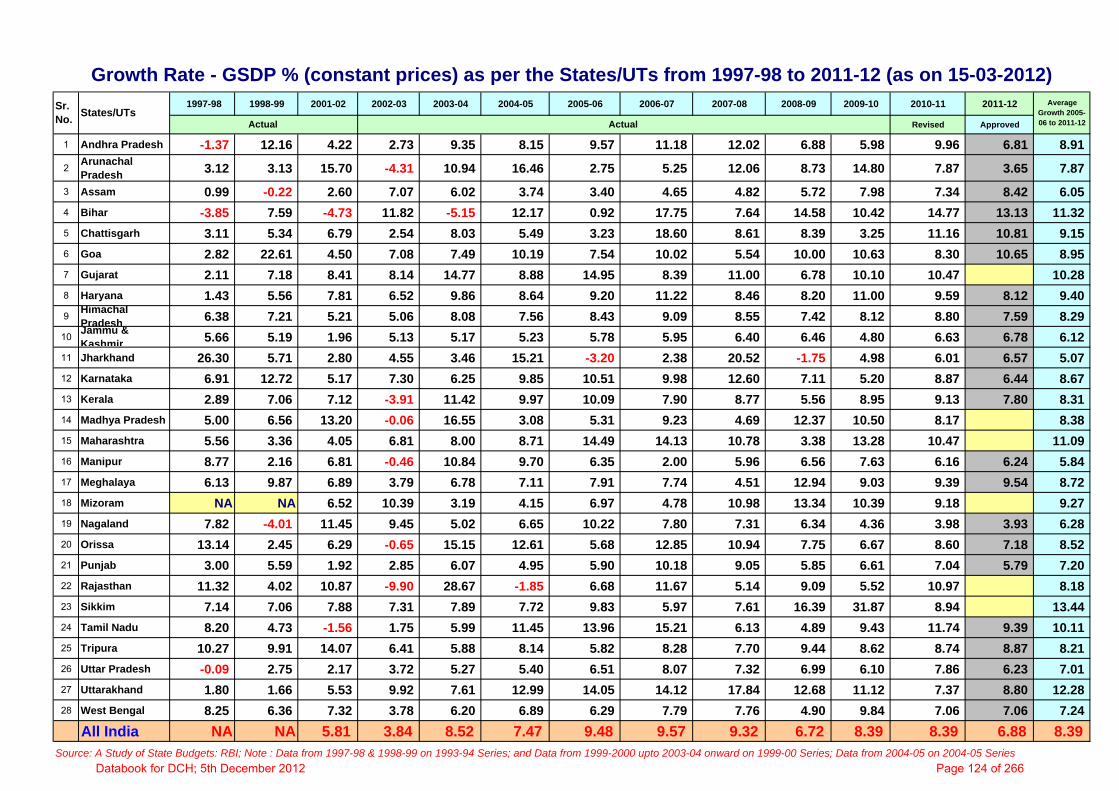
Growth Rate - GSDP % (constant prices) as per the States/UTs from 1997-98 to 2011-12 (as on 15-03-2012)
Sr.
No.States/UTs
1997-98 1998-99 2001-02 2002-03 2003-04 2004-05 2005-06 2006-07 2007-08 2008-09 2009-10 2010-11 2011-12 Average
Growth 2005-
06 to 2011-12Actual Actual Revised Approved
1 Andhra Pradesh -1.37 12.16 4.22 2.73 9.35 8.15 9.57 11.18 12.02 6.88 5.98 9.96 6.81 8.91
2Arunachal
Pradesh 3.12 3.13 15.70 -4.31 10.94 16.46 2.75 5.25 12.06 8.73 14.80 7.87 3.65 7.87
3 Assam 0.99 -0.22 2.60 7.07 6.02 3.74 3.40 4.65 4.82 5.72 7.98 7.34 8.42 6.05
4 Bihar -3.85 7.59 -4.73 11.82 -5.15 12.17 0.92 17.75 7.64 14.58 10.42 14.77 13.13 11.32
5 Chattisgarh 3.11 5.34 6.79 2.54 8.03 5.49 3.23 18.60 8.61 8.39 3.25 11.16 10.81 9.15
6 Goa 2.82 22.61 4.50 7.08 7.49 10.19 7.54 10.02 5.54 10.00 10.63 8.30 10.65 8.95
7 Gujarat 2.11 7.18 8.41 8.14 14.77 8.88 14.95 8.39 11.00 6.78 10.10 10.47 10.28
8 Haryana 1.43 5.56 7.81 6.52 9.86 8.64 9.20 11.22 8.46 8.20 11.00 9.59 8.12 9.40
9Himachal
6.38 7.21 5.21 5.06 8.08 7.56 8.43 9.09 8.55 7.42 8.12 8.80 7.59 8.29
10PradeshJammu &
5.66 5.19 1.96 5.13 5.17 5.23 5.78 5.95 6.40 6.46 4.80 6.63 6.78 6.12
11Kashmir
Jharkhand 26.30 5.71 2.80 4.55 3.46 15.21 -3.20 2.38 20.52 -1.75 4.98 6.01 6.57 5.07
12 Karnataka 6.91 12.72 5.17 7.30 6.25 9.85 10.51 9.98 12.60 7.11 5.20 8.87 6.44 8.67
13 Kerala 2.89 7.06 7.12 -3.91 11.42 9.97 10.09 7.90 8.77 5.56 8.95 9.13 7.80 8.31
14 Madhya Pradesh 5.00 6.56 13.20 -0.06 16.55 3.08 5.31 9.23 4.69 12.37 10.50 8.17 8.38
15 Maharashtra 5.56 3.36 4.05 6.81 8.00 8.71 14.49 14.13 10.78 3.38 13.28 10.47 11.09
16 Manipur 8.77 2.16 6.81 -0.46 10.84 9.70 6.35 2.00 5.96 6.56 7.63 6.16 6.24 5.84
17 Meghalaya 6.13 9.87 6.89 3.79 6.78 7.11 7.91 7.74 4.51 12.94 9.03 9.39 9.54 8.72
18 Mizoram NA NA 6.52 10.39 3.19 4.15 6.97 4.78 10.98 13.34 10.39 9.18 9.27
19 Nagaland 7.82 -4.01 11.45 9.45 5.02 6.65 10.22 7.80 7.31 6.34 4.36 3.98 3.93 6.28
20 Orissa 13.14 2.45 6.29 -0.65 15.15 12.61 5.68 12.85 10.94 7.75 6.67 8.60 7.18 8.52
21 Punjab 3.00 5.59 1.92 2.85 6.07 4.95 5.90 10.18 9.05 5.85 6.61 7.04 5.79 7.20
22 Rajasthan 11.32 4.02 10.87 -9.90 28.67 -1.85 6.68 11.67 5.14 9.09 5.52 10.97 8.18
23 Sikkim 7.14 7.06 7.88 7.31 7.89 7.72 9.83 5.97 7.61 16.39 31.87 8.94 13.44
24 Tamil Nadu 8.20 4.73 -1.56 1.75 5.99 11.45 13.96 15.21 6.13 4.89 9.43 11.74 9.39 10.11
25 Tripura 10.27 9.91 14.07 6.41 5.88 8.14 5.82 8.28 7.70 9.44 8.62 8.74 8.87 8.21
26 Uttar Pradesh -0.09 2.75 2.17 3.72 5.27 5.40 6.51 8.07 7.32 6.99 6.10 7.86 6.23 7.01
27 Uttarakhand 1.80 1.66 5.53 9.92 7.61 12.99 14.05 14.12 17.84 12.68 11.12 7.37 8.80 12.28
28 West Bengal 8.25 6.36 7.32 3.78 6.20 6.89 6.29 7.79 7.76 4.90 9.84 7.06 7.06 7.24
All India NA NA 5.81 3.84 8.52 7.47 9.48 9.57 9.32 6.72 8.39 8.39 6.88 8.39
Source: A Study of State Budgets: RBI; Note : Data from 1997-98 & 1998-99 on 1993-94 Series; and Data from 1999-2000 upto 2003-04 onward on 1999-00 Series; Data from 2004-05 on 2004-05 SeriesDatabook for DCH; 5th December 2012 Page 124 of 266
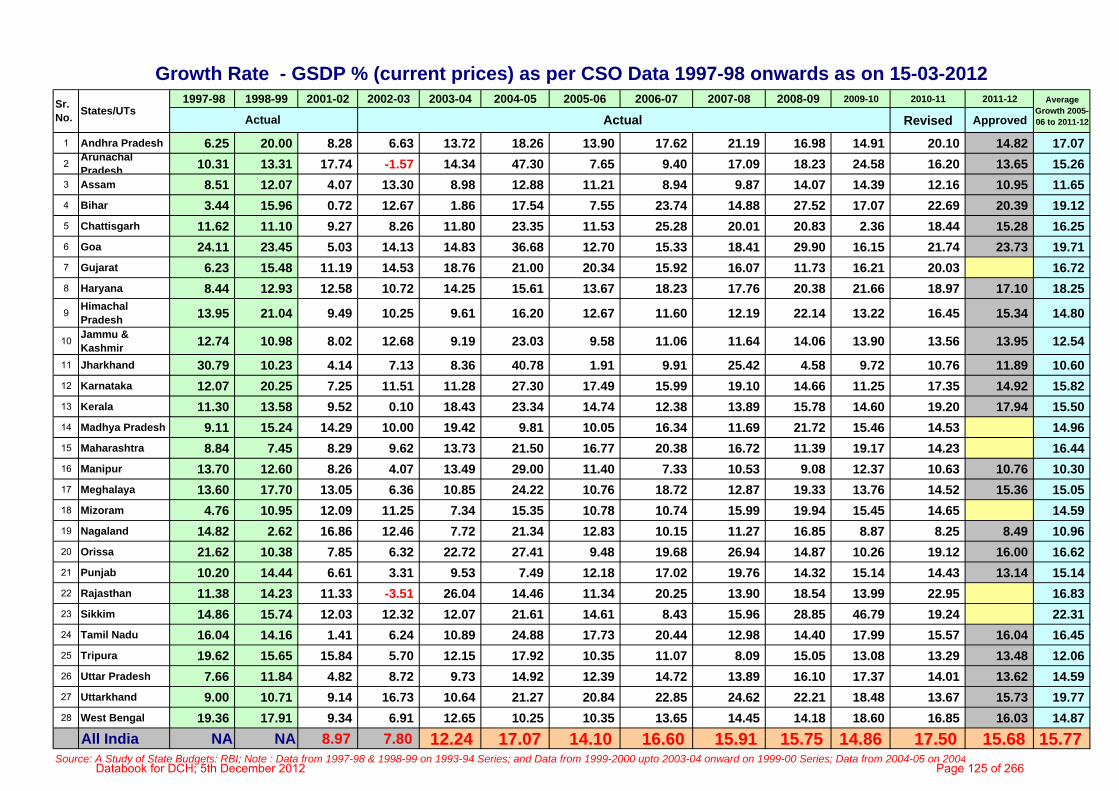
28
15.68 15.774
Growth Rate - GSDP % (current prices) as per CSO Data 1997-98 onwards as on 15-03-2012
Sr.
No.States/UTs
1997-98 1998-99 2001-02 2002-03 2003-04 2004-05 2005-06 2006-07 2007-08 2008-09 2009-10 2010-11 2011-12 Average
Growth 2005-
06 to 2011-12Actual Actual Revised Approved
1 Andhra Pradesh 6.25 20.00 8.28 6.63 13.72 18.26 13.90 17.62 21.19 16.98 14.91 20.10 14.82 17.07
2Arunachal
10.31 13.31 17.74 -1.57 14.34 47.30 7.65 9.40 17.09 18.23 24.58 16.20 13.65 15.26
3Pradesh
Assam 8.51 12.07 4.07 13.30 8.98 12.88 11.21 8.94 9.87 14.07 14.39 12.16 10.95 11.65
4 Bihar 3.44 15.96 0.72 12.67 1.86 17.54 7.55 23.74 14.88 27.52 17.07 22.69 20.39 19.12
5 Chattisgarh 11.62 11.10 9.27 8.26 11.80 23.35 11.53 25.28 20.01 20.83 2.36 18.44 15.28 16.25
6 Goa 24.11 23.45 5.03 14.13 14.83 36.68 12.70 15.33 18.41 29.90 16.15 21.74 23.73 19.71
7 Gujarat 6.23 15.48 11.19 14.53 18.76 21.00 20.34 15.92 16.07 11.73 16.21 20.03 16.72
8 Haryana 8.44 12.93 12.58 10.72 14.25 15.61 13.67 18.23 17.76 20.38 21.66 18.97 17.10 18.25
9Himachal
13.95 21.04 9.49 10.25 9.61 16.20 12.67 11.60 12.19 22.14 13.22 16.45 15.34 14.80
10
Pradesh
Jammu & 12.74 10.98 8.02 12.68 9.19 23.03 9.58 11.06 11.64 14.06 13.90 13.56 13.95 12.54
11
Kashmir
Jharkhand 30.79 10.23 4.14 7.13 8.36 40.78 1.91 9.91 25.42 4.58 9.72 10.76 11.89 10.60
12 Karnataka 12.07 20.25 7.25 11.51 11.28 27.30 17.49 15.99 19.10 14.66 11.25 17.35 14.92 15.82
13 Kerala 11.30 13.58 9.52 0.10 18.43 23.34 14.74 12.38 13.89 15.78 14.60 19.20 17.94 15.50
14 Madhya Pradesh 9.11 15.24 14.29 10.00 19.42 9.81 10.05 16.34 11.69 21.72 15.46 14.53 14.96
15 Maharashtra 8.84 7.45 8.29 9.62 13.73 21.50 16.77 20.38 16.72 11.39 19.17 14.23 16.44
16 Manipur 13.70 12.60 8.26 4.07 13.49 29.00 11.40 7.33 10.53 9.08 12.37 10.63 10.76 10.30
17 Meghalaya 13.60 17.70 13.05 6.36 10.85 24.22 10.76 18.72 12.87 19.33 13.76 14.52 15.36 15.05
18 Mizoram 4.76 10.95 12.09 11.25 7.34 15.35 10.78 10.74 15.99 19.94 15.45 14.65 14.59
19 Nagaland 14.82 2.62 16.86 12.46 7.72 21.34 12.83 10.15 11.27 16.85 8.87 8.25 8.49 10.96
20 Orissa 21.62 10.38 7.85 6.32 22.72 27.41 9.48 19.68 26.94 14.87 10.26 19.12 16.00 16.62
21 Punjab
22 Rajasthan
10.20 14.44 6.61 3.31 9.53 7.49 12.18 17.02 19.76 14.32 15.14 14.43 13.14 15.14
23
11.38 14.23 11.33 -3.51 26.04 14.46 11.34 20.25 13.90 18.54 13.99 22.95 16.83
24
Sikkim 14.86 15.74 12.03 12.32 12.07 21.61 14.61 8.43 15.96 28.85 46.79 19.24 22.31
Tamil Nadu 16.04 14.16 1.41 6.24 10.89 24.88 17.73 20.44 12.98 14.40 17.99 15.57 16.04 16.45
25 Tripura 19.62 15.65 15.84 5.70 12.15 17.92 10.35 11.07 8.09 15.05 13.08 13.29 13.48 12.06
26 Uttar Pradesh 7.66 11.84 4.82 8.72 9.73 14.92 12.39 14.72 13.89 16.10 17.37 14.01 13.62 14.59
27 Uttarkhand 9.00 10.71 9.14 16.73 10.64 21.27 20.84 22.85 24.62 22.21 18.48 13.67 15.73 19.77
West Bengal 19.36 17.91 9.34 6.91 12.65 10.25 10.35 13.65 14.45 14.18 18.60 16.85 16.03 14.87
All India NA NA 8.97 7.80 12.24 17.07 14.10 16.60 15.91 15.75 14.86 17.50Source: A Study of State Budgets: RBI; Note : Data from 1997-98 & 1998-99 on 1993-94 Series; and Data from 1999-2000 upto 2003-04 onward on 1999-00 Series; Data from 2004-05 on 200
Databook for DCH; 5th December 2012 Page 125 of 266
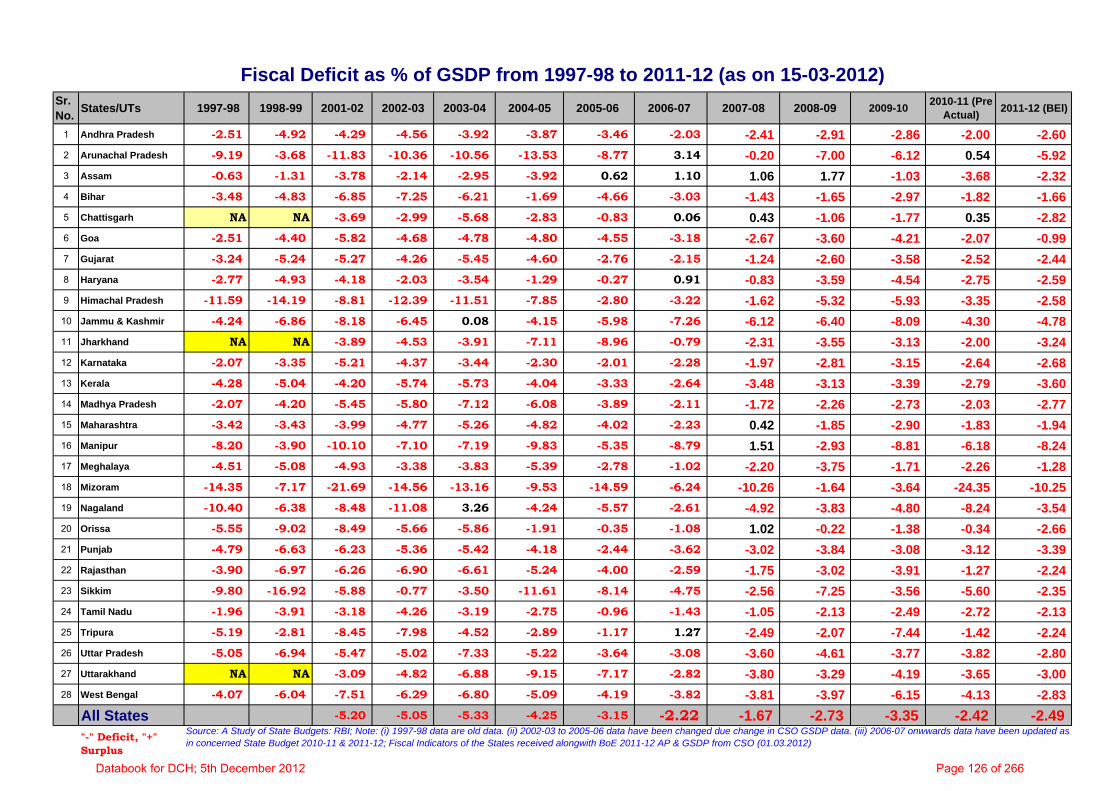
28
Fiscal Deficit as % of GSDP from 1997-98 to 2011-12 (as on 15-03-2012)
Sr.
No.States/UTs 1997-98 1998-99 2001-02 2002-03 2003-04 2004-05 2005-06 2006-07 2007-08 2008-09 2009-10
2010-11 (Pre
Actual)2011-12 (BEl)
1 Andhra Pradesh -2.51 -4.92 -4.29 -4.56 -3.92 -3.87 -3.46 -2.03 -2.41 -2.91 -2.86 -2.00 -2.60
2 Arunachal Pradesh -9.19 -3.68 -11.83 -10.36 -10.56 -13.53 -8.77 3.14 -0.20 -7.00 -6.12 0.54 -5.92
3 Assam -0.63 -1.31 -3.78 -2.14 -2.95 -3.92 0.62 1.10 1.06 1.77 -1.03 -3.68 -2.32
4 Bihar -3.48 -4.83 -6.85 -7.25 -6.21 -1.69 -4.66 -3.03 -1.43 -1.65 -2.97 -1.82 -1.66
5 Chattisgarh NA NA -3.69 -2.99 -5.68 -2.83 -0.83 0.06 0.43 -1.06 -1.77 0.35 -2.82
6 Goa -2.51 -4.40 -5.82 -4.68 -4.78 -4.80 -4.55 -3.18 -2.67 -3.60 -4.21 -2.07 -0.99
7 Gujarat -3.24 -5.24 -5.27 -4.26 -5.45 -4.60 -2.76 -2.15 -1.24 -2.60 -3.58 -2.52 -2.44
8 Haryana -2.77 -4.93 -4.18 -2.03 -3.54 -1.29 -0.27 0.91 -0.83 -3.59 -4.54 -2.75 -2.59
9 Himachal Pradesh -11.59 -14.19 -8.81 -12.39 -11.51 -7.85 -2.80 -3.22 -1.62 -5.32 -5.93 -3.35 -2.58
10 Jammu & Kashmir -4.24 -6.86 -8.18 -6.45 0.08 -4.15 -5.98 -7.26 -6.12 -6.40 -8.09 -4.30 -4.78
11 Jharkhand NA NA -3.89 -4.53 -3.91 -7.11 -8.96 -0.79 -2.31 -3.55 -3.13 -2.00 -3.24
12 Karnataka -2.07 -3.35 -5.21 -4.37 -3.44 -2.30 -2.01 -2.28 -1.97 -2.81 -3.15 -2.64 -2.68
13 Kerala -4.28 -5.04 -4.20 -5.74 -5.73 -4.04 -3.33 -2.64 -3.48 -3.13 -3.39 -2.79 -3.60
14 Madhya Pradesh -2.07 -4.20 -5.45 -5.80 -7.12 -6.08 -3.89 -2.11 -1.72 -2.26 -2.73 -2.03 -2.77
15 Maharashtra -3.42 -3.43 -3.99 -4.77 -5.26 -4.82 -4.02 -2.23 16 Manipur -8.20 -3.90 -10.10 -7.10 -7.19 -9.83 -5.35 -8.79
0.42 -1.85 -2.90 -1.83 -1.94
17 Meghalaya -4.51 -5.08 -4.93 -3.38 -3.83 -5.39 -2.78 -1.02 1.51 -2.93 -8.81 -6.18 -8.24
18 -14.35 -7.17 -21.69 -14.56 -13.16 -9.53 -14.59 -6.24 -2.20 -3.75 -1.71 -2.26 -1.28
19
Mizoram
-10.40 -6.38 -8.48 -11.08 3.26 -4.24 -5.57 -2.61 -10.26 -1.64 -3.64 -24.35 -10.25
20
Nagaland
-5.55 -9.02 -8.49 -5.66 -5.86 -1.91 -0.35 -1.08 -4.92 -3.83 -4.80 -8.24 -3.54
Orissa
-4.79 -6.63 -6.23 -5.36 -5.42 -4.18 -2.44 -3.62 1.02 -0.22 -1.38 -0.34 -2.66
21 Punjab
-3.90 -6.97 -6.26 -6.90 -6.61 -5.24 -4.00 -2.59 -3.02 -3.84 -3.08 -3.12 -3.39
22 Rajasthan -1.75 -3.02 -3.91 -1.27 -2.24
23 Sikkim -9.80 -16.92 -5.88 -0.77 -3.50 -11.61 -8.14 -4.75 -2.56 -7.25 -3.56 -5.60 -2.35
24 Tamil Nadu -1.96 -3.91 -3.18 -4.26 -3.19 -2.75 -0.96 -1.43 -1.05 -2.13 -2.49 -2.72 -2.13
25 Tripura -5.19 -2.81 -8.45 -7.98 -4.52 -2.89 -1.17 1.27 -2.49 -2.07 -7.44 -1.42 -2.24
26 Uttar Pradesh -5.05 -6.94 -5.47 -5.02 -7.33 -5.22 -3.64 -3.08 -3.60 -4.61 -3.77 -3.82 -2.80
27 Uttarakhand NA NA -3.09 -4.82 -6.88 -9.15 -7.17 -2.82 -3.80 -3.29 -4.19 -3.65 -3.00
West Bengal -4.07 -6.04 -7.51 -6.29 -6.80 -5.09 -4.19 -3.82 -3.81 -3.97 -6.15 -4.13 -2.83
All States
"-" Deficit, "+" Surplus
-5.20 -5.05 -5.33 -4.25 -3.15 -2.22 -1.67 -2.73 -3.35 -2.42 -2.49 Source: A Study of State Budgets: RBI; Note: (i) 1997-98 data are old data. (ii) 2002-03 to 2005-06 data have been changed due change in CSO GSDP data. (iii) 2006-07 onwwards data have been updated as in concerned State Budget 2010-11 & 2011-12; Fiscal Indicators of the States received alongwith BoE 2011-12 AP & GSDP from CSO (01.03.2012)
Databook for DCH; 5th December 2012 Page 126 of 266
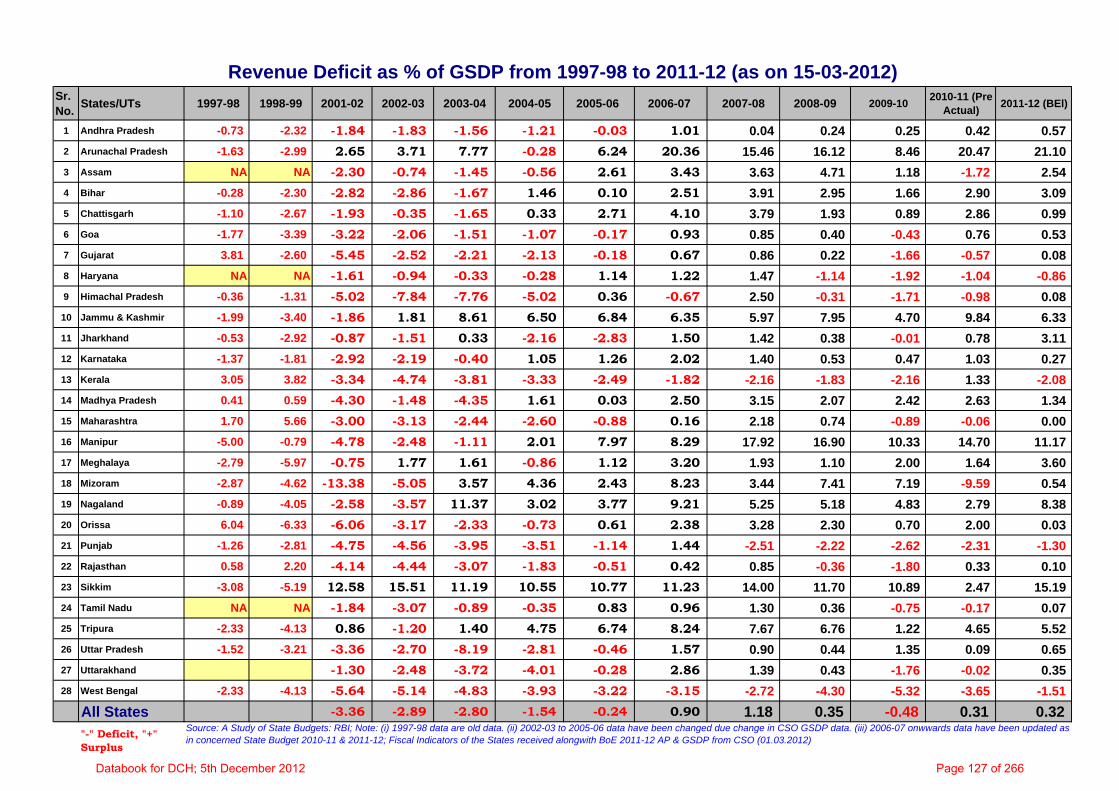
28
Surplus
Revenue Deficit as % of GSDP from 1997-98 to 2011-12 (as on 15-03-2012)Sr.
States/UTs 1997-98 1998-99 2001-02 2002-03 2003-04 2004-05 2005-06 2006-07 2007-08 2008-09 2009-102010-11 (Pre
2011-12 (BEl)No.
1 Andhra Pradesh -0.73 -2.32 -1.84 -1.83 -1.56 -1.21 -0.03 1.01Actual)
-1.63 -2.99 2.65 3.71 7.77 -0.28 6.24 20.360.04 0.24 0.25 0.42 0.57
2 Arunachal Pradesh
-2.30 -0.74 -1.45 -0.56 2.61 3.4315.46 16.12 8.46 20.47 21.10
3 Assam NA NA
-2.82 -2.86 -1.67 1.46 0.10 2.513.63 4.71 1.18 -1.72 2.54
4 Bihar -0.28 -2.30
-1.93 -0.35 -1.65 0.33 2.71 4.103.91 2.95 1.66 2.90 3.09
5 Chattisgarh -1.10 -2.67 3.79 1.93 0.89 2.86 0.99
6 Goa -1.77 -3.39 -3.22 -2.06 -1.51 -1.07 -0.17 0.93 0.85 0.40 -0.43 0.76 0.53
7 Gujarat 3.81 -2.60 -5.45 -2.52 -2.21 -2.13 -0.18 0.67 0.86 0.22 -1.66 -0.57 0.08
8 Haryana NA NA -1.61 -0.94 -0.33 -0.28 1.14 1.22 1.47 -1.14 -1.92 -1.04 -0.86
9 Himachal Pradesh -0.36 -1.31 -5.02 -7.84 -7.76 -5.02 0.36 -0.67 2.50 -0.31 -1.71 -0.98 0.08
10 Jammu & Kashmir -1.99 -3.40 -1.86 1.81 8.61 6.50 6.84 6.35 5.97 7.95 4.70 9.84 6.33
11 Jharkhand -0.53 -2.92 -0.87 -1.51 0.33 -2.16 -2.83 1.50 1.42 0.38 -0.01 0.78 3.11
12 Karnataka -1.37 -1.81 -2.92 -2.19 -0.40 1.05 1.26 2.02 1.40 0.53 0.47 1.03 0.27
13 Kerala 3.05 3.82 -3.34 -4.74 -3.81 -3.33 -2.49 -1.82 -2.16 -1.83 -2.16 1.33 -2.08
14 Madhya Pradesh 0.41 0.59 -4.30 -1.48 -4.35 1.61 0.03 2.50 3.15 2.07 2.42 2.63 1.34
15 Maharashtra 1.70 5.66 -3.00 -3.13 -2.44 -2.60 -0.88 0.16 2.18 0.74 -0.89 -0.06 0.00
16 Manipur -5.00 -0.79 -4.78 -2.48 -1.11 2.01 7.97 8.29 17.92 16.90 10.33 14.70 11.17
17 Meghalaya -2.79 -5.97 -0.75 1.77 1.61 -0.86 1.12 3.20 1.93 1.10 2.00 1.64 3.60
18 Mizoram -2.87 -4.62 -13.38 -5.05 3.57 4.36 2.43 8.23 3.44 7.41 7.19 -9.59 0.54
19 Nagaland -0.89 -4.05 -2.58 -3.57 11.37 3.02 3.77 9.21 5.25 5.18 4.83 2.79 8.38
20 Orissa 6.04 -6.33 -6.06 -3.17 -2.33 -0.73 0.61 2.38 3.28 2.30 0.70 2.00 0.03
21 Punjab -1.26 -2.81 -4.75 -4.56 -3.95 -3.51 -1.14 1.44 -2.51 -2.22 -2.62 -2.31 -1.30
22 Rajasthan 0.58 2.20 -4.14 -4.44 -3.07 -1.83 -0.51 0.42 0.85 -0.36 -1.80 0.33 0.10
23 Sikkim -3.08 -5.19 12.58 15.51 11.19 10.55 10.77 11.23 14.00 11.70 10.89 2.47 15.19
24 Tamil Nadu NA NA -1.84 -3.07 -0.89 -0.35 0.83 0.96 1.30 0.36 -0.75 -0.17 0.07
25 Tripura -2.33 -4.13 0.86 -1.20 1.40 4.75 6.74 8.24 7.67 6.76 1.22 4.65 5.52
26 Uttar Pradesh -1.52 -3.21 -3.36 -2.70 -8.19 -2.81 -0.46 1.57 0.90 0.44 1.35 0.09 0.65
27 Uttarakhand -1.30 -2.48 -3.72 -4.01 -0.28 2.86 1.39 0.43 -1.76 -0.02 0.35
West Bengal -2.33 -4.13 -5.64 -5.14 -4.83 -3.93 -3.22 -3.15 -2.72 -4.30 -5.32 -3.65 -1.51
All States
"-" Deficit, "+"
-3.36 -2.89 -2.80 -1.54 -0.24 0.90 1.18 0.35 -0.48 0.31 0.32Source: A Study of State Budgets: RBI; Note: (i) 1997-98 data are old data. (ii) 2002-03 to 2005-06 data have been changed due change in CSO GSDP data. (iii) 2006-07 onwwards data have been updated as in concerned State Budget 2010-11 & 2011-12; Fiscal Indicators of the States received alongwith BoE 2011-12 AP & GSDP from CSO (01.03.2012)
Databook for DCH; 5th December 2012 Page 127 of 266
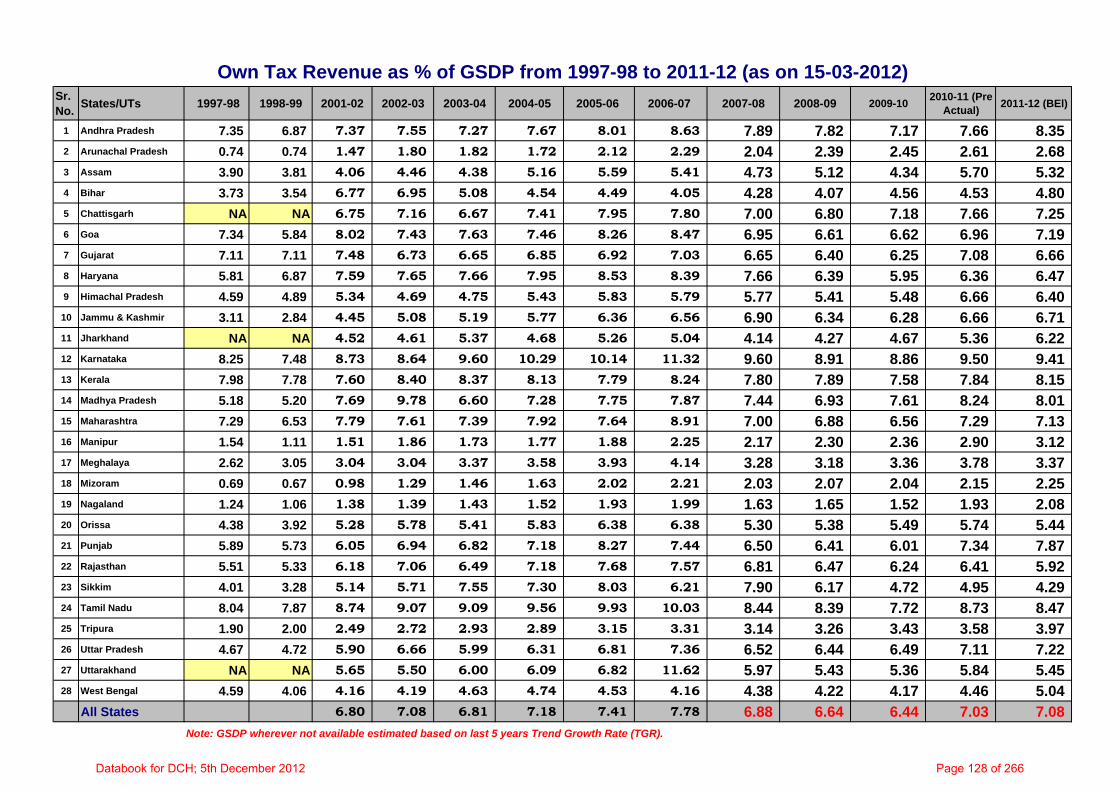
28
All States 7.08
Note: GSDP wherever not available estimated based on last 5 years Trend Growth Rate (TGR).
Own Tax Revenue as % of GSDP from 1997-98 to 2011-12 (as on 15-03-2012)Sr.
States/UTs 1997-98 1998-99 2001-02 2002-03 2003-04 2004-05 2005-06 2006-07 2007-08 2008-09 2009-102010-11 (Pre
2011-12 (BEl)No. Actual)
1 Andhra Pradesh 7.35 6.87 7.37 7.55 7.27 7.67 8.01 8.63 7.89 7.82 7.17 7.66 8.35
2 Arunachal Pradesh 0.74 0.74 1.47 1.80 1.82 1.72 2.12 2.29 2.04 2.39 2.45 2.61 2.68
3 Assam 3.90 3.81 4.06 4.46 4.38 5.16 5.59 5.41 4.73 5.12 4.34 5.70 5.32
4 Bihar 3.73 3.54 6.77 6.95 5.08 4.54 4.49 4.05 4.28 4.07 4.56 4.53 4.80
5 Chattisgarh NA NA 6.75 7.16 6.67 7.41 7.95 7.80 7.00 6.80 7.18 7.66 7.25
6 Goa 7.34 5.84 8.02 7.43 7.63 7.46 8.26 8.47 6.95 6.61 6.62 6.96 7.19
7 Gujarat 7.11 7.11 7.48 6.73 6.65 6.85 6.92 7.03 6.65 6.40 6.25 7.08 6.66
8 Haryana 5.81 6.87 7.59 7.65 7.66 7.95 8.53 8.39 7.66 6.39 5.95 6.36 6.47
9 Himachal Pradesh 4.59 4.89 5.34 4.69 4.75 5.43 5.83 5.79 5.77 5.41 5.48 6.66 6.40
10 Jammu & Kashmir 3.11 2.84 4.45 5.08 5.19 5.77 6.36 6.56 6.90 6.34 6.28 6.66 6.71
11 Jharkhand NA NA 4.52 4.61 5.37 4.68 5.26 5.04 4.14 4.27 4.67 5.36 6.22
12 Karnataka 8.25 7.48 8.73 8.64 9.60 10.29 10.14 11.32 9.60 8.91 8.86 9.50 9.41
13 Kerala 7.98 7.78 7.60 8.40 8.37 8.13 7.79 8.24 7.80 7.89 7.58 7.84 8.15
14 Madhya Pradesh 5.18 5.20 7.69 9.78 6.60 7.28 7.75 7.87 7.44 6.93 7.61 8.24 8.01
15 Maharashtra 7.29 6.53 7.79 7.61 7.39 7.92 7.64 8.91 7.00 6.88 6.56 7.29 7.13
16 Manipur 1.54 1.11 1.51 1.86 1.73 1.77 1.88 2.25 2.17 2.30 2.36 2.90 3.12
17 Meghalaya 2.62 3.05 3.04 3.04 3.37 3.58 3.93 4.14 3.28 3.18 3.36 3.78 3.37
18 Mizoram 0.69 0.67 0.98 1.29 1.46 1.63 2.02 2.21 2.03 2.07 2.04 2.15 2.25
19 Nagaland 1.24 1.06 1.38 1.39 1.43 1.52 1.93 1.99 1.63 1.65 1.52 1.93 2.08
20 Orissa 4.38 3.92 5.28 5.78 5.41 5.83 6.38 6.38 5.30 5.38 5.49 5.74 5.44
21 Punjab 5.89 5.73 6.05 6.94 6.82 7.18 8.27 7.44 6.50 6.41 6.01 7.34 7.87
22 Rajasthan 5.51 5.33 6.18 7.06 6.49 7.18 7.68 7.57 6.81 6.47 6.24 6.41 5.92
23 Sikkim 4.01 3.28 5.14 5.71 7.55 7.30 8.03 6.21 7.90 6.17 4.72 4.95 4.29
24 Tamil Nadu 8.04 7.87 8.74 9.07 9.09 9.56 9.93 10.03 8.44 8.39 7.72 8.73 8.47
25 Tripura 1.90 2.00 2.49 2.72 2.93 2.89 3.15 3.31 3.14 3.26 3.43 3.58 3.97
26 Uttar Pradesh 4.67 4.72 5.90 6.66 5.99 6.31 6.81 7.36 6.52 6.44 6.49 7.11 7.22
27 Uttarakhand NA NA 5.65 5.50 6.00 6.09 6.82 11.62 5.97 5.43 5.36 5.84 5.45
West Bengal 4.59 4.06 4.16 4.19 4.63 4.74 4.53 4.16 4.38 4.22 4.17 4.46 5.04
6.80 7.08 6.81 7.18 7.41 7.78 6.88 6.64 6.44 7.03
Databook for DCH; 5th December 2012 Page 128 of 266
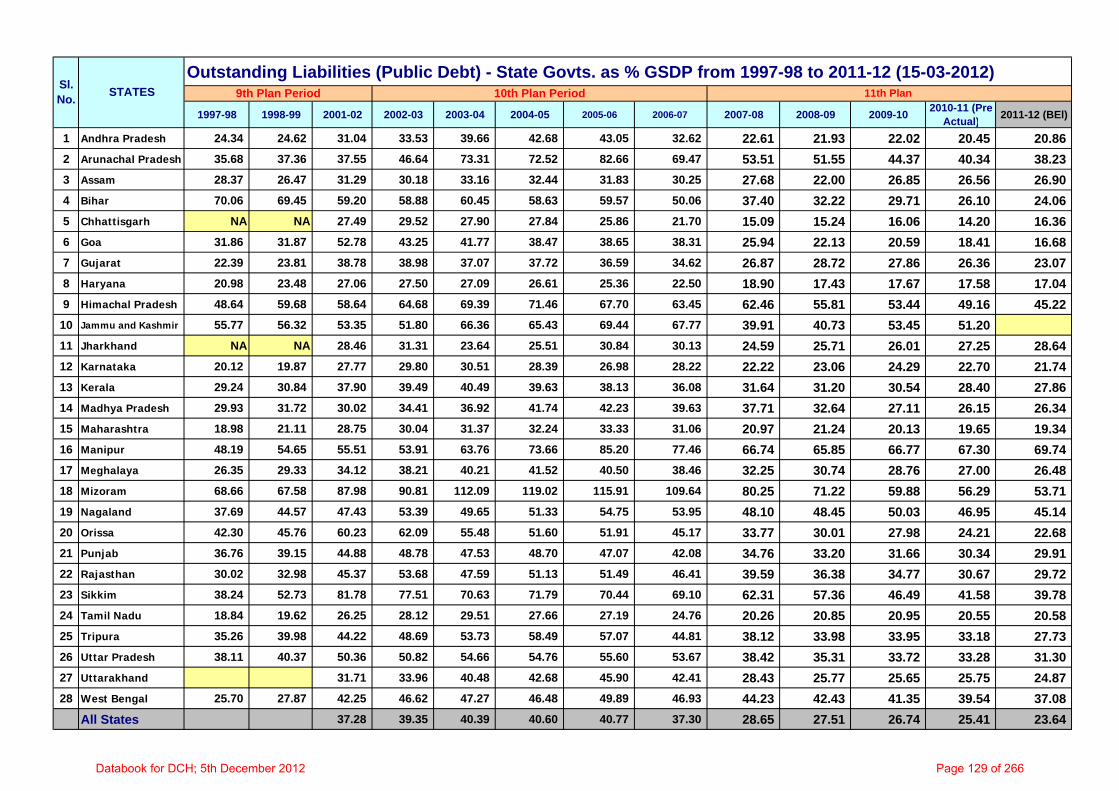
28
All States
Sl.
No.STATES
Outstanding Liabilities (Public Debt) - State Govts. as % GSDP from 1997-98 to 2011-12 (15-03-2012)9th Plan Period 10th Plan Period 11th Plan
2010-11 (Pre 1997-98 1998-99 2001-02 2002-03 2003-04 2004-05 2005-06 2006-07 2007-08 2008-09 2009-10
Actual)2011-12 (BEl)
1 Andhra Pradesh 24.34 24.62 31.04 33.53 39.66 42.68 43.05 32.62 22.61 21.93 22.02 20.45 20.86
2 Arunachal Pradesh 35.68 37.36 37.55 46.64 73.31 72.52 82.66 69.47 53.51 51.55 44.37 40.34 38.23
3 Assam 28.37 26.47 31.29 30.18 33.16 32.44 31.83 30.25 27.68 22.00 26.85 26.56 26.90
4 Bihar 70.06 69.45 59.20 58.88 60.45 58.63 59.57 50.06 37.40 32.22 29.71 26.10 24.06
5 Chhattisgarh NA NA 27.49 29.52 27.90 27.84 25.86 21.70 15.09 15.24 16.06 14.20 16.36
6 Goa 31.86 31.87 52.78 43.25 41.77 38.47 38.65 38.31 25.94 22.13 20.59 18.41 16.68
7 Gujarat 22.39 23.81 38.78 38.98 37.07 37.72 36.59 34.62 26.87 28.72 27.86 26.36 23.07
8 Haryana 20.98 23.48 27.06 27.50 27.09 26.61 25.36 22.50 18.90 17.43 17.67 17.58 17.04
9 Himachal Pradesh 48.64 59.68 58.64 64.68 69.39 71.46 67.70 63.45 62.46 55.81 53.44 49.16 45.22
10 Jammu and Kashmir 55.77 56.32 53.35 51.80 66.36 65.43 69.44 67.77 39.91 40.73 53.45 51.20
11 Jharkhand NA NA 28.46 31.31 23.64 25.51 30.84 30.13 24.59 25.71 26.01 27.25 28.64
12 Karnataka 20.12 19.87 27.77 29.80 30.51 28.39 26.98 28.22 22.22 23.06 24.29 22.70 21.74
13 Kerala 29.24 30.84 37.90 39.49 40.49 39.63 38.13 36.08 31.64 31.20 30.54 28.40 27.86
14 Madhya Pradesh 29.93 31.72 30.02 34.41 36.92 41.74 42.23 39.63 37.71 32.64 27.11 26.15 26.34
15 Maharashtra 18.98 21.11 28.75 30.04 31.37 32.24 33.33 31.06 20.97 21.24 20.13 19.65 19.34
16 Manipur 48.19 54.65 55.51 53.91 63.76 73.66 85.20 77.46 66.74 65.85 66.77 67.30 69.74
17 Meghalaya 26.35 29.33 34.12 38.21 40.21 41.52 40.50 38.46 32.25 30.74 28.76 27.00 26.48
18 Mizoram 68.66 67.58 87.98 90.81 112.09 119.02 115.91 109.64 80.25 71.22 59.88 56.29 53.71
19 Nagaland 37.69 44.57 47.43 53.39 49.65 51.33 54.75 53.95 48.10 48.45 50.03 46.95 45.14
20 Orissa 42.30 45.76 60.23 62.09 55.48 51.60 51.91 45.17 33.77 30.01 27.98 24.21 22.68
21 Punjab 36.76 39.15 44.88 48.78 47.53 48.70 47.07 42.08 34.76 33.20 31.66 30.34 29.91
22 Rajasthan 30.02 32.98 45.37 53.68 47.59 51.13 51.49 46.41 39.59 36.38 34.77 30.67 29.72
23 Sikkim 38.24 52.73 81.78 77.51 70.63 71.79 70.44 69.10 62.31 57.36 46.49 41.58 39.78
24 Tamil Nadu 18.84 19.62 26.25 28.12 29.51 27.66 27.19 24.76 20.26 20.85 20.95 20.55 20.58
25 Tripura 35.26 39.98 44.22 48.69 53.73 58.49 57.07 44.81 38.12 33.98 33.95 33.18 27.73
26 Uttar Pradesh 38.11 40.37 50.36 50.82 54.66 54.76 55.60 53.67 38.42 35.31 33.72 33.28 31.30
27 Uttarakhand 31.71 33.96 40.48 42.68 45.90 42.41 28.43 25.77 25.65 25.75 24.87
West Bengal 25.70 27.87 42.25 46.62 47.27 46.48 49.89 46.93 44.23 42.43 41.35 39.54 37.08
37.28 39.35 40.39 40.60 40.77 37.30 28.65 27.51 26.74 25.41 23.64
Databook for DCH; 5th December 2012 Page 129 of 266
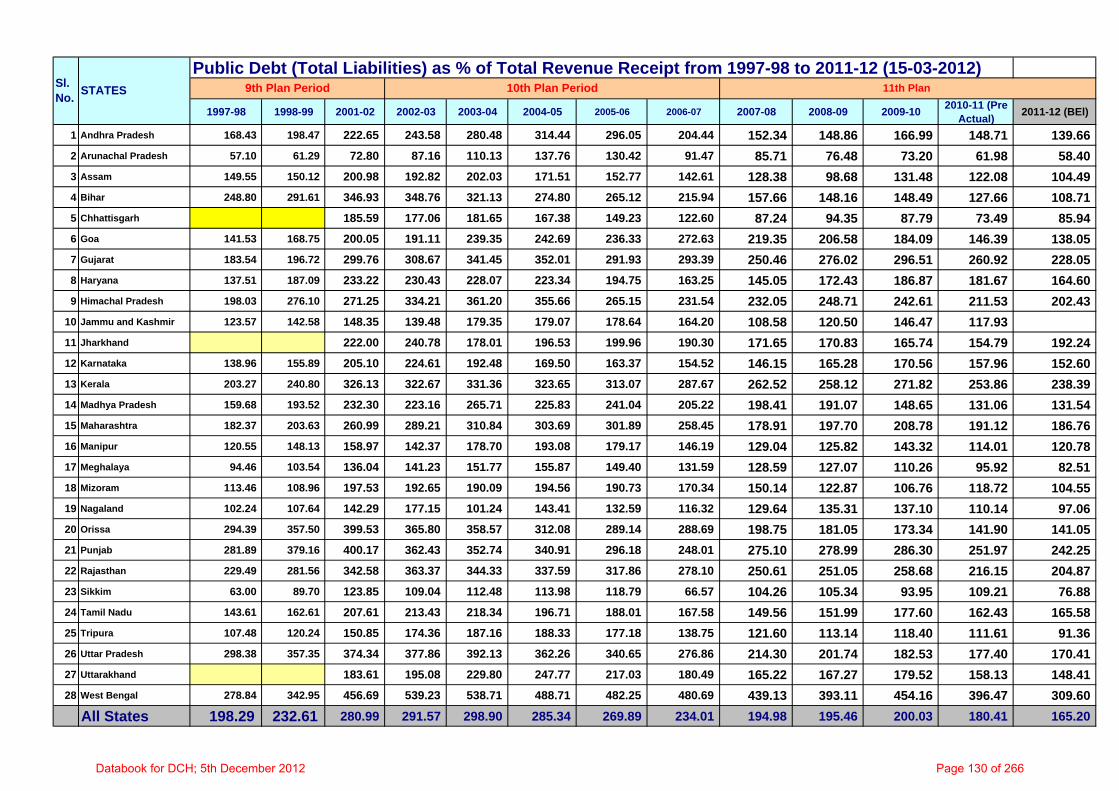
28
All States
Sl.
No.STATES
Public Debt (Total Liabilities) as % of Total Revenue Receipt from 1997-98 to 2011-12 (15-03-2012)9th Plan Period 10th Plan Period 11th Plan
2010-11 (Pre 1997-98 1998-99 2001-02 2002-03 2003-04 2004-05 2005-06 2006-07 2007-08 2008-09 2009-10
Actual)2011-12 (BEl)
1 Andhra Pradesh 168.43 198.47 222.65 243.58 280.48 314.44 296.05 204.44 152.34 148.86 166.99 148.71 139.66
2 Arunachal Pradesh 57.10 61.29 72.80 87.16 110.13 137.76 130.42 91.47 85.71 76.48 73.20 61.98 58.40
3 Assam 149.55 150.12 200.98 192.82 202.03 171.51 152.77 142.61 128.38 98.68 131.48 122.08 104.49
4 Bihar 248.80 291.61 346.93 348.76 321.13 274.80 265.12 215.94 157.66 148.16 148.49 127.66 108.71
5 Chhattisgarh 185.59 177.06 181.65 167.38 149.23 122.60 87.24 94.35 87.79 73.49 85.94
6 Goa 141.53 168.75 200.05 191.11 239.35 242.69 236.33 272.63 219.35 206.58 184.09 146.39 138.05
7 Gujarat 183.54 196.72 299.76 308.67 341.45 352.01 291.93 293.39 250.46 276.02 296.51 260.92 228.05
8 Haryana 137.51 187.09 233.22 230.43 228.07 223.34 194.75 163.25 145.05 172.43 186.87 181.67 164.60
9 Himachal Pradesh 198.03 276.10 271.25 334.21 361.20 355.66 265.15 231.54 232.05 248.71 242.61 211.53 202.43
10 Jammu and Kashmir 123.57 142.58 148.35 139.48 179.35 179.07 178.64 164.20 108.58 120.50 146.47 117.93
11 Jharkhand 222.00 240.78 178.01 196.53 199.96 190.30 171.65 170.83 165.74 154.79 192.24
12 Karnataka 138.96 155.89 205.10 224.61 192.48 169.50 163.37 154.52 146.15 165.28 170.56 157.96 152.60
13 Kerala 203.27 240.80 326.13 322.67 331.36 323.65 313.07 287.67 262.52 258.12 271.82 253.86 238.39
14 Madhya Pradesh 159.68 193.52 232.30 223.16 265.71 225.83 241.04 205.22 198.41 191.07 148.65 131.06 131.54
15 Maharashtra 182.37 203.63 260.99 289.21 310.84 303.69 301.89 258.45 178.91 197.70 208.78 191.12 186.76
16 Manipur 120.55 148.13 158.97 142.37 178.70 193.08 179.17 146.19 129.04 125.82 143.32 114.01 120.78
17 Meghalaya 94.46 103.54 136.04 141.23 151.77 155.87 149.40 131.59 128.59 127.07 110.26 95.92 82.51
18 Mizoram 113.46 108.96 197.53 192.65 190.09 194.56 190.73 170.34 150.14 122.87 106.76 118.72 104.55
19 Nagaland 102.24 107.64 142.29 177.15 101.24 143.41 132.59 116.32 129.64 135.31 137.10 110.14 97.06
20 Orissa 294.39 357.50 399.53 365.80 358.57 312.08 289.14 288.69 198.75 181.05 173.34 141.90 141.05
21 Punjab 281.89 379.16 400.17 362.43 352.74 340.91 296.18 248.01 275.10 278.99 286.30 251.97 242.25
22 Rajasthan 229.49 281.56 342.58 363.37 344.33 337.59 317.86 278.10 250.61 251.05 258.68 216.15 204.87
23 Sikkim 63.00 89.70 123.85 109.04 112.48 113.98 118.79 66.57 104.26 105.34 93.95 109.21 76.88
24 Tamil Nadu 143.61 162.61 207.61 213.43 218.34 196.71 188.01 167.58 149.56 151.99 177.60 162.43 165.58
25 Tripura 107.48 120.24 150.85 174.36 187.16 188.33 177.18 138.75 121.60 113.14 118.40 111.61 91.36
26 Uttar Pradesh 298.38 357.35 374.34 377.86 392.13 362.26 340.65 276.86 214.30 201.74 182.53 177.40 170.41
27 Uttarakhand 183.61 195.08 229.80 247.77 217.03 180.49 165.22 167.27 179.52 158.13 148.41
West Bengal 278.84 342.95 456.69 539.23 538.71 488.71 482.25 480.69 439.13 393.11 454.16 396.47 309.60
198.29 232.61 280.99 291.57 298.90 285.34 269.89 234.01 194.98 195.46 200.03 180.41 165.20
Databook for DCH; 5th December 2012 Page 130 of 266
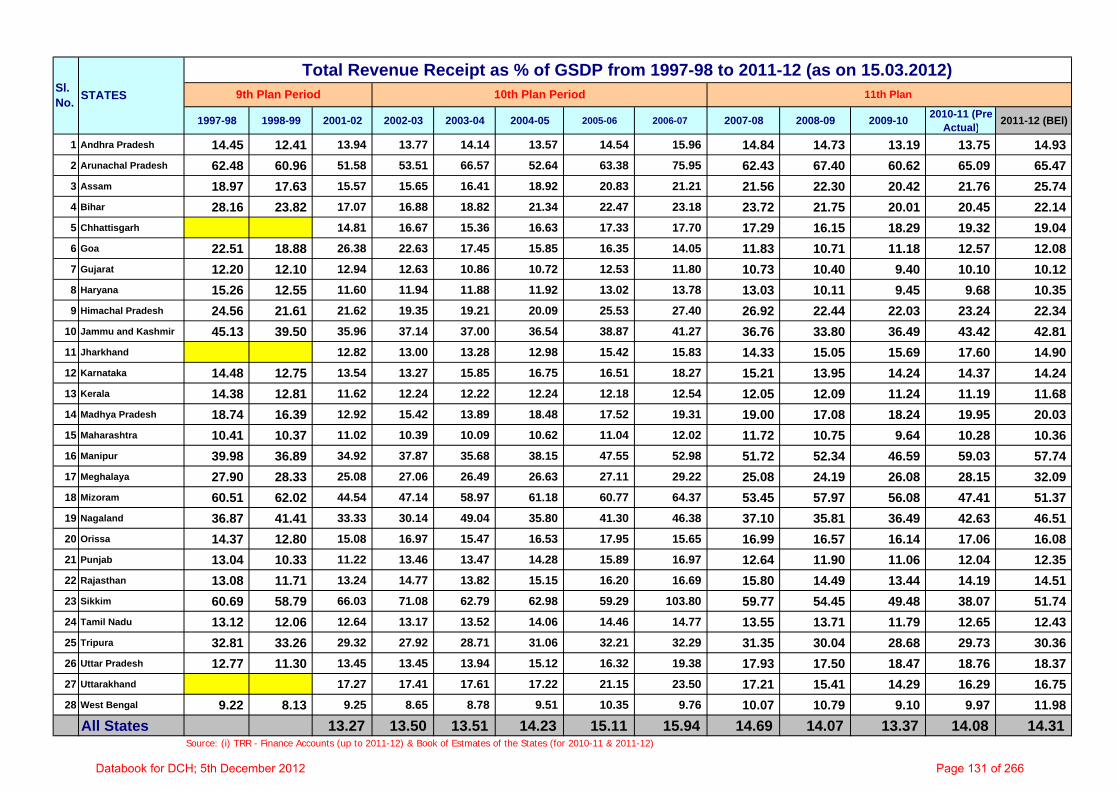
28
All States 14.07 13.37 14.08 14.31Source: (i) TRR - Finance Accounts (up to 2011-12) & Book of Estmates of the States (for 2010-11 & 2011-12)
Sl.
No.STATES
Total Revenue Receipt as % of GSDP from 1997-98 to 2011-12 (as on 15.03.2012)
9th Plan Period 10th Plan Period 11th Plan
2010-11 (Pre 1997-98 1998-99 2001-02 2002-03 2003-04 2004-05 2005-06 2006-07 2007-08 2008-09 2009-10
Actual)2011-12 (BEl)
1 Andhra Pradesh 14.45 12.41 13.94 13.77 14.14 13.57 14.54 15.96 14.84 14.73 13.19 13.75 14.93
2 Arunachal Pradesh 62.48 60.96 51.58 53.51 66.57 52.64 63.38 75.95 62.43 67.40 60.62 65.09 65.47
3 Assam 18.97 17.63 15.57 15.65 16.41 18.92 20.83 21.21 21.56 22.30 20.42 21.76 25.74
4 Bihar 28.16 23.82 17.07 16.88 18.82 21.34 22.47 23.18 23.72 21.75 20.01 20.45 22.14
5 Chhattisgarh 14.81 16.67 15.36 16.63 17.33 17.70 17.29 16.15 18.29 19.32 19.04
6 Goa 22.51 18.88 26.38 22.63 17.45 15.85 16.35 14.05 11.83 10.71 11.18 12.57 12.08
7 Gujarat 12.20 12.10 12.94 12.63 10.86 10.72 12.53 11.80 10.73 10.40 9.40 10.10 10.12
8 Haryana 15.26 12.55 11.60 11.94 11.88 11.92 13.02 13.78 13.03 10.11 9.45 9.68 10.35
9 Himachal Pradesh 24.56 21.61 21.62 19.35 19.21 20.09 25.53 27.40 26.92 22.44 22.03 23.24 22.34
10 Jammu and Kashmir 45.13 39.50 35.96 37.14 37.00 36.54 38.87 41.27 36.76 33.80 36.49 43.42 42.81
11 Jharkhand 12.82 13.00 13.28 12.98 15.42 15.83 14.33 15.05 15.69 17.60 14.90
12 Karnataka 14.48 12.75 13.54 13.27 15.85 16.75 16.51 18.27 15.21 13.95 14.24 14.37 14.24
13 Kerala 14.38 12.81 11.62 12.24 12.22 12.24 12.18 12.54 12.05 12.09 11.24 11.19 11.68
14 Madhya Pradesh 18.74 16.39 12.92 15.42 13.89 18.48 17.52 19.31 19.00 17.08 18.24 19.95 20.03
15 Maharashtra 10.41 10.37 11.02 10.39 10.09 10.62 11.04 12.02 11.72 10.75 9.64 10.28 10.36
16 Manipur 39.98 36.89 34.92 37.87 35.68 38.15 47.55 52.98 51.72 52.34 46.59 59.03 57.74
17 Meghalaya 27.90 28.33 25.08 27.06 26.49 26.63 27.11 29.22 25.08 24.19 26.08 28.15 32.09
18 Mizoram 60.51 62.02 44.54 47.14 58.97 61.18 60.77 64.37 53.45 57.97 56.08 47.41 51.37
19 Nagaland 36.87 41.41 33.33 30.14 49.04 35.80 41.30 46.38 37.10 35.81 36.49 42.63 46.51
20 Orissa 14.37 12.80 15.08 16.97 15.47 16.53 17.95 15.65 16.99 16.57 16.14 17.06 16.08
21 Punjab 13.04 10.33 11.22 13.46 13.47 14.28 15.89 16.97 12.64 11.90 11.06 12.04 12.35
22 Rajasthan 13.08 11.71 13.24 14.77 13.82 15.15 16.20 16.69 15.80 14.49 13.44 14.19 14.51
23 Sikkim 60.69 58.79 66.03 71.08 62.79 62.98 59.29 103.80 59.77 54.45 49.48 38.07 51.74
24 Tamil Nadu 13.12 12.06 12.64 13.17 13.52 14.06 14.46 14.77 13.55 13.71 11.79 12.65 12.43
25 Tripura 32.81 33.26 29.32 27.92 28.71 31.06 32.21 32.29 31.35 30.04 28.68 29.73 30.36
26 Uttar Pradesh 12.77 11.30 13.45 13.45 13.94 15.12 16.32 19.38 17.93 17.50 18.47 18.76 18.37
27 Uttarakhand 17.27 17.41 17.61 17.22 21.15 23.50 17.21 15.41 14.29 16.29 16.75
West Bengal 9.22 8.13 9.25 8.65 8.78 9.51 10.35 9.76 10.07 10.79 9.10 9.97 11.98
13.27 13.50 13.51 14.23 15.11 15.94 14.69
Databook for DCH; 5th December 2012 Page 131 of 266
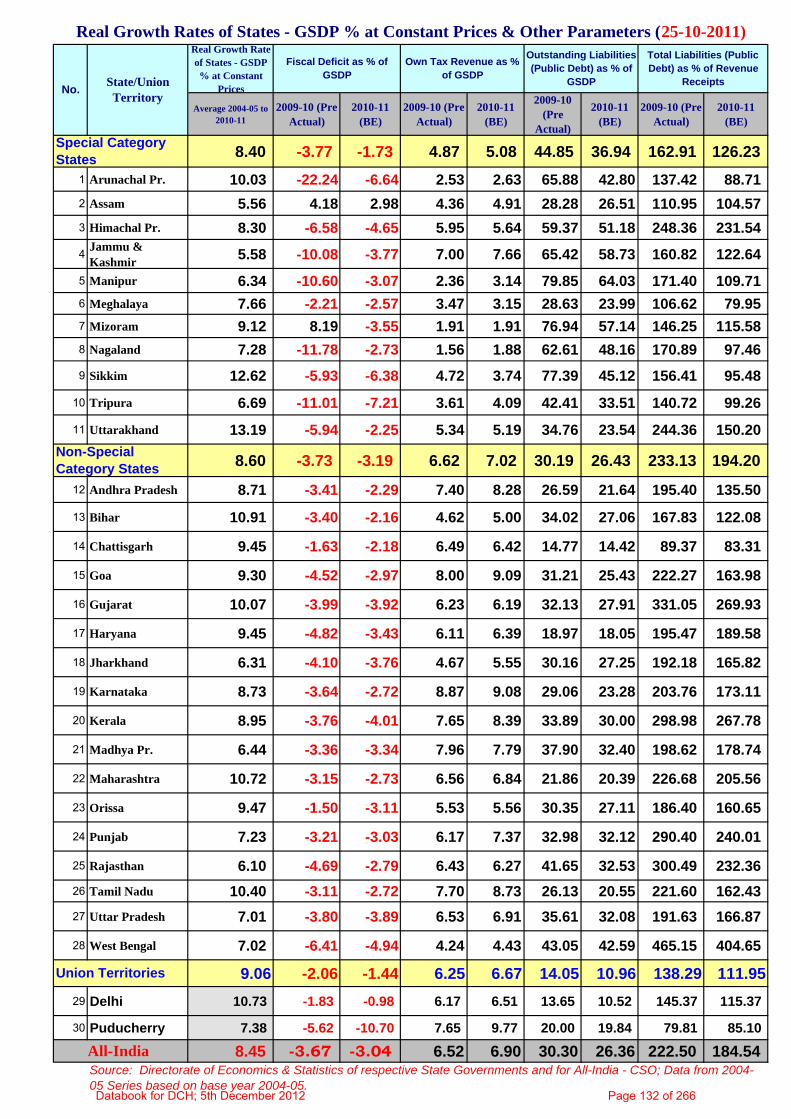
Real Growth Rates of States - GSDP % at Constant Prices & Other Parameters (25-10-2011)
No.State/Union Territory
Real Growth Rate of States - GSDP % at Constant
Prices
Fiscal Deficit as % of
GSDP
Own Tax Revenue as %
of GSDP
Outstanding Liabilities
(Public Debt) as % of
GSDP
Total Liabilities (Public
Debt) as % of Revenue
Receipts
Average 2004-05 to 2010-11
2009-10 (Pre Actual)
2010-11 (BE)
2009-10 (Pre Actual)
2010-11 (BE)
2009-10 (Pre
Actual)
2010-11 (BE)
2009-10 (Pre Actual)
2010-11 (BE)
Special Category
States8.40 -3.77 -1.73 4.87 5.08 44.85 36.94 162.91 126.23
1 Arunachal Pr. 10.03 -22.24 -6.64 2.53 2.63 65.88 42.80 137.42 88.71
2 Assam 5.56 4.18 2.98 4.36 4.91 28.28 26.51 110.95 104.57
3 Himachal Pr. 8.30 -6.58 -4.65 5.95 5.64 59.37 51.18 248.36 231.54
4 Jammu & Kashmir 5.58 -10.08 -3.77 7.00 7.66 65.42 58.73 160.82 122.64
5 Manipur 6.34 -10.60 -3.07 2.36 3.14 79.85 64.03 171.40 109.71
6 Meghalaya 7.66 -2.21 -2.57 3.47 3.15 28.63 23.99 106.62 79.95
7 Mizoram 9.12 8.19 -3.55 1.91 1.91 76.94 57.14 146.25 115.58
8 Nagaland 7.28 -11.78 -2.73 1.56 1.88 62.61 48.16 170.89 97.46
9 Sikkim 12.62 -5.93 -6.38 4.72 3.74 77.39 45.12 156.41 95.48
10 Tripura 6.69 -11.01 -7.21 3.61 4.09 42.41 33.51 140.72 99.26
11 Uttarakhand 13.19 -5.94 -2.25 5.34 5.19 34.76 23.54 244.36 150.20
Non-Special
Category States8.60 -3.73 -3.19 6.62 7.02 30.19 26.43 233.13 194.20
12 Andhra Pradesh 8.71 -3.41 -2.29 7.40 8.28 26.59 21.64 195.40 135.50
13 Bihar 10.91 -3.40 -2.16 4.62 5.00 34.02 27.06 167.83 122.08
14 Chattisgarh 9.45 -1.63 -2.18 6.49 6.42 14.77 14.42 89.37 83.31
15 Goa 9.30 -4.52 -2.97 8.00 9.09 31.21 25.43 222.27 163.98
16 Gujarat 10.07 -3.99 -3.92 6.23 6.19 32.13 27.91 331.05 269.93
17 Haryana 9.45 -4.82 -3.43 6.11 6.39 18.97 18.05 195.47 189.58
18 Jharkhand 6.31 -4.10 -3.76 4.67 5.55 30.16 27.25 192.18 165.82
19 Karnataka 8.73 -3.64 -2.72 8.87 9.08 29.06 23.28 203.76 173.11
20 Kerala 8.95 -3.76 -4.01 7.65 8.39 33.89 30.00 298.98 267.78
21 Madhya Pr. 6.44 -3.36 -3.34 7.96 7.79 37.90 32.40 198.62 178.74
22 Maharashtra 10.72 -3.15 -2.73 6.56 6.84 21.86 20.39 226.68 205.56
23 Orissa 9.47 -1.50 -3.11 5.53 5.56 30.35 27.11 186.40 160.65
24 Punjab 7.23 -3.21 -3.03 6.17 7.37 32.98 32.12 290.40 240.01
25 Rajasthan 6.10 -4.69 -2.79 6.43 6.27 41.65 32.53 300.49 232.36
26 Tamil Nadu 10.40 -3.11 -2.72 7.70 8.73 26.13 20.55 221.60 162.43
27 Uttar Pradesh 7.01 -3.80 -3.89 6.53 6.91 35.61 32.08 191.63 166.87
28 West Bengal 7.02 -6.41 -4.94 4.24 4.43 43.05 42.59 465.15 404.65
Union Territories 9.06 -2.06 -1.44 6.25 6.67 14.05 10.96 138.29 111.95
29 Delhi 10.73 -1.83 -0.98 6.17 6.51 13.65 10.52 145.37 115.37
30 Puducherry 7.38 -5.62 -10.70 7.65 9.77 20.00 19.84 79.81 85.10
All-India 8.45 -3.67 -3.04 6.52 6.90 30.30 26.36 222.50 184.54Source: Directorate of Economics & Statistics of respective State Governments and for All-India - CSO; Data from 2004-05 Series based on base year 2004-05. Databook for DCH; 5th December 2012 Page 132 of 266
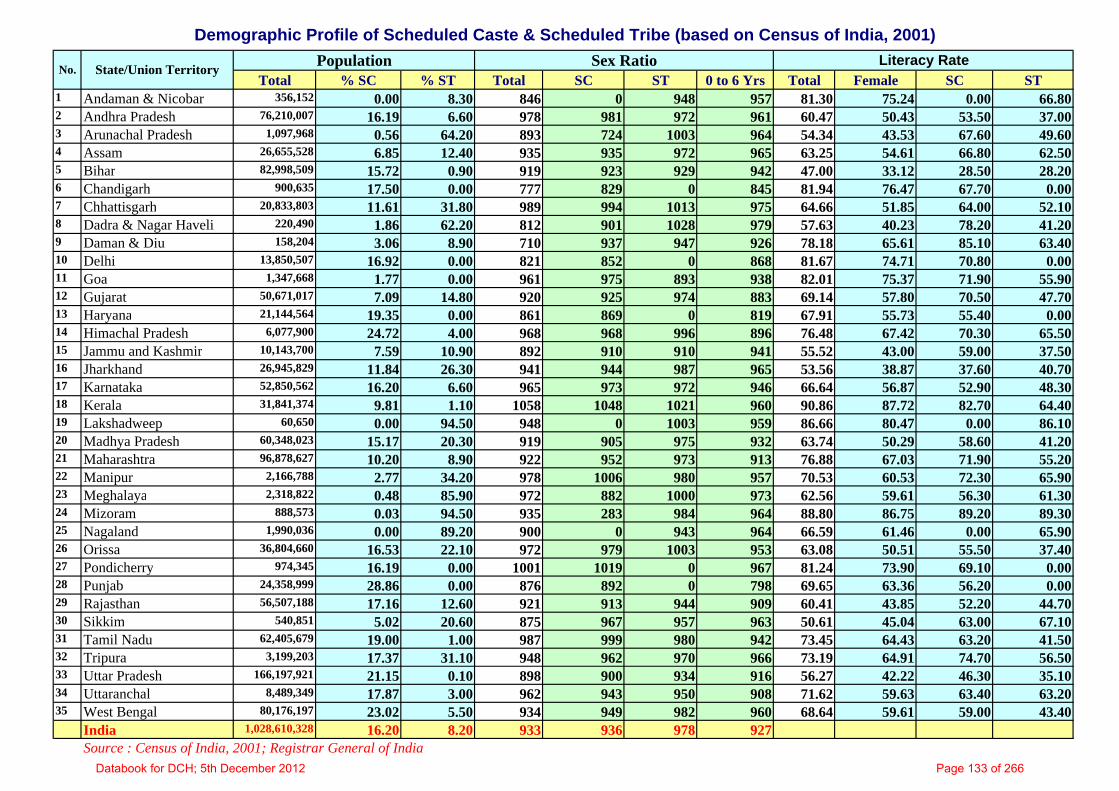
Demographic Profile of Scheduled Caste & Scheduled Tribe (based on Census of India, 2001)
No. State/Union Territory Population Sex Ratio Literacy Rate
Total % SC % ST Total SC ST 0 to 6 Yrs Total Female SC ST1 Andaman & Nicobar 356,152 0.00 8.30 846 0 948 957 81.30 75.24 0.00 66.802 Andhra Pradesh 76,210,007 16.19 6.60 978 981 972 961 60.47 50.43 53.50 37.003 Arunachal Pradesh 1,097,968 0.56 64.20 893 724 1003 964 54.34 43.53 67.60 49.604 Assam 26,655,528 6.85 12.40 935 935 972 965 63.25 54.61 66.80 62.505 Bihar 82,998,509 15.72 0.90 919 923 929 942 47.00 33.12 28.50 28.206 Chandigarh 900,635 17.50 0.00 777 829 0 845 81.94 76.47 67.70 0.007 Chhattisgarh 20,833,803 11.61 31.80 989 994 1013 975 64.66 51.85 64.00 52.108 Dadra & Nagar Haveli 220,490 1.86 62.20 812 901 1028 979 57.63 40.23 78.20 41.209 Daman & Diu 158,204 3.06 8.90 710 937 947 926 78.18 65.61 85.10 63.4010 Delhi 13,850,507 16.92 0.00 821 852 0 868 81.67 74.71 70.80 0.0011 Goa 1,347,668 1.77 0.00 961 975 893 938 82.01 75.37 71.90 55.9012 Gujarat 50,671,017 7.09 14.80 920 925 974 883 69.14 57.80 70.50 47.7013 Haryana 21,144,564 19.35 0.00 861 869 0 819 67.91 55.73 55.40 0.0014 Himachal Pradesh 6,077,900 24.72 4.00 968 968 996 896 76.48 67.42 70.30 65.5015 Jammu and Kashmir 10,143,700 7.59 10.90 892 910 910 941 55.52 43.00 59.00 37.5016 Jharkhand 26,945,829 11.84 26.30 941 944 987 965 53.56 38.87 37.60 40.7017 Karnataka 52,850,562 16.20 6.60 965 973 972 946 66.64 56.87 52.90 48.3018 Kerala 31,841,374 9.81 1.10 1058 1048 1021 960 90.86 87.72 82.70 64.4019 Lakshadweep 60,650 0.00 94.50 948 0 1003 959 86.66 80.47 0.00 86.1020 Madhya Pradesh 60,348,023 15.17 20.30 919 905 975 932 63.74 50.29 58.60 41.2021 Maharashtra 96,878,627 10.20 8.90 922 952 973 913 76.88 67.03 71.90 55.2022 Manipur 2,166,788 2.77 34.20 978 1006 980 957 70.53 60.53 72.30 65.9023 Meghalaya 2,318,822 0.48 85.90 972 882 1000 973 62.56 59.61 56.30 61.3024 Mizoram 888,573 0.03 94.50 935 283 984 964 88.80 86.75 89.20 89.3025 Nagaland 1,990,036 0.00 89.20 900 0 943 964 66.59 61.46 0.00 65.9026 Orissa 36,804,660 16.53 22.10 972 979 1003 953 63.08 50.51 55.50 37.4027 Pondicherry 974,345 16.19 0.00 1001 1019 0 967 81.24 73.90 69.10 0.0028 Punjab 24,358,999 28.86 0.00 876 892 0 798 69.65 63.36 56.20 0.0029 Rajasthan 56,507,188 17.16 12.60 921 913 944 909 60.41 43.85 52.20 44.7030 Sikkim 540,851 5.02 20.60 875 967 957 963 50.61 45.04 63.00 67.1031 Tamil Nadu 62,405,679 19.00 1.00 987 999 980 942 73.45 64.43 63.20 41.5032 Tripura 3,199,203 17.37 31.10 948 962 970 966 73.19 64.91 74.70 56.5033 Uttar Pradesh 166,197,921 21.15 0.10 898 900 934 916 56.27 42.22 46.30 35.1034 Uttaranchal 8,489,349 17.87 3.00 962 943 950 908 71.62 59.63 63.40 63.2035 West Bengal 80,176,197 23.02 5.50 934 949 982 960 68.64 59.61 59.00 43.40
India 1,028,610,328 16.20 8.20 933 936 978 927Source : Census of India, 2001; Registrar General of India
Databook for DCH; 5th December 2012 Page 133 of 266
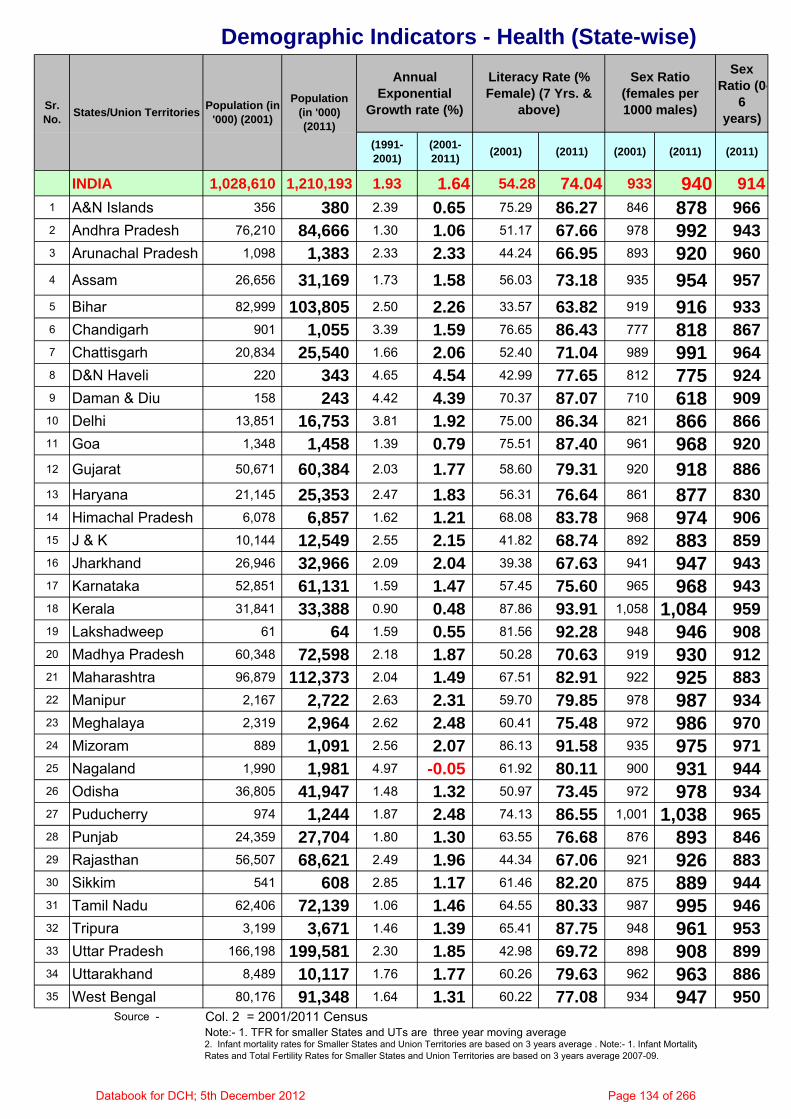
Sex
Ratio (0-
6
years)
(1991-
2001)
(2001-
2011)(2001) (2011) (2001) (2011) (2011)
INDIA 1,028,610 1,210,193 1.93 1.64 54.28 74.04 933 940 914
1 A&N Islands 356 380 2.39 0.65 75.29 86.27 846 878 966
2 Andhra Pradesh 76,210 84,666 1.30 1.06 51.17 67.66 978 992 943
3 Arunachal Pradesh 1,098 1,383 2.33 2.33 44.24 66.95 893 920 960
4 Assam 26,656 31,169 1.73 1.58 56.03 73.18 935 954 957
5 Bihar 82,999 103,805 2.50 2.26 33.57 63.82 919 916 933
6 Chandigarh 901 1,055 3.39 1.59 76.65 86.43 777 818 867
7 Chattisgarh 20,834 25,540 1.66 2.06 52.40 71.04 989 991 964
8 D&N Haveli 220 343 4.65 4.54 42.99 77.65 812 775 924
9 Daman & Diu 158 243 4.42 4.39 70.37 87.07 710 618 909
10 Delhi 13,851 16,753 3.81 1.92 75.00 86.34 821 866 866
11 Goa 1,348 1,458 1.39 0.79 75.51 87.40 961 968 920
12 Gujarat 50,671 60,384 2.03 1.77 58.60 79.31 920 918 886
13 Haryana 21,145 25,353 2.47 1.83 56.31 76.64 861 877 830
14 Himachal Pradesh 6,078 6,857 1.62 1.21 68.08 83.78 968 974 906
15 J & K 10,144 12,549 2.55 2.15 41.82 68.74 892 883 859
16 Jharkhand 26,946 32,966 2.09 2.04 39.38 67.63 941 947 943
17 Karnataka 52,851 61,131 1.59 1.47 57.45 75.60 965 968 943
18 Kerala 31,841 33,388 0.90 0.48 87.86 93.91 1,058 1,084 959
19 Lakshadweep 61 64 1.59 0.55 81.56 92.28 948 946 908
20 Madhya Pradesh 60,348 72,598 2.18 1.87 50.28 70.63 919 930 912
21 Maharashtra 96,879 112,373 2.04 1.49 67.51 82.91 922 925 883
22 Manipur 2,167 2,722 2.63 2.31 59.70 79.85 978 987 934
23 Meghalaya 2,319 2,964 2.62 2.48 60.41 75.48 972 986 970
24 Mizoram 889 1,091 2.56 2.07 86.13 91.58 935 975 971
25 Nagaland 1,990 1,981 4.97 -0.05 61.92 80.11 900 931 944
26 Odisha 36,805 41,947 1.48 1.32 50.97 73.45 972 978 934
27 Puducherry 974 1,244 1.87 2.48 74.13 86.55 1,001 1,038 965
28 Punjab 24,359 27,704 1.80 1.30 63.55 76.68 876 893 846
29 Rajasthan 56,507 68,621 2.49 1.96 44.34 67.06 921 926 883
30 Sikkim 541 608 2.85 1.17 61.46 82.20 875 889 944
31 Tamil Nadu 62,406 72,139 1.06 1.46 64.55 80.33 987 995 946
32 Tripura 3,199 3,671 1.46 1.39 65.41 87.75 948 961 953
33 Uttar Pradesh 166,198 199,581 2.30 1.85 42.98 69.72 898 908 899
34 Uttarakhand 8,489 10,117 1.76 1.77 60.26 79.63 962 963 886
35 West Bengal 80,176 91,348 1.64 1.31 60.22 77.08 934 947 950Source - Col. 2 = 2001/2011 Census
Note:- 1. TFR for smaller States and UTs are three year moving average
States/Union TerritoriesSr.
No.
Annual
Exponential
Growth rate (%)
Literacy Rate (%
Female) (7 Yrs. &
above)
Demographic Indicators - Health (State-wise)
2. Infant mortality rates for Smaller States and Union Territories are based on 3 years average . Note:- 1. Infant MortalityRates and Total Fertility Rates for Smaller States and Union Territories are based on 3 years average 2007-09.
Population
(in '000)
(2011)
Population (in
'000) (2001)
Sex Ratio
(females per
1000 males)
Databook for DCH; 5th December 2012 Page 134 of 266
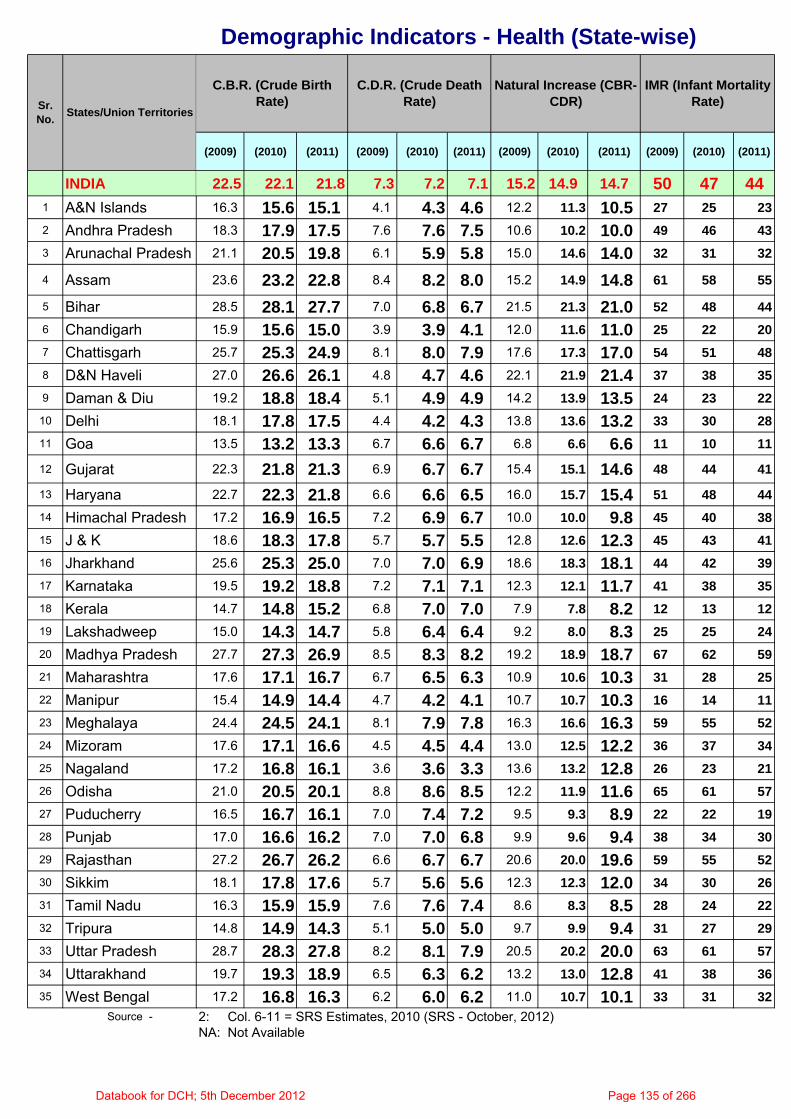
INDIA
1 A&N Islands2 Andhra Pradesh3 Arunachal Pradesh
4 Assam
5 Bihar6 Chandigarh7 Chattisgarh8 D&N Haveli9 Daman & Diu
10 Delhi11 Goa12 Gujarat13 Haryana14 Himachal Pradesh15 J & K 16 Jharkhand17 Karnataka18 Kerala 19 Lakshadweep20 Madhya Pradesh21 Maharashtra 22 Manipur23 Meghalaya24 Mizoram25 Nagaland26 Odisha27 Puducherry28 Punjab29 Rajasthan 30 Sikkim31 Tamil Nadu 32 Tripura33 Uttar Pradesh34 Uttarakhand35 West Bengal
Source -
States/Union TerritoriesSr.
No.
(2009) (2010) (2011) (2009) (2010) (2011) (2009) (2010) (2011) (2009) (2010) (2011)
22.5 22.1 21.8 7.3 7.2 7.1 15.2 14.9 14.7 50 47 44
16.3 15.6 15.1 4.1 4.3 4.6 12.2 11.3 10.5 27 25 23
18.3 17.9 17.5 7.6 7.6 7.5 10.6 10.2 10.0 49 46 43
21.1 20.5 19.8 6.1 5.9 5.8 15.0 14.6 14.0 32 31 32
23.6 23.2 22.8 8.4 8.2 8.0 15.2 14.9 14.8 61 58 55
28.5 28.1 27.7 7.0 6.8 6.7 21.5 21.3 21.0 52 48 44
15.9 15.6 15.0 3.9 3.9 4.1 12.0 11.6 11.0 25 22 20
25.7 25.3 24.9 8.1 8.0 7.9 17.6 17.3 17.0 54 51 48
27.0 26.6 26.1 4.8 4.7 4.6 22.1 21.9 21.4 37 38 35
19.2 18.8 18.4 5.1 4.9 4.9 14.2 13.9 13.5 24 23 22
18.1 17.8 17.5 4.4 4.2 4.3 13.8 13.6 13.2 33 30 28
13.5 13.2 13.3 6.7 6.6 6.7 6.8 6.6 6.6 11 10 11
22.3 21.8 21.3 6.9 6.7 6.7 15.4 15.1 14.6 48 44 41
22.7 22.3 21.8 6.6 6.6 6.5 16.0 15.7 15.4 51 48 44
17.2 16.9 16.5 7.2 6.9 6.7 10.0 10.0 9.8 45 40 38
18.6 18.3 17.8 5.7 5.7 5.5 12.8 12.6 12.3 45 43 41
25.6 25.3 25.0 7.0 7.0 6.9 18.6 18.3 18.1 44 42 39
19.5 19.2 18.8 7.2 7.1 7.1 12.3 12.1 11.7 41 38 35
14.7 14.8 15.2 6.8 7.0 7.0 7.9 7.8 8.2 12 13 12
15.0 14.3 14.7 5.8 6.4 6.4 9.2 8.0 8.3 25 25 24
27.7 27.3 26.9 8.5 8.3 8.2 19.2 18.9 18.7 67 62 59
17.6 17.1 16.7 6.7 6.5 6.3 10.9 10.6 10.3 31 28 25
15.4 14.9 14.4 4.7 4.2 4.1 10.7 10.7 10.3 16 14 11
24.4 24.5 24.1 8.1 7.9 7.8 16.3 16.6 16.3 59 55 52
17.6 17.1 16.6 4.5 4.5 4.4 13.0 12.5 12.2 36 37 34
17.2 16.8 16.1 3.6 3.6 3.3 13.6 13.2 12.8 26 23 21
21.0 20.5 20.1 8.8 8.6 8.5 12.2 11.9 11.6 65 61 57
16.5 16.7 16.1 7.0 7.4 7.2 9.5 9.3 8.9 22 22 19
17.0 16.6 16.2 7.0 7.0 6.8 9.9 9.6 9.4 38 34 30
27.2 26.7 26.2 6.6 6.7 6.7 20.6 20.0 19.6 59 55 52
18.1 17.8 17.6 5.7 5.6 5.6 12.3 12.3 12.0 34 30 26
16.3 15.9 15.9 7.6 7.6 7.4 8.6 8.3 8.5 28 24 22
14.8 14.9 14.3 5.1 5.0 5.0 9.7 9.9 9.4 31 27 29
28.7 28.3 27.8 8.2 8.1 7.9 20.5 20.2 20.0 63 61 57
19.7 19.3 18.9 6.5 6.3 6.2 13.2 13.0 12.8 41 38 36
17.2 16.8 16.3 6.2 6.0 6.2 11.0 10.7 10.1 33 31 32
2: Col. 6-11 = SRS Estimates, 2010 (SRS - October, 2012)NA: Not Available
C.B.R. (Crude Birth
Rate)
C.D.R. (Crude Death
Rate)
Demographic Indicators - Health (State-wise)
Natural Increase (CBR-
CDR)
IMR (Infant Mortality
Rate)
Databook for DCH; 5th December 2012 Page 135 of 266
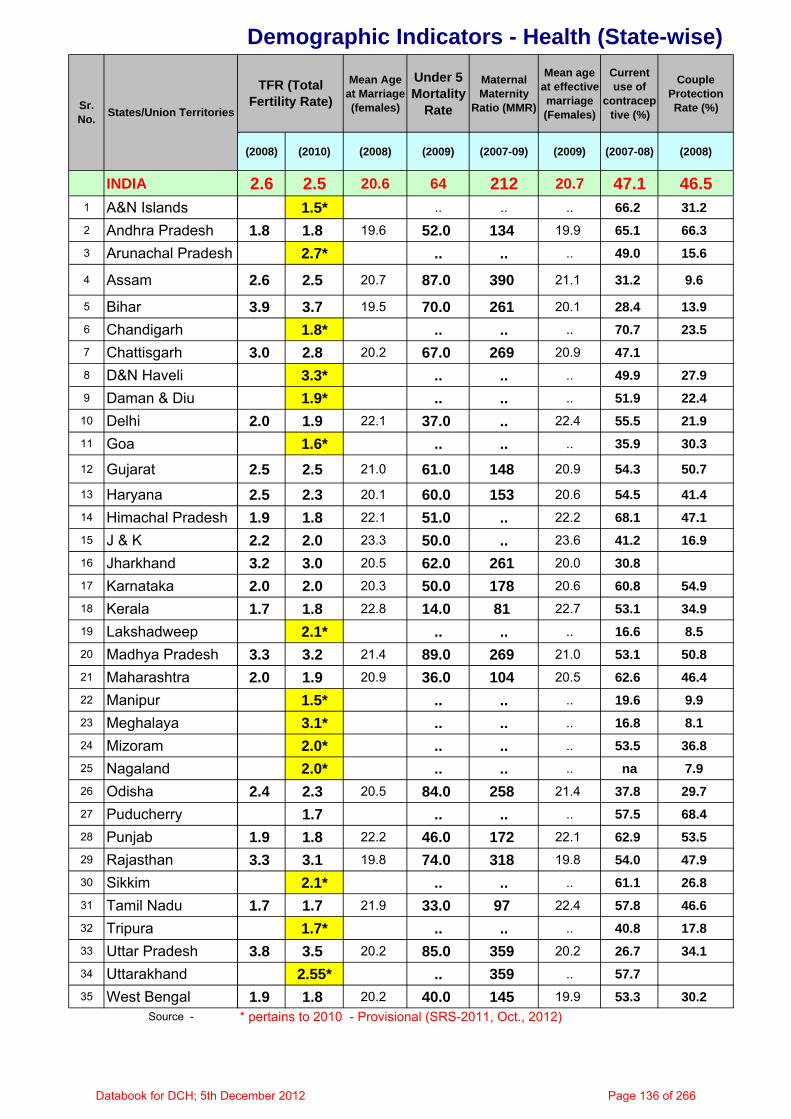
INDIA
1 A&N Islands2 Andhra Pradesh3 Arunachal Pradesh
4 Assam
5 Bihar6 Chandigarh7 Chattisgarh8 D&N Haveli9 Daman & Diu
10 Delhi11 Goa12 Gujarat13 Haryana14 Himachal Pradesh15 J & K 16 Jharkhand17 Karnataka18 Kerala 19 Lakshadweep20 Madhya Pradesh21 Maharashtra 22 Manipur23 Meghalaya24 Mizoram25 Nagaland26 Odisha27 Puducherry28 Punjab29 Rajasthan 30 Sikkim31 Tamil Nadu 32 Tripura33 Uttar Pradesh34 Uttarakhand35 West Bengal
Source -
States/Union TerritoriesSr.
No.
Mean Age
at Marriage
(females)
Under 5
Mortality
Rate
Maternal
Maternity
Ratio (MMR)
Mean age
at effective
marriage
(Females)
Current
use of
contracep
tive (%)
Couple
Protection
Rate (%)
(2008) (2010) (2008) (2009) (2007-09) (2009) (2007-08) (2008)
2.6 2.5 20.6 64 212 20.7 47.1 46.5
1.5* .. .. .. 66.2 31.2
1.8 1.8 19.6 52.0 134 19.9 65.1 66.3
2.7* .. .. .. 49.0 15.6
2.6 2.5 20.7 87.0 390 21.1 31.2 9.6
3.9 3.7 19.5 70.0 261 20.1 28.4 13.9
1.8* .. .. .. 70.7 23.5
3.0 2.8 20.2 67.0 269 20.9 47.1
3.3* .. .. .. 49.9 27.9
1.9* .. .. .. 51.9 22.4
2.0 1.9 22.1 37.0 .. 22.4 55.5 21.9
1.6* .. .. .. 35.9 30.3
2.5 2.5 21.0 61.0 148 20.9 54.3 50.7
2.5 2.3 20.1 60.0 153 20.6 54.5 41.4
1.9 1.8 22.1 51.0 .. 22.2 68.1 47.1
2.2 2.0 23.3 50.0 .. 23.6 41.2 16.9
3.2 3.0 20.5 62.0 261 20.0 30.8
2.0 2.0 20.3 50.0 178 20.6 60.8 54.9
1.7 1.8 22.8 14.0 81 22.7 53.1 34.9
2.1* .. .. .. 16.6 8.5
3.3 3.2 21.4 89.0 269 21.0 53.1 50.8
2.0 1.9 20.9 36.0 104 20.5 62.6 46.4
1.5* .. .. .. 19.6 9.9
3.1* .. .. .. 16.8 8.1
2.0* .. .. .. 53.5 36.8
2.0* .. .. .. na 7.9
2.4 2.3 20.5 84.0 258 21.4 37.8 29.7
1.7 .. .. .. 57.5 68.4
1.9 1.8 22.2 46.0 172 22.1 62.9 53.5
3.3 3.1 19.8 74.0 318 19.8 54.0 47.9
2.1* .. .. .. 61.1 26.8
1.7 1.7 21.9 33.0 97 22.4 57.8 46.6
1.7* .. .. .. 40.8 17.8
3.8 3.5 20.2 85.0 359 20.2 26.7 34.1
2.55* .. 359 .. 57.7
1.9 1.8 20.2 40.0 145 19.9 53.3 30.2
* pertains to 2010 - Provisional (SRS-2011, Oct., 2012)
Demographic Indicators - Health (State-wise)
TFR (Total
Fertility Rate)
Databook for DCH; 5th December 2012 Page 136 of 266
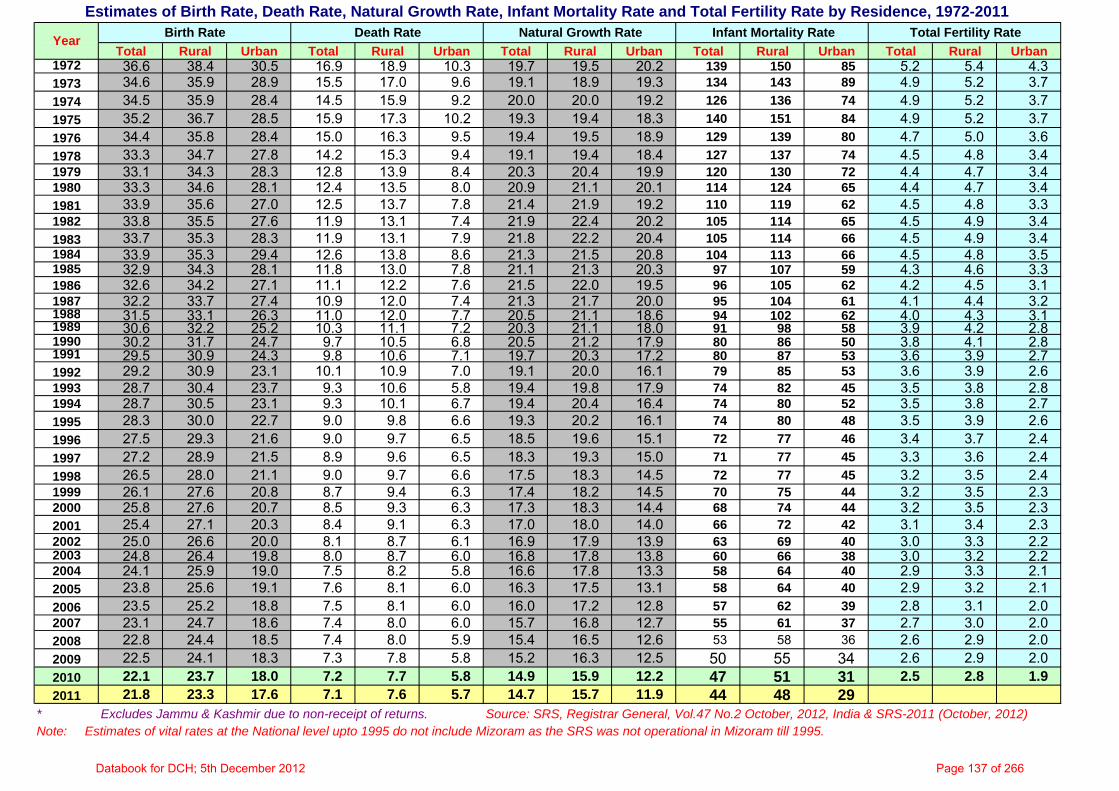
Estimates of Birth Rate, Death Rate, Natural Growth Rate, Infant Mortality Rate and Total Fertility Rate by Residence, 1972-2011
YearBirth Rate Death Rate Natural Growth Rate Infant Mortality Rate Total Fertility Rate
Total Rural Urban Total Rural Urban Total Rural Urban Total Rural Urban Total Rural Urban1972 36.6 38.4 30.5 16.9 18.9 10.3 19.7 19.5 20.2 139 150 85 5.2 5.4 4.31973 34.6 35.9 28.9 15.5 17.0 9.6 19.1 18.9 19.3 134 143 89 4.9 5.2 3.71974 34.5 35.9 28.4 14.5 15.9 9.2 20.0 20.0 19.2 126 136 74 4.9 5.2 3.71975 35.2 36.7 28.5 15.9 17.3 10.2 19.3 19.4 18.3 140 151 84 4.9 5.2 3.71976 34.4 35.8 28.4 15.0 16.3 9.5 19.4 19.5 18.9 129 139 80 4.7 5.0 3.61978 33.3 34.7 27.8 14.2 15.3 9.4 19.1 19.4 18.4 127 137 74 4.5 4.8 3.41979 33.1 34.3 28.3 12.8 13.9 8.4 20.3 20.4 19.9 120 130 72 4.4 4.7 3.41980 33.3 34.6 28.1 12.4 13.5 8.0 20.9 21.1 20.1 114 124 65 4.4 4.7 3.41981 33.9 35.6 27.0 12.5 13.7 7.8 21.4 21.9 19.2 110 119 62 4.5 4.8 3.31982 33.8 35.5 27.6 11.9 13.1 7.4 21.9 22.4 20.2 105 114 65 4.5 4.9 3.41983 33.7 35.3 28.3 11.9 13.1 7.9 21.8 22.2 20.4 105 114 66 4.5 4.9 3.41984 33.9 35.3 29.4 12.6 13.8 8.6 21.3 21.5 20.8 104 113 66 4.5 4.8 3.51985 32.9 34.3 28.1 11.8 13.0 7.8 21.1 21.3 20.3 97 107 59 4.3 4.6 3.31986 32.6 34.2 27.1 11.1 12.2 7.6 21.5 22.0 19.5 96 105 62 4.2 4.5 3.11987 32.2 33.7 27.4 10.9 12.0 7.4 21.3 21.7 20.0 95 104 61 4.1 4.4 3.21988 31.5 33.1 26.3 11.0 12.0 7.7 20.5 21.1 18.6 94 102 62 4.0 4.3 3.11989 30.6 32.2 25.2 10.3 11.1 7.2 20.3 21.1 18.0 91 98 58 3.9 4.2 2.81990 30.2 31.7 24.7 9.7 10.5 6.8 20.5 21.2 17.9 80 86 50 3.8 4.1 2.81991 29.5 30.9 24.3 9.8 10.6 7.1 19.7 20.3 17.2 80 87 53 3.6 3.9 2.71992 29.2 30.9 23.1 10.1 10.9 7.0 19.1 20.0 16.1 79 85 53 3.6 3.9 2.61993 28.7 30.4 23.7 9.3 10.6 5.8 19.4 19.8 17.9 74 82 45 3.5 3.8 2.81994 28.7 30.5 23.1 9.3 10.1 6.7 19.4 20.4 16.4 74 80 52 3.5 3.8 2.71995 28.3 30.0 22.7 9.0 9.8 6.6 19.3 20.2 16.1 74 80 48 3.5 3.9 2.61996 27.5 29.3 21.6 9.0 9.7 6.5 18.5 19.6 15.1 72 77 46 3.4 3.7 2.41997 27.2 28.9 21.5 8.9 9.6 6.5 18.3 19.3 15.0 71 77 45 3.3 3.6 2.41998 26.5 28.0 21.1 9.0 9.7 6.6 17.5 18.3 14.5 72 77 45 3.2 3.5 2.41999 26.1 27.6 20.8 8.7 9.4 6.3 17.4 18.2 14.5 70 75 44 3.2 3.5 2.32000 25.8 27.6 20.7 8.5 9.3 6.3 17.3 18.3 14.4 68 74 44 3.2 3.5 2.32001 25.4 27.1 20.3 8.4 9.1 6.3 17.0 18.0 14.0 66 72 42 3.1 3.4 2.32002 25.0 26.6 20.0 8.1 8.7 6.1 16.9 17.9 13.9 63 69 40 3.0 3.3 2.22003 24.8 26.4 19.8 8.0 8.7 6.0 16.8 17.8 13.8 60 66 38 3.0 3.2 2.22004 24.1 25.9 19.0 7.5 8.2 5.8 16.6 17.8 13.3 58 64 40 2.9 3.3 2.12005 23.8 25.6 19.1 7.6 8.1 6.0 16.3 17.5 13.1 58 64 40 2.9 3.2 2.12006 23.5 25.2 18.8 7.5 8.1 6.0 16.0 17.2 12.8 57 62 39 2.8 3.1 2.02007 23.1 24.7 18.6 7.4 8.0 6.0 15.7 16.8 12.7 55 61 37 2.7 3.0 2.02008 22.8 24.4 18.5 7.4 8.0 5.9 15.4 16.5 12.6 53 58 36 2.6 2.9 2.02009 22.5 24.1 18.3 7.3 7.8 5.8 15.2 16.3 12.5 50 55 34 2.6 2.9 2.02010 22.1 23.7 18.0 7.2 7.7 5.8 14.9 15.9 12.2 47 51 31 2.5 2.8 1.9
2011 21.8 23.3 17.6 7.1 7.6 5.7 14.7 15.7 11.9 44 48 29
* Excludes Jammu & Kashmir due to non-receipt of returns. Source: SRS, Registrar General, Vol.47 No.2 October, 2012, India & SRS-2011 (October, 2012) Note: Estimates of vital rates at the National level upto 1995 do not include Mizoram as the SRS was not operational in Mizoram till 1995.
Databook for DCH; 5th December 2012 Page 137 of 266
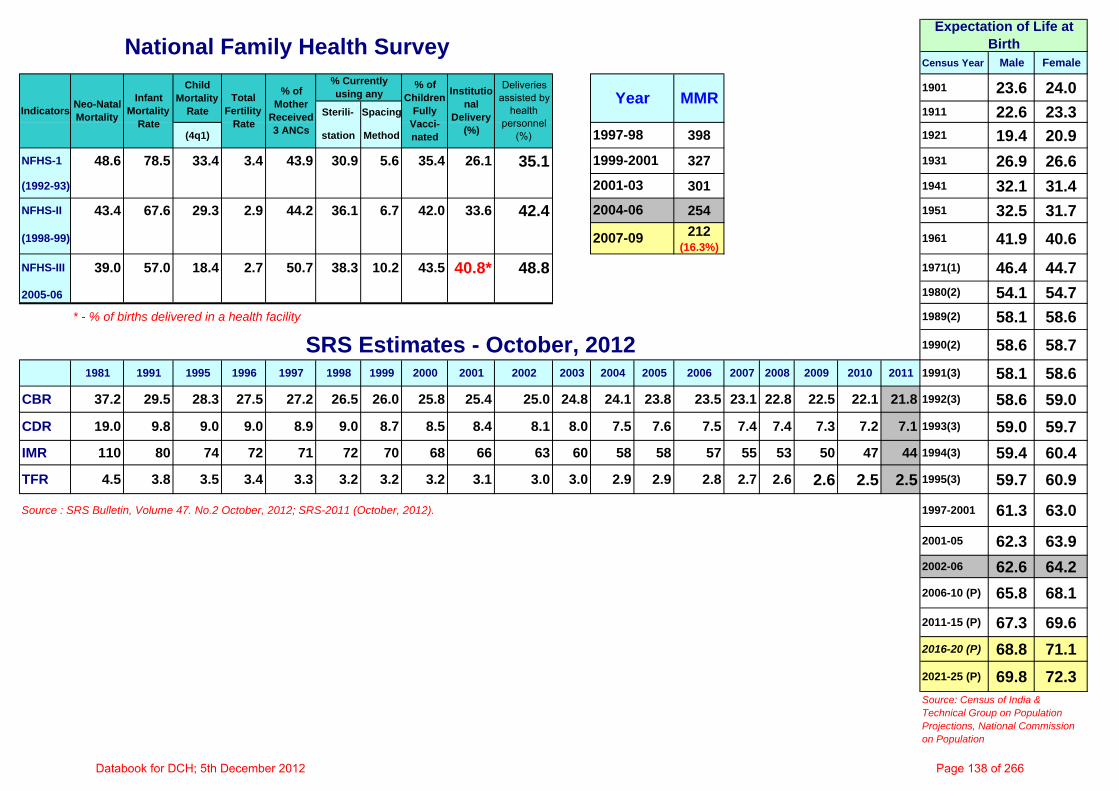
National Family Health SurveyExpectation of Life at
Birth
Census Year Male Female
IndicatorsNeo-Natal
Mortality
Infant
Mortality
Rate
Child
Mortality
Rate
Total
Fertility
Rate
% of
Mother
Received
3 ANCs
% Currently
using any % of
Children
Fully
Vacci-
nated
Institutio
nal
Delivery
(%)
Deliveries assisted by
health personnel
(%)
Year MMR1901 23.6 24.0
Sterili- Spacing 1911 22.6 23.3
(4q1) station Method 1997-98 398 1921 19.4 20.9
NFHS-1 48.6 78.5 33.4 3.4 43.9 30.9 5.6 35.4 26.1 35.1 1999-2001 327 1931 26.9 26.6
(1992-93) 2001-03 301 1941 32.1 31.4
NFHS-II 43.4 67.6 29.3 2.9 44.2 36.1 6.7 42.0 33.6 42.4 2004-06 254 1951 32.5 31.7
(1998-99) 2007-09212
(16.3%)1961 41.9 40.6
NFHS-III 39.0 57.0 18.4 2.7 50.7 38.3 10.2 43.5 40.8* 48.8 1971(1) 46.4 44.7
2005-06 1980(2) 54.1 54.7
* - % of births delivered in a health facility 1989(2) 58.1 58.6
SRS Estimates - October, 2012 1990(2) 58.6 58.7
1981 1991 1995 1996 1997 1998 1999 2000 2001 2002 2003 2004 2005 2006 2007 2008 2009 2010 2011 1991(3) 58.1 58.6
CBR 37.2 29.5 28.3 27.5 27.2 26.5 26.0 25.8 25.4 25.0 24.8 24.1 23.8 23.5 23.1 22.8 22.5 22.1 21.8 1992(3) 58.6 59.0
CDR 19.0 9.8 9.0 9.0 8.9 9.0 8.7 8.5 8.4 8.1 8.0 7.5 7.6 7.5 7.4 7.4 7.3 7.2 7.1 1993(3) 59.0 59.7
IMR 110 80 74 72 71 72 70 68 66 63 60 58 58 57 55 53 50 47 44 1994(3) 59.4 60.4
TFR 4.5 3.8 3.5 3.4 3.3 3.2 3.2 3.2 3.1 3.0 3.0 2.9 2.9 2.8 2.7 2.6 2.6 2.5 2.5 1995(3) 59.7 60.9
Source : SRS Bulletin, Volume 47. No.2 October, 2012; SRS-2011 (October, 2012). 1997-2001 61.3 63.0
2001-05 62.3 63.9
2002-06 62.6 64.2
2006-10 (P) 65.8 68.1
2011-15 (P) 67.3 69.6
2016-20 (P) 68.8 71.1
2021-25 (P) 69.8 72.3
Source: Census of India & Technical Group on Population Projections, National Commission on Population
Databook for DCH; 5th December 2012 Page 138 of 266
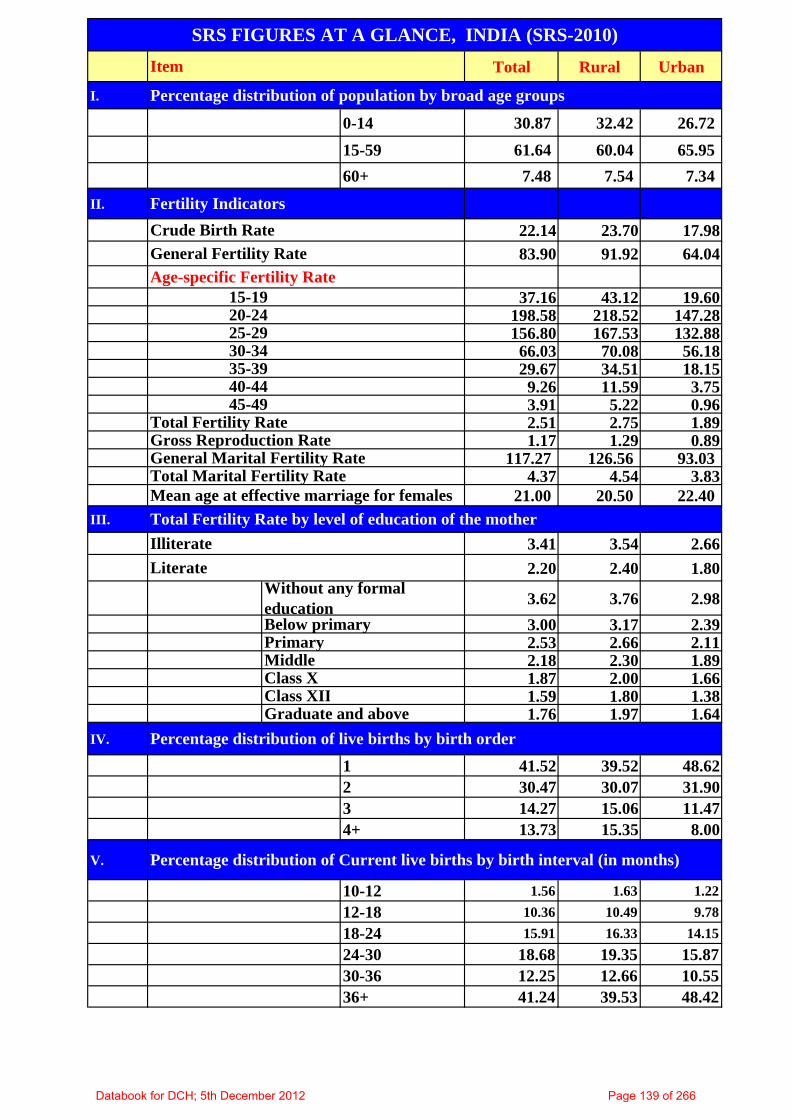
Total Rural Urban
I.
0-14 30.87 32.42 26.7215-59 61.64 60.04 65.9560+ 7.48 7.54 7.34
II.
22.14 23.70 17.98 83.90 91.92 64.04
37.16 43.12 19.60 198.58 218.52 147.28 156.80 167.53 132.88 66.03 70.08 56.18 29.67 34.51 18.15 9.26 11.59 3.75 3.91 5.22 0.96 2.51 2.75 1.89 1.17 1.29 0.89
117.27 126.56 93.034.37 4.54 3.83
21.00 20.50 22.40III.
3.41 3.54 2.662.20 2.40 1.80
3.62 3.76 2.983.00 3.17 2.392.53 2.66 2.112.18 2.30 1.891.87 2.00 1.661.59 1.80 1.381.76 1.97 1.64
IV.
1 41.52 39.52 48.622 30.47 30.07 31.903 14.27 15.06 11.474+ 13.73 15.35 8.00
V.
10-12 1.56 1.63 1.2212-18 10.36 10.49 9.7818-24 15.91 16.33 14.1524-30 18.68 19.35 15.8730-36 12.25 12.66 10.5536+ 41.24 39.53 48.42
Percentage distribution of Current live births by birth interval (in months)
Percentage distribution of population by broad age groups
Total Fertility Rate by level of education of the mother
Percentage distribution of live births by birth order
Class X
IlliterateLiterate
Without any formal education
SRS FIGURES AT A GLANCE, INDIA (SRS-2010)
Class XIIGraduate and above
Below primary
General Fertility Rate
General Marital Fertility Rate
PrimaryMiddle
45-49Total Fertility Rate
Total Marital Fertility RateMean age at effective marriage for females
Gross Reproduction Rate
20-24 15-19
Item
Age-specific Fertility Rate
Fertility IndicatorsCrude Birth Rate
25-29 30-34 35-39 40-44
Databook for DCH; 5th December 2012 Page 139 of 266
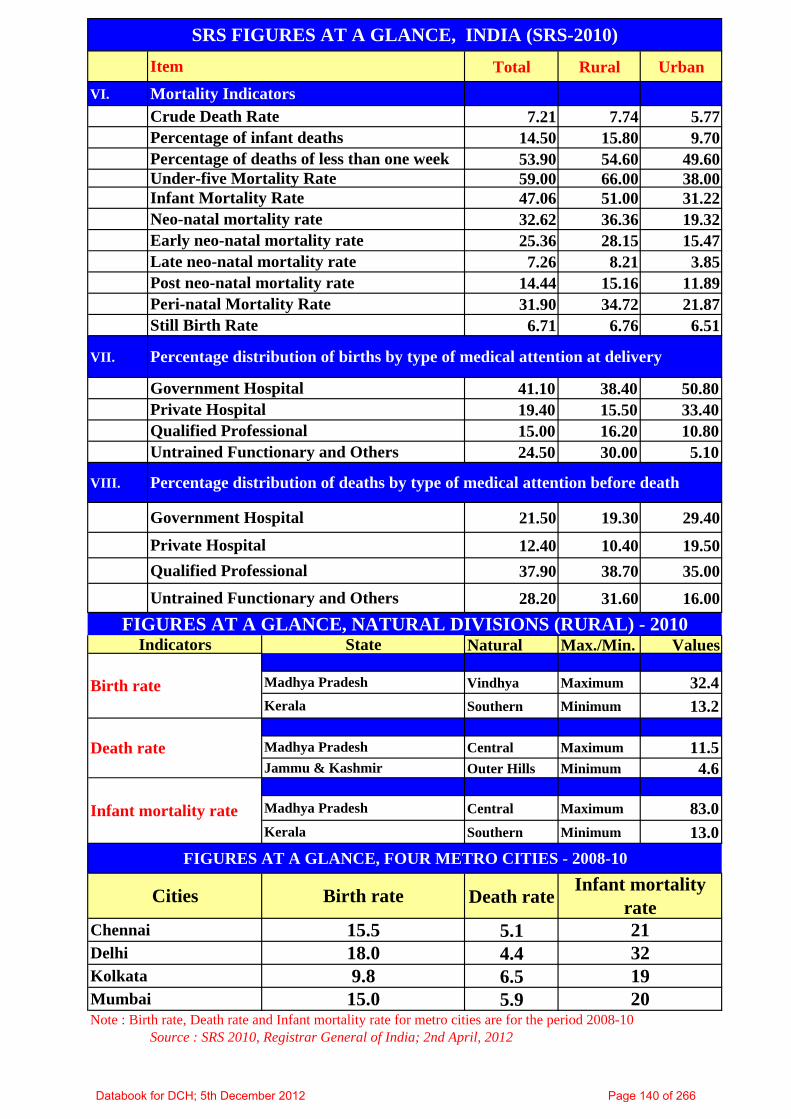
Total Rural Urban
SRS FIGURES AT A GLANCE, INDIA (SRS-2010)Item
VI.
7.21 7.74 5.7714.50 15.80 9.7053.90 54.60 49.6059.00 66.00 38.0047.06 51.00 31.2232.62 36.36 19.3225.36 28.15 15.477.26 8.21 3.85
14.44 15.16 11.8931.90 34.72 21.876.71 6.76 6.51
VII.
41.10 38.40 50.8019.40 15.50 33.4015.00 16.20 10.8024.50 30.00 5.10
VIII.
21.50 19.30 29.40
12.40 10.40 19.5037.90 38.70 35.00
28.20 31.60 16.00
Natural Max./Min. Values
Vindhya Maximum 32.4Southern Minimum 13.2
Central Maximum 11.5Outer Hills Minimum 4.6
Central Maximum 83.0Southern Minimum 13.0
Death rate
5.14.46.55.9
Note : Birth rate, Death rate and Infant mortality rate for metro cities are for the period 2008-10
Infant mortality rateBirth rate
15.518.0
2132
Cities
ChennaiDelhiKolkataMumbai
9.815.0
FIGURES AT A GLANCE, FOUR METRO CITIES - 2008-10
Madhya Pradesh
Kerala
FIGURES AT A GLANCE, NATURAL DIVISIONS (RURAL) - 2010
Birth rate
Death rate
Infant mortality rate
State
Madhya Pradesh
Kerala
Madhya PradeshJammu & Kashmir
Indicators
Qualified Professional
Untrained Functionary and Others
Under-five Mortality Rate
Source : SRS 2010, Registrar General of India; 2nd April, 2012
1920
Untrained Functionary and Others
Percentage distribution of deaths by type of medical attention before death
Government Hospital
Private Hospital
Percentage distribution of births by type of medical attention at delivery
Government HospitalPrivate HospitalQualified Professional
Late neo-natal mortality ratePost neo-natal mortality ratePeri-natal Mortality RateStill Birth Rate
Infant Mortality RateNeo-natal mortality rateEarly neo-natal mortality rate
Mortality IndicatorsCrude Death RatePercentage of infant deaths Percentage of deaths of less than one week
Databook for DCH; 5th December 2012 Page 140 of 266
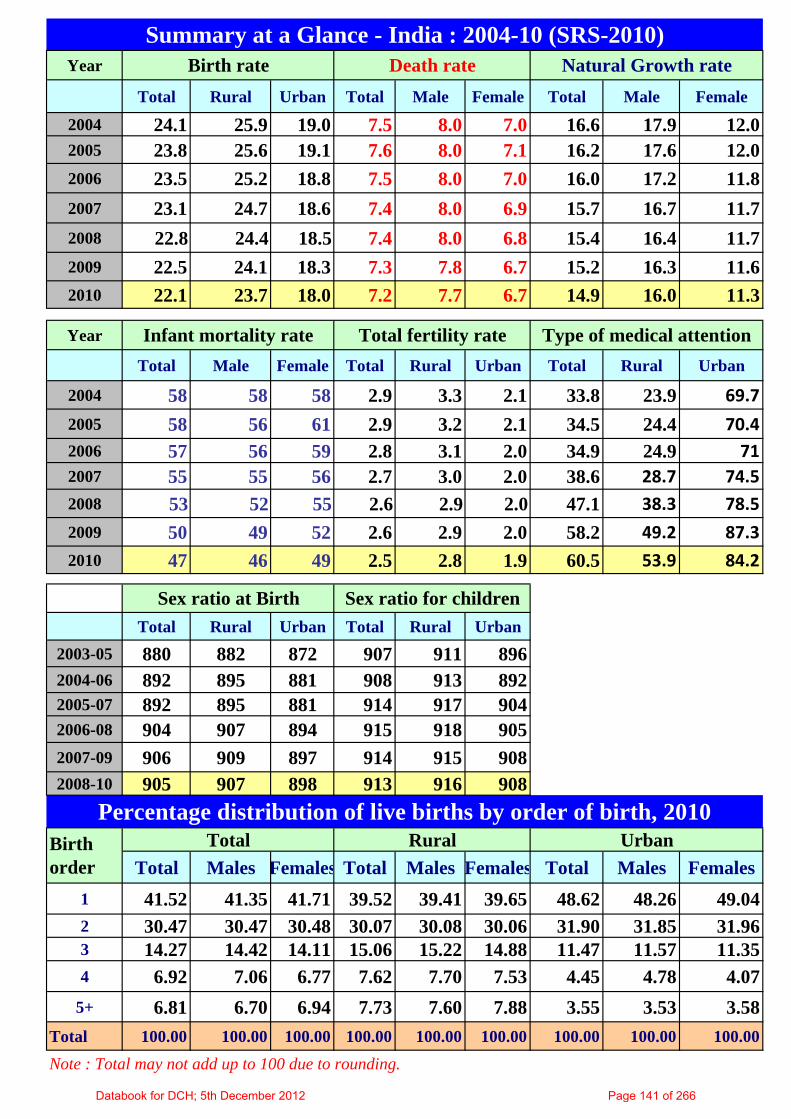
s s
Summary at a Glance - India : 2004-10 (SRS-2010)Year Birth rate Death rate Natural Growth rate
Total Rural Urban Total Male Female Total Male Female
2004 24.1 25.9 19.0 7.5 8.0 7.0 16.6 17.9 12.02005 23.8 25.6 19.1 7.6 8.0 7.1 16.2 17.6 12.02006 23.5 25.2 18.8 7.5 8.0 7.0 16.0 17.2 11.82007 23.1 24.7 18.6 7.4 8.0 6.9 15.7 16.7 11.72008 22.8 24.4 18.5 7.4 8.0 6.8 15.4 16.4 11.72009 22.5 24.1 18.3 7.3 7.8 6.7 15.2 16.3 11.62010 22.1 23.7 18.0 7.2 7.7 6.7 14.9 16.0 11.3
Year Infant mortality rate Total fertility rate Type of medical attentionTotal Male Female Total Rural Urban Total Rural Urban
2004 58 58 58 2.9 3.3 2.1 33.8 23.9 69.72005 58 56 61 2.9 3.2 2.1 34.5 24.4 70.42006 57 56 59 2.8 3.1 2.0 34.9 24.9 712007 55 55 56 2.7 3.0 2.0 38.6 28.7 74.52008 53 52 55 2.6 2.9 2.0 47.1 38.3 78.52009 50 49 52 2.6 2.9 2.0 58.2 49.2 87.32010 47 46 49 2.5 2.8 1.9 60.5 53.9 84.2
Sex ratio at Birth Sex ratio for childrenTotal Rural Urban Total Rural Urban
2003-05 880 882 872 907 911 8962004-06 892 895 881 908 913 8922005-07 892 895 881 914 917 9042006-08 904 907 894 915 918 9052007-09 906 909 897 914 915 9082008-10 905 907 898 913 916 908
Percentage distribution of live births by order of birth, 2010Birth order
Total Rural UrbanTotal Males Female Total Males Female Total Males Females
1 41.52 41.35 41.71 39.52 39.41 39.65 48.62 48.26 49.042 30.47 30.47 30.48 30.07 30.08 30.06 31.90 31.85 31.963 14.27 14.42 14.11 15.06 15.22 14.88 11.47 11.57 11.354 6.92 7.06 6.77 7.62 7.70 7.53 4.45 4.78 4.07
5+ 6.81 6.70 6.94 7.73 7.60 7.88 3.55 3.53 3.58Total 100.00 100.00 100.00 100.00 100.00 100.00 100.00 100.00 100.00Note : Total may not add up to 100 due to rounding.
Databook for DCH; 5th December 2012 Page 141 of 266
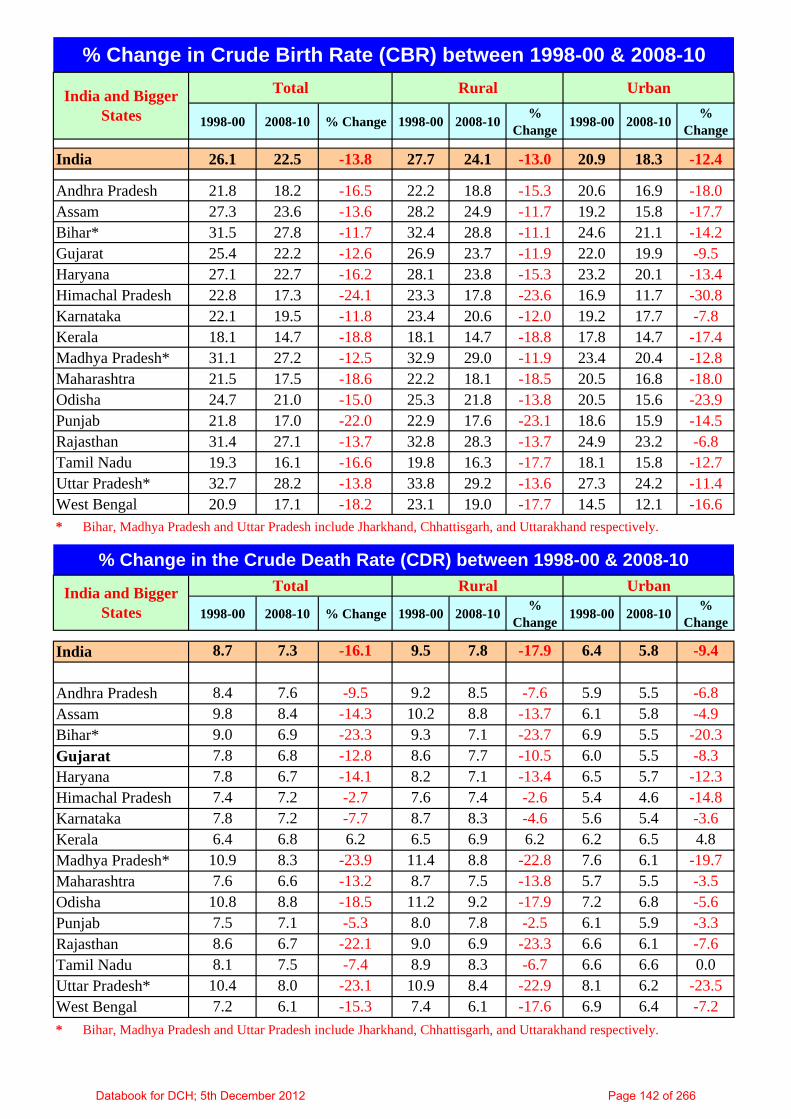
% Change in Crude Birth Rate (CBR) between 1998-00 & 2008-10
India and Bigger States
Total Rural Urban
1998-00 2008-10 % Change 1998-00 2008-10 % Change 1998-00 2008-10 %
Change
India 26.1 22.5 -13.8 27.7 24.1 -13.0 20.9 18.3 -12.4
Andhra Pradesh 21.8 18.2 -16.5 22.2 18.8 -15.3 20.6 16.9 -18.0 Assam 27.3 23.6 -13.6 28.2 24.9 -11.7 19.2 15.8 -17.7 Bihar* 31.5 27.8 -11.7 32.4 28.8 -11.1 24.6 21.1 -14.2 Gujarat 25.4 22.2 -12.6 26.9 23.7 -11.9 22.0 19.9 -9.5 Haryana 27.1 22.7 -16.2 28.1 23.8 -15.3 23.2 20.1 -13.4 Himachal Pradesh 22.8 17.3 -24.1 23.3 17.8 -23.6 16.9 11.7 -30.8 Karnataka 22.1 19.5 -11.8 23.4 20.6 -12.0 19.2 17.7 -7.8 Kerala 18.1 14.7 -18.8 18.1 14.7 -18.8 17.8 14.7 -17.4 Madhya Pradesh* 31.1 27.2 -12.5 32.9 29.0 -11.9 23.4 20.4 -12.8 Maharashtra 21.5 17.5 -18.6 22.2 18.1 -18.5 20.5 16.8 -18.0 Odisha 24.7 21.0 -15.0 25.3 21.8 -13.8 20.5 15.6 -23.9 Punjab 21.8 17.0 -22.0 22.9 17.6 -23.1 18.6 15.9 -14.5 Rajasthan 31.4 27.1 -13.7 32.8 28.3 -13.7 24.9 23.2 -6.8 Tamil Nadu 19.3 16.1 -16.6 19.8 16.3 -17.7 18.1 15.8 -12.7 Uttar Pradesh* 32.7 28.2 -13.8 33.8 29.2 -13.6 27.3 24.2 -11.4 West Bengal 20.9 17.1 -18.2 23.1 19.0 -17.7 14.5 12.1 -16.6 * Bihar, Madhya Pradesh and Uttar Pradesh include Jharkhand, Chhattisgarh, and Uttarakhand respectively.
% Change in the Crude Death Rate (CDR) between 1998-00 & 2008-10
India and Bigger States
Total Rural Urban
1998-00 2008-10 % Change 1998-00 2008-10 % Change 1998-00 2008-10 %
Change
India 8.7 7.3 -16.1 9.5 7.8 -17.9 6.4 5.8 -9.4
Andhra Pradesh 8.4 7.6 -9.5 9.2 8.5 -7.6 5.9 5.5 -6.8 Assam 9.8 8.4 -14.3 10.2 8.8 -13.7 6.1 5.8 -4.9 Bihar* 9.0 6.9 -23.3 9.3 7.1 -23.7 6.9 5.5 -20.3 Gujarat 7.8 6.8 -12.8 8.6 7.7 -10.5 6.0 5.5 -8.3 Haryana 7.8 6.7 -14.1 8.2 7.1 -13.4 6.5 5.7 -12.3 Himachal Pradesh 7.4 7.2 -2.7 7.6 7.4 -2.6 5.4 4.6 -14.8 Karnataka 7.8 7.2 -7.7 8.7 8.3 -4.6 5.6 5.4 -3.6 Kerala 6.4 6.8 6.2 6.5 6.9 6.2 6.2 6.5 4.8 Madhya Pradesh* 10.9 8.3 -23.9 11.4 8.8 -22.8 7.6 6.1 -19.7 Maharashtra 7.6 6.6 -13.2 8.7 7.5 -13.8 5.7 5.5 -3.5 Odisha 10.8 8.8 -18.5 11.2 9.2 -17.9 7.2 6.8 -5.6 Punjab 7.5 7.1 -5.3 8.0 7.8 -2.5 6.1 5.9 -3.3 Rajasthan 8.6 6.7 -22.1 9.0 6.9 -23.3 6.6 6.1 -7.6 Tamil Nadu 8.1 7.5 -7.4 8.9 8.3 -6.7 6.6 6.6 0.0 Uttar Pradesh* 10.4 8.0 -23.1 10.9 8.4 -22.9 8.1 6.2 -23.5 West Bengal 7.2 6.1 -15.3 7.4 6.1 -17.6 6.9 6.4 -7.2 * Bihar, Madhya Pradesh and Uttar Pradesh include Jharkhand, Chhattisgarh, and Uttarakhand respectively.
Databook for DCH; 5th December 2012 Page 142 of 266
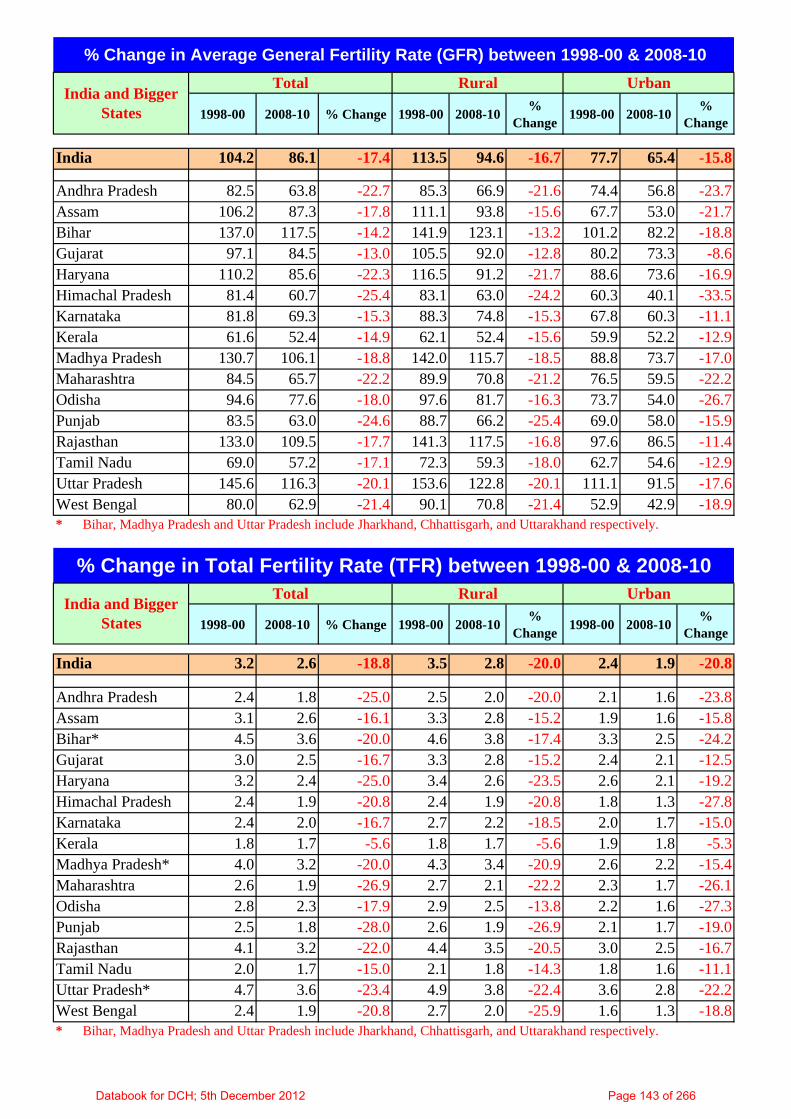
% Change in Average General Fertility Rate (GFR) between 1998-00 & 2008-10
India and Bigger States
Total Rural Urban
1998-00 2008-10 % Change 1998-00 2008-10 % Change 1998-00 2008-10 %
Change
India 104.2 86.1 -17.4 113.5 94.6 -16.7 77.7 65.4 -15.8
Andhra Pradesh 82.5 63.8 -22.7 85.3 66.9 -21.6 74.4 56.8 -23.7 Assam 106.2 87.3 -17.8 111.1 93.8 -15.6 67.7 53.0 -21.7 Bihar 137.0 117.5 -14.2 141.9 123.1 -13.2 101.2 82.2 -18.8 Gujarat 97.1 84.5 -13.0 105.5 92.0 -12.8 80.2 73.3 -8.6 Haryana 110.2 85.6 -22.3 116.5 91.2 -21.7 88.6 73.6 -16.9 Himachal Pradesh 81.4 60.7 -25.4 83.1 63.0 -24.2 60.3 40.1 -33.5 Karnataka 81.8 69.3 -15.3 88.3 74.8 -15.3 67.8 60.3 -11.1 Kerala 61.6 52.4 -14.9 62.1 52.4 -15.6 59.9 52.2 -12.9 Madhya Pradesh 130.7 106.1 -18.8 142.0 115.7 -18.5 88.8 73.7 -17.0 Maharashtra 84.5 65.7 -22.2 89.9 70.8 -21.2 76.5 59.5 -22.2 Odisha 94.6 77.6 -18.0 97.6 81.7 -16.3 73.7 54.0 -26.7 Punjab 83.5 63.0 -24.6 88.7 66.2 -25.4 69.0 58.0 -15.9 Rajasthan 133.0 109.5 -17.7 141.3 117.5 -16.8 97.6 86.5 -11.4 Tamil Nadu 69.0 57.2 -17.1 72.3 59.3 -18.0 62.7 54.6 -12.9 Uttar Pradesh 145.6 116.3 -20.1 153.6 122.8 -20.1 111.1 91.5 -17.6 West Bengal 80.0 62.9 -21.4 90.1 70.8 -21.4 52.9 42.9 -18.9 * Bihar, Madhya Pradesh and Uttar Pradesh include Jharkhand, Chhattisgarh, and Uttarakhand respectively.
% Change in Total Fertility Rate (TFR) between 1998-00 & 2008-10
India and Bigger States
Total Rural Urban
1998-00 2008-10 % Change 1998-00 2008-10 % Change 1998-00 2008-10 %
Change
India 3.2 2.6 -18.8 3.5 2.8 -20.0 2.4 1.9 -20.8
Andhra Pradesh 2.4 1.8 -25.0 2.5 2.0 -20.0 2.1 1.6 -23.8 Assam 3.1 2.6 -16.1 3.3 2.8 -15.2 1.9 1.6 -15.8 Bihar* 4.5 3.6 -20.0 4.6 3.8 -17.4 3.3 2.5 -24.2 Gujarat 3.0 2.5 -16.7 3.3 2.8 -15.2 2.4 2.1 -12.5 Haryana 3.2 2.4 -25.0 3.4 2.6 -23.5 2.6 2.1 -19.2 Himachal Pradesh 2.4 1.9 -20.8 2.4 1.9 -20.8 1.8 1.3 -27.8 Karnataka 2.4 2.0 -16.7 2.7 2.2 -18.5 2.0 1.7 -15.0 Kerala 1.8 1.7 -5.6 1.8 1.7 -5.6 1.9 1.8 -5.3 Madhya Pradesh* 4.0 3.2 -20.0 4.3 3.4 -20.9 2.6 2.2 -15.4 Maharashtra 2.6 1.9 -26.9 2.7 2.1 -22.2 2.3 1.7 -26.1 Odisha 2.8 2.3 -17.9 2.9 2.5 -13.8 2.2 1.6 -27.3 Punjab 2.5 1.8 -28.0 2.6 1.9 -26.9 2.1 1.7 -19.0 Rajasthan 4.1 3.2 -22.0 4.4 3.5 -20.5 3.0 2.5 -16.7 Tamil Nadu 2.0 1.7 -15.0 2.1 1.8 -14.3 1.8 1.6 -11.1 Uttar Pradesh* 4.7 3.6 -23.4 4.9 3.8 -22.4 3.6 2.8 -22.2 West Bengal 2.4 1.9 -20.8 2.7 2.0 -25.9 1.6 1.3 -18.8 * Bihar, Madhya Pradesh and Uttar Pradesh include Jharkhand, Chhattisgarh, and Uttarakhand respectively.
Databook for DCH; 5th December 2012 Page 143 of 266
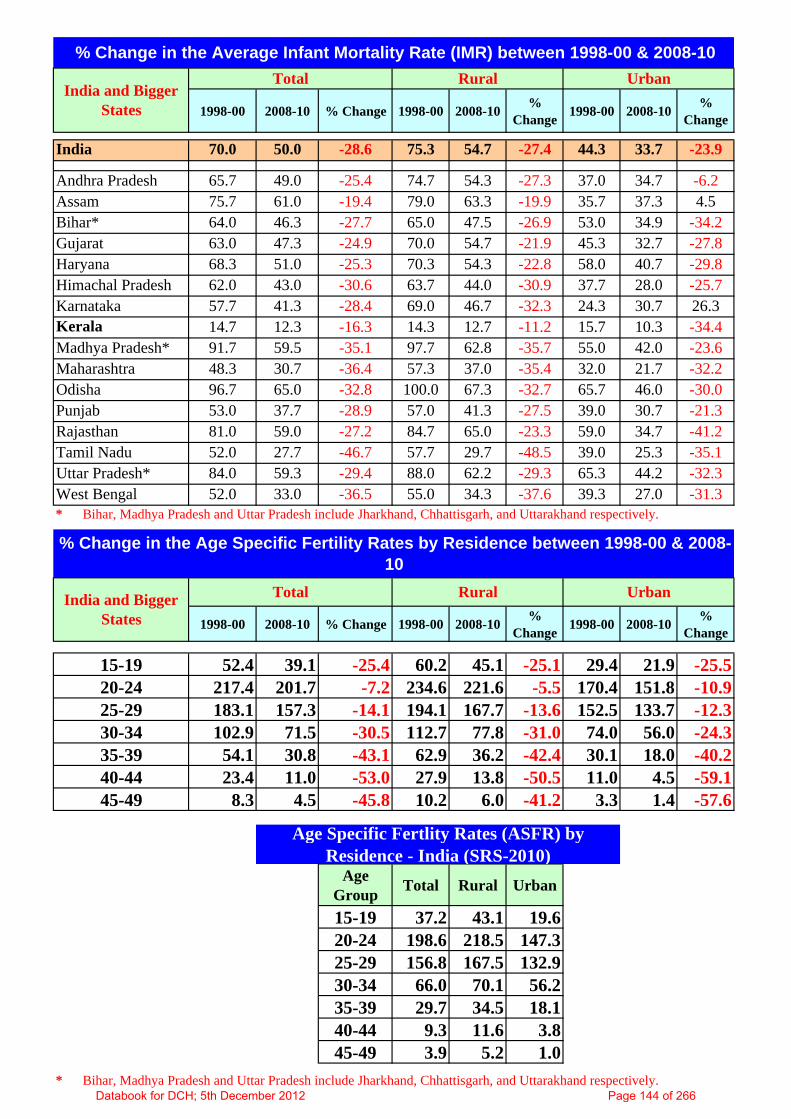
% Change in the Average Infant Mortality Rate (IMR) between 1998-00 & 2008-10
India and Bigger States
Total Rural Urban
1998-00 2008-10 % Change 1998-00 2008-10 % Change 1998-00 2008-10 %
Change
India 70.0 50.0 -28.6 75.3 54.7 -27.4 44.3 33.7 -23.9
Andhra Pradesh 65.7 49.0 -25.4 74.7 54.3 -27.3 37.0 34.7 -6.2 Assam 75.7 61.0 -19.4 79.0 63.3 -19.9 35.7 37.3 4.5 Bihar* 64.0 46.3 -27.7 65.0 47.5 -26.9 53.0 34.9 -34.2 Gujarat 63.0 47.3 -24.9 70.0 54.7 -21.9 45.3 32.7 -27.8 Haryana 68.3 51.0 -25.3 70.3 54.3 -22.8 58.0 40.7 -29.8 Himachal Pradesh 62.0 43.0 -30.6 63.7 44.0 -30.9 37.7 28.0 -25.7 Karnataka 57.7 41.3 -28.4 69.0 46.7 -32.3 24.3 30.7 26.3 Kerala 14.7 12.3 -16.3 14.3 12.7 -11.2 15.7 10.3 -34.4 Madhya Pradesh* 91.7 59.5 -35.1 97.7 62.8 -35.7 55.0 42.0 -23.6 Maharashtra 48.3 30.7 -36.4 57.3 37.0 -35.4 32.0 21.7 -32.2 Odisha 96.7 65.0 -32.8 100.0 67.3 -32.7 65.7 46.0 -30.0 Punjab 53.0 37.7 -28.9 57.0 41.3 -27.5 39.0 30.7 -21.3 Rajasthan 81.0 59.0 -27.2 84.7 65.0 -23.3 59.0 34.7 -41.2 Tamil Nadu 52.0 27.7 -46.7 57.7 29.7 -48.5 39.0 25.3 -35.1 Uttar Pradesh* 84.0 59.3 -29.4 88.0 62.2 -29.3 65.3 44.2 -32.3 West Bengal 52.0 33.0 -36.5 55.0 34.3 -37.6 39.3 27.0 -31.3 * Bihar, Madhya Pradesh and Uttar Pradesh include Jharkhand, Chhattisgarh, and Uttarakhand respectively.
% Change in the Age Specific Fertility Rates by Residence between 1998-00 & 2008-
10
India and Bigger States
Total Rural Urban
1998-00 2008-10 % Change 1998-00 2008-10 % Change 1998-00 2008-10 %
Change
15-19 52.4 39.1 -25.4 60.2 45.1 -25.1 29.4 21.9 -25.5 20-24 217.4 201.7 -7.2 234.6 221.6 -5.5 170.4 151.8 -10.9 25-29 183.1 157.3 -14.1 194.1 167.7 -13.6 152.5 133.7 -12.3 30-34 102.9 71.5 -30.5 112.7 77.8 -31.0 74.0 56.0 -24.3 35-39 54.1 30.8 -43.1 62.9 36.2 -42.4 30.1 18.0 -40.2 40-44 23.4 11.0 -53.0 27.9 13.8 -50.5 11.0 4.5 -59.1 45-49 8.3 4.5 -45.8 10.2 6.0 -41.2 3.3 1.4 -57.6
Age Specific Fertlity Rates (ASFR) by Residence - India (SRS-2010)
Age Group Total Rural Urban
15-19 37.2 43.1 19.6 20-24 198.6 218.5 147.3 25-29 156.8 167.5 132.9 30-34 66.0 70.1 56.2 35-39 29.7 34.5 18.1 40-44 9.3 11.6 3.8 45-49 3.9 5.2 1.0
* Bihar, Madhya Pradesh and Uttar Pradesh include Jharkhand, Chhattisgarh, and Uttarakhand respectively.Databook for DCH; 5th December 2012 Page 144 of 266
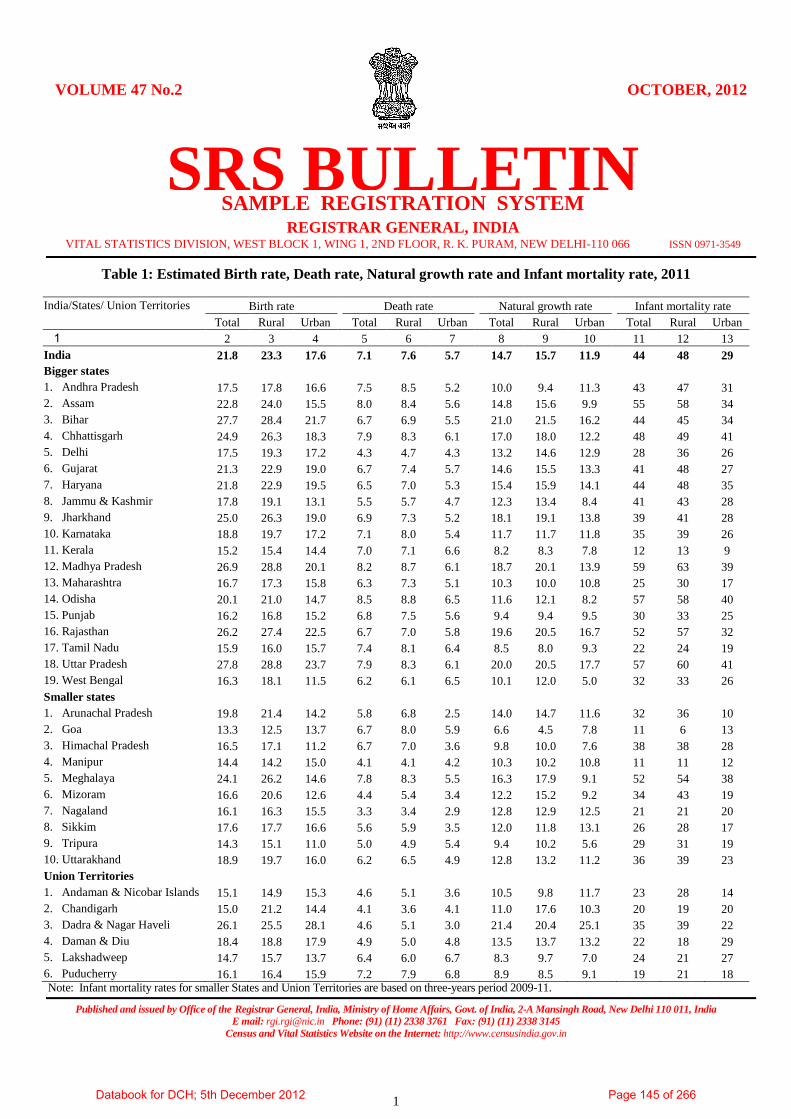
1
VOLUME 47 No.2
OCTOBER, 2012
SRS BULLETIN SAMPLE REGISTRATION SYSTEM
REGISTRAR GENERAL, INDIA
VITAL STATISTICS DIVISION, WEST BLOCK 1, WING 1, 2ND FLOOR, R. K. PURAM, NEW DELHI-110 066 ISSN 0971-3549
Table 1: Estimated Birth rate, Death rate, Natural growth rate and Infant mortality rate, 2011
India/States/ Union Territories Birth rate Death rate Natural growth rate Infant mortality rate
Total Rural Urban Total Rural Urban Total Rural Urban Total Rural Urban
1 2 3 4 5 6 7 8 9 10 11 12 13
India 21.8 23.3 17.6 7.1 7.6 5.7 14.7 15.7 11.9 44 48 29
Bigger states
1. Andhra Pradesh 17.5 17.8 16.6 7.5 8.5 5.2 10.0 9.4 11.3 43 47 31
2. Assam 22.8 24.0 15.5 8.0 8.4 5.6 14.8 15.6 9.9 55 58 34
3. Bihar 27.7 28.4 21.7 6.7 6.9 5.5 21.0 21.5 16.2 44 45 34
4. Chhattisgarh 24.9 26.3 18.3 7.9 8.3 6.1 17.0 18.0 12.2 48 49 41
5. Delhi 17.5 19.3 17.2 4.3 4.7 4.3 13.2 14.6 12.9 28 36 26
6. Gujarat 21.3 22.9 19.0 6.7 7.4 5.7 14.6 15.5 13.3 41 48 27
7. Haryana 21.8 22.9 19.5 6.5 7.0 5.3 15.4 15.9 14.1 44 48 35
8. Jammu & Kashmir 17.8 19.1 13.1 5.5 5.7 4.7 12.3 13.4 8.4 41 43 28
9. Jharkhand 25.0 26.3 19.0 6.9 7.3 5.2 18.1 19.1 13.8 39 41 28
10. Karnataka 18.8 19.7 17.2 7.1 8.0 5.4 11.7 11.7 11.8 35 39 26
11. Kerala 15.2 15.4 14.4 7.0 7.1 6.6 8.2 8.3 7.8 12 13 9
12. Madhya Pradesh 26.9 28.8 20.1 8.2 8.7 6.1 18.7 20.1 13.9 59 63 39
13. Maharashtra 16.7 17.3 15.8 6.3 7.3 5.1 10.3 10.0 10.8 25 30 17
14. Odisha 20.1 21.0 14.7 8.5 8.8 6.5 11.6 12.1 8.2 57 58 40
15. Punjab 16.2 16.8 15.2 6.8 7.5 5.6 9.4 9.4 9.5 30 33 25
16. Rajasthan 26.2 27.4 22.5 6.7 7.0 5.8 19.6 20.5 16.7 52 57 32
17. Tamil Nadu 15.9 16.0 15.7 7.4 8.1 6.4 8.5 8.0 9.3 22 24 19
18. Uttar Pradesh 27.8 28.8 23.7 7.9 8.3 6.1 20.0 20.5 17.7 57 60 41
19. West Bengal 16.3 18.1 11.5 6.2 6.1 6.5 10.1 12.0 5.0 32 33 26
Smaller states
1. Arunachal Pradesh 19.8 21.4 14.2 5.8 6.8 2.5 14.0 14.7 11.6 32 36 10
2. Goa 13.3 12.5 13.7 6.7 8.0 5.9 6.6 4.5 7.8 11 6 13
3. Himachal Pradesh 16.5 17.1 11.2 6.7 7.0 3.6 9.8 10.0 7.6 38 38 28
4. Manipur 14.4 14.2 15.0 4.1 4.1 4.2 10.3 10.2 10.8 11 11 12
5. Meghalaya 24.1 26.2 14.6 7.8 8.3 5.5 16.3 17.9 9.1 52 54 38
6. Mizoram 16.6 20.6 12.6 4.4 5.4 3.4 12.2 15.2 9.2 34 43 19
7. Nagaland 16.1 16.3 15.5 3.3 3.4 2.9 12.8 12.9 12.5 21 21 20
8. Sikkim 17.6 17.7 16.6 5.6 5.9 3.5 12.0 11.8 13.1 26 28 17
9. Tripura 14.3 15.1 11.0 5.0 4.9 5.4 9.4 10.2 5.6 29 31 19
10. Uttarakhand 18.9 19.7 16.0 6.2 6.5 4.9 12.8 13.2 11.2 36 39 23
Union Territories
1. Andaman & Nicobar Islands 15.1 14.9 15.3 4.6 5.1 3.6 10.5 9.8 11.7 23 28 14
2. Chandigarh 15.0 21.2 14.4 4.1 3.6 4.1 11.0 17.6 10.3 20 19 20
3. Dadra & Nagar Haveli 26.1 25.5 28.1 4.6 5.1 3.0 21.4 20.4 25.1 35 39 22
4. Daman & Diu 18.4 18.8 17.9 4.9 5.0 4.8 13.5 13.7 13.2 22 18 29
5. Lakshadweep 14.7 15.7 13.7 6.4 6.0 6.7 8.3 9.7 7.0 24 21 27
6. Puducherry 16.1 16.4 15.9 7.2 7.9 6.8 8.9 8.5 9.1 19 21 18 Note: Infant mortality rates for smaller States and Union Territories are based on three-years period 2009-11.
Published and issued by Office of the Registrar General, India, Ministry of Home Affairs, Govt. of India, 2-A Mansingh Road, New Delhi 110 011, India
E mail: [email protected] Phone: (91) (11) 2338 3761 Fax: (91) (11) 2338 3145
Census and Vital Statistics Website on the Internet: http://www.censusindia.gov.in
Databook for DCH; 5th December 2012 Page 145 of 266
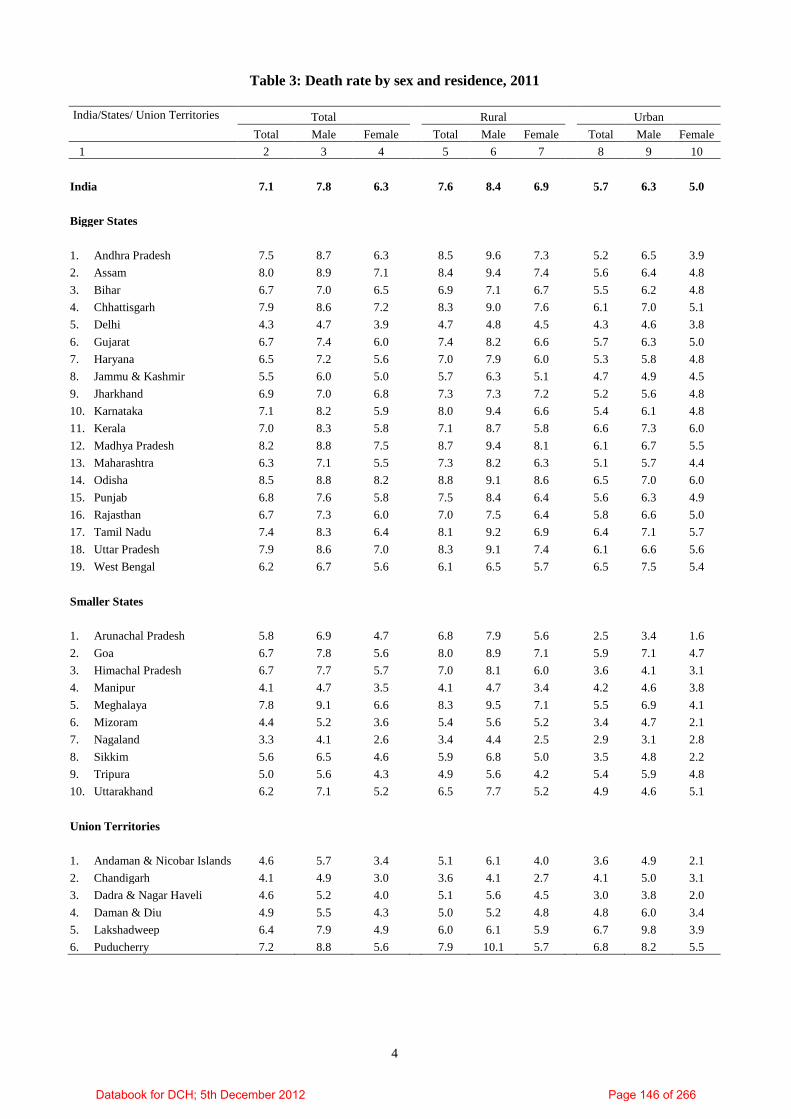
4
Table 3: Death rate by sex and residence, 2011
India/States/ Union Territories Total Rural Urban
Total Male Female Total Male Female Total Male Female
1 2 3 4 5 6 7 8 9 10
India 7.1 7.8 6.3 7.6 8.4 6.9 5.7 6.3 5.0
Bigger States
1. Andhra Pradesh 7.5 8.7 6.3 8.5 9.6 7.3 5.2 6.5 3.9
2. Assam 8.0 8.9 7.1 8.4 9.4 7.4 5.6 6.4 4.8
3. Bihar 6.7 7.0 6.5 6.9 7.1 6.7 5.5 6.2 4.8
4. Chhattisgarh 7.9 8.6 7.2 8.3 9.0 7.6 6.1 7.0 5.1
5. Delhi 4.3 4.7 3.9 4.7 4.8 4.5 4.3 4.6 3.8
6. Gujarat 6.7 7.4 6.0 7.4 8.2 6.6 5.7 6.3 5.0
7. Haryana 6.5 7.2 5.6 7.0 7.9 6.0 5.3 5.8 4.8
8. Jammu & Kashmir 5.5 6.0 5.0 5.7 6.3 5.1 4.7 4.9 4.5
9. Jharkhand 6.9 7.0 6.8 7.3 7.3 7.2 5.2 5.6 4.8
10. Karnataka 7.1 8.2 5.9 8.0 9.4 6.6 5.4 6.1 4.8
11. Kerala 7.0 8.3 5.8 7.1 8.7 5.8 6.6 7.3 6.0
12. Madhya Pradesh 8.2 8.8 7.5 8.7 9.4 8.1 6.1 6.7 5.5
13. Maharashtra 6.3 7.1 5.5 7.3 8.2 6.3 5.1 5.7 4.4
14. Odisha 8.5 8.8 8.2 8.8 9.1 8.6 6.5 7.0 6.0
15. Punjab 6.8 7.6 5.8 7.5 8.4 6.4 5.6 6.3 4.9
16. Rajasthan 6.7 7.3 6.0 7.0 7.5 6.4 5.8 6.6 5.0
17. Tamil Nadu 7.4 8.3 6.4 8.1 9.2 6.9 6.4 7.1 5.7
18. Uttar Pradesh 7.9 8.6 7.0 8.3 9.1 7.4 6.1 6.6 5.6
19. West Bengal 6.2 6.7 5.6 6.1 6.5 5.7 6.5 7.5 5.4
Smaller States
1. Arunachal Pradesh 5.8 6.9 4.7 6.8 7.9 5.6 2.5 3.4 1.6
2. Goa 6.7 7.8 5.6 8.0 8.9 7.1 5.9 7.1 4.7
3. Himachal Pradesh 6.7 7.7 5.7 7.0 8.1 6.0 3.6 4.1 3.1
4. Manipur 4.1 4.7 3.5 4.1 4.7 3.4 4.2 4.6 3.8
5. Meghalaya 7.8 9.1 6.6 8.3 9.5 7.1 5.5 6.9 4.1
6. Mizoram 4.4 5.2 3.6 5.4 5.6 5.2 3.4 4.7 2.1
7. Nagaland 3.3 4.1 2.6 3.4 4.4 2.5 2.9 3.1 2.8
8. Sikkim 5.6 6.5 4.6 5.9 6.8 5.0 3.5 4.8 2.2
9. Tripura 5.0 5.6 4.3 4.9 5.6 4.2 5.4 5.9 4.8
10. Uttarakhand 6.2 7.1 5.2 6.5 7.7 5.2 4.9 4.6 5.1
Union Territories
1. Andaman & Nicobar Islands 4.6 5.7 3.4 5.1 6.1 4.0 3.6 4.9 2.1
2. Chandigarh 4.1 4.9 3.0 3.6 4.1 2.7 4.1 5.0 3.1
3. Dadra & Nagar Haveli 4.6 5.2 4.0 5.1 5.6 4.5 3.0 3.8 2.0
4. Daman & Diu 4.9 5.5 4.3 5.0 5.2 4.8 4.8 6.0 3.4
5. Lakshadweep 6.4 7.9 4.9 6.0 6.1 5.9 6.7 9.8 3.9
6. Puducherry 7.2 8.8 5.6 7.9 10.1 5.7 6.8 8.2 5.5
Databook for DCH; 5th December 2012 Page 146 of 266
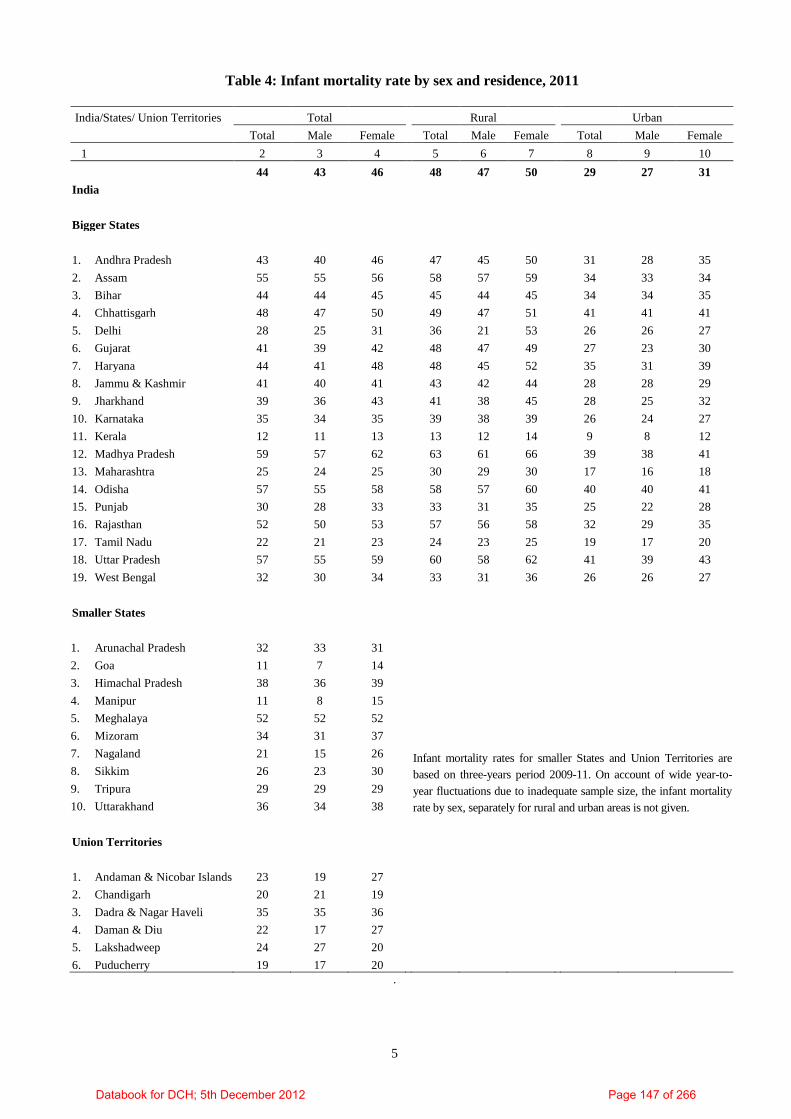
5
Table 4: Infant mortality rate by sex and residence, 2011
India/States/ Union Territories Total Rural Urban
Total Male Female Total Male Female Total Male Female
1 2 3 4 5 6 7 8 9 10
44 43 46 48 47 50 29 27 31
India
Bigger States
1. Andhra Pradesh 43 40 46 47 45 50 31 28 35
2. Assam 55 55 56 58 57 59 34 33 34
3. Bihar 44 44 45 45 44 45 34 34 35
4. Chhattisgarh 48 47 50 49 47 51 41 41 41
5. Delhi 28 25 31 36 21 53 26 26 27
6. Gujarat 41 39 42 48 47 49 27 23 30
7. Haryana 44 41 48 48 45 52 35 31 39
8. Jammu & Kashmir 41 40 41 43 42 44 28 28 29
9. Jharkhand 39 36 43 41 38 45 28 25 32
10. Karnataka 35 34 35 39 38 39 26 24 27
11. Kerala 12 11 13 13 12 14 9 8 12
12. Madhya Pradesh 59 57 62 63 61 66 39 38 41
13. Maharashtra 25 24 25 30 29 30 17 16 18
14. Odisha 57 55 58 58 57 60 40 40 41
15. Punjab 30 28 33 33 31 35 25 22 28
16. Rajasthan 52 50 53 57 56 58 32 29 35
17. Tamil Nadu 22 21 23 24 23 25 19 17 20
18. Uttar Pradesh 57 55 59 60 58 62 41 39 43
19. West Bengal 32 30 34 33 31 36 26 26 27
Smaller States
1. Arunachal Pradesh 32 33 31
2. Goa 11 7 14
3. Himachal Pradesh 38 36 39
4. Manipur 11 8 15
5. Meghalaya 52 52 52
6. Mizoram 34 31 37
7. Nagaland 21 15 26 Infant mortality rates for smaller States and Union Territories are
based on three-years period 2009-11. On account of wide year-to-
year fluctuations due to inadequate sample size, the infant mortality
rate by sex, separately for rural and urban areas is not given.
8. Sikkim 26 23 30
9. Tripura 29 29 29
10. Uttarakhand 36 34 38
Union Territories
1. Andaman & Nicobar Islands 23 19 27
2. Chandigarh 20 21 19
3. Dadra & Nagar Haveli 35 35 36
4. Daman & Diu 22 17 27
5. Lakshadweep 24 27 20
6. Puducherry 19 17 20
.
Databook for DCH; 5th December 2012 Page 147 of 266
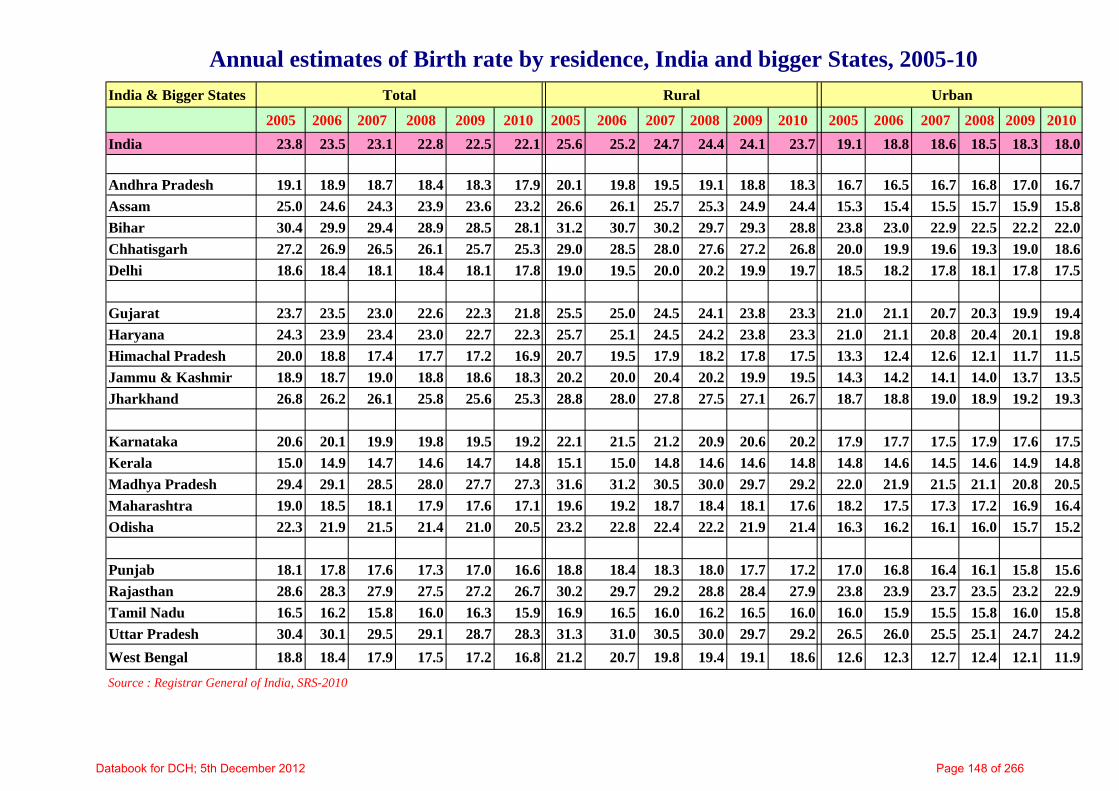
Annual estimates of Birth rate by residence, India and bigger States, 2005-10India & Bigger States Total Rural Urban
2005 2006 2007 2008 2009 2010 2005 2006 2007 2008 2009 2010 2005 2006 2007 2008 2009 2010India 23.8 23.5 23.1 22.8 22.5 22.1 25.6 25.2 24.7 24.4 24.1 23.7 19.1 18.8 18.6 18.5 18.3 18.0
Andhra Pradesh 19.1 18.9 18.7 18.4 18.3 17.9 20.1 19.8 19.5 19.1 18.8 18.3 16.7 16.5 16.7 16.8 17.0 16.7Assam 25.0 24.6 24.3 23.9 23.6 23.2 26.6 26.1 25.7 25.3 24.9 24.4 15.3 15.4 15.5 15.7 15.9 15.8Bihar 30.4 29.9 29.4 28.9 28.5 28.1 31.2 30.7 30.2 29.7 29.3 28.8 23.8 23.0 22.9 22.5 22.2 22.0Chhatisgarh 27.2 26.9 26.5 26.1 25.7 25.3 29.0 28.5 28.0 27.6 27.2 26.8 20.0 19.9 19.6 19.3 19.0 18.6Delhi 18.6 18.4 18.1 18.4 18.1 17.8 19.0 19.5 20.0 20.2 19.9 19.7 18.5 18.2 17.8 18.1 17.8 17.5
Gujarat 23.7 23.5 23.0 22.6 22.3 21.8 25.5 25.0 24.5 24.1 23.8 23.3 21.0 21.1 20.7 20.3 19.9 19.4Haryana 24.3 23.9 23.4 23.0 22.7 22.3 25.7 25.1 24.5 24.2 23.8 23.3 21.0 21.1 20.8 20.4 20.1 19.8Himachal Pradesh 20.0 18.8 17.4 17.7 17.2 16.9 20.7 19.5 17.9 18.2 17.8 17.5 13.3 12.4 12.6 12.1 11.7 11.5Jammu & Kashmir 18.9 18.7 19.0 18.8 18.6 18.3 20.2 20.0 20.4 20.2 19.9 19.5 14.3 14.2 14.1 14.0 13.7 13.5Jharkhand 26.8 26.2 26.1 25.8 25.6 25.3 28.8 28.0 27.8 27.5 27.1 26.7 18.7 18.8 19.0 18.9 19.2 19.3
Karnataka 20.6 20.1 19.9 19.8 19.5 19.2 22.1 21.5 21.2 20.9 20.6 20.2 17.9 17.7 17.5 17.9 17.6 17.5Kerala 15.0 14.9 14.7 14.6 14.7 14.8 15.1 15.0 14.8 14.6 14.6 14.8 14.8 14.6 14.5 14.6 14.9 14.8Madhya Pradesh 29.4 29.1 28.5 28.0 27.7 27.3 31.6 31.2 30.5 30.0 29.7 29.2 22.0 21.9 21.5 21.1 20.8 20.5Maharashtra 19.0 18.5 18.1 17.9 17.6 17.1 19.6 19.2 18.7 18.4 18.1 17.6 18.2 17.5 17.3 17.2 16.9 16.4Odisha 22.3 21.9 21.5 21.4 21.0 20.5 23.2 22.8 22.4 22.2 21.9 21.4 16.3 16.2 16.1 16.0 15.7 15.2
Punjab 18.1 17.8 17.6 17.3 17.0 16.6 18.8 18.4 18.3 18.0 17.7 17.2 17.0 16.8 16.4 16.1 15.8 15.6Rajasthan 28.6 28.3 27.9 27.5 27.2 26.7 30.2 29.7 29.2 28.8 28.4 27.9 23.8 23.9 23.7 23.5 23.2 22.9Tamil Nadu 16.5 16.2 15.8 16.0 16.3 15.9 16.9 16.5 16.0 16.2 16.5 16.0 16.0 15.9 15.5 15.8 16.0 15.8Uttar Pradesh 30.4 30.1 29.5 29.1 28.7 28.3 31.3 31.0 30.5 30.0 29.7 29.2 26.5 26.0 25.5 25.1 24.7 24.2West Bengal 18.8 18.4 17.9 17.5 17.2 16.8 21.2 20.7 19.8 19.4 19.1 18.6 12.6 12.3 12.7 12.4 12.1 11.9
Source : Registrar General of India, SRS-2010
Databook for DCH; 5th December 2012 Page 148 of 266
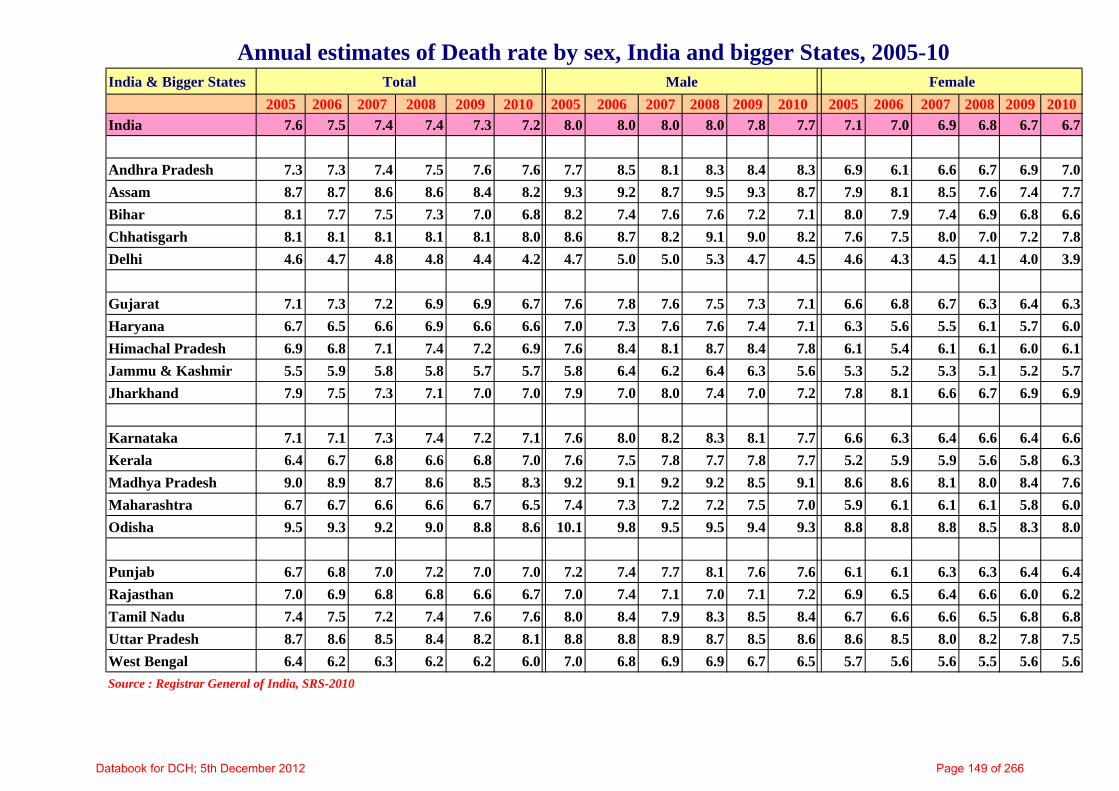
Annual estimates of Death rate by sex, India and bigger States, 2005-10India & Bigger States Total Male Female
2005 2006 2007 2008 2009 2010 2005 2006 2007 2008 2009 2010 2005 2006 2007 2008 2009 2010India 7.6 7.5 7.4 7.4 7.3 7.2 8.0 8.0 8.0 8.0 7.8 7.7 7.1 7.0 6.9 6.8 6.7 6.7
Andhra Pradesh 7.3 7.3 7.4 7.5 7.6 7.6 7.7 8.5 8.1 8.3 8.4 8.3 6.9 6.1 6.6 6.7 6.9 7.0Assam 8.7 8.7 8.6 8.6 8.4 8.2 9.3 9.2 8.7 9.5 9.3 8.7 7.9 8.1 8.5 7.6 7.4 7.7Bihar 8.1 7.7 7.5 7.3 7.0 6.8 8.2 7.4 7.6 7.6 7.2 7.1 8.0 7.9 7.4 6.9 6.8 6.6Chhatisgarh 8.1 8.1 8.1 8.1 8.1 8.0 8.6 8.7 8.2 9.1 9.0 8.2 7.6 7.5 8.0 7.0 7.2 7.8Delhi 4.6 4.7 4.8 4.8 4.4 4.2 4.7 5.0 5.0 5.3 4.7 4.5 4.6 4.3 4.5 4.1 4.0 3.9
Gujarat 7.1 7.3 7.2 6.9 6.9 6.7 7.6 7.8 7.6 7.5 7.3 7.1 6.6 6.8 6.7 6.3 6.4 6.3Haryana 6.7 6.5 6.6 6.9 6.6 6.6 7.0 7.3 7.6 7.6 7.4 7.1 6.3 5.6 5.5 6.1 5.7 6.0Himachal Pradesh 6.9 6.8 7.1 7.4 7.2 6.9 7.6 8.4 8.1 8.7 8.4 7.8 6.1 5.4 6.1 6.1 6.0 6.1Jammu & Kashmir 5.5 5.9 5.8 5.8 5.7 5.7 5.8 6.4 6.2 6.4 6.3 5.6 5.3 5.2 5.3 5.1 5.2 5.7Jharkhand 7.9 7.5 7.3 7.1 7.0 7.0 7.9 7.0 8.0 7.4 7.0 7.2 7.8 8.1 6.6 6.7 6.9 6.9
Karnataka 7.1 7.1 7.3 7.4 7.2 7.1 7.6 8.0 8.2 8.3 8.1 7.7 6.6 6.3 6.4 6.6 6.4 6.6Kerala 6.4 6.7 6.8 6.6 6.8 7.0 7.6 7.5 7.8 7.7 7.8 7.7 5.2 5.9 5.9 5.6 5.8 6.3Madhya Pradesh 9.0 8.9 8.7 8.6 8.5 8.3 9.2 9.1 9.2 9.2 8.5 9.1 8.6 8.6 8.1 8.0 8.4 7.6Maharashtra 6.7 6.7 6.6 6.6 6.7 6.5 7.4 7.3 7.2 7.2 7.5 7.0 5.9 6.1 6.1 6.1 5.8 6.0Odisha 9.5 9.3 9.2 9.0 8.8 8.6 10.1 9.8 9.5 9.5 9.4 9.3 8.8 8.8 8.8 8.5 8.3 8.0
Punjab 6.7 6.8 7.0 7.2 7.0 7.0 7.2 7.4 7.7 8.1 7.6 7.6 6.1 6.1 6.3 6.3 6.4 6.4Rajasthan 7.0 6.9 6.8 6.8 6.6 6.7 7.0 7.4 7.1 7.0 7.1 7.2 6.9 6.5 6.4 6.6 6.0 6.2Tamil Nadu 7.4 7.5 7.2 7.4 7.6 7.6 8.0 8.4 7.9 8.3 8.5 8.4 6.7 6.6 6.6 6.5 6.8 6.8Uttar Pradesh 8.7 8.6 8.5 8.4 8.2 8.1 8.8 8.8 8.9 8.7 8.5 8.6 8.6 8.5 8.0 8.2 7.8 7.5West Bengal 6.4 6.2 6.3 6.2 6.2 6.0 7.0 6.8 6.9 6.9 6.7 6.5 5.7 5.6 5.6 5.5 5.6 5.6Source : Registrar General of India, SRS-2010
Databook for DCH; 5th December 2012 Page 149 of 266
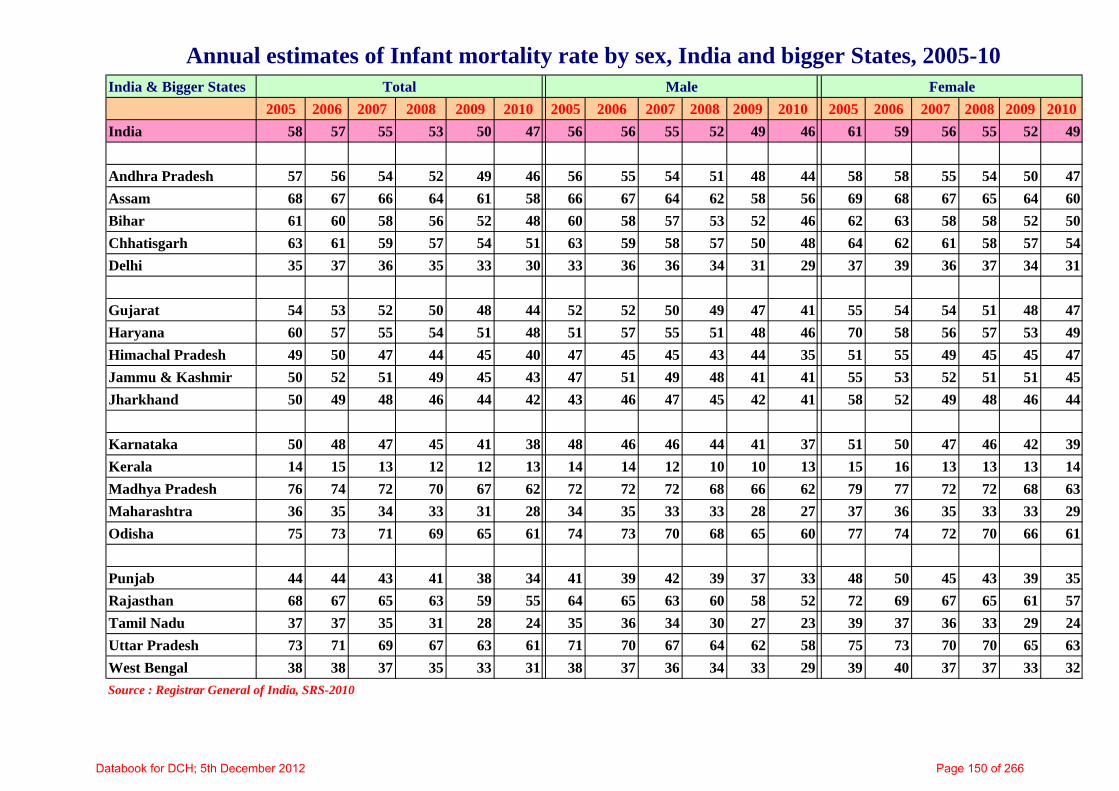
Annual estimates of Infant mortality rate by sex, India and bigger States, 2005-10India & Bigger States Total Male Female
2005 2006 2007 2008 2009 2010 2005 2006 2007 2008 2009 2010 2005 2006 2007 2008 2009 2010India 58 57 55 53 50 47 56 56 55 52 49 46 61 59 56 55 52 49
Andhra Pradesh 57 56 54 52 49 46 56 55 54 51 48 44 58 58 55 54 50 47Assam 68 67 66 64 61 58 66 67 64 62 58 56 69 68 67 65 64 60Bihar 61 60 58 56 52 48 60 58 57 53 52 46 62 63 58 58 52 50Chhatisgarh 63 61 59 57 54 51 63 59 58 57 50 48 64 62 61 58 57 54Delhi 35 37 36 35 33 30 33 36 36 34 31 29 37 39 36 37 34 31
Gujarat 54 53 52 50 48 44 52 52 50 49 47 41 55 54 54 51 48 47Haryana 60 57 55 54 51 48 51 57 55 51 48 46 70 58 56 57 53 49Himachal Pradesh 49 50 47 44 45 40 47 45 45 43 44 35 51 55 49 45 45 47Jammu & Kashmir 50 52 51 49 45 43 47 51 49 48 41 41 55 53 52 51 51 45Jharkhand 50 49 48 46 44 42 43 46 47 45 42 41 58 52 49 48 46 44
Karnataka 50 48 47 45 41 38 48 46 46 44 41 37 51 50 47 46 42 39Kerala 14 15 13 12 12 13 14 14 12 10 10 13 15 16 13 13 13 14Madhya Pradesh 76 74 72 70 67 62 72 72 72 68 66 62 79 77 72 72 68 63Maharashtra 36 35 34 33 31 28 34 35 33 33 28 27 37 36 35 33 33 29Odisha 75 73 71 69 65 61 74 73 70 68 65 60 77 74 72 70 66 61
Punjab 44 44 43 41 38 34 41 39 42 39 37 33 48 50 45 43 39 35Rajasthan 68 67 65 63 59 55 64 65 63 60 58 52 72 69 67 65 61 57Tamil Nadu 37 37 35 31 28 24 35 36 34 30 27 23 39 37 36 33 29 24Uttar Pradesh 73 71 69 67 63 61 71 70 67 64 62 58 75 73 70 70 65 63West Bengal 38 38 37 35 33 31 38 37 36 34 33 29 39 40 37 37 33 32Source : Registrar General of India, SRS-2010
Databook for DCH; 5th December 2012 Page 150 of 266
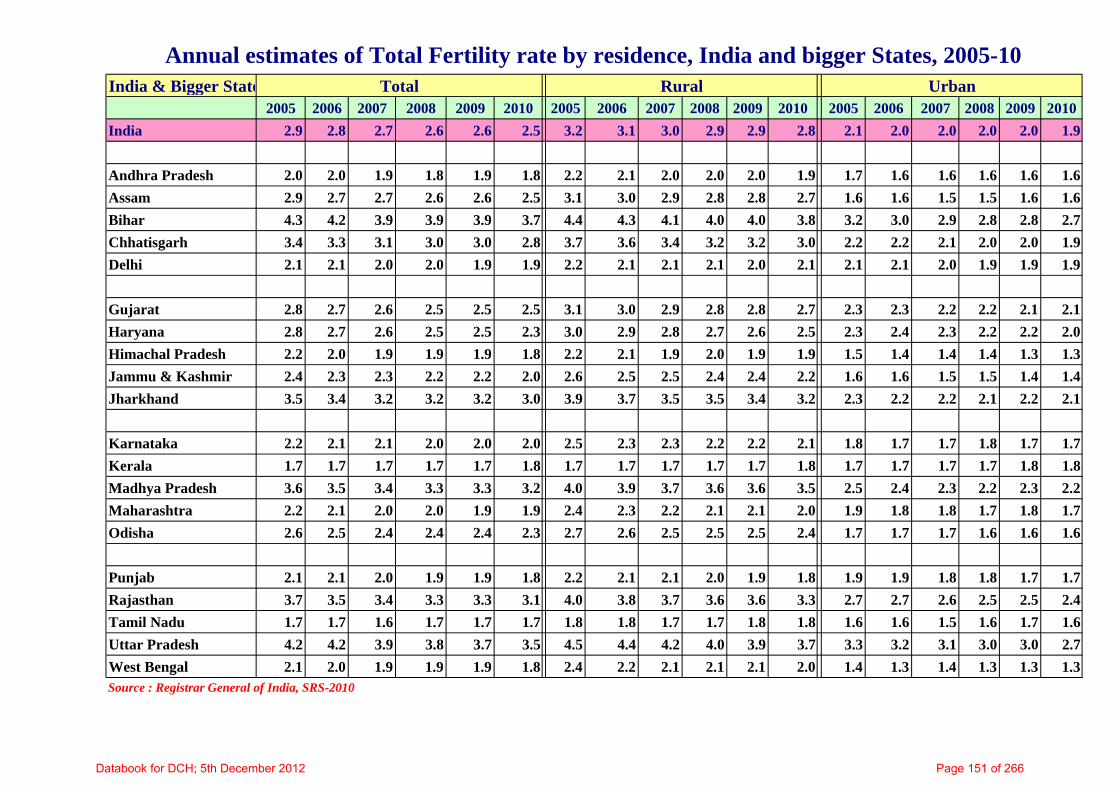
e
Annual estimates of Total Fertility rate by residence, India and bigger States, 2005-10India & Bigger Stat Total Rural Urban
2005 2006 2007 2008 2009 2010 2005 2006 2007 2008 2009 2010 2005 2006 2007 2008 2009 2010India 2.9 2.8 2.7 2.6 2.6 2.5 3.2 3.1 3.0 2.9 2.9 2.8 2.1 2.0 2.0 2.0 2.0 1.9
Andhra Pradesh 2.0 2.0 1.9 1.8 1.9 1.8 2.2 2.1 2.0 2.0 2.0 1.9 1.7 1.6 1.6 1.6 1.6 1.6Assam 2.9 2.7 2.7 2.6 2.6 2.5 3.1 3.0 2.9 2.8 2.8 2.7 1.6 1.6 1.5 1.5 1.6 1.6Bihar 4.3 4.2 3.9 3.9 3.9 3.7 4.4 4.3 4.1 4.0 4.0 3.8 3.2 3.0 2.9 2.8 2.8 2.7Chhatisgarh 3.4 3.3 3.1 3.0 3.0 2.8 3.7 3.6 3.4 3.2 3.2 3.0 2.2 2.2 2.1 2.0 2.0 1.9Delhi 2.1 2.1 2.0 2.0 1.9 1.9 2.2 2.1 2.1 2.1 2.0 2.1 2.1 2.1 2.0 1.9 1.9 1.9
Gujarat 2.8 2.7 2.6 2.5 2.5 2.5 3.1 3.0 2.9 2.8 2.8 2.7 2.3 2.3 2.2 2.2 2.1 2.1Haryana 2.8 2.7 2.6 2.5 2.5 2.3 3.0 2.9 2.8 2.7 2.6 2.5 2.3 2.4 2.3 2.2 2.2 2.0Himachal Pradesh 2.2 2.0 1.9 1.9 1.9 1.8 2.2 2.1 1.9 2.0 1.9 1.9 1.5 1.4 1.4 1.4 1.3 1.3Jammu & Kashmir 2.4 2.3 2.3 2.2 2.2 2.0 2.6 2.5 2.5 2.4 2.4 2.2 1.6 1.6 1.5 1.5 1.4 1.4Jharkhand 3.5 3.4 3.2 3.2 3.2 3.0 3.9 3.7 3.5 3.5 3.4 3.2 2.3 2.2 2.2 2.1 2.2 2.1
Karnataka 2.2 2.1 2.1 2.0 2.0 2.0 2.5 2.3 2.3 2.2 2.2 2.1 1.8 1.7 1.7 1.8 1.7 1.7Kerala 1.7 1.7 1.7 1.7 1.7 1.8 1.7 1.7 1.7 1.7 1.7 1.8 1.7 1.7 1.7 1.7 1.8 1.8Madhya Pradesh 3.6 3.5 3.4 3.3 3.3 3.2 4.0 3.9 3.7 3.6 3.6 3.5 2.5 2.4 2.3 2.2 2.3 2.2Maharashtra 2.2 2.1 2.0 2.0 1.9 1.9 2.4 2.3 2.2 2.1 2.1 2.0 1.9 1.8 1.8 1.7 1.8 1.7Odisha 2.6 2.5 2.4 2.4 2.4 2.3 2.7 2.6 2.5 2.5 2.5 2.4 1.7 1.7 1.7 1.6 1.6 1.6
Punjab 2.1 2.1 2.0 1.9 1.9 1.8 2.2 2.1 2.1 2.0 1.9 1.8 1.9 1.9 1.8 1.8 1.7 1.7Rajasthan 3.7 3.5 3.4 3.3 3.3 3.1 4.0 3.8 3.7 3.6 3.6 3.3 2.7 2.7 2.6 2.5 2.5 2.4Tamil Nadu 1.7 1.7 1.6 1.7 1.7 1.7 1.8 1.8 1.7 1.7 1.8 1.8 1.6 1.6 1.5 1.6 1.7 1.6Uttar Pradesh 4.2 4.2 3.9 3.8 3.7 3.5 4.5 4.4 4.2 4.0 3.9 3.7 3.3 3.2 3.1 3.0 3.0 2.7West Bengal 2.1 2.0 1.9 1.9 1.9 1.8 2.4 2.2 2.1 2.1 2.1 2.0 1.4 1.3 1.4 1.3 1.3 1.3Source : Registrar General of India, SRS-2010
Databook for DCH; 5th December 2012 Page 151 of 266

7
Source : Registrar General of India, SRS-2010
Sex ratio at birth (female per 1000 male) by residence, India and bigger States, 2004-06 to 2008-10India & Bigger States Total Rural Urban
2004-06 2005-07 2006-08 2007-09 2008-10 2004-06 2005-0 2006-08 2007-09 2008-10 2004-06 2005-07 2006-08 2007-09 2008-10
India 892 901 904 906 905 895 904 907 909 907 881 891 894 897 898
Andhra Pradesh 917 915 917 919 920 909 911 913 915 921 941 928 930 932 919Assam 920 939 933 931 928 922 942 936 936 933 905 911 900 891 889Bihar 881 909 914 917 912 884 912 917 920 914 847 876 880 886 890Chhattisgarh 961 969 975 980 985 967 978 985 990 995 929 913 914 915 922Delhi 847 871 877 882 884 810 867 873 878 879 854 871 877 882 885
Gujarat 865 891 898 904 903 886 915 922 929 920 827 848 856 859 873Haryana 837 843 847 849 848 838 851 853 855 853 834 822 829 834 836Himachal Pradesh 872 931 938 944 942 870 931 939 947 944 888 926 916 906 915Jammu & Kashmir 838 854 862 870 873 834 851 859 867 870 861 866 879 886 888Jharkhand 888 927 922 921 919 896 937 935 935 932 838 867 846 843 851
Karnataka 917 926 935 944 943 908 924 935 944 948 938 932 937 942 934Kerala 922 958 964 968 966 910 957 962 966 963 962 962 970 975 974Madhya Pradesh 913 913 919 926 921 914 913 919 926 920 907 912 921 928 927Maharashtra 879 871 884 896 895 879 866 878 889 888 878 879 893 908 906Odisha 934 933 937 941 938 937 934 939 944 940 908 919 917 913 918
Punjab 808 837 836 836 831 813 827 827 828 820 800 855 852 851 852Rajasthan 855 865 870 875 877 855 868 875 882 884 856 852 849 846 850Tamil Nadu 955 944 936 929 927 970 940 935 932 930 933 950 937 925 923Uttar Pradesh 874 881 877 874 870 876 883 878 874 869 866 871 875 877 878West Bengal 931 936 941 944 938 937 932 938 943 935 903 951 950 949 951
Databook for DCH; 5th December 2012 Page 152 of 266
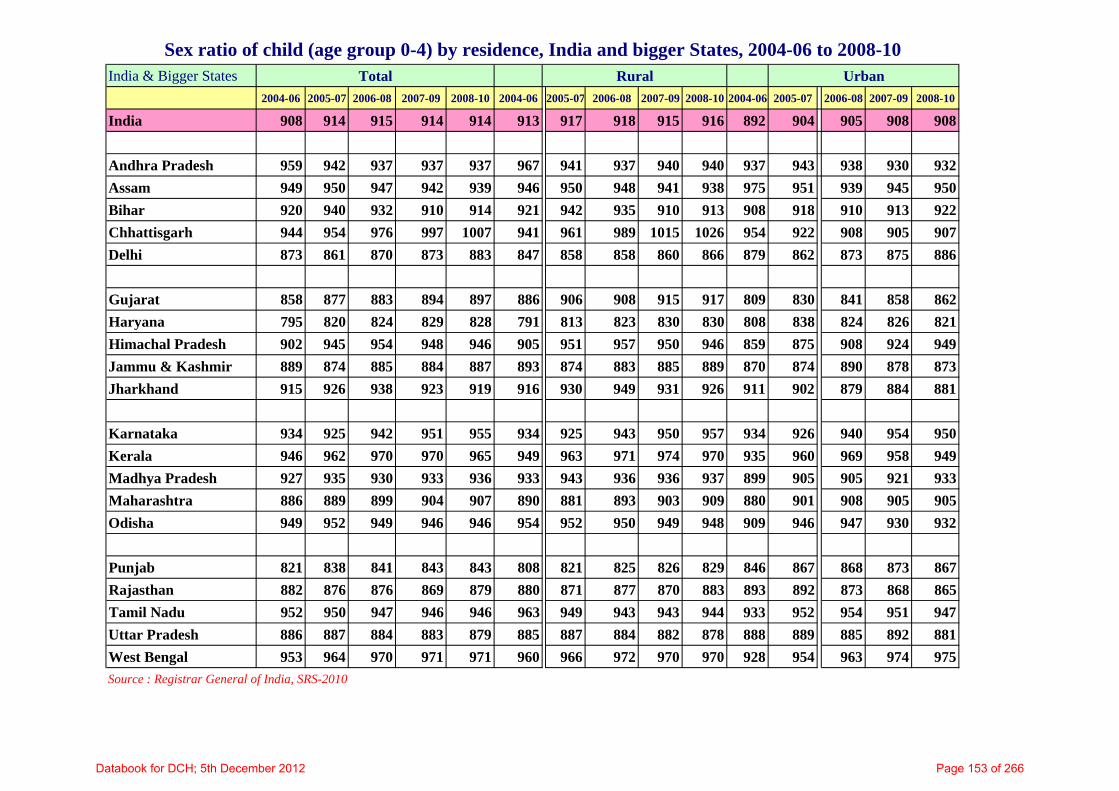
7
Delhi 873 861 870 873 883 847 858 858 860 866 879 862 873 875 886
Jharkhand 915 926 938 923 919 916 930 949 931 926 911 902 879 884 881
Odisha 949 952 949 946 946 954 952 950 949 948 909 946 947 930 932
Source : Registrar General of India, SRS-2010
Sex ratio of child (age group 0-4) by residence, India and bigger States, 2004-06 to 2008-10India & Bigger States Total Rural Urban
2004-06 2005-07 2006-08 2007-09 2008-10 2004-06 2005-0 2006-08 2007-09 2008-10 2004-06 2005-07 2006-08 2007-09 2008-10
India 908 914 915 914 914 913 917 918 915 916 892 904 905 908 908
Andhra Pradesh 959 942 937 937 937 967 941 937 940 940 937 943 938 930 932Assam 949 950 947 942 939 946 950 948 941 938 975 951 939 945 950Bihar 920 940 932 910 914 921 942 935 910 913 908 918 910 913 922Chhattisgarh 944 954 976 997 1007 941 961 989 1015 1026 954 922 908 905 907
Gujarat 858 877 883 894 897 886 906 908 915 917 809 830 841 858 862Haryana 795 820 824 829 828 791 813 823 830 830 808 838 824 826 821Himachal Pradesh 902 945 954 948 946 905 951 957 950 946 859 875 908 924 949Jammu & Kashmir 889 874 885 884 887 893 874 883 885 889 870 874 890 878 873
Karnataka 934 925 942 951 955 934 925 943 950 957 934 926 940 954 950Kerala 946 962 970 970 965 949 963 971 974 970 935 960 969 958 949Madhya Pradesh 927 935 930 933 936 933 943 936 936 937 899 905 905 921 933Maharashtra 886 889 899 904 907 890 881 893 903 909 880 901 908 905 905
Punjab 821 838 841 843 843 808 821 825 826 829 846 867 868 873 867Rajasthan 882 876 876 869 879 880 871 877 870 883 893 892 873 868 865Tamil Nadu 952 950 947 946 946 963 949 943 943 944 933 952 954 951 947Uttar Pradesh 886 887 884 883 879 885 887 884 882 878 888 889 885 892 881West Bengal 953 964 970 971 971 960 966 972 970 970 928 954 963 974 975
Databook for DCH; 5th December 2012 Page 153 of 266
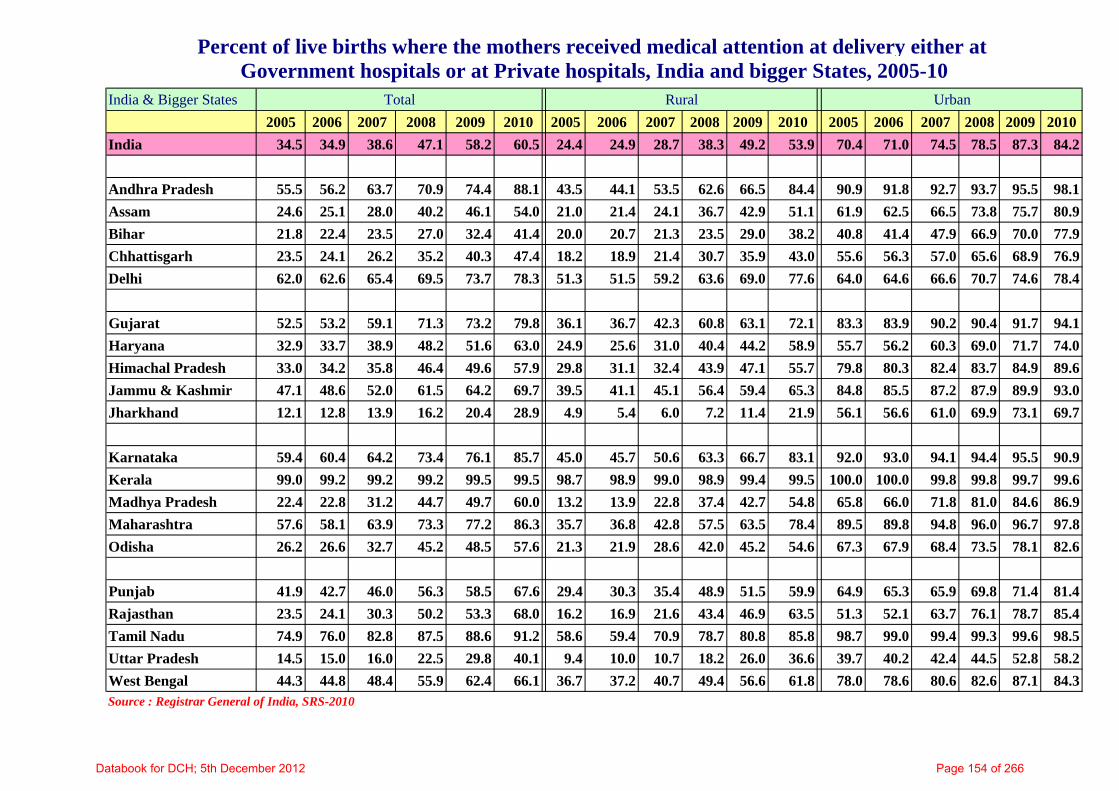
India 34.5 34.9 38.6 47.1 58.2 60.5 24.4 24.9 28.7 38.3 49.2 53.9 70.4 71.0 74.5 78.5 87.3 84.2
Delhi 62.0 62.6 65.4 69.5 73.7 78.3 51.3 51.5 59.2 63.6 69.0 77.6 64.0 64.6 66.6 70.7 74.6 78.4
Jharkhand 12.1 12.8 13.9 16.2 20.4 28.9 4.9 5.4 6.0 7.2 11.4 21.9 56.1 56.6 61.0 69.9 73.1 69.7
Odisha 26.2 26.6 32.7 45.2 48.5 57.6 21.3 21.9 28.6 42.0 45.2 54.6 67.3 67.9 68.4 73.5 78.1 82.6
Source : Registrar General of India, SRS-2010
Percent of live births where the mothers received medical attention at delivery either at Government hospitals or at Private hospitals, India and bigger States, 2005-10
India & Bigger States Total Rural Urban2005 2006 2007 2008 2009 2010 2005 2006 2007 2008 2009 2010 2005 2006 2007 2008 2009 2010
Andhra Pradesh 55.5 56.2 63.7 70.9 74.4 88.1 43.5 44.1 53.5 62.6 66.5 84.4 90.9 91.8 92.7 93.7 95.5 98.1Assam 24.6 25.1 28.0 40.2 46.1 54.0 21.0 21.4 24.1 36.7 42.9 51.1 61.9 62.5 66.5 73.8 75.7 80.9Bihar 21.8 22.4 23.5 27.0 32.4 41.4 20.0 20.7 21.3 23.5 29.0 38.2 40.8 41.4 47.9 66.9 70.0 77.9Chhattisgarh 23.5 24.1 26.2 35.2 40.3 47.4 18.2 18.9 21.4 30.7 35.9 43.0 55.6 56.3 57.0 65.6 68.9 76.9
Gujarat 52.5 53.2 59.1 71.3 73.2 79.8 36.1 36.7 42.3 60.8 63.1 72.1 83.3 83.9 90.2 90.4 91.7 94.1Haryana 32.9 33.7 38.9 48.2 51.6 63.0 24.9 25.6 31.0 40.4 44.2 58.9 55.7 56.2 60.3 69.0 71.7 74.0Himachal Pradesh 33.0 34.2 35.8 46.4 49.6 57.9 29.8 31.1 32.4 43.9 47.1 55.7 79.8 80.3 82.4 83.7 84.9 89.6Jammu & Kashmir 47.1 48.6 52.0 61.5 64.2 69.7 39.5 41.1 45.1 56.4 59.4 65.3 84.8 85.5 87.2 87.9 89.9 93.0
Karnataka 59.4 60.4 64.2 73.4 76.1 85.7 45.0 45.7 50.6 63.3 66.7 83.1 92.0 93.0 94.1 94.4 95.5 90.9Kerala 99.0 99.2 99.2 99.2 99.5 99.5 98.7 98.9 99.0 98.9 99.4 99.5 100.0 100.0 99.8 99.8 99.7 99.6Madhya Pradesh 22.4 22.8 31.2 44.7 49.7 60.0 13.2 13.9 22.8 37.4 42.7 54.8 65.8 66.0 71.8 81.0 84.6 86.9Maharashtra 57.6 58.1 63.9 73.3 77.2 86.3 35.7 36.8 42.8 57.5 63.5 78.4 89.5 89.8 94.8 96.0 96.7 97.8
Punjab 41.9 42.7 46.0 56.3 58.5 67.6 29.4 30.3 35.4 48.9 51.5 59.9 64.9 65.3 65.9 69.8 71.4 81.4Rajasthan 23.5 24.1 30.3 50.2 53.3 68.0 16.2 16.9 21.6 43.4 46.9 63.5 51.3 52.1 63.7 76.1 78.7 85.4Tamil Nadu 74.9 76.0 82.8 87.5 88.6 91.2 58.6 59.4 70.9 78.7 80.8 85.8 98.7 99.0 99.4 99.3 99.6 98.5Uttar Pradesh 14.5 15.0 16.0 22.5 29.8 40.1 9.4 10.0 10.7 18.2 26.0 36.6 39.7 40.2 42.4 44.5 52.8 58.2West Bengal 44.3 44.8 48.4 55.9 62.4 66.1 36.7 37.2 40.7 49.4 56.6 61.8 78.0 78.6 80.6 82.6 87.1 84.3
Databook for DCH; 5th December 2012 Page 154 of 266
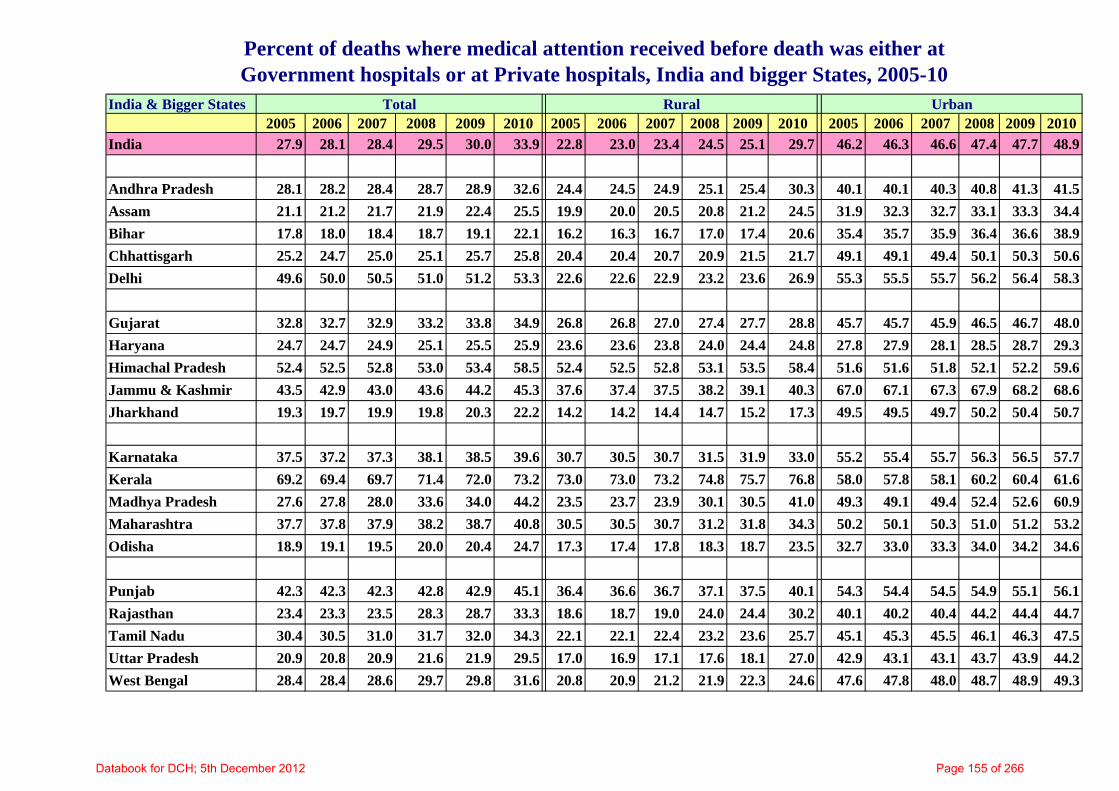
India 27.9 28.1 28.4 29.5 30.0 33.9 22.8 23.0 23.4 24.5 25.1 29.7 46.2 46.3 46.6 47.4 47.7 48.9
Delhi 49.6 50.0 50.5 51.0 51.2 53.3 22.6 22.6 22.9 23.2 23.6 26.9 55.3 55.5 55.7 56.2 56.4 58.3
Jharkhand 19.3 19.7 19.9 19.8 20.3 22.2 14.2 14.2 14.4 14.7 15.2 17.3 49.5 49.5 49.7 50.2 50.4 50.7
Odisha 18.9 19.1 19.5 20.0 20.4 24.7 17.3 17.4 17.8 18.3 18.7 23.5 32.7 33.0 33.3 34.0 34.2 34.6
Percent of deaths where medical attention received before death was either atGovernment hospitals or at Private hospitals, India and bigger States, 2005-10
India & Bigger States Total Rural Urban2005 2006 2007 2008 2009 2010 2005 2006 2007 2008 2009 2010 2005 2006 2007 2008 2009 2010
Andhra Pradesh 28.1 28.2 28.4 28.7 28.9 32.6 24.4 24.5 24.9 25.1 25.4 30.3 40.1 40.1 40.3 40.8 41.3 41.5Assam 21.1 21.2 21.7 21.9 22.4 25.5 19.9 20.0 20.5 20.8 21.2 24.5 31.9 32.3 32.7 33.1 33.3 34.4Bihar 17.8 18.0 18.4 18.7 19.1 22.1 16.2 16.3 16.7 17.0 17.4 20.6 35.4 35.7 35.9 36.4 36.6 38.9Chhattisgarh 25.2 24.7 25.0 25.1 25.7 25.8 20.4 20.4 20.7 20.9 21.5 21.7 49.1 49.1 49.4 50.1 50.3 50.6
Gujarat 32.8 32.7 32.9 33.2 33.8 34.9 26.8 26.8 27.0 27.4 27.7 28.8 45.7 45.7 45.9 46.5 46.7 48.0Haryana 24.7 24.7 24.9 25.1 25.5 25.9 23.6 23.6 23.8 24.0 24.4 24.8 27.8 27.9 28.1 28.5 28.7 29.3Himachal Pradesh 52.4 52.5 52.8 53.0 53.4 58.5 52.4 52.5 52.8 53.1 53.5 58.4 51.6 51.6 51.8 52.1 52.2 59.6Jammu & Kashmir 43.5 42.9 43.0 43.6 44.2 45.3 37.6 37.4 37.5 38.2 39.1 40.3 67.0 67.1 67.3 67.9 68.2 68.6
Karnataka 37.5 37.2 37.3 38.1 38.5 39.6 30.7 30.5 30.7 31.5 31.9 33.0 55.2 55.4 55.7 56.3 56.5 57.7Kerala 69.2 69.4 69.7 71.4 72.0 73.2 73.0 73.0 73.2 74.8 75.7 76.8 58.0 57.8 58.1 60.2 60.4 61.6Madhya Pradesh 27.6 27.8 28.0 33.6 34.0 44.2 23.5 23.7 23.9 30.1 30.5 41.0 49.3 49.1 49.4 52.4 52.6 60.9Maharashtra 37.7 37.8 37.9 38.2 38.7 40.8 30.5 30.5 30.7 31.2 31.8 34.3 50.2 50.1 50.3 51.0 51.2 53.2
Punjab 42.3 42.3 42.3 42.8 42.9 45.1 36.4 36.6 36.7 37.1 37.5 40.1 54.3 54.4 54.5 54.9 55.1 56.1Rajasthan 23.4 23.3 23.5 28.3 28.7 33.3 18.6 18.7 19.0 24.0 24.4 30.2 40.1 40.2 40.4 44.2 44.4 44.7Tamil Nadu 30.4 30.5 31.0 31.7 32.0 34.3 22.1 22.1 22.4 23.2 23.6 25.7 45.1 45.3 45.5 46.1 46.3 47.5Uttar Pradesh 20.9 20.8 20.9 21.6 21.9 29.5 17.0 16.9 17.1 17.6 18.1 27.0 42.9 43.1 43.1 43.7 43.9 44.2West Bengal 28.4 28.4 28.6 29.7 29.8 31.6 20.8 20.9 21.2 21.9 22.3 24.6 47.6 47.8 48.0 48.7 48.9 49.3
Databook for DCH; 5th December 2012 Page 155 of 266
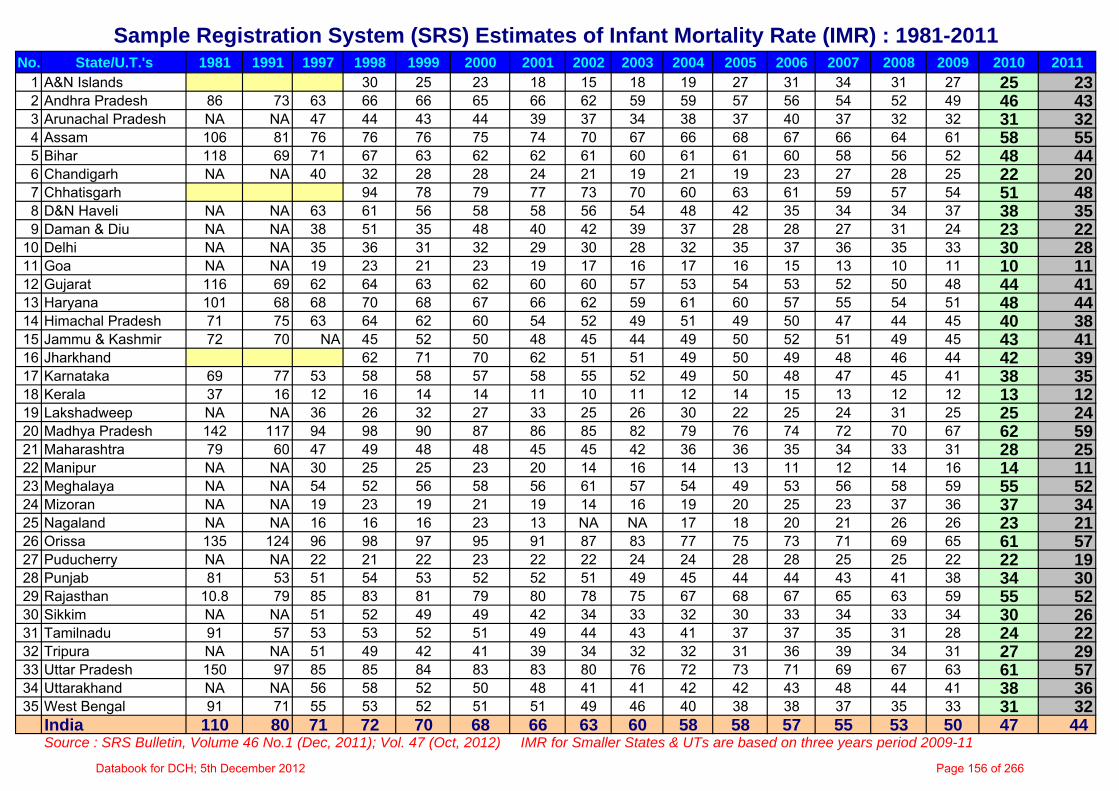
Sample Registration System (SRS) Estimates of Infant Mortality Rate (IMR) : 1981-2011No. State/U.T.'s 1981 1991 1997 1998 1999 2000 2001 2002 2003 2004 2005 2006 2007 2008 2009 2010 2011
1 A&N Islands 30 25 23 18 15 18 19 27 31 34 31 27 25 232 Andhra Pradesh 86 73 63 66 66 65 66 62 59 59 57 56 54 52 49 46 433 Arunachal Pradesh NA NA 47 44 43 44 39 37 34 38 37 40 37 32 32 31 324 Assam 106 81 76 76 76 75 74 70 67 66 68 67 66 64 61 58 555 Bihar 118 69 71 67 63 62 62 61 60 61 61 60 58 56 52 48 446 Chandigarh NA NA 40 32 28 28 24 21 19 21 19 23 27 28 25 22 207 Chhatisgarh 94 78 79 77 73 70 60 63 61 59 57 54 51 488 D&N Haveli NA NA 63 61 56 58 58 56 54 48 42 35 34 34 37 38 359 Daman & Diu NA NA 38 51 35 48 40 42 39 37 28 28 27 31 24 23 22
10 Delhi NA NA 35 36 31 32 29 30 28 32 35 37 36 35 33 30 2811 Goa NA NA 19 23 21 23 19 17 16 17 16 15 13 10 11 10 1112 Gujarat 116 69 62 64 63 62 60 60 57 53 54 53 52 50 48 44 4113 Haryana 101 68 68 70 68 67 66 62 59 61 60 57 55 54 51 48 4414 Himachal Pradesh 71 75 63 64 62 60 54 52 49 51 49 50 47 44 45 40 3815 Jammu & Kashmir 72 70 NA 45 52 50 48 45 44 49 50 52 51 49 45 43 4116 Jharkhand 62 71 70 62 51 51 49 50 49 48 46 44 42 3917 Karnataka 69 77 53 58 58 57 58 55 52 49 50 48 47 45 41 38 3518 Kerala 37 16 12 16 14 14 11 10 11 12 14 15 13 12 12 13 1219 Lakshadweep NA NA 36 26 32 27 33 25 26 30 22 25 24 31 25 25 2420 Madhya Pradesh 142 117 94 98 90 87 86 85 82 79 76 74 72 70 67 62 5921 Maharashtra 79 60 47 49 48 48 45 45 42 36 36 35 34 33 31 28 2522 Manipur NA NA 30 25 25 23 20 14 16 14 13 11 12 14 16 14 1123 Meghalaya NA NA 54 52 56 58 56 61 57 54 49 53 56 58 59 55 5224 Mizoran NA NA 19 23 19 21 19 14 16 19 20 25 23 37 36 37 3425 Nagaland NA NA 16 16 16 23 13 NA NA 17 18 20 21 26 26 23 2126 Orissa 135 124 96 98 97 95 91 87 83 77 75 73 71 69 65 61 5727 Puducherry NA NA 22 21 22 23 22 22 24 24 28 28 25 25 22 22 1928 Punjab 81 53 51 54 53 52 52 51 49 45 44 44 43 41 38 34 3029 Rajasthan 10.8 79 85 83 81 79 80 78 75 67 68 67 65 63 59 55 5230 Sikkim NA NA 51 52 49 49 42 34 33 32 30 33 34 33 34 30 2631 Tamilnadu 91 57 53 53 52 51 49 44 43 41 37 37 35 31 28 24 2232 Tripura NA NA 51 49 42 41 39 34 32 32 31 36 39 34 31 27 2933 Uttar Pradesh 150 97 85 85 84 83 83 80 76 72 73 71 69 67 63 61 5734 Uttarakhand NA NA 56 58 52 50 48 41 41 42 42 43 48 44 41 38 3635 West Bengal 91 71 55 53 52 51 51 49 46 40 38 38 37 35 33 31 32
India 110 80 71 72 70 68 66 63 60 58 58 57 55 53 50 47 44Source : SRS Bulletin, Volume 46 No.1 (Dec, 2011); Vol. 47 (Oct, 2012) IMR for Smaller States & UTs are based on three years period 2009-11
Databook for DCH; 5th December 2012 Page 156 of 266
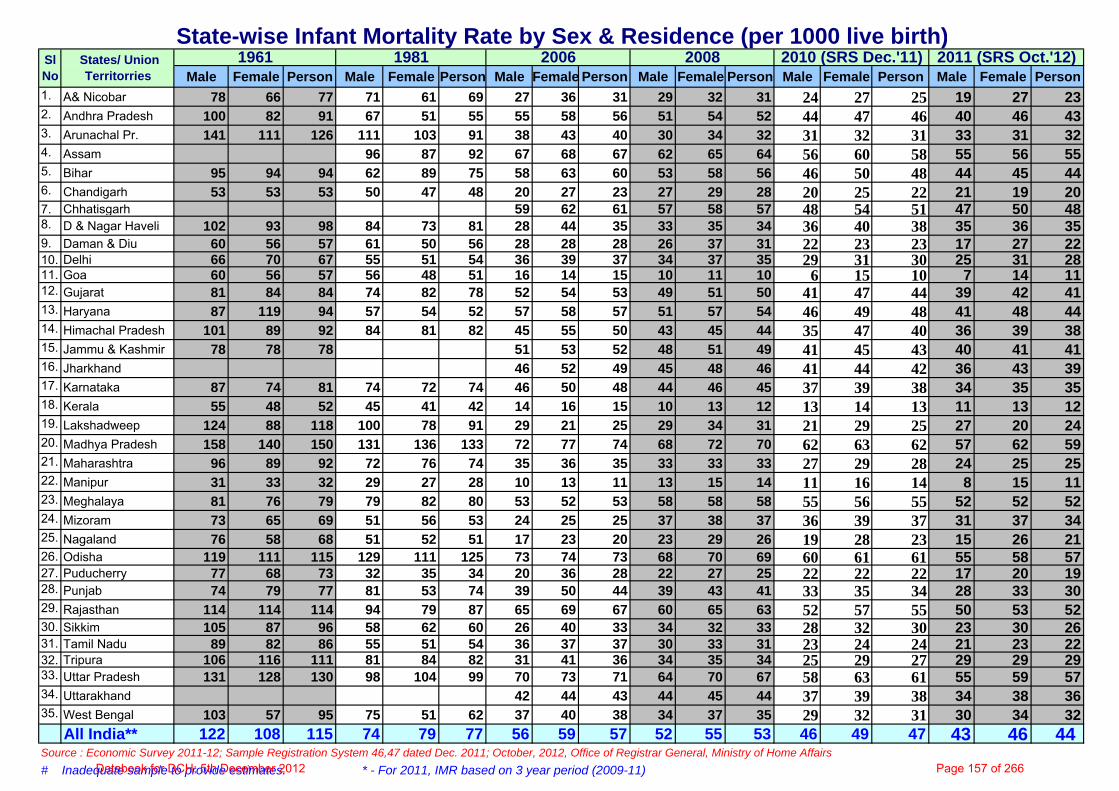
e
State-wise Infant Mortality Rate by Sex & Residence (per 1000 live birth)Sl
No
States/ Union
Territorries
1961 1981 2006 2008 2010 (SRS Dec.'11) 2011 (SRS Oct.'12)
Male Female Person Male Female Person Male Femal Person Male Female Person Male Female Person Male Female Person
1. A& Nicobar 78 66 77 71 61 69 27 36 31 29 32 31 24 27 25 19 27 232. Andhra Pradesh 100 82 91 67 51 55 55 58 56 51 54 52 44 47 46 40 46 433. Arunachal Pr. 141 111 126 111 103 91 38 43 40 30 34 32 31 32 31 33 31 324. Assam 96 87 92 67 68 67 62 65 64 56 60 58 55 56 555. Bihar 95 94 94 62 89 75 58 63 60 53 58 56 46 50 48 44 45 446. Chandigarh 53 53 53 50 47 48 20 27 23 27 29 28 20 25 22 21 19 207. Chhatisgarh 59 62 61 57 58 57 48 54 51 47 50 488. D & Nagar Haveli 102 93 98 84 73 81 28 44 35 33 35 34 36 40 38 35 36 359. Daman & Diu 60 56 57 61 50 56 28 28 28 26 37 31 22 23 23 17 27 2210. Delhi 66 70 67 55 51 54 36 39 37 34 37 35 29 31 30 25 31 2811. Goa 60 56 57 56 48 51 16 14 15 10 11 10 6 15 10 7 14 1112. Gujarat 81 84 84 74 82 78 52 54 53 49 51 50 41 47 44 39 42 4113. Haryana 87 119 94 57 54 52 57 58 57 51 57 54 46 49 48 41 48 4414. Himachal Pradesh 101 89 92 84 81 82 45 55 50 43 45 44 35 47 40 36 39 3815. Jammu & Kashmir 78 78 78 51 53 52 48 51 49 41 45 43 40 41 4116. Jharkhand 46 52 49 45 48 46 41 44 42 36 43 3917. Karnataka 87 74 81 74 72 74 46 50 48 44 46 45 37 39 38 34 35 3518. Kerala 55 48 52 45 41 42 14 16 15 10 13 12 13 14 13 11 13 1219. Lakshadweep 124 88 118 100 78 91 29 21 25 29 34 31 21 29 25 27 20 2420. Madhya Pradesh 158 140 150 131 136 133 72 77 74 68 72 70 62 63 62 57 62 5921. Maharashtra 96 89 92 72 76 74 35 36 35 33 33 33 27 29 28 24 25 2522. Manipur 31 33 32 29 27 28 10 13 11 13 15 14 11 16 14 8 15 1123. Meghalaya 81 76 79 79 82 80 53 52 53 58 58 58 55 56 55 52 52 5224. Mizoram 73 65 69 51 56 53 24 25 25 37 38 37 36 39 37 31 37 3425. Nagaland 76 58 68 51 52 51 17 23 20 23 29 26 19 28 23 15 26 2126. Odisha 119 111 115 129 111 125 73 74 73 68 70 69 60 61 61 55 58 5727. Puducherry 77 68 73 32 35 34 20 36 28 22 27 25 22 22 22 17 20 1928. Punjab 74 79 77 81 53 74 39 50 44 39 43 41 33 35 34 28 33 3029. Rajasthan 114 114 114 94 79 87 65 69 67 60 65 63 52 57 55 50 53 5230. Sikkim 105 87 96 58 62 60 26 40 33 34 32 33 28 32 30 23 30 2631. Tamil Nadu 89 82 86 55 51 54 36 37 37 30 33 31 23 24 24 21 23 2232. Tripura 106 116 111 81 84 82 31 41 36 34 35 34 25 29 27 29 29 2933. Uttar Pradesh 131 128 130 98 104 99 70 73 71 64 70 67 58 63 61 55 59 5734. Uttarakhand 42 44 43 44 45 44 37 39 38 34 38 3635. West Bengal 103 57 95 75 51 62 37 40 38 34 37 35 29 32 31 30 34 32
All India** 122 108 115 74 79 77 56 59 57 52 55 53 46 49 47 43 46 44Source : Economic Survey 2011-12; Sample Registration System 46,47 dated Dec. 2011; October, 2012, Office of Registrar General, Ministry of Home Affairs# Inadequate sample to provide estimates. * - For 2011, IMR based on 3 year period (2009-11)Databook for DCH; 5th December 2012 Page 157 of 266
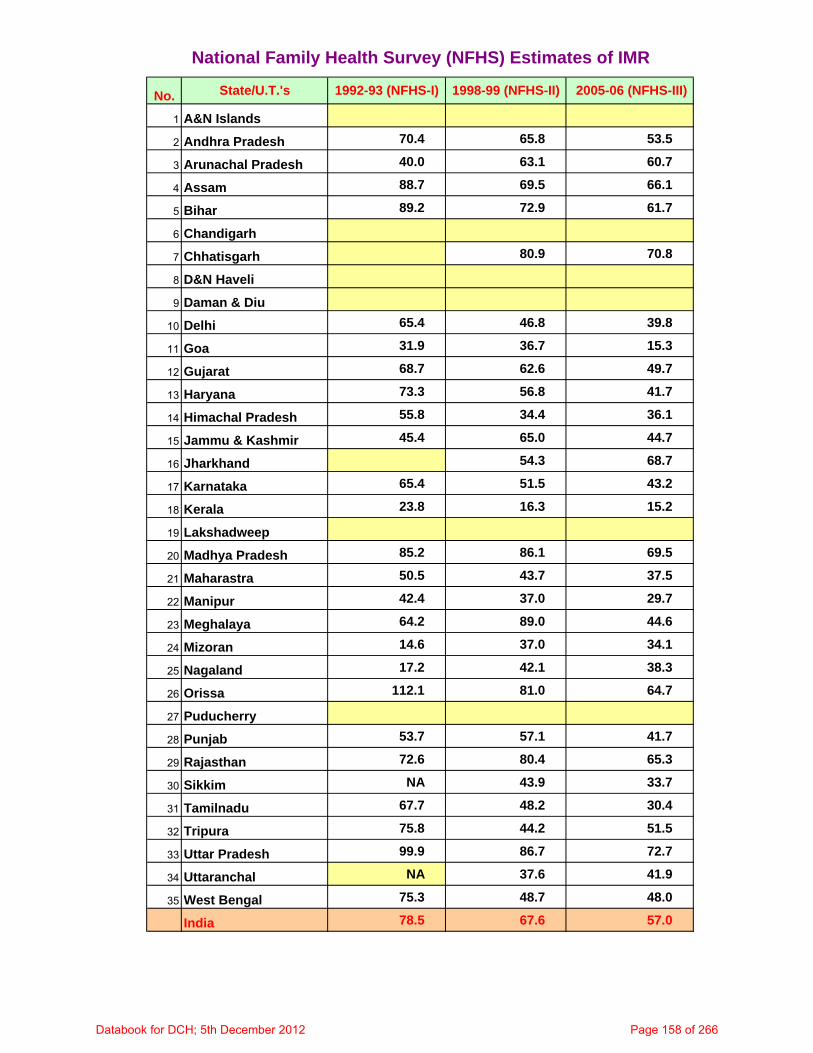
1 A&N Islands
2 Andhra Pradesh 70.4 65.8 53.5
3 Arunachal Pradesh 40.0 63.1 60.7
4 Assam 88.7 69.5 66.1
5 Bihar 89.2 72.9 61.7
6 Chandigarh
7 Chhatisgarh 80.9 70.8
8 D&N Haveli
9 Daman & Diu
10 Delhi 65.4 46.8 39.8
11 Goa 31.9 36.7 15.3
12 Gujarat 68.7 62.6 49.7
13 Haryana 73.3 56.8 41.7
14 Himachal Pradesh 55.8 34.4 36.1
15 Jammu & Kashmir 45.4 65.0 44.7
16 Jharkhand 54.3 68.7
17 Karnataka 65.4 51.5 43.2
18 Kerala 23.8 16.3 15.2
19 Lakshadweep
20 Madhya Pradesh 85.2 86.1 69.5
21 Maharastra 50.5 43.7 37.5
22 Manipur 42.4 37.0 29.7
23 Meghalaya 64.2 89.0 44.6
24 Mizoran 14.6 37.0 34.1
25 Nagaland 17.2 42.1 38.3
26 Orissa 112.1 81.0 64.7
27 Puducherry
28 Punjab 53.7 57.1 41.7
29 Rajasthan 72.6 80.4 65.3
30 Sikkim NA 43.9 33.7
31 Tamilnadu 67.7 48.2 30.4
32 Tripura 75.8 44.2 51.5
33 Uttar Pradesh 99.9 86.7 72.7
34 Uttaranchal NA 37.6 41.9
35 West Bengal 75.3 48.7 48.0
India 78.5 67.6 57.0
National Family Health Survey (NFHS) Estimates of IMR
No. State/U.T.'s 1992-93 (NFHS-I) 2005-06 (NFHS-III)1998-99 (NFHS-II)
Databook for DCH; 5th December 2012 Page 158 of 266
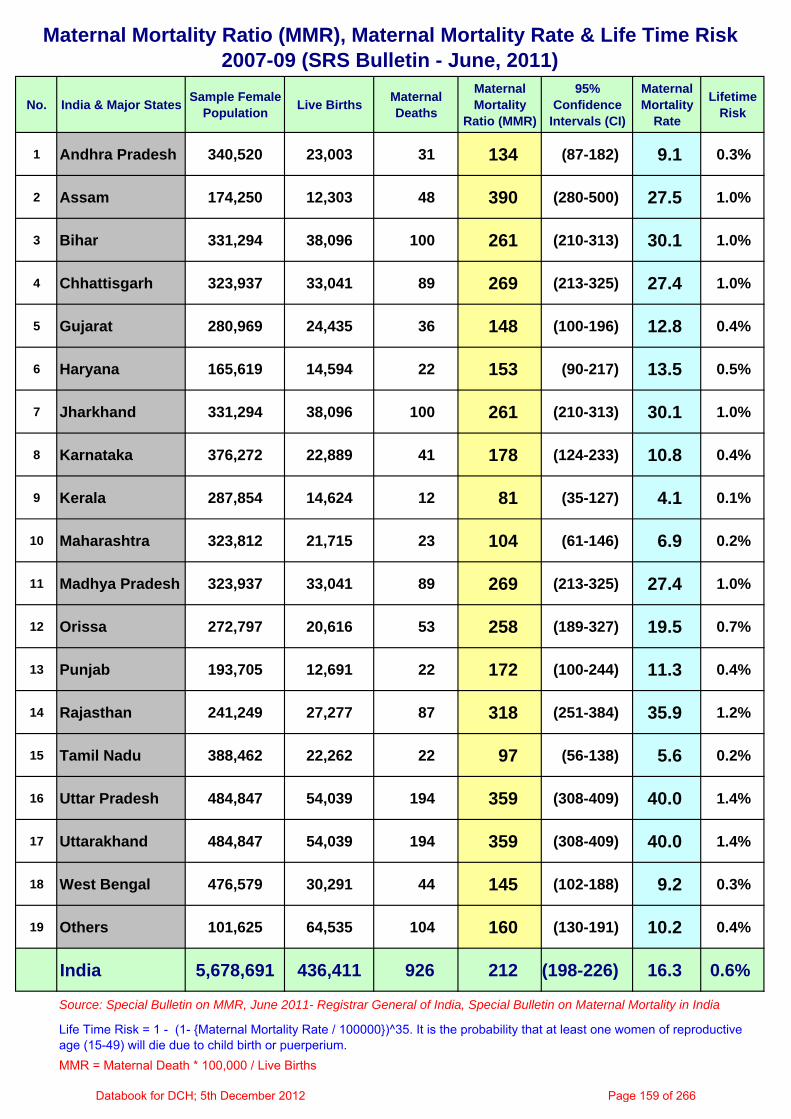
Maternal Mortality Ratio (MMR), Maternal Mortality Rate & Life Time Risk
2007-09 (SRS Bulletin - June, 2011)
No. India & Major StatesSample Female
PopulationLive Births
Maternal
Deaths
Maternal
Mortality
Ratio (MMR)
95%
Confidence
Intervals (CI)
Maternal
Mortality
Rate
Lifetime
Risk
1 Andhra Pradesh 340,520 23,003 31 134 (87-182) 9.1 0.3%
2 Assam 174,250 12,303 48 390 (280-500) 27.5 1.0%
3 Bihar 331,294 38,096 100 261 (210-313) 30.1 1.0%
4 Chhattisgarh 323,937 33,041 89 269 (213-325) 27.4 1.0%
5 Gujarat 280,969 24,435 36 148 (100-196) 12.8 0.4%
6 Haryana 165,619 14,594 22 153 (90-217) 13.5 0.5%
7 Jharkhand 331,294 38,096 100 261 (210-313) 30.1 1.0%
8 Karnataka 376,272 22,889 41 178 (124-233) 10.8 0.4%
9 Kerala 287,854 14,624 12 81 (35-127) 4.1 0.1%
10 Maharashtra 323,812 21,715 23 104 (61-146) 6.9 0.2%
11 Madhya Pradesh 323,937 33,041 89 269 (213-325) 27.4 1.0%
12 Orissa 272,797 20,616 53 258 (189-327) 19.5 0.7%
13 Punjab 193,705 12,691 22 172 (100-244) 11.3 0.4%
14 Rajasthan 241,249 27,277 87 318 (251-384) 35.9 1.2%
15 Tamil Nadu 388,462 22,262 22 97 (56-138) 5.6 0.2%
16 Uttar Pradesh 484,847 54,039 194 359 (308-409) 40.0 1.4%
17 Uttarakhand 484,847 54,039 194 359 (308-409) 40.0 1.4%
18 West Bengal 476,579 30,291 44 145 (102-188) 9.2 0.3%
19 Others 101,625 64,535 104 160 (130-191) 10.2 0.4%
India 5,678,691 436,411 926 212 (198-226) 16.3 0.6%
Source: Special Bulletin on MMR, June 2011- Registrar General of India, Special Bulletin on Maternal Mortality in India
Life Time Risk = 1 - (1- {Maternal Mortality Rate / 100000})^35. It is the probability that at least one women of reproductive age (15-49) will die due to child birth or puerperium.MMR = Maternal Death * 100,000 / Live Births
Databook for DCH; 5th December 2012 Page 159 of 266
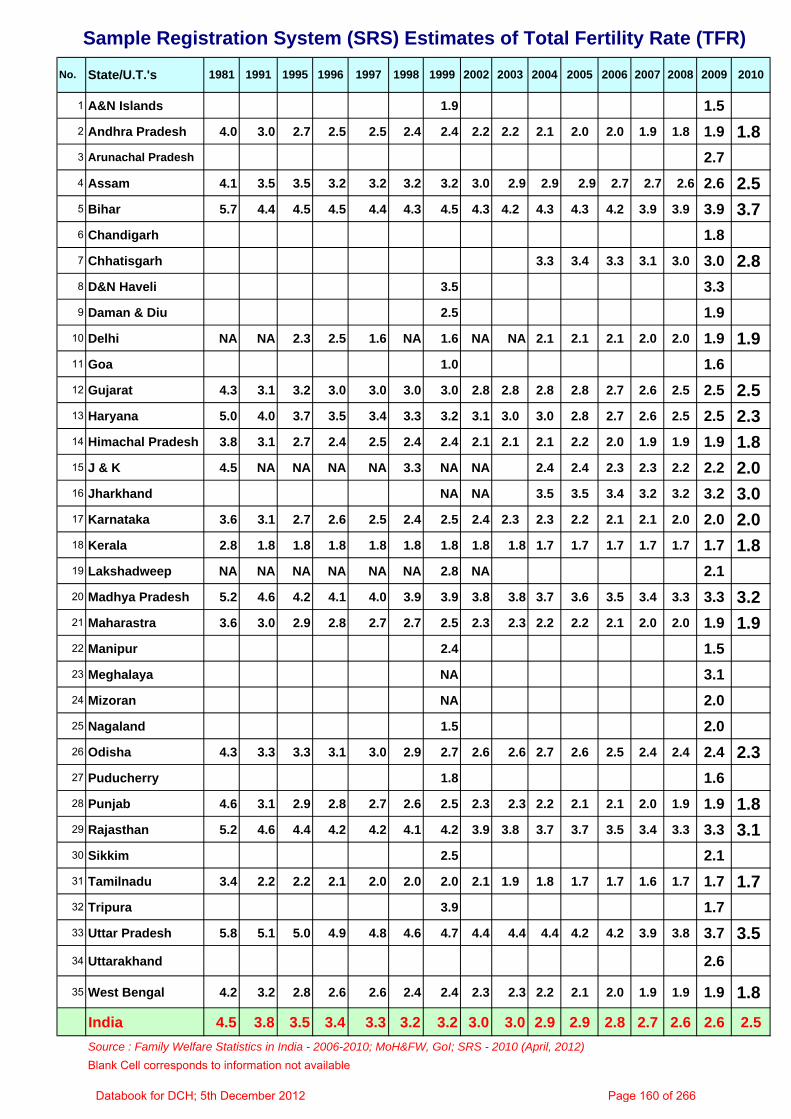
Sample Registration System (SRS) Estimates of Total Fertility Rate (TFR)
No. State/U.T.'s 1981 1991 1995 1996 1997 1998 1999 2002 2003 2004 2005 2006 2007 2008 2009 2010
1 A&N Islands 1.9 1.5
2 Andhra Pradesh 4.0 3.0 2.7 2.5 2.5 2.4 2.4 2.2 2.2 2.1 2.0 2.0 1.9 1.8 1.9 1.8
3 Arunachal Pradesh 2.7
4 Assam 4.1 3.5 3.5 3.2 3.2 3.2 3.2 3.0 2.9 2.9 2.9 2.7 2.7 2.6 2.6 2.5
5 Bihar 5.7 4.4 4.5 4.5 4.4 4.3 4.5 4.3 4.2 4.3 4.3 4.2 3.9 3.9 3.9 3.7
6 Chandigarh 1.8
7 Chhatisgarh 3.3 3.4 3.3 3.1 3.0 3.0 2.8
8 D&N Haveli 3.5 3.3
9 Daman & Diu 2.5 1.9
10 Delhi NA NA 2.3 2.5 1.6 NA 1.6 NA NA 2.1 2.1 2.1 2.0 2.0 1.9 1.9
11 Goa 1.0 1.6
12 Gujarat 4.3 3.1 3.2 3.0 3.0 3.0 3.0 2.8 2.8 2.8 2.8 2.7 2.6 2.5 2.5 2.5
13 Haryana 5.0 4.0 3.7 3.5 3.4 3.3 3.2 3.1 3.0 3.0 2.8 2.7 2.6 2.5 2.5 2.3
14 Himachal Pradesh 3.8 3.1 2.7 2.4 2.5 2.4 2.4 2.1 2.1 2.1 2.2 2.0 1.9 1.9 1.9 1.8
15 J & K 4.5 NA NA NA NA 3.3 NA NA 2.4 2.4 2.3 2.3 2.2 2.2 2.0
16 Jharkhand NA NA 3.5 3.5 3.4 3.2 3.2 3.2 3.0
17 Karnataka 3.6 3.1 2.7 2.6 2.5 2.4 2.5 2.4 2.3 2.3 2.2 2.1 2.1 2.0 2.0 2.0
18 Kerala 2.8 1.8 1.8 1.8 1.8 1.8 1.8 1.8 1.8 1.7 1.7 1.7 1.7 1.7 1.7 1.8
19 Lakshadweep NA NA NA NA NA NA 2.8 NA 2.1
20 Madhya Pradesh 5.2 4.6 4.2 4.1 4.0 3.9 3.9 3.8 3.8 3.7 3.6 3.5 3.4 3.3 3.3 3.2
21 Maharastra 3.6 3.0 2.9 2.8 2.7 2.7 2.5 2.3 2.3 2.2 2.2 2.1 2.0 2.0 1.9 1.9
22 Manipur 2.4 1.5
23 Meghalaya NA 3.1
24 Mizoran NA 2.0
25 Nagaland 1.5 2.0
26 Odisha 4.3 3.3 3.3 3.1 3.0 2.9 2.7 2.6 2.6 2.7 2.6 2.5 2.4 2.4 2.4 2.3
27 Puducherry 1.8 1.6
28 Punjab 4.6 3.1 2.9 2.8 2.7 2.6 2.5 2.3 2.3 2.2 2.1 2.1 2.0 1.9 1.9 1.8
29 Rajasthan 5.2 4.6 4.4 4.2 4.2 4.1 4.2 3.9 3.8 3.7 3.7 3.5 3.4 3.3 3.3 3.1
30 Sikkim 2.5 2.1
31 Tamilnadu 3.4 2.2 2.2 2.1 2.0 2.0 2.0 2.1 1.9 1.8 1.7 1.7 1.6 1.7 1.7 1.7
32 Tripura 3.9 1.7
33 Uttar Pradesh 5.8 5.1 5.0 4.9 4.8 4.6 4.7 4.4 4.4 4.4 4.2 4.2 3.9 3.8 3.7 3.5
34 Uttarakhand 2.6
35 West Bengal 4.2 3.2 2.8 2.6 2.6 2.4 2.4 2.3 2.3 2.2 2.1 2.0 1.9 1.9 1.9 1.8
India 4.5 3.8 3.5 3.4 3.3 3.2 3.2 3.0 3.0 2.9 2.9 2.8 2.7 2.6 2.6 2.5
Source : Family Welfare Statistics in India - 2006-2010; MoH&FW, GoI; SRS - 2010 (April, 2012)Blank Cell corresponds to information not available
Databook for DCH; 5th December 2012 Page 160 of 266
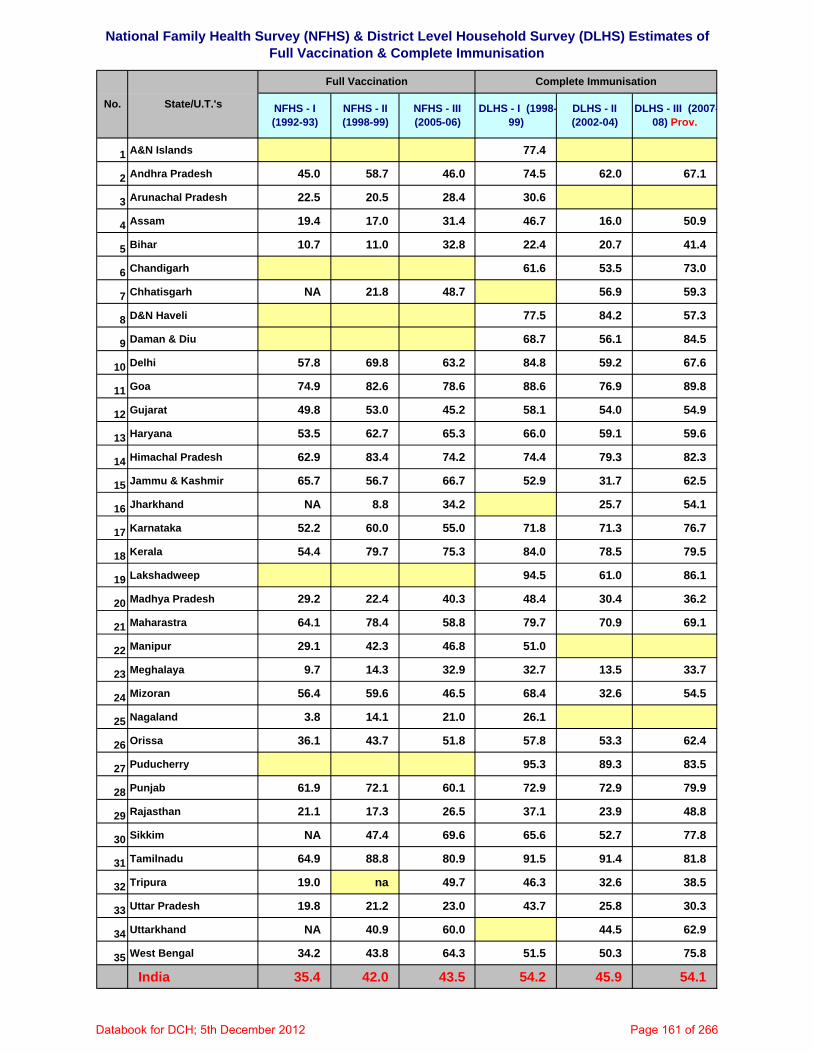
--
National Family Health Survey (NFHS) & District Level Household Survey (DLHS) Estimates of Full Vaccination & Complete Immunisation
No. State/U.T.'s
Full Vaccination Complete Immunisation
NFHS - I (1992-93)
NFHS - II (1998-99)
NFHS - III (2005-06)
DLHS - I (199899)
DLHS - II (2002-04)
DLHS - III (200708) Prov.
1 A&N Islands 77.4
2 Andhra Pradesh 45.0 58.7 46.0 74.5 62.0 67.1
3 Arunachal Pradesh 22.5 20.5 28.4 30.6
4 Assam 19.4 17.0 31.4 46.7 16.0 50.9
5 Bihar 10.7 11.0 32.8 22.4 20.7 41.4
6 Chandigarh 61.6 53.5 73.0
7 Chhatisgarh NA 21.8 48.7 56.9 59.3
8 D&N Haveli 77.5 84.2 57.3
9 Daman & Diu 68.7 56.1 84.5
10 Delhi 57.8 69.8 63.2 84.8 59.2 67.6
11 Goa 74.9 82.6 78.6 88.6 76.9 89.8
12 Gujarat 49.8 53.0 45.2 58.1 54.0 54.9
13 Haryana 53.5 62.7 65.3 66.0 59.1 59.6
14 Himachal Pradesh 62.9 83.4 74.2 74.4 79.3 82.3
15 Jammu & Kashmir 65.7 56.7 66.7 52.9 31.7 62.5
16 Jharkhand NA 8.8 34.2 25.7 54.1
17 Karnataka 52.2 60.0 55.0 71.8 71.3 76.7
18 Kerala 54.4 79.7 75.3 84.0 78.5 79.5
19 Lakshadweep 94.5 61.0 86.1
20 Madhya Pradesh 29.2 22.4 40.3 48.4 30.4 36.2
21 Maharastra 64.1 78.4 58.8 79.7 70.9 69.1
22 Manipur 29.1 42.3 46.8 51.0
23 Meghalaya 9.7 14.3 32.9 32.7 13.5 33.7
24 Mizoran 56.4 59.6 46.5 68.4 32.6 54.5
25 Nagaland 3.8 14.1 21.0 26.1
26 Orissa 36.1 43.7 51.8 57.8 53.3 62.4
27 Puducherry 95.3 89.3 83.5
28 Punjab 61.9 72.1 60.1 72.9 72.9 79.9
29 Rajasthan 21.1 17.3 26.5 37.1 23.9 48.8
30 Sikkim NA 47.4 69.6 65.6 52.7 77.8
31 Tamilnadu 64.9 88.8 80.9 91.5 91.4 81.8
32 Tripura 19.0 na 49.7 46.3 32.6 38.5
33 Uttar Pradesh 19.8 21.2 23.0 43.7 25.8 30.3
34 Uttarkhand NA 40.9 60.0 44.5 62.9
35 West Bengal 34.2 43.8 64.3 51.5 50.3 75.8
India 35.4 42.0 43.5 54.2 45.9 54.1
Databook for DCH; 5th December 2012 Page 161 of 266
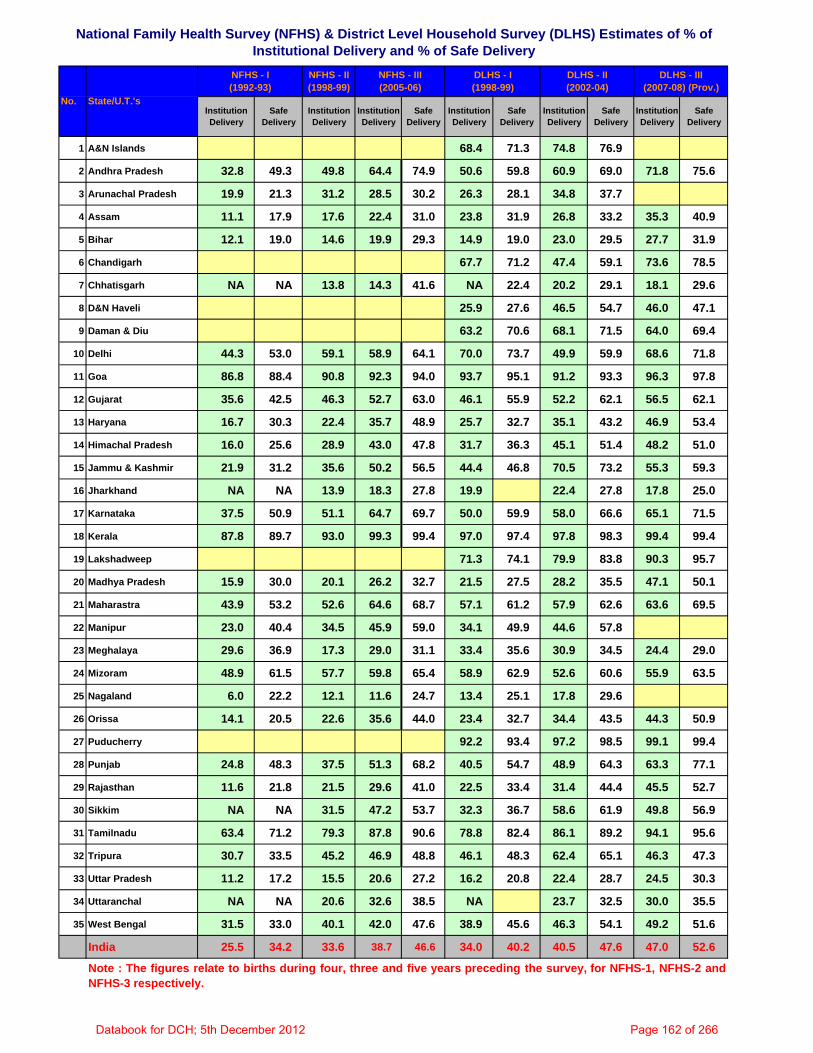
National Family Health Survey (NFHS) & District Level Household Survey (DLHS) Estimates of % of Institutional Delivery and % of Safe Delivery
No. State/U.T.'s
NFHS - I (1992-93)
NFHS - II (1998-99)
NFHS - III (2005-06)
DLHS - I (1998-99)
DLHS - II (2002-04)
DLHS - III (2007-08) (Prov.)
Institution Delivery
Safe Delivery
Institution Delivery
Institution Delivery
Safe Delivery
Institution Delivery
Safe Delivery
Institution Delivery
Safe Delivery
Institution Delivery
Safe Delivery
1 A&N Islands 68.4 71.3 74.8 76.9
2 Andhra Pradesh 32.8 49.3 49.8 64.4 74.9 50.6 59.8 60.9 69.0 71.8 75.6
3 Arunachal Pradesh 19.9 21.3 31.2 28.5 30.2 26.3 28.1 34.8 37.7
4 Assam 11.1 17.9 17.6 22.4 31.0 23.8 31.9 26.8 33.2 35.3 40.9
5 Bihar 12.1 19.0 14.6 19.9 29.3 14.9 19.0 23.0 29.5 27.7 31.9
6 Chandigarh 67.7 71.2 47.4 59.1 73.6 78.5
7 Chhatisgarh NA NA 13.8 14.3 41.6 NA 22.4 20.2 29.1 18.1 29.6
8 D&N Haveli 25.9 27.6 46.5 54.7 46.0 47.1
9 Daman & Diu 63.2 70.6 68.1 71.5 64.0 69.4
10 Delhi 44.3 53.0 59.1 58.9 64.1 70.0 73.7 49.9 59.9 68.6 71.8
11 Goa 86.8 88.4 90.8 92.3 94.0 93.7 95.1 91.2 93.3 96.3 97.8
12 Gujarat 35.6 42.5 46.3 52.7 63.0 46.1 55.9 52.2 62.1 56.5 62.1
13 Haryana 16.7 30.3 22.4 35.7 48.9 25.7 32.7 35.1 43.2 46.9 53.4
14 Himachal Pradesh 16.0 25.6 28.9 43.0 47.8 31.7 36.3 45.1 51.4 48.2 51.0
15 Jammu & Kashmir 21.9 31.2 35.6 50.2 56.5 44.4 46.8 70.5 73.2 55.3 59.3
16 Jharkhand NA NA 13.9 18.3 27.8 19.9 22.4 27.8 17.8 25.0
17 Karnataka 37.5 50.9 51.1 64.7 69.7 50.0 59.9 58.0 66.6 65.1 71.5
18 Kerala 87.8 89.7 93.0 99.3 99.4 97.0 97.4 97.8 98.3 99.4 99.4
19 Lakshadweep 71.3 74.1 79.9 83.8 90.3 95.7
20 Madhya Pradesh 15.9 30.0 20.1 26.2 32.7 21.5 27.5 28.2 35.5 47.1 50.1
21 Maharastra 43.9 53.2 52.6 64.6 68.7 57.1 61.2 57.9 62.6 63.6 69.5
22 Manipur 23.0 40.4 34.5 45.9 59.0 34.1 49.9 44.6 57.8
23 Meghalaya 29.6 36.9 17.3 29.0 31.1 33.4 35.6 30.9 34.5 24.4 29.0
24 Mizoram 48.9 61.5 57.7 59.8 65.4 58.9 62.9 52.6 60.6 55.9 63.5
25 Nagaland 6.0 22.2 12.1 11.6 24.7 13.4 25.1 17.8 29.6
26 Orissa 14.1 20.5 22.6 35.6 44.0 23.4 32.7 34.4 43.5 44.3 50.9
27 Puducherry 92.2 93.4 97.2 98.5 99.1 99.4
28 Punjab 24.8 48.3 37.5 51.3 68.2 40.5 54.7 48.9 64.3 63.3 77.1
29 Rajasthan 11.6 21.8 21.5 29.6 41.0 22.5 33.4 31.4 44.4 45.5 52.7
30 Sikkim NA NA 31.5 47.2 53.7 32.3 36.7 58.6 61.9 49.8 56.9
31 Tamilnadu 63.4 71.2 79.3 87.8 90.6 78.8 82.4 86.1 89.2 94.1 95.6
32 Tripura 30.7 33.5 45.2 46.9 48.8 46.1 48.3 62.4 65.1 46.3 47.3
33 Uttar Pradesh 11.2 17.2 15.5 20.6 27.2 16.2 20.8 22.4 28.7 24.5 30.3
34 Uttaranchal NA NA 20.6 32.6 38.5 NA 23.7 32.5 30.0 35.5
35 West Bengal 31.5 33.0 40.1 42.0 47.6 38.9 45.6 46.3 54.1 49.2 51.6
India 25.5 34.2 33.6 38.7 46.6 34.0 40.2 40.5 47.6 47.0 52.6
Note : The figures relate to births during four, three and five years preceding the survey, for NFHS-1, NFHS-2 andNFHS-3 respectively.
Databook for DCH; 5th December 2012 Page 162 of 266
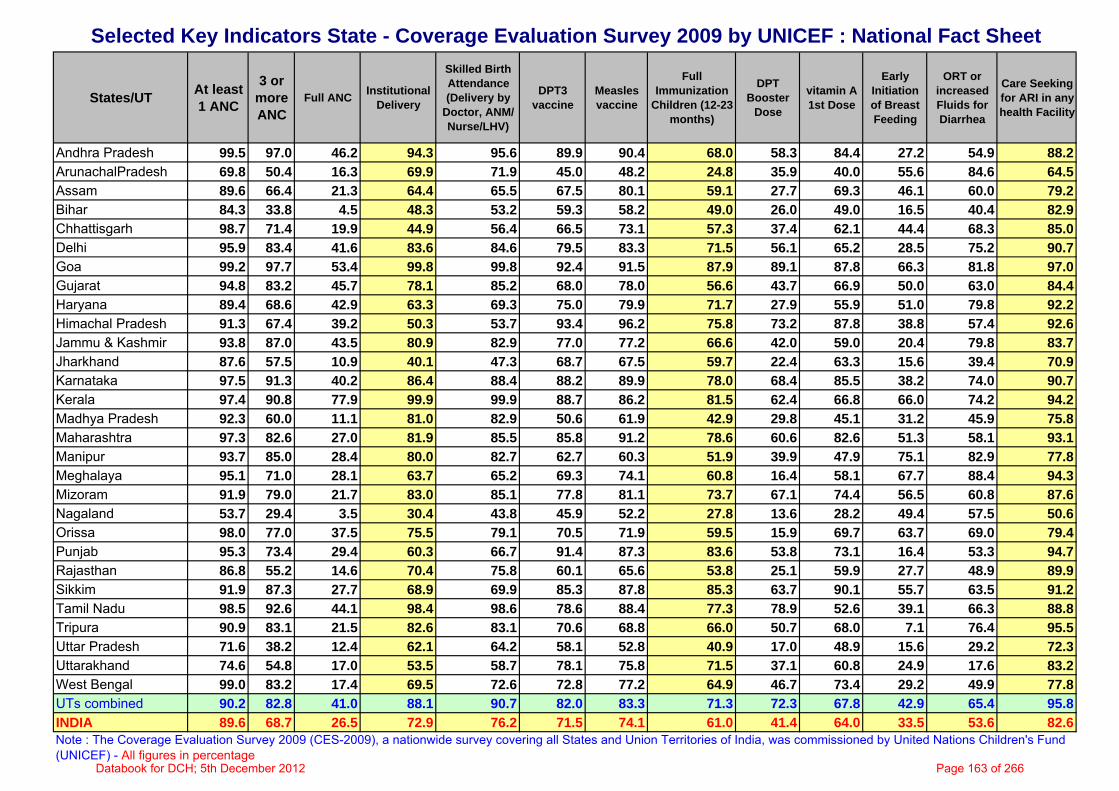
Selected Key Indicators State - Coverage Evaluation Survey 2009 by UNICEF : National Fact Sheet
States/UTAt least
1 ANC
3 or
more
ANC
Full ANC Institutional
Delivery
Skilled Birth
Attendance
(Delivery by
Doctor, ANM/
Nurse/LHV)
DPT3
vaccine
Measles
vaccine
Full
Immunization
Children (12-23
months)
DPT
Booster
Dose
vitamin A
1st Dose
Early
Initiation
of Breast
Feeding
ORT or
increased
Fluids for
Diarrhea
Care Seeking
for ARI in any
health Facility
Andhra Pradesh 99.5 97.0 46.2 94.3 95.6 89.9 90.4 68.0 58.3 84.4 27.2 54.9 88.2
ArunachalPradesh 69.8 50.4 16.3 69.9 71.9 45.0 48.2 24.8 35.9 40.0 55.6 84.6 64.5
Assam 89.6 66.4 21.3 64.4 65.5 67.5 80.1 59.1 27.7 69.3 46.1 60.0 79.2
Bihar 84.3 33.8 4.5 48.3 53.2 59.3 58.2 49.0 26.0 49.0 16.5 40.4 82.9
Chhattisgarh 98.7 71.4 19.9 44.9 56.4 66.5 73.1 57.3 37.4 62.1 44.4 68.3 85.0
Delhi 95.9 83.4 41.6 83.6 84.6 79.5 83.3 71.5 56.1 65.2 28.5 75.2 90.7
Goa 99.2 97.7 53.4 99.8 99.8 92.4 91.5 87.9 89.1 87.8 66.3 81.8 97.0
Gujarat 94.8 83.2 45.7 78.1 85.2 68.0 78.0 56.6 43.7 66.9 50.0 63.0 84.4
Haryana 89.4 68.6 42.9 63.3 69.3 75.0 79.9 71.7 27.9 55.9 51.0 79.8 92.2
Himachal Pradesh 91.3 67.4 39.2 50.3 53.7 93.4 96.2 75.8 73.2 87.8 38.8 57.4 92.6
Jammu & Kashmir 93.8 87.0 43.5 80.9 82.9 77.0 77.2 66.6 42.0 59.0 20.4 79.8 83.7
Jharkhand 87.6 57.5 10.9 40.1 47.3 68.7 67.5 59.7 22.4 63.3 15.6 39.4 70.9
Karnataka 97.5 91.3 40.2 86.4 88.4 88.2 89.9 78.0 68.4 85.5 38.2 74.0 90.7
Kerala 97.4 90.8 77.9 99.9 99.9 88.7 86.2 81.5 62.4 66.8 66.0 74.2 94.2
Madhya Pradesh 92.3 60.0 11.1 81.0 82.9 50.6 61.9 42.9 29.8 45.1 31.2 45.9 75.8
Maharashtra 97.3 82.6 27.0 81.9 85.5 85.8 91.2 78.6 60.6 82.6 51.3 58.1 93.1
Manipur 93.7 85.0 28.4 80.0 82.7 62.7 60.3 51.9 39.9 47.9 75.1 82.9 77.8
Meghalaya 95.1 71.0 28.1 63.7 65.2 69.3 74.1 60.8 16.4 58.1 67.7 88.4 94.3
Mizoram 91.9 79.0 21.7 83.0 85.1 77.8 81.1 73.7 67.1 74.4 56.5 60.8 87.6
Nagaland 53.7 29.4 3.5 30.4 43.8 45.9 52.2 27.8 13.6 28.2 49.4 57.5 50.6
Orissa 98.0 77.0 37.5 75.5 79.1 70.5 71.9 59.5 15.9 69.7 63.7 69.0 79.4
Punjab 95.3 73.4 29.4 60.3 66.7 91.4 87.3 83.6 53.8 73.1 16.4 53.3 94.7
Rajasthan 86.8 55.2 14.6 70.4 75.8 60.1 65.6 53.8 25.1 59.9 27.7 48.9 89.9
Sikkim 91.9 87.3 27.7 68.9 69.9 85.3 87.8 85.3 63.7 90.1 55.7 63.5 91.2
Tamil Nadu 98.5 92.6 44.1 98.4 98.6 78.6 88.4 77.3 78.9 52.6 39.1 66.3 88.8
Tripura 90.9 83.1 21.5 82.6 83.1 70.6 68.8 66.0 50.7 68.0 7.1 76.4 95.5
Uttar Pradesh 71.6 38.2 12.4 62.1 64.2 58.1 52.8 40.9 17.0 48.9 15.6 29.2 72.3
Uttarakhand 74.6 54.8 17.0 53.5 58.7 78.1 75.8 71.5 37.1 60.8 24.9 17.6 83.2
West Bengal 99.0 83.2 17.4 69.5 72.6 72.8 77.2 64.9 46.7 73.4 29.2 49.9 77.8
UTs combined 90.2 82.8 41.0 88.1 90.7 82.0 83.3 71.3 72.3 67.8 42.9 65.4 95.8
INDIA 89.6 68.7 26.5 72.9 76.2 71.5 74.1 61.0 41.4 64.0 33.5 53.6 82.6
Note : The Coverage Evaluation Survey 2009 (CES-2009), a nationwide survey covering all States and Union Territories of India, was commissioned by United Nations Children's Fund (UNICEF) - All figures in percentage Databook for DCH; 5th December 2012 Page 163 of 266
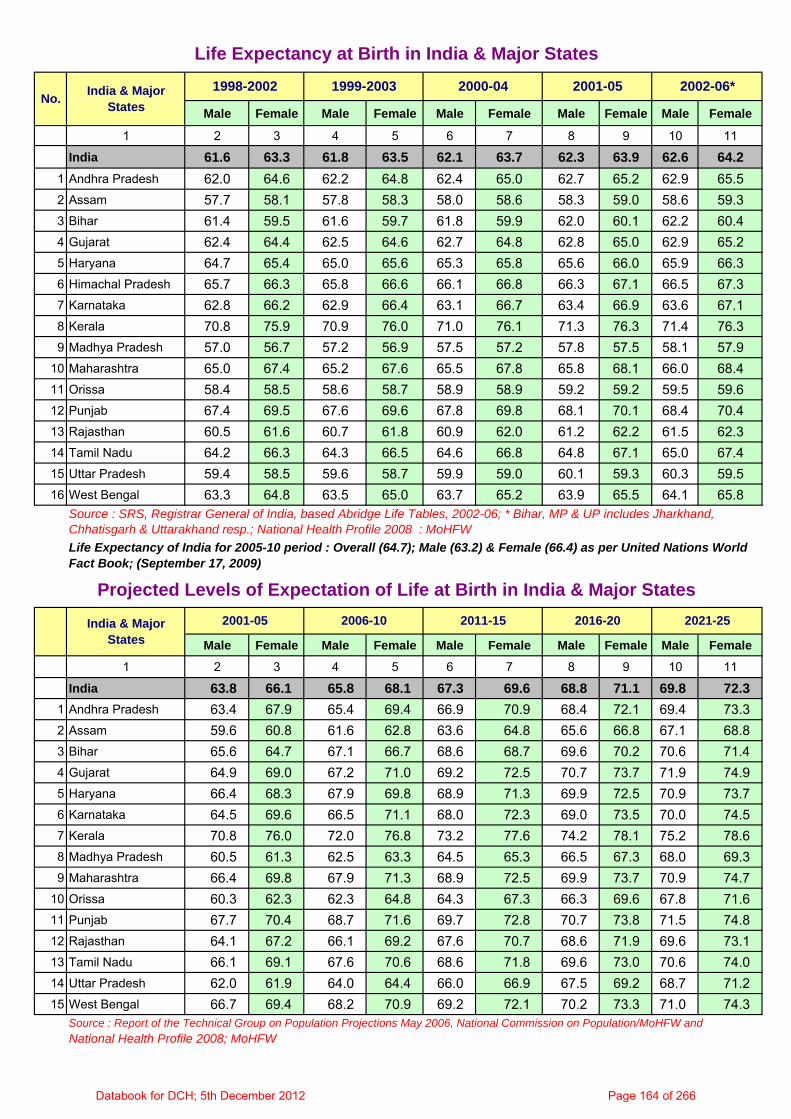
Life Expectancy at Birth in India & Major States
No. India & Major States
1998-2002 1999-2003 2000-04 2001-05 2002-06*
Male Female Male Female Male Female Male Female Male Female
1 2 3 4 5 6 7 8 9 10 11
India 61.6 63.3 61.8 63.5 62.1 63.7 62.3 63.9 62.6 64.21 Andhra Pradesh 62.0 64.6 62.2 64.8 62.4 65.0 62.7 65.2 62.9 65.52 Assam 57.7 58.1 57.8 58.3 58.0 58.6 58.3 59.0 58.6 59.33 Bihar 61.4 59.5 61.6 59.7 61.8 59.9 62.0 60.1 62.2 60.44 Gujarat 62.4 64.4 62.5 64.6 62.7 64.8 62.8 65.0 62.9 65.25 Haryana 64.7 65.4 65.0 65.6 65.3 65.8 65.6 66.0 65.9 66.36 Himachal Pradesh 65.7 66.3 65.8 66.6 66.1 66.8 66.3 67.1 66.5 67.37 Karnataka 62.8 66.2 62.9 66.4 63.1 66.7 63.4 66.9 63.6 67.18 Kerala 70.8 75.9 70.9 76.0 71.0 76.1 71.3 76.3 71.4 76.39 Madhya Pradesh 57.0 56.7 57.2 56.9 57.5 57.2 57.8 57.5 58.1 57.9
10 Maharashtra 65.0 67.4 65.2 67.6 65.5 67.8 65.8 68.1 66.0 68.411 Orissa 58.4 58.5 58.6 58.7 58.9 58.9 59.2 59.2 59.5 59.612 Punjab 67.4 69.5 67.6 69.6 67.8 69.8 68.1 70.1 68.4 70.413 Rajasthan 60.5 61.6 60.7 61.8 60.9 62.0 61.2 62.2 61.5 62.314 Tamil Nadu 64.2 66.3 64.3 66.5 64.6 66.8 64.8 67.1 65.0 67.415 Uttar Pradesh 59.4 58.5 59.6 58.7 59.9 59.0 60.1 59.3 60.3 59.516 West Bengal 63.3 64.8 63.5 65.0 63.7 65.2 63.9 65.5 64.1 65.8
Source : SRS, Registrar General of India, based Abridge Life Tables, 2002-06; * Bihar, MP & UP includes Jharkhand, Chhatisgarh & Uttarakhand resp.; National Health Profile 2008 : MoHFWLife Expectancy of India for 2005-10 period : Overall (64.7); Male (63.2) & Female (66.4) as per United Nations World Fact Book; (September 17, 2009)
Projected Levels of Expectation of Life at Birth in India & Major States
No. India & Major States
2001-05 2006-10 2011-15 2016-20 2021-25
Male Female Male Female Male Female Male Female Male Female1 2 3 4 5 6 7 8 9 10 11
India 63.8 66.1 65.8 68.1 67.3 69.6 68.8 71.1 69.8 72.31 Andhra Pradesh 63.4 67.9 65.4 69.4 66.9 70.9 68.4 72.1 69.4 73.32 Assam 59.6 60.8 61.6 62.8 63.6 64.8 65.6 66.8 67.1 68.83 Bihar 65.6 64.7 67.1 66.7 68.6 68.7 69.6 70.2 70.6 71.44 Gujarat 64.9 69.0 67.2 71.0 69.2 72.5 70.7 73.7 71.9 74.95 Haryana 66.4 68.3 67.9 69.8 68.9 71.3 69.9 72.5 70.9 73.76 Karnataka 64.5 69.6 66.5 71.1 68.0 72.3 69.0 73.5 70.0 74.57 Kerala 70.8 76.0 72.0 76.8 73.2 77.6 74.2 78.1 75.2 78.68 Madhya Pradesh 60.5 61.3 62.5 63.3 64.5 65.3 66.5 67.3 68.0 69.39 Maharashtra 66.4 69.8 67.9 71.3 68.9 72.5 69.9 73.7 70.9 74.7
10 Orissa 60.3 62.3 62.3 64.8 64.3 67.3 66.3 69.6 67.8 71.611 Punjab 67.7 70.4 68.7 71.6 69.7 72.8 70.7 73.8 71.5 74.812 Rajasthan 64.1 67.2 66.1 69.2 67.6 70.7 68.6 71.9 69.6 73.113 Tamil Nadu 66.1 69.1 67.6 70.6 68.6 71.8 69.6 73.0 70.6 74.014 Uttar Pradesh 62.0 61.9 64.0 64.4 66.0 66.9 67.5 69.2 68.7 71.215 West Bengal 66.7 69.4 68.2 70.9 69.2 72.1 70.2 73.3 71.0 74.3
Source : Report of the Technical Group on Population Projections May 2006, National Commission on Population/MoHFW and National Health Profile 2008; MoHFW
Databook for DCH; 5th December 2012 Page 164 of 266
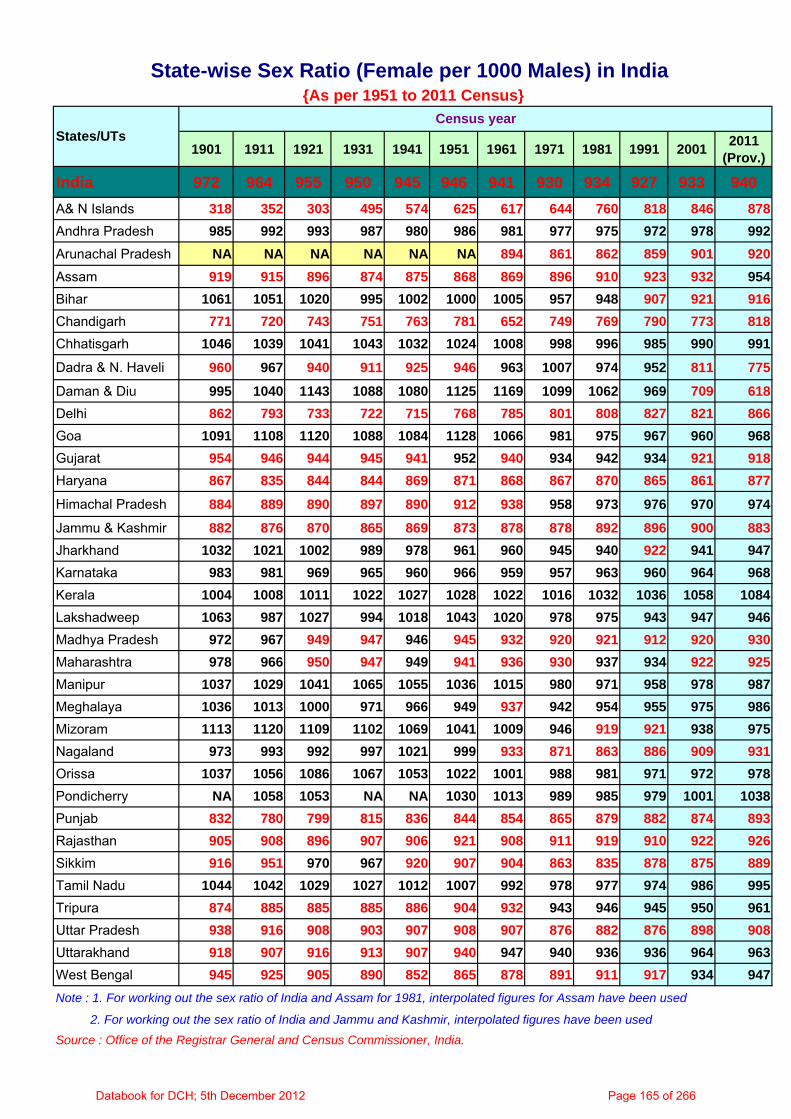
State-wise Sex Ratio (Female per 1000 Males) in India {As per 1951 to 2011 Census}
States/UTsCensus year
1901 1911 1921 1931 1941 1951 1961 1971 1981 1991 2001 2011 (Prov.)
India 972 964 955 950 945 946 941 930 934 927 933 940A& N Islands 318 352 303 495 574 625 617 644 760 818 846 878Andhra Pradesh 985 992 993 987 980 986 981 977 975 972 978 992Arunachal Pradesh NA NA NA NA NA NA 894 861 862 859 901 920Assam 919 915 896 874 875 868 869 896 910 923 932 954Bihar 1061 1051 1020 995 1002 1000 1005 957 948 907 921 916Chandigarh 771 720 743 751 763 781 652 749 769 790 773 818Chhatisgarh 1046 1039 1041 1043 1032 1024 1008 998 996 985 990 991
Dadra & N. Haveli 960 967 940 911 925 946 963 1007 974 952 811 775
Daman & Diu 995 1040 1143 1088 1080 1125 1169 1099 1062 969 709 618Delhi 862 793 733 722 715 768 785 801 808 827 821 866Goa 1091 1108 1120 1088 1084 1128 1066 981 975 967 960 968Gujarat 954 946 944 945 941 952 940 934 942 934 921 918Haryana 867 835 844 844 869 871 868 867 870 865 861 877
Himachal Pradesh 884 889 890 897 890 912 938 958 973 976 970 974
Jammu & Kashmir 882 876 870 865 869 873 878 878 892 896 900 883Jharkhand 1032 1021 1002 989 978 961 960 945 940 922 941 947Karnataka 983 981 969 965 960 966 959 957 963 960 964 968Kerala 1004 1008 1011 1022 1027 1028 1022 1016 1032 1036 1058 1084Lakshadweep 1063 987 1027 994 1018 1043 1020 978 975 943 947 946Madhya Pradesh 972 967 949 947 946 945 932 920 921 912 920 930Maharashtra 978 966 950 947 949 941 936 930 937 934 922 925Manipur 1037 1029 1041 1065 1055 1036 1015 980 971 958 978 987Meghalaya 1036 1013 1000 971 966 949 937 942 954 955 975 986Mizoram 1113 1120 1109 1102 1069 1041 1009 946 919 921 938 975Nagaland 973 993 992 997 1021 999 933 871 863 886 909 931Orissa 1037 1056 1086 1067 1053 1022 1001 988 981 971 972 978Pondicherry NA 1058 1053 NA NA 1030 1013 989 985 979 1001 1038Punjab 832 780 799 815 836 844 854 865 879 882 874 893Rajasthan 905 908 896 907 906 921 908 911 919 910 922 926Sikkim 916 951 970 967 920 907 904 863 835 878 875 889Tamil Nadu 1044 1042 1029 1027 1012 1007 992 978 977 974 986 995Tripura 874 885 885 885 886 904 932 943 946 945 950 961Uttar Pradesh 938 916 908 903 907 908 907 876 882 876 898 908Uttarakhand 918 907 916 913 907 940 947 940 936 936 964 963West Bengal 945 925 905 890 852 865 878 891 911 917 934 947Note : 1. For working out the sex ratio of India and Assam for 1981, interpolated figures for Assam have been used
2. For working out the sex ratio of India and Jammu and Kashmir, interpolated figures have been usedSource : Office of the Registrar General and Census Commissioner, India.
Databook for DCH; 5th December 2012 Page 165 of 266
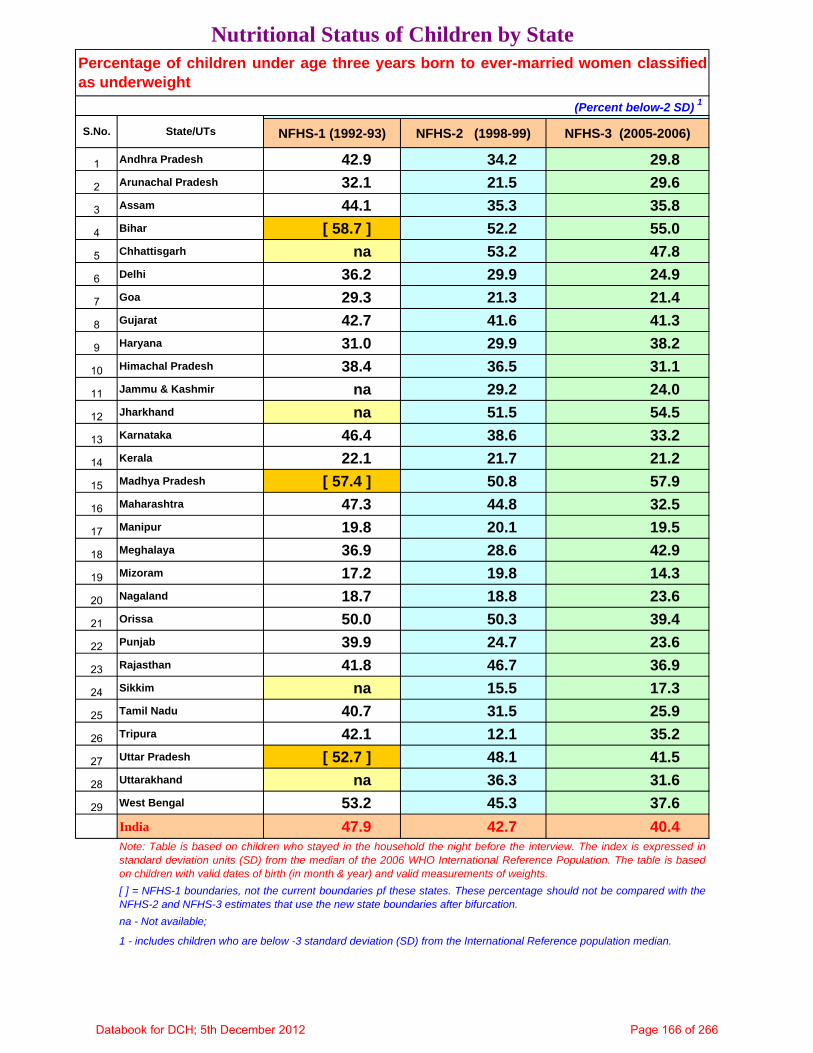
NFHS-1 (1992-93) NFHS-2 (1998-99) NFHS-3 (2005-2006)
1 Andhra Pradesh 42.9 34.2 29.8 2 Arunachal Pradesh 32.1 21.5 29.6 3 Assam 44.1 35.3 35.8 4 Bihar [ 58.7 ] 52.2 55.0 5 Chhattisgarh na 53.2 47.8 6 Delhi 36.2 29.9 24.9 7 Goa 29.3 21.3 21.4 8 Gujarat 42.7 41.6 41.3 9 Haryana 31.0 29.9 38.2
10 Himachal Pradesh 38.4 36.5 31.1 11 Jammu & Kashmir na 29.2 24.0 12 Jharkhand na 51.5 54.5 13 Karnataka 46.4 38.6 33.2 14 Kerala 22.1 21.7 21.2 15 Madhya Pradesh [ 57.4 ] 50.8 57.9 16 Maharashtra 47.3 44.8 32.5 17 Manipur 19.8 20.1 19.5 18 Meghalaya 36.9 28.6 42.9 19 Mizoram 17.2 19.8 14.3 20 Nagaland 18.7 18.8 23.6 21 Orissa 50.0 50.3 39.4 22 Punjab 39.9 24.7 23.6 23 Rajasthan 41.8 46.7 36.9 24 Sikkim na 15.5 17.3 25 Tamil Nadu 40.7 31.5 25.9 26 Tripura 42.1 12.1 35.2 27 Uttar Pradesh [ 52.7 ] 48.1 41.5 28 Uttarakhand na 36.3 31.6 29 West Bengal 53.2 45.3 37.6
India 47.9 42.7 40.4
Percentage of children under age three years born to ever-married women classifiedas underweight
Nutritional Status of Children by State
(Percent below-2 SD) 1
S.No. State/UTs
Note: Table is based on children who stayed in the household the night before the interview. The index is expressed instandard deviation units (SD) from the median of the 2006 WHO International Reference Population. The table is basedon children with valid dates of birth (in month & year) and valid measurements of weights.[ ] = NFHS-1 boundaries, not the current boundaries pf these states. These percentage should not be compared with theNFHS-2 and NFHS-3 estimates that use the new state boundaries after bifurcation.na - Not available;
1 - includes children who are below -3 standard deviation (SD) from the International Reference population median.
Databook for DCH; 5th December 2012 Page 166 of 266
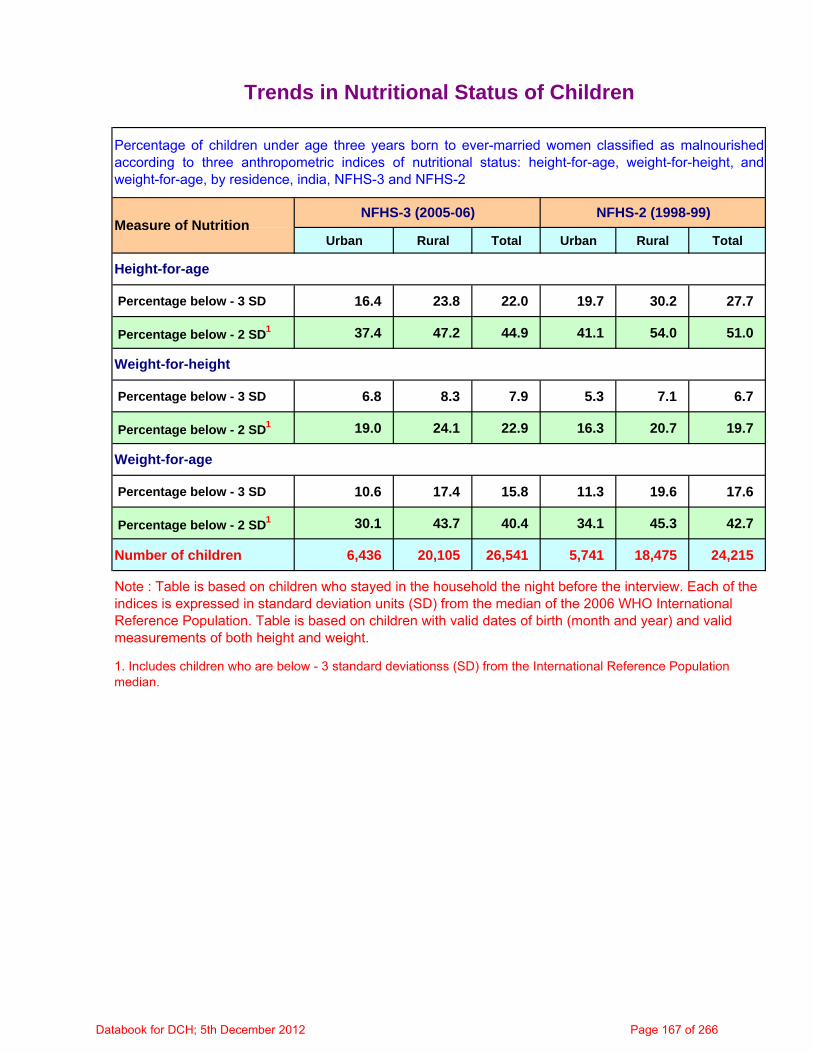
Urban Rural Total Urban Rural Total
Percentage below - 3 SD 16.4 23.8 22.0 19.7 30.2 27.7
Percentage below - 2 SD1 37.4 47.2 44.9 41.1 54.0 51.0
Percentage below - 3 SD 6.8 8.3 7.9 5.3 7.1 6.7
Percentage below - 2 SD1 19.0 24.1 22.9 16.3 20.7 19.7
Percentage below - 3 SD 10.6 17.4 15.8 11.3 19.6 17.6
Percentage below - 2 SD1 30.1 43.7 40.4 34.1 45.3 42.7
Number of children 6,436 20,105 26,541 5,741 18,475 24,215
Trends in Nutritional Status of Children
Note : Table is based on children who stayed in the household the night before the interview. Each of the indices is expressed in standard deviation units (SD) from the median of the 2006 WHO International Reference Population. Table is based on children with valid dates of birth (month and year) and valid measurements of both height and weight.
1. Includes children who are below - 3 standard deviationss (SD) from the International Reference Population median.
Height-for-age
Weight-for-height
Weight-for-age
NFHS-3 (2005-06) NFHS-2 (1998-99)Measure of Nutrition
Percentage of children under age three years born to ever-married women classified as malnourishedaccording to three anthropometric indices of nutritional status: height-for-age, weight-for-height, andweight-for-age, by residence, india, NFHS-3 and NFHS-2
Databook for DCH; 5th December 2012 Page 167 of 266
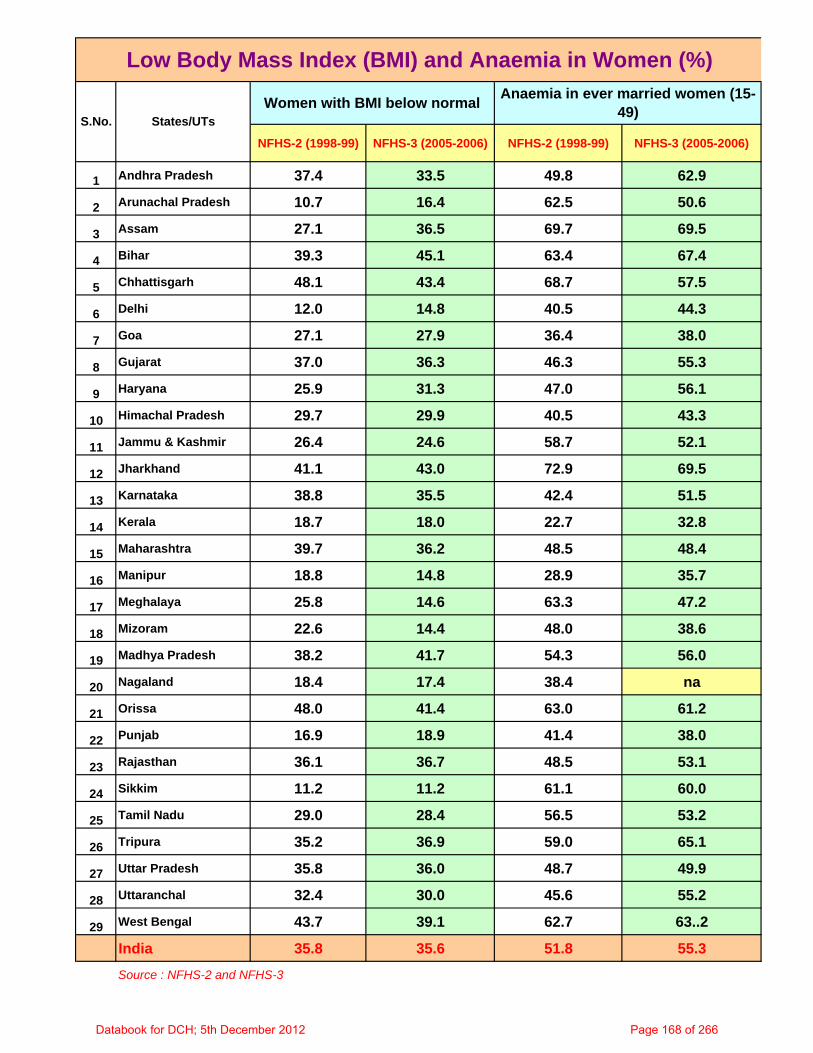
NFHS-2 (1998-99) NFHS-3 (2005-2006) NFHS-2 (1998-99) NFHS-3 (2005-2006)
1 Andhra Pradesh 37.4 33.5 49.8 62.9
2 Arunachal Pradesh 10.7 16.4 62.5 50.6
3 Assam 27.1 36.5 69.7 69.5
4 Bihar 39.3 45.1 63.4 67.4
5 Chhattisgarh 48.1 43.4 68.7 57.5
6 Delhi 12.0 14.8 40.5 44.3
7 Goa 27.1 27.9 36.4 38.0
8 Gujarat 37.0 36.3 46.3 55.3
9 Haryana 25.9 31.3 47.0 56.1
10 Himachal Pradesh 29.7 29.9 40.5 43.3
11 Jammu & Kashmir 26.4 24.6 58.7 52.1
12 Jharkhand 41.1 43.0 72.9 69.5
13 Karnataka 38.8 35.5 42.4 51.5
14 Kerala 18.7 18.0 22.7 32.8
15 Maharashtra 39.7 36.2 48.5 48.4
16 Manipur 18.8 14.8 28.9 35.7
17 Meghalaya 25.8 14.6 63.3 47.2
18 Mizoram 22.6 14.4 48.0 38.6
19 Madhya Pradesh 38.2 41.7 54.3 56.0
20 Nagaland 18.4 17.4 38.4 na
21 Orissa 48.0 41.4 63.0 61.2
22 Punjab 16.9 18.9 41.4 38.0
23 Rajasthan 36.1 36.7 48.5 53.1
24 Sikkim 11.2 11.2 61.1 60.0
25 Tamil Nadu 29.0 28.4 56.5 53.2
26 Tripura 35.2 36.9 59.0 65.1
27 Uttar Pradesh 35.8 36.0 48.7 49.9
28 Uttaranchal 32.4 30.0 45.6 55.2
29 West Bengal 43.7 39.1 62.7 63..2
India 35.8 35.6 51.8 55.3
Source : NFHS-2 and NFHS-3
S.No.
Low Body Mass Index (BMI) and Anaemia in Women (%)
Women with BMI below normal Anaemia in ever married women (15-49)States/UTs
Databook for DCH; 5th December 2012 Page 168 of 266
National Family Health Survey (NFHS) & District Level Household and Facility Survey - Note
The National Family Health Survey (NFHS) is a large-scale, multi-round survey conducted in a representative sample of households throughout India. Three rounds of the survey have been conducted since the first survey in 1992-93. The survey provides state and national information for India on fertility, infant and child mortality, the practice of family planning, maternal and child health, reproductive health, nutrition, anaemia, utilization and quality of health and family planning services. Each successive round of the NFHS has had two specific goals: a) to provide essential data on health and family welfare needed by the Ministry of
Health and Family Welfare and other agencies for policy and programme purposes, and
b) to provide information on important emerging health and family welfare issues. The third National Family Health Survey (NFHS-3), coordinated by the International Institute for Population Sciences (IIPS) under the aegis of the Government of India, was conducted in 2005-06. As did NFHS-1 (1992-93) and NFHS-2 (1998-99), NFHS-3 provides information on fertility, mortality, family planning, HIV-related knowledge, and important aspects of nutrition, health, and health care. Unlike the earlier surveys, however, NFHS-3 interviewed men age 15-54 and never married women age 15-49, as well as ever-married women, and included questions on several emerging issues such as perinatal mortality, male involvement in maternal health care, adolescent reproductive health, higher-risk sexual behaviour, family life education, safe injections, and knowledge about tuberculosis. In addition, NFHS-3 carried out blood testing for HIV to provide, for the first time in India, population-based data on HIV prevalence. NFHS-3 collected information from a nationally representative sample of 109,041 households, 124,385 women age 15-49, and 74,369 men age 15-54. The NFHS-3 sample covers 99 percent of India’s population living in all 29 states. From among all the women and men interviewed nationwide, 102,946 were tested for HIV. Fieldwork for NFHS-3 was conducted in two phases from November 2005 to August 2006.
District Level Household and Facility survey Results of District Level Household Survey - III 2007-08 (DLHS - III)
1. The District Level Household and Facility Survey is one of the largest ever demographic and health surveys carried out in India, with a sample size of about seven lakh households covering all the districts of the country. 2. The Ministry of Health and Family Welfare (MOHFW), Government of India, initiated District Level Household Surveys (DLHS) in 1997 to provide district level estimates on health indicators to assists policy makers and program administrators in decentralized planning, monitoring and evaluation. 3. The present District Level Household Survey (DLHS-3) is the third in the series preceded by DLHS -1 in 1998-99 and DLHS-2 in 2002-04. DLHS-3, like two
Databook for DCH; 5th December 2012 Page 169 of 266
2
earlier rounds, is designed to provide estimates on maternal and child health, family planning and other reproductive health services. In addition, 4. DLHS-3 provides information related to the programmes of the National Rural Health Mission (NRHM). 5. Unlike other two rounds in which currently married women age 15-44 years were interviewed, DLHS-3 interviewed ever-married women (age 15-49). In DLHS-3, along with ever-married women age 15-49, never married women (age 15-24) are also included as respondents. 6. DLHS-3 adopts a multi-stage stratified probability proportion to size sampling design. Bilingual questionnaires in the local language and English pertaining to Household, Ever Married Women (age 15-49), Unmarried Women (age 15-24), Village and Health Facility were used in DLHS-3. 8. In the household questionnaire, information on all members of the household and socio-economic characteristics of the household, assets possessed, number of marriages and deaths in the household since January 2004, etc. were collected. 9. The ever-married women’s questionnaire contained information on women’s characteristics, maternal care, immunization and childcare, contraception and fertility preferences, reproductive health including knowledge about HIV/AIDS. 10. The unmarried women’s questionnaire contained information on women’s characteristics, family life education, awareness about reproductive health and contraception and HIV/AIDS, etc. The village questionnaire contained information on availability of health, education and other facilities in the village, and whether the facilities are accessible throughout the year. 11. The health facility questionnaires contained information on human resources, infrastructure, and services. 12. For the first time, a population-linked facility survey has been conducted in DLHS-3. At the district level, all Community Health Centres and the District Hospital were covered. Further, all Sub-Centres and Primary Health Centres which were expected to serve the population of the selected PSU were also covered. 14. Fieldwork in Uttar Pradesh was conducted during November 2007 to April 2008, gathering information from 90,363 households. At district level, separate fact sheets are available for all (70) districts of the state. Note : As it may be noted the period of coverage of NFHS 3 is different from coverage of DLHS survey. Moreover, focus is also different between the two surveys, so these are not comparable
*****
Databook for DCH; 5th December 2012 Page 170 of 266
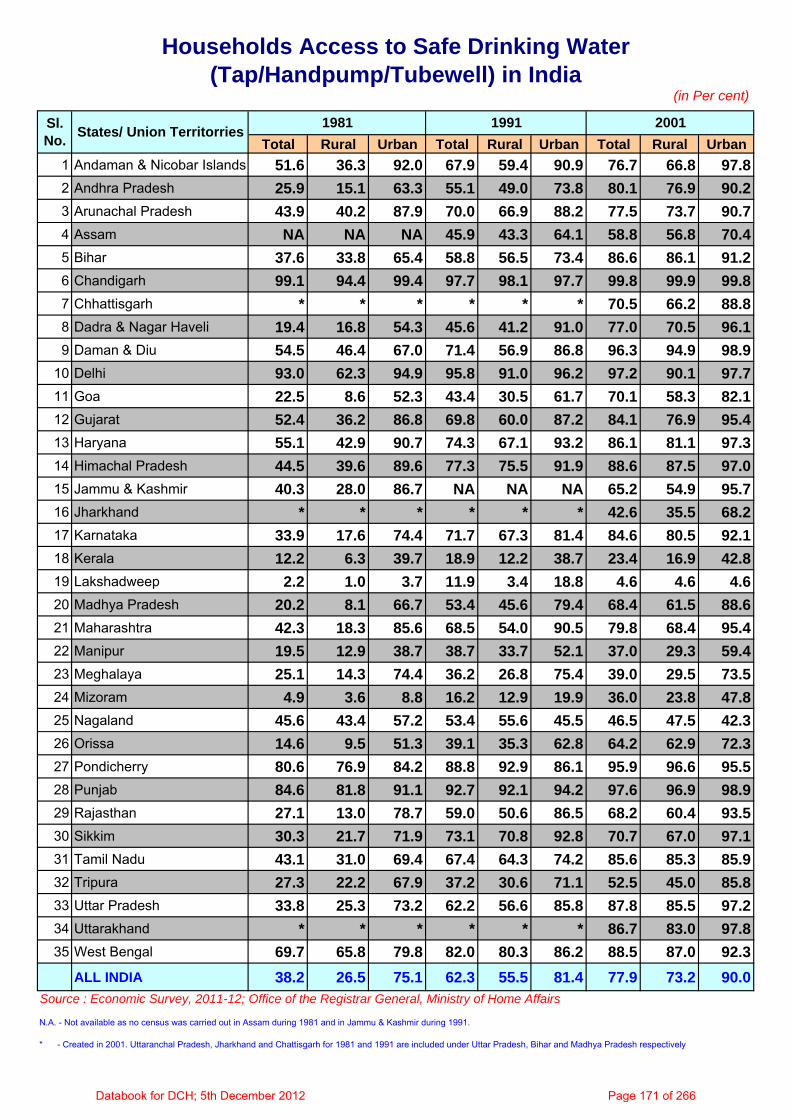
Households Access to Safe Drinking Water
(Tap/Handpump/Tubewell) in India (in Per cent)
Sl.
No.States/ Union Territorries
1981 1991 2001
Total Rural Urban Total Rural Urban Total Rural Urban
1 Andaman & Nicobar Islands 51.6 36.3 92.0 67.9 59.4 90.9 76.7 66.8 97.8
2 Andhra Pradesh 25.9 15.1 63.3 55.1 49.0 73.8 80.1 76.9 90.2
3 Arunachal Pradesh 43.9 40.2 87.9 70.0 66.9 88.2 77.5 73.7 90.7
4 Assam NA NA NA 45.9 43.3 64.1 58.8 56.8 70.4
5 Bihar 37.6 33.8 65.4 58.8 56.5 73.4 86.6 86.1 91.2
6 Chandigarh 99.1 94.4 99.4 97.7 98.1 97.7 99.8 99.9 99.8
7 Chhattisgarh * * * * * * 70.5 66.2 88.8
8 Dadra & Nagar Haveli 19.4 16.8 54.3 45.6 41.2 91.0 77.0 70.5 96.1
9 Daman & Diu 54.5 46.4 67.0 71.4 56.9 86.8 96.3 94.9 98.9
10 Delhi 93.0 62.3 94.9 95.8 91.0 96.2 97.2 90.1 97.7
11 Goa 22.5 8.6 52.3 43.4 30.5 61.7 70.1 58.3 82.1
12 Gujarat 52.4 36.2 86.8 69.8 60.0 87.2 84.1 76.9 95.4
13 Haryana 55.1 42.9 90.7 74.3 67.1 93.2 86.1 81.1 97.3
14 Himachal Pradesh 44.5 39.6 89.6 77.3 75.5 91.9 88.6 87.5 97.0
15 Jammu & Kashmir 40.3 28.0 86.7 NA NA NA 65.2 54.9 95.7
16 Jharkhand * * * * * * 42.6 35.5 68.2
17 Karnataka 33.9 17.6 74.4 71.7 67.3 81.4 84.6 80.5 92.1
18 Kerala 12.2 6.3 39.7 18.9 12.2 38.7 23.4 16.9 42.8
19 Lakshadweep 2.2 1.0 3.7 11.9 3.4 18.8 4.6 4.6 4.6
20 Madhya Pradesh 20.2 8.1 66.7 53.4 45.6 79.4 68.4 61.5 88.6
21 Maharashtra 42.3 18.3 85.6 68.5 54.0 90.5 79.8 68.4 95.4
22 Manipur 19.5 12.9 38.7 38.7 33.7 52.1 37.0 29.3 59.4
23 Meghalaya 25.1 14.3 74.4 36.2 26.8 75.4 39.0 29.5 73.5
24 Mizoram 4.9 3.6 8.8 16.2 12.9 19.9 36.0 23.8 47.8
25 Nagaland 45.6 43.4 57.2 53.4 55.6 45.5 46.5 47.5 42.3
26 Orissa 14.6 9.5 51.3 39.1 35.3 62.8 64.2 62.9 72.3
27 Pondicherry 80.6 76.9 84.2 88.8 92.9 86.1 95.9 96.6 95.5
28 Punjab 84.6 81.8 91.1 92.7 92.1 94.2 97.6 96.9 98.9
29 Rajasthan 27.1 13.0 78.7 59.0 50.6 86.5 68.2 60.4 93.5
30 Sikkim 30.3 21.7 71.9 73.1 70.8 92.8 70.7 67.0 97.1
31 Tamil Nadu 43.1 31.0 69.4 67.4 64.3 74.2 85.6 85.3 85.9
32 Tripura 27.3 22.2 67.9 37.2 30.6 71.1 52.5 45.0 85.8
33 Uttar Pradesh 33.8 25.3 73.2 62.2 56.6 85.8 87.8 85.5 97.2
34 Uttarakhand * * * * * * 86.7 83.0 97.8
35 West Bengal 69.7 65.8 79.8 82.0 80.3 86.2 88.5 87.0 92.3
ALL INDIA 38.2 26.5 75.1 62.3 55.5 81.4 77.9 73.2 90.0
Source : Economic Survey, 2011-12; Office of the Registrar General, Ministry of Home Affairs
N.A. - Not available as no census was carried out in Assam during 1981 and in Jammu & Kashmir during 1991.
* - Created in 2001. Uttaranchal Pradesh, Jharkhand and Chattisgarh for 1981 and 1991 are included under Uttar Pradesh, Bihar and Madhya Pradesh respectively
Databook for DCH; 5th December 2012 Page 171 of 266
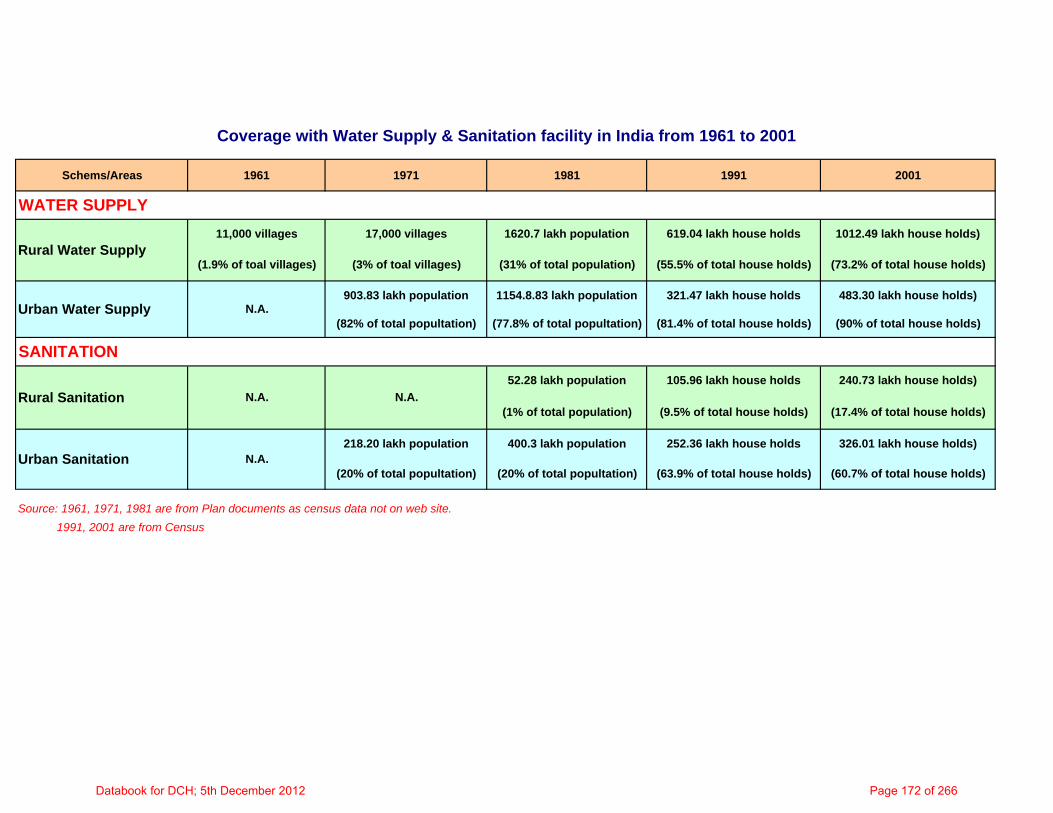
Coverage with Water Supply & Sanitation facility in India from 1961 to 2001
Schems/Areas 1961 1971 1981 1991 2001
WATER SUPPLY11,000 villages 17,000 villages 1620.7 lakh population 619.04 lakh house holds 1012.49 lakh house holds)
Rural Water Supply(1.9% of toal villages) (3% of toal villages) (31% of total population) (55.5% of total house holds) (73.2% of total house holds)
903.83 lakh population 1154.8.83 lakh population 321.47 lakh house holds 483.30 lakh house holds)Urban Water Supply N.A.
(82% of total popultation) (77.8% of total popultation) (81.4% of total house holds) (90% of total house holds)
SANITATION52.28 lakh population 105.96 lakh house holds 240.73 lakh house holds)
Rural Sanitation N.A. N.A.(1% of total population) (9.5% of total house holds) (17.4% of total house holds)
218.20 lakh population 400.3 lakh population 252.36 lakh house holds 326.01 lakh house holds)Urban Sanitation N.A.
(20% of total popultation) (20% of total popultation) (63.9% of total house holds) (60.7% of total house holds)
Source: 1961, 1971, 1981 are from Plan documents as census data not on web site. 1991, 2001 are from Census
Databook for DCH; 5th December 2012 Page 172 of 266
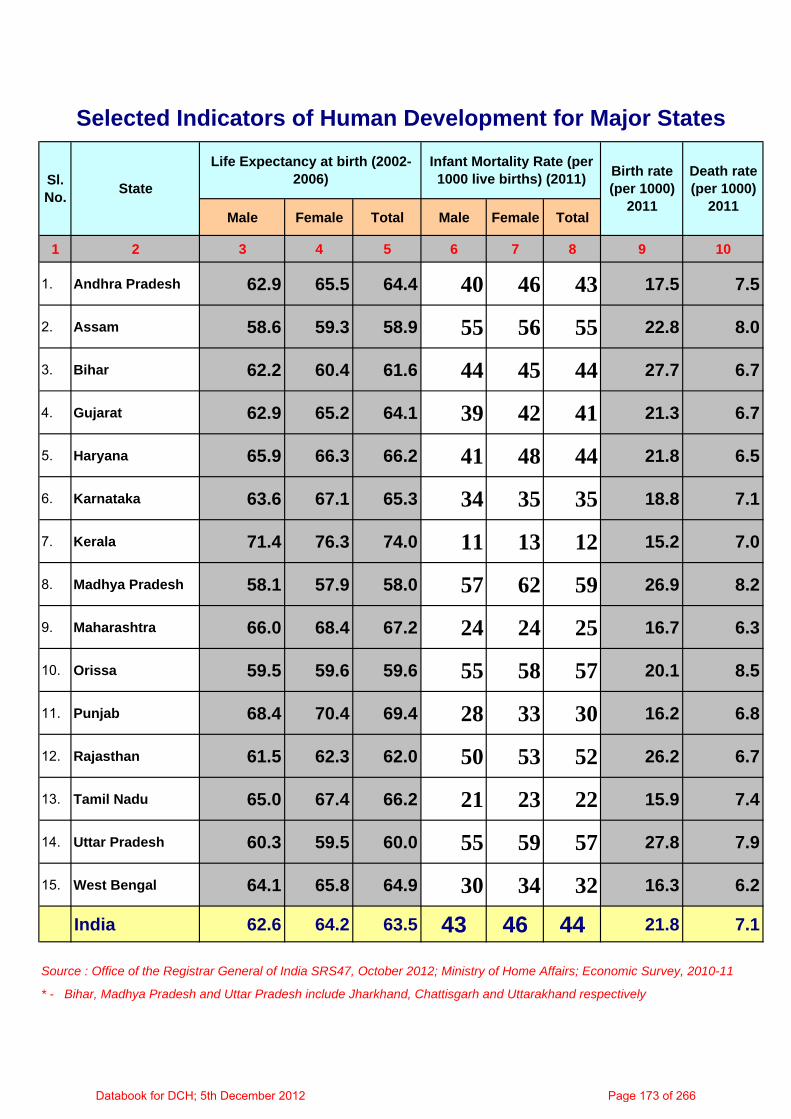
Selected Indicators of Human Development for Major States
Sl.
No.State
Life Expectancy at birth (2002-
2006)
Infant Mortality Rate (per
1000 live births) (2011)Birth rate
(per 1000)
2011
Death rate
(per 1000)
2011Male Female Total Male Female Total
1 2 3 4 5 6 7 8 9 10
1. Andhra Pradesh 62.9 65.5 64.4 40 46 43 17.5 7.5
2. Assam 58.6 59.3 58.9 55 56 55 22.8 8.0
3. Bihar 62.2 60.4 61.6 44 45 44 27.7 6.7
4. Gujarat 62.9 65.2 64.1 39 42 41 21.3 6.7
5. Haryana 65.9 66.3 66.2 41 48 44 21.8 6.5
6. Karnataka 63.6 67.1 65.3 34 35 35 18.8 7.1
7. Kerala 71.4 76.3 74.0 11 13 12 15.2 7.0
8. Madhya Pradesh 58.1 57.9 58.0 57 62 59 26.9 8.2
9. Maharashtra 66.0 68.4 67.2 24 24 25 16.7 6.3
10. Orissa 59.5 59.6 59.6 55 58 57 20.1 8.5
11. Punjab 68.4 70.4 69.4 28 33 30 16.2 6.8
12. Rajasthan 61.5 62.3 62.0 50 53 52 26.2 6.7
13. Tamil Nadu 65.0 67.4 66.2 21 23 22 15.9 7.4
14. Uttar Pradesh 60.3 59.5 60.0 55 59 57 27.8 7.9
15. West Bengal 64.1 65.8 64.9 30 34 32 16.3 6.2
India 62.6 64.2 63.5 43 46 44 21.8 7.1
Source : Office of the Registrar General of India SRS47, October 2012; Ministry of Home Affairs; Economic Survey, 2010-11
* - Bihar, Madhya Pradesh and Uttar Pradesh include Jharkhand, Chattisgarh and Uttarakhand respectively
Databook for DCH; 5th December 2012 Page 173 of 266
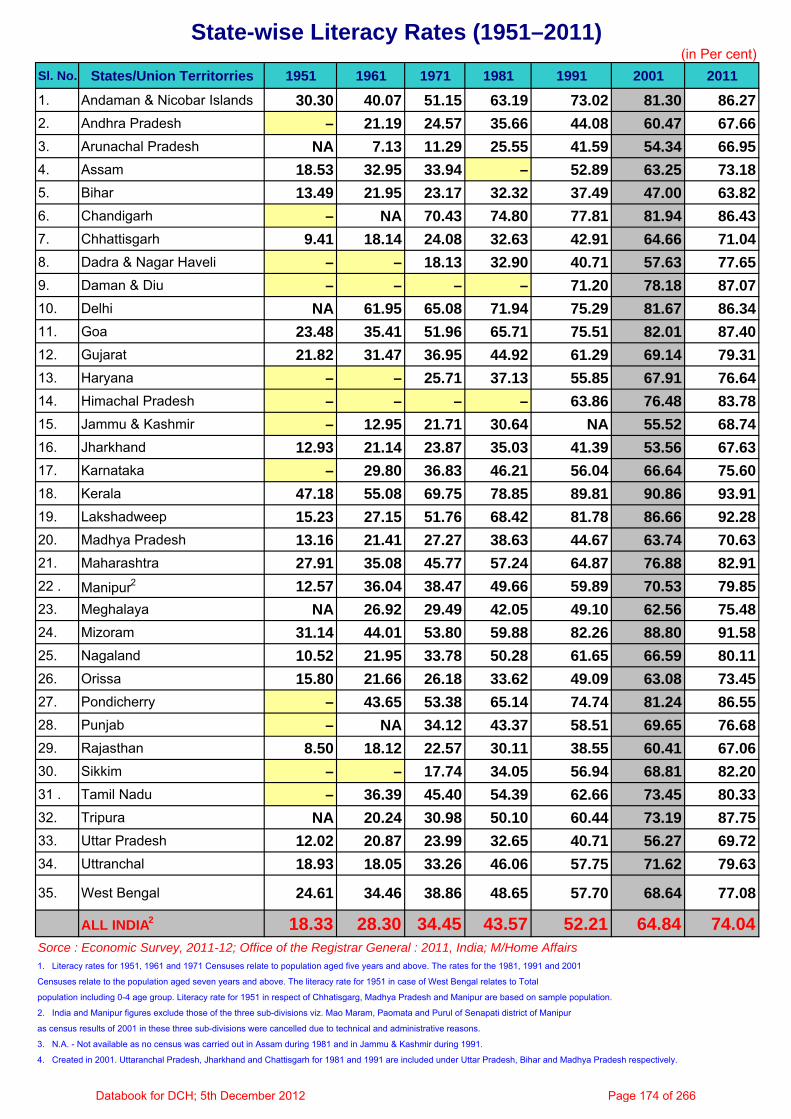
State-wise Literacy Rates (1951–2011)(in Per cent)
Sl. No. States/Union Territorries 1951 1961 1971 1981 1991 2001 2011
1. Andaman & Nicobar Islands 30.30 40.07 51.15 63.19 73.02 81.30 86.27
2. Andhra Pradesh – 21.19 24.57 35.66 44.08 60.47 67.66
3. Arunachal Pradesh NA 7.13 11.29 25.55 41.59 54.34 66.95
4. Assam 18.53 32.95 33.94 – 52.89 63.25 73.18
5. Bihar 13.49 21.95 23.17 32.32 37.49 47.00 63.82
6. Chandigarh – NA 70.43 74.80 77.81 81.94 86.43
7. Chhattisgarh 9.41 18.14 24.08 32.63 42.91 64.66 71.04
8. Dadra & Nagar Haveli – – 18.13 32.90 40.71 57.63 77.65
9. Daman & Diu – – – – 71.20 78.18 87.07
10. Delhi NA 61.95 65.08 71.94 75.29 81.67 86.34
11. Goa 23.48 35.41 51.96 65.71 75.51 82.01 87.40
12. Gujarat 21.82 31.47 36.95 44.92 61.29 69.14 79.31
13. Haryana – – 25.71 37.13 55.85 67.91 76.64
14. Himachal Pradesh – – – – 63.86 76.48 83.78
15. Jammu & Kashmir – 12.95 21.71 30.64 NA 55.52 68.74
16. Jharkhand 12.93 21.14 23.87 35.03 41.39 53.56 67.63
17. Karnataka – 29.80 36.83 46.21 56.04 66.64 75.60
18. Kerala 47.18 55.08 69.75 78.85 89.81 90.86 93.91
19. Lakshadweep 15.23 27.15 51.76 68.42 81.78 86.66 92.28
20. Madhya Pradesh 13.16 21.41 27.27 38.63 44.67 63.74 70.63
21. Maharashtra 27.91 35.08 45.77 57.24 64.87 76.88 82.91
22 . Manipur2 12.57 36.04 38.47 49.66 59.89 70.53 79.85
23. Meghalaya NA 26.92 29.49 42.05 49.10 62.56 75.48
24. Mizoram 31.14 44.01 53.80 59.88 82.26 88.80 91.58
25. Nagaland 10.52 21.95 33.78 50.28 61.65 66.59 80.11
26. Orissa 15.80 21.66 26.18 33.62 49.09 63.08 73.45
27. Pondicherry – 43.65 53.38 65.14 74.74 81.24 86.55
28. Punjab – NA 34.12 43.37 58.51 69.65 76.68
29. Rajasthan 8.50 18.12 22.57 30.11 38.55 60.41 67.06
30. Sikkim – – 17.74 34.05 56.94 68.81 82.20
31 . Tamil Nadu – 36.39 45.40 54.39 62.66 73.45 80.33
32. Tripura NA 20.24 30.98 50.10 60.44 73.19 87.75
33. Uttar Pradesh 12.02 20.87 23.99 32.65 40.71 56.27 69.72
34. Uttranchal 18.93 18.05 33.26 46.06 57.75 71.62 79.63
35. West Bengal 24.61 34.46 38.86 48.65 57.70 68.64 77.08
ALL INDIA2 18.33 28.30 34.45 43.57 52.21 64.84 74.04
Sorce : Economic Survey, 2011-12; Office of the Registrar General : 2011, India; M/Home Affairs1. Literacy rates for 1951, 1961 and 1971 Censuses relate to population aged five years and above. The rates for the 1981, 1991 and 2001
Censuses relate to the population aged seven years and above. The literacy rate for 1951 in case of West Bengal relates to Total
population including 0-4 age group. Literacy rate for 1951 in respect of Chhatisgarg, Madhya Pradesh and Manipur are based on sample population.
2. India and Manipur figures exclude those of the three sub-divisions viz. Mao Maram, Paomata and Purul of Senapati district of Manipur
as census results of 2001 in these three sub-divisions were cancelled due to technical and administrative reasons.
3. N.A. - Not available as no census was carried out in Assam during 1981 and in Jammu & Kashmir during 1991.
4. Created in 2001. Uttaranchal Pradesh, Jharkhand and Chattisgarh for 1981 and 1991 are included under Uttar Pradesh, Bihar and Madhya Pradesh respectively.
Databook for DCH; 5th December 2012 Page 174 of 266
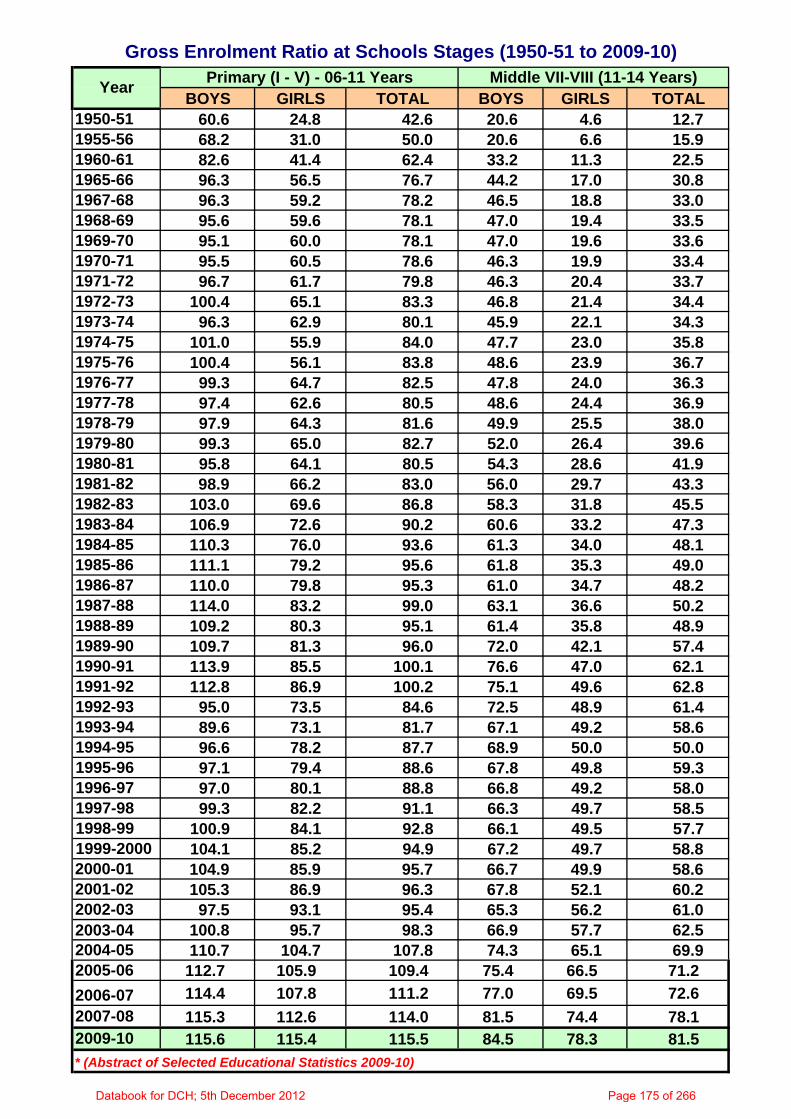
Gross Enrolment Ratio at Schools Stages (1950-51 to 2009-10)
YearPrimary (I - V) - 06-11 Years Middle VII-VIII (11-14 Years)
BOYS GIRLS TOTAL BOYS GIRLS TOTAL
1950-51 60.6 24.8 42.6 20.6 4.6 12.7
1955-56 68.2 31.0 50.0 20.6 6.6 15.9
1960-61 82.6 41.4 62.4 33.2 11.3 22.5
1965-66 96.3 56.5 76.7 44.2 17.0 30.8
1967-68 96.3 59.2 78.2 46.5 18.8 33.0
1968-69 95.6 59.6 78.1 47.0 19.4 33.5
1969-70 95.1 60.0 78.1 47.0 19.6 33.6
1970-71 95.5 60.5 78.6 46.3 19.9 33.4
1971-72 96.7 61.7 79.8 46.3 20.4 33.7
1972-73 100.4 65.1 83.3 46.8 21.4 34.4
1973-74 96.3 62.9 80.1 45.9 22.1 34.3
1974-75 101.0 55.9 84.0 47.7 23.0 35.8
1975-76 100.4 56.1 83.8 48.6 23.9 36.7
1976-77 99.3 64.7 82.5 47.8 24.0 36.3
1977-78 97.4 62.6 80.5 48.6 24.4 36.9
1978-79 97.9 64.3 81.6 49.9 25.5 38.0
1979-80 99.3 65.0 82.7 52.0 26.4 39.6
1980-81 95.8 64.1 80.5 54.3 28.6 41.9
1981-82 98.9 66.2 83.0 56.0 29.7 43.3
1982-83 103.0 69.6 86.8 58.3 31.8 45.5
1983-84 106.9 72.6 90.2 60.6 33.2 47.3
1984-85 110.3 76.0 93.6 61.3 34.0 48.1
1985-86 111.1 79.2 95.6 61.8 35.3 49.0
1986-87 110.0 79.8 95.3 61.0 34.7 48.2
1987-88 114.0 83.2 99.0 63.1 36.6 50.2
1988-89 109.2 80.3 95.1 61.4 35.8 48.9
1989-90 109.7 81.3 96.0 72.0 42.1 57.4
1990-91 113.9 85.5 100.1 76.6 47.0 62.1
1991-92 112.8 86.9 100.2 75.1 49.6 62.8
1992-93 95.0 73.5 84.6 72.5 48.9 61.4
1993-94 89.6 73.1 81.7 67.1 49.2 58.6
1994-95 96.6 78.2 87.7 68.9 50.0 50.0
1995-96 97.1 79.4 88.6 67.8 49.8 59.3
1996-97 97.0 80.1 88.8 66.8 49.2 58.0
1997-98 99.3 82.2 91.1 66.3 49.7 58.5
1998-99 100.9 84.1 92.8 66.1 49.5 57.7
1999-2000 104.1 85.2 94.9 67.2 49.7 58.8
2000-01 104.9 85.9 95.7 66.7 49.9 58.6
2001-02 105.3 86.9 96.3 67.8 52.1 60.2
2002-03 97.5 93.1 95.4 65.3 56.2 61.0
2003-04 100.8 95.7 98.3 66.9 57.7 62.5
2004-05 110.7 104.7 107.8 74.3 65.1 69.9
2005-06 112.7 105.9 109.4 75.4 66.5 71.2
2006-07 114.4 107.8 111.2 77.0 69.5 72.6
2007-08 115.3 112.6 114.0 81.5 74.4 78.1
2009-10 115.6 115.4 115.5 84.5 78.3 81.5
* (Abstract of Selected Educational Statistics 2009-10)
Databook for DCH; 5th December 2012 Page 175 of 266
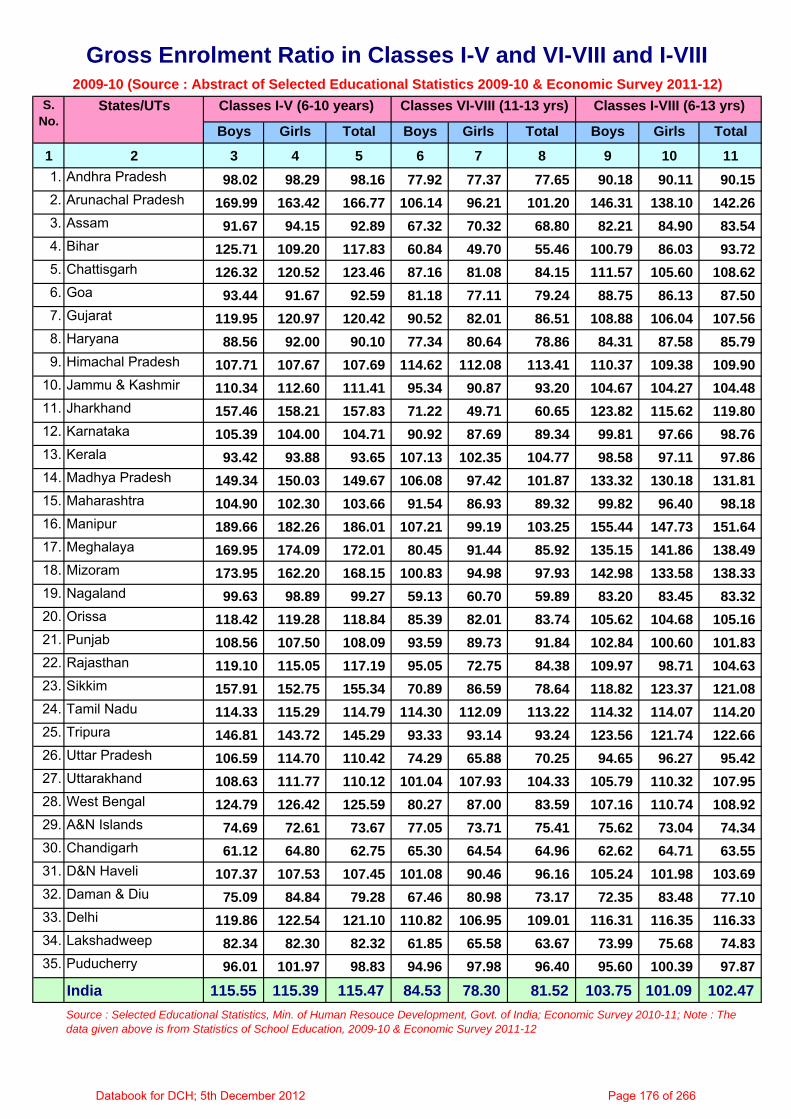
Gross Enrolment Ratio in Classes I-V and VI-VIII and I-VIII2009-10 (Source : Abstract of Selected Educational Statistics 2009-10 & Economic Survey 2011-12)
S.
No.
States/UTs Classes I-V (6-10 years) Classes VI-VIII (11-13 yrs) Classes I-VIII (6-13 yrs)
Boys Girls Total Boys Girls Total Boys Girls Total
1 2 3 4 5 6 7 8 9 10 11
1. Andhra Pradesh 98.02 98.29 98.16 77.92 77.37 77.65 90.18 90.11 90.15
2. Arunachal Pradesh 169.99 163.42 166.77 106.14 96.21 101.20 146.31 138.10 142.26
3. Assam 91.67 94.15 92.89 67.32 70.32 68.80 82.21 84.90 83.54
4. Bihar 125.71 109.20 117.83 60.84 49.70 55.46 100.79 86.03 93.72
5. Chattisgarh 126.32 120.52 123.46 87.16 81.08 84.15 111.57 105.60 108.62
6. Goa 93.44 91.67 92.59 81.18 77.11 79.24 88.75 86.13 87.50
7. Gujarat 119.95 120.97 120.42 90.52 82.01 86.51 108.88 106.04 107.56
8. Haryana 88.56 92.00 90.10 77.34 80.64 78.86 84.31 87.58 85.79
9. Himachal Pradesh 107.71 107.67 107.69 114.62 112.08 113.41 110.37 109.38 109.90
10. Jammu & Kashmir 110.34 112.60 111.41 95.34 90.87 93.20 104.67 104.27 104.48
11. Jharkhand 157.46 158.21 157.83 71.22 49.71 60.65 123.82 115.62 119.80
12. Karnataka 105.39 104.00 104.71 90.92 87.69 89.34 99.81 97.66 98.76
13. Kerala 93.42 93.88 93.65 107.13 102.35 104.77 98.58 97.11 97.86
14. Madhya Pradesh 149.34 150.03 149.67 106.08 97.42 101.87 133.32 130.18 131.81
15. Maharashtra 104.90 102.30 103.66 91.54 86.93 89.32 99.82 96.40 98.18
16. Manipur 189.66 182.26 186.01 107.21 99.19 103.25 155.44 147.73 151.64
17. Meghalaya 169.95 174.09 172.01 80.45 91.44 85.92 135.15 141.86 138.49
18. Mizoram 173.95 162.20 168.15 100.83 94.98 97.93 142.98 133.58 138.33
19. Nagaland 99.63 98.89 99.27 59.13 60.70 59.89 83.20 83.45 83.32
20. Orissa 118.42 119.28 118.84 85.39 82.01 83.74 105.62 104.68 105.16
21. Punjab 108.56 107.50 108.09 93.59 89.73 91.84 102.84 100.60 101.83
22. Rajasthan 119.10 115.05 117.19 95.05 72.75 84.38 109.97 98.71 104.63
23. Sikkim 157.91 152.75 155.34 70.89 86.59 78.64 118.82 123.37 121.08
24. Tamil Nadu 114.33 115.29 114.79 114.30 112.09 113.22 114.32 114.07 114.20
25. Tripura 146.81 143.72 145.29 93.33 93.14 93.24 123.56 121.74 122.66
26. Uttar Pradesh 106.59 114.70 110.42 74.29 65.88 70.25 94.65 96.27 95.42
27. Uttarakhand 108.63 111.77 110.12 101.04 107.93 104.33 105.79 110.32 107.95
28. West Bengal 124.79 126.42 125.59 80.27 87.00 83.59 107.16 110.74 108.92
29. A&N Islands 74.69 72.61 73.67 77.05 73.71 75.41 75.62 73.04 74.34
30. Chandigarh 61.12 64.80 62.75 65.30 64.54 64.96 62.62 64.71 63.55
31. D&N Haveli 107.37 107.53 107.45 101.08 90.46 96.16 105.24 101.98 103.69
32. Daman & Diu 75.09 84.84 79.28 67.46 80.98 73.17 72.35 83.48 77.10
33. Delhi 119.86 122.54 121.10 110.82 106.95 109.01 116.31 116.35 116.33
34. Lakshadweep 82.34 82.30 82.32 61.85 65.58 63.67 73.99 75.68 74.83
35. Puducherry 96.01 101.97 98.83 94.96 97.98 96.40 95.60 100.39 97.87
India 115.55 115.39 115.47 84.53 78.30 81.52 103.75 101.09 102.47
Source : Selected Educational Statistics, Min. of Human Resouce Development, Govt. of India; Economic Survey 2010-11; Note : The data given above is from Statistics of School Education, 2009-10 & Economic Survey 2011-12
Databook for DCH; 5th December 2012 Page 176 of 266
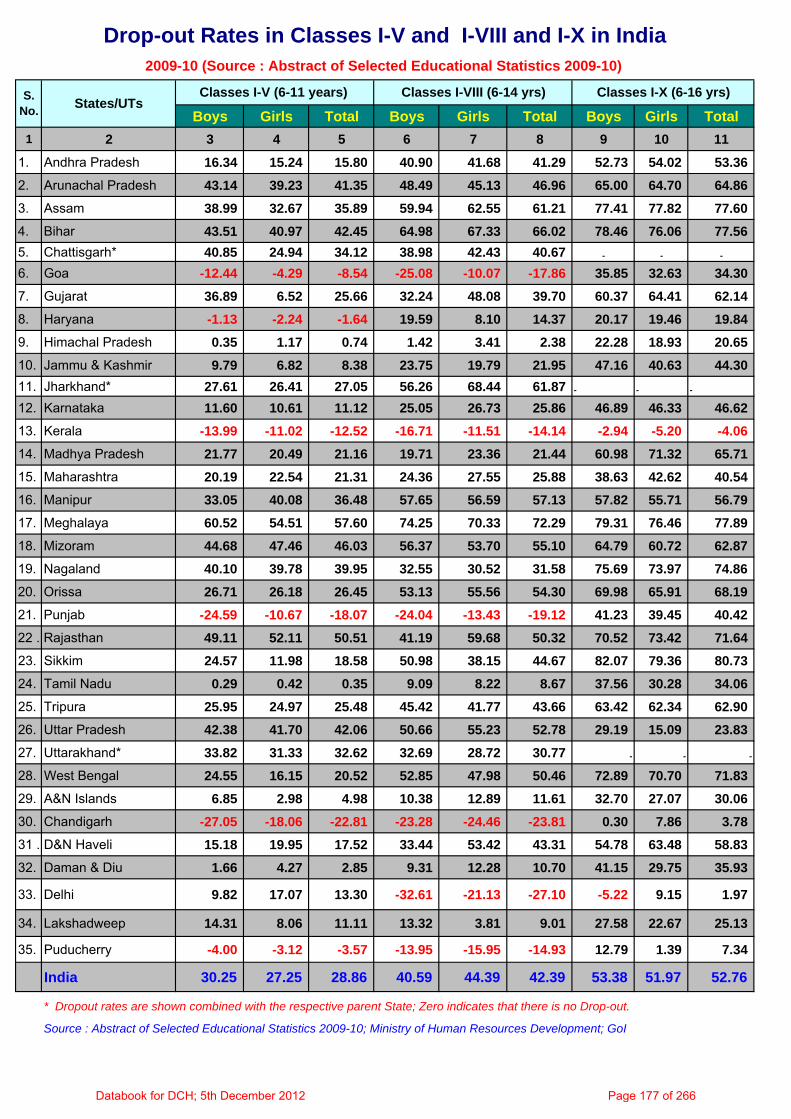
Drop-out Rates in Classes I-V and I-VIII and I-X in India
2009-10 (Source : Abstract of Selected Educational Statistics 2009-10)
S.
No.States/UTs
Classes I-V (6-11 years) Classes I-VIII (6-14 yrs) Classes I-X (6-16 yrs)
Boys Girls Total Boys Girls Total Boys Girls Total
1 2 3 4 5 6 7 8 9 10 11
1. Andhra Pradesh 16.34 15.24 15.80 40.90 41.68 41.29 52.73 54.02 53.36
2. Arunachal Pradesh 43.14 39.23 41.35 48.49 45.13 46.96 65.00 64.70 64.86
3. Assam 38.99 32.67 35.89 59.94 62.55 61.21 77.41 77.82 77.60
4. Bihar 43.51 40.97 42.45 64.98 67.33 66.02 78.46 76.06 77.56
5. Chattisgarh* 40.85 24.94 34.12 38.98 42.43 40.67 - - -
6. Goa -12.44 -4.29 -8.54 -25.08 -10.07 -17.86 35.85 32.63 34.30
7. Gujarat 36.89 6.52 25.66 32.24 48.08 39.70 60.37 64.41 62.14
8. Haryana -1.13 -2.24 -1.64 19.59 8.10 14.37 20.17 19.46 19.84
9. Himachal Pradesh 0.35 1.17 0.74 1.42 3.41 2.38 22.28 18.93 20.65
10. Jammu & Kashmir 9.79 6.82 8.38 23.75 19.79 21.95 47.16 40.63 44.30
11. Jharkhand* 27.61 26.41 27.05 56.26 68.44 61.87 - - -
12. Karnataka 11.60 10.61 11.12 25.05 26.73 25.86 46.89 46.33 46.62
13. Kerala -13.99 -11.02 -12.52 -16.71 -11.51 -14.14 -2.94 -5.20 -4.06
14. Madhya Pradesh 21.77 20.49 21.16 19.71 23.36 21.44 60.98 71.32 65.71
15. Maharashtra 20.19 22.54 21.31 24.36 27.55 25.88 38.63 42.62 40.54
16. Manipur 33.05 40.08 36.48 57.65 56.59 57.13 57.82 55.71 56.79
17. Meghalaya 60.52 54.51 57.60 74.25 70.33 72.29 79.31 76.46 77.89
18. Mizoram 44.68 47.46 46.03 56.37 53.70 55.10 64.79 60.72 62.87
19. Nagaland 40.10 39.78 39.95 32.55 30.52 31.58 75.69 73.97 74.86
20. Orissa 26.71 26.18 26.45 53.13 55.56 54.30 69.98 65.91 68.19
21. Punjab -24.59 -10.67 -18.07 -24.04 -13.43 -19.12 41.23 39.45 40.42
22 . Rajasthan 49.11 52.11 50.51 41.19 59.68 50.32 70.52 73.42 71.64
23. Sikkim 24.57 11.98 18.58 50.98 38.15 44.67 82.07 79.36 80.73
24. Tamil Nadu 0.29 0.42 0.35 9.09 8.22 8.67 37.56 30.28 34.06
25. Tripura 25.95 24.97 25.48 45.42 41.77 43.66 63.42 62.34 62.90
26. Uttar Pradesh 42.38 41.70 42.06 50.66 55.23 52.78 29.19 15.09 23.83
27. Uttarakhand* 33.82 31.33 32.62 32.69 28.72 30.77 - - -
28. West Bengal 24.55 16.15 20.52 52.85 47.98 50.46 72.89 70.70 71.83
29. A&N Islands 6.85 2.98 4.98 10.38 12.89 11.61 32.70 27.07 30.06
30. Chandigarh -27.05 -18.06 -22.81 -23.28 -24.46 -23.81 0.30 7.86 3.78
31 . D&N Haveli 15.18 19.95 17.52 33.44 53.42 43.31 54.78 63.48 58.83
32. Daman & Diu 1.66 4.27 2.85 9.31 12.28 10.70 41.15 29.75 35.93
33. Delhi 9.82 17.07 13.30 -32.61 -21.13 -27.10 -5.22 9.15 1.97
34. Lakshadweep 14.31 8.06 11.11 13.32 3.81 9.01 27.58 22.67 25.13
35. Puducherry -4.00 -3.12 -3.57 -13.95 -15.95 -14.93 12.79 1.39 7.34
India 30.25 27.25 28.86 40.59 44.39 42.39 53.38 51.97 52.76
* Dropout rates are shown combined with the respective parent State; Zero indicates that there is no Drop-out.
Source : Abstract of Selected Educational Statistics 2009-10; Ministry of Human Resources Development; GoI
Databook for DCH; 5th December 2012 Page 177 of 266
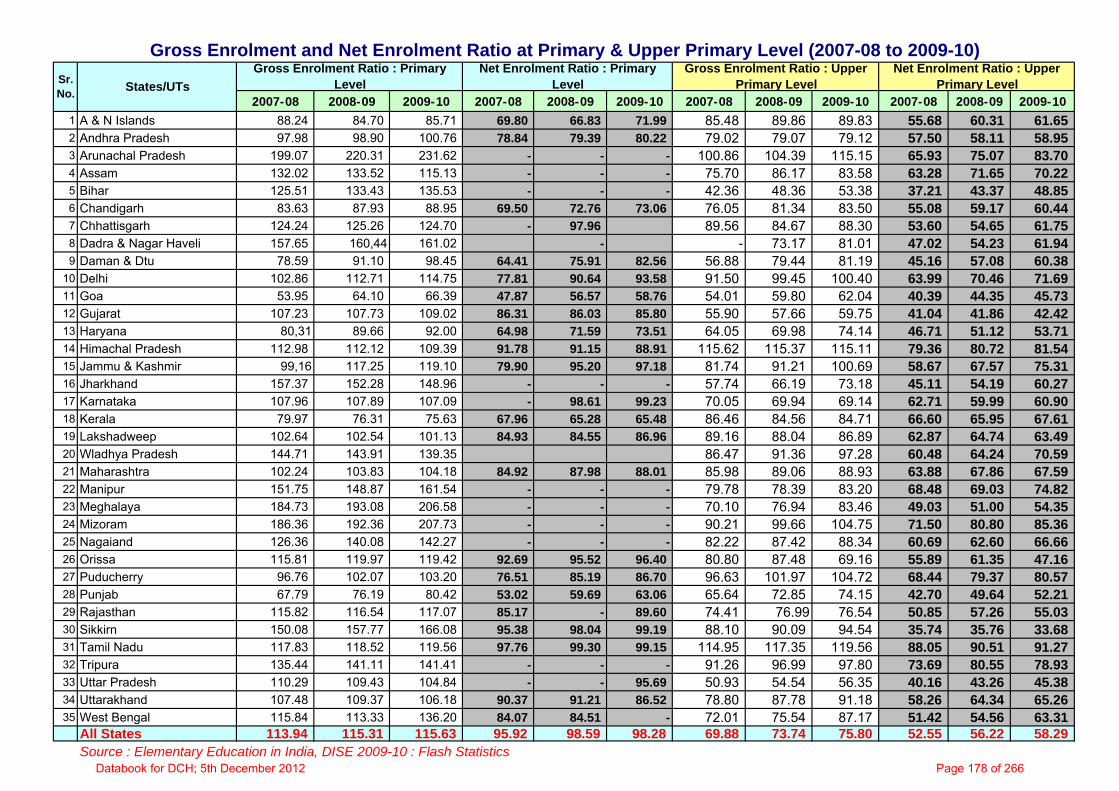
Gross Enrolment and Net Enrolment Ratio at Primary & Upper Primary Level (2007-08 to 2009-10)
Sr.
No.States/UTs
Gross Enrolment Ratio : Primary
Level
Net Enrolment Ratio : Primary
Level
Gross Enrolment Ratio : Upper
Primary Level
Net Enrolment Ratio : Upper
Primary Level
2007-08 2008-09 2009-10 2007-08 2008-09 2009-10 2007-08 2008-09 2009-10 2007-08 2008-09 2009-101 A & N Islands 88.24 84.70 85.71 69.80 66.83 71.99 85.48 89.86 89.83 55.68 60.31 61.65
2 Andhra Pradesh 97.98 98.90 100.76 78.84 79.39 80.22 79.02 79.07 79.12 57.50 58.11 58.95
3 Arunachal Pradesh 199.07 220.31 231.62 - - - 100.86 104.39 115.15 65.93 75.07 83.70
4 Assam 132.02 133.52 115.13 - - - 75.70 86.17 83.58 63.28 71.65 70.22
5 Bihar 125.51 133.43 135.53 - - - 42.36 48.36 53.38 37.21 43.37 48.85
6 Chandigarh 83.63 87.93 88.95 69.50 72.76 73.06 76.05 81.34 83.50 55.08 59.17 60.44
7 Chhattisgarh 124.24 125.26 124.70 - 97.96 89.56 84.67 88.30 53.60 54.65 61.75
8 Dadra & Nagar Haveli 157.65 160,44 161.02 - - 73.17 81.01 47.02 54.23 61.94
9 Daman & Dtu 78.59 91.10 98.45 64.41 75.91 82.56 56.88 79.44 81.19 45.16 57.08 60.38
10 Delhi 102.86 112.71 114.75 77.81 90.64 93.58 91.50 99.45 100.40 63.99 70.46 71.69
11 Goa 53.95 64.10 66.39 47.87 56.57 58.76 54.01 59.80 62.04 40.39 44.35 45.73
12 Gujarat 107.23 107.73 109.02 86.31 86.03 85.80 55.90 57.66 59.75 41.04 41.86 42.42
13 Haryana 80,31 89.66 92.00 64.98 71.59 73.51 64.05 69.98 74.14 46.71 51.12 53.71
14 Himachal Pradesh 112.98 112.12 109.39 91.78 91.15 88.91 115.62 115.37 115.11 79.36 80.72 81.54
15 Jammu & Kashmir 99,16 117.25 119.10 79.90 95.20 97.18 81.74 91.21 100.69 58.67 67.57 75.31
16 Jharkhand 157.37 152.28 148.96 - - - 57.74 66.19 73.18 45.11 54.19 60.27
17 Karnataka 107.96 107.89 107.09 - 98.61 99.23 70.05 69.94 69.14 62.71 59.99 60.90
18 Kerala 79.97 76.31 75.63 67.96 65.28 65.48 86.46 84.56 84.71 66.60 65.95 67.61
19 Lakshadweep 102.64 102.54 101.13 84.93 84.55 86.96 89.16 88.04 86.89 62.87 64.74 63.49
20 Wladhya Pradesh 144.71 143.91 139.35 86.47 91.36 97.28 60.48 64.24 70.59
21 Maharashtra 102.24 103.83 104.18 84.92 87.98 88.01 85.98 89.06 88.93 63.88 67.86 67.59
22 Manipur 151.75 148.87 161.54 - - - 79.78 78.39 83.20 68.48 69.03 74.82
23 Meghalaya 184.73 193.08 206.58 - - - 70.10 76.94 83.46 49.03 51.00 54.35
24 Mizoram 186.36 192.36 207.73 - - - 90.21 99.66 104.75 71.50 80.80 85.36
25 Nagaiand 126.36 140.08 142.27 - - - 82.22 87.42 88.34 60.69 62.60 66.66
26 Orissa 115.81 119.97 119.42 92.69 95.52 96.40 80.80 87.48 69.16 55.89 61.35 47.16
27 Puducherry 96.76 102.07 103.20 76.51 85.19 86.70 96.63 101.97 104.72 68.44 79.37 80.57
28 Punjab 67.79 76.19 80.42 53.02 59.69 63.06 65.64 72.85 74.15 42.70 49.64 52.21
29 Rajasthan 115.82 116.54 117.07 85.17 - 89.60 74.41 76.99 76.54 50.85 57.26 55.03
30 Sikkirn 150.08 157.77 166.08 95.38 98.04 99.19 88.10 90.09 94.54 35.74 35.76 33.68
31 Tamil Nadu 117.83 118.52 119.56 97.76 99.30 99.15 114.95 117.35 119.56 88.05 90.51 91.27
32 Tripura 135.44 141.11 141.41 - - - 91.26 96.99 97.80 73.69 80.55 78.93
33 Uttar Pradesh 110.29 109.43 104.84 - - 95.69 50.93 54.54 56.35 40.16 43.26 45.38
34 Uttarakhand 107.48 109.37 106.18 90.37 91.21 86.52 78.80 87.78 91.18 58.26 64.34 65.26
35 West Bengal 115.84 113.33 136.20 84.07 84.51 - 72.01 75.54 87.17 51.42 54.56 63.31
All States 113.94 115.31 115.63 95.92 98.59 98.28 69.88 73.74 75.80 52.55 56.22 58.29
Source : Elementary Education in India, DISE 2009-10 : Flash StatisticsDatabook for DCH; 5th December 2012 Page 178 of 266
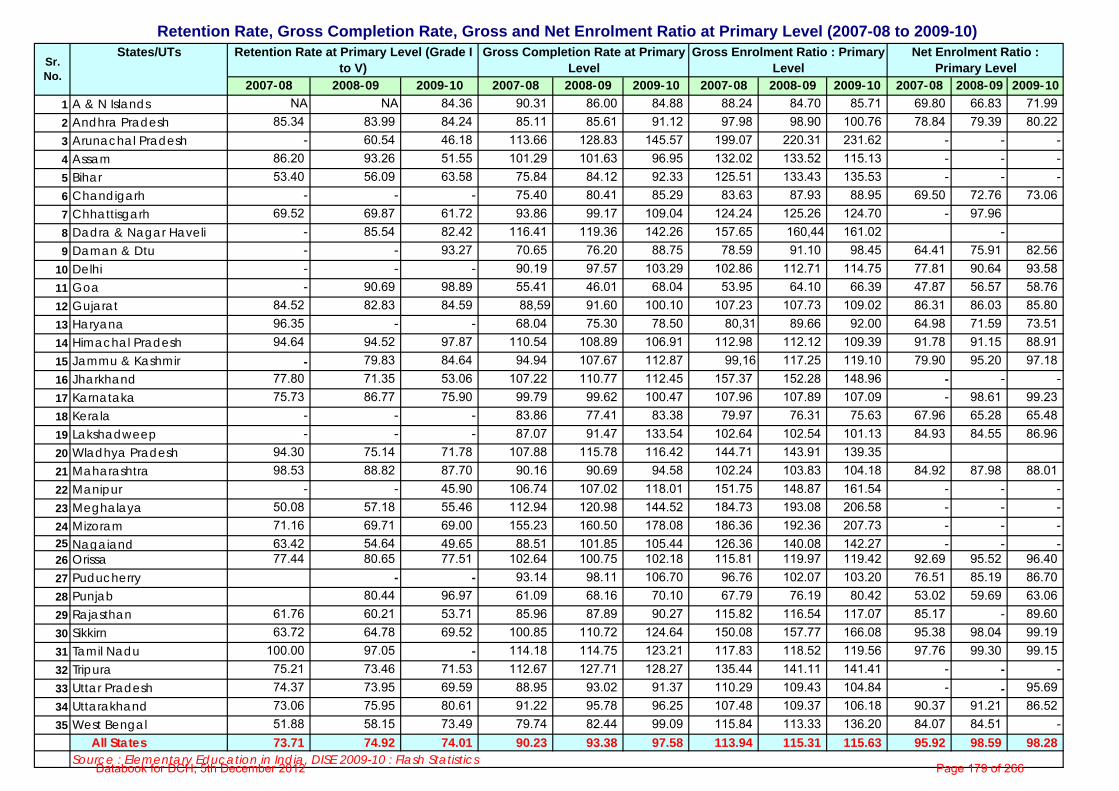
Retention Rate, Gross Completion Rate, Gross and Net Enrolment Ratio at Primary Level (2007-08 to 2009-10)
Sr.
No.
States/UTs Retention Rate at Primary Level (Grade I
to V)
Gross Completion Rate at Primary
Level
Gross Enrolment Ratio : Primary
Level
Net Enrolment Ratio :
Primary Level
2007-08 2008-09 2009-10 2007-08 2008-09 2009-10 2007-08 2008-09 2009-10 2007-08 2008-09 2009-101 A & N Islands NA NA 84.36 90.31 86.00 84.88 88.24 84.70 85.71 69.80 66.83 71.992 Andhra Pradesh 85.34 83.99 84.24 85.11 85.61 91.12 97.98 98.90 100.76 78.84 79.39 80.223 Arunachal Pradesh - 60.54 46.18 113.66 128.83 145.57 199.07 220.31 231.62 - - -4 Assam 86.20 93.26 51.55 101.29 101.63 96.95 132.02 133.52 115.13 - - -5 Bihar 53.40 56.09 63.58 75.84 84.12 92.33 125.51 133.43 135.53 - - -6 Chandigarh - - - 75.40 80.41 85.29 83.63 87.93 88.95 69.50 72.76 73.067 Chhattisgarh 69.52 69.87 61.72 93.86 99.17 109.04 124.24 125.26 124.70 - 97.968 Dadra & Nagar Haveli - 85.54 82.42 116.41 119.36 142.26 157.65 160,44 161.02 -9 Daman & Dtu - - 93.27 70.65 76.20 88.75 78.59 91.10 98.45 64.41 75.91 82.56
10 Delhi - - - 90.19 97.57 103.29 102.86 112.71 114.75 77.81 90.64 93.5811 Goa - 90.69 98.89 55.41 46.01 68.04 53.95 64.10 66.39 47.87 56.57 58.7612 Gujarat 84.52 82.83 84.59 88,59 91.60 100.10 107.23 107.73 109.02 86.31 86.03 85.8013 Haryana 96.35 - - 68.04 75.30 78.50 80,31 89.66 92.00 64.98 71.59 73.5114 Himachal Pradesh 94.64 94.52 97.87 110.54 108.89 106.91 112.98 112.12 109.39 91.78 91.15 88.9115 Jammu & Kashmir - 79.83 84.64 94.94 107.67 112.87 99,16 117.25 119.10 79.90 95.20 97.1816 Jharkhand 77.80 71.35 53.06 107.22 110.77 112.45 157.37 152.28 148.96 - - -17 Karnataka 75.73 86.77 75.90 99.79 99.62 100.47 107.96 107.89 107.09 - 98.61 99.2318 Kerala - - - 83.86 77.41 83.38 79.97 76.31 75.63 67.96 65.28 65.4819 Lakshadweep - - - 87.07 91.47 133.54 102.64 102.54 101.13 84.93 84.55 86.9620 Wladhya Pradesh 94.30 75.14 71.78 107.88 115.78 116.42 144.71 143.91 139.3521 Maharashtra 98.53 88.82 87.70 90.16 90.69 94.58 102.24 103.83 104.18 84.92 87.98 88.0122 Manipur - - 45.90 106.74 107.02 118.01 151.75 148.87 161.54 - - -23 Meghalaya 50.08 57.18 55.46 112.94 120.98 144.52 184.73 193.08 206.58 - - -24 Mizoram 71.16 69.71 69.00 155.23 160.50 178.08 186.36 192.36 207.73 - - -25 Nagaiand 63.42 54.64 49.65 88.51 101.85 105.44 126.36 140.08 142.27 - - -26 Orissa 77.44 80.65 77.51 102.64 100.75 102.18 115.81 119.97 119.42 92.69 95.52 96.4027 Puducherry - - 93.14 98.11 106.70 96.76 102.07 103.20 76.51 85.19 86.7028 Punjab 80.44 96.97 61.09 68.16 70.10 67.79 76.19 80.42 53.02 59.69 63.0629 Rajasthan 61.76 60.21 53.71 85.96 87.89 90.27 115.82 116.54 117.07 85.17 - 89.6030 Sikkirn 63.72 64.78 69.52 100.85 110.72 124.64 150.08 157.77 166.08 95.38 98.04 99.1931 Tamil Nadu 100.00 97.05 - 114.18 114.75 123.21 117.83 118.52 119.56 97.76 99.30 99.1532 Tripura 75.21 73.46 71.53 112.67 127.71 128.27 135.44 141.11 141.41 - - -33 Uttar Pradesh 74.37 73.95 69.59 88.95 93.02 91.37 110.29 109.43 104.84 - - 95.6934 Uttarakhand 73.06 75.95 80.61 91.22 95.78 96.25 107.48 109.37 106.18 90.37 91.21 86.5235 West Bengal 51.88 58.15 73.49 79.74 82.44 99.09 115.84 113.33 136.20 84.07 84.51 -
All States 73.71 74.92 74.01 90.23 93.38 97.58 113.94 115.31 115.63 95.92 98.59 98.28
Source : Elementary Education in India, DISE 2009-10 : Flash StatisticsDatabook for DCH; 5th December 2012 Page 179 of 266
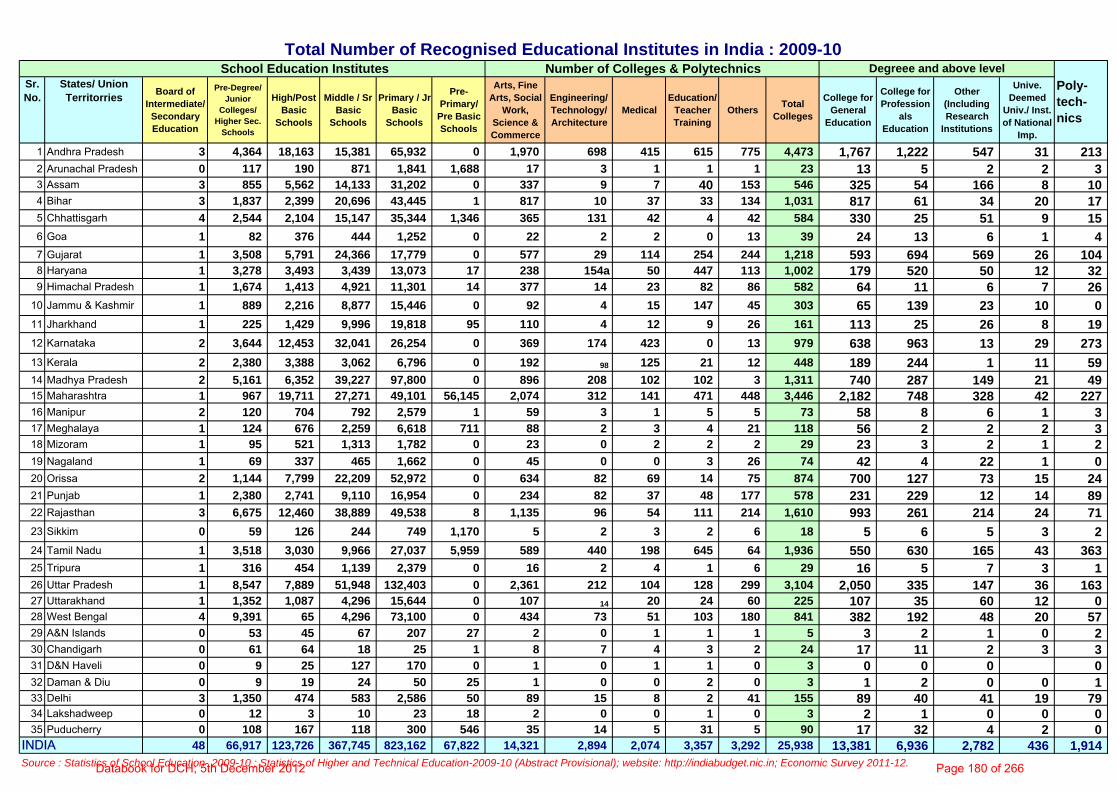
Total Number of Recognised Educational Institutes in India : 2009-10 School Education Institutes Number of Colleges & Polytechnics Degreee and above level
Poly-
tech-
nics
Sr.
No.
States/ Union
TerritorriesBoard of
Intermediate/
Secondary
Education
Pre-Degree/
Junior
Colleges/
Higher Sec.
Schools
High/Post
Basic
Schools
Middle / Sr
Basic
Schools
Primary / Jr
Basic
Schools
Pre-
Primary/
Pre Basic
Schools
Arts, Fine
Arts, Social
Work,
Science &
Commerce
Engineering/
Technology/
Architecture
Medical
Education/
Teacher
Training
OthersTotal
Colleges
College for
General
Education
College for
Profession
als
Education
Other
(Including
Research
Institutions
Unive.
Deemed
Univ./ Inst.
of National
Imp.
1 Andhra Pradesh 3 4,364 18,163 15,381 65,932 0 1,970 698 415 615 775 4,473 1,767 1,222 547 31 213
2 Arunachal Pradesh 0 117 190 871 1,841 1,688 17 3 1 1 1 23 13 5 2 2 33 Assam 3 855 5,562 14,133 31,202 0 337 9 7 40 153 546 325 54 166 8 10
4 Bihar 3 1,837 2,399 20,696 43,445 1 817 10 37 33 134 1,031 817 61 34 20 17
5 Chhattisgarh 4 2,544 2,104 15,147 35,344 1,346 365 131 42 4 42 584 330 25 51 9 15
6 Goa 1 82 376 444 1,252 0 22 2 2 0 13 39 24 13 6 1 4
7 Gujarat 1 3,508 5,791 24,366 17,779 0 577 29 114 254 244 1,218 593 694 569 26 1048 Haryana 1 3,278 3,493 3,439 13,073 17 238 154a 50 447 113 1,002 179 520 50 12 32
9 Himachal Pradesh 1 1,674 1,413 4,921 11,301 14 377 14 23 82 86 582 64 11 6 7 26
10 Jammu & Kashmir 1 889 2,216 8,877 15,446 0 92 4 15 147 45 303 65 139 23 10 0
11 Jharkhand 1 225 1,429 9,996 19,818 95 110 4 12 9 26 161 113 25 26 8 19
12 Karnataka 2 3,644 12,453 32,041 26,254 0 369 174 423 0 13 979 638 963 13 29 273
13 Kerala 2 2,380 3,388 3,062 6,796 0 192 98 125 21 12 448 189 244 1 11 59
14 Madhya Pradesh 2 5,161 6,352 39,227 97,800 0 896 208 102 102 3 1,311 740 287 149 21 4915 Maharashtra 1 967 19,711 27,271 49,101 56,145 2,074 312 141 471 448 3,446 2,182 748 328 42 227
16 Manipur 2 120 704 792 2,579 1 59 3 1 5 5 73 58 8 6 1 3
17 Meghalaya 1 124 676 2,259 6,618 711 88 2 3 4 21 118 56 2 2 2 318 Mizoram 1 95 521 1,313 1,782 0 23 0 2 2 2 29 23 3 2 1 2
19 Nagaland 1 69 337 465 1,662 0 45 0 0 3 26 74 42 4 22 1 0
20 Orissa 2 1,144 7,799 22,209 52,972 0 634 82 69 14 75 874 700 127 73 15 24
21 Punjab 1 2,380 2,741 9,110 16,954 0 234 82 37 48 177 578 231 229 12 14 89
22 Rajasthan 3 6,675 12,460 38,889 49,538 8 1,135 96 54 111 214 1,610 993 261 214 24 71
23 Sikkim 0 59 126 244 749 1,170 5 2 3 2 6 18 5 6 5 3 2
24 Tamil Nadu 1 3,518 3,030 9,966 27,037 5,959 589 440 198 645 64 1,936 550 630 165 43 363
25 Tripura 1 316 454 1,139 2,379 0 16 2 4 1 6 29 16 5 7 3 1
26 Uttar Pradesh 1 8,547 7,889 51,948 132,403 0 2,361 212 104 128 299 3,104 2,050 335 147 36 16327 Uttarakhand 1 1,352 1,087 4,296 15,644 0 107 14 20 24 60 225 107 35 60 12 028 West Bengal 4 9,391 65 4,296 73,100 0 434 73 51 103 180 841 382 192 48 20 57
29 A&N Islands 0 53 45 67 207 27 2 0 1 1 1 5 3 2 1 0 2
30 Chandigarh 0 61 64 18 25 1 8 7 4 3 2 24 17 11 2 3 3
31 D&N Haveli 0 9 25 127 170 0 1 0 1 1 0 3 0 0 0 0
32 Daman & Diu 0 9 19 24 50 25 1 0 0 2 0 3 1 2 0 0 133 Delhi 3 1,350 474 583 2,586 50 89 15 8 2 41 155 89 40 41 19 7934 Lakshadweep 0 12 3 10 23 18 2 0 0 1 0 3 2 1 0 0 035 Puducherry 0 108 167 118 300 546 35 14 5 31 5 90 17 32 4 2 0
INDIA 48 66,917 123,726 367,745 823,162 67,822 14,321 2,894 2,074 3,357 3,292 25,938 13,381 6,936 2,782 436 1,914
Source : Statistics of School Education- 2009-10 ; Statistics of Higher and Technical Education-2009-10 (Abstract Provisional); website: http://indiabudget.nic.in; Economic Survey 2011-12.Databook for DCH; 5th December 2012 Page 180 of 266
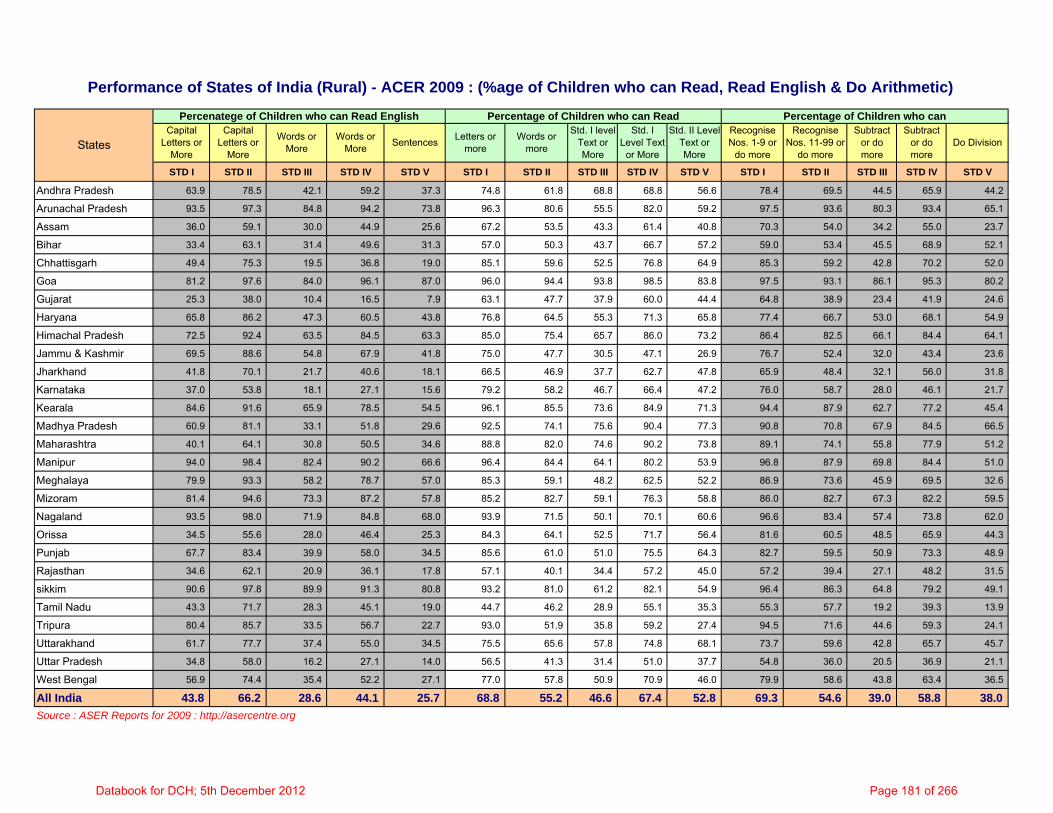
Performance of States of India (Rural) - ACER 2009 : (%age of Children who can Read, Read English & Do Arithmetic)
States
Percenatege of Children who can Read English Percentage of Children who can Read Percentage of Children who canCapital
Letters or More
Capital Letters or
More
Words or More
Words or More Sentences Letters or
moreWords or
more
Std. I level Text or More
Std. I Level Text
or More
Std. II Level Text or More
Recognise Nos. 1-9 or
do more
Recognise Nos. 11-99 or
do more
Subtract or do more
Subtract or do more
Do Division
STD I STD II STD III STD IV STD V STD I STD II STD III STD IV STD V STD I STD II STD III STD IV STD V
Andhra Pradesh 63.9 78.5 42.1 59.2 37.3 74.8 61.8 68.8 68.8 56.6 78.4 69.5 44.5 65.9 44.2
Arunachal Pradesh 93.5 97.3 84.8 94.2 73.8 96.3 80.6 55.5 82.0 59.2 97.5 93.6 80.3 93.4 65.1
Assam 36.0 59.1 30.0 44.9 25.6 67.2 53.5 43.3 61.4 40.8 70.3 54.0 34.2 55.0 23.7
Bihar 33.4 63.1 31.4 49.6 31.3 57.0 50.3 43.7 66.7 57.2 59.0 53.4 45.5 68.9 52.1
Chhattisgarh 49.4 75.3 19.5 36.8 19.0 85.1 59.6 52.5 76.8 64.9 85.3 59.2 42.8 70.2 52.0
Goa 81.2 97.6 84.0 96.1 87.0 96.0 94.4 93.8 98.5 83.8 97.5 93.1 86.1 95.3 80.2
Gujarat 25.3 38.0 10.4 16.5 7.9 63.1 47.7 37.9 60.0 44.4 64.8 38.9 23.4 41.9 24.6
Haryana 65.8 86.2 47.3 60.5 43.8 76.8 64.5 55.3 71.3 65.8 77.4 66.7 53.0 68.1 54.9
Himachal Pradesh 72.5 92.4 63.5 84.5 63.3 85.0 75.4 65.7 86.0 73.2 86.4 82.5 66.1 84.4 64.1
Jammu & Kashmir 69.5 88.6 54.8 67.9 41.8 75.0 47.7 30.5 47.1 26.9 76.7 52.4 32.0 43.4 23.6
Jharkhand 41.8 70.1 21.7 40.6 18.1 66.5 46.9 37.7 62.7 47.8 65.9 48.4 32.1 56.0 31.8
Karnataka 37.0 53.8 18.1 27.1 15.6 79.2 58.2 46.7 66.4 47.2 76.0 58.7 28.0 46.1 21.7
Kearala 84.6 91.6 65.9 78.5 54.5 96.1 85.5 73.6 84.9 71.3 94.4 87.9 62.7 77.2 45.4
Madhya Pradesh 60.9 81.1 33.1 51.8 29.6 92.5 74.1 75.6 90.4 77.3 90.8 70.8 67.9 84.5 66.5
Maharashtra 40.1 64.1 30.8 50.5 34.6 88.8 82.0 74.6 90.2 73.8 89.1 74.1 55.8 77.9 51.2
Manipur 94.0 98.4 82.4 90.2 66.6 96.4 84.4 64.1 80.2 53.9 96.8 87.9 69.8 84.4 51.0
Meghalaya 79.9 93.3 58.2 78.7 57.0 85.3 59.1 48.2 62.5 52.2 86.9 73.6 45.9 69.5 32.6
Mizoram 81.4 94.6 73.3 87.2 57.8 85.2 82.7 59.1 76.3 58.8 86.0 82.7 67.3 82.2 59.5
Nagaland 93.5 98.0 71.9 84.8 68.0 93.9 71.5 50.1 70.1 60.6 96.6 83.4 57.4 73.8 62.0
Orissa 34.5 55.6 28.0 46.4 25.3 84.3 64.1 52.5 71.7 56.4 81.6 60.5 48.5 65.9 44.3
Punjab 67.7 83.4 39.9 58.0 34.5 85.6 61.0 51.0 75.5 64.3 82.7 59.5 50.9 73.3 48.9
Rajasthan 34.6 62.1 20.9 36.1 17.8 57.1 40.1 34.4 57.2 45.0 57.2 39.4 27.1 48.2 31.5
sikkim 90.6 97.8 89.9 91.3 80.8 93.2 81.0 61.2 82.1 54.9 96.4 86.3 64.8 79.2 49.1
Tamil Nadu 43.3 71.7 28.3 45.1 19.0 44.7 46.2 28.9 55.1 35.3 55.3 57.7 19.2 39.3 13.9
Tripura 80.4 85.7 33.5 56.7 22.7 93.0 51.9 35.8 59.2 27.4 94.5 71.6 44.6 59.3 24.1
Uttarakhand 61.7 77.7 37.4 55.0 34.5 75.5 65.6 57.8 74.8 68.1 73.7 59.6 42.8 65.7 45.7
Uttar Pradesh 34.8 58.0 16.2 27.1 14.0 56.5 41.3 31.4 51.0 37.7 54.8 36.0 20.5 36.9 21.1
West Bengal 56.9 74.4 35.4 52.2 27.1 77.0 57.8 50.9 70.9 46.0 79.9 58.6 43.8 63.4 36.5
All India 43.8 66.2 28.6 44.1 25.7 68.8 55.2 46.6 67.4 52.8 69.3 54.6 39.0 58.8 38.0Source : ASER Reports for 2009 : http://asercentre.org
Databook for DCH; 5th December 2012 Page 181 of 266
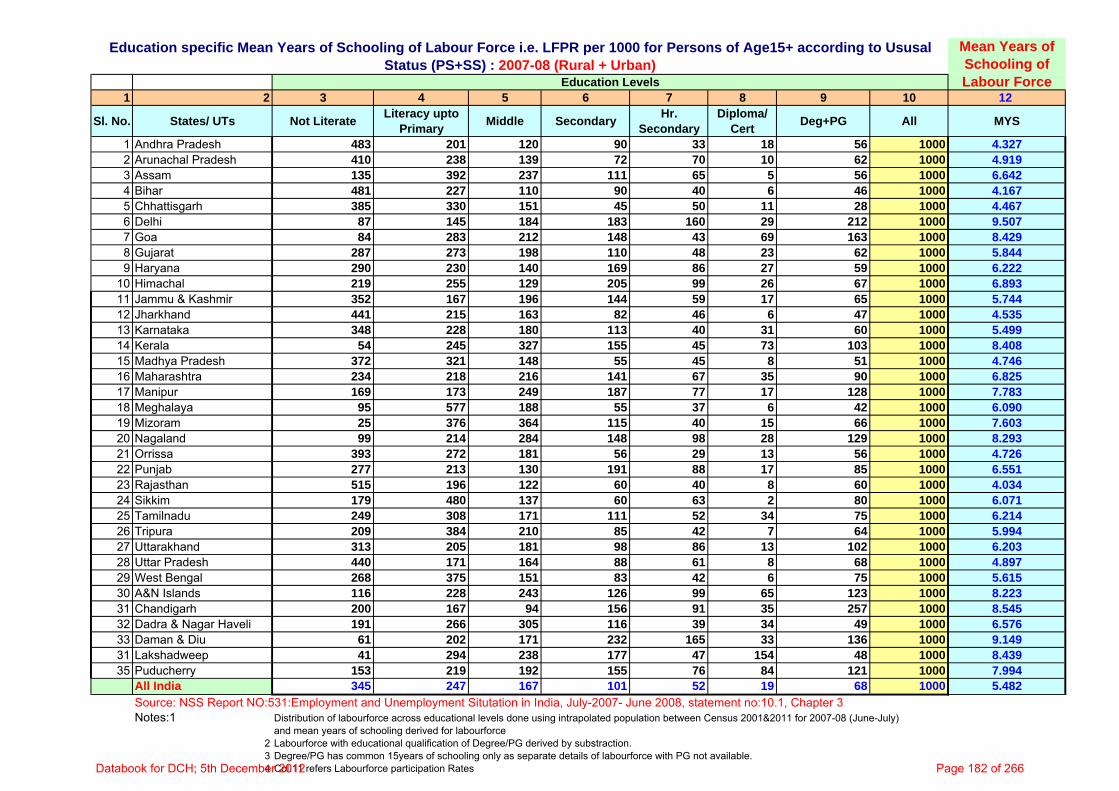
Education specific Mean Years of Schooling of Labour Force i.e. LFPR per 1000 for Persons of Age15+ according to Ususal Status (PS+SS) : 2007-08 (Rural + Urban)
Mean Years of Schooling of Labour ForceEducation Levels
1 2 3 4 5 6 7 8 9 10 12
Sl. No. States/ UTs Not Literate Literacy upto Primary Middle Secondary Hr.
SecondaryDiploma/
Cert Deg+PG All MYS
1 Andhra Pradesh 483 201 120 90 33 18 56 1000 4.3272 Arunachal Pradesh 410 238 139 72 70 10 62 1000 4.9193 Assam 135 392 237 111 65 5 56 1000 6.6424 Bihar 481 227 110 90 40 6 46 1000 4.1675 Chhattisgarh 385 330 151 45 50 11 28 1000 4.4676 Delhi 87 145 184 183 160 29 212 1000 9.5077 Goa 84 283 212 148 43 69 163 1000 8.4298 Gujarat 287 273 198 110 48 23 62 1000 5.8449 Haryana 290 230 140 169 86 27 59 1000 6.222
10 Himachal 219 255 129 205 99 26 67 1000 6.89311 Jammu & Kashmir 352 167 196 144 59 17 65 1000 5.74412 Jharkhand 441 215 163 82 46 6 47 1000 4.53513 Karnataka 348 228 180 113 40 31 60 1000 5.49914 Kerala 54 245 327 155 45 73 103 1000 8.40815 Madhya Pradesh 372 321 148 55 45 8 51 1000 4.74616 Maharashtra 234 218 216 141 67 35 90 1000 6.82517 Manipur 169 173 249 187 77 17 128 1000 7.78318 Meghalaya 95 577 188 55 37 6 42 1000 6.09019 Mizoram 25 376 364 115 40 15 66 1000 7.60320 Nagaland 99 214 284 148 98 28 129 1000 8.29321 Orrissa 393 272 181 56 29 13 56 1000 4.72622 Punjab 277 213 130 191 88 17 85 1000 6.55123 Rajasthan 515 196 122 60 40 8 60 1000 4.03424 Sikkim 179 480 137 60 63 2 80 1000 6.07125 Tamilnadu 249 308 171 111 52 34 75 1000 6.21426 Tripura 209 384 210 85 42 7 64 1000 5.99427 Uttarakhand 313 205 181 98 86 13 102 1000 6.20328 Uttar Pradesh 440 171 164 88 61 8 68 1000 4.89729 West Bengal 268 375 151 83 42 6 75 1000 5.61530 A&N Islands 116 228 243 126 99 65 123 1000 8.22331 Chandigarh 200 167 94 156 91 35 257 1000 8.54532 Dadra & Nagar Haveli 191 266 305 116 39 34 49 1000 6.57633 Daman & Diu 61 202 171 232 165 33 136 1000 9.14931 Lakshadweep 41 294 238 177 47 154 48 1000 8.43935 Puducherry 153 219 192 155 76 84 121 1000 7.994
All India 345 247 167 101 52 19 68 1000 5.482Source: NSS Report NO:531:Employment and Unemployment Situtation in India, July-2007- June 2008, statement no:10.1, Chapter 3Notes:1 Distribution of labourforce across educational levels done using intrapolated population between Census 2001&2011 for 2007-08 (June-July)
and mean years of schooling derived for labourforce2 Labourforce with educational qualification of Degree/PG derived by substraction.3 Degree/PG has common 15years of schooling only as separate details of labourforce with PG not available.4 Col.11 refers Labourforce participation Rates
Databook for DCH; 5th December 2012 Page 182 of 266
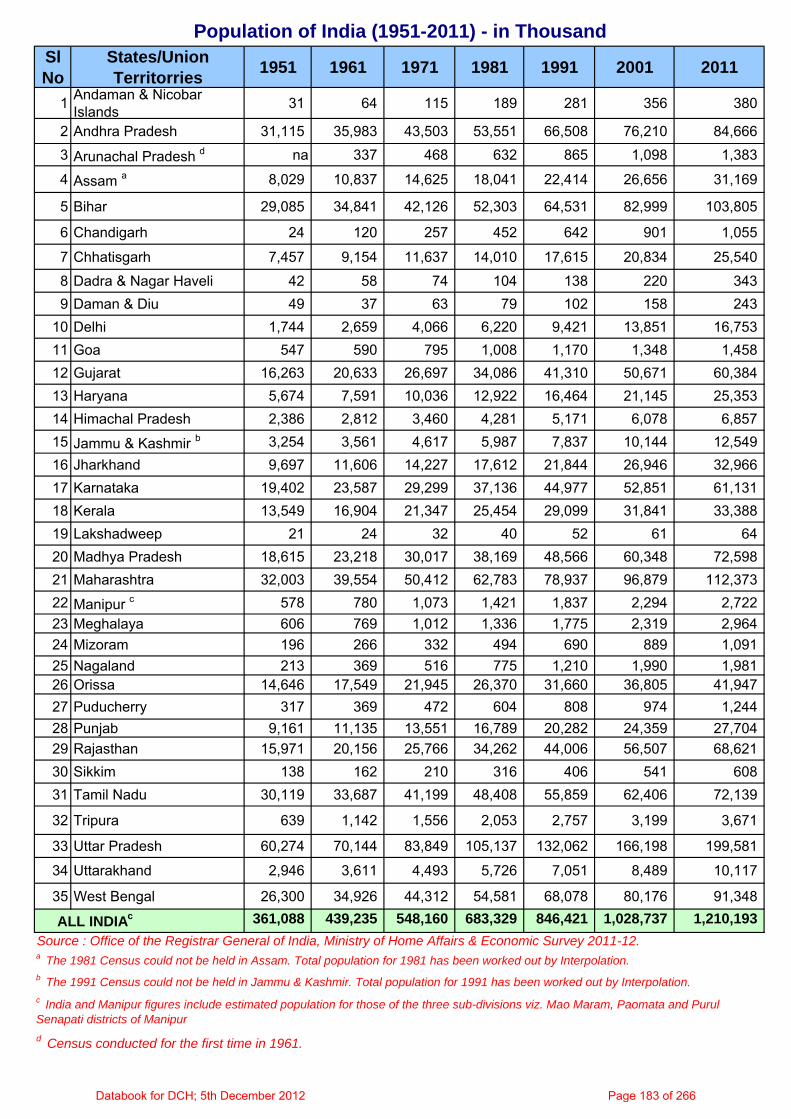
Population of India (1951-2011) - in Thousand
Sl
No
States/Union
Territorries1951 1961 1971 1981 1991 2001 2011
1 Andaman & Nicobar Islands 31 64 115 189 281 356 380
2 Andhra Pradesh 31,115 35,983 43,503 53,551 66,508 76,210 84,6663 Arunachal Pradesh d na 337 468 632 865 1,098 1,383
4 Assam a 8,029 10,837 14,625 18,041 22,414 26,656 31,169
5 Bihar 29,085 34,841 42,126 52,303 64,531 82,999 103,805
6 Chandigarh 24 120 257 452 642 901 1,055
7 Chhatisgarh 7,457 9,154 11,637 14,010 17,615 20,834 25,540
8 Dadra & Nagar Haveli 42 58 74 104 138 220 3439 Daman & Diu 49 37 63 79 102 158 243
10 Delhi 1,744 2,659 4,066 6,220 9,421 13,851 16,75311 Goa 547 590 795 1,008 1,170 1,348 1,45812 Gujarat 16,263 20,633 26,697 34,086 41,310 50,671 60,38413 Haryana 5,674 7,591 10,036 12,922 16,464 21,145 25,35314 Himachal Pradesh 2,386 2,812 3,460 4,281 5,171 6,078 6,85715 Jammu & Kashmir b 3,254 3,561 4,617 5,987 7,837 10,144 12,54916 Jharkhand 9,697 11,606 14,227 17,612 21,844 26,946 32,96617 Karnataka 19,402 23,587 29,299 37,136 44,977 52,851 61,13118 Kerala 13,549 16,904 21,347 25,454 29,099 31,841 33,38819 Lakshadweep 21 24 32 40 52 61 6420 Madhya Pradesh 18,615 23,218 30,017 38,169 48,566 60,348 72,59821 Maharashtra 32,003 39,554 50,412 62,783 78,937 96,879 112,37322 Manipur c 578 780 1,073 1,421 1,837 2,294 2,72223 Meghalaya 606 769 1,012 1,336 1,775 2,319 2,96424 Mizoram 196 266 332 494 690 889 1,09125 Nagaland 213 369 516 775 1,210 1,990 1,98126 Orissa 14,646 17,549 21,945 26,370 31,660 36,805 41,94727 Puducherry 317 369 472 604 808 974 1,24428 Punjab 9,161 11,135 13,551 16,789 20,282 24,359 27,70429 Rajasthan 15,971 20,156 25,766 34,262 44,006 56,507 68,62130 Sikkim 138 162 210 316 406 541 60831 Tamil Nadu 30,119 33,687 41,199 48,408 55,859 62,406 72,139
32 Tripura 639 1,142 1,556 2,053 2,757 3,199 3,671
33 Uttar Pradesh 60,274 70,144 83,849 105,137 132,062 166,198 199,581
34 Uttarakhand 2,946 3,611 4,493 5,726 7,051 8,489 10,117
35 West Bengal 26,300 34,926 44,312 54,581 68,078 80,176 91,348
ALL INDIAc 361,088 439,235 548,160 683,329 846,421 1,028,737 1,210,193
Source : Office of the Registrar General of India, Ministry of Home Affairs & Economic Survey 2011-12.a The 1981 Census could not be held in Assam. Total population for 1981 has been worked out by Interpolation.b The 1991 Census could not be held in Jammu & Kashmir. Total population for 1991 has been worked out by Interpolation.c India and Manipur figures include estimated population for those of the three sub-divisions viz. Mao Maram, Paomata and Purul Senapati districts of Manipurd Census conducted for the first time in 1961.
Databook for DCH; 5th December 2012 Page 183 of 266
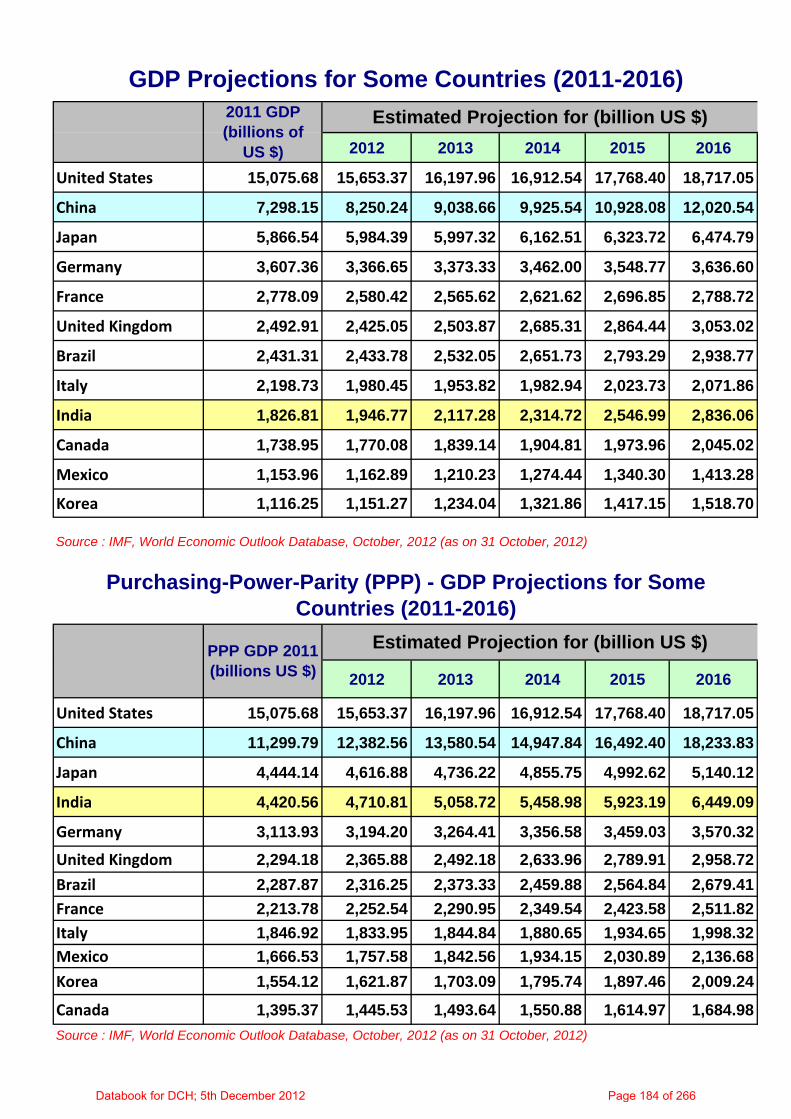
GDP Projections for Some Countries (2011-2016)
2011 GDP
(billions of
US $)
Estimated Projection for (billion US $)
2012 2013 2014 2015 2016
United States 15,075.68 15,653.37 16,197.96 16,912.54 17,768.40 18,717.05
China 7,298.15 8,250.24 9,038.66 9,925.54 10,928.08 12,020.54
Japan 5,866.54 5,984.39 5,997.32 6,162.51 6,323.72 6,474.79
Germany 3,607.36 3,366.65 3,373.33 3,462.00 3,548.77 3,636.60
France 2,778.09 2,580.42 2,565.62 2,621.62 2,696.85 2,788.72
United Kingdom 2,492.91 2,425.05 2,503.87 2,685.31 2,864.44 3,053.02
Brazil 2,431.31 2,433.78 2,532.05 2,651.73 2,793.29 2,938.77
Italy 2,198.73 1,980.45 1,953.82 1,982.94 2,023.73 2,071.86
India 1,826.81 1,946.77 2,117.28 2,314.72 2,546.99 2,836.06
Canada 1,738.95 1,770.08 1,839.14 1,904.81 1,973.96 2,045.02
Mexico 1,153.96 1,162.89 1,210.23 1,274.44 1,340.30 1,413.28
Korea 1,116.25 1,151.27 1,234.04 1,321.86 1,417.15 1,518.70
Source : IMF, World Economic Outlook Database, October, 2012 (as on 31 October, 2012)
Purchasing-Power-Parity (PPP) - GDP Projections for Some
Countries (2011-2016)
PPP GDP 2011
(billions US $)
Estimated Projection for (billion US $)
2012 2013 2014 2015 2016
United States 15,075.68 15,653.37 16,197.96 16,912.54 17,768.40 18,717.05
China 11,299.79 12,382.56 13,580.54 14,947.84 16,492.40 18,233.83
Japan 4,444.14 4,616.88 4,736.22 4,855.75 4,992.62 5,140.12
India 4,420.56 4,710.81 5,058.72 5,458.98 5,923.19 6,449.09
Germany 3,113.93 3,194.20 3,264.41 3,356.58 3,459.03 3,570.32
United Kingdom 2,294.18 2,365.88 2,492.18 2,633.96 2,789.91 2,958.72
Brazil 2,287.87 2,316.25 2,373.33 2,459.88 2,564.84 2,679.41
France 2,213.78 2,252.54 2,290.95 2,349.54 2,423.58 2,511.82
Italy 1,846.92 1,833.95 1,844.84 1,880.65 1,934.65 1,998.32
Mexico 1,666.53 1,757.58 1,842.56 1,934.15 2,030.89 2,136.68
Korea 1,554.12 1,621.87 1,703.09 1,795.74 1,897.46 2,009.24
Canada 1,395.37 1,445.53 1,493.64 1,550.88 1,614.97 1,684.98
Source : IMF, World Economic Outlook Database, October, 2012 (as on 31 October, 2012)
Databook for DCH; 5th December 2012 Page 184 of 266
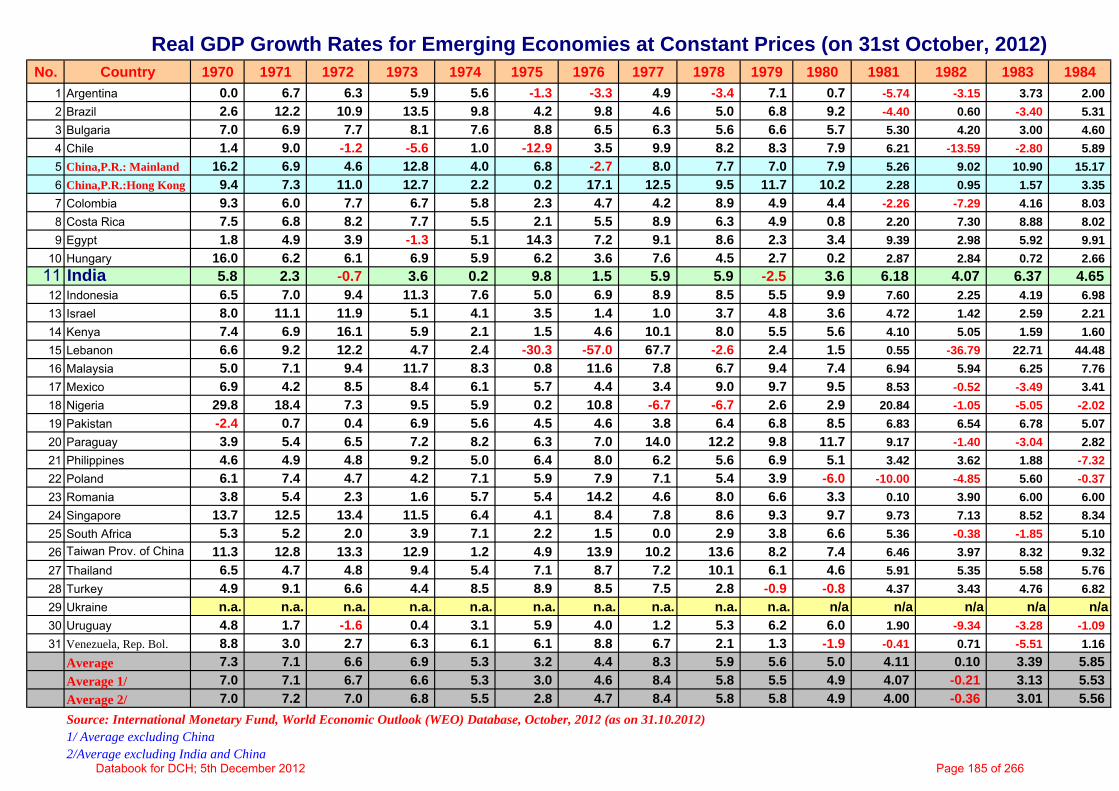
Real GDP Growth Rates for Emerging Economies at Constant Prices (on 31st October, 2012)
No. Country 1970 1971 1972 1973 1974 1975 1976 1977 1978 1979 1980 1981 1982 1983 1984
1 Argentina 0.0 6.7 6.3 5.9 5.6 -1.3 -3.3 4.9 -3.4 7.1 0.7 -5.74 -3.15 3.73 2.00
2 Brazil 2.6 12.2 10.9 13.5 9.8 4.2 9.8 4.6 5.0 6.8 9.2 -4.40 0.60 -3.40 5.31
3 Bulgaria 7.0 6.9 7.7 8.1 7.6 8.8 6.5 6.3 5.6 6.6 5.7 5.30 4.20 3.00 4.60
4 Chile 1.4 9.0 -1.2 -5.6 1.0 -12.9 3.5 9.9 8.2 8.3 7.9 6.21 -13.59 -2.80 5.89
5 China,P.R.: Mainland 16.2 6.9 4.6 12.8 4.0 6.8 -2.7 8.0 7.7 7.0 7.9 5.26 9.02 10.90 15.17
6 China,P.R.:Hong Kong 9.4 7.3 11.0 12.7 2.2 0.2 17.1 12.5 9.5 11.7 10.2 2.28 0.95 1.57 3.35
7 Colombia 9.3 6.0 7.7 6.7 5.8 2.3 4.7 4.2 8.9 4.9 4.4 -2.26 -7.29 4.16 8.03
8 Costa Rica 7.5 6.8 8.2 7.7 5.5 2.1 5.5 8.9 6.3 4.9 0.8 2.20 7.30 8.88 8.02
9 Egypt 1.8 4.9 3.9 -1.3 5.1 14.3 7.2 9.1 8.6 2.3 3.4 9.39 2.98 5.92 9.91
10 Hungary 16.0 6.2 6.1 6.9 5.9 6.2 3.6 7.6 4.5 2.7 0.2 2.87 2.84 0.72 2.66
11 India 5.8 2.3 -0.7 3.6 0.2 9.8 1.5 5.9 5.9 -2.5 3.6 6.18 4.07 6.37 4.65
12 Indonesia 6.5 7.0 9.4 11.3 7.6 5.0 6.9 8.9 8.5 5.5 9.9 7.60 2.25 4.19 6.98
13 Israel 8.0 11.1 11.9 5.1 4.1 3.5 1.4 1.0 3.7 4.8 3.6 4.72 1.42 2.59 2.21
14 Kenya 7.4 6.9 16.1 5.9 2.1 1.5 4.6 10.1 8.0 5.5 5.6 4.10 5.05 1.59 1.60
15 Lebanon 6.6 9.2 12.2 4.7 2.4 -30.3 -57.0 67.7 -2.6 2.4 1.5 0.55 -36.79 22.71 44.48
16 Malaysia 5.0 7.1 9.4 11.7 8.3 0.8 11.6 7.8 6.7 9.4 7.4 6.94 5.94 6.25 7.76
17 Mexico 6.9 4.2 8.5 8.4 6.1 5.7 4.4 3.4 9.0 9.7 9.5 8.53 -0.52 -3.49 3.41
18 Nigeria 29.8 18.4 7.3 9.5 5.9 0.2 10.8 -6.7 -6.7 2.6 2.9 20.84 -1.05 -5.05 -2.02
19 Pakistan -2.4 0.7 0.4 6.9 5.6 4.5 4.6 3.8 6.4 6.8 8.5 6.83 6.54 6.78 5.07
20 Paraguay 3.9 5.4 6.5 7.2 8.2 6.3 7.0 14.0 12.2 9.8 11.7 9.17 -1.40 -3.04 2.82
21 Philippines 4.6 4.9 4.8 9.2 5.0 6.4 8.0 6.2 5.6 6.9 5.1 3.42 3.62 1.88 -7.32
22 Poland 6.1 7.4 4.7 4.2 7.1 5.9 7.9 7.1 5.4 3.9 -6.0 -10.00 -4.85 5.60 -0.37
23 Romania 3.8 5.4 2.3 1.6 5.7 5.4 14.2 4.6 8.0 6.6 3.3 0.10 3.90 6.00 6.00
24 Singapore 13.7 12.5 13.4 11.5 6.4 4.1 8.4 7.8 8.6 9.3 9.7 9.73 7.13 8.52 8.34
25 South Africa 5.3 5.2 2.0 3.9 7.1 2.2 1.5 0.0 2.9 3.8 6.6 5.36 -0.38 -1.85 5.10
26 Taiwan Prov. of China 11.3 12.8 13.3 12.9 1.2 4.9 13.9 10.2 13.6 8.2 7.4 6.46 3.97 8.32 9.32
27 Thailand 6.5 4.7 4.8 9.4 5.4 7.1 8.7 7.2 10.1 6.1 4.6 5.91 5.35 5.58 5.76
28 Turkey 4.9 9.1 6.6 4.4 8.5 8.9 8.5 7.5 2.8 -0.9 -0.8 4.37 3.43 4.76 6.82
29 Ukraine n.a. n.a. n.a. n.a. n.a. n.a. n.a. n.a. n.a. n.a. n/a n/a n/a n/a n/a
30 Uruguay 4.8 1.7 -1.6 0.4 3.1 5.9 4.0 1.2 5.3 6.2 6.0 1.90 -9.34 -3.28 -1.09
31 Venezuela, Rep. Bol. 8.8 3.0 2.7 6.3 6.1 6.1 8.8 6.7 2.1 1.3 -1.9 -0.41 0.71 -5.51 1.16
Average 7.3 7.1 6.6 6.9 5.3 3.2 4.4 8.3 5.9 5.6 5.0 4.11 0.10 3.39 5.85
Average 1/ 7.0 7.1 6.7 6.6 5.3 3.0 4.6 8.4 5.8 5.5 4.9 4.07 -0.21 3.13 5.53
Average 2/ 7.0 7.2 7.0 6.8 5.5 2.8 4.7 8.4 5.8 5.8 4.9 4.00 -0.36 3.01 5.56
Source: International Monetary Fund, World Economic Outlook (WEO) Database, October, 2012 (as on 31.10.2012)1/ Average excluding China2/Average excluding India and China
Databook for DCH; 5th December 2012 Page 185 of 266
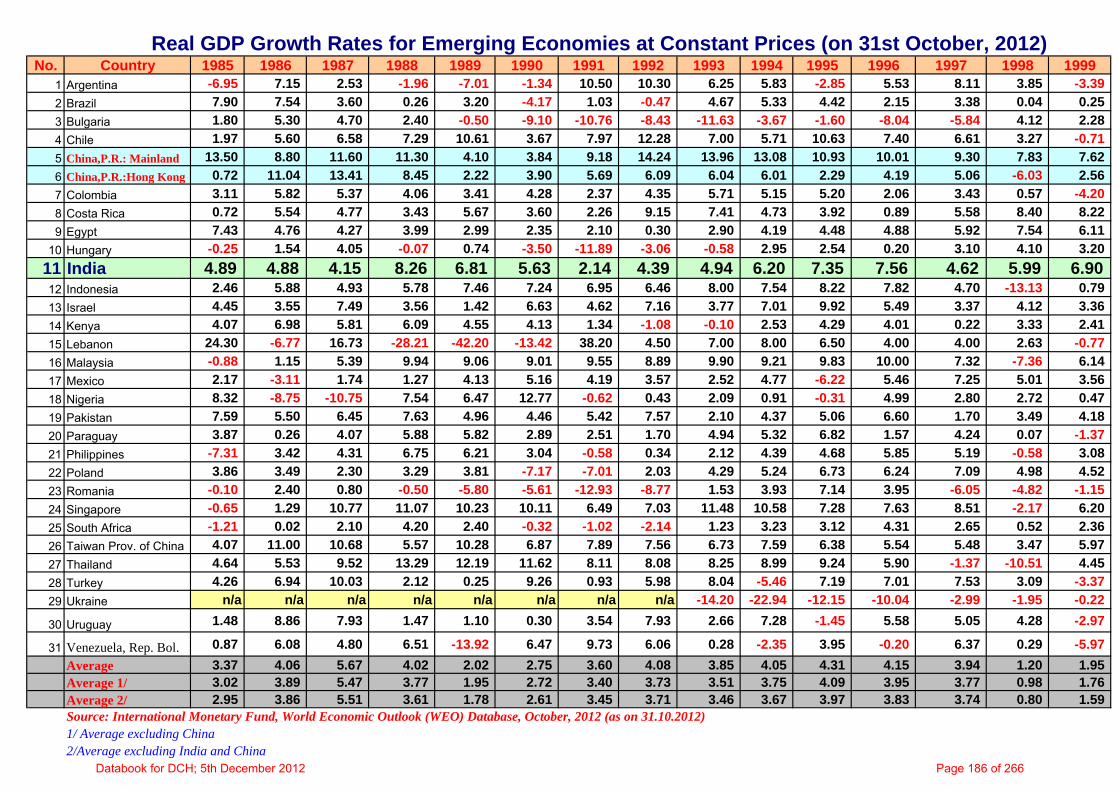
Real GDP Growth Rates for Emerging Economies at Constant Prices (on 31st October, 2012)No. Country 1985 1986 1987 1988 1989 1990 1991 1992 1993 1994 1995 1996 1997 1998 1999
1 Argentina -6.95 7.15 2.53 -1.96 -7.01 -1.34 10.50 10.30 6.25 5.83 -2.85 5.53 8.11 3.85 -3.39
2 Brazil 7.90 7.54 3.60 0.26 3.20 -4.17 1.03 -0.47 4.67 5.33 4.42 2.15 3.38 0.04 0.25
3 Bulgaria 1.80 5.30 4.70 2.40 -0.50 -9.10 -10.76 -8.43 -11.63 -3.67 -1.60 -8.04 -5.84 4.12 2.28
4 Chile 1.97 5.60 6.58 7.29 10.61 3.67 7.97 12.28 7.00 5.71 10.63 7.40 6.61 3.27 -0.71
5 China,P.R.: Mainland 13.50 8.80 11.60 11.30 4.10 3.84 9.18 14.24 13.96 13.08 10.93 10.01 9.30 7.83 7.62
6 China,P.R.:Hong Kong 0.72 11.04 13.41 8.45 2.22 3.90 5.69 6.09 6.04 6.01 2.29 4.19 5.06 -6.03 2.56
7 Colombia 3.11 5.82 5.37 4.06 3.41 4.28 2.37 4.35 5.71 5.15 5.20 2.06 3.43 0.57 -4.20
8 Costa Rica 0.72 5.54 4.77 3.43 5.67 3.60 2.26 9.15 7.41 4.73 3.92 0.89 5.58 8.40 8.22
9 Egypt 7.43 4.76 4.27 3.99 2.99 2.35 2.10 0.30 2.90 4.19 4.48 4.88 5.92 7.54 6.11
10 Hungary -0.25 1.54 4.05 -0.07 0.74 -3.50 -11.89 -3.06 -0.58 2.95 2.54 0.20 3.10 4.10 3.20
11 India 4.89 4.88 4.15 8.26 6.81 5.63 2.14 4.39 4.94 6.20 7.35 7.56 4.62 5.99 6.9012 Indonesia 2.46 5.88 4.93 5.78 7.46 7.24 6.95 6.46 8.00 7.54 8.22 7.82 4.70 -13.13 0.79
13 Israel 4.45 3.55 7.49 3.56 1.42 6.63 4.62 7.16 3.77 7.01 9.92 5.49 3.37 4.12 3.36
14 Kenya 4.07 6.98 5.81 6.09 4.55 4.13 1.34 -1.08 -0.10 2.53 4.29 4.01 0.22 3.33 2.41
15 Lebanon 24.30 -6.77 16.73 -28.21 -42.20 -13.42 38.20 4.50 7.00 8.00 6.50 4.00 4.00 2.63 -0.77
16 Malaysia -0.88 1.15 5.39 9.94 9.06 9.01 9.55 8.89 9.90 9.21 9.83 10.00 7.32 -7.36 6.14
17 Mexico 2.17 -3.11 1.74 1.27 4.13 5.16 4.19 3.57 2.52 4.77 -6.22 5.46 7.25 5.01 3.56
18 Nigeria 8.32 -8.75 -10.75 7.54 6.47 12.77 -0.62 0.43 2.09 0.91 -0.31 4.99 2.80 2.72 0.47
19 Pakistan 7.59 5.50 6.45 7.63 4.96 4.46 5.42 7.57 2.10 4.37 5.06 6.60 1.70 3.49 4.18
20 Paraguay 3.87 0.26 4.07 5.88 5.82 2.89 2.51 1.70 4.94 5.32 6.82 1.57 4.24 0.07 -1.37
21 Philippines -7.31 3.42 4.31 6.75 6.21 3.04 -0.58 0.34 2.12 4.39 4.68 5.85 5.19 -0.58 3.08
22 Poland 3.86 3.49 2.30 3.29 3.81 -7.17 -7.01 2.03 4.29 5.24 6.73 6.24 7.09 4.98 4.52
23 Romania -0.10 2.40 0.80 -0.50 -5.80 -5.61 -12.93 -8.77 1.53 3.93 7.14 3.95 -6.05 -4.82 -1.15
24 Singapore -0.65 1.29 10.77 11.07 10.23 10.11 6.49 7.03 11.48 10.58 7.28 7.63 8.51 -2.17 6.20
25 South Africa -1.21 0.02 2.10 4.20 2.40 -0.32 -1.02 -2.14 1.23 3.23 3.12 4.31 2.65 0.52 2.36
26 Taiwan Prov. of China 4.07 11.00 10.68 5.57 10.28 6.87 7.89 7.56 6.73 7.59 6.38 5.54 5.48 3.47 5.97
27 Thailand 4.64 5.53 9.52 13.29 12.19 11.62 8.11 8.08 8.25 8.99 9.24 5.90 -1.37 -10.51 4.45
28 Turkey 4.26 6.94 10.03 2.12 0.25 9.26 0.93 5.98 8.04 -5.46 7.19 7.01 7.53 3.09 -3.37
29 Ukraine n/a n/a n/a n/a n/a n/a n/a n/a -14.20 -22.94 -12.15 -10.04 -2.99 -1.95 -0.22
30 Uruguay 1.48 8.86 7.93 1.47 1.10 0.30 3.54 7.93 2.66 7.28 -1.45 5.58 5.05 4.28 -2.97
31 Venezuela, Rep. Bol. 0.87 6.08 4.80 6.51 -13.92 6.47 9.73 6.06 0.28 -2.35 3.95 -0.20 6.37 0.29 -5.97
Average 3.37 4.06 5.67 4.02 2.02 2.75 3.60 4.08 3.85 4.05 4.31 4.15 3.94 1.20 1.95
Average 1/ 3.02 3.89 5.47 3.77 1.95 2.72 3.40 3.73 3.51 3.75 4.09 3.95 3.77 0.98 1.76
Average 2/ 2.95 3.86 5.51 3.61 1.78 2.61 3.45 3.71 3.46 3.67 3.97 3.83 3.74 0.80 1.59
Source: International Monetary Fund, World Economic Outlook (WEO) Database, October, 2012 (as on 31.10.2012)1/ Average excluding China2/Average excluding India and China
Databook for DCH; 5th December 2012 Page 186 of 266
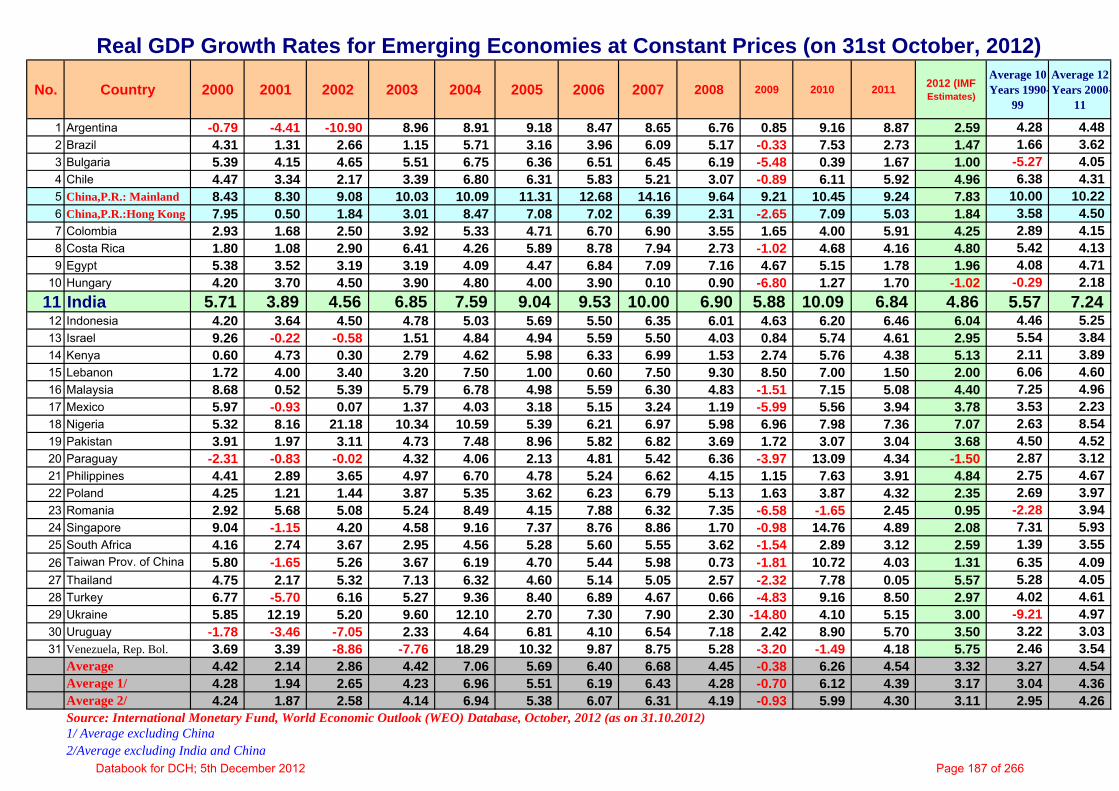
Real GDP Growth Rates for Emerging Economies at Constant Prices (on 31st October, 2012)
No. Country 2000 2001 2002 2003 2004 2005 2006 2007 2008 2009 2010 20112012 (IMF
Estimates)
Average 10Years 1990
99
-Average 12 Years 2000-
11
1 Argentina -0.79 -4.41 -10.90 8.96 8.91 9.18 8.47 8.65 6.76 0.85 9.16 8.87 2.59 4.28 4.48
2 Brazil 4.31 1.31 2.66 1.15 5.71 3.16 3.96 6.09 5.17 -0.33 7.53 2.73 1.47 1.66 3.62
3 Bulgaria 5.39 4.15 4.65 5.51 6.75 6.36 6.51 6.45 6.19 -5.48 0.39 1.67 1.00 -5.27 4.05
4 Chile 4.47 3.34 2.17 3.39 6.80 6.31 5.83 5.21 3.07 -0.89 6.11 5.92 4.96 6.38 4.31
5 China,P.R.: Mainland 8.43 8.30 9.08 10.03 10.09 11.31 12.68 14.16 9.64 9.21 10.45 9.24 7.83 10.00 10.22
6 China,P.R.:Hong Kong 7.95 0.50 1.84 3.01 8.47 7.08 7.02 6.39 2.31 -2.65 7.09 5.03 1.84 3.58 4.50
7 Colombia 2.93 1.68 2.50 3.92 5.33 4.71 6.70 6.90 3.55 1.65 4.00 5.91 4.25 2.89 4.15
8 Costa Rica 1.80 1.08 2.90 6.41 4.26 5.89 8.78 7.94 2.73 -1.02 4.68 4.16 4.80 5.42 4.13
9 Egypt 5.38 3.52 3.19 3.19 4.09 4.47 6.84 7.09 7.16 4.67 5.15 1.78 1.96 4.08 4.71
10 Hungary 4.20 3.70 4.50 3.90 4.80 4.00 3.90 0.10 0.90 -6.80 1.27 1.70 -1.02 -0.29 2.18
11 India 5.71 3.89 4.56 6.85 7.59 9.04 9.53 10.00 6.90 5.88 10.09 6.84 4.86 5.57 7.2412 Indonesia 4.20 3.64 4.50 4.78 5.03 5.69 5.50 6.35 6.01 4.63 6.20 6.46 6.04 4.46 5.25
13 Israel 9.26 -0.22 -0.58 1.51 4.84 4.94 5.59 5.50 4.03 0.84 5.74 4.61 2.95 5.54 3.84
14 Kenya 0.60 4.73 0.30 2.79 4.62 5.98 6.33 6.99 1.53 2.74 5.76 4.38 5.13 2.11 3.89
15 Lebanon 1.72 4.00 3.40 3.20 7.50 1.00 0.60 7.50 9.30 8.50 7.00 1.50 2.00 6.06 4.60
16 Malaysia 8.68 0.52 5.39 5.79 6.78 4.98 5.59 6.30 4.83 -1.51 7.15 5.08 4.40 7.25 4.96
17 Mexico 5.97 -0.93 0.07 1.37 4.03 3.18 5.15 3.24 1.19 -5.99 5.56 3.94 3.78 3.53 2.23
18 Nigeria 5.32 8.16 21.18 10.34 10.59 5.39 6.21 6.97 5.98 6.96 7.98 7.36 7.07 2.63 8.54
19 Pakistan 3.91 1.97 3.11 4.73 7.48 8.96 5.82 6.82 3.69 1.72 3.07 3.04 3.68 4.50 4.52
20 Paraguay -2.31 -0.83 -0.02 4.32 4.06 2.13 4.81 5.42 6.36 -3.97 13.09 4.34 -1.50 2.87 3.12
21 Philippines 4.41 2.89 3.65 4.97 6.70 4.78 5.24 6.62 4.15 1.15 7.63 3.91 4.84 2.75 4.67
22 Poland 4.25 1.21 1.44 3.87 5.35 3.62 6.23 6.79 5.13 1.63 3.87 4.32 2.35 2.69 3.97
23 Romania 2.92 5.68 5.08 5.24 8.49 4.15 7.88 6.32 7.35 -6.58 -1.65 2.45 0.95 -2.28 3.94
24 Singapore 9.04 -1.15 4.20 4.58 9.16 7.37 8.76 8.86 1.70 -0.98 14.76 4.89 2.08 7.31 5.93
25 South Africa 4.16 2.74 3.67 2.95 4.56 5.28 5.60 5.55 3.62 -1.54 2.89 3.12 2.59 1.39 3.55
26 Taiwan Prov. of China 5.80 -1.65 5.26 3.67 6.19 4.70 5.44 5.98 0.73 -1.81 10.72 4.03 1.31 6.35 4.09
27 Thailand 4.75 2.17 5.32 7.13 6.32 4.60 5.14 5.05 2.57 -2.32 7.78 0.05 5.57 5.28 4.05
28 Turkey 6.77 -5.70 6.16 5.27 9.36 8.40 6.89 4.67 0.66 -4.83 9.16 8.50 2.97 4.02 4.61
29 Ukraine 5.85 12.19 5.20 9.60 12.10 2.70 7.30 7.90 2.30 -14.80 4.10 5.15 3.00 -9.21 4.97
30 Uruguay -1.78 -3.46 -7.05 2.33 4.64 6.81 4.10 6.54 7.18 2.42 8.90 5.70 3.50 3.22 3.03
31 Venezuela, Rep. Bol. 3.69 3.39 -8.86 -7.76 18.29 10.32 9.87 8.75 5.28 -3.20 -1.49 4.18 5.75 2.46 3.54
Average 4.42 2.14 2.86 4.42 7.06 5.69 6.40 6.68 4.45 -0.38 6.26 4.54 3.32 3.27 4.54
Average 1/ 4.28 1.94 2.65 4.23 6.96 5.51 6.19 6.43 4.28 -0.70 6.12 4.39 3.17 3.04 4.36
Average 2/ 4.24 1.87 2.58 4.14 6.94 5.38 6.07 6.31 4.19 -0.93 5.99 4.30 3.11 2.95 4.26
Source: International Monetary Fund, World Economic Outlook (WEO) Database, October, 2012 (as on 31.10.2012)1/ Average excluding China2/Average excluding India and China
Databook for DCH; 5th December 2012 Page 187 of 266
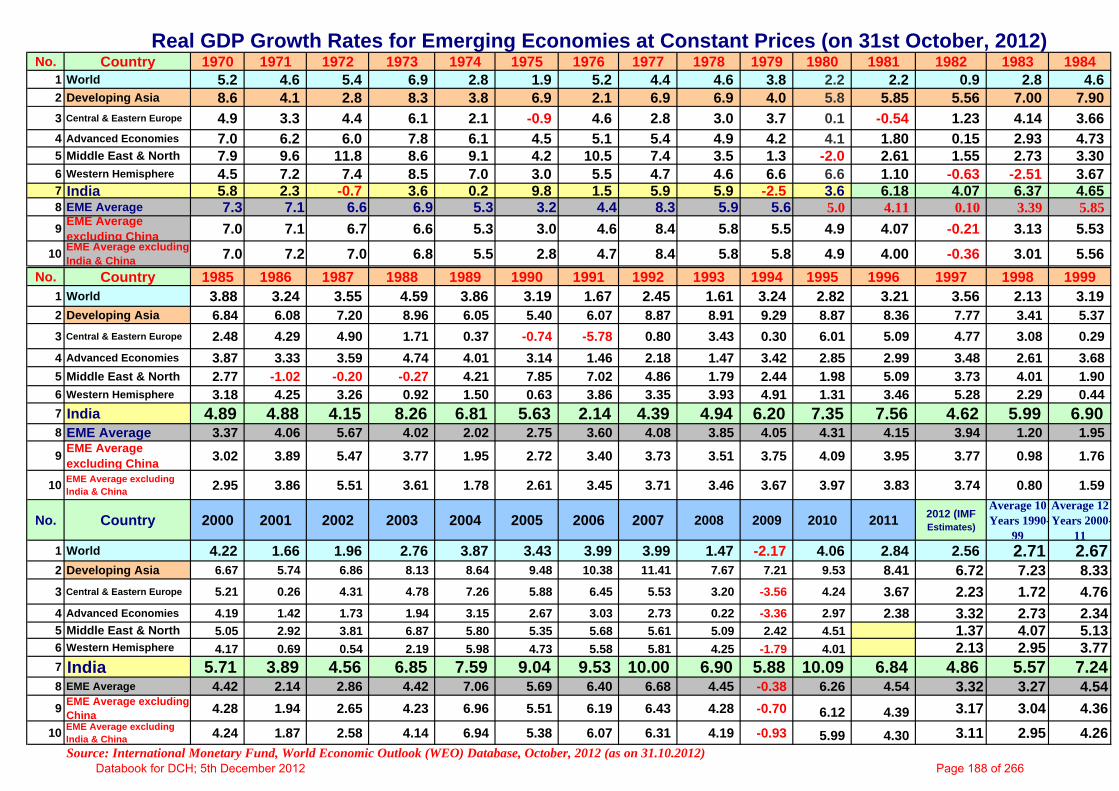
6
Source: International Monetary Fund, World Economic Outlook (WEO) Database, October, 2012 (as on 31.10.2012)
Real GDP Growth Rates for Emerging Economies at Constant Prices (on 31st October, 2012)No. Country 1970 1971 1972 1973 1974 1975 1976 1977 1978 1979 1980 1981 1982 1983 1984
1 World 5.2 4.6 5.4 6.9 2.8 1.9 5.2 4.4 4.6 3.8 2.2 2.2 0.9 2.8 4.6
2 Developing Asia 8.6 4.1 2.8 8.3 3.8 6.9 2.1 6.9 6.9 4.0 5.8 5.85 5.56 7.00 7.90
3 Central & Eastern Europe 4.9 3.3 4.4 6.1 2.1 -0.9 4.6 2.8 3.0 3.7 0.1 -0.54 1.23 4.14 3.66
4 Advanced Economies 7.0 6.2 6.0 7.8 6.1 4.5 5.1 5.4 4.9 4.2 4.1 1.80 0.15 2.93 4.735 Middle East & North 7.9 9.6 11.8 8.6 9.1 4.2 10.5 7.4 3.5 1.3 -2.0 2.61 1.55 2.73 3.30
6 Western Hemisphere 4.5 7.2 7.4 8.5 7.0 3.0 5.5 4.7 4.6 6.6 6.6 1.10 -0.63 -2.51 3.677
8
IndiaEME Average
5.87.3
2.37.1
-0.7 6.6
3.6 .9
0.2 5.3
9.8 3.2
1.5 4.4
5.9 8.3
5.9 5.9
-2.5 5.6
3.6 5.0
6.184.11
4.070.10
6.373.39
4.655.85
9EME Average
7.0 7.1 6.7 6.6 5.3 3.0 4.6 8.4 5.8 5.5 4.9 4.07 -0.21 3.13 5.53
10
excluding ChinaEME Average excluding
7.0 7.2 7.0 6.8 5.5 2.8 4.7 8.4 5.8 5.8 4.9 4.00 -0.36 3.01 5.56
No.
India & China
Country 1985 1986 1987 1988 1989 1990 1991 1992 1993 1994 1995 1996 1997 1998 1999
1 World 3.88 3.24 3.55 4.59 3.86 3.19 1.67 2.45 1.61 3.24 2.82 3.21 3.56 2.13 3.19
2
3
Developing Asia
Central & Eastern Europe
6.84
2.48
6.08
4.29
7.20
4.90
8.96
1.71
6.05
0.37
5.40
-0.74
6.07
-5.78
8.87
0.80
8.91
3.43
9.29
0.30
8.87
6.01
8.36
5.09
7.77
4.77
3.41
3.08
5.37
0.29
Advanced Economies4
5 Middle East & North
3.87
2.77
3.33
-1.02
3.59
-0.20
4.74
-0.27
4.01
4.21
3.14
7.85
1.46
7.02
2.18
4.86
1.47
1.79
3.42
2.44
2.85
1.98
2.99
5.09
3.48
3.73
2.61
4.01
3.68
1.90
6
7
Western Hemisphere
India
3.18
4.89
4.25
4.88
3.26
4.15
0.92
8.26
1.50
6.81
0.63
5.63
3.86
2.14
3.35
4.39
3.93
4.94
4.91
6.20
1.31
7.35
3.46
7.56
5.28
4.62
2.29
5.99
0.44
6.908
9
EME AverageEME Average
3.37
3.02
4.06
3.89
5.67
5.47
4.02
3.77
2.02
1.95
2.75
2.72
3.60
3.40
4.08
3.73
3.85
3.51
4.05
3.75
4.31
4.09
4.15
3.95
3.94
3.77
1.20
0.98
1.95
1.76
10
excluding China
EME Average excluding 2.95 3.86 5.51 3.61 1.78 2.61 3.45 3.71 3.46 3.67 3.97 3.83 3.74 0.80 1.59
No.
India & China
Country 2000 2001 2002 2003 2004 2005 2006 2007 2008 2009 2010 20112012 (IMF
Estimates)
Average 10Years 1990
-Average 12 Years 2000-
1 World 4.22 1.66 1.96 2.76 3.87 3.43 3.99 3.99 1.47 -2.17 4.06 2.84 2.56992.71
112.67
2
3
Developing Asia
Central & Eastern Europe
6.67
5.21
5.74
0.26
6.86
4.31
8.13
4.78
8.64
7.26
9.48
5.88
10.38
6.45
11.41
5.53
7.67
3.20
7.21
-3.56
9.53
4.24
8.41
3.67
6.72
2.23
7.23
1.72
8.33
4.76
4 Advanced Economies 4.19 1.42 1.73 1.94 3.15 2.67 3.03 2.73 0.22 -3.36 2.97 2.38 3.32 2.73 2.345 Middle East & North 5.05 2.92 3.81 6.87 5.80 5.35 5.68 5.61 5.09 2.42 4.51 1.37 4.07 5.136
7
Western Hemisphere 4.17
5.710.69
3.890.54
4.562.19
6.855.98
7.594.73
9.045.58
9.535.81
10.004.25
6.90-1.79
5.884.01
10.09 6.84
2.13
4.86
2.95
5.57
3.77
7.24India8
9
EME Average
EME Average excluding
4.42
4.28
2.14
1.94
2.86
2.65
4.42
4.23
7.06
6.96
5.69
5.51
6.40
6.19
6.68
6.43
4.45
4.28
-0.38
-0.70
6.26 4.54 3.32
3.17
3.27
3.04
4.54
4.36
10
ChinaEME Average excluding
4.24 1.87 2.58 4.14 6.94 5.38 6.07 6.31 4.19 -0.93
6.12 4.39
3.11 2.95 4.26India & China 5.99 4.30
Databook for DCH; 5th December 2012 Page 188 of 266
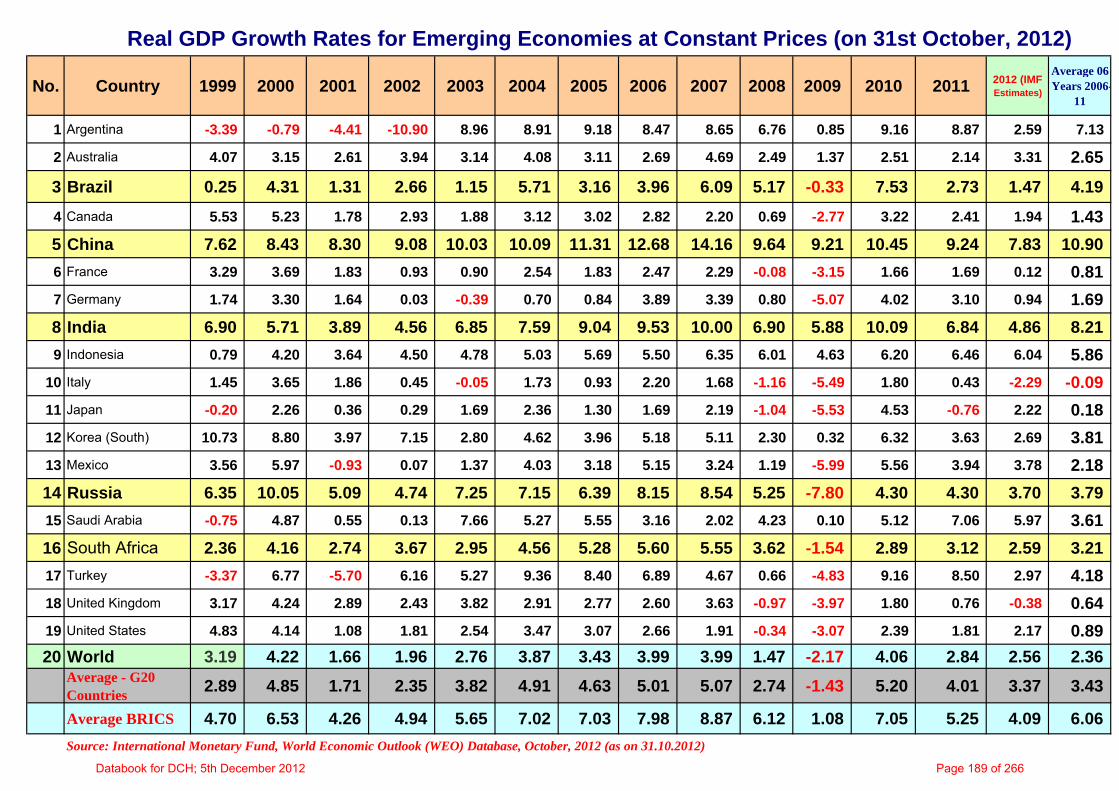
20
Source: International Monetary Fund, World Economic Outlook (WEO) Database, October, 2012 (as on 31.10.2012)
Real GDP Growth Rates for Emerging Economies at Constant Prices (on 31st October, 2012)
No. Country 1999 2000 2001 2002 2003 2004 2005 2006 2007 2008 2009 2010 20112012 (IMF
Estimates)
Average 06 Years 2006-
11
1 Argentina -3.39 -0.79 -4.41 -10.90 8.96 8.91 9.18 8.47 8.65 6.76 0.85 9.16 8.87 2.59 7.13
2 Australia 4.07 3.15 2.61 3.94 3.14 4.08 3.11 2.69 4.69 2.49 1.37 2.51 2.14 3.31 2.65
3 Brazil 0.25 4.31 1.31 2.66 1.15 5.71 3.16 3.96 6.09 5.17 -0.33 7.53 2.73 1.47 4.19
4 Canada 5.53 5.23 1.78 2.93 1.88 3.12 3.02 2.82 2.20 0.69 -2.77 3.22 2.41 1.94 1.43
5 China 7.62 8.43 8.30 9.08 10.03 10.09 11.31 12.68 14.16 9.64 9.21 10.45 9.24 7.83 10.90
6 France 3.29 3.69 1.83 0.93 0.90 2.54 1.83 2.47 2.29 -0.08 -3.15 1.66 1.69 0.12 0.81
7 Germany 1.74 3.30 1.64 0.03 -0.39 0.70 0.84 3.89 3.39 0.80 -5.07 4.02 3.10 0.94 1.69
8 India 6.90 5.71 3.89 4.56 6.85 7.59 9.04 9.53 10.00 6.90 5.88 10.09 6.84 4.86 8.21
9 Indonesia 0.79 4.20 3.64 4.50 4.78 5.03 5.69 5.50 6.35 6.01 4.63 6.20 6.46 6.04 5.86
10 Italy 1.45 3.65 1.86 0.45 -0.05 1.73 0.93 2.20 1.68 -1.16 -5.49 1.80 0.43 -2.29 -0.09
11 Japan -0.20 2.26 0.36 0.29 1.69 2.36 1.30 1.69 2.19 -1.04 -5.53 4.53 -0.76 2.22 0.18
12 Korea (South) 10.73 8.80 3.97 7.15 2.80 4.62 3.96 5.18 5.11 2.30 0.32 6.32 3.63 2.69 3.81
13 Mexico 3.56 5.97 -0.93 0.07 1.37 4.03 3.18 5.15 3.24 1.19 -5.99 5.56 3.94 3.78 2.18
14 Russia 6.35 10.05 5.09 4.74 7.25 7.15 6.39 8.15 8.54 5.25 -7.80 4.30 4.30 3.70 3.79
15 Saudi Arabia -0.75 4.87 0.55 0.13 7.66 5.27 5.55 3.16 2.02 4.23 0.10 5.12 7.06 5.97 3.61
16 South Africa 2.36 4.16 2.74 3.67 2.95 4.56 5.28 5.60 5.55 3.62 -1.54 2.89 3.12 2.59 3.21
17 Turkey -3.37 6.77 -5.70 6.16 5.27 9.36 8.40 6.89 4.67 0.66 -4.83 9.16 8.50 2.97 4.18
18 United Kingdom 3.17 4.24 2.89 2.43 3.82 2.91 2.77 2.60 3.63 -0.97 -3.97 1.80 0.76 -0.38 0.64
19 United States 4.83 4.14 1.08 1.81 2.54 3.47 3.07 2.66 1.91 -0.34 -3.07 2.39 1.81 2.17 0.89
World Average - G20
3.19
2.89
4.22
4.85
1.66
1.71
1.96
2.35
2.76
3.82
3.87
4.91
3.43
4.63
3.99
5.01
3.99
5.07
1.47
2.74
-2.17
-1.43
4.06
5.20
2.84
4.01
2.56
3.37
2.36
3.43Countries
Average BRICS 4.70 6.53 4.26 4.94 5.65 7.02 7.03 7.98 8.87 6.12 1.08 7.05 5.25 4.09 6.06
Databook for DCH; 5th December 2012 Page 189 of 266
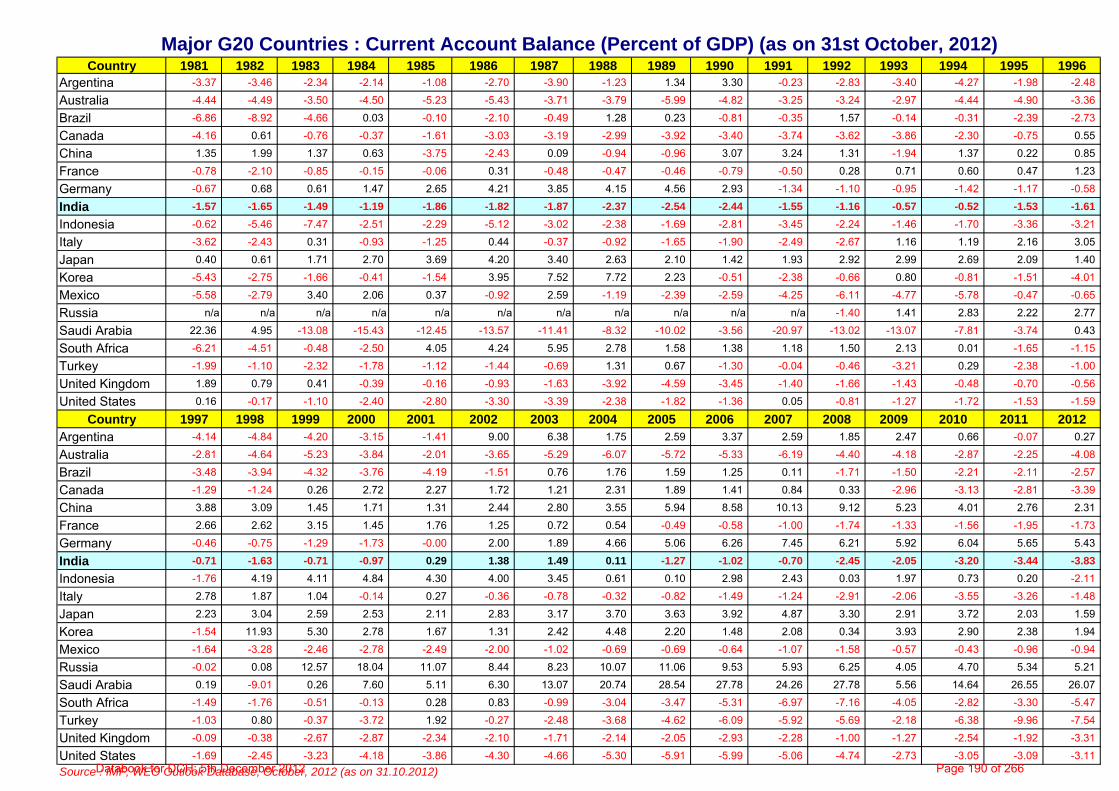
Major G20 Countries : Current Account Balance (Percent of GDP) (as on 31st October, 2012)Country 1981 1982 1983 1984 1985 1986 1987 1988 1989 1990 1991 1992 1993 1994 1995 1996
Argentina -3.37 -3.46 -2.34 -2.14 -1.08 -2.70 -3.90 -1.23 1.34 3.30 -0.23 -2.83 -3.40 -4.27 -1.98 -2.48
Australia -4.44 -4.49 -3.50 -4.50 -5.23 -5.43 -3.71 -3.79 -5.99 -4.82 -3.25 -3.24 -2.97 -4.44 -4.90 -3.36
Brazil -6.86 -8.92 -4.66 0.03 -0.10 -2.10 -0.49 1.28 0.23 -0.81 -0.35 1.57 -0.14 -0.31 -2.39 -2.73
Canada -4.16 0.61 -0.76 -0.37 -1.61 -3.03 -3.19 -2.99 -3.92 -3.40 -3.74 -3.62 -3.86 -2.30 -0.75 0.55
China 1.35 1.99 1.37 0.63 -3.75 -2.43 0.09 -0.94 -0.96 3.07 3.24 1.31 -1.94 1.37 0.22 0.85
France -0.78 -2.10 -0.85 -0.15 -0.06 0.31 -0.48 -0.47 -0.46 -0.79 -0.50 0.28 0.71 0.60 0.47 1.23
Germany -0.67 0.68 0.61 1.47 2.65 4.21 3.85 4.15 4.56 2.93 -1.34 -1.10 -0.95 -1.42 -1.17 -0.58
India -1.57 -1.65 -1.49 -1.19 -1.86 -1.82 -1.87 -2.37 -2.54 -2.44 -1.55 -1.16 -0.57 -0.52 -1.53 -1.61
Indonesia -0.62 -5.46 -7.47 -2.51 -2.29 -5.12 -3.02 -2.38 -1.69 -2.81 -3.45 -2.24 -1.46 -1.70 -3.36 -3.21
Italy -3.62 -2.43 0.31 -0.93 -1.25 0.44 -0.37 -0.92 -1.65 -1.90 -2.49 -2.67 1.16 1.19 2.16 3.05
Japan 0.40 0.61 1.71 2.70 3.69 4.20 3.40 2.63 2.10 1.42 1.93 2.92 2.99 2.69 2.09 1.40
Korea -5.43 -2.75 -1.66 -0.41 -1.54 3.95 7.52 7.72 2.23 -0.51 -2.38 -0.66 0.80 -0.81 -1.51 -4.01
Mexico -5.58 -2.79 3.40 2.06 0.37 -0.92 2.59 -1.19 -2.39 -2.59 -4.25 -6.11 -4.77 -5.78 -0.47 -0.65
Russia n/a n/a n/a n/a n/a n/a n/a n/a n/a n/a n/a -1.40 1.41 2.83 2.22 2.77
Saudi Arabia 22.36 4.95 -13.08 -15.43 -12.45 -13.57 -11.41 -8.32 -10.02 -3.56 -20.97 -13.02 -13.07 -7.81 -3.74 0.43
South Africa -6.21 -4.51 -0.48 -2.50 4.05 4.24 5.95 2.78 1.58 1.38 1.18 1.50 2.13 0.01 -1.65 -1.15
Turkey -1.99 -1.10 -2.32 -1.78 -1.12 -1.44 -0.69 1.31 0.67 -1.30 -0.04 -0.46 -3.21 0.29 -2.38 -1.00
United Kingdom 1.89 0.79 0.41 -0.39 -0.16 -0.93 -1.63 -3.92 -4.59 -3.45 -1.40 -1.66 -1.43 -0.48 -0.70 -0.56
United States 0.16 -0.17 -1.10 -2.40 -2.80 -3.30 -3.39 -2.38 -1.82 -1.36 0.05 -0.81 -1.27 -1.72 -1.53 -1.59
Country 1997 1998 1999 2000 2001 2002 2003 2004 2005 2006 2007 2008 2009 2010 2011 2012
Argentina -4.14 -4.84 -4.20 -3.15 -1.41 9.00 6.38 1.75 2.59 3.37 2.59 1.85 2.47 0.66 -0.07 0.27
Australia -2.81 -4.64 -5.23 -3.84 -2.01 -3.65 -5.29 -6.07 -5.72 -5.33 -6.19 -4.40 -4.18 -2.87 -2.25 -4.08
Brazil -3.48 -3.94 -4.32 -3.76 -4.19 -1.51 0.76 1.76 1.59 1.25 0.11 -1.71 -1.50 -2.21 -2.11 -2.57
Canada -1.29 -1.24 0.26 2.72 2.27 1.72 1.21 2.31 1.89 1.41 0.84 0.33 -2.96 -3.13 -2.81 -3.39
China 3.88 3.09 1.45 1.71 1.31 2.44 2.80 3.55 5.94 8.58 10.13 9.12 5.23 4.01 2.76 2.31
France 2.66 2.62 3.15 1.45 1.76 1.25 0.72 0.54 -0.49 -0.58 -1.00 -1.74 -1.33 -1.56 -1.95 -1.73
Germany -0.46 -0.75 -1.29 -1.73 -0.00 2.00 1.89 4.66 5.06 6.26 7.45 6.21 5.92 6.04 5.65 5.43
India -0.71 -1.63 -0.71 -0.97 0.29 1.38 1.49 0.11 -1.27 -1.02 -0.70 -2.45 -2.05 -3.20 -3.44 -3.83
Indonesia -1.76 4.19 4.11 4.84 4.30 4.00 3.45 0.61 0.10 2.98 2.43 0.03 1.97 0.73 0.20 -2.11
Italy 2.78 1.87 1.04 -0.14 0.27 -0.36 -0.78 -0.32 -0.82 -1.49 -1.24 -2.91 -2.06 -3.55 -3.26 -1.48
Japan 2.23 3.04 2.59 2.53 2.11 2.83 3.17 3.70 3.63 3.92 4.87 3.30 2.91 3.72 2.03 1.59
Korea -1.54 11.93 5.30 2.78 1.67 1.31 2.42 4.48 2.20 1.48 2.08 0.34 3.93 2.90 2.38 1.94
Mexico -1.64 -3.28 -2.46 -2.78 -2.49 -2.00 -1.02 -0.69 -0.69 -0.64 -1.07 -1.58 -0.57 -0.43 -0.96 -0.94
Russia -0.02 0.08 12.57 18.04 11.07 8.44 8.23 10.07 11.06 9.53 5.93 6.25 4.05 4.70 5.34 5.21
Saudi Arabia 0.19 -9.01 0.26 7.60 5.11 6.30 13.07 20.74 28.54 27.78 24.26 27.78 5.56 14.64 26.55 26.07
South Africa -1.49 -1.76 -0.51 -0.13 0.28 0.83 -0.99 -3.04 -3.47 -5.31 -6.97 -7.16 -4.05 -2.82 -3.30 -5.47
Turkey -1.03 0.80 -0.37 -3.72 1.92 -0.27 -2.48 -3.68 -4.62 -6.09 -5.92 -5.69 -2.18 -6.38 -9.96 -7.54
United Kingdom -0.09 -0.38 -2.67 -2.87 -2.34 -2.10 -1.71 -2.14 -2.05 -2.93 -2.28 -1.00 -1.27 -2.54 -1.92 -3.31
United States -1.69 -2.45 -3.23 -4.18 -3.86 -4.30 -4.66 -5.30 -5.91 -5.99 -5.06 -4.74 -2.73 -3.05 -3.09 -3.11 Source : IMF; WEO Outlook Database, October, 2012 (as on 31.10.2012)Databook for DCH; 5th December 2012 Page 190 of 266
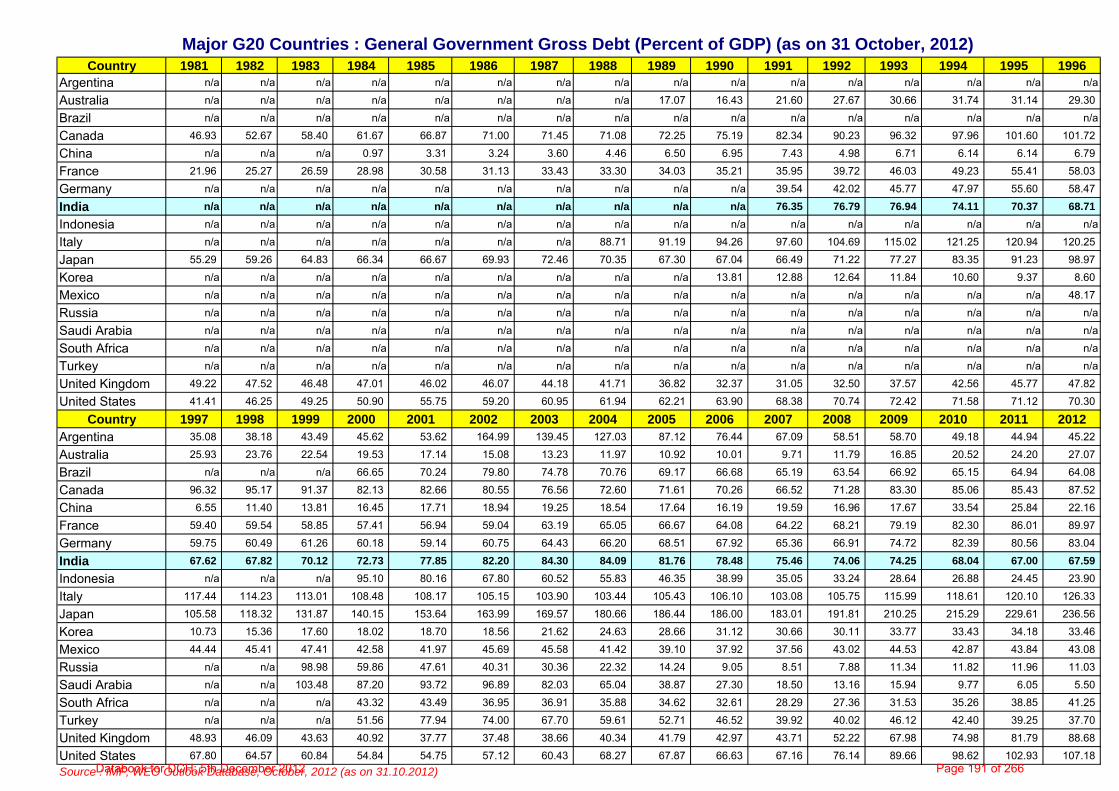
Major G20 Countries : General Government Gross Debt (Percent of GDP) (as on 31 October, 2012)
Country 1981 1982 1983 1984 1985 1986 1987 1988 1989 1990 1991 1992 1993 1994 1995 1996
Argentina n/a n/a n/a n/a n/a n/a n/a n/a n/a n/a n/a n/a n/a n/a n/a n/a
Australia n/a n/a n/a n/a n/a n/a n/a n/a 17.07 16.43 21.60 27.67 30.66 31.74 31.14 29.30
Brazil n/a n/a n/a n/a n/a n/a n/a n/a n/a n/a n/a n/a n/a n/a n/a n/a
Canada 46.93 52.67 58.40 61.67 66.87 71.00 71.45 71.08 72.25 75.19 82.34 90.23 96.32 97.96 101.60 101.72
China n/a n/a n/a 0.97 3.31 3.24 3.60 4.46 6.50 6.95 7.43 4.98 6.71 6.14 6.14 6.79
France 21.96 25.27 26.59 28.98 30.58 31.13 33.43 33.30 34.03 35.21 35.95 39.72 46.03 49.23 55.41 58.03
Germany n/a n/a n/a n/a n/a n/a n/a n/a n/a n/a 39.54 42.02 45.77 47.97 55.60 58.47
India n/a n/a n/a n/a n/a n/a n/a n/a n/a n/a 76.35 76.79 76.94 74.11 70.37 68.71
Indonesia n/a n/a n/a n/a n/a n/a n/a n/a n/a n/a n/a n/a n/a n/a n/a n/a
Italy n/a n/a n/a n/a n/a n/a n/a 88.71 91.19 94.26 97.60 104.69 115.02 121.25 120.94 120.25
Japan 55.29 59.26 64.83 66.34 66.67 69.93 72.46 70.35 67.30 67.04 66.49 71.22 77.27 83.35 91.23 98.97
Korea n/a n/a n/a n/a n/a n/a n/a n/a n/a 13.81 12.88 12.64 11.84 10.60 9.37 8.60
Mexico n/a n/a n/a n/a n/a n/a n/a n/a n/a n/a n/a n/a n/a n/a n/a 48.17
Russia n/a n/a n/a n/a n/a n/a n/a n/a n/a n/a n/a n/a n/a n/a n/a n/a
Saudi Arabia n/a n/a n/a n/a n/a n/a n/a n/a n/a n/a n/a n/a n/a n/a n/a n/a
South Africa n/a n/a n/a n/a n/a n/a n/a n/a n/a n/a n/a n/a n/a n/a n/a n/a
Turkey n/a n/a n/a n/a n/a n/a n/a n/a n/a n/a n/a n/a n/a n/a n/a n/a
United Kingdom 49.22 47.52 46.48 47.01 46.02 46.07 44.18 41.71 36.82 32.37 31.05 32.50 37.57 42.56 45.77 47.82
United States 41.41 46.25 49.25 50.90 55.75 59.20 60.95 61.94 62.21 63.90 68.38 70.74 72.42 71.58 71.12 70.30
Country 1997 1998 1999 2000 2001 2002 2003 2004 2005 2006 2007 2008 2009 2010 2011 2012
Argentina 35.08 38.18 43.49 45.62 53.62 164.99 139.45 127.03 87.12 76.44 67.09 58.51 58.70 49.18 44.94 45.22
Australia 25.93 23.76 22.54 19.53 17.14 15.08 13.23 11.97 10.92 10.01 9.71 11.79 16.85 20.52 24.20 27.07
Brazil n/a n/a n/a 66.65 70.24 79.80 74.78 70.76 69.17 66.68 65.19 63.54 66.92 65.15 64.94 64.08
Canada 96.32 95.17 91.37 82.13 82.66 80.55 76.56 72.60 71.61 70.26 66.52 71.28 83.30 85.06 85.43 87.52
China 6.55 11.40 13.81 16.45 17.71 18.94 19.25 18.54 17.64 16.19 19.59 16.96 17.67 33.54 25.84 22.16
France 59.40 59.54 58.85 57.41 56.94 59.04 63.19 65.05 66.67 64.08 64.22 68.21 79.19 82.30 86.01 89.97
Germany 59.75 60.49 61.26 60.18 59.14 60.75 64.43 66.20 68.51 67.92 65.36 66.91 74.72 82.39 80.56 83.04
India 67.62 67.82 70.12 72.73 77.85 82.20 84.30 84.09 81.76 78.48 75.46 74.06 74.25 68.04 67.00 67.59
Indonesia n/a n/a n/a 95.10 80.16 67.80 60.52 55.83 46.35 38.99 35.05 33.24 28.64 26.88 24.45 23.90
Italy 117.44 114.23 113.01 108.48 108.17 105.15 103.90 103.44 105.43 106.10 103.08 105.75 115.99 118.61 120.10 126.33
Japan 105.58 118.32 131.87 140.15 153.64 163.99 169.57 180.66 186.44 186.00 183.01 191.81 210.25 215.29 229.61 236.56
Korea 10.73 15.36 17.60 18.02 18.70 18.56 21.62 24.63 28.66 31.12 30.66 30.11 33.77 33.43 34.18 33.46
Mexico 44.44 45.41 47.41 42.58 41.97 45.69 45.58 41.42 39.10 37.92 37.56 43.02 44.53 42.87 43.84 43.08
Russia n/a n/a 98.98 59.86 47.61 40.31 30.36 22.32 14.24 9.05 8.51 7.88 11.34 11.82 11.96 11.03
Saudi Arabia n/a n/a 103.48 87.20 93.72 96.89 82.03 65.04 38.87 27.30 18.50 13.16 15.94 9.77 6.05 5.50
South Africa n/a n/a n/a 43.32 43.49 36.95 36.91 35.88 34.62 32.61 28.29 27.36 31.53 35.26 38.85 41.25
Turkey n/a n/a n/a 51.56 77.94 74.00 67.70 59.61 52.71 46.52 39.92 40.02 46.12 42.40 39.25 37.70
United Kingdom 48.93 46.09 43.63 40.92 37.77 37.48 38.66 40.34 41.79 42.97 43.71 52.22 67.98 74.98 81.79 88.68
United States 67.80 64.57 60.84 54.84 54.75 57.12 60.43 68.27 67.87 66.63 67.16 76.14 89.66 98.62 102.93 107.18Source : IMF; WEO Outlook Database, October, 2012 (as on 31.10.2012)Databook for DCH; 5th December 2012 Page 191 of 266
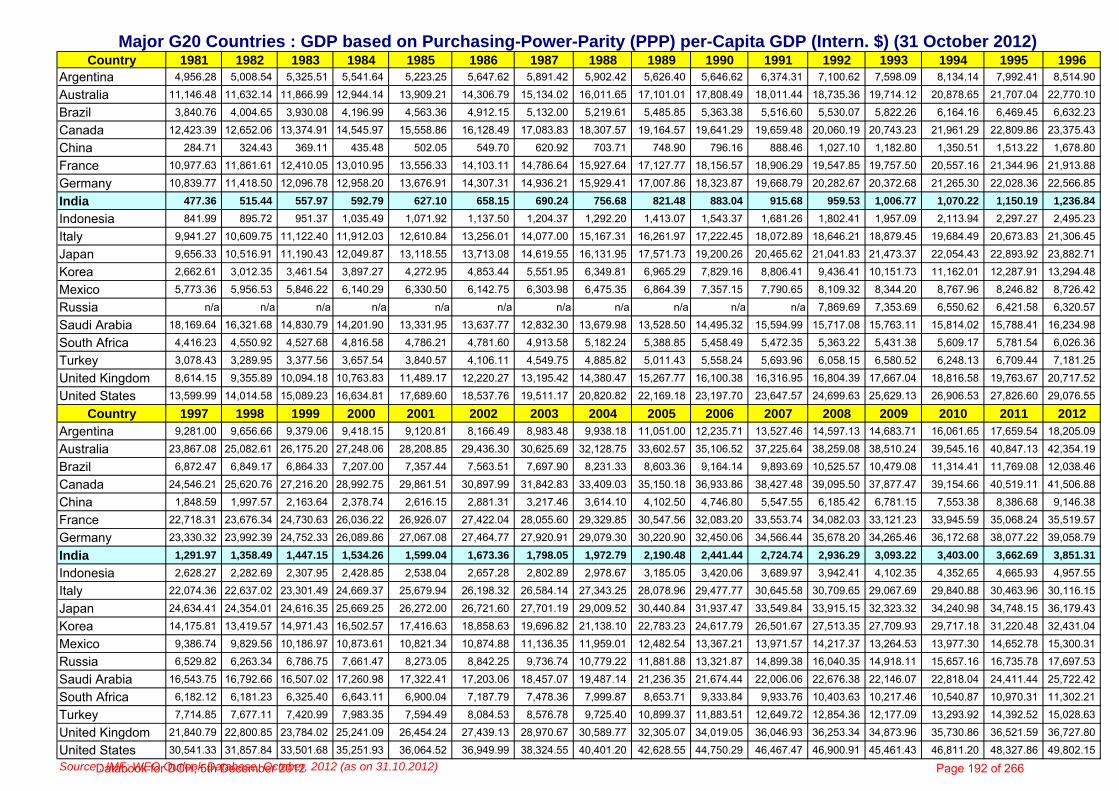
Major G20 Countries : GDP based on Purchasing-Power-Parity (PPP) per-Capita GDP (Intern. $) (31 October 2012)Country 1981 1982 1983 1984 1985 1986 1987 1988 1989 1990 1991 1992 1993 1994 1995 1996
Argentina 4,956.28 5,008.54 5,325.51 5,541.64 5,223.25 5,647.62 5,891.42 5,902.42 5,626.40 5,646.62 6,374.31 7,100.62 7,598.09 8,134.14 7,992.41 8,514.90
Australia 11,146.48 11,632.14 11,866.99 12,944.14 13,909.21 14,306.79 15,134.02 16,011.65 17,101.01 17,808.49 18,011.44 18,735.36 19,714.12 20,878.65 21,707.04 22,770.10
Brazil 3,840.76 4,004.65 3,930.08 4,196.99 4,563.36 4,912.15 5,132.00 5,219.61 5,485.85 5,363.38 5,516.60 5,530.07 5,822.26 6,164.16 6,469.45 6,632.23
Canada 12,423.39 12,652.06 13,374.91 14,545.97 15,558.86 16,128.49 17,083.83 18,307.57 19,164.57 19,641.29 19,659.48 20,060.19 20,743.23 21,961.29 22,809.86 23,375.43
China 284.71 324.43 369.11 435.48 502.05 549.70 620.92 703.71 748.90 796.16 888.46 1,027.10 1,182.80 1,350.51 1,513.22 1,678.80
France 10,977.63 11,861.61 12,410.05 13,010.95 13,556.33 14,103.11 14,786.64 15,927.64 17,127.77 18,156.57 18,906.29 19,547.85 19,757.50 20,557.16 21,344.96 21,913.88
Germany 10,839.77 11,418.50 12,096.78 12,958.20 13,676.91 14,307.31 14,936.21 15,929.41 17,007.86 18,323.87 19,668.79 20,282.67 20,372.68 21,265.30 22,028.36 22,566.85
India 477.36 515.44 557.97 592.79 627.10 658.15 690.24 756.68 821.48 883.04 915.68 959.53 1,006.77 1,070.22 1,150.19 1,236.84
Indonesia 841.99 895.72 951.37 1,035.49 1,071.92 1,137.50 1,204.37 1,292.20 1,413.07 1,543.37 1,681.26 1,802.41 1,957.09 2,113.94 2,297.27 2,495.23
Italy 9,941.27 10,609.75 11,122.40 11,912.03 12,610.84 13,256.01 14,077.00 15,167.31 16,261.97 17,222.45 18,072.89 18,646.21 18,879.45 19,684.49 20,673.83 21,306.45
Japan 9,656.33 10,516.91 11,190.43 12,049.87 13,118.55 13,713.08 14,619.55 16,131.95 17,571.73 19,200.26 20,465.62 21,041.83 21,473.37 22,054.43 22,893.92 23,882.71
Korea 2,662.61 3,012.35 3,461.54 3,897.27 4,272.95 4,853.44 5,551.95 6,349.81 6,965.29 7,829.16 8,806.41 9,436.41 10,151.73 11,162.01 12,287.91 13,294.48
Mexico 5,773.36 5,956.53 5,846.22 6,140.29 6,330.50 6,142.75 6,303.98 6,475.35 6,864.39 7,357.15 7,790.65 8,109.32 8,344.20 8,767.96 8,246.82 8,726.42
Russia n/a n/a n/a n/a n/a n/a n/a n/a n/a n/a n/a 7,869.69 7,353.69 6,550.62 6,421.58 6,320.57
Saudi Arabia 18,169.64 16,321.68 14,830.79 14,201.90 13,331.95 13,637.77 12,832.30 13,679.98 13,528.50 14,495.32 15,594.99 15,717.08 15,763.11 15,814.02 15,788.41 16,234.98
South Africa 4,416.23 4,550.92 4,527.68 4,816.58 4,786.21 4,781.60 4,913.58 5,182.24 5,388.85 5,458.49 5,472.35 5,363.22 5,431.38 5,609.17 5,781.54 6,026.36
Turkey 3,078.43 3,289.95 3,377.56 3,657.54 3,840.57 4,106.11 4,549.75 4,885.82 5,011.43 5,558.24 5,693.96 6,058.15 6,580.52 6,248.13 6,709.44 7,181.25
United Kingdom 8,614.15 9,355.89 10,094.18 10,763.83 11,489.17 12,220.27 13,195.42 14,380.47 15,267.77 16,100.38 16,316.95 16,804.39 17,667.04 18,816.58 19,763.67 20,717.52
United States 13,599.99 14,014.58 15,089.23 16,634.81 17,689.60 18,537.76 19,511.17 20,820.82 22,169.18 23,197.70 23,647.57 24,699.63 25,629.13 26,906.53 27,826.60 29,076.55
Country 1997 1998 1999 2000 2001 2002 2003 2004 2005 2006 2007 2008 2009 2010 2011 2012
Argentina 9,281.00 9,656.66 9,379.06 9,418.15 9,120.81 8,166.49 8,983.48 9,938.18 11,051.00 12,235.71 13,527.46 14,597.13 14,683.71 16,061.65 17,659.54 18,205.09
Australia 23,867.08 25,082.61 26,175.20 27,248.06 28,208.85 29,436.30 30,625.69 32,128.75 33,602.57 35,106.52 37,225.64 38,259.08 38,510.24 39,545.16 40,847.13 42,354.19
Brazil 6,872.47 6,849.17 6,864.33 7,207.00 7,357.44 7,563.51 7,697.90 8,231.33 8,603.36 9,164.14 9,893.69 10,525.57 10,479.08 11,314.41 11,769.08 12,038.46
Canada 24,546.21 25,620.76 27,216.20 28,992.75 29,861.51 30,897.99 31,842.83 33,409.03 35,150.18 36,933.86 38,427.48 39,095.50 37,877.47 39,154.66 40,519.11 41,506.88
China 1,848.59 1,997.57 2,163.64 2,378.74 2,616.15 2,881.31 3,217.46 3,614.10 4,102.50 4,746.80 5,547.55 6,185.42 6,781.15 7,553.38 8,386.68 9,146.38
France 22,718.31 23,676.34 24,730.63 26,036.22 26,926.07 27,422.04 28,055.60 29,329.85 30,547.56 32,083.20 33,553.74 34,082.03 33,121.23 33,945.59 35,068.24 35,519.57
Germany 23,330.32 23,992.39 24,752.33 26,089.86 27,067.08 27,464.77 27,920.91 29,079.30 30,220.90 32,450.06 34,566.44 35,678.20 34,265.46 36,172.68 38,077.22 39,058.79
India 1,291.97 1,358.49 1,447.15 1,534.26 1,599.04 1,673.36 1,798.05 1,972.79 2,190.48 2,441.44 2,724.74 2,936.29 3,093.22 3,403.00 3,662.69 3,851.31
Indonesia 2,628.27 2,282.69 2,307.95 2,428.85 2,538.04 2,657.28 2,802.89 2,978.67 3,185.05 3,420.06 3,689.97 3,942.41 4,102.35 4,352.65 4,665.93 4,957.55
Italy 22,074.36 22,637.02 23,301.49 24,669.37 25,679.94 26,198.32 26,584.14 27,343.25 28,078.96 29,477.77 30,645.58 30,709.65 29,067.69 29,840.88 30,463.96 30,116.15
Japan 24,634.41 24,354.01 24,616.35 25,669.25 26,272.00 26,721.60 27,701.19 29,009.52 30,440.84 31,937.47 33,549.84 33,915.15 32,323.32 34,240.98 34,748.15 36,179.43
Korea 14,175.81 13,419.57 14,971.43 16,502.57 17,416.63 18,858.63 19,696.82 21,138.10 22,783.23 24,617.79 26,501.67 27,513.35 27,709.93 29,717.18 31,220.48 32,431.04
Mexico 9,386.74 9,829.56 10,186.97 10,873.61 10,821.34 10,874.88 11,136.35 11,959.01 12,482.54 13,367.21 13,971.57 14,217.37 13,264.53 13,977.30 14,652.78 15,300.31
Russia 6,529.82 6,263.34 6,786.75 7,661.47 8,273.05 8,842.25 9,736.74 10,779.22 11,881.88 13,321.87 14,899.38 16,040.35 14,918.11 15,657.16 16,735.78 17,697.53
Saudi Arabia 16,543.75 16,792.66 16,507.02 17,260.98 17,322.41 17,203.06 18,457.07 19,487.14 21,236.35 21,674.44 22,006.06 22,676.38 22,146.07 22,818.04 24,411.44 25,722.42
South Africa 6,182.12 6,181.23 6,325.40 6,643.11 6,900.04 7,187.79 7,478.36 7,999.87 8,653.71 9,333.84 9,933.76 10,403.63 10,217.46 10,540.87 10,970.31 11,302.21
Turkey 7,714.85 7,677.11 7,420.99 7,983.35 7,594.49 8,084.53 8,576.78 9,725.40 10,899.37 11,883.51 12,649.72 12,854.36 12,177.09 13,293.92 14,392.52 15,028.63
United Kingdom 21,840.79 22,800.85 23,784.02 25,241.09 26,454.24 27,439.13 28,970.67 30,589.77 32,305.07 34,019.05 36,046.93 36,253.34 34,873.96 35,730.86 36,521.59 36,727.80
United States 30,541.33 31,857.84 33,501.68 35,251.93 36,064.52 36,949.99 38,324.55 40,401.20 42,628.55 44,750.29 46,467.47 46,900.91 45,461.43 46,811.20 48,327.86 49,802.15Source : IMF; WEO Outlook Database, October, 2012 (as on 31.10.2012)Databook for DCH; 5th December 2012 Page 192 of 266
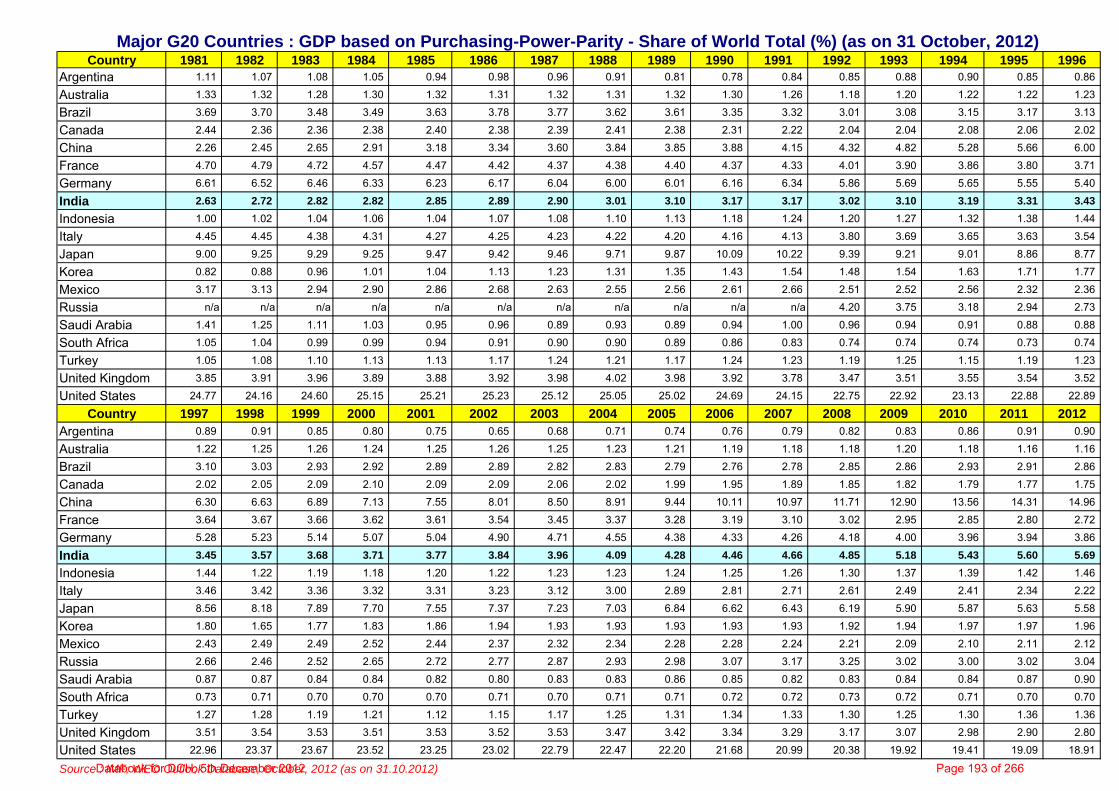
Major G20 Countries : GDP based on Purchasing-Power-Parity - Share of World Total (%) (as on 31 October, 2012)Country 1981 1982 1983 1984 1985 1986 1987 1988 1989 1990 1991 1992 1993 1994 1995 1996
Argentina 1.11 1.07 1.08 1.05 0.94 0.98 0.96 0.91 0.81 0.78 0.84 0.85 0.88 0.90 0.85 0.86
Australia 1.33 1.32 1.28 1.30 1.32 1.31 1.32 1.31 1.32 1.30 1.26 1.18 1.20 1.22 1.22 1.23
Brazil 3.69 3.70 3.48 3.49 3.63 3.78 3.77 3.62 3.61 3.35 3.32 3.01 3.08 3.15 3.17 3.13
Canada 2.44 2.36 2.36 2.38 2.40 2.38 2.39 2.41 2.38 2.31 2.22 2.04 2.04 2.08 2.06 2.02
China 2.26 2.45 2.65 2.91 3.18 3.34 3.60 3.84 3.85 3.88 4.15 4.32 4.82 5.28 5.66 6.00
France 4.70 4.79 4.72 4.57 4.47 4.42 4.37 4.38 4.40 4.37 4.33 4.01 3.90 3.86 3.80 3.71
Germany 6.61 6.52 6.46 6.33 6.23 6.17 6.04 6.00 6.01 6.16 6.34 5.86 5.69 5.65 5.55 5.40
India 2.63 2.72 2.82 2.82 2.85 2.89 2.90 3.01 3.10 3.17 3.17 3.02 3.10 3.19 3.31 3.43
Indonesia 1.00 1.02 1.04 1.06 1.04 1.07 1.08 1.10 1.13 1.18 1.24 1.20 1.27 1.32 1.38 1.44
Italy 4.45 4.45 4.38 4.31 4.27 4.25 4.23 4.22 4.20 4.16 4.13 3.80 3.69 3.65 3.63 3.54
Japan 9.00 9.25 9.29 9.25 9.47 9.42 9.46 9.71 9.87 10.09 10.22 9.39 9.21 9.01 8.86 8.77
Korea 0.82 0.88 0.96 1.01 1.04 1.13 1.23 1.31 1.35 1.43 1.54 1.48 1.54 1.63 1.71 1.77
Mexico 3.17 3.13 2.94 2.90 2.86 2.68 2.63 2.55 2.56 2.61 2.66 2.51 2.52 2.56 2.32 2.36
Russia n/a n/a n/a n/a n/a n/a n/a n/a n/a n/a n/a 4.20 3.75 3.18 2.94 2.73
Saudi Arabia 1.41 1.25 1.11 1.03 0.95 0.96 0.89 0.93 0.89 0.94 1.00 0.96 0.94 0.91 0.88 0.88
South Africa 1.05 1.04 0.99 0.99 0.94 0.91 0.90 0.90 0.89 0.86 0.83 0.74 0.74 0.74 0.73 0.74
Turkey 1.05 1.08 1.10 1.13 1.13 1.17 1.24 1.21 1.17 1.24 1.23 1.19 1.25 1.15 1.19 1.23
United Kingdom 3.85 3.91 3.96 3.89 3.88 3.92 3.98 4.02 3.98 3.92 3.78 3.47 3.51 3.55 3.54 3.52
United States 24.77 24.16 24.60 25.15 25.21 25.23 25.12 25.05 25.02 24.69 24.15 22.75 22.92 23.13 22.88 22.89
Country 1997 1998 1999 2000 2001 2002 2003 2004 2005 2006 2007 2008 2009 2010 2011 2012
Argentina 0.89 0.91 0.85 0.80 0.75 0.65 0.68 0.71 0.74 0.76 0.79 0.82 0.83 0.86 0.91 0.90
Australia 1.22 1.25 1.26 1.24 1.25 1.26 1.25 1.23 1.21 1.19 1.18 1.18 1.20 1.18 1.16 1.16
Brazil 3.10 3.03 2.93 2.92 2.89 2.89 2.82 2.83 2.79 2.76 2.78 2.85 2.86 2.93 2.91 2.86
Canada 2.02 2.05 2.09 2.10 2.09 2.09 2.06 2.02 1.99 1.95 1.89 1.85 1.82 1.79 1.77 1.75
China 6.30 6.63 6.89 7.13 7.55 8.01 8.50 8.91 9.44 10.11 10.97 11.71 12.90 13.56 14.31 14.96
France 3.64 3.67 3.66 3.62 3.61 3.54 3.45 3.37 3.28 3.19 3.10 3.02 2.95 2.85 2.80 2.72
Germany 5.28 5.23 5.14 5.07 5.04 4.90 4.71 4.55 4.38 4.33 4.26 4.18 4.00 3.96 3.94 3.863.45 3.57 3.68 3.71 3.77 3.84 3.96 4.09 4.28 4.46 4.66 4.85 5.18 5.43 5.60 5.69India
Indonesia 1.44 1.22 1.19 1.18 1.20 1.22 1.23 1.23 1.24 1.25 1.26 1.30 1.37 1.39 1.42 1.46
Italy 3.46 3.42 3.36 3.32 3.31 3.23 3.12 3.00 2.89 2.81 2.71 2.61 2.49 2.41 2.34 2.228.56 8.18 7.89 7.70 7.55 7.37 7.23 7.03 6.84 6.62 6.43 6.19 5.90 5.87 5.63 5.58Japan
Korea 1.80 1.65 1.77 1.83 1.86 1.94 1.93 1.93 1.93 1.93 1.93 1.92 1.94 1.97 1.97 1.96
Mexico 2.43 2.49 2.49 2.52 2.44 2.37 2.32 2.34 2.28 2.28 2.24 2.21 2.09 2.10 2.11 2.12
Russia 2.66 2.46 2.52 2.65 2.72 2.77 2.87 2.93 2.98 3.07 3.17 3.25 3.02 3.00 3.02 3.04
Saudi Arabia 0.87 0.87 0.84 0.84 0.82 0.80 0.83 0.83 0.86 0.85 0.82 0.83 0.84 0.84 0.87 0.90
South Africa 0.73 0.71 0.70 0.70 0.70 0.71 0.70 0.71 0.71 0.72 0.72 0.73 0.72 0.71 0.70 0.70
Turkey 1.27 1.28 1.19 1.21 1.12 1.15 1.17 1.25 1.31 1.34 1.33 1.30 1.25 1.30 1.36 1.36
United Kingdom 3.51 3.54 3.53 3.51 3.53 3.52 3.53 3.47 3.42 3.34 3.29 3.17 3.07 2.98 2.90 2.80
United States 22.96 23.37 23.67 23.52 23.25 23.02 22.79 22.47 22.20 21.68 20.99 20.38 19.92 19.41 19.09 18.91
Source : IMF; WEO Outlook Database, October, 2012 (as on 31.10.2012)Databook for DCH; 5th December 2012 Page 193 of 266
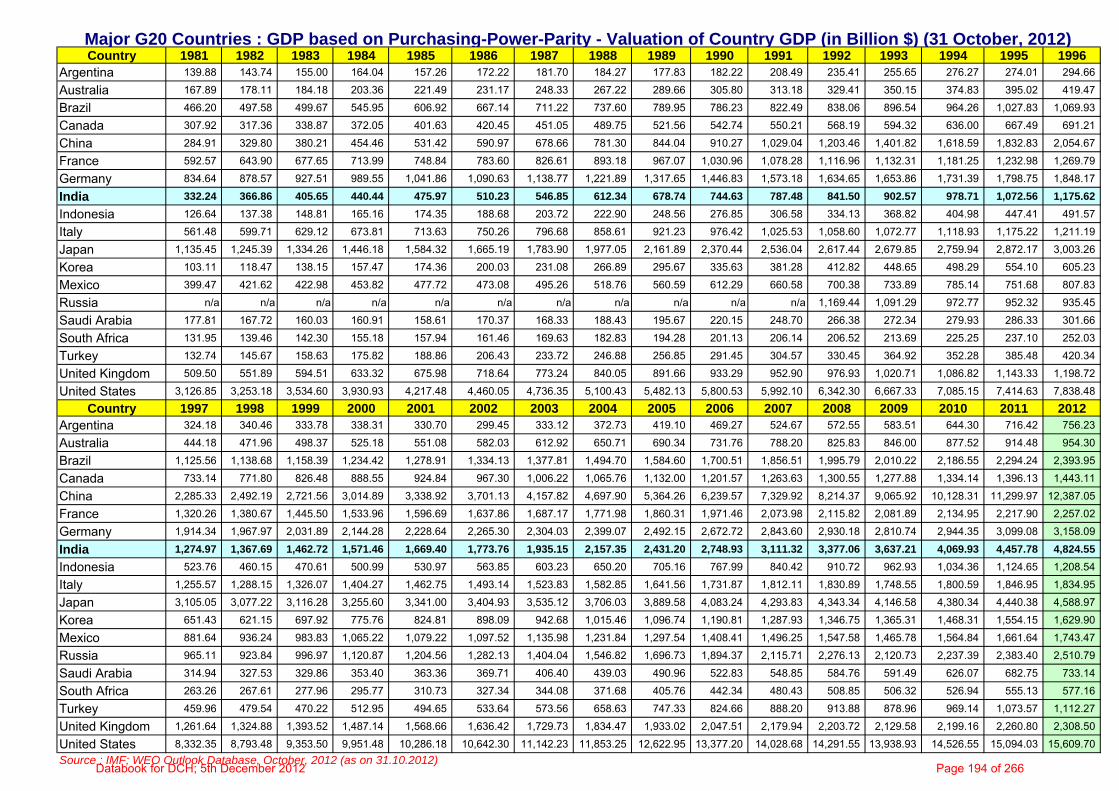
Source : IMF; WEO Outlook Database, October, 2012 (as on 31.10.2012)
Major G20 Countries : GDP based on Purchasing-Power-Parity - Valuation of Country GDP (in Billion $) (31 October, 2012)Country
Argentina1981
139.881982
143.741983
155.001984
164.041985
157.261986
172.221987
181.701988
184.271989
177.831990
182.221991
208.491992
235.411993
255.651994
276.271995
274.011996
294.66
Australia 167.89 178.11 184.18 203.36 221.49 231.17 248.33 267.22 289.66 305.80 313.18 329.41 350.15 374.83 395.02 419.47
Brazil 466.20 497.58 499.67 545.95 606.92 667.14 711.22 737.60 789.95 786.23 822.49 838.06 896.54 964.26 1,027.83 1,069.93
Canada 307.92 317.36 338.87 372.05 401.63 420.45 451.05 489.75 521.56 542.74 550.21 568.19 594.32 636.00 667.49 691.21284.91 329.80 380.21 454.46 531.42 590.97 678.66 781.30 844.04 910.27 1,029.04 1,203.46 1,401.82 1,618.59 1,832.83 2,054.67China
France 592.57 643.90 677.65 713.99 748.84 783.60 826.61 893.18 967.07 1,030.96 1,078.28 1,116.96 1,132.31 1,181.25 1,232.98 1,269.79
Germany 834.64 878.57 927.51 989.55 1,041.86 1,090.63 1,138.77 1,221.89 1,317.65 1,446.83 1,573.18 1,634.65 1,653.86 1,731.39 1,798.75 1,848.17
India 332.24 366.86 405.65 440.44 475.97 510.23 546.85 612.34 678.74 744.63 787.48 841.50 902.57 978.71 1,072.56 1,175.62
Indonesia 126.64 137.38 148.81 165.16 174.35 188.68 203.72 222.90 248.56 276.85 306.58 334.13 368.82 404.98 447.41 491.57
Italy 561.48 599.71 629.12 673.81 713.63 750.26 796.68 858.61 921.23 976.42 1,025.53 1,058.60 1,072.77 1,118.93 1,175.22 1,211.19
Japan 1,135.45 1,245.39 1,334.26 1,446.18 1,584.32 1,665.19 1,783.90 1,977.05 2,161.89 2,370.44 2,536.04 2,617.44 2,679.85 2,759.94 2,872.17 3,003.26
Korea 103.11 118.47 138.15 157.47 174.36 200.03 231.08 266.89 295.67 335.63 381.28 412.82 448.65 498.29 554.10 605.23
Mexico 399.47 421.62 422.98 453.82 477.72 473.08 495.26 518.76 560.59 612.29 660.58 700.38 733.89 785.14 751.68 807.83
Russia n/a n/a n/a n/a n/a n/a n/a n/a n/a n/a n/a 1,169.44 1,091.29 972.77 952.32 935.45
Saudi Arabia 177.81 167.72 160.03 160.91 158.61 170.37 168.33 188.43 195.67 220.15 248.70 266.38 272.34 279.93 286.33 301.66
South Africa 131.95 139.46 142.30 155.18 157.94 161.46 169.63 182.83 194.28 201.13 206.14 206.52 213.69 225.25 237.10 252.03
Turkey 132.74 145.67 158.63 175.82 188.86 206.43 233.72 246.88 256.85 291.45 304.57 330.45 364.92 352.28 385.48 420.34
United Kingdom 509.50 551.89 594.51 633.32 675.98 718.64 773.24 840.05 891.66 933.29 952.90 976.93 1,020.71 1,086.82 1,143.33 1,198.72
United States 3,126.85 3,253.18 3,534.60 3,930.93 4,217.48 4,460.05 4,736.35 5,100.43 5,482.13 5,800.53 5,992.10 6,342.30 6,667.33 7,085.15 7,414.63 7,838.48
Country 1997 1998 1999 2000 2001 2002 2003 2004 2005 2006 2007 2008 2009 2010 2011 2012
Argentina 324.18 340.46 333.78 338.31 330.70 299.45 333.12 372.73 419.10 469.27 524.67 572.55 583.51 644.30 716.42 756.23
Australia 444.18 471.96 498.37 525.18 551.08 582.03 612.92 650.71 690.34 731.76 788.20 825.83 846.00 877.52 914.48 954.30
Brazil 1,125.56 1,138.68 1,158.39 1,234.42 1,278.91 1,334.13 1,377.81 1,494.70 1,584.60 1,700.51 1,856.51 1,995.79 2,010.22 2,186.55 2,294.24 2,393.95
Canada 733.14 771.80 826.48 888.55 924.84 967.30 1,006.22 1,065.76 1,132.00 1,201.57 1,263.63 1,300.55 1,277.88 1,334.14 1,396.13 1,443.11
China 2,285.33 2,492.19 2,721.56 3,014.89 3,338.92 3,701.13 4,157.82 4,697.90 5,364.26 6,239.57 7,329.92 8,214.37 9,065.92 10,128.31 11,299.97 12,387.05
France 1,320.26 1,380.67 1,445.50 1,533.96 1,596.69 1,637.86 1,687.17 1,771.98 1,860.31 1,971.46 2,073.98 2,115.82 2,081.89 2,134.95 2,217.90 2,257.02
Germany 1,914.34 1,967.97 2,031.89 2,144.28 2,228.64 2,265.30 2,304.03 2,399.07 2,492.15 2,672.72 2,843.60 2,930.18 2,810.74 2,944.35 3,099.08 3,158.09
India 1,274.97 1,367.69 1,462.72 1,571.46 1,669.40 1,773.76 1,935.15 2,157.35 2,431.20 2,748.93 3,111.32 3,377.06 3,637.21 4,069.93 4,457.78 4,824.55
Indonesia 523.76 460.15 470.61 500.99 530.97 563.85 603.23 650.20 705.16 767.99 840.42 910.72 962.93 1,034.36 1,124.65 1,208.54
Italy 1,255.57 1,288.15 1,326.07 1,404.27 1,462.75 1,493.14 1,523.83 1,582.85 1,641.56 1,731.87 1,812.11 1,830.89 1,748.55 1,800.59 1,846.95 1,834.95
Japan 3,105.05 3,077.22 3,116.28 3,255.60 3,341.00 3,404.93 3,535.12 3,706.03 3,889.58 4,083.24 4,293.83 4,343.34 4,146.58 4,380.34 4,440.38 4,588.97
Korea 651.43 621.15 697.92 775.76 824.81 898.09 942.68 1,015.46 1,096.74 1,190.81 1,287.93 1,346.75 1,365.31 1,468.31 1,554.15 1,629.90
Mexico 881.64 936.24 983.83 1,065.22 1,079.22 1,097.52 1,135.98 1,231.84 1,297.54 1,408.41 1,496.25 1,547.58 1,465.78 1,564.84 1,661.64 1,743.47
Russia 965.11 923.84 996.97 1,120.87 1,204.56 1,282.13 1,404.04 1,546.82 1,696.73 1,894.37 2,115.71 2,276.13 2,120.73 2,237.39 2,383.40 2,510.79
Saudi Arabia 314.94 327.53 329.86 353.40 363.36 369.71 406.40 439.03 490.96 522.83 548.85 584.76 591.49 626.07 682.75 733.14
South Africa 263.26 267.61 277.96 295.77 310.73 327.34 344.08 371.68 405.76 442.34 480.43 508.85 506.32 526.94 555.13 577.16
Turkey 459.96 479.54 470.22 512.95 494.65 533.64 573.56 658.63 747.33 824.66 888.20 913.88 878.96 969.14 1,073.57 1,112.27
United Kingdom 1,261.64 1,324.88 1,393.52 1,487.14 1,568.66 1,636.42 1,729.73 1,834.47 1,933.02 2,047.51 2,179.94 2,203.72 2,129.58 2,199.16 2,260.80 2,308.50
United States 8,332.35 8,793.48 9,353.50 9,951.48 10,286.18 10,642.30 11,142.23 11,853.25 12,622.95 13,377.20 14,028.68 14,291.55 13,938.93 14,526.55 15,094.03 15,609.70
Databook for DCH; 5th December 2012 Page 194 of 266
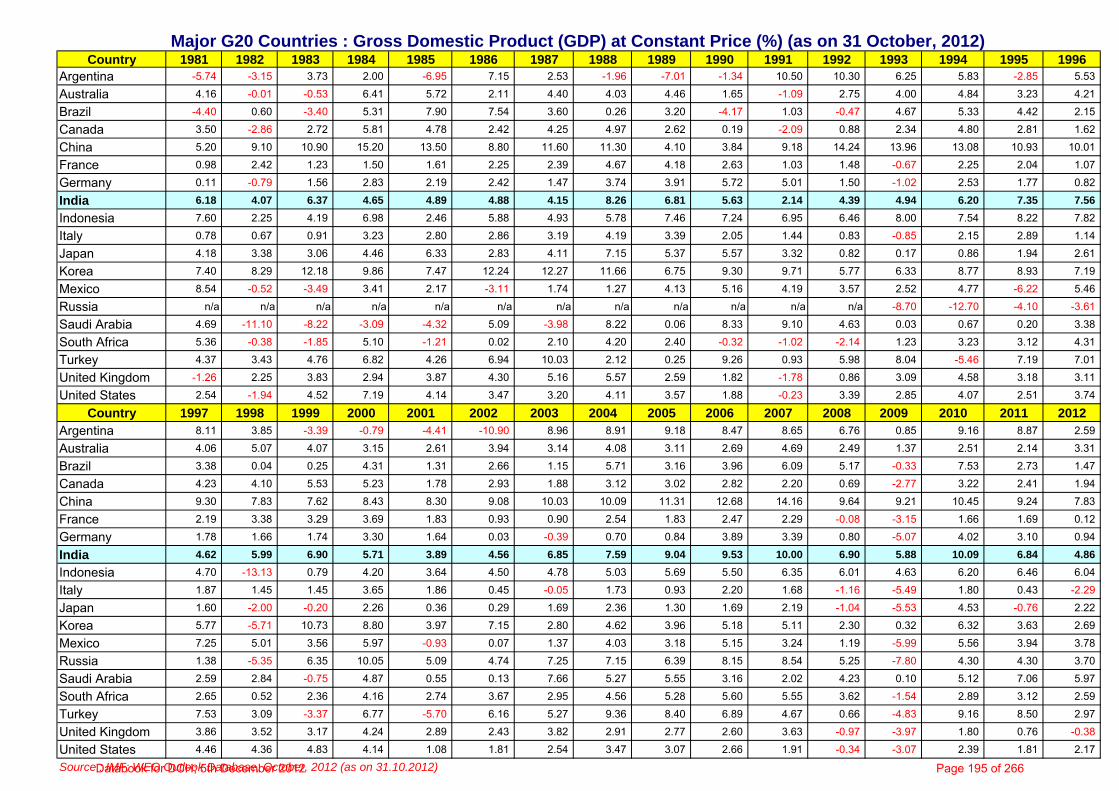
Source : IMF; WEO Outlook Database, October, 2012 (as on 31.10.2012)
Major G20 Countries : Gross Domestic Product (GDP) at Constant Price (%) (as on 31 October, 2012)Country 1981 1982 1983 1984 1985 1986 1987 1988 1989 1990 1991 1992 1993 1994 1995 1996
Argentina -5.74 -3.15 3.73 2.00 -6.95 7.15 2.53 -1.96 -7.01 -1.34 10.50 10.30 6.25 5.83 -2.85 5.53
Australia 4.16 -0.01 -0.53 6.41 5.72 2.11 4.40 4.03 4.46 1.65 -1.09 2.75 4.00 4.84 3.23 4.21
Brazil -4.40 0.60 -3.40 5.31 7.90 7.54 3.60 0.26 3.20 -4.17 1.03 -0.47 4.67 5.33 4.42 2.15
Canada 3.50 -2.86 2.72 5.81 4.78 2.42 4.25 4.97 2.62 0.19 -2.09 0.88 2.34 4.80 2.81 1.62
China 5.20 9.10 10.90 15.20 13.50 8.80 11.60 11.30 4.10 3.84 9.18 14.24 13.96 13.08 10.93 10.01
France 0.98 2.42 1.23 1.50 1.61 2.25 2.39 4.67 4.18 2.63 1.03 1.48 -0.67 2.25 2.04 1.07
Germany 0.11 -0.79 1.56 2.83 2.19 2.42 1.47 3.74 3.91 5.72 5.01 1.50 -1.02 2.53 1.77 0.82
India 6.18 4.07 6.37 4.65 4.89 4.88 4.15 8.26 6.81 5.63 2.14 4.39 4.94 6.20 7.35 7.56
Indonesia 7.60 2.25 4.19 6.98 2.46 5.88 4.93 5.78 7.46 7.24 6.95 6.46 8.00 7.54 8.22 7.82
Italy 0.78 0.67 0.91 3.23 2.80 2.86 3.19 4.19 3.39 2.05 1.44 0.83 -0.85 2.15 2.89 1.14
Japan 4.18 3.38 3.06 4.46 6.33 2.83 4.11 7.15 5.37 5.57 3.32 0.82 0.17 0.86 1.94 2.61
Korea 7.40 8.29 12.18 9.86 7.47 12.24 12.27 11.66 6.75 9.30 9.71 5.77 6.33 8.77 8.93 7.19
Mexico 8.54 -0.52 -3.49 3.41 2.17 -3.11 1.74 1.27 4.13 5.16 4.19 3.57 2.52 4.77 -6.22 5.46
Russia n/a n/a n/a n/a n/a n/a n/a n/a n/a n/a n/a n/a -8.70 -12.70 -4.10 -3.61
Saudi Arabia 4.69 -11.10 -8.22 -3.09 -4.32 5.09 -3.98 8.22 0.06 8.33 9.10 4.63 0.03 0.67 0.20 3.38
South Africa 5.36 -0.38 -1.85 5.10 -1.21 0.02 2.10 4.20 2.40 -0.32 -1.02 -2.14 1.23 3.23 3.12 4.31
Turkey 4.37 3.43 4.76 6.82 4.26 6.94 10.03 2.12 0.25 9.26 0.93 5.98 8.04 -5.46 7.19 7.01
United Kingdom -1.26 2.25 3.83 2.94 3.87 4.30 5.16 5.57 2.59 1.82 -1.78 0.86 3.09 4.58 3.18 3.11
United States 2.54 -1.94 4.52 7.19 4.14 3.47 3.20 4.11 3.57 1.88 -0.23 3.39 2.85 4.07 2.51 3.74
Country 1997 1998 1999 2000 2001 2002 2003 2004 2005 2006 2007 2008 2009 2010 2011 2012
Argentina 8.11 3.85 -3.39 -0.79 -4.41 -10.90 8.96 8.91 9.18 8.47 8.65 6.76 0.85 9.16 8.87 2.59
Australia 4.06 5.07 4.07 3.15 2.61 3.94 3.14 4.08 3.11 2.69 4.69 2.49 1.37 2.51 2.14 3.31
Brazil 3.38 0.04 0.25 4.31 1.31 2.66 1.15 5.71 3.16 3.96 6.09 5.17 -0.33 7.53 2.73 1.47
Canada 4.23 4.10 5.53 5.23 1.78 2.93 1.88 3.12 3.02 2.82 2.20 0.69 -2.77 3.22 2.41 1.94
China 9.30 7.83 7.62 8.43 8.30 9.08 10.03 10.09 11.31 12.68 14.16 9.64 9.21 10.45 9.24 7.83
France 2.19 3.38 3.29 3.69 1.83 0.93 0.90 2.54 1.83 2.47 2.29 -0.08 -3.15 1.66 1.69 0.12
Germany 1.78 1.66 1.74 3.30 1.64 0.03 -0.39 0.70 0.84 3.89 3.39 0.80 -5.07 4.02 3.10 0.94
India 4.62 5.99 6.90 5.71 3.89 4.56 6.85 7.59 9.04 9.53 10.00 6.90 5.88 10.09 6.84 4.86
Indonesia 4.70 -13.13 0.79 4.20 3.64 4.50 4.78 5.03 5.69 5.50 6.35 6.01 4.63 6.20 6.46 6.04
Italy 1.87 1.45 1.45 3.65 1.86 0.45 -0.05 1.73 0.93 2.20 1.68 -1.16 -5.49 1.80 0.43 -2.29
Japan 1.60 -2.00 -0.20 2.26 0.36 0.29 1.69 2.36 1.30 1.69 2.19 -1.04 -5.53 4.53 -0.76 2.22
Korea 5.77 -5.71 10.73 8.80 3.97 7.15 2.80 4.62 3.96 5.18 5.11 2.30 0.32 6.32 3.63 2.69
Mexico 7.25 5.01 3.56 5.97 -0.93 0.07 1.37 4.03 3.18 5.15 3.24 1.19 -5.99 5.56 3.94 3.78
Russia 1.38 -5.35 6.35 10.05 5.09 4.74 7.25 7.15 6.39 8.15 8.54 5.25 -7.80 4.30 4.30 3.70
Saudi Arabia 2.59 2.84 -0.75 4.87 0.55 0.13 7.66 5.27 5.55 3.16 2.02 4.23 0.10 5.12 7.06 5.97
South Africa 2.65 0.52 2.36 4.16 2.74 3.67 2.95 4.56 5.28 5.60 5.55 3.62 -1.54 2.89 3.12 2.59
Turkey 7.53 3.09 -3.37 6.77 -5.70 6.16 5.27 9.36 8.40 6.89 4.67 0.66 -4.83 9.16 8.50 2.97
United Kingdom 3.86 3.52 3.17 4.24 2.89 2.43 3.82 2.91 2.77 2.60 3.63 -0.97 -3.97 1.80 0.76 -0.38
United States 4.46 4.36 4.83 4.14 1.08 1.81 2.54 3.47 3.07 2.66 1.91 -0.34 -3.07 2.39 1.81 2.17
Databook for DCH; 5th December 2012 Page 195 of 266
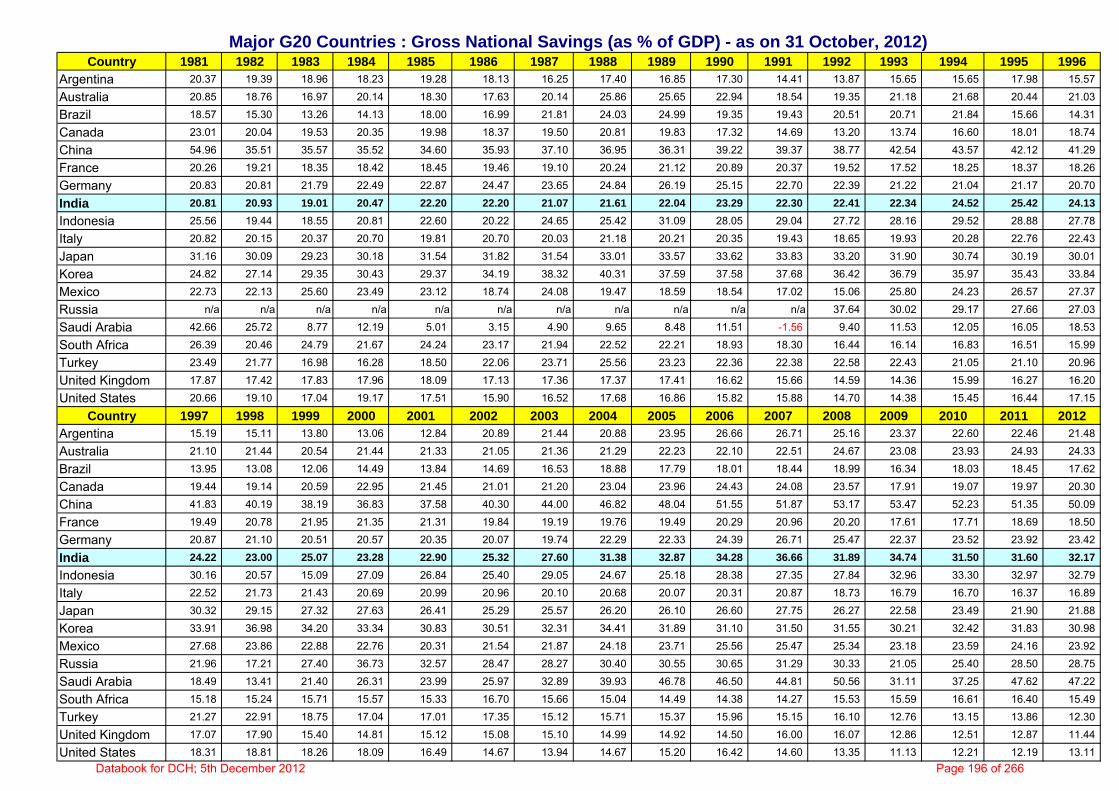
Major G20 Countries : Gross National Savings (as % of GDP) - as on 31 October, 2012)Country 1981 1982 1983 1984 1985 1986 1987 1988 1989 1990 1991 1992 1993 1994 1995 1996
Argentina 20.37 19.39 18.96 18.23 19.28 18.13 16.25 17.40 16.85 17.30 14.41 13.87 15.65 15.65 17.98 15.57
Australia 20.85 18.76 16.97 20.14 18.30 17.63 20.14 25.86 25.65 22.94 18.54 19.35 21.18 21.68 20.44 21.03
Brazil 18.57 15.30 13.26 14.13 18.00 16.99 21.81 24.03 24.99 19.35 19.43 20.51 20.71 21.84 15.66 14.31
Canada 23.01 20.04 19.53 20.35 19.98 18.37 19.50 20.81 19.83 17.32 14.69 13.20 13.74 16.60 18.01 18.74
China 54.96 35.51 35.57 35.52 34.60 35.93 37.10 36.95 36.31 39.22 39.37 38.77 42.54 43.57 42.12 41.29
France 20.26 19.21 18.35 18.42 18.45 19.46 19.10 20.24 21.12 20.89 20.37 19.52 17.52 18.25 18.37 18.26
Germany 20.83 20.81 21.79 22.49 22.87 24.47 23.65 24.84 26.19 25.15 22.70 22.39 21.22 21.04 21.17 20.70
India 20.81 20.93 19.01 20.47 22.20 22.20 21.07 21.61 22.04 23.29 22.30 22.41 22.34 24.52 25.42 24.13
Indonesia 25.56 19.44 18.55 20.81 22.60 20.22 24.65 25.42 31.09 28.05 29.04 27.72 28.16 29.52 28.88 27.78
Italy 20.82 20.15 20.37 20.70 19.81 20.70 20.03 21.18 20.21 20.35 19.43 18.65 19.93 20.28 22.76 22.43
Japan 31.16 30.09 29.23 30.18 31.54 31.82 31.54 33.01 33.57 33.62 33.83 33.20 31.90 30.74 30.19 30.01
Korea 24.82 27.14 29.35 30.43 29.37 34.19 38.32 40.31 37.59 37.58 37.68 36.42 36.79 35.97 35.43 33.84
Mexico 22.73 22.13 25.60 23.49 23.12 18.74 24.08 19.47 18.59 18.54 17.02 15.06 25.80 24.23 26.57 27.37
Russia n/a n/a n/a n/a n/a n/a n/a n/a n/a n/a n/a 37.64 30.02 29.17 27.66 27.03
Saudi Arabia 42.66 25.72 8.77 12.19 5.01 3.15 4.90 9.65 8.48 11.51 -1.56 9.40 11.53 12.05 16.05 18.53
South Africa 26.39 20.46 24.79 21.67 24.24 23.17 21.94 22.52 22.21 18.93 18.30 16.44 16.14 16.83 16.51 15.99
Turkey 23.49 21.77 16.98 16.28 18.50 22.06 23.71 25.56 23.23 22.36 22.38 22.58 22.43 21.05 21.10 20.96
United Kingdom 17.87 17.42 17.83 17.96 18.09 17.13 17.36 17.37 17.41 16.62 15.66 14.59 14.36 15.99 16.27 16.20
United States 20.66 19.10 17.04 19.17 17.51 15.90 16.52 17.68 16.86 15.82 15.88 14.70 14.38 15.45 16.44 17.15
Country 1997 1998 1999 2000 2001 2002 2003 2004 2005 2006 2007 2008 2009 2010 2011 2012
Argentina 15.19 15.11 13.80 13.06 12.84 20.89 21.44 20.88 23.95 26.66 26.71 25.16 23.37 22.60 22.46 21.48
Australia 21.10 21.44 20.54 21.44 21.33 21.05 21.36 21.29 22.23 22.10 22.51 24.67 23.08 23.93 24.93 24.33
Brazil 13.95 13.08 12.06 14.49 13.84 14.69 16.53 18.88 17.79 18.01 18.44 18.99 16.34 18.03 18.45 17.62
Canada 19.44 19.14 20.59 22.95 21.45 21.01 21.20 23.04 23.96 24.43 24.08 23.57 17.91 19.07 19.97 20.30
China 41.83 40.19 38.19 36.83 37.58 40.30 44.00 46.82 48.04 51.55 51.87 53.17 53.47 52.23 51.35 50.09
France 19.49 20.78 21.95 21.35 21.31 19.84 19.19 19.76 19.49 20.29 20.96 20.20 17.61 17.71 18.69 18.50
Germany 20.87 21.10 20.51 20.57 20.35 20.07 19.74 22.29 22.33 24.39 26.71 25.47 22.37 23.52 23.92 23.42
India 24.22 23.00 25.07 23.28 22.90 25.32 27.60 31.38 32.87 34.28 36.66 31.89 34.74 31.50 31.60 32.17
Indonesia 30.16 20.57 15.09 27.09 26.84 25.40 29.05 24.67 25.18 28.38 27.35 27.84 32.96 33.30 32.97 32.79
Italy 22.52 21.73 21.43 20.69 20.99 20.96 20.10 20.68 20.07 20.31 20.87 18.73 16.79 16.70 16.37 16.89
Japan 30.32 29.15 27.32 27.63 26.41 25.29 25.57 26.20 26.10 26.60 27.75 26.27 22.58 23.49 21.90 21.88
Korea 33.91 36.98 34.20 33.34 30.83 30.51 32.31 34.41 31.89 31.10 31.50 31.55 30.21 32.42 31.83 30.98
Mexico 27.68 23.86 22.88 22.76 20.31 21.54 21.87 24.18 23.71 25.56 25.47 25.34 23.18 23.59 24.16 23.92
Russia 21.96 17.21 27.40 36.73 32.57 28.47 28.27 30.40 30.55 30.65 31.29 30.33 21.05 25.40 28.50 28.75
Saudi Arabia 18.49 13.41 21.40 26.31 23.99 25.97 32.89 39.93 46.78 46.50 44.81 50.56 31.11 37.25 47.62 47.22
South Africa 15.18 15.24 15.71 15.57 15.33 16.70 15.66 15.04 14.49 14.38 14.27 15.53 15.59 16.61 16.40 15.49
Turkey 21.27 22.91 18.75 17.04 17.01 17.35 15.12 15.71 15.37 15.96 15.15 16.10 12.76 13.15 13.86 12.30
United Kingdom 17.07 17.90 15.40 14.81 15.12 15.08 15.10 14.99 14.92 14.50 16.00 16.07 12.86 12.51 12.87 11.44
United States 18.31 18.81 18.26 18.09 16.49 14.67 13.94 14.67 15.20 16.42 14.60 13.35 11.13 12.21 12.19 13.11Databook for DCH; 5th December 2012 Page 196 of 266
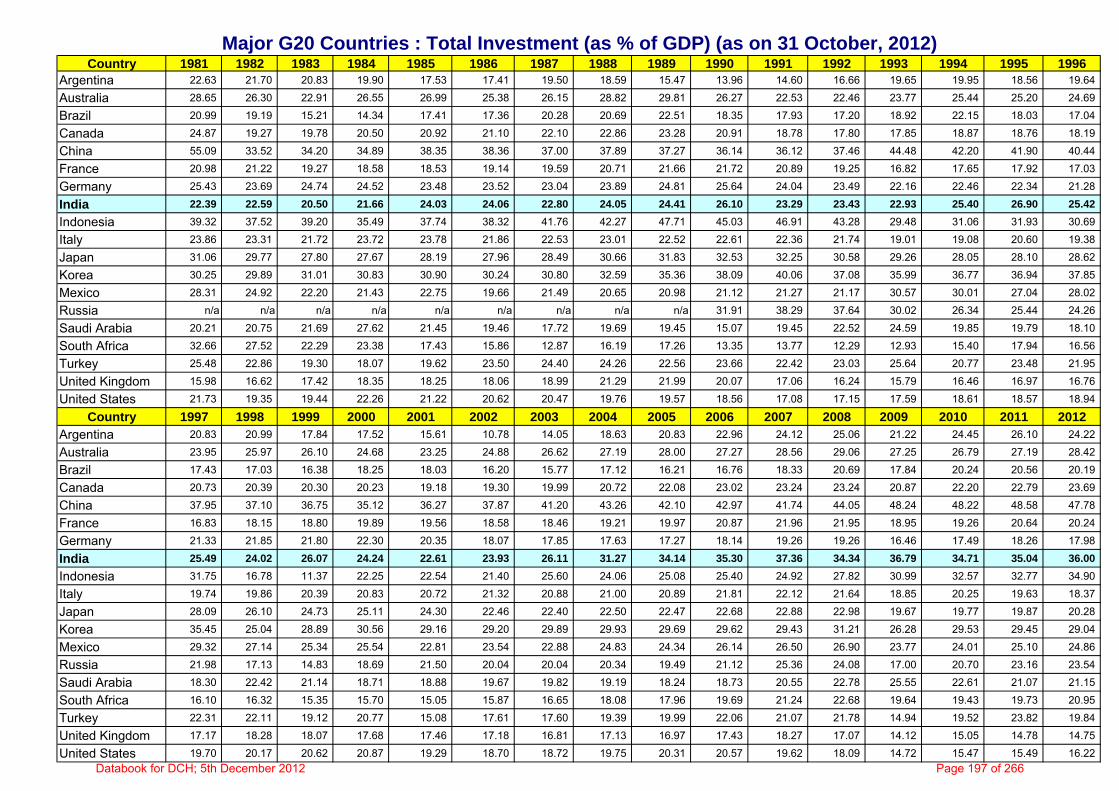
Major G20 Countries : Total Investment (as % of GDP) (as on 31 October, 2012)Country 1981 1982 1983 1984 1985 1986 1987 1988 1989 1990 1991 1992 1993 1994 1995 1996
Argentina 22.63 21.70 20.83 19.90 17.53 17.41 19.50 18.59 15.47 13.96 14.60 16.66 19.65 19.95 18.56 19.64
Australia 28.65 26.30 22.91 26.55 26.99 25.38 26.15 28.82 29.81 26.27 22.53 22.46 23.77 25.44 25.20 24.69
Brazil 20.99 19.19 15.21 14.34 17.41 17.36 20.28 20.69 22.51 18.35 17.93 17.20 18.92 22.15 18.03 17.04
Canada 24.87 19.27 19.78 20.50 20.92 21.10 22.10 22.86 23.28 20.91 18.78 17.80 17.85 18.87 18.76 18.19
China 55.09 33.52 34.20 34.89 38.35 38.36 37.00 37.89 37.27 36.14 36.12 37.46 44.48 42.20 41.90 40.44
France 20.98 21.22 19.27 18.58 18.53 19.14 19.59 20.71 21.66 21.72 20.89 19.25 16.82 17.65 17.92 17.03
Germany 25.43 23.69 24.74 24.52 23.48 23.52 23.04 23.89 24.81 25.64 24.04 23.49 22.16 22.46 22.34 21.28
India 22.39 22.59 20.50 21.66 24.03 24.06 22.80 24.05 24.41 26.10 23.29 23.43 22.93 25.40 26.90 25.42
Indonesia 39.32 37.52 39.20 35.49 37.74 38.32 41.76 42.27 47.71 45.03 46.91 43.28 29.48 31.06 31.93 30.69
Italy 23.86 23.31 21.72 23.72 23.78 21.86 22.53 23.01 22.52 22.61 22.36 21.74 19.01 19.08 20.60 19.38
Japan 31.06 29.77 27.80 27.67 28.19 27.96 28.49 30.66 31.83 32.53 32.25 30.58 29.26 28.05 28.10 28.62
Korea 30.25 29.89 31.01 30.83 30.90 30.24 30.80 32.59 35.36 38.09 40.06 37.08 35.99 36.77 36.94 37.85
Mexico 28.31 24.92 22.20 21.43 22.75 19.66 21.49 20.65 20.98 21.12 21.27 21.17 30.57 30.01 27.04 28.02
Russia n/a n/a n/a n/a n/a n/a n/a n/a n/a 31.91 38.29 37.64 30.02 26.34 25.44 24.26
Saudi Arabia 20.21 20.75 21.69 27.62 21.45 19.46 17.72 19.69 19.45 15.07 19.45 22.52 24.59 19.85 19.79 18.10
South Africa 32.66 27.52 22.29 23.38 17.43 15.86 12.87 16.19 17.26 13.35 13.77 12.29 12.93 15.40 17.94 16.56
Turkey 25.48 22.86 19.30 18.07 19.62 23.50 24.40 24.26 22.56 23.66 22.42 23.03 25.64 20.77 23.48 21.95
United Kingdom 15.98 16.62 17.42 18.35 18.25 18.06 18.99 21.29 21.99 20.07 17.06 16.24 15.79 16.46 16.97 16.76
United States 21.73 19.35 19.44 22.26 21.22 20.62 20.47 19.76 19.57 18.56 17.08 17.15 17.59 18.61 18.57 18.94
Country 1997 1998 1999 2000 2001 2002 2003 2004 2005 2006 2007 2008 2009 2010 2011 2012
Argentina 20.83 20.99 17.84 17.52 15.61 10.78 14.05 18.63 20.83 22.96 24.12 25.06 21.22 24.45 26.10 24.22
Australia 23.95 25.97 26.10 24.68 23.25 24.88 26.62 27.19 28.00 27.27 28.56 29.06 27.25 26.79 27.19 28.42
Brazil 17.43 17.03 16.38 18.25 18.03 16.20 15.77 17.12 16.21 16.76 18.33 20.69 17.84 20.24 20.56 20.19
Canada 20.73 20.39 20.30 20.23 19.18 19.30 19.99 20.72 22.08 23.02 23.24 23.24 20.87 22.20 22.79 23.69
China 37.95 37.10 36.75 35.12 36.27 37.87 41.20 43.26 42.10 42.97 41.74 44.05 48.24 48.22 48.58 47.78
France 16.83 18.15 18.80 19.89 19.56 18.58 18.46 19.21 19.97 20.87 21.96 21.95 18.95 19.26 20.64 20.24
Germany 21.33 21.85 21.80 22.30 20.35 18.07 17.85 17.63 17.27 18.14 19.26 19.26 16.46 17.49 18.26 17.98
India 25.49 24.02 26.07 24.24 22.61 23.93 26.11 31.27 34.14 35.30 37.36 34.34 36.79 34.71 35.04 36.00
Indonesia 31.75 16.78 11.37 22.25 22.54 21.40 25.60 24.06 25.08 25.40 24.92 27.82 30.99 32.57 32.77 34.90
Italy 19.74 19.86 20.39 20.83 20.72 21.32 20.88 21.00 20.89 21.81 22.12 21.64 18.85 20.25 19.63 18.37
Japan 28.09 26.10 24.73 25.11 24.30 22.46 22.40 22.50 22.47 22.68 22.88 22.98 19.67 19.77 19.87 20.28
Korea 35.45 25.04 28.89 30.56 29.16 29.20 29.89 29.93 29.69 29.62 29.43 31.21 26.28 29.53 29.45 29.04
Mexico 29.32 27.14 25.34 25.54 22.81 23.54 22.88 24.83 24.34 26.14 26.50 26.90 23.77 24.01 25.10 24.86
Russia 21.98 17.13 14.83 18.69 21.50 20.04 20.04 20.34 19.49 21.12 25.36 24.08 17.00 20.70 23.16 23.54
Saudi Arabia 18.30 22.42 21.14 18.71 18.88 19.67 19.82 19.19 18.24 18.73 20.55 22.78 25.55 22.61 21.07 21.15
South Africa 16.10 16.32 15.35 15.70 15.05 15.87 16.65 18.08 17.96 19.69 21.24 22.68 19.64 19.43 19.73 20.95
Turkey 22.31 22.11 19.12 20.77 15.08 17.61 17.60 19.39 19.99 22.06 21.07 21.78 14.94 19.52 23.82 19.84
United Kingdom 17.17 18.28 18.07 17.68 17.46 17.18 16.81 17.13 16.97 17.43 18.27 17.07 14.12 15.05 14.78 14.75
United States 19.70 20.17 20.62 20.87 19.29 18.70 18.72 19.75 20.31 20.57 19.62 18.09 14.72 15.47 15.49 16.22Databook for DCH; 5th December 2012 Page 197 of 266
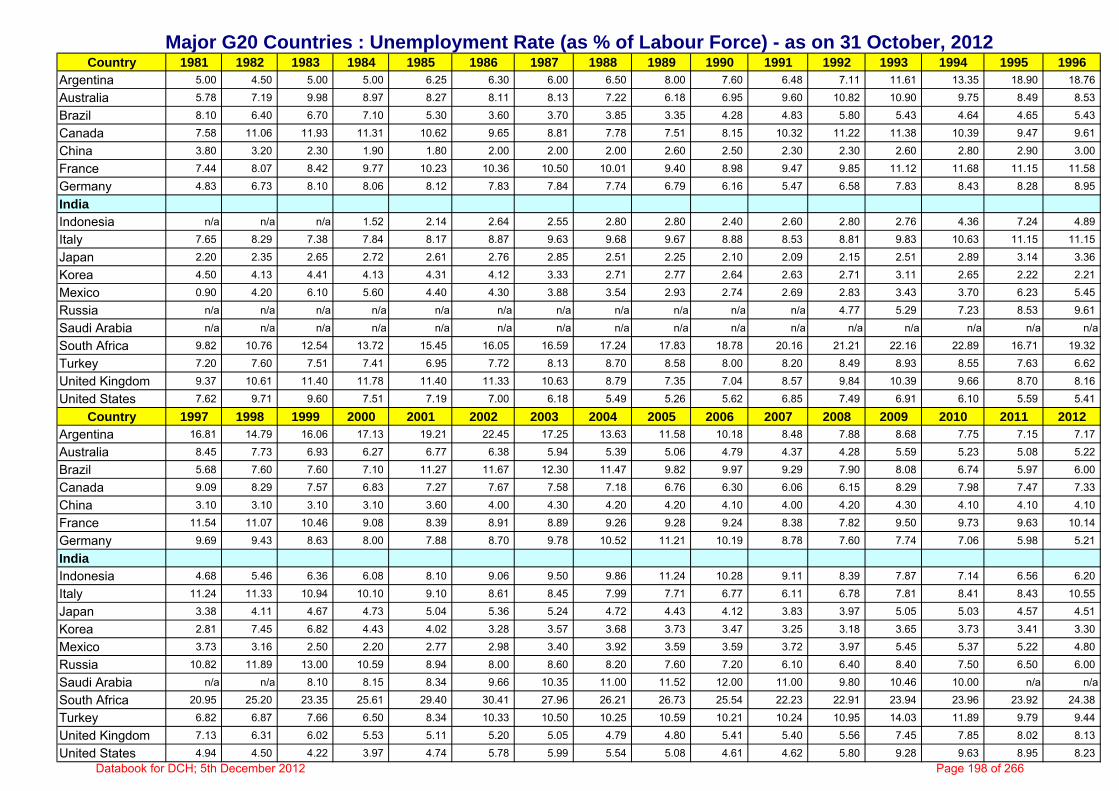
Major G20 Countries : Unemployment Rate (as % of Labour Force) - as on 31 October, 2012Country 1981 1982 1983 1984 1985 1986 1987 1988 1989 1990 1991 1992 1993 1994 1995 1996
Argentina 5.00 4.50 5.00 5.00 6.25 6.30 6.00 6.50 8.00 7.60 6.48 7.11 11.61 13.35 18.90 18.76
Australia 5.78 7.19 9.98 8.97 8.27 8.11 8.13 7.22 6.18 6.95 9.60 10.82 10.90 9.75 8.49 8.53
Brazil 8.10 6.40 6.70 7.10 5.30 3.60 3.70 3.85 3.35 4.28 4.83 5.80 5.43 4.64 4.65 5.43
Canada 7.58 11.06 11.93 11.31 10.62 9.65 8.81 7.78 7.51 8.15 10.32 11.22 11.38 10.39 9.47 9.61
China 3.80 3.20 2.30 1.90 1.80 2.00 2.00 2.00 2.60 2.50 2.30 2.30 2.60 2.80 2.90 3.00
France 7.44 8.07 8.42 9.77 10.23 10.36 10.50 10.01 9.40 8.98 9.47 9.85 11.12 11.68 11.15 11.58
Germany 4.83 6.73 8.10 8.06 8.12 7.83 7.84 7.74 6.79 6.16 5.47 6.58 7.83 8.43 8.28 8.95
India
Indonesia n/a n/a n/a 1.52 2.14 2.64 2.55 2.80 2.80 2.40 2.60 2.80 2.76 4.36 7.24 4.89
Italy 7.65 8.29 7.38 7.84 8.17 8.87 9.63 9.68 9.67 8.88 8.53 8.81 9.83 10.63 11.15 11.15
Japan 2.20 2.35 2.65 2.72 2.61 2.76 2.85 2.51 2.25 2.10 2.09 2.15 2.51 2.89 3.14 3.36
Korea 4.50 4.13 4.41 4.13 4.31 4.12 3.33 2.71 2.77 2.64 2.63 2.71 3.11 2.65 2.22 2.21
Mexico 0.90 4.20 6.10 5.60 4.40 4.30 3.88 3.54 2.93 2.74 2.69 2.83 3.43 3.70 6.23 5.45
Russia n/a n/a n/a n/a n/a n/a n/a n/a n/a n/a n/a 4.77 5.29 7.23 8.53 9.61
Saudi Arabia n/a n/a n/a n/a n/a n/a n/a n/a n/a n/a n/a n/a n/a n/a n/a n/a
South Africa 9.82 10.76 12.54 13.72 15.45 16.05 16.59 17.24 17.83 18.78 20.16 21.21 22.16 22.89 16.71 19.32
Turkey 7.20 7.60 7.51 7.41 6.95 7.72 8.13 8.70 8.58 8.00 8.20 8.49 8.93 8.55 7.63 6.62
United Kingdom 9.37 10.61 11.40 11.78 11.40 11.33 10.63 8.79 7.35 7.04 8.57 9.84 10.39 9.66 8.70 8.16
United States 7.62 9.71 9.60 7.51 7.19 7.00 6.18 5.49 5.26 5.62 6.85 7.49 6.91 6.10 5.59 5.41
Country 1997 1998 1999 2000 2001 2002 2003 2004 2005 2006 2007 2008 2009 2010 2011 2012
Argentina 16.81 14.79 16.06 17.13 19.21 22.45 17.25 13.63 11.58 10.18 8.48 7.88 8.68 7.75 7.15 7.17
Australia 8.45 7.73 6.93 6.27 6.77 6.38 5.94 5.39 5.06 4.79 4.37 4.28 5.59 5.23 5.08 5.22
Brazil 5.68 7.60 7.60 7.10 11.27 11.67 12.30 11.47 9.82 9.97 9.29 7.90 8.08 6.74 5.97 6.00
Canada 9.09 8.29 7.57 6.83 7.27 7.67 7.58 7.18 6.76 6.30 6.06 6.15 8.29 7.98 7.47 7.33
China 3.10 3.10 3.10 3.10 3.60 4.00 4.30 4.20 4.20 4.10 4.00 4.20 4.30 4.10 4.10 4.10
France 11.54 11.07 10.46 9.08 8.39 8.91 8.89 9.26 9.28 9.24 8.38 7.82 9.50 9.73 9.63 10.14
Germany 9.69 9.43 8.63 8.00 7.88 8.70 9.78 10.52 11.21 10.19 8.78 7.60 7.74 7.06 5.98 5.21
India
Indonesia 4.68 5.46 6.36 6.08 8.10 9.06 9.50 9.86 11.24 10.28 9.11 8.39 7.87 7.14 6.56 6.20
Italy 11.24 11.33 10.94 10.10 9.10 8.61 8.45 7.99 7.71 6.77 6.11 6.78 7.81 8.41 8.43 10.55
Japan 3.38 4.11 4.67 4.73 5.04 5.36 5.24 4.72 4.43 4.12 3.83 3.97 5.05 5.03 4.57 4.51
Korea 2.81 7.45 6.82 4.43 4.02 3.28 3.57 3.68 3.73 3.47 3.25 3.18 3.65 3.73 3.41 3.30
Mexico 3.73 3.16 2.50 2.20 2.77 2.98 3.40 3.92 3.59 3.59 3.72 3.97 5.45 5.37 5.22 4.80
Russia 10.82 11.89 13.00 10.59 8.94 8.00 8.60 8.20 7.60 7.20 6.10 6.40 8.40 7.50 6.50 6.00
Saudi Arabia n/a n/a 8.10 8.15 8.34 9.66 10.35 11.00 11.52 12.00 11.00 9.80 10.46 10.00 n/a n/a
South Africa 20.95 25.20 23.35 25.61 29.40 30.41 27.96 26.21 26.73 25.54 22.23 22.91 23.94 23.96 23.92 24.38
Turkey 6.82 6.87 7.66 6.50 8.34 10.33 10.50 10.25 10.59 10.21 10.24 10.95 14.03 11.89 9.79 9.44
United Kingdom 7.13 6.31 6.02 5.53 5.11 5.20 5.05 4.79 4.80 5.41 5.40 5.56 7.45 7.85 8.02 8.13
United States 4.94 4.50 4.22 3.97 4.74 5.78 5.99 5.54 5.08 4.61 4.62 5.80 9.28 9.63 8.95 8.23Databook for DCH; 5th December 2012 Page 198 of 266
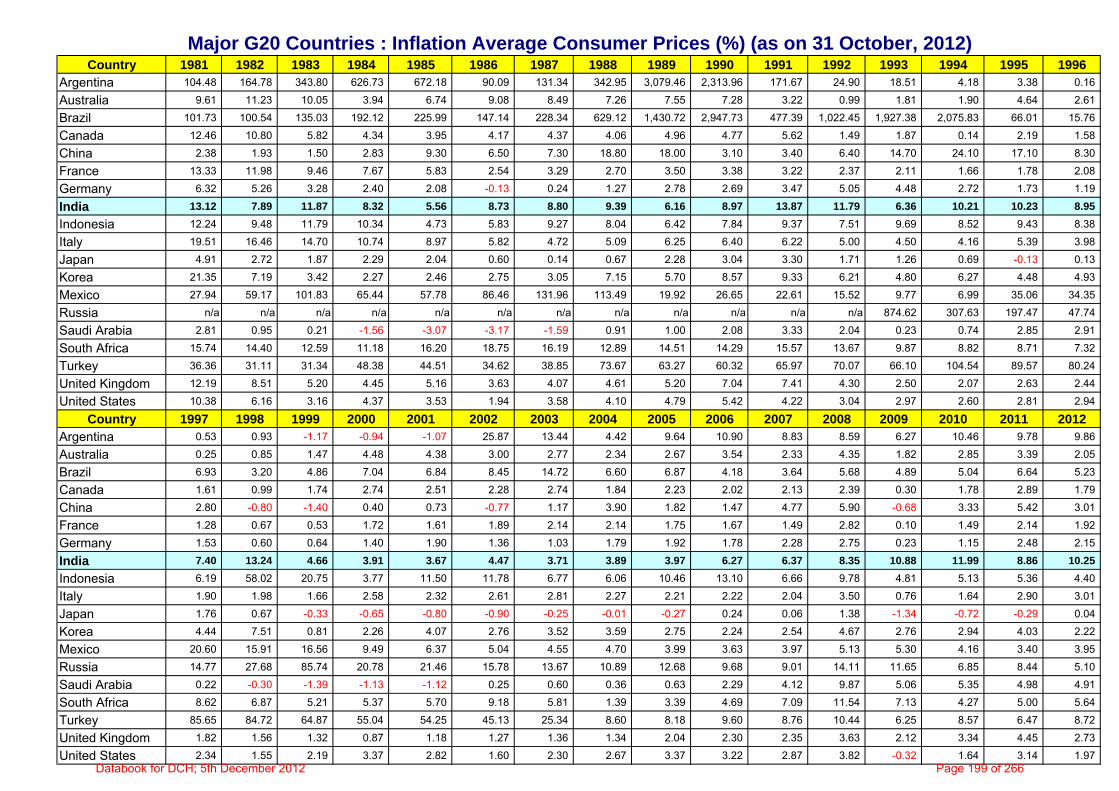
Major G20 Countries : Inflation Average Consumer Prices (%) (as on 31 October, 2012)Country 1981 1982 1983 1984 1985 1986 1987 1988 1989 1990 1991 1992 1993 1994 1995 1996
Argentina 104.48 164.78 343.80 626.73 672.18 90.09 131.34 342.95 3,079.46 2,313.96 171.67 24.90 18.51 4.18 3.38 0.16
Australia 9.61 11.23 10.05 3.94 6.74 9.08 8.49 7.26 7.55 7.28 3.22 0.99 1.81 1.90 4.64 2.61
Brazil 101.73 100.54 135.03 192.12 225.99 147.14 228.34 629.12 1,430.72 2,947.73 477.39 1,022.45 1,927.38 2,075.83 66.01 15.76
Canada 12.46 10.80 5.82 4.34 3.95 4.17 4.37 4.06 4.96 4.77 5.62 1.49 1.87 0.14 2.19 1.58
China 2.38 1.93 1.50 2.83 9.30 6.50 7.30 18.80 18.00 3.10 3.40 6.40 14.70 24.10 17.10 8.30
France 13.33 11.98 9.46 7.67 5.83 2.54 3.29 2.70 3.50 3.38 3.22 2.37 2.11 1.66 1.78 2.08
Germany 6.32 5.26 3.28 2.40 2.08 -0.13 0.24 1.27 2.78 2.69 3.47 5.05 4.48 2.72 1.73 1.19
India 13.12 7.89 11.87 8.32 5.56 8.73 8.80 9.39 6.16 8.97 13.87 11.79 6.36 10.21 10.23 8.95
Indonesia 12.24 9.48 11.79 10.34 4.73 5.83 9.27 8.04 6.42 7.84 9.37 7.51 9.69 8.52 9.43 8.38
Italy 19.51 16.46 14.70 10.74 8.97 5.82 4.72 5.09 6.25 6.40 6.22 5.00 4.50 4.16 5.39 3.98
Japan 4.91 2.72 1.87 2.29 2.04 0.60 0.14 0.67 2.28 3.04 3.30 1.71 1.26 0.69 -0.13 0.13
Korea 21.35 7.19 3.42 2.27 2.46 2.75 3.05 7.15 5.70 8.57 9.33 6.21 4.80 6.27 4.48 4.93
Mexico 27.94 59.17 101.83 65.44 57.78 86.46 131.96 113.49 19.92 26.65 22.61 15.52 9.77 6.99 35.06 34.35
Russia n/a n/a n/a n/a n/a n/a n/a n/a n/a n/a n/a n/a 874.62 307.63 197.47 47.74
Saudi Arabia 2.81 0.95 0.21 -1.56 -3.07 -3.17 -1.59 0.91 1.00 2.08 3.33 2.04 0.23 0.74 2.85 2.91
South Africa 15.74 14.40 12.59 11.18 16.20 18.75 16.19 12.89 14.51 14.29 15.57 13.67 9.87 8.82 8.71 7.32
Turkey 36.36 31.11 31.34 48.38 44.51 34.62 38.85 73.67 63.27 60.32 65.97 70.07 66.10 104.54 89.57 80.24
United Kingdom 12.19 8.51 5.20 4.45 5.16 3.63 4.07 4.61 5.20 7.04 7.41 4.30 2.50 2.07 2.63 2.44
United States 10.38 6.16 3.16 4.37 3.53 1.94 3.58 4.10 4.79 5.42 4.22 3.04 2.97 2.60 2.81 2.94
Country 1997 1998 1999 2000 2001 2002 2003 2004 2005 2006 2007 2008 2009 2010 2011 2012
Argentina 0.53 0.93 -1.17 -0.94 -1.07 25.87 13.44 4.42 9.64 10.90 8.83 8.59 6.27 10.46 9.78 9.86
Australia 0.25 0.85 1.47 4.48 4.38 3.00 2.77 2.34 2.67 3.54 2.33 4.35 1.82 2.85 3.39 2.05
Brazil 6.93 3.20 4.86 7.04 6.84 8.45 14.72 6.60 6.87 4.18 3.64 5.68 4.89 5.04 6.64 5.23
Canada 1.61 0.99 1.74 2.74 2.51 2.28 2.74 1.84 2.23 2.02 2.13 2.39 0.30 1.78 2.89 1.79
China 2.80 -0.80 -1.40 0.40 0.73 -0.77 1.17 3.90 1.82 1.47 4.77 5.90 -0.68 3.33 5.42 3.01
France 1.28 0.67 0.53 1.72 1.61 1.89 2.14 2.14 1.75 1.67 1.49 2.82 0.10 1.49 2.14 1.92
Germany 1.53 0.60 0.64 1.40 1.90 1.36 1.03 1.79 1.92 1.78 2.28 2.75 0.23 1.15 2.48 2.15
India 7.40 13.24 4.66 3.91 3.67 4.47 3.71 3.89 3.97 6.27 6.37 8.35 10.88 11.99 8.86 10.25
Indonesia 6.19 58.02 20.75 3.77 11.50 11.78 6.77 6.06 10.46 13.10 6.66 9.78 4.81 5.13 5.36 4.40
Italy 1.90 1.98 1.66 2.58 2.32 2.61 2.81 2.27 2.21 2.22 2.04 3.50 0.76 1.64 2.90 3.01
Japan 1.76 0.67 -0.33 -0.65 -0.80 -0.90 -0.25 -0.01 -0.27 0.24 0.06 1.38 -1.34 -0.72 -0.29 0.04
Korea 4.44 7.51 0.81 2.26 4.07 2.76 3.52 3.59 2.75 2.24 2.54 4.67 2.76 2.94 4.03 2.22
Mexico 20.60 15.91 16.56 9.49 6.37 5.04 4.55 4.70 3.99 3.63 3.97 5.13 5.30 4.16 3.40 3.95
Russia 14.77 27.68 85.74 20.78 21.46 15.78 13.67 10.89 12.68 9.68 9.01 14.11 11.65 6.85 8.44 5.10
Saudi Arabia 0.22 -0.30 -1.39 -1.13 -1.12 0.25 0.60 0.36 0.63 2.29 4.12 9.87 5.06 5.35 4.98 4.91
South Africa 8.62 6.87 5.21 5.37 5.70 9.18 5.81 1.39 3.39 4.69 7.09 11.54 7.13 4.27 5.00 5.64
Turkey 85.65 84.72 64.87 55.04 54.25 45.13 25.34 8.60 8.18 9.60 8.76 10.44 6.25 8.57 6.47 8.72
United Kingdom 1.82 1.56 1.32 0.87 1.18 1.27 1.36 1.34 2.04 2.30 2.35 3.63 2.12 3.34 4.45 2.73
United States 2.34 1.55 2.19 3.37 2.82 1.60 2.30 2.67 3.37 3.22 2.87 3.82 -0.32 1.64 3.14 1.97Databook for DCH; 5th December 2012 Page 199 of 266
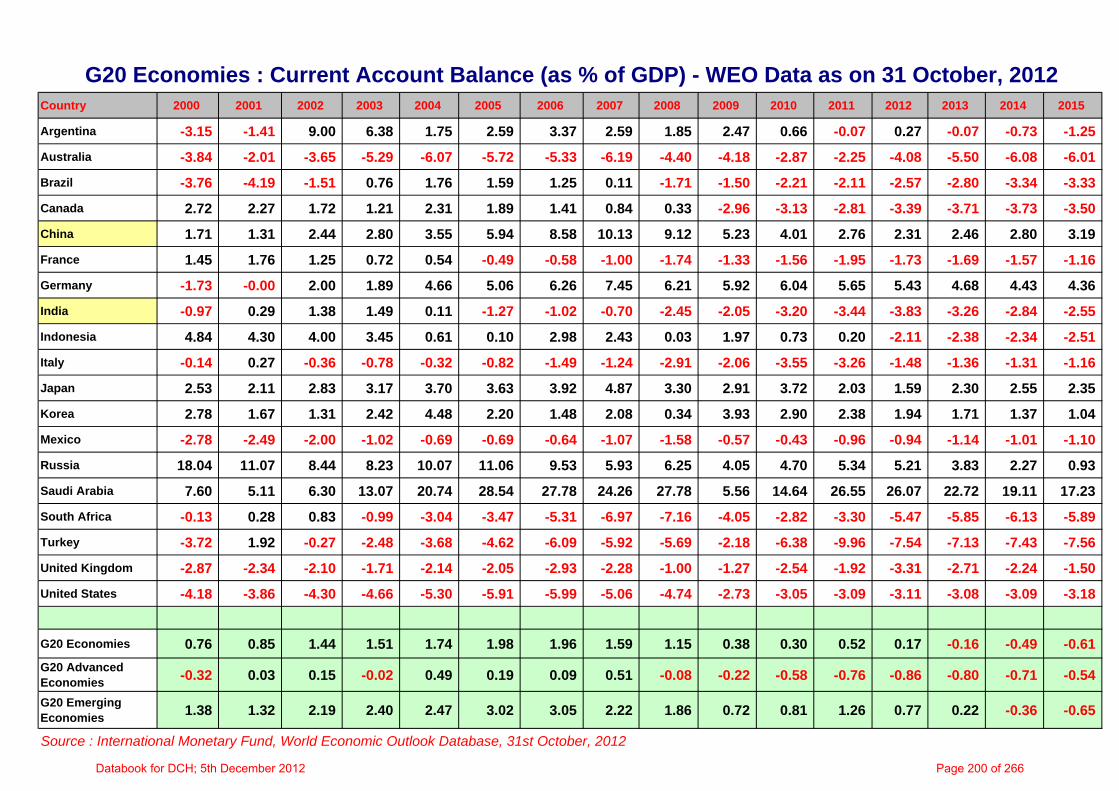
G20 Economies : Current Account Balance (as % of GDP) - WEO Data as on 31 October, 2012
Country 2000 2001 2002 2003 2004 2005 2006 2007 2008 2009 2010 2011 2012 2013 2014 2015
Argentina -3.15 -1.41 9.00 6.38 1.75 2.59 3.37 2.59 1.85 2.47 0.66 -0.07 0.27 -0.07 -0.73 -1.25
Australia -3.84 -2.01 -3.65 -5.29 -6.07 -5.72 -5.33 -6.19 -4.40 -4.18 -2.87 -2.25 -4.08 -5.50 -6.08 -6.01
Brazil -3.76 -4.19 -1.51 0.76 1.76 1.59 1.25 0.11 -1.71 -1.50 -2.21 -2.11 -2.57 -2.80 -3.34 -3.33
Canada 2.72 2.27 1.72 1.21 2.31 1.89 1.41 0.84 0.33 -2.96 -3.13 -2.81 -3.39 -3.71 -3.73 -3.50
China 1.71 1.31 2.44 2.80 3.55 5.94 8.58 10.13 9.12 5.23 4.01 2.76 2.31 2.46 2.80 3.19
France 1.45 1.76 1.25 0.72 0.54 -0.49 -0.58 -1.00 -1.74 -1.33 -1.56 -1.95 -1.73 -1.69 -1.57 -1.16
Germany -1.73 -0.00 2.00 1.89 4.66 5.06 6.26 7.45 6.21 5.92 6.04 5.65 5.43 4.68 4.43 4.36
India -0.97 0.29 1.38 1.49 0.11 -1.27 -1.02 -0.70 -2.45 -2.05 -3.20 -3.44 -3.83 -3.26 -2.84 -2.55
Indonesia 4.84 4.30 4.00 3.45 0.61 0.10 2.98 2.43 0.03 1.97 0.73 0.20 -2.11 -2.38 -2.34 -2.51
Italy -0.14 0.27 -0.36 -0.78 -0.32 -0.82 -1.49 -1.24 -2.91 -2.06 -3.55 -3.26 -1.48 -1.36 -1.31 -1.16
Japan 2.53 2.11 2.83 3.17 3.70 3.63 3.92 4.87 3.30 2.91 3.72 2.03 1.59 2.30 2.55 2.35
Korea 2.78 1.67 1.31 2.42 4.48 2.20 1.48 2.08 0.34 3.93 2.90 2.38 1.94 1.71 1.37 1.04
Mexico -2.78 -2.49 -2.00 -1.02 -0.69 -0.69 -0.64 -1.07 -1.58 -0.57 -0.43 -0.96 -0.94 -1.14 -1.01 -1.10
Russia 18.04 11.07 8.44 8.23 10.07 11.06 9.53 5.93 6.25 4.05 4.70 5.34 5.21 3.83 2.27 0.93
Saudi Arabia 7.60 5.11 6.30 13.07 20.74 28.54 27.78 24.26 27.78 5.56 14.64 26.55 26.07 22.72 19.11 17.23
South Africa -0.13 0.28 0.83 -0.99 -3.04 -3.47 -5.31 -6.97 -7.16 -4.05 -2.82 -3.30 -5.47 -5.85 -6.13 -5.89
Turkey -3.72 1.92 -0.27 -2.48 -3.68 -4.62 -6.09 -5.92 -5.69 -2.18 -6.38 -9.96 -7.54 -7.13 -7.43 -7.56
United Kingdom -2.87 -2.34 -2.10 -1.71 -2.14 -2.05 -2.93 -2.28 -1.00 -1.27 -2.54 -1.92 -3.31 -2.71 -2.24 -1.50
United States -4.18 -3.86 -4.30 -4.66 -5.30 -5.91 -5.99 -5.06 -4.74 -2.73 -3.05 -3.09 -3.11 -3.08 -3.09 -3.18
G20 Economies 0.76 0.85 1.44 1.51 1.74 1.98 1.96 1.59 1.15 0.38 0.30 0.52 0.17 -0.16 -0.49 -0.61
G20 Advanced
Economies-0.32 0.03 0.15 -0.02 0.49 0.19 0.09 0.51 -0.08 -0.22 -0.58 -0.76 -0.86 -0.80 -0.71 -0.54
G20 Emerging
Economies1.38 1.32 2.19 2.40 2.47 3.02 3.05 2.22 1.86 0.72 0.81 1.26 0.77 0.22 -0.36 -0.65
Source : International Monetary Fund, World Economic Outlook Database, 31st October, 2012
Databook for DCH; 5th December 2012 Page 200 of 266
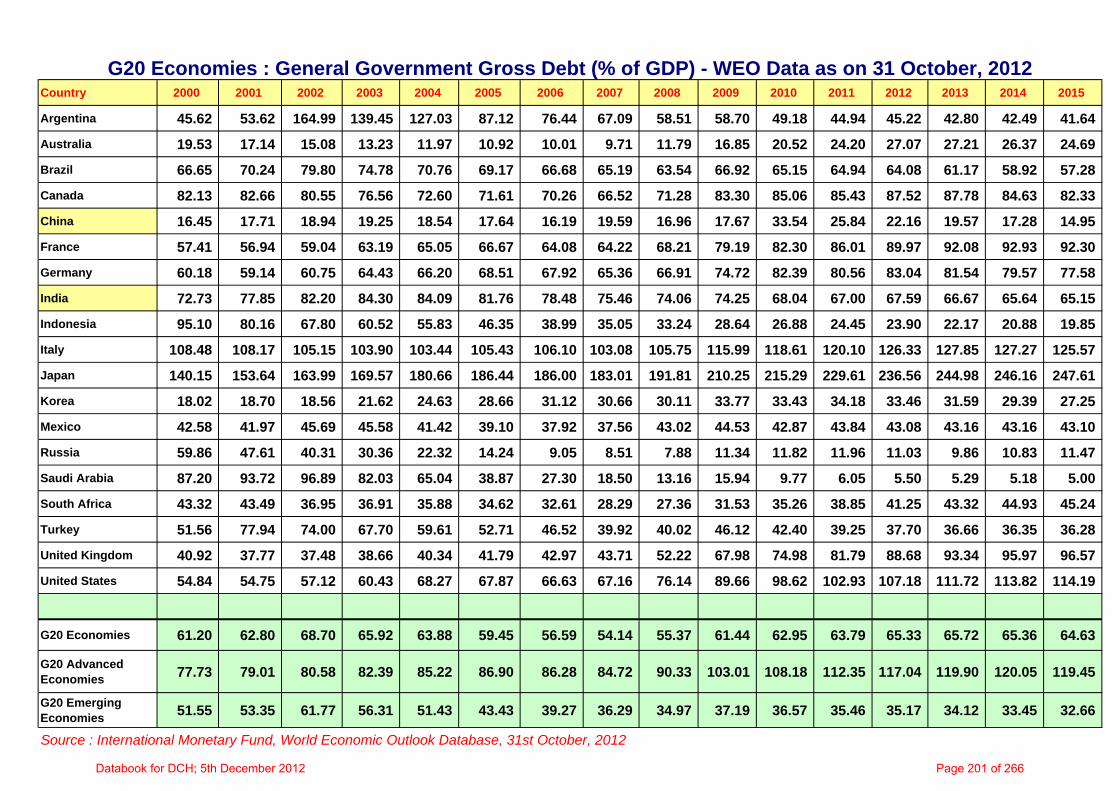
G20 Economies : General Government Gross Debt (% of GDP) - WEO Data as on 31 October, 2012Country 2000 2001 2002 2003 2004 2005 2006 2007 2008 2009 2010 2011 2012 2013 2014 2015
Argentina 45.62 53.62 164.99 139.45 127.03 87.12 76.44 67.09 58.51 58.70 49.18 44.94 45.22 42.80 42.49 41.64
Australia 19.53 17.14 15.08 13.23 11.97 10.92 10.01 9.71 11.79 16.85 20.52 24.20 27.07 27.21 26.37 24.69
Brazil 66.65 70.24 79.80 74.78 70.76 69.17 66.68 65.19 63.54 66.92 65.15 64.94 64.08 61.17 58.92 57.28
Canada 82.13 82.66 80.55 76.56 72.60 71.61 70.26 66.52 71.28 83.30 85.06 85.43 87.52 87.78 84.63 82.33
China 16.45 17.71 18.94 19.25 18.54 17.64 16.19 19.59 16.96 17.67 33.54 25.84 22.16 19.57 17.28 14.95
France 57.41 56.94 59.04 63.19 65.05 66.67 64.08 64.22 68.21 79.19 82.30 86.01 89.97 92.08 92.93 92.30
Germany 60.18 59.14 60.75 64.43 66.20 68.51 67.92 65.36 66.91 74.72 82.39 80.56 83.04 81.54 79.57 77.58
India 72.73 77.85 82.20 84.30 84.09 81.76 78.48 75.46 74.06 74.25 68.04 67.00 67.59 66.67 65.64 65.15
Indonesia 95.10 80.16 67.80 60.52 55.83 46.35 38.99 35.05 33.24 28.64 26.88 24.45 23.90 22.17 20.88 19.85
Italy 108.48 108.17 105.15 103.90 103.44 105.43 106.10 103.08 105.75 115.99 118.61 120.10 126.33 127.85 127.27 125.57
Japan 140.15 153.64 163.99 169.57 180.66 186.44 186.00 183.01 191.81 210.25 215.29 229.61 236.56 244.98 246.16 247.61
Korea 18.02 18.70 18.56 21.62 24.63 28.66 31.12 30.66 30.11 33.77 33.43 34.18 33.46 31.59 29.39 27.25
Mexico 42.58 41.97 45.69 45.58 41.42 39.10 37.92 37.56 43.02 44.53 42.87 43.84 43.08 43.16 43.16 43.10
Russia 59.86 47.61 40.31 30.36 22.32 14.24 9.05 8.51 7.88 11.34 11.82 11.96 11.03 9.86 10.83 11.47
Saudi Arabia 87.20 93.72 96.89 82.03 65.04 38.87 27.30 18.50 13.16 15.94 9.77 6.05 5.50 5.29 5.18 5.00
South Africa 43.32 43.49 36.95 36.91 35.88 34.62 32.61 28.29 27.36 31.53 35.26 38.85 41.25 43.32 44.93 45.24
Turkey 51.56 77.94 74.00 67.70 59.61 52.71 46.52 39.92 40.02 46.12 42.40 39.25 37.70 36.66 36.35 36.28
United Kingdom 40.92 37.77 37.48 38.66 40.34 41.79 42.97 43.71 52.22 67.98 74.98 81.79 88.68 93.34 95.97 96.57
United States 54.84 54.75 57.12 60.43 68.27 67.87 66.63 67.16 76.14 89.66 98.62 102.93 107.18 111.72 113.82 114.19
G20 Economies 61.20 62.80 68.70 65.92 63.88 59.45 56.59 54.14 55.37 61.44 62.95 63.79 65.33 65.72 65.36 64.63
G20 Advanced
Economies77.73 79.01 80.58 82.39 85.22 86.90 86.28 84.72 90.33 103.01 108.18 112.35 117.04 119.90 120.05 119.45
G20 Emerging
Economies51.55 53.35 61.77 56.31 51.43 43.43 39.27 36.29 34.97 37.19 36.57 35.46 35.17 34.12 33.45 32.66
Source : International Monetary Fund, World Economic Outlook Database, 31st October, 2012
Databook for DCH; 5th December 2012 Page 201 of 266
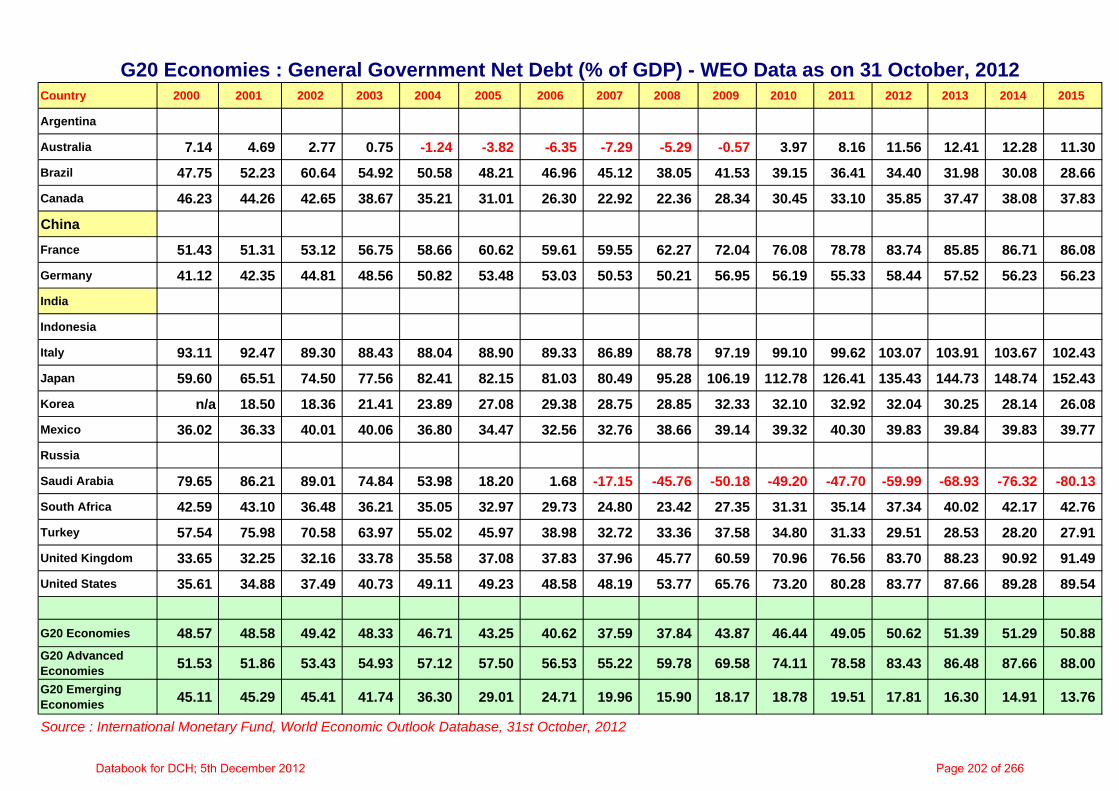
G20 Economies : General Government Net Debt (% of GDP) - WEO Data as on 31 October, 2012Country 2000 2001 2002 2003 2004 2005 2006 2007 2008 2009 2010 2011 2012 2013 2014 2015
Argentina
Australia 7.14 4.69 2.77 0.75 -1.24 -3.82 -6.35 -7.29 -5.29 -0.57 3.97 8.16 11.56 12.41 12.28 11.30
Brazil 47.75 52.23 60.64 54.92 50.58 48.21 46.96 45.12 38.05 41.53 39.15 36.41 34.40 31.98 30.08 28.66
Canada 46.23 44.26 42.65 38.67 35.21 31.01 26.30 22.92 22.36 28.34 30.45 33.10 35.85 37.47 38.08 37.83
China
France 51.43 51.31 53.12 56.75 58.66 60.62 59.61 59.55 62.27 72.04 76.08 78.78 83.74 85.85 86.71 86.08
Germany 41.12 42.35 44.81 48.56 50.82 53.48 53.03 50.53 50.21 56.95 56.19 55.33 58.44 57.52 56.23 56.23
India
Indonesia
Italy 93.11 92.47 89.30 88.43 88.04 88.90 89.33 86.89 88.78 97.19 99.10 99.62 103.07 103.91 103.67 102.43
Japan 59.60 65.51 74.50 77.56 82.41 82.15 81.03 80.49 95.28 106.19 112.78 126.41 135.43 144.73 148.74 152.43
Korea n/a 18.50 18.36 21.41 23.89 27.08 29.38 28.75 28.85 32.33 32.10 32.92 32.04 30.25 28.14 26.08
Mexico 36.02 36.33 40.01 40.06 36.80 34.47 32.56 32.76 38.66 39.14 39.32 40.30 39.83 39.84 39.83 39.77
Russia
Saudi Arabia 79.65 86.21 89.01 74.84 53.98 18.20 1.68 -17.15 -45.76 -50.18 -49.20 -47.70 -59.99 -68.93 -76.32 -80.13
South Africa 42.59 43.10 36.48 36.21 35.05 32.97 29.73 24.80 23.42 27.35 31.31 35.14 37.34 40.02 42.17 42.76
Turkey 57.54 75.98 70.58 63.97 55.02 45.97 38.98 32.72 33.36 37.58 34.80 31.33 29.51 28.53 28.20 27.91
United Kingdom 33.65 32.25 32.16 33.78 35.58 37.08 37.83 37.96 45.77 60.59 70.96 76.56 83.70 88.23 90.92 91.49
United States 35.61 34.88 37.49 40.73 49.11 49.23 48.58 48.19 53.77 65.76 73.20 80.28 83.77 87.66 89.28 89.54
G20 Economies 48.57 48.58 49.42 48.33 46.71 43.25 40.62 37.59 37.84 43.87 46.44 49.05 50.62 51.39 51.29 50.88
G20 Advanced
Economies51.53 51.86 53.43 54.93 57.12 57.50 56.53 55.22 59.78 69.58 74.11 78.58 83.43 86.48 87.66 88.00
G20 Emerging
Economies45.11 45.29 45.41 41.74 36.30 29.01 24.71 19.96 15.90 18.17 18.78 19.51 17.81 16.30 14.91 13.76
Source : International Monetary Fund, World Economic Outlook Database, 31st October, 2012
Databook for DCH; 5th December 2012 Page 202 of 266
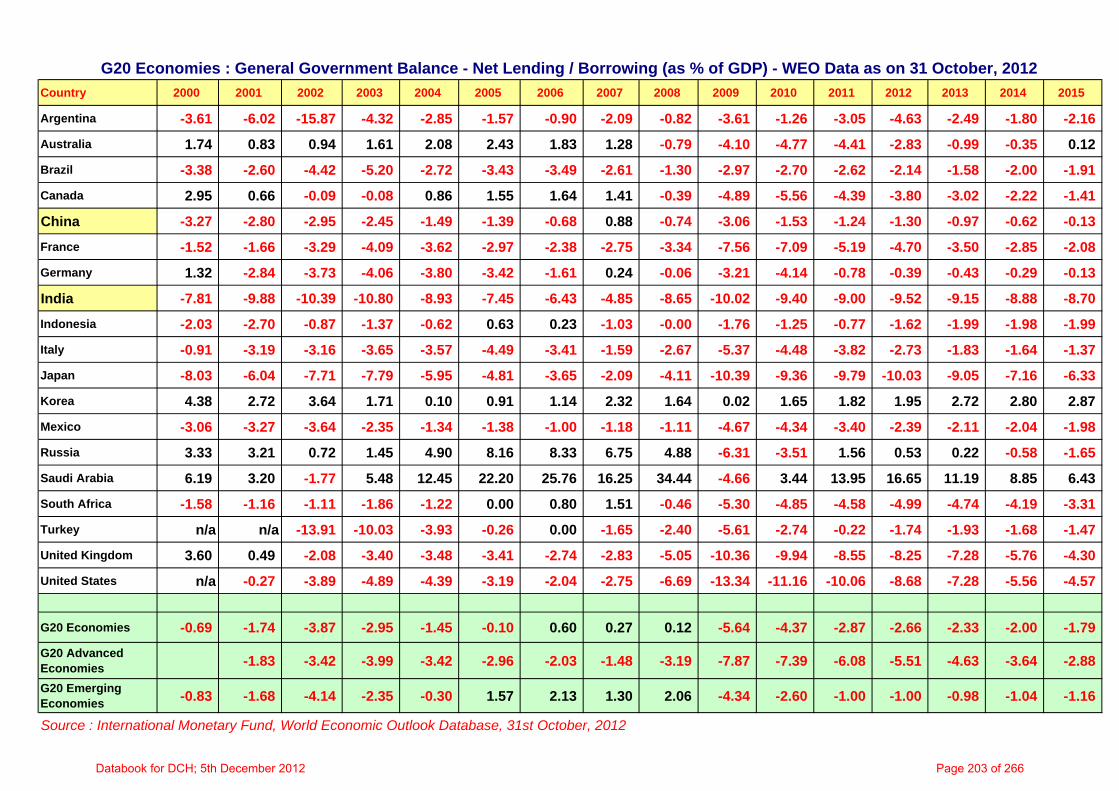
G20 Economies : General Government Balance - Net Lending / Borrowing (as % of GDP) - WEO Data as on 31 October, 2012
Country 2000 2001 2002 2003 2004 2005 2006 2007 2008 2009 2010 2011 2012 2013 2014 2015
Argentina -3.61 -6.02 -15.87 -4.32 -2.85 -1.57 -0.90 -2.09 -0.82 -3.61 -1.26 -3.05 -4.63 -2.49 -1.80 -2.16
Australia 1.74 0.83 0.94 1.61 2.08 2.43 1.83 1.28 -0.79 -4.10 -4.77 -4.41 -2.83 -0.99 -0.35 0.12
Brazil -3.38 -2.60 -4.42 -5.20 -2.72 -3.43 -3.49 -2.61 -1.30 -2.97 -2.70 -2.62 -2.14 -1.58 -2.00 -1.91
Canada 2.95 0.66 -0.09 -0.08 0.86 1.55 1.64 1.41 -0.39 -4.89 -5.56 -4.39 -3.80 -3.02 -2.22 -1.41
China -3.27 -2.80 -2.95 -2.45 -1.49 -1.39 -0.68 0.88 -0.74 -3.06 -1.53 -1.24 -1.30 -0.97 -0.62 -0.13
France -1.52 -1.66 -3.29 -4.09 -3.62 -2.97 -2.38 -2.75 -3.34 -7.56 -7.09 -5.19 -4.70 -3.50 -2.85 -2.08
Germany 1.32 -2.84 -3.73 -4.06 -3.80 -3.42 -1.61 0.24 -0.06 -3.21 -4.14 -0.78 -0.39 -0.43 -0.29 -0.13
India -7.81 -9.88 -10.39 -10.80 -8.93 -7.45 -6.43 -4.85 -8.65 -10.02 -9.40 -9.00 -9.52 -9.15 -8.88 -8.70
Indonesia -2.03 -2.70 -0.87 -1.37 -0.62 0.63 0.23 -1.03 -0.00 -1.76 -1.25 -0.77 -1.62 -1.99 -1.98 -1.99
Italy -0.91 -3.19 -3.16 -3.65 -3.57 -4.49 -3.41 -1.59 -2.67 -5.37 -4.48 -3.82 -2.73 -1.83 -1.64 -1.37
Japan -8.03 -6.04 -7.71 -7.79 -5.95 -4.81 -3.65 -2.09 -4.11 -10.39 -9.36 -9.79 -10.03 -9.05 -7.16 -6.33
Korea 4.38 2.72 3.64 1.71 0.10 0.91 1.14 2.32 1.64 0.02 1.65 1.82 1.95 2.72 2.80 2.87
Mexico -3.06 -3.27 -3.64 -2.35 -1.34 -1.38 -1.00 -1.18 -1.11 -4.67 -4.34 -3.40 -2.39 -2.11 -2.04 -1.98
Russia 3.33 3.21 0.72 1.45 4.90 8.16 8.33 6.75 4.88 -6.31 -3.51 1.56 0.53 0.22 -0.58 -1.65
Saudi Arabia 6.19 3.20 -1.77 5.48 12.45 22.20 25.76 16.25 34.44 -4.66 3.44 13.95 16.65 11.19 8.85 6.43
South Africa -1.58 -1.16 -1.11 -1.86 -1.22 0.00 0.80 1.51 -0.46 -5.30 -4.85 -4.58 -4.99 -4.74 -4.19 -3.31
Turkey n/a n/a -13.91 -10.03 -3.93 -0.26 0.00 -1.65 -2.40 -5.61 -2.74 -0.22 -1.74 -1.93 -1.68 -1.47
United Kingdom 3.60 0.49 -2.08 -3.40 -3.48 -3.41 -2.74 -2.83 -5.05 -10.36 -9.94 -8.55 -8.25 -7.28 -5.76 -4.30
United States n/a -0.27 -3.89 -4.89 -4.39 -3.19 -2.04 -2.75 -6.69 -13.34 -11.16 -10.06 -8.68 -7.28 -5.56 -4.57
G20 Economies -0.69 -1.74 -3.87 -2.95 -1.45 -0.10 0.60 0.27 0.12 -5.64 -4.37 -2.87 -2.66 -2.33 -2.00 -1.79
G20 Advanced
Economies-1.83 -3.42 -3.99 -3.42 -2.96 -2.03 -1.48 -3.19 -7.87 -7.39 -6.08 -5.51 -4.63 -3.64 -2.88
G20 Emerging
Economies-0.83 -1.68 -4.14 -2.35 -0.30 1.57 2.13 1.30 2.06 -4.34 -2.60 -1.00 -1.00 -0.98 -1.04 -1.16
Source : International Monetary Fund, World Economic Outlook Database, 31st October, 2012
Databook for DCH; 5th December 2012 Page 203 of 266
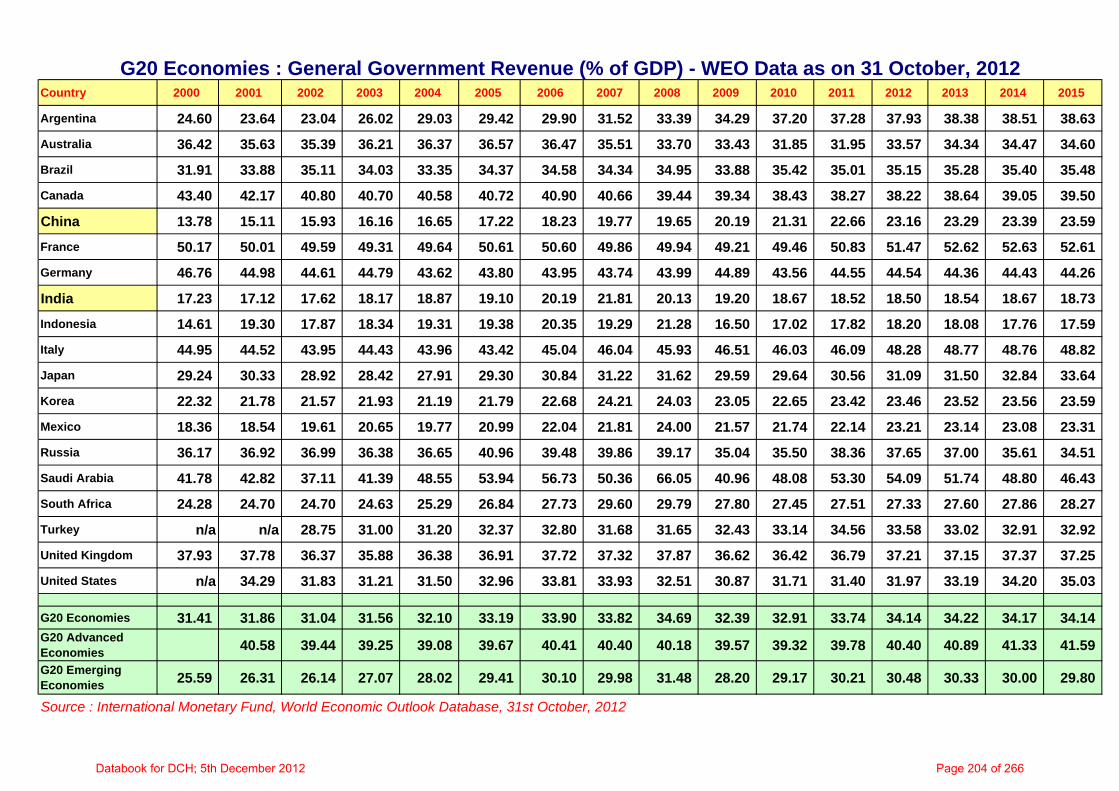
G20 Economies : General Government Revenue (% of GDP) - WEO Data as on 31 October, 2012Country 2000 2001 2002 2003 2004 2005 2006 2007 2008 2009 2010 2011 2012 2013 2014 2015
Argentina 24.60 23.64 23.04 26.02 29.03 29.42 29.90 31.52 33.39 34.29 37.20 37.28 37.93 38.38 38.51 38.63
Australia 36.42 35.63 35.39 36.21 36.37 36.57 36.47 35.51 33.70 33.43 31.85 31.95 33.57 34.34 34.47 34.60
Brazil 31.91 33.88 35.11 34.03 33.35 34.37 34.58 34.34 34.95 33.88 35.42 35.01 35.15 35.28 35.40 35.48
Canada 43.40 42.17 40.80 40.70 40.58 40.72 40.90 40.66 39.44 39.34 38.43 38.27 38.22 38.64 39.05 39.50
China 13.78 15.11 15.93 16.16 16.65 17.22 18.23 19.77 19.65 20.19 21.31 22.66 23.16 23.29 23.39 23.59
France 50.17 50.01 49.59 49.31 49.64 50.61 50.60 49.86 49.94 49.21 49.46 50.83 51.47 52.62 52.63 52.61
Germany 46.76 44.98 44.61 44.79 43.62 43.80 43.95 43.74 43.99 44.89 43.56 44.55 44.54 44.36 44.43 44.26
India 17.23 17.12 17.62 18.17 18.87 19.10 20.19 21.81 20.13 19.20 18.67 18.52 18.50 18.54 18.67 18.73
Indonesia 14.61 19.30 17.87 18.34 19.31 19.38 20.35 19.29 21.28 16.50 17.02 17.82 18.20 18.08 17.76 17.59
Italy 44.95 44.52 43.95 44.43 43.96 43.42 45.04 46.04 45.93 46.51 46.03 46.09 48.28 48.77 48.76 48.82
Japan 29.24 30.33 28.92 28.42 27.91 29.30 30.84 31.22 31.62 29.59 29.64 30.56 31.09 31.50 32.84 33.64
Korea 22.32 21.78 21.57 21.93 21.19 21.79 22.68 24.21 24.03 23.05 22.65 23.42 23.46 23.52 23.56 23.59
Mexico 18.36 18.54 19.61 20.65 19.77 20.99 22.04 21.81 24.00 21.57 21.74 22.14 23.21 23.14 23.08 23.31
Russia 36.17 36.92 36.99 36.38 36.65 40.96 39.48 39.86 39.17 35.04 35.50 38.36 37.65 37.00 35.61 34.51
Saudi Arabia 41.78 42.82 37.11 41.39 48.55 53.94 56.73 50.36 66.05 40.96 48.08 53.30 54.09 51.74 48.80 46.43
South Africa 24.28 24.70 24.70 24.63 25.29 26.84 27.73 29.60 29.79 27.80 27.45 27.51 27.33 27.60 27.86 28.27
Turkey n/a n/a 28.75 31.00 31.20 32.37 32.80 31.68 31.65 32.43 33.14 34.56 33.58 33.02 32.91 32.92
United Kingdom 37.93 37.78 36.37 35.88 36.38 36.91 37.72 37.32 37.87 36.62 36.42 36.79 37.21 37.15 37.37 37.25
United States n/a 34.29 31.83 31.21 31.50 32.96 33.81 33.93 32.51 30.87 31.71 31.40 31.97 33.19 34.20 35.03
G20 Economies 31.41
G20 Advanced
31.86
40.58
31.04
39.44
31.56
39.25
32.10
39.08
33.19
39.67
33.90
40.41
33.82
40.40
34.69
40.18
32.39
39.57
32.91
39.32
33.74
39.78
34.14
40.40
34.22
40.89
34.17
41.33
34.14
41.59Economies
G20 Emerging 25.59 26.31 26.14 27.07 28.02 29.41 30.10 29.98 31.48 28.20 29.17 30.21 30.48 30.33 30.00 29.80
Economies
Source : International Monetary Fund, World Economic Outlook Database, 31st October, 2012
Databook for DCH; 5th December 2012 Page 204 of 266
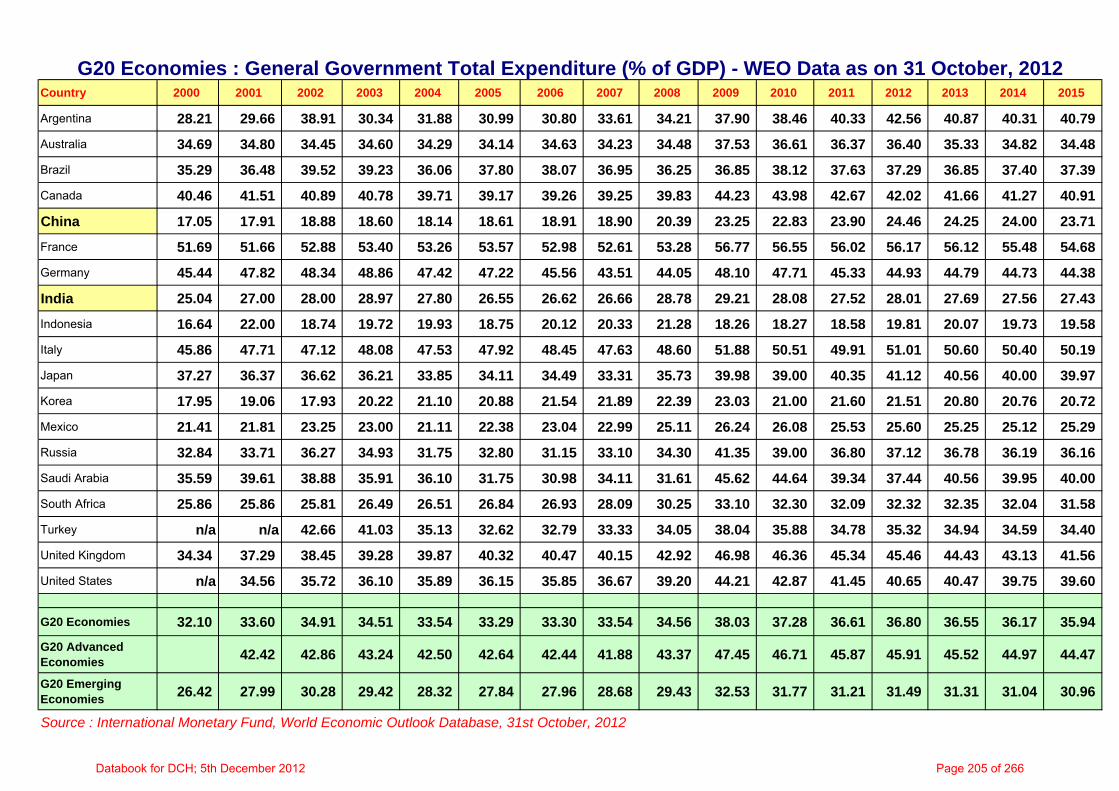
United States n/a 34.56 35.72 36.10 35.89 36.15 35.85 36.67 39.20 44.21 42.87 41.45 40.65 40.47 39.75 39.60
G20 Economies : General Government Total Expenditure (% of GDP) - WEO Data as on 31 October, 2012Country 2000 2001 2002 2003 2004 2005 2006 2007 2008 2009 2010 2011 2012 2013 2014 2015
Argentina 28.21 29.66 38.91 30.34 31.88 30.99 30.80 33.61 34.21 37.90 38.46 40.33 42.56 40.87 40.31 40.79
Australia 34.69 34.80 34.45 34.60 34.29 34.14 34.63 34.23 34.48 37.53 36.61 36.37 36.40 35.33 34.82 34.48
Brazil 35.29 36.48 39.52 39.23 36.06 37.80 38.07 36.95 36.25 36.85 38.12 37.63 37.29 36.85 37.40 37.39
Canada 40.46 41.51 40.89 40.78 39.71 39.17 39.26 39.25 39.83 44.23 43.98 42.67 42.02 41.66 41.27 40.91
China 17.05 17.91 18.88 18.60 18.14 18.61 18.91 18.90 20.39 23.25 22.83 23.90 24.46 24.25 24.00 23.71
France 51.69 51.66 52.88 53.40 53.26 53.57 52.98 52.61 53.28 56.77 56.55 56.02 56.17 56.12 55.48 54.68
Germany 45.44 47.82 48.34 48.86 47.42 47.22 45.56 43.51 44.05 48.10 47.71 45.33 44.93 44.79 44.73 44.38
India
Indonesia
25.04 27.00 28.00 28.97 27.80 26.55 26.62 26.66 28.78 29.21 28.08 27.52 28.01 27.69 27.56 27.43
Italy
16.64 22.00 18.74 19.72 19.93 18.75 20.12 20.33 21.28 18.26 18.27 18.58 19.81 20.07 19.73 19.58
45.86 47.71 47.12 48.08 47.53 47.92 48.45 47.63 48.60 51.88 50.51 49.91 51.01 50.60 50.40 50.19
Japan 37.27 36.37 36.62 36.21 33.85 34.11 34.49 33.31 35.73 39.98 39.00 40.35 41.12 40.56 40.00 39.97
Korea 17.95 19.06 17.93 20.22 21.10 20.88 21.54 21.89 22.39 23.03 21.00 21.60 21.51 20.80 20.76 20.72
Mexico 21.41 21.81 23.25 23.00 21.11 22.38 23.04 22.99 25.11 26.24 26.08 25.53 25.60 25.25 25.12 25.29
Russia 32.84 33.71 36.27 34.93 31.75 32.80 31.15 33.10 34.30 41.35 39.00 36.80 37.12 36.78 36.19 36.16
Saudi Arabia 35.59 39.61 38.88 35.91 36.10 31.75 30.98 34.11 31.61 45.62 44.64 39.34 37.44 40.56 39.95 40.00
South Africa 25.86 25.86 25.81 26.49 26.51 26.84 26.93 28.09 30.25 33.10 32.30 32.09 32.32 32.35 32.04 31.58
Turkey n/a n/a 42.66 41.03 35.13 32.62 32.79 33.33 34.05 38.04 35.88 34.78 35.32 34.94 34.59 34.40
United Kingdom 34.34 37.29 38.45 39.28 39.87 40.32 40.47 40.15 42.92 46.98 46.36 45.34 45.46 44.43 43.13 41.56
G20 Economies 32.10
G20 Advanced
33.60
42.42
34.91
42.86
34.51
43.24
33.54
42.50
33.29
42.64
33.30
42.44
33.54
41.88
34.56
43.37
38.03
47.45
37.28
46.71
36.61
45.87
36.80
45.91
36.55
45.52
36.17
44.97
35.94
44.47Economies
G20 Emerging 26.42 27.99 30.28 29.42 28.32 27.84 27.96 28.68 29.43 32.53 31.77 31.21 31.49 31.31 31.04 30.96
Economies
Source : International Monetary Fund, World Economic Outlook Database, 31st October, 2012
Databook for DCH; 5th December 2012 Page 205 of 266
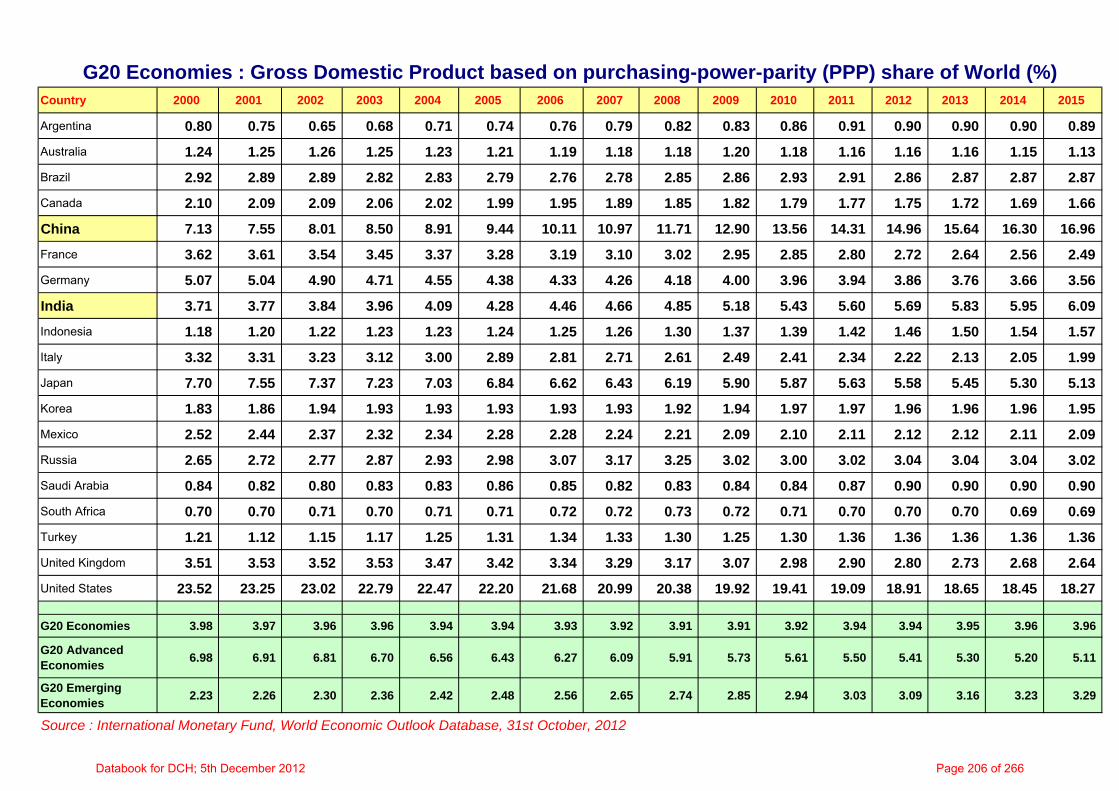
United States 23.52 23.25 23.02 22.79 22.47 22.20 21.68 20.99 20.38 19.92 19.41 19.09 18.91 18.65 18.45 18.27
Source : International Monetary Fund, World Economic Outlook Database, 31st October, 2012
G20 Economies : Gross Domestic Product based on purchasing-power-parity (PPP) share of World (%)
Country 2000 2001 2002 2003 2004 2005 2006 2007 2008 2009 2010 2011 2012 2013 2014 2015
Argentina
Australia
0.80 0.75 0.65 0.68 0.71 0.74 0.76 0.79 0.82 0.83 0.86 0.91 0.90 0.90 0.90 0.89
1.24 1.25 1.26 1.25 1.23 1.21 1.19 1.18 1.18 1.20 1.18 1.16 1.16 1.16 1.15 1.13
Brazil 2.92 2.89 2.89 2.82 2.83 2.79 2.76 2.78 2.85 2.86 2.93 2.91 2.86 2.87 2.87 2.87
Canada 2.10 2.09 2.09 2.06 2.02 1.99 1.95 1.89 1.85 1.82 1.79 1.77 1.75 1.72 1.69 1.66
China 7.13 7.55 8.01 8.50 8.91 9.44 10.11 10.97 11.71 12.90 13.56 14.31 14.96 15.64 16.30 16.96
France 3.62 3.61 3.54 3.45 3.37 3.28 3.19 3.10 3.02 2.95 2.85 2.80 2.72 2.64 2.56 2.49
Germany 5.07 5.04 4.90 4.71 4.55 4.38 4.33 4.26 4.18 4.00 3.96 3.94 3.86 3.76 3.66 3.56
India 3.71 3.77 3.84 3.96 4.09 4.28 4.46 4.66 4.85 5.18 5.43 5.60 5.69 5.83 5.95 6.09
Indonesia 1.18 1.20 1.22 1.23 1.23 1.24 1.25 1.26 1.30 1.37 1.39 1.42 1.46 1.50 1.54 1.57
Italy 3.32 3.31 3.23 3.12 3.00 2.89 2.81 2.71 2.61 2.49 2.41 2.34 2.22 2.13 2.05 1.99
Japan 7.70 7.55 7.37 7.23 7.03 6.84 6.62 6.43 6.19 5.90 5.87 5.63 5.58 5.45 5.30 5.13
Korea 1.83 1.86 1.94 1.93 1.93 1.93 1.93 1.93 1.92 1.94 1.97 1.97 1.96 1.96 1.96 1.95
Mexico 2.52 2.44 2.37 2.32 2.34 2.28 2.28 2.24 2.21 2.09 2.10 2.11 2.12 2.12 2.11 2.09
Russia 2.65 2.72 2.77 2.87 2.93 2.98 3.07 3.17 3.25 3.02 3.00 3.02 3.04 3.04 3.04 3.02
Saudi Arabia 0.84 0.82 0.80 0.83 0.83 0.86 0.85 0.82 0.83 0.84 0.84 0.87 0.90 0.90 0.90 0.90
South Africa 0.70 0.70 0.71 0.70 0.71 0.71 0.72 0.72 0.73 0.72 0.71 0.70 0.70 0.70 0.69 0.69
Turkey 1.21 1.12 1.15 1.17 1.25 1.31 1.34 1.33 1.30 1.25 1.30 1.36 1.36 1.36 1.36 1.36
United Kingdom 3.51 3.53 3.52 3.53 3.47 3.42 3.34 3.29 3.17 3.07 2.98 2.90 2.80 2.73 2.68 2.64
G20 Economies
G20 Advanced
3.98
6.98
3.97
6.91
3.96
6.81
3.96
6.70
3.94
6.56
3.94
6.43
3.93
6.27
3.92
6.09
3.91
5.91
3.91
5.73
3.92
5.61
3.94
5.50
3.94
5.41
3.95
5.30
3.96
5.20
3.96
5.11Economies
G20 Emerging 2.23 2.26 2.30 2.36 2.42 2.48 2.56 2.65 2.74 2.85 2.94 3.03 3.09 3.16 3.23 3.29
Economies
Databook for DCH; 5th December 2012 Page 206 of 266
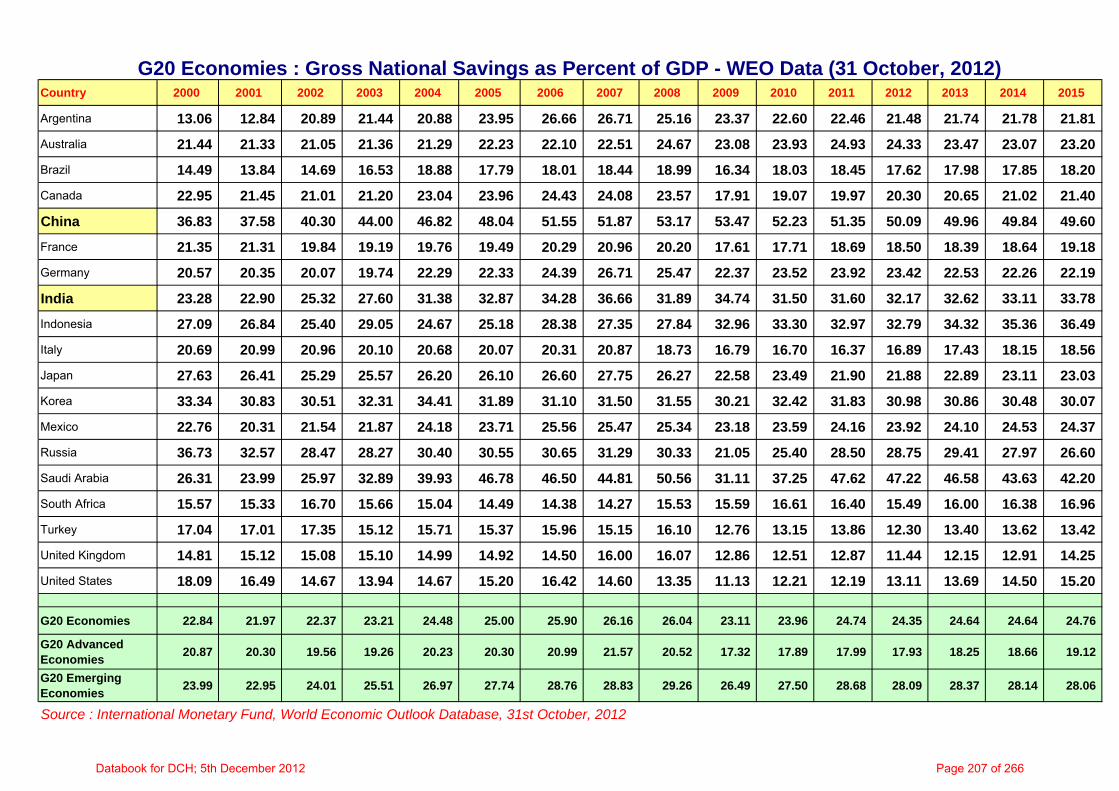
United States 18.09 16.49 14.67 13.94 14.67 15.20 16.42 14.60 13.35 11.13 12.21 12.19 13.11 13.69 14.50 15.20
Source : International Monetary Fund, World Economic Outlook Database, 31st October, 2012
G20 Economies : Gross National Savings as Percent of GDP - WEO Data (31 October, 2012)Country 2000 2001 2002 2003 2004 2005 2006 2007 2008 2009 2010 2011 2012 2013 2014 2015
Argentina 13.06 12.84 20.89 21.44 20.88 23.95 26.66 26.71 25.16 23.37 22.60 22.46 21.48 21.74 21.78 21.81
Australia 21.44 21.33 21.05 21.36 21.29 22.23 22.10 22.51 24.67 23.08 23.93 24.93 24.33 23.47 23.07 23.20
Brazil 14.49 13.84 14.69 16.53 18.88 17.79 18.01 18.44 18.99 16.34 18.03 18.45 17.62 17.98 17.85 18.20
Canada 22.95 21.45 21.01 21.20 23.04 23.96 24.43 24.08 23.57 17.91 19.07 19.97 20.30 20.65 21.02 21.40
China 36.83 37.58 40.30 44.00 46.82 48.04 51.55 51.87 53.17 53.47 52.23 51.35 50.09 49.96 49.84 49.60
France 21.35 21.31 19.84 19.19 19.76 19.49 20.29 20.96 20.20 17.61 17.71 18.69 18.50 18.39 18.64 19.18
Germany 20.57 20.35 20.07 19.74 22.29 22.33 24.39 26.71 25.47 22.37 23.52 23.92 23.42 22.53 22.26 22.19
India 23.28 22.90 25.32 27.60 31.38 32.87 34.28 36.66 31.89 34.74 31.50 31.60 32.17 32.62 33.11 33.78
Indonesia 27.09 26.84 25.40 29.05 24.67 25.18 28.38 27.35 27.84 32.96 33.30 32.97 32.79 34.32 35.36 36.49
Italy 20.69 20.99 20.96 20.10 20.68 20.07 20.31 20.87 18.73 16.79 16.70 16.37 16.89 17.43 18.15 18.56
Japan 27.63 26.41 25.29 25.57 26.20 26.10 26.60 27.75 26.27 22.58 23.49 21.90 21.88 22.89 23.11 23.03
Korea 33.34 30.83 30.51 32.31 34.41 31.89 31.10 31.50 31.55 30.21 32.42 31.83 30.98 30.86 30.48 30.07
Mexico 22.76 20.31 21.54 21.87 24.18 23.71 25.56 25.47 25.34 23.18 23.59 24.16 23.92 24.10 24.53 24.37
Russia 36.73 32.57 28.47 28.27 30.40 30.55 30.65 31.29 30.33 21.05 25.40 28.50 28.75 29.41 27.97 26.60
Saudi Arabia 26.31 23.99 25.97 32.89 39.93 46.78 46.50 44.81 50.56 31.11 37.25 47.62 47.22 46.58 43.63 42.20
South Africa 15.57 15.33 16.70 15.66 15.04 14.49 14.38 14.27 15.53 15.59 16.61 16.40 15.49 16.00 16.38 16.96
Turkey 17.04 17.01 17.35 15.12 15.71 15.37 15.96 15.15 16.10 12.76 13.15 13.86 12.30 13.40 13.62 13.42
United Kingdom 14.81 15.12 15.08 15.10 14.99 14.92 14.50 16.00 16.07 12.86 12.51 12.87 11.44 12.15 12.91 14.25
G20 Economies
G20 Advanced
22.84
20.87
21.97
20.30
22.37
19.56
23.21
19.26
24.48
20.23
25.00
20.30
25.90
20.99
26.16
21.57
26.04
20.52
23.11
17.32
23.96
17.89
24.74
17.99
24.35
17.93
24.64
18.25
24.64
18.66
24.76
19.12Economies
G20 Emerging
Economies23.99 22.95 24.01 25.51 26.97 27.74 28.76 28.83 29.26 26.49 27.50 28.68 28.09 28.37 28.14 28.06
Databook for DCH; 5th December 2012 Page 207 of 266
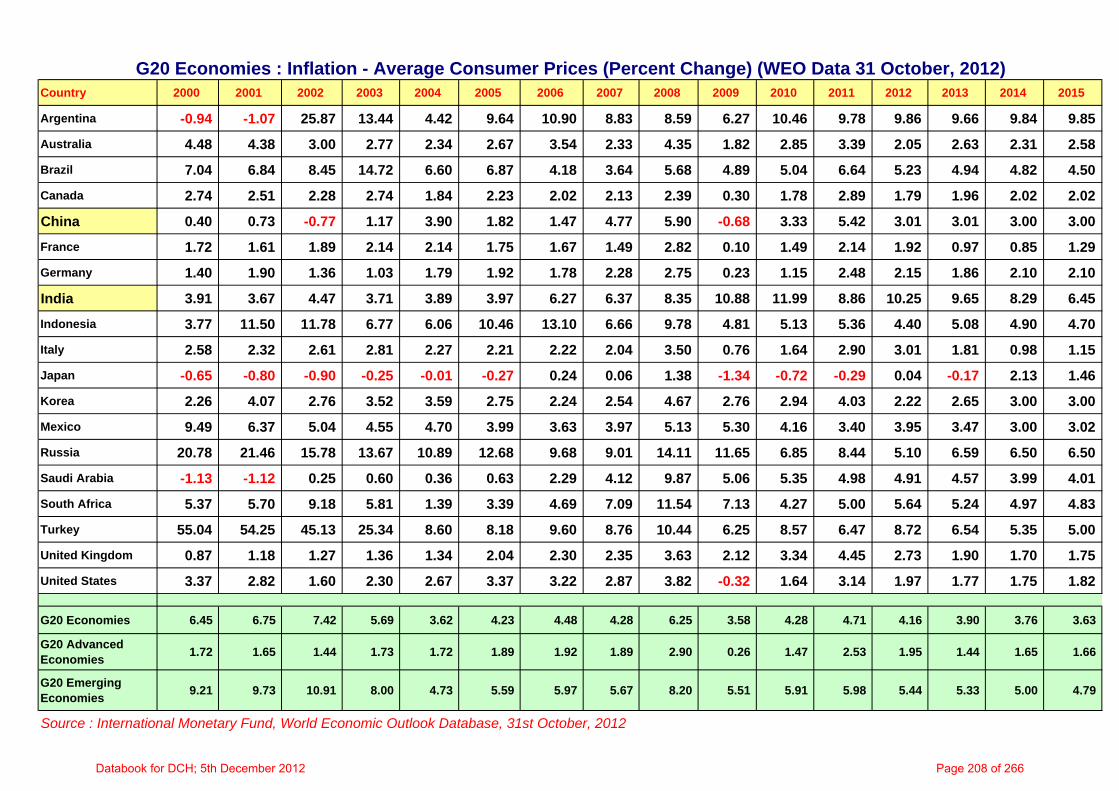
United States 3.37 2.82 1.60 2.30 2.67 3.37 3.22 2.87 3.82 -0.32 1.64 3.14 1.97 1.77 1.75 1.82
Source : International Monetary Fund, World Economic Outlook Database, 31st October, 2012
G20 Economies : Inflation - Average Consumer Prices (Percent Change) (WEO Data 31 October, 2012)
Country 2000 2001 2002 2003 2004 2005 2006 2007 2008 2009 2010 2011 2012 2013 2014 2015
Argentina -0.94 -1.07 25.87 13.44 4.42 9.64 10.90 8.83 8.59 6.27 10.46 9.78 9.86 9.66 9.84 9.85
Australia 4.48 4.38 3.00 2.77 2.34 2.67 3.54 2.33 4.35 1.82 2.85 3.39 2.05 2.63 2.31 2.58
Brazil 7.04 6.84 8.45 14.72 6.60 6.87 4.18 3.64 5.68 4.89 5.04 6.64 5.23 4.94 4.82 4.50
Canada 2.74 2.51 2.28 2.74 1.84 2.23 2.02 2.13 2.39 0.30 1.78 2.89 1.79 1.96 2.02 2.02
China 0.40 0.73 -0.77 1.17 3.90 1.82 1.47 4.77 5.90 -0.68 3.33 5.42 3.01 3.01 3.00 3.00
France 1.72 1.61 1.89 2.14 2.14 1.75 1.67 1.49 2.82 0.10 1.49 2.14 1.92 0.97 0.85 1.29
Germany 1.40 1.90 1.36 1.03 1.79 1.92 1.78 2.28 2.75 0.23 1.15 2.48 2.15 1.86 2.10 2.10
India 3.91 3.67 4.47 3.71 3.89 3.97 6.27 6.37 8.35 10.88 11.99 8.86 10.25 9.65 8.29 6.45
Indonesia 3.77 11.50 11.78 6.77 6.06 10.46 13.10 6.66 9.78 4.81 5.13 5.36 4.40 5.08 4.90 4.70
Italy 2.58 2.32 2.61 2.81 2.27 2.21 2.22 2.04 3.50 0.76 1.64 2.90 3.01 1.81 0.98 1.15
Japan -0.65 -0.80 -0.90 -0.25 -0.01 -0.27 0.24 0.06 1.38 -1.34 -0.72 -0.29 0.04 -0.17 2.13 1.46
Korea 2.26 4.07 2.76 3.52 3.59 2.75 2.24 2.54 4.67 2.76 2.94 4.03 2.22 2.65 3.00 3.00
Mexico 9.49 6.37 5.04 4.55 4.70 3.99 3.63 3.97 5.13 5.30 4.16 3.40 3.95 3.47 3.00 3.02
Russia 20.78 21.46 15.78 13.67 10.89 12.68 9.68 9.01 14.11 11.65 6.85 8.44 5.10 6.59 6.50 6.50
Saudi Arabia -1.13 -1.12 0.25 0.60 0.36 0.63 2.29 4.12 9.87 5.06 5.35 4.98 4.91 4.57 3.99 4.01
South Africa 5.37 5.70 9.18 5.81 1.39 3.39 4.69 7.09 11.54 7.13 4.27 5.00 5.64 5.24 4.97 4.83
Turkey 55.04 54.25 45.13 25.34 8.60 8.18 9.60 8.76 10.44 6.25 8.57 6.47 8.72 6.54 5.35 5.00
United Kingdom 0.87 1.18 1.27 1.36 1.34 2.04 2.30 2.35 3.63 2.12 3.34 4.45 2.73 1.90 1.70 1.75
G20 Economies
G20 Advanced
6.45 6.75 7.42 5.69 3.62 4.23 4.48 4.28 6.25 3.58 4.28 4.71 4.16 3.90 3.76 3.63
Economies
G20 Emerging
1.72
9.21
1.65
9.73
1.44
10.91
1.73
8.00
1.72
4.73
1.89
5.59
1.92
5.97
1.89
5.67
2.90
8.20
0.26
5.51
1.47
5.91
2.53
5.98
1.95
5.44
1.44
5.33
1.65
5.00
1.66
4.79Economies
Databook for DCH; 5th December 2012 Page 208 of 266
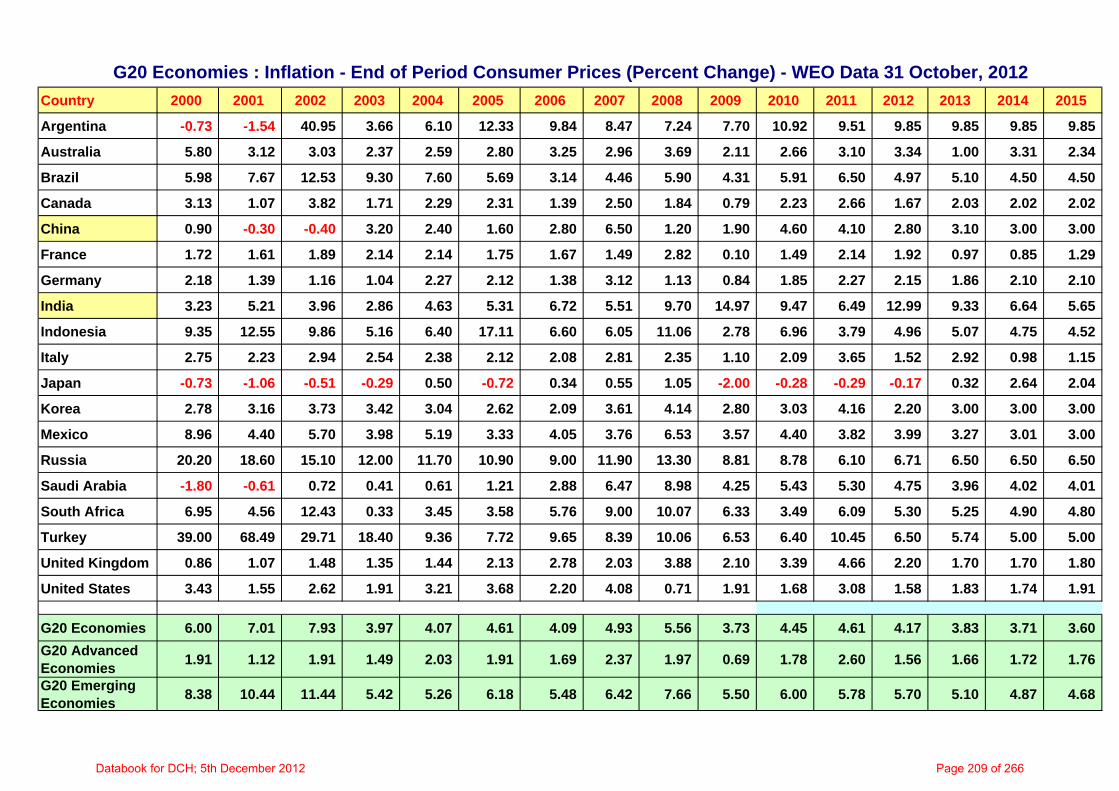
United States 3.43 1.55 2.62 1.91 3.21 3.68 2.20 4.08 0.71 1.91 1.68 3.08 1.58 1.83 1.74 1.91
G20 Economies : Inflation - End of Period Consumer Prices (Percent Change) - WEO Data 31 October, 2012
Country 2000 2001 2002 2003 2004 2005 2006 2007 2008 2009 2010 2011 2012 2013 2014 2015
Argentina -0.73 -1.54 40.95 3.66 6.10 12.33 9.84 8.47 7.24 7.70 10.92 9.51 9.85 9.85 9.85 9.85
Australia 5.80 3.12 3.03 2.37 2.59 2.80 3.25 2.96 3.69 2.11 2.66 3.10 3.34 1.00 3.31 2.34
Brazil 5.98 7.67 12.53 9.30 7.60 5.69 3.14 4.46 5.90 4.31 5.91 6.50 4.97 5.10 4.50 4.50
Canada 3.13 1.07 3.82 1.71 2.29 2.31 1.39 2.50 1.84 0.79 2.23 2.66 1.67 2.03 2.02 2.02
China 0.90 -0.30 -0.40 3.20 2.40 1.60 2.80 6.50 1.20 1.90 4.60 4.10 2.80 3.10 3.00 3.00
France 1.72 1.61 1.89 2.14 2.14 1.75 1.67 1.49 2.82 0.10 1.49 2.14 1.92 0.97 0.85 1.29
Germany 2.18 1.39 1.16 1.04 2.27 2.12 1.38 3.12 1.13 0.84 1.85 2.27 2.15 1.86 2.10 2.10
India 3.23 5.21 3.96 2.86 4.63 5.31 6.72 5.51 9.70 14.97 9.47 6.49 12.99 9.33 6.64 5.65
Indonesia 9.35 12.55 9.86 5.16 6.40 17.11 6.60 6.05 11.06 2.78 6.96 3.79 4.96 5.07 4.75 4.52
Italy 2.75 2.23 2.94 2.54 2.38 2.12 2.08 2.81 2.35 1.10 2.09 3.65 1.52 2.92 0.98 1.15
Japan -0.73 -1.06 -0.51 -0.29 0.50 -0.72 0.34 0.55 1.05 -2.00 -0.28 -0.29 -0.17 0.32 2.64 2.04
Korea 2.78 3.16 3.73 3.42 3.04 2.62 2.09 3.61 4.14 2.80 3.03 4.16 2.20 3.00 3.00 3.00
Mexico 8.96 4.40 5.70 3.98 5.19 3.33 4.05 3.76 6.53 3.57 4.40 3.82 3.99 3.27 3.01 3.00
Russia 20.20 18.60 15.10 12.00 11.70 10.90 9.00 11.90 13.30 8.81 8.78 6.10 6.71 6.50 6.50 6.50
Saudi Arabia -1.80 -0.61 0.72 0.41 0.61 1.21 2.88 6.47 8.98 4.25 5.43 5.30 4.75 3.96 4.02 4.01
South Africa 6.95 4.56 12.43 0.33 3.45 3.58 5.76 9.00 10.07 6.33 3.49 6.09 5.30 5.25 4.90 4.80
Turkey 39.00 68.49 29.71 18.40 9.36 7.72 9.65 8.39 10.06 6.53 6.40 10.45 6.50 5.74 5.00 5.00
United Kingdom 0.86 1.07 1.48 1.35 1.44 2.13 2.78 2.03 3.88 2.10 3.39 4.66 2.20 1.70 1.70 1.80
G20 Economies
G20 Advanced
6.00 7.01 7.93 3.97 4.07 4.61 4.09 4.93 5.56 3.73 4.45 4.61 4.17 3.83 3.71 3.60
Economies
G20 Emerging
1.91 1.12 1.91 1.49 2.03 1.91 1.69 2.37 1.97 0.69 1.78 2.60 1.56 1.66 1.72 1.76
Economies8.38 10.44 11.44 5.42 5.26 6.18 5.48 6.42 7.66 5.50 6.00 5.78 5.70 5.10 4.87 4.68
Databook for DCH; 5th December 2012 Page 209 of 266
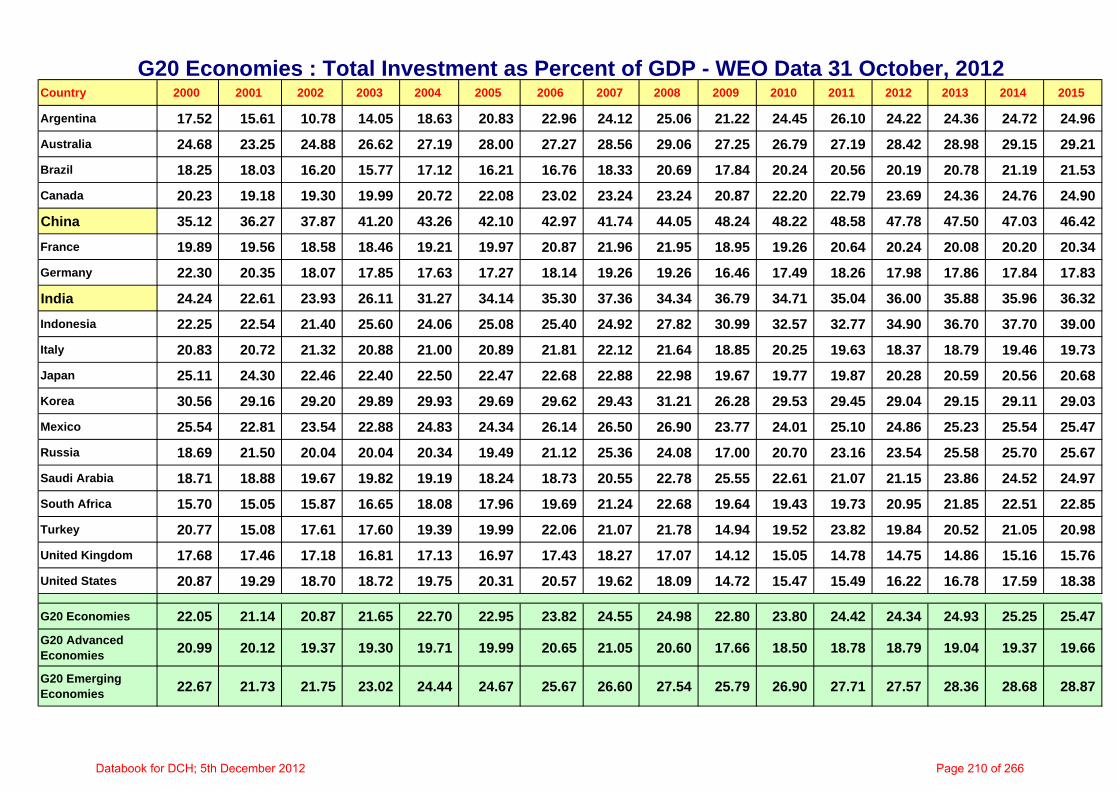
G20 Economies : Total Investment as Percent of GDP - WEO Data 31 October, 2012Country 2000 2001 2002 2003 2004 2005 2006 2007 2008 2009 2010 2011 2012 2013 2014 2015
Argentina 17.52 15.61 10.78 14.05 18.63 20.83 22.96 24.12 25.06 21.22 24.45 26.10 24.22 24.36 24.72 24.96
Australia 24.68 23.25 24.88 26.62 27.19 28.00 27.27 28.56 29.06 27.25 26.79 27.19 28.42 28.98 29.15 29.21
Brazil 18.25 18.03 16.20 15.77 17.12 16.21 16.76 18.33 20.69 17.84 20.24 20.56 20.19 20.78 21.19 21.53
Canada 20.23 19.18 19.30 19.99 20.72 22.08 23.02 23.24 23.24 20.87 22.20 22.79 23.69 24.36 24.76 24.90
China 35.12 36.27 37.87 41.20 43.26 42.10 42.97 41.74 44.05 48.24 48.22 48.58 47.78 47.50 47.03 46.42
France 19.89 19.56 18.58 18.46 19.21 19.97 20.87 21.96 21.95 18.95 19.26 20.64 20.24 20.08 20.20 20.34
Germany 22.30 20.35 18.07 17.85 17.63 17.27 18.14 19.26 19.26 16.46 17.49 18.26 17.98 17.86 17.84 17.83
India 24.24 22.61 23.93 26.11 31.27 34.14 35.30 37.36 34.34 36.79 34.71 35.04 36.00 35.88 35.96 36.32
Indonesia 22.25 22.54 21.40 25.60 24.06 25.08 25.40 24.92 27.82 30.99 32.57 32.77 34.90 36.70 37.70 39.00
Italy 20.83 20.72 21.32 20.88 21.00 20.89 21.81 22.12 21.64 18.85 20.25 19.63 18.37 18.79 19.46 19.73
Japan 25.11 24.30 22.46 22.40 22.50 22.47 22.68 22.88 22.98 19.67 19.77 19.87 20.28 20.59 20.56 20.68
Korea 30.56 29.16 29.20 29.89 29.93 29.69 29.62 29.43 31.21 26.28 29.53 29.45 29.04 29.15 29.11 29.03
Mexico 25.54 22.81 23.54 22.88 24.83 24.34 26.14 26.50 26.90 23.77 24.01 25.10 24.86 25.23 25.54 25.47
Russia 18.69 21.50 20.04 20.04 20.34 19.49 21.12 25.36 24.08 17.00 20.70 23.16 23.54 25.58 25.70 25.67
Saudi Arabia 18.71 18.88 19.67 19.82 19.19 18.24 18.73 20.55 22.78 25.55 22.61 21.07 21.15 23.86 24.52 24.97
South Africa 15.70 15.05 15.87 16.65 18.08 17.96 19.69 21.24 22.68 19.64 19.43 19.73 20.95 21.85 22.51 22.85
Turkey 20.77 15.08 17.61 17.60 19.39 19.99 22.06 21.07 21.78 14.94 19.52 23.82 19.84 20.52 21.05 20.98
United Kingdom 17.68 17.46 17.18 16.81 17.13 16.97 17.43 18.27 17.07 14.12 15.05 14.78 14.75 14.86 15.16 15.76
United States 20.87 19.29 18.70 18.72 19.75 20.31 20.57 19.62 18.09 14.72 15.47 15.49 16.22 16.78 17.59 18.38
G20 Economies
G20 Advanced
22.05 21.14 20.87 21.65 22.70 22.95 23.82 24.55 24.98 22.80 23.80 24.42 24.34 24.93 25.25 25.47
Economies
G20 Emerging
20.99 20.12 19.37 19.30 19.71 19.99 20.65 21.05 20.60 17.66 18.50 18.78 18.79 19.04 19.37 19.66
Economies22.67 21.73 21.75 23.02 24.44 24.67 25.67 26.60 27.54 25.79 26.90 27.71 27.57 28.36 28.68 28.87
Databook for DCH; 5th December 2012 Page 210 of 266
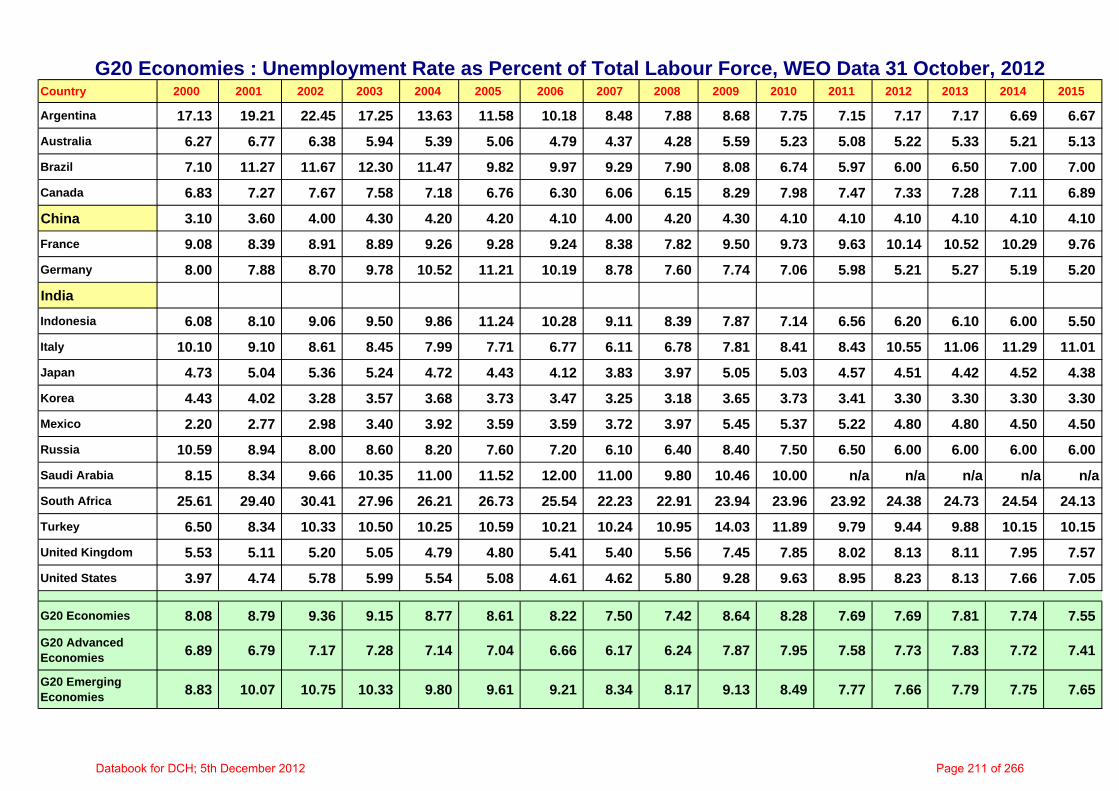
G20 Economies : Unemployment Rate as Percent of Total Labour Force, WEO Data 31 October, 2012Country 2000 2001 2002 2003 2004 2005 2006 2007 2008 2009 2010 2011 2012 2013 2014 2015
Argentina 17.13 19.21 22.45 17.25 13.63 11.58 10.18 8.48 7.88 8.68 7.75 7.15 7.17 7.17 6.69 6.67
Australia 6.27 6.77 6.38 5.94 5.39 5.06 4.79 4.37 4.28 5.59 5.23 5.08 5.22 5.33 5.21 5.13
Brazil 7.10 11.27 11.67 12.30 11.47 9.82 9.97 9.29 7.90 8.08 6.74 5.97 6.00 6.50 7.00 7.00
Canada 6.83 7.27 7.67 7.58 7.18 6.76 6.30 6.06 6.15 8.29 7.98 7.47 7.33 7.28 7.11 6.89
China 3.10 3.60 4.00 4.30 4.20 4.20 4.10 4.00 4.20 4.30 4.10 4.10 4.10 4.10 4.10 4.10
France 9.08 8.39 8.91 8.89 9.26 9.28 9.24 8.38 7.82 9.50 9.73 9.63 10.14 10.52 10.29 9.76
Germany 8.00 7.88 8.70 9.78 10.52 11.21 10.19 8.78 7.60 7.74 7.06 5.98 5.21 5.27 5.19 5.20
India
Indonesia 6.08 8.10 9.06 9.50 9.86 11.24 10.28 9.11 8.39 7.87 7.14 6.56 6.20 6.10 6.00 5.50
Italy 10.10 9.10 8.61 8.45 7.99 7.71 6.77 6.11 6.78 7.81 8.41 8.43 10.55 11.06 11.29 11.01
Japan 4.73 5.04 5.36 5.24 4.72 4.43 4.12 3.83 3.97 5.05 5.03 4.57 4.51 4.42 4.52 4.38
Korea 4.43 4.02 3.28 3.57 3.68 3.73 3.47 3.25 3.18 3.65 3.73 3.41 3.30 3.30 3.30 3.30
Mexico 2.20 2.77 2.98 3.40 3.92 3.59 3.59 3.72 3.97 5.45 5.37 5.22 4.80 4.80 4.50 4.50
Russia 10.59 8.94 8.00 8.60 8.20 7.60 7.20 6.10 6.40 8.40 7.50 6.50 6.00 6.00 6.00 6.00
Saudi Arabia 8.15 8.34 9.66 10.35 11.00 11.52 12.00 11.00 9.80 10.46 10.00 n/a n/a n/a n/a n/a
South Africa 25.61 29.40 30.41 27.96 26.21 26.73 25.54 22.23 22.91 23.94 23.96 23.92 24.38 24.73 24.54 24.13
Turkey 6.50 8.34 10.33 10.50 10.25 10.59 10.21 10.24 10.95 14.03 11.89 9.79 9.44 9.88 10.15 10.15
United Kingdom 5.53 5.11 5.20 5.05 4.79 4.80 5.41 5.40 5.56 7.45 7.85 8.02 8.13 8.11 7.95 7.57
United States 3.97 4.74 5.78 5.99 5.54 5.08 4.61 4.62 5.80 9.28 9.63 8.95 8.23 8.13 7.66 7.05
G20 Economies
G20 Advanced
8.08 8.79 9.36 9.15 8.77 8.61 8.22 7.50 7.42 8.64 8.28 7.69 7.69 7.81 7.74 7.55
Economies
G20 Emerging
6.89 6.79 7.17 7.28 7.14 7.04 6.66 6.17 6.24 7.87 7.95 7.58 7.73 7.83 7.72 7.41
Economies8.83 10.07 10.75 10.33 9.80 9.61 9.21 8.34 8.17 9.13 8.49 7.77 7.66 7.79 7.75 7.65
Databook for DCH; 5th December 2012 Page 211 of 266
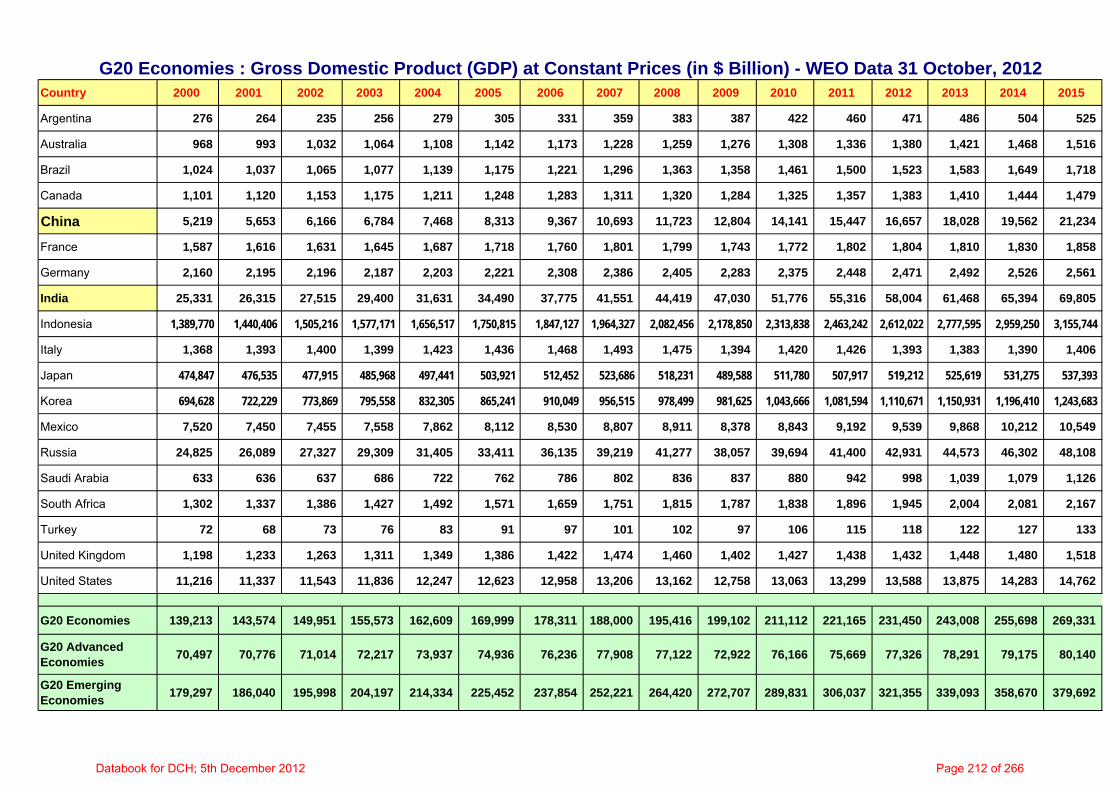
G20 Economies : Gross Domestic Product (GDP) at Constant Prices (in $ Billion) - WEO Data 31 October, 2012
Country 2000 2001 2002 2003 2004 2005 2006 2007 2008 2009 2010 2011 2012 2013 2014 2015
Argentina 276 264 235 256 279 305 331 359 383 387 422 460 471 486 504 525
Australia 968 993 1,032 1,064 1,108 1,142 1,173 1,228 1,259 1,276 1,308 1,336 1,380 1,421 1,468 1,516
Brazil 1,024 1,037 1,065 1,077 1,139 1,175 1,221 1,296 1,363 1,358 1,461 1,500 1,523 1,583 1,649 1,718
Canada 1,101 1,120 1,153 1,175 1,211 1,248 1,283 1,311 1,320 1,284 1,325 1,357 1,383 1,410 1,444 1,479
China 5,219 5,653 6,166 6,784 7,468 8,313 9,367 10,693 11,723 12,804 14,141 15,447 16,657 18,028 19,562 21,234
France 1,587 1,616 1,631 1,645 1,687 1,718 1,760 1,801 1,799 1,743 1,772 1,802 1,804 1,810 1,830 1,858
Germany 2,160 2,195 2,196 2,187 2,203 2,221 2,308 2,386 2,405 2,283 2,375 2,448 2,471 2,492 2,526 2,561
India 25,331 26,315 27,515 29,400 31,631 34,490 37,775 41,551 44,419 47,030 51,776 55,316 58,004 61,468 65,394 69,805
Indonesia 1,389,770 1,440,406 1,505,216 1,577,171 1,656,517 1,750,815 1,847,127 1,964,327 2,082,456 2,178,850 2,313,838 2,463,242 2,612,022 2,777,595 2,959,250 3,155,744
Italy 1,368 1,393 1,400 1,399 1,423 1,436 1,468 1,493 1,475 1,394 1,420 1,426 1,393 1,383 1,390 1,406
Japan 474,847 476,535 477,915 485,968 497,441 503,921 512,452 523,686 518,231 489,588 511,780 507,917 519,212 525,619 531,275 537,393
Korea 694,628 722,229 773,869 795,558 832,305 865,241 910,049 956,515 978,499 981,625 1,043,666 1,081,594 1,110,671 1,150,931 1,196,410 1,243,683
Mexico 7,520 7,450 7,455 7,558 7,862 8,112 8,530 8,807 8,911 8,378 8,843 9,192 9,539 9,868 10,212 10,549
Russia 24,825 26,089 27,327 29,309 31,405 33,411 36,135 39,219 41,277 38,057 39,694 41,400 42,931 44,573 46,302 48,108
Saudi Arabia 633 636 637 686 722 762 786 802 836 837 880 942 998 1,039 1,079 1,126
South Africa 1,302 1,337 1,386 1,427 1,492 1,571 1,659 1,751 1,815 1,787 1,838 1,896 1,945 2,004 2,081 2,167
Turkey 72 68 73 76 83 91 97 101 102 97 106 115 118 122 127 133
United Kingdom 1,198 1,233 1,263 1,311 1,349 1,386 1,422 1,474 1,460 1,402 1,427 1,438 1,432 1,448 1,480 1,518
United States 11,216 11,337 11,543 11,836 12,247 12,623 12,958 13,206 13,162 12,758 13,063 13,299 13,588 13,875 14,283 14,762
G20 Economies
G20 Advanced
139,213 143,574 149,951 155,573 162,609 169,999 178,311 188,000 195,416 199,102 211,112 221,165 231,450 243,008 255,698 269,331
Economies70,497 70,776 71,014 72,217 73,937 74,936 76,236 77,908 77,122 72,922 76,166 75,669 77,326 78,291 79,175 80,140
G20 Emerging
Economies179,297 186,040 195,998 204,197 214,334 225,452 237,854 252,221 264,420 272,707 289,831 306,037 321,355 339,093 358,670 379,692
Databook for DCH; 5th December 2012 Page 212 of 266
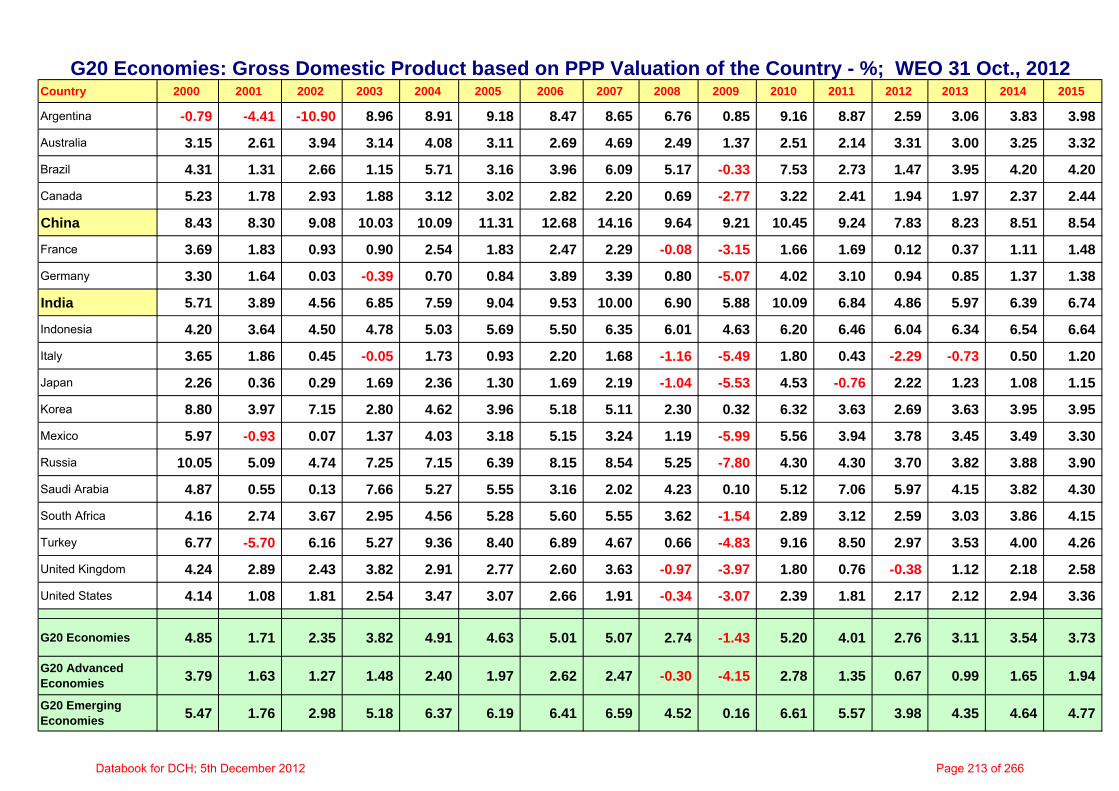
G20 Economies: Gross Domestic Product based on PPP Valuation of the Country - %; WEO 31 Oct., 2012Country 2000 2001 2002 2003 2004 2005 2006 2007 2008 2009 2010 2011 2012 2013 2014 2015
Argentina -0.79 -4.41 -10.90 8.96 8.91 9.18 8.47 8.65 6.76 0.85 9.16 8.87 2.59 3.06 3.83 3.98
Australia 3.15 2.61 3.94 3.14 4.08 3.11 2.69 4.69 2.49 1.37 2.51 2.14 3.31 3.00 3.25 3.32
Brazil 4.31 1.31 2.66 1.15 5.71 3.16 3.96 6.09 5.17 -0.33 7.53 2.73 1.47 3.95 4.20 4.20
Canada 5.23 1.78 2.93 1.88 3.12 3.02 2.82 2.20 0.69 -2.77 3.22 2.41 1.94 1.97 2.37 2.44
China 8.43 8.30 9.08 10.03 10.09 11.31 12.68 14.16 9.64 9.21 10.45 9.24 7.83 8.23 8.51 8.54
France 3.69 1.83 0.93 0.90 2.54 1.83 2.47 2.29 -0.08 -3.15 1.66 1.69 0.12 0.37 1.11 1.48
Germany 3.30 1.64 0.03 -0.39 0.70 0.84 3.89 3.39 0.80 -5.07 4.02 3.10 0.94 0.85 1.37 1.38
India 5.71 3.89 4.56 6.85 7.59 9.04 9.53 10.00 6.90 5.88 10.09 6.84 4.86 5.97 6.39 6.74
Indonesia 4.20 3.64 4.50 4.78 5.03 5.69 5.50 6.35 6.01 4.63 6.20 6.46 6.04 6.34 6.54 6.64
Italy 3.65 1.86 0.45 -0.05 1.73 0.93 2.20 1.68 -1.16 -5.49 1.80 0.43 -2.29 -0.73 0.50 1.20
Japan 2.26 0.36 0.29 1.69 2.36 1.30 1.69 2.19 -1.04 -5.53 4.53 -0.76 2.22 1.23 1.08 1.15
Korea 8.80 3.97 7.15 2.80 4.62 3.96 5.18 5.11 2.30 0.32 6.32 3.63 2.69 3.63 3.95 3.95
Mexico 5.97 -0.93 0.07 1.37 4.03 3.18 5.15 3.24 1.19 -5.99 5.56 3.94 3.78 3.45 3.49 3.30
Russia 10.05 5.09 4.74 7.25 7.15 6.39 8.15 8.54 5.25 -7.80 4.30 4.30 3.70 3.82 3.88 3.90
Saudi Arabia 4.87 0.55 0.13 7.66 5.27 5.55 3.16 2.02 4.23 0.10 5.12 7.06 5.97 4.15 3.82 4.30
South Africa 4.16 2.74 3.67 2.95 4.56 5.28 5.60 5.55 3.62 -1.54 2.89 3.12 2.59 3.03 3.86 4.15
Turkey 6.77 -5.70 6.16 5.27 9.36 8.40 6.89 4.67 0.66 -4.83 9.16 8.50 2.97 3.53 4.00 4.26
United Kingdom 4.24 2.89 2.43 3.82 2.91 2.77 2.60 3.63 -0.97 -3.97 1.80 0.76 -0.38 1.12 2.18 2.58
United States 4.14 1.08 1.81 2.54 3.47 3.07 2.66 1.91 -0.34 -3.07 2.39 1.81 2.17 2.12 2.94 3.36
G20 Economies 4.85 1.71 2.35 3.82 4.91 4.63 5.01 5.07 2.74 -1.43 5.20 4.01 2.76 3.11 3.54 3.73
G20 Advanced
Economies3.79 1.63 1.27 1.48 2.40 1.97 2.62 2.47 -0.30 -4.15 2.78 1.35 0.67 0.99 1.65 1.94
G20 Emerging
Economies5.47 1.76 2.98 5.18 6.37 6.19 6.41 6.59 4.52 0.16 6.61 5.57 3.98 4.35 4.64 4.77
Databook for DCH; 5th December 2012 Page 213 of 266
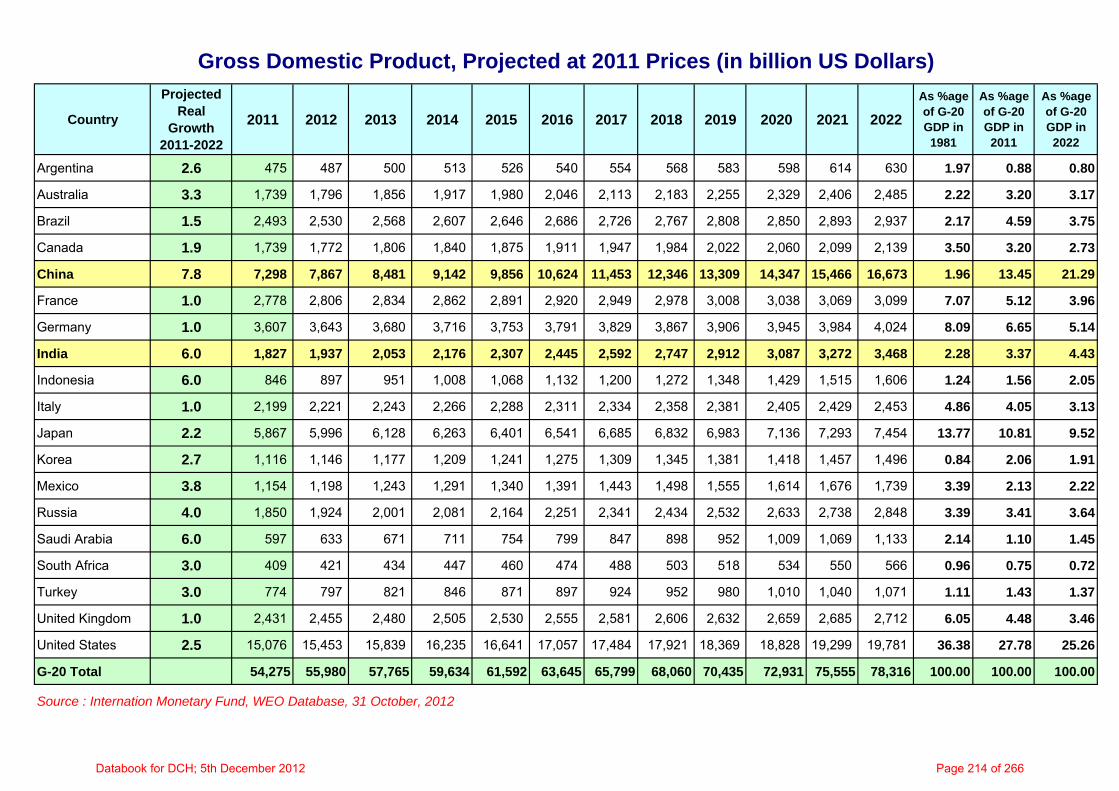
Gross Domestic Product, Projected at 2011 Prices (in billion US Dollars)
Country
Projected
Real
Growth
2011-2022
2011 2012 2013 2014 2015 2016 2017 2018 2019 2020 2021 2022
As %age
of G-20
GDP in
1981
As %age
of G-20
GDP in
2011
As %age
of G-20
GDP in
2022
Argentina 2.6 475 487 500 513 526 540 554 568 583 598 614 630 1.97 0.88 0.80
Australia 3.3 1,739 1,796 1,856 1,917 1,980 2,046 2,113 2,183 2,255 2,329 2,406 2,485 2.22 3.20 3.17
Brazil 1.5 2,493 2,530 2,568 2,607 2,646 2,686 2,726 2,767 2,808 2,850 2,893 2,937 2.17 4.59 3.75
Canada 1.9 1,739 1,772 1,806 1,840 1,875 1,911 1,947 1,984 2,022 2,060 2,099 2,139 3.50 3.20 2.73
China 7.8 7,298 7,867 8,481 9,142 9,856 10,624 11,453 12,346 13,309 14,347 15,466 16,673 1.96 13.45 21.29
France 1.0 2,778 2,806 2,834 2,862 2,891 2,920 2,949 2,978 3,008 3,038 3,069 3,099 7.07 5.12 3.96
Germany 1.0 3,607 3,643 3,680 3,716 3,753 3,791 3,829 3,867 3,906 3,945 3,984 4,024 8.09 6.65 5.14
India 6.0 1,827 1,937 2,053 2,176 2,307 2,445 2,592 2,747 2,912 3,087 3,272 3,468 2.28 3.37 4.43
Indonesia 6.0 846 897 951 1,008 1,068 1,132 1,200 1,272 1,348 1,429 1,515 1,606 1.24 1.56 2.05
Italy 1.0 2,199 2,221 2,243 2,266 2,288 2,311 2,334 2,358 2,381 2,405 2,429 2,453 4.86 4.05 3.13
Japan 2.2 5,867 5,996 6,128 6,263 6,401 6,541 6,685 6,832 6,983 7,136 7,293 7,454 13.77 10.81 9.52
Korea 2.7 1,116 1,146 1,177 1,209 1,241 1,275 1,309 1,345 1,381 1,418 1,457 1,496 0.84 2.06 1.91
Mexico 3.8 1,154 1,198 1,243 1,291 1,340 1,391 1,443 1,498 1,555 1,614 1,676 1,739 3.39 2.13 2.22
Russia 4.0 1,850 1,924 2,001 2,081 2,164 2,251 2,341 2,434 2,532 2,633 2,738 2,848 3.39 3.41 3.64
Saudi Arabia 6.0 597 633 671 711 754 799 847 898 952 1,009 1,069 1,133 2.14 1.10 1.45
South Africa 3.0 409 421 434 447 460 474 488 503 518 534 550 566 0.96 0.75 0.72
Turkey 3.0 774 797 821 846 871 897 924 952 980 1,010 1,040 1,071 1.11 1.43 1.37
United Kingdom 1.0 2,431 2,455 2,480 2,505 2,530 2,555 2,581 2,606 2,632 2,659 2,685 2,712 6.05 4.48 3.46
United States 2.5 15,076 15,453 15,839 16,235 16,641 17,057 17,484 17,921 18,369 18,828 19,299 19,781 36.38 27.78 25.26
G-20 Total 54,275 55,980 57,765 59,634 61,592 63,645 65,799 68,060 70,435 72,931 75,555 78,316 100.00 100.00 100.00
Source : Internation Monetary Fund, WEO Database, 31 October, 2012
Databook for DCH; 5th December 2012 Page 214 of 266
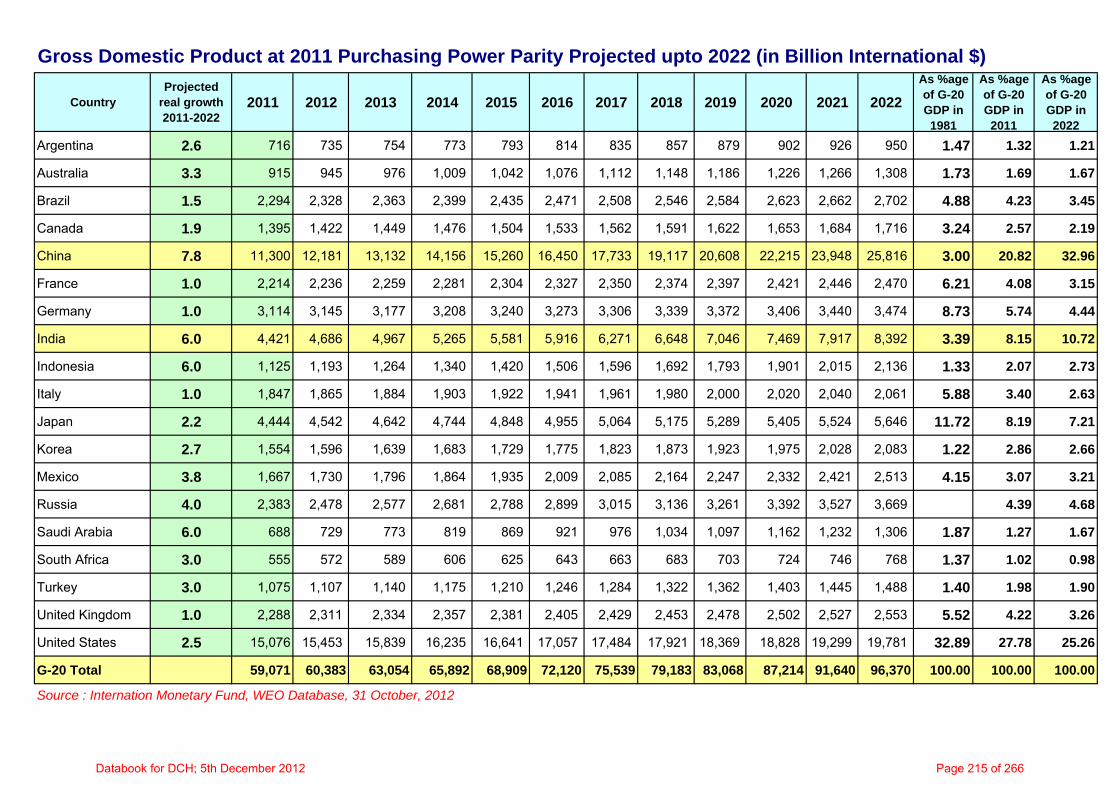
Gross Domestic Product at 2011 Purchasing Power Parity Projected upto 2022 (in Billion International $)
Country
Projected
real growth
2011-2022
2011 2012 2013 2014 2015 2016 2017 2018 2019 2020 2021 2022
As %age
of G-20
GDP in
1981
As %age
of G-20
GDP in
2011
As %age
of G-20
GDP in
2022
Argentina 2.6 716 735 754 773 793 814 835 857 879 902 926 950 1.47 1.32 1.21
Australia 3.3 915 945 976 1,009 1,042 1,076 1,112 1,148 1,186 1,226 1,266 1,308 1.73 1.69 1.67
Brazil 1.5 2,294 2,328 2,363 2,399 2,435 2,471 2,508 2,546 2,584 2,623 2,662 2,702 4.88 4.23 3.45
Canada 1.9 1,395 1,422 1,449 1,476 1,504 1,533 1,562 1,591 1,622 1,653 1,684 1,716 3.24 2.57 2.19
China 7.8 11,300 12,181 13,132 14,156 15,260 16,450 17,733 19,117 20,608 22,215 23,948 25,816 3.00 20.82 32.96
France 1.0 2,214 2,236 2,259 2,281 2,304 2,327 2,350 2,374 2,397 2,421 2,446 2,470 6.21 4.08 3.15
Germany 1.0 3,114 3,145 3,177 3,208 3,240 3,273 3,306 3,339 3,372 3,406 3,440 3,474 8.73 5.74 4.44
India 6.0 4,421 4,686 4,967 5,265 5,581 5,916 6,271 6,648 7,046 7,469 7,917 8,392 3.39 8.15 10.72
Indonesia 6.0 1,125 1,193 1,264 1,340 1,420 1,506 1,596 1,692 1,793 1,901 2,015 2,136 1.33 2.07 2.73
Italy 1.0 1,847 1,865 1,884 1,903 1,922 1,941 1,961 1,980 2,000 2,020 2,040 2,061 5.88 3.40 2.63
Japan 2.2 4,444 4,542 4,642 4,744 4,848 4,955 5,064 5,175 5,289 5,405 5,524 5,646 11.72 8.19 7.21
Korea 2.7 1,554 1,596 1,639 1,683 1,729 1,775 1,823 1,873 1,923 1,975 2,028 2,083 1.22 2.86 2.66
Mexico 3.8 1,667 1,730 1,796 1,864 1,935 2,009 2,085 2,164 2,247 2,332 2,421 2,513 4.15 3.07 3.21
Russia 4.0 2,383 2,478 2,577 2,681 2,788 2,899 3,015 3,136 3,261 3,392 3,527 3,669 4.39 4.68
Saudi Arabia 6.0 688 729 773 819 869 921 976 1,034 1,097 1,162 1,232 1,306 1.87 1.27 1.67
South Africa 3.0 555 572 589 606 625 643 663 683 703 724 746 768 1.37 1.02 0.98
Turkey 3.0 1,075 1,107 1,140 1,175 1,210 1,246 1,284 1,322 1,362 1,403 1,445 1,488 1.40 1.98 1.90
United Kingdom 1.0 2,288 2,311 2,334 2,357 2,381 2,405 2,429 2,453 2,478 2,502 2,527 2,553 5.52 4.22 3.26
United States 2.5 15,076 15,453 15,839 16,235 16,641 17,057 17,484 17,921 18,369 18,828 19,299 19,781 32.89 27.78 25.26
G-20 Total 59,071 60,383 63,054 65,892 68,909 72,120 75,539 79,183 83,068 87,214 91,640 96,370 100.00 100.00 100.00
Source : Internation Monetary Fund, WEO Database, 31 October, 2012
Databook for DCH; 5th December 2012 Page 215 of 266
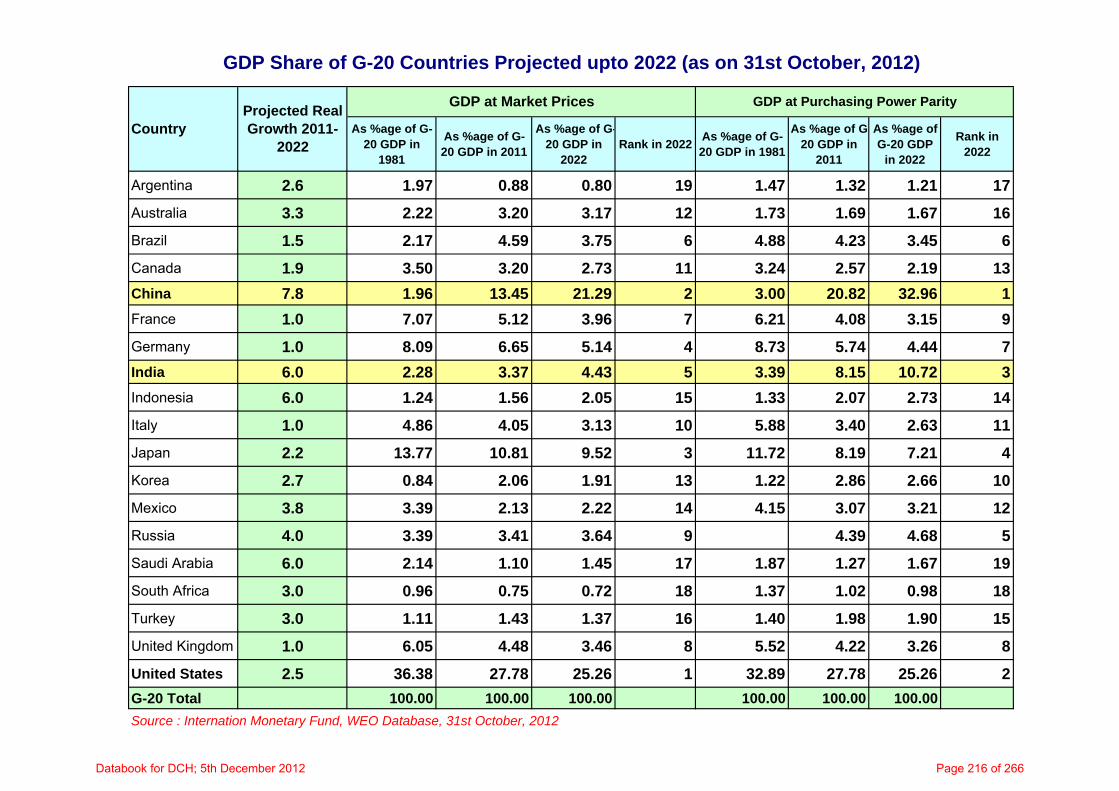
-
GDP Share of G-20 Countries Projected upto 2022 (as on 31st October, 2012)
Country
Projected Real
Growth 2011-
2022
GDP at Market Prices GDP at Purchasing Power Parity
As %age of G-
20 GDP in
1981
As %age of G-
20 GDP in 2011
As %age of G
20 GDP in
2022
Rank in 2022As %age of G-
20 GDP in 1981
As %age of G
20 GDP in
2011
-As %age of
G-20 GDP
in 2022
Rank in
2022
Argentina 2.6 1.97 0.88 0.80 19 1.47 1.32 1.21 17
Australia 3.3 2.22 3.20 3.17 12 1.73 1.69 1.67 16
Brazil 1.5 2.17 4.59 3.75 6 4.88 4.23 3.45 6
Canada 1.9 3.50 3.20 2.73 11 3.24 2.57 2.19 13
China 7.8 1.96 13.45 21.29 2 3.00 20.82 32.96 1
France 1.0 7.07 5.12 3.96 7 6.21 4.08 3.15 9
Germany 1.0 8.09 6.65 5.14 4 8.73 5.74 4.44 7
India 6.0 2.28 3.37 4.43 5 3.39 8.15 10.72 3
Indonesia 6.0 1.24 1.56 2.05 15 1.33 2.07 2.73 14
Italy 1.0 4.86 4.05 3.13 10 5.88 3.40 2.63 11
Japan 2.2 13.77 10.81 9.52 3 11.72 8.19 7.21 4
Korea 2.7 0.84 2.06 1.91 13 1.22 2.86 2.66 10
Mexico 3.8 3.39 2.13 2.22 14 4.15 3.07 3.21 12
Russia 4.0 3.39 3.41 3.64 9 4.39 4.68 5
Saudi Arabia 6.0 2.14 1.10 1.45 17 1.87 1.27 1.67 19
South Africa 3.0 0.96 0.75 0.72 18 1.37 1.02 0.98 18
Turkey 3.0 1.11 1.43 1.37 16 1.40 1.98 1.90 15
United Kingdom 1.0 6.05 4.48 3.46 8 5.52 4.22 3.26 8
United States 2.5 36.38 27.78 25.26 1 32.89 27.78 25.26 2
G-20 Total 100.00 100.00 100.00 100.00 100.00 100.00
Source : Internation Monetary Fund, WEO Database, 31st October, 2012
Databook for DCH; 5th December 2012 Page 216 of 266
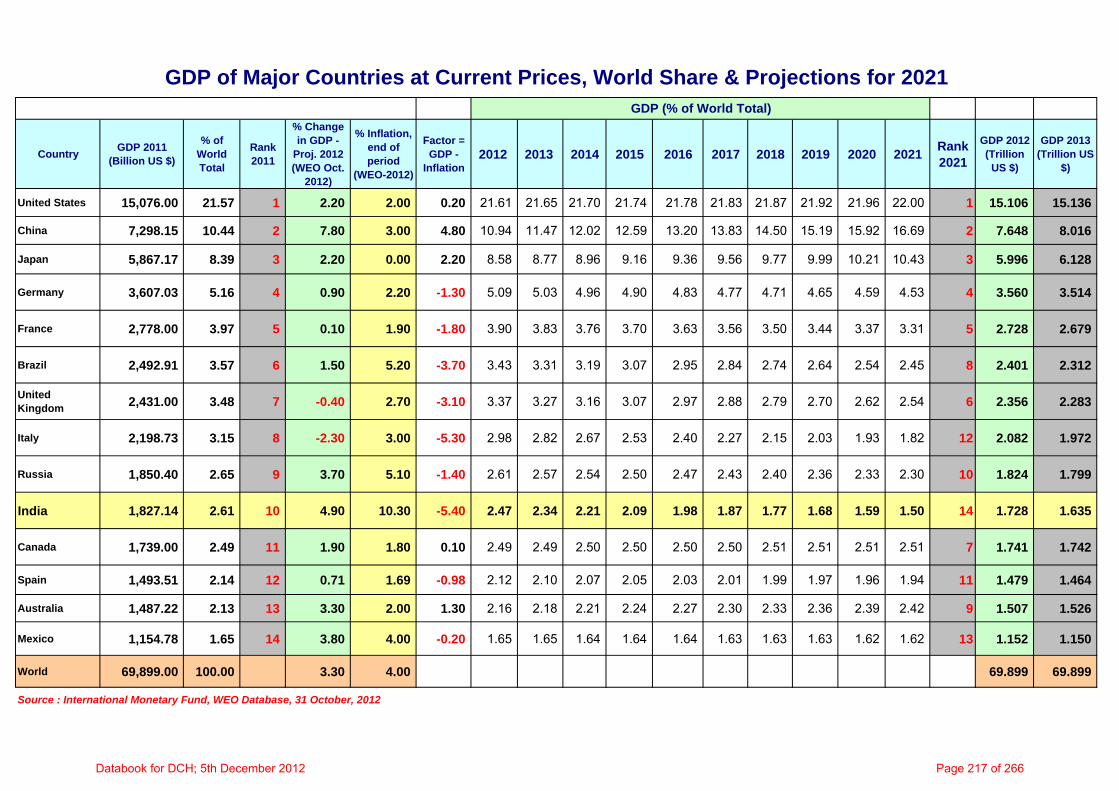
GDP of Major Countries at Current Prices, World Share & Projections for 2021
GDP (% of World Total)
CountryGDP 2011
(Billion US $)
% of
World
Total
Rank
2011
% Change
in GDP -
Proj. 2012
(WEO Oct.
2012)
% Inflation,
end of
period
(WEO-2012)
Factor =
GDP -
Inflation
2012 2013 2014 2015 2016 2017 2018 2019 2020 2021 Rank
2021
GDP 2012
(Trillion
US $)
GDP 2013
(Trillion US
$)
United States 15,076.00 21.57 1 2.20 2.00 0.20 21.61 21.65 21.70 21.74 21.78 21.83 21.87 21.92 21.96 22.00 1 15.106 15.136
China 7,298.15 10.44 2 7.80 3.00 4.80 10.94 11.47 12.02 12.59 13.20 13.83 14.50 15.19 15.92 16.69 2 7.648 8.016
Japan 5,867.17 8.39 3 2.20 0.00 2.20 8.58 8.77 8.96 9.16 9.36 9.56 9.77 9.99 10.21 10.43 3 5.996 6.128
Germany 3,607.03 5.16 4 0.90 2.20 -1.30 5.09 5.03 4.96 4.90 4.83 4.77 4.71 4.65 4.59 4.53 4 3.560 3.514
France 2,778.00 3.97 5 0.10 1.90 -1.80 3.90 3.83 3.76 3.70 3.63 3.56 3.50 3.44 3.37 3.31 5 2.728 2.679
Brazil 2,492.91 3.57 6 1.50 5.20 -3.70 3.43 3.31 3.19 3.07 2.95 2.84 2.74 2.64 2.54 2.45 8 2.401 2.312
United
Kingdom2,431.00 3.48 7 -0.40 2.70 -3.10 3.37 3.27 3.16 3.07 2.97 2.88 2.79 2.70 2.62 2.54 6 2.356 2.283
Italy 2,198.73 3.15 8 -2.30 3.00 -5.30 2.98 2.82 2.67 2.53 2.40 2.27 2.15 2.03 1.93 1.82 12 2.082 1.972
Russia 1,850.40 2.65 9 3.70 5.10 -1.40 2.61 2.57 2.54 2.50 2.47 2.43 2.40 2.36 2.33 2.30 10 1.824 1.799
India 1,827.14 2.61 10 4.90 10.30 -5.40 2.47 2.34 2.21 2.09 1.98 1.87 1.77 1.68 1.59 1.50 14 1.728 1.635
Canada 1,739.00 2.49 11 1.90 1.80 0.10 2.49 2.49 2.50 2.50 2.50 2.50 2.51 2.51 2.51 2.51 7 1.741 1.742
Spain 1,493.51 2.14 12 0.71 1.69 -0.98 2.12 2.10 2.07 2.05 2.03 2.01 1.99 1.97 1.96 1.94 11 1.479 1.464
Australia 1,487.22 2.13 13 3.30 2.00 1.30 2.16 2.18 2.21 2.24 2.27 2.30 2.33 2.36 2.39 2.42 9 1.507 1.526
Mexico 1,154.78 1.65 14 3.80 4.00 -0.20 1.65 1.65 1.64 1.64 1.64 1.63 1.63 1.63 1.62 1.62 13 1.152 1.150
World 69,899.00 100.00 3.30 4.00 69.899 69.899
Source : International Monetary Fund, WEO Database, 31 October, 2012
Databook for DCH; 5th December 2012 Page 217 of 266
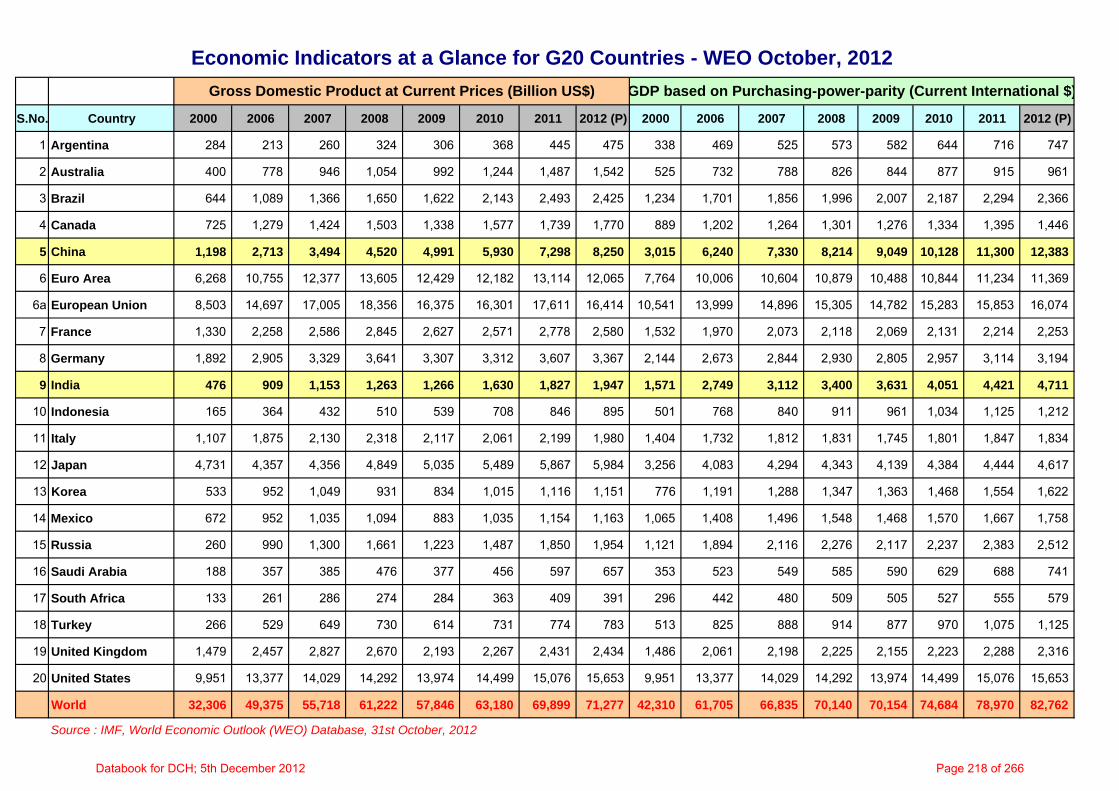
)
Economic Indicators at a Glance for G20 Countries - WEO October, 2012
Gross Domestic Product at Current Prices (Billion US$) GDP based on Purchasing-power-parity (Current International $
S.No. Country 2000 2006 2007 2008 2009 2010 2011 2012 (P) 2000 2006 2007 2008 2009 2010 2011 2012 (P)
1 Argentina 284 213 260 324 306 368 445 475 338 469 525 573 582 644 716 747
2 Australia 400 778 946 1,054 992 1,244 1,487 1,542 525 732 788 826 844 877 915 961
3 Brazil 644 1,089 1,366 1,650 1,622 2,143 2,493 2,425 1,234 1,701 1,856 1,996 2,007 2,187 2,294 2,366
4 Canada 725 1,279 1,424 1,503 1,338 1,577 1,739 1,770 889 1,202 1,264 1,301 1,276 1,334 1,395 1,446
5 China 1,198 2,713 3,494 4,520 4,991 5,930 7,298 8,250 3,015 6,240 7,330 8,214 9,049 10,128 11,300 12,383
6 Euro Area 6,268 10,755 12,377 13,605 12,429 12,182 13,114 12,065 7,764 10,006 10,604 10,879 10,488 10,844 11,234 11,369
6a European Union 8,503 14,697 17,005 18,356 16,375 16,301 17,611 16,414 10,541 13,999 14,896 15,305 14,782 15,283 15,853 16,074
7 France 1,330 2,258 2,586 2,845 2,627 2,571 2,778 2,580 1,532 1,970 2,073 2,118 2,069 2,131 2,214 2,253
8 Germany 1,892 2,905 3,329 3,641 3,307 3,312 3,607 3,367 2,144 2,673 2,844 2,930 2,805 2,957 3,114 3,194
9 India 476 909 1,153 1,263 1,266 1,630 1,827 1,947 1,571 2,749 3,112 3,400 3,631 4,051 4,421 4,711
10 Indonesia 165 364 432 510 539 708 846 895 501 768 840 911 961 1,034 1,125 1,212
11 Italy 1,107 1,875 2,130 2,318 2,117 2,061 2,199 1,980 1,404 1,732 1,812 1,831 1,745 1,801 1,847 1,834
12 Japan 4,731 4,357 4,356 4,849 5,035 5,489 5,867 5,984 3,256 4,083 4,294 4,343 4,139 4,384 4,444 4,617
13 Korea 533 952 1,049 931 834 1,015 1,116 1,151 776 1,191 1,288 1,347 1,363 1,468 1,554 1,622
14 Mexico 672 952 1,035 1,094 883 1,035 1,154 1,163 1,065 1,408 1,496 1,548 1,468 1,570 1,667 1,758
15 Russia 260 990 1,300 1,661 1,223 1,487 1,850 1,954 1,121 1,894 2,116 2,276 2,117 2,237 2,383 2,512
16 Saudi Arabia 188 357 385 476 377 456 597 657 353 523 549 585 590 629 688 741
17 South Africa 133 261 286 274 284 363 409 391 296 442 480 509 505 527 555 579
18 Turkey 266 529 649 730 614 731 774 783 513 825 888 914 877 970 1,075 1,125
19 United Kingdom 1,479 2,457 2,827 2,670 2,193 2,267 2,431 2,434 1,486 2,061 2,198 2,225 2,155 2,223 2,288 2,316
20 United States 9,951 13,377 14,029 14,292 13,974 14,499 15,076 15,653 9,951 13,377 14,029 14,292 13,974 14,499 15,076 15,653
World 32,306 49,375 55,718 61,222 57,846 63,180 69,899 71,277 42,310 61,705 66,835 70,140 70,154 74,684 78,970 82,762
Source : IMF, World Economic Outlook (WEO) Database, 31st October, 2012
Databook for DCH; 5th December 2012 Page 218 of 266
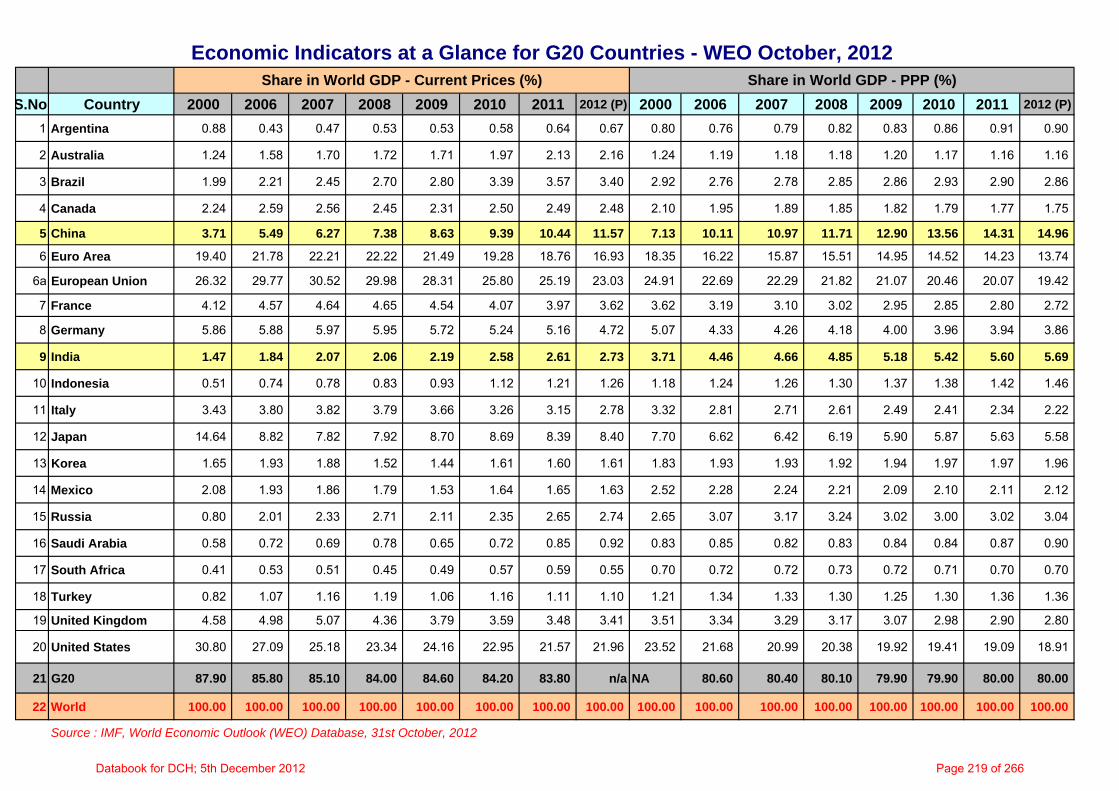
S
Economic Indicators at a Glance for G20 Countries - WEO October, 2012
Share in World GDP - Current Prices (%) Share in World GDP - PPP (%)
.No Country 2000 2006 2007 2008 2009 2010 2011 2012 (P) 2000 2006 2007 2008 2009 2010 2011 2012 (P)
1 Argentina 0.88 0.43 0.47 0.53 0.53 0.58 0.64 0.67 0.80 0.76 0.79 0.82 0.83 0.86 0.91 0.90
2 Australia 1.24 1.58 1.70 1.72 1.71 1.97 2.13 2.16 1.24 1.19 1.18 1.18 1.20 1.17 1.16 1.16
3 Brazil 1.99 2.21 2.45 2.70 2.80 3.39 3.57 3.40 2.92 2.76 2.78 2.85 2.86 2.93 2.90 2.86
4 Canada 2.24 2.59 2.56 2.45 2.31 2.50 2.49 2.48 2.10 1.95 1.89 1.85 1.82 1.79 1.77 1.75
5 China 3.71 5.49 6.27 7.38 8.63 9.39 10.44 11.57 7.13 10.11 10.97 11.71 12.90 13.56 14.31 14.96
6 Euro Area 19.40 21.78 22.21 22.22 21.49 19.28 18.76 16.93 18.35 16.22 15.87 15.51 14.95 14.52 14.23 13.74
6a European Union 26.32 29.77 30.52 29.98 28.31 25.80 25.19 23.03 24.91 22.69 22.29 21.82 21.07 20.46 20.07 19.42
7 France 4.12 4.57 4.64 4.65 4.54 4.07 3.97 3.62 3.62 3.19 3.10 3.02 2.95 2.85 2.80 2.72
8 Germany 5.86 5.88 5.97 5.95 5.72 5.24 5.16 4.72 5.07 4.33 4.26 4.18 4.00 3.96 3.94 3.86
9 India 1.47 1.84 2.07 2.06 2.19 2.58 2.61 2.73 3.71 4.46 4.66 4.85 5.18 5.42 5.60 5.69
10 Indonesia 0.51 0.74 0.78 0.83 0.93 1.12 1.21 1.26 1.18 1.24 1.26 1.30 1.37 1.38 1.42 1.46
11 Italy 3.43 3.80 3.82 3.79 3.66 3.26 3.15 2.78 3.32 2.81 2.71 2.61 2.49 2.41 2.34 2.22
12 Japan 14.64 8.82 7.82 7.92 8.70 8.69 8.39 8.40 7.70 6.62 6.42 6.19 5.90 5.87 5.63 5.58
13 Korea 1.65 1.93 1.88 1.52 1.44 1.61 1.60 1.61 1.83 1.93 1.93 1.92 1.94 1.97 1.97 1.96
14 Mexico 2.08 1.93 1.86 1.79 1.53 1.64 1.65 1.63 2.52 2.28 2.24 2.21 2.09 2.10 2.11 2.12
15 Russia 0.80 2.01 2.33 2.71 2.11 2.35 2.65 2.74 2.65 3.07 3.17 3.24 3.02 3.00 3.02 3.04
16 Saudi Arabia 0.58 0.72 0.69 0.78 0.65 0.72 0.85 0.92 0.83 0.85 0.82 0.83 0.84 0.84 0.87 0.90
17 South Africa 0.41 0.53 0.51 0.45 0.49 0.57 0.59 0.55 0.70 0.72 0.72 0.73 0.72 0.71 0.70 0.70
18 Turkey 0.82 1.07 1.16 1.19 1.06 1.16 1.11 1.10 1.21 1.34 1.33 1.30 1.25 1.30 1.36 1.36
19 United Kingdom 4.58 4.98 5.07 4.36 3.79 3.59 3.48 3.41 3.51 3.34 3.29 3.17 3.07 2.98 2.90 2.80
20 United States 30.80 27.09 25.18 23.34 24.16 22.95 21.57 21.96 23.52 21.68 20.99 20.38 19.92 19.41 19.09 18.91
21 G20 87.90 85.80 85.10 84.00 84.60 84.20 83.80 n/a NA 80.60 80.40 80.10 79.90 79.90 80.00 80.00
22 World 100.00 100.00 100.00 100.00 100.00 100.00 100.00 100.00 100.00 100.00 100.00 100.00 100.00 100.00 100.00 100.00
Source : IMF, World Economic Outlook (WEO) Database, 31st October, 2012
Databook for DCH; 5th December 2012 Page 219 of 266
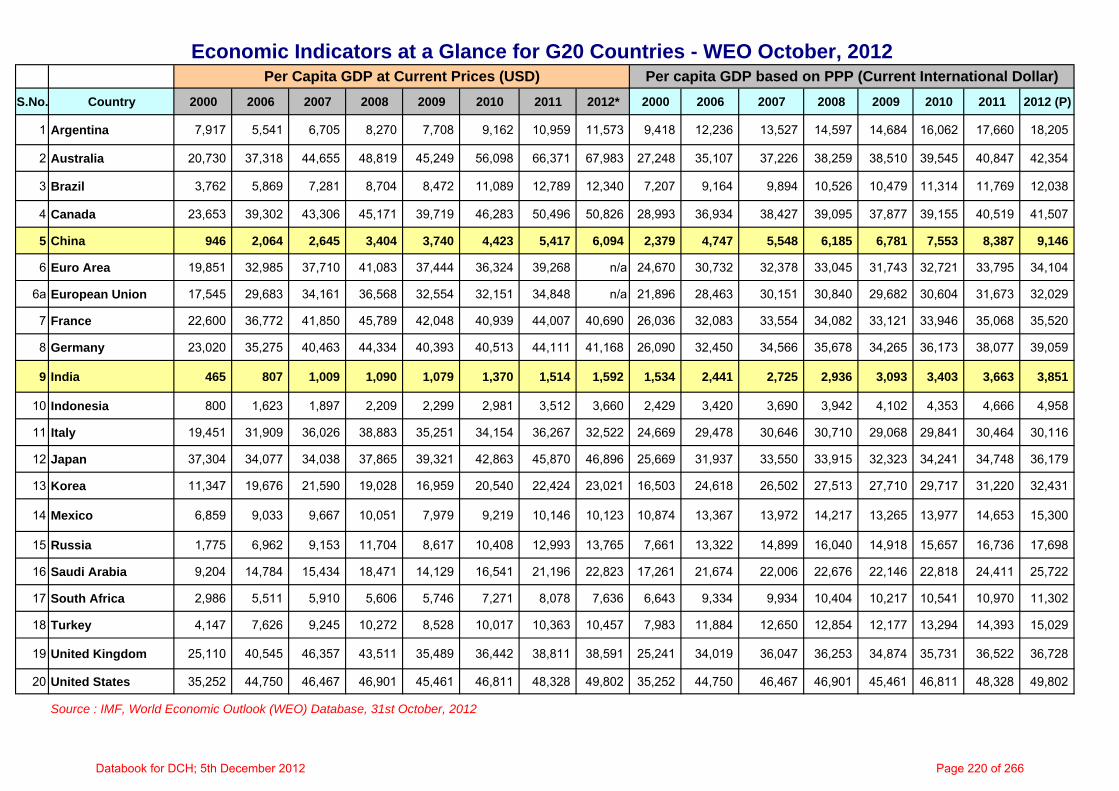
Economic Indicators at a Glance for G20 Countries - WEO October, 2012 Per Capita GDP at Current Prices (USD) Per capita GDP based on PPP (Current International Dollar)
S.No. Country 2000 2006 2007 2008 2009 2010 2011 2012* 2000 2006 2007 2008 2009 2010 2011 2012 (P)
1 Argentina 7,917 5,541 6,705 8,270 7,708 9,162 10,959 11,573 9,418 12,236 13,527 14,597 14,684 16,062 17,660 18,205
2 Australia 20,730 37,318 44,655 48,819 45,249 56,098 66,371 67,983 27,248 35,107 37,226 38,259 38,510 39,545 40,847 42,354
3 Brazil 3,762 5,869 7,281 8,704 8,472 11,089 12,789 12,340 7,207 9,164 9,894 10,526 10,479 11,314 11,769 12,038
4 Canada 23,653 39,302 43,306 45,171 39,719 46,283 50,496 50,826 28,993 36,934 38,427 39,095 37,877 39,155 40,519 41,507
5 China 946 2,064 2,645 3,404 3,740 4,423 5,417 6,094 2,379 4,747 5,548 6,185 6,781 7,553 8,387 9,146
6 Euro Area 19,851 32,985 37,710 41,083 37,444 36,324 39,268 n/a 24,670 30,732 32,378 33,045 31,743 32,721 33,795 34,104
6a European Union 17,545 29,683 34,161 36,568 32,554 32,151 34,848 n/a 21,896 28,463 30,151 30,840 29,682 30,604 31,673 32,029
7 France 22,600 36,772 41,850 45,789 42,048 40,939 44,007 40,690 26,036 32,083 33,554 34,082 33,121 33,946 35,068 35,520
8 Germany 23,020 35,275 40,463 44,334 40,393 40,513 44,111 41,168 26,090 32,450 34,566 35,678 34,265 36,173 38,077 39,059
9 India 465 807 1,009 1,090 1,079 1,370 1,514 1,592 1,534 2,441 2,725 2,936 3,093 3,403 3,663 3,851
10 Indonesia 800 1,623 1,897 2,209 2,299 2,981 3,512 3,660 2,429 3,420 3,690 3,942 4,102 4,353 4,666 4,958
11 Italy 19,451 31,909 36,026 38,883 35,251 34,154 36,267 32,522 24,669 29,478 30,646 30,710 29,068 29,841 30,464 30,116
12 Japan 37,304 34,077 34,038 37,865 39,321 42,863 45,870 46,896 25,669 31,937 33,550 33,915 32,323 34,241 34,748 36,179
13 Korea 11,347 19,676 21,590 19,028 16,959 20,540 22,424 23,021 16,503 24,618 26,502 27,513 27,710 29,717 31,220 32,431
14 Mexico 6,859 9,033 9,667 10,051 7,979 9,219 10,146 10,123 10,874 13,367 13,972 14,217 13,265 13,977 14,653 15,300
15 Russia 1,775 6,962 9,153 11,704 8,617 10,408 12,993 13,765 7,661 13,322 14,899 16,040 14,918 15,657 16,736 17,698
16 Saudi Arabia 9,204 14,784 15,434 18,471 14,129 16,541 21,196 22,823 17,261 21,674 22,006 22,676 22,146 22,818 24,411 25,722
17 South Africa 2,986 5,511 5,910 5,606 5,746 7,271 8,078 7,636 6,643 9,334 9,934 10,404 10,217 10,541 10,970 11,302
18 Turkey 4,147 7,626 9,245 10,272 8,528 10,017 10,363 10,457 7,983 11,884 12,650 12,854 12,177 13,294 14,393 15,029
19 United Kingdom 25,110 40,545 46,357 43,511 35,489 36,442 38,811 38,591 25,241 34,019 36,047 36,253 34,874 35,731 36,522 36,728
20 United States 35,252 44,750 46,467 46,901 45,461 46,811 48,328 49,802 35,252 44,750 46,467 46,901 45,461 46,811 48,328 49,802
Source : IMF, World Economic Outlook (WEO) Database, 31st October, 2012
Databook for DCH; 5th December 2012 Page 220 of 266
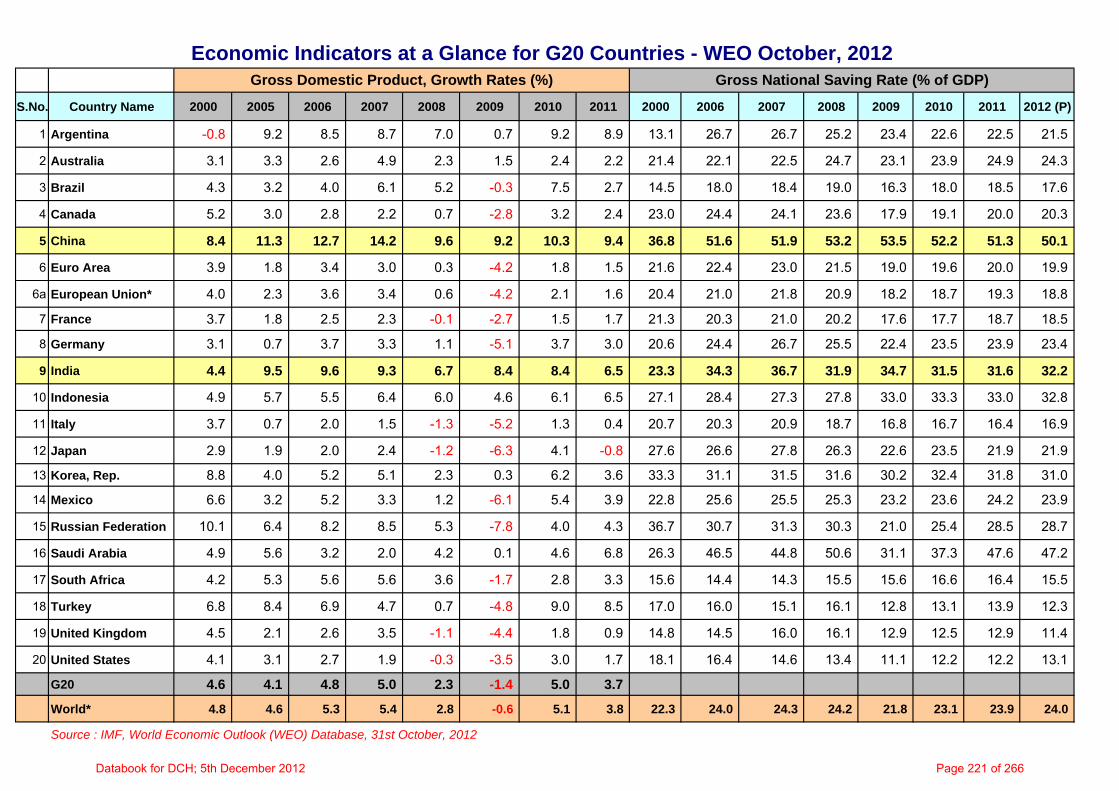
Economic Indicators at a Glance for G20 Countries - WEO October, 2012
Gross Domestic Product, Growth Rates (%) Gross National Saving Rate (% of GDP)
S.No. Country Name 2000 2005 2006 2007 2008 2009 2010 2011 2000 2006 2007 2008 2009 2010 2011 2012 (P)
1 Argentina -0.8 9.2 8.5 8.7 7.0 0.7 9.2 8.9 13.1 26.7 26.7 25.2 23.4 22.6 22.5 21.5
2 Australia 3.1 3.3 2.6 4.9 2.3 1.5 2.4 2.2 21.4 22.1 22.5 24.7 23.1 23.9 24.9 24.3
3 Brazil 4.3 3.2 4.0 6.1 5.2 -0.3 7.5 2.7 14.5 18.0 18.4 19.0 16.3 18.0 18.5 17.6
4 Canada 5.2 3.0 2.8 2.2 0.7 -2.8 3.2 2.4 23.0 24.4 24.1 23.6 17.9 19.1 20.0 20.3
5 China 8.4 11.3 12.7 14.2 9.6 9.2 10.3 9.4 36.8 51.6 51.9 53.2 53.5 52.2 51.3 50.1
6 Euro Area 3.9 1.8 3.4 3.0 0.3 -4.2 1.8 1.5 21.6 22.4 23.0 21.5 19.0 19.6 20.0 19.9
6a European Union* 4.0 2.3 3.6 3.4 0.6 -4.2 2.1 1.6 20.4 21.0 21.8 20.9 18.2 18.7 19.3 18.8
7 France 3.7 1.8 2.5 2.3 -0.1 -2.7 1.5 1.7 21.3 20.3 21.0 20.2 17.6 17.7 18.7 18.5
8 Germany 3.1 0.7 3.7 3.3 1.1 -5.1 3.7 3.0 20.6 24.4 26.7 25.5 22.4 23.5 23.9 23.4
9 India 4.4 9.5 9.6 9.3 6.7 8.4 8.4 6.5 23.3 34.3 36.7 31.9 34.7 31.5 31.6 32.2
10 Indonesia 4.9 5.7 5.5 6.4 6.0 4.6 6.1 6.5 27.1 28.4 27.3 27.8 33.0 33.3 33.0 32.8
11 Italy 3.7 0.7 2.0 1.5 -1.3 -5.2 1.3 0.4 20.7 20.3 20.9 18.7 16.8 16.7 16.4 16.9
12 Japan 2.9 1.9 2.0 2.4 -1.2 -6.3 4.1 -0.8 27.6 26.6 27.8 26.3 22.6 23.5 21.9 21.9
13 Korea, Rep. 8.8 4.0 5.2 5.1 2.3 0.3 6.2 3.6 33.3 31.1 31.5 31.6 30.2 32.4 31.8 31.0
14 Mexico 6.6 3.2 5.2 3.3 1.2 -6.1 5.4 3.9 22.8 25.6 25.5 25.3 23.2 23.6 24.2 23.9
15 Russian Federation 10.1 6.4 8.2 8.5 5.3 -7.8 4.0 4.3 36.7 30.7 31.3 30.3 21.0 25.4 28.5 28.7
16 Saudi Arabia 4.9 5.6 3.2 2.0 4.2 0.1 4.6 6.8 26.3 46.5 44.8 50.6 31.1 37.3 47.6 47.2
17 South Africa 4.2 5.3 5.6 5.6 3.6 -1.7 2.8 3.3 15.6 14.4 14.3 15.5 15.6 16.6 16.4 15.5
18 Turkey 6.8 8.4 6.9 4.7 0.7 -4.8 9.0 8.5 17.0 16.0 15.1 16.1 12.8 13.1 13.9 12.3
19 United Kingdom 4.5 2.1 2.6 3.5 -1.1 -4.4 1.8 0.9 14.8 14.5 16.0 16.1 12.9 12.5 12.9 11.4
20 United States 4.1 3.1 2.7 1.9 -0.3 -3.5 3.0 1.7 18.1 16.4 14.6 13.4 11.1 12.2 12.2 13.1
G20 4.6 4.1 4.8 5.0 2.3 -1.4 5.0 3.7
World* 4.8 4.6 5.3 5.4 2.8 -0.6 5.1 3.8 22.3 24.0 24.3 24.2 21.8 23.1 23.9 24.0
Source : IMF, World Economic Outlook (WEO) Database, 31st October, 2012
Databook for DCH; 5th December 2012 Page 221 of 266
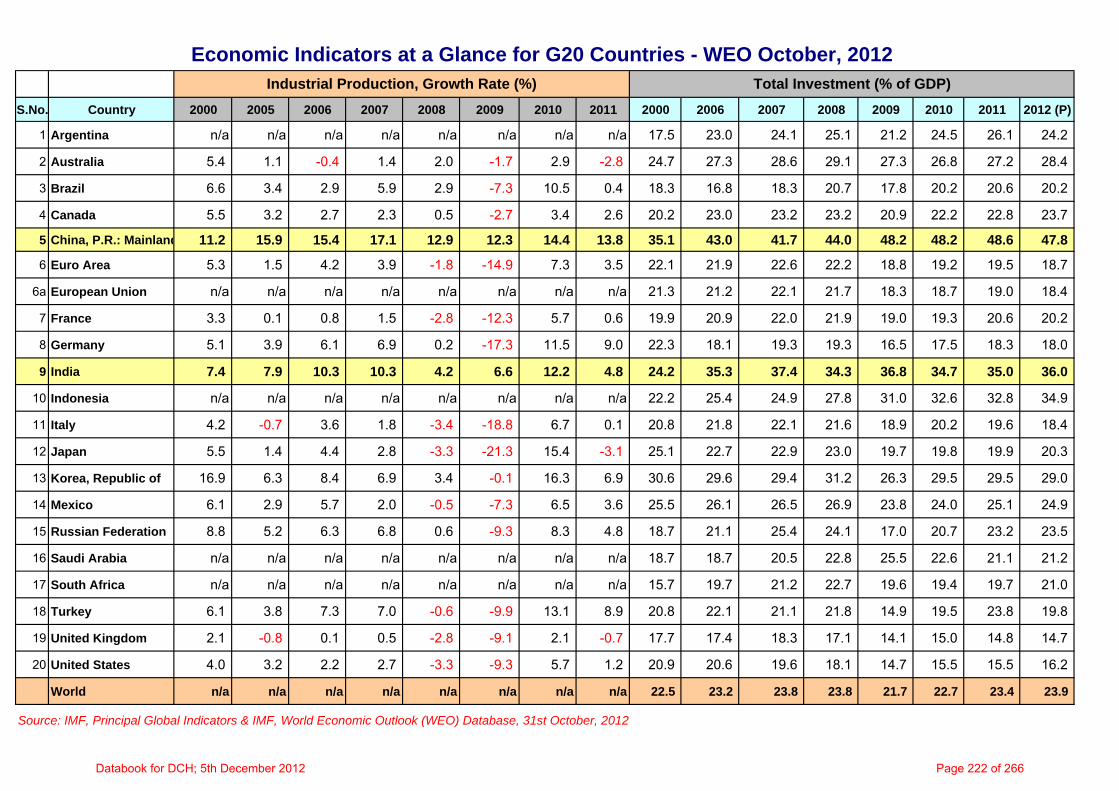
d
Economic Indicators at a Glance for G20 Countries - WEO October, 2012
Industrial Production, Growth Rate (%) Total Investment (% of GDP)
S.No. Country 2000 2005 2006 2007 2008 2009 2010 2011 2000 2006 2007 2008 2009 2010 2011 2012 (P)
1 Argentina n/a n/a n/a n/a n/a n/a n/a n/a 17.5 23.0 24.1 25.1 21.2 24.5 26.1 24.2
2 Australia 5.4 1.1 -0.4 1.4 2.0 -1.7 2.9 -2.8 24.7 27.3 28.6 29.1 27.3 26.8 27.2 28.4
3 Brazil 6.6 3.4 2.9 5.9 2.9 -7.3 10.5 0.4 18.3 16.8 18.3 20.7 17.8 20.2 20.6 20.2
4 Canada 5.5 3.2 2.7 2.3 0.5 -2.7 3.4 2.6 20.2 23.0 23.2 23.2 20.9 22.2 22.8 23.7
5 China, P.R.: Mainlan 11.2 15.9 15.4 17.1 12.9 12.3 14.4 13.8 35.1 43.0 41.7 44.0 48.2 48.2 48.6 47.8
6 Euro Area 5.3 1.5 4.2 3.9 -1.8 -14.9 7.3 3.5 22.1 21.9 22.6 22.2 18.8 19.2 19.5 18.7
6a European Union n/a n/a n/a n/a n/a n/a n/a n/a 21.3 21.2 22.1 21.7 18.3 18.7 19.0 18.4
7 France 3.3 0.1 0.8 1.5 -2.8 -12.3 5.7 0.6 19.9 20.9 22.0 21.9 19.0 19.3 20.6 20.2
8 Germany 5.1 3.9 6.1 6.9 0.2 -17.3 11.5 9.0 22.3 18.1 19.3 19.3 16.5 17.5 18.3 18.0
9 India 7.4 7.9 10.3 10.3 4.2 6.6 12.2 4.8 24.2 35.3 37.4 34.3 36.8 34.7 35.0 36.0
10 Indonesia n/a n/a n/a n/a n/a n/a n/a n/a 22.2 25.4 24.9 27.8 31.0 32.6 32.8 34.9
11 Italy 4.2 -0.7 3.6 1.8 -3.4 -18.8 6.7 0.1 20.8 21.8 22.1 21.6 18.9 20.2 19.6 18.4
12 Japan 5.5 1.4 4.4 2.8 -3.3 -21.3 15.4 -3.1 25.1 22.7 22.9 23.0 19.7 19.8 19.9 20.3
13 Korea, Republic of 16.9 6.3 8.4 6.9 3.4 -0.1 16.3 6.9 30.6 29.6 29.4 31.2 26.3 29.5 29.5 29.0
14 Mexico 6.1 2.9 5.7 2.0 -0.5 -7.3 6.5 3.6 25.5 26.1 26.5 26.9 23.8 24.0 25.1 24.9
15 Russian Federation 8.8 5.2 6.3 6.8 0.6 -9.3 8.3 4.8 18.7 21.1 25.4 24.1 17.0 20.7 23.2 23.5
16 Saudi Arabia n/a n/a n/a n/a n/a n/a n/a n/a 18.7 18.7 20.5 22.8 25.5 22.6 21.1 21.2
17 South Africa n/a n/a n/a n/a n/a n/a n/a n/a 15.7 19.7 21.2 22.7 19.6 19.4 19.7 21.0
18 Turkey 6.1 3.8 7.3 7.0 -0.6 -9.9 13.1 8.9 20.8 22.1 21.1 21.8 14.9 19.5 23.8 19.8
19 United Kingdom 2.1 -0.8 0.1 0.5 -2.8 -9.1 2.1 -0.7 17.7 17.4 18.3 17.1 14.1 15.0 14.8 14.7
20 United States 4.0 3.2 2.2 2.7 -3.3 -9.3 5.7 1.2 20.9 20.6 19.6 18.1 14.7 15.5 15.5 16.2
World n/a n/a n/a n/a n/a n/a n/a n/a 22.5 23.2 23.8 23.8 21.7 22.7 23.4 23.9
Source: IMF, Principal Global Indicators & IMF, World Economic Outlook (WEO) Database, 31st October, 2012
Databook for DCH; 5th December 2012 Page 222 of 266
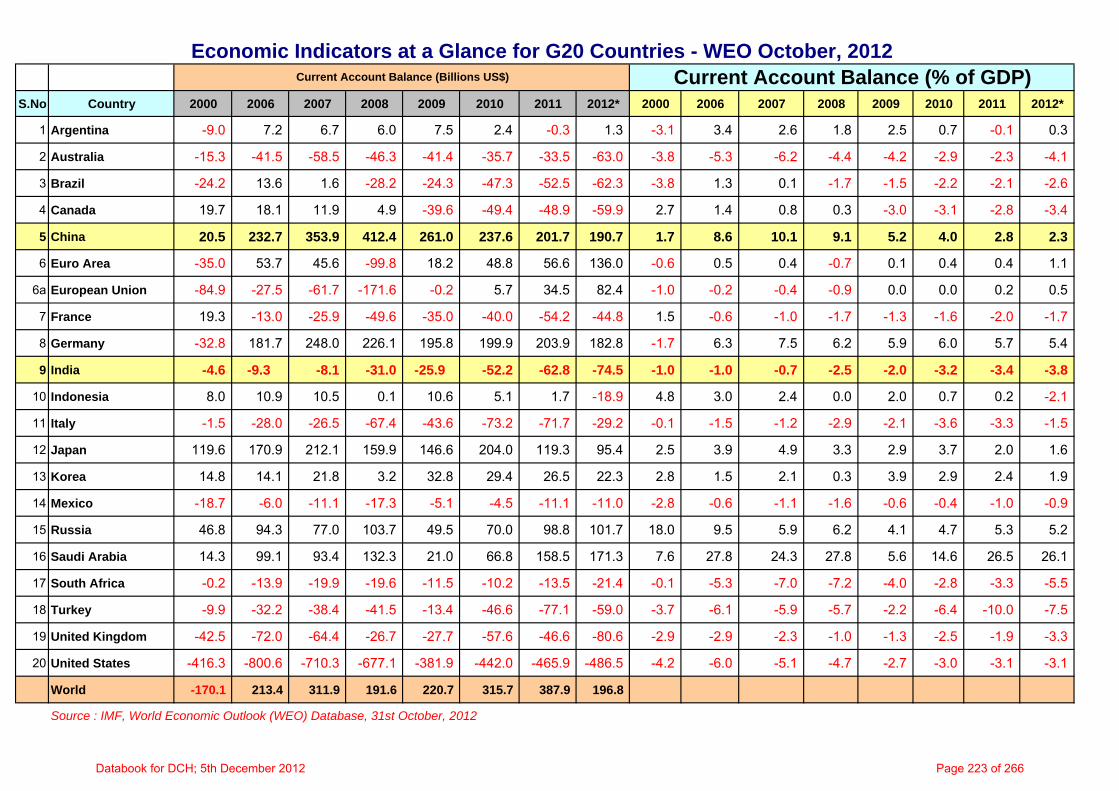
World
Source : IMF, World Economic Outlook (WEO) Database, 31st October, 2012
Economic Indicators at a Glance for G20 Countries - WEO October, 2012 Current Account Balance (Billions US$) Current Account Balance (% of GDP)
S.No Country 2000 2006 2007 2008 2009 2010 2011 2012* 2000 2006 2007 2008 2009 2010 2011 2012*
1 Argentina -9.0 7.2 6.7 6.0 7.5 2.4 -0.3 1.3 -3.1 3.4 2.6 1.8 2.5 0.7 -0.1 0.3
2 Australia -15.3 -41.5 -58.5 -46.3 -41.4 -35.7 -33.5 -63.0 -3.8 -5.3 -6.2 -4.4 -4.2 -2.9 -2.3 -4.1
3 Brazil -24.2 13.6 1.6 -28.2 -24.3 -47.3 -52.5 -62.3 -3.8 1.3 0.1 -1.7 -1.5 -2.2 -2.1 -2.6
4 Canada 19.7 18.1 11.9 4.9 -39.6 -49.4 -48.9 -59.9 2.7 1.4 0.8 0.3 -3.0 -3.1 -2.8 -3.4
5 China 20.5 232.7 353.9 412.4 261.0 237.6 201.7 190.7 1.7 8.6 10.1 9.1 5.2 4.0 2.8 2.3
6 Euro Area -35.0 53.7 45.6 -99.8 18.2 48.8 56.6 136.0 -0.6 0.5 0.4 -0.7 0.1 0.4 0.4 1.1
6a European Union -84.9 -27.5 -61.7 -171.6 -0.2 5.7 34.5 82.4 -1.0 -0.2 -0.4 -0.9 0.0 0.0 0.2 0.5
7 France 19.3 -13.0 -25.9 -49.6 -35.0 -40.0 -54.2 -44.8 1.5 -0.6 -1.0 -1.7 -1.3 -1.6 -2.0 -1.7
8 Germany -32.8 181.7 248.0 226.1 195.8 199.9 203.9 182.8 -1.7 6.3 7.5 6.2 5.9 6.0 5.7 5.4
9
10
India -4.6
8.0
-9.3
10.9
-8.1
10.5
-31.0
0.1
-25.9
10.6
-52.2
5.1
-62.8
1.7
-74.5
-18.9
-1.0
4.8
-1.0
3.0
-0.7
2.4
-2.5
0.0
-2.0
2.0
-3.2
0.7
-3.4
0.2
-3.8
-2.1
11
Indonesia
-1.5 -28.0 -26.5 -67.4 -43.6 -73.2 -71.7 -29.2 -0.1 -1.5 -1.2 -2.9 -2.1 -3.6 -3.3 -1.5
12
Italy
119.6 170.9 212.1 159.9 146.6 204.0 119.3 95.4 2.5 3.9 4.9 3.3 2.9 3.7 2.0 1.6
13
Japan
14.8 14.1 21.8 3.2 32.8 29.4 26.5 22.3 2.8 1.5 2.1 0.3 3.9 2.9 2.4 1.9
14
Korea
-18.7 -6.0 -11.1 -17.3 -5.1 -4.5 -11.1 -11.0 -2.8 -0.6 -1.1 -1.6 -0.6 -0.4 -1.0 -0.9 Mexico
15 Russia 46.8 94.3 77.0 103.7 49.5 70.0 98.8 101.7 18.0 9.5 5.9 6.2 4.1 4.7 5.3 5.2
16 Saudi Arabia 14.3 99.1 93.4 132.3 21.0 66.8 158.5 171.3 7.6 27.8 24.3 27.8 5.6 14.6 26.5 26.1
17 South Africa -0.2 -13.9 -19.9 -19.6 -11.5 -10.2 -13.5 -21.4 -0.1 -5.3 -7.0 -7.2 -4.0 -2.8 -3.3 -5.5
18 Turkey -9.9 -32.2 -38.4 -41.5 -13.4 -46.6 -77.1 -59.0 -3.7 -6.1 -5.9 -5.7 -2.2 -6.4 -10.0 -7.5
19 United Kingdom -42.5 -72.0 -64.4 -26.7 -27.7 -57.6 -46.6 -80.6 -2.9 -2.9 -2.3 -1.0 -1.3 -2.5 -1.9 -3.3
20 United States -416.3 -800.6 -710.3 -677.1 -381.9 -442.0 -465.9 -486.5 -4.2 -6.0 -5.1 -4.7 -2.7 -3.0 -3.1 -3.1
-170.1 213.4 311.9 191.6 220.7 315.7 387.9 196.8
Databook for DCH; 5th December 2012 Page 223 of 266
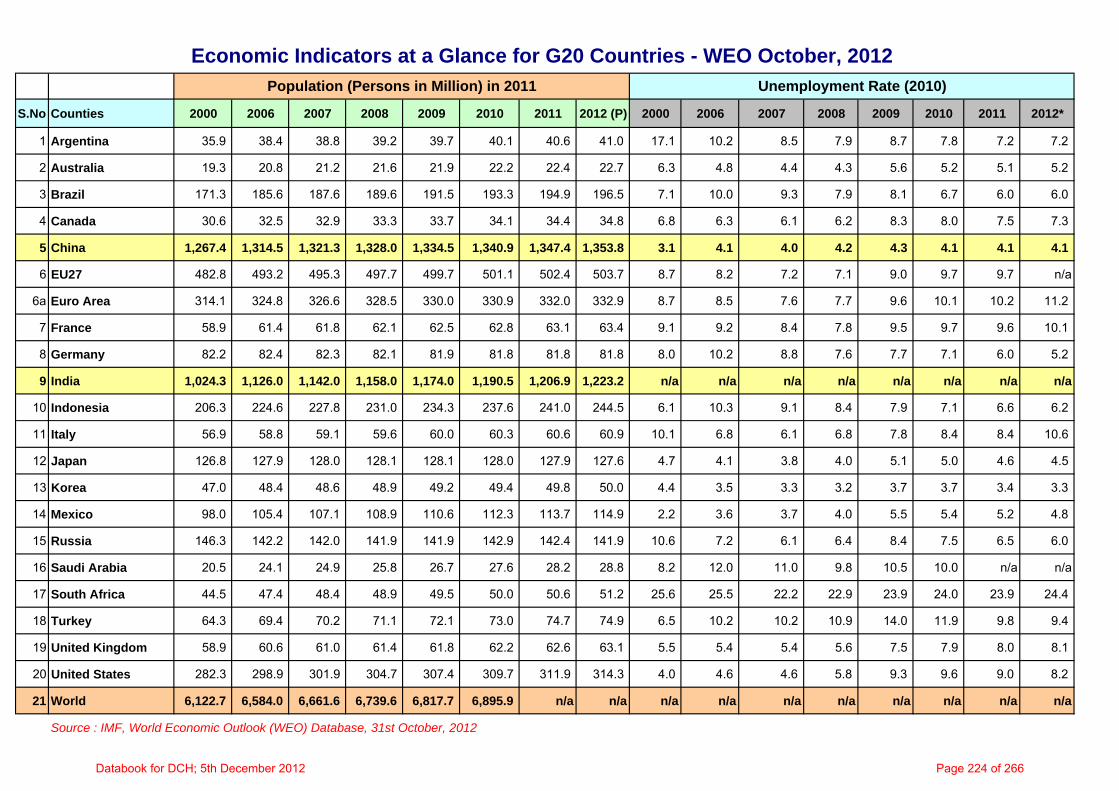
21
Source : IMF, World Economic Outlook (WEO) Database, 31st October, 2012
Economic Indicators at a Glance for G20 Countries - WEO October, 2012
Population (Persons in Million) in 2011 Unemployment Rate (2010)
S.No Counties 2000 2006 2007 2008 2009 2010 2011 2012 (P) 2000 2006 2007 2008 2009 2010 2011 2012*
1 Argentina 35.9 38.4 38.8 39.2 39.7 40.1 40.6 41.0 17.1 10.2 8.5 7.9 8.7 7.8 7.2 7.2
2 Australia 19.3 20.8 21.2 21.6 21.9 22.2 22.4 22.7 6.3 4.8 4.4 4.3 5.6 5.2 5.1 5.2
3 Brazil 171.3 185.6 187.6 189.6 191.5 193.3 194.9 196.5 7.1 10.0 9.3 7.9 8.1 6.7 6.0 6.0
4 Canada 30.6 32.5 32.9 33.3 33.7 34.1 34.4 34.8 6.8 6.3 6.1 6.2 8.3 8.0 7.5 7.3
5 China 1,267.4 1,314.5 1,321.3 1,328.0 1,334.5 1,340.9 1,347.4 1,353.8 3.1 4.1 4.0 4.2 4.3 4.1 4.1 4.1
6 EU27 482.8 493.2 495.3 497.7 499.7 501.1 502.4 503.7 8.7 8.2 7.2 7.1 9.0 9.7 9.7 n/a
6a Euro Area 314.1 324.8 326.6 328.5 330.0 330.9 332.0 332.9 8.7 8.5 7.6 7.7 9.6 10.1 10.2 11.2
7 France 58.9 61.4 61.8 62.1 62.5 62.8 63.1 63.4 9.1 9.2 8.4 7.8 9.5 9.7 9.6 10.1
8 Germany 82.2 82.4 82.3 82.1 81.9 81.8 81.8 81.8 8.0 10.2 8.8 7.6 7.7 7.1 6.0 5.2
9 India 1,024.3 1,126.0 1,142.0 1,158.0 1,174.0 1,190.5 1,206.9 1,223.2 n/a n/a n/a n/a n/a n/a n/a n/a
10 Indonesia 206.3 224.6 227.8 231.0 234.3 237.6 241.0 244.5 6.1 10.3 9.1 8.4 7.9 7.1 6.6 6.2
11 Italy 56.9 58.8 59.1 59.6 60.0 60.3 60.6 60.9 10.1 6.8 6.1 6.8 7.8 8.4 8.4 10.6
12 Japan 126.8 127.9 128.0 128.1 128.1 128.0 127.9 127.6 4.7 4.1 3.8 4.0 5.1 5.0 4.6 4.5
13 Korea 47.0 48.4 48.6 48.9 49.2 49.4 49.8 50.0 4.4 3.5 3.3 3.2 3.7 3.7 3.4 3.3
14 Mexico 98.0 105.4 107.1 108.9 110.6 112.3 113.7 114.9 2.2 3.6 3.7 4.0 5.5 5.4 5.2 4.8
15 Russia 146.3 142.2 142.0 141.9 141.9 142.9 142.4 141.9 10.6 7.2 6.1 6.4 8.4 7.5 6.5 6.0
16 Saudi Arabia 20.5 24.1 24.9 25.8 26.7 27.6 28.2 28.8 8.2 12.0 11.0 9.8 10.5 10.0 n/a n/a
17 South Africa 44.5 47.4 48.4 48.9 49.5 50.0 50.6 51.2 25.6 25.5 22.2 22.9 23.9 24.0 23.9 24.4
18 Turkey 64.3 69.4 70.2 71.1 72.1 73.0 74.7 74.9 6.5 10.2 10.2 10.9 14.0 11.9 9.8 9.4
19 United Kingdom 58.9 60.6 61.0 61.4 61.8 62.2 62.6 63.1 5.5 5.4 5.4 5.6 7.5 7.9 8.0 8.1
20 United States 282.3 298.9 301.9 304.7 307.4 309.7 311.9 314.3 4.0 4.6 4.6 5.8 9.3 9.6 9.0 8.2
World 6,122.7 6,584.0 6,661.6 6,739.6 6,817.7 6,895.9 n/a n/a n/a n/a n/a n/a n/a n/a n/a n/a
Databook for DCH; 5th December 2012 Page 224 of 266
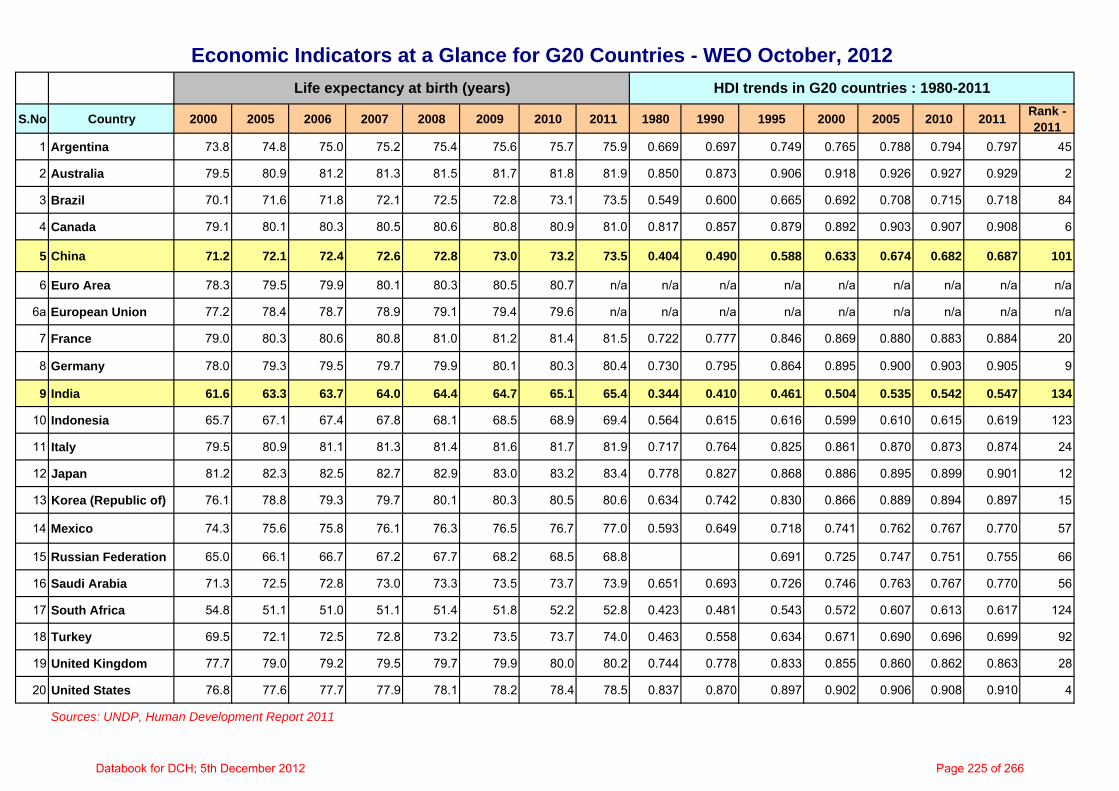
20
Sources: UNDP, Human Development Report 2011
Economic Indicators at a Glance for G20 Countries - WEO October, 2012
Life expectancy at birth (years) HDI trends in G20 countries : 1980-2011
Rank - S.No Country 2000 2005 2006 2007 2008 2009 2010 2011 1980 1990 1995 2000 2005 2010 2011
2011
1 Argentina 73.8 74.8 75.0 75.2 75.4 75.6 75.7 75.9 0.669 0.697 0.749 0.765 0.788 0.794 0.797 45
2 Australia 79.5 80.9 81.2 81.3 81.5 81.7 81.8 81.9 0.850 0.873 0.906 0.918 0.926 0.927 0.929 2
3 Brazil 70.1 71.6 71.8 72.1 72.5 72.8 73.1 73.5 0.549 0.600 0.665 0.692 0.708 0.715 0.718 84
4 Canada 79.1 80.1 80.3 80.5 80.6 80.8 80.9 81.0 0.817 0.857 0.879 0.892 0.903 0.907 0.908 6
5 China 71.2 72.1 72.4 72.6 72.8 73.0 73.2 73.5 0.404 0.490 0.588 0.633 0.674 0.682 0.687 101
6 Euro Area 78.3 79.5 79.9 80.1 80.3 80.5 80.7 n/a n/a n/a n/a n/a n/a n/a n/a n/a
6a European Union 77.2 78.4 78.7 78.9 79.1 79.4 79.6 n/a n/a n/a n/a n/a n/a n/a n/a n/a
7 France 79.0 80.3 80.6 80.8 81.0 81.2 81.4 81.5 0.722 0.777 0.846 0.869 0.880 0.883 0.884 20
8 Germany 78.0 79.3 79.5 79.7 79.9 80.1 80.3 80.4 0.730 0.795 0.864 0.895 0.900 0.903 0.905 9
9 India 61.6 63.3 63.7 64.0 64.4 64.7 65.1 65.4 0.344 0.410 0.461 0.504 0.535 0.542 0.547 134
10 Indonesia 65.7 67.1 67.4 67.8 68.1 68.5 68.9 69.4 0.564 0.615 0.616 0.599 0.610 0.615 0.619 123
11 Italy 79.5 80.9 81.1 81.3 81.4 81.6 81.7 81.9 0.717 0.764 0.825 0.861 0.870 0.873 0.874 24
12 Japan 81.2 82.3 82.5 82.7 82.9 83.0 83.2 83.4 0.778 0.827 0.868 0.886 0.895 0.899 0.901 12
13 Korea (Republic of) 76.1 78.8 79.3 79.7 80.1 80.3 80.5 80.6 0.634 0.742 0.830 0.866 0.889 0.894 0.897 15
14 Mexico 74.3 75.6 75.8 76.1 76.3 76.5 76.7 77.0 0.593 0.649 0.718 0.741 0.762 0.767 0.770 57
15 Russian Federation 65.0 66.1 66.7 67.2 67.7 68.2 68.5 68.8 0.691 0.725 0.747 0.751 0.755 66
16 Saudi Arabia 71.3 72.5 72.8 73.0 73.3 73.5 73.7 73.9 0.651 0.693 0.726 0.746 0.763 0.767 0.770 56
17 South Africa 54.8 51.1 51.0 51.1 51.4 51.8 52.2 52.8 0.423 0.481 0.543 0.572 0.607 0.613 0.617 124
18 Turkey 69.5 72.1 72.5 72.8 73.2 73.5 73.7 74.0 0.463 0.558 0.634 0.671 0.690 0.696 0.699 92
19 United Kingdom 77.7 79.0 79.2 79.5 79.7 79.9 80.0 80.2 0.744 0.778 0.833 0.855 0.860 0.862 0.863 28
United States 76.8 77.6 77.7 77.9 78.1 78.2 78.4 78.5 0.837 0.870 0.897 0.902 0.906 0.908 0.910 4
Databook for DCH; 5th December 2012 Page 225 of 266
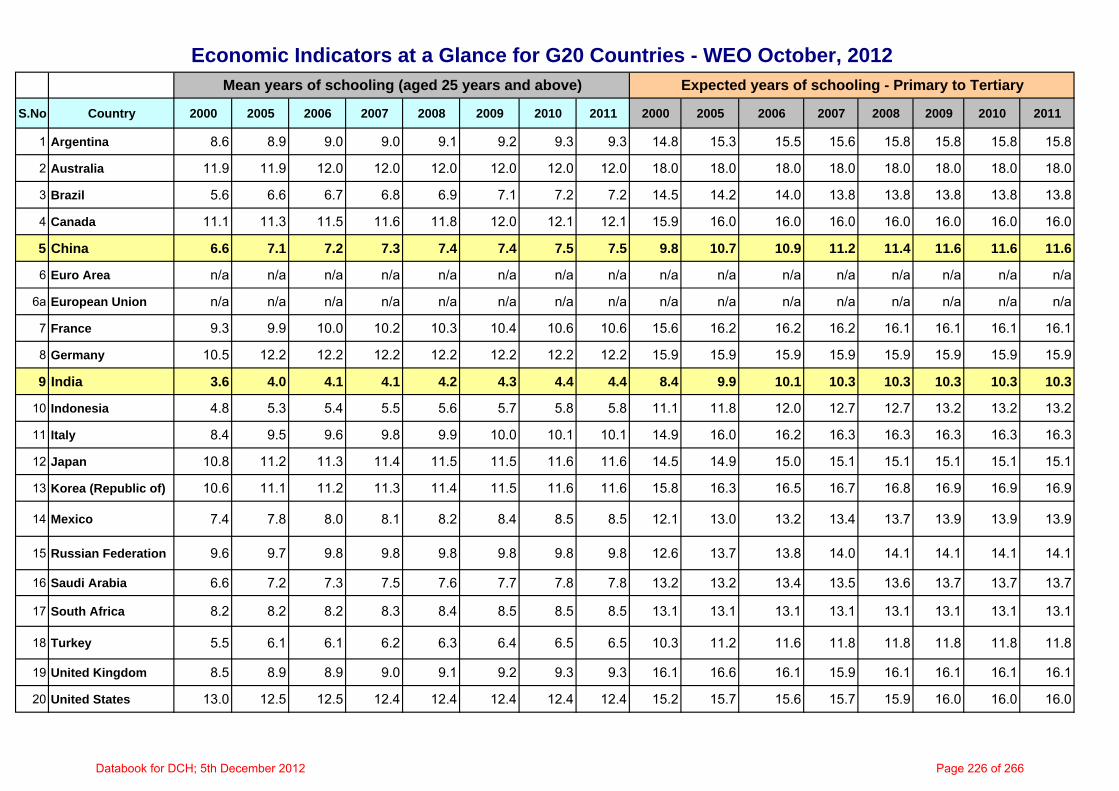
Economic Indicators at a Glance for G20 Countries - WEO October, 2012
Mean years of schooling (aged 25 years and above) Expected years of schooling - Primary to Tertiary
S.No Country 2000 2005 2006 2007 2008 2009 2010 2011 2000 2005 2006 2007 2008 2009 2010 2011
1 Argentina 8.6 8.9 9.0 9.0 9.1 9.2 9.3 9.3 14.8 15.3 15.5 15.6 15.8 15.8 15.8 15.8
2 Australia 11.9 11.9 12.0 12.0 12.0 12.0 12.0 12.0 18.0 18.0 18.0 18.0 18.0 18.0 18.0 18.0
3 Brazil 5.6 6.6 6.7 6.8 6.9 7.1 7.2 7.2 14.5 14.2 14.0 13.8 13.8 13.8 13.8 13.8
4 Canada 11.1 11.3 11.5 11.6 11.8 12.0 12.1 12.1 15.9 16.0 16.0 16.0 16.0 16.0 16.0 16.0
5 China 6.6 7.1 7.2 7.3 7.4 7.4 7.5 7.5 9.8 10.7 10.9 11.2 11.4 11.6 11.6 11.6
6 Euro Area n/a n/a n/a n/a n/a n/a n/a n/a n/a n/a n/a n/a n/a n/a n/a n/a
6a European Union n/a n/a n/a n/a n/a n/a n/a n/a n/a n/a n/a n/a n/a n/a n/a n/a
7 France 9.3 9.9 10.0 10.2 10.3 10.4 10.6 10.6 15.6 16.2 16.2 16.2 16.1 16.1 16.1 16.1
8 Germany 10.5 12.2 12.2 12.2 12.2 12.2 12.2 12.2 15.9 15.9 15.9 15.9 15.9 15.9 15.9 15.9
9 India 3.6 4.0 4.1 4.1 4.2 4.3 4.4 4.4 8.4 9.9 10.1 10.3 10.3 10.3 10.3 10.3
10 Indonesia 4.8 5.3 5.4 5.5 5.6 5.7 5.8 5.8 11.1 11.8 12.0 12.7 12.7 13.2 13.2 13.2
11 Italy 8.4 9.5 9.6 9.8 9.9 10.0 10.1 10.1 14.9 16.0 16.2 16.3 16.3 16.3 16.3 16.3
12 Japan 10.8 11.2 11.3 11.4 11.5 11.5 11.6 11.6 14.5 14.9 15.0 15.1 15.1 15.1 15.1 15.1
13 Korea (Republic of) 10.6 11.1 11.2 11.3 11.4 11.5 11.6 11.6 15.8 16.3 16.5 16.7 16.8 16.9 16.9 16.9
14 Mexico 7.4 7.8 8.0 8.1 8.2 8.4 8.5 8.5 12.1 13.0 13.2 13.4 13.7 13.9 13.9 13.9
15 Russian Federation 9.6 9.7 9.8 9.8 9.8 9.8 9.8 9.8 12.6 13.7 13.8 14.0 14.1 14.1 14.1 14.1
16 Saudi Arabia 6.6 7.2 7.3 7.5 7.6 7.7 7.8 7.8 13.2 13.2 13.4 13.5 13.6 13.7 13.7 13.7
17 South Africa 8.2 8.2 8.2 8.3 8.4 8.5 8.5 8.5 13.1 13.1 13.1 13.1 13.1 13.1 13.1 13.1
18 Turkey 5.5 6.1 6.1 6.2 6.3 6.4 6.5 6.5 10.3 11.2 11.6 11.8 11.8 11.8 11.8 11.8
19 United Kingdom 8.5 8.9 8.9 9.0 9.1 9.2 9.3 9.3 16.1 16.6 16.1 15.9 16.1 16.1 16.1 16.1
20 United States 13.0 12.5 12.5 12.4 12.4 12.4 12.4 12.4 15.2 15.7 15.6 15.7 15.9 16.0 16.0 16.0
Databook for DCH; 5th December 2012 Page 226 of 266
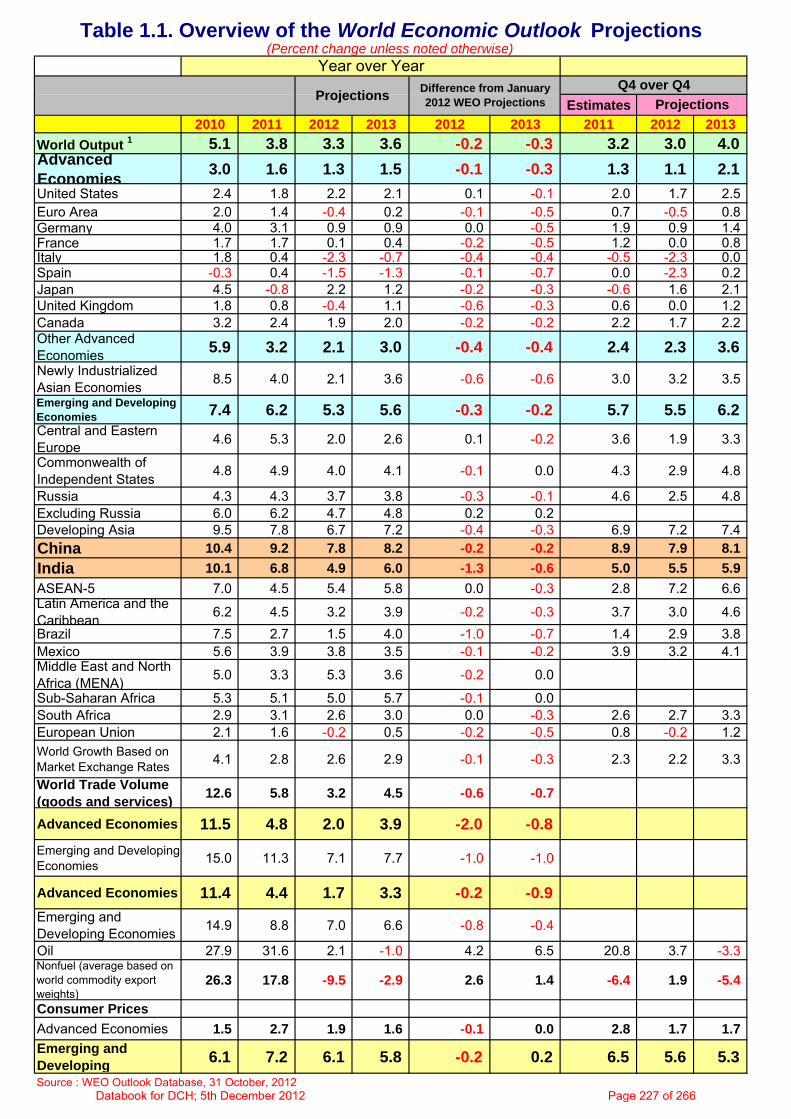
Table 1.1. Overview of the World Economic Outlook Projections(Percent change unless noted otherwise)
Year over Year
ProjectionsDifference from January
2012 WEO Projections
Q4 over Q4
Estimates Projections
2010 2011 2012 2013 2012 2013 2011 2012 2013
World Output 1 5.1 3.8 3.3 3.6 -0.2 -0.3 3.2 3.0 4.0
Advanced
Economies3.0 1.6 1.3 1.5 -0.1 -0.3 1.3 1.1 2.1
United States 2.4 1.8 2.2 2.1 0.1 -0.1 2.0 1.7 2.5Euro Area 2.0 1.4 -0.4 0.2 -0.1 -0.5 0.7 -0.5 0.8Germany 4.0 3.1 0.9 0.9 0.0 -0.5 1.9 0.9 1.4France 1.7 1.7 0.1 0.4 -0.2 -0.5 1.2 0.0 0.8Italy 1.8 0.4 -2.3 -0.7 -0.4 -0.4 -0.5 -2.3 0.0Spain -0.3 0.4 -1.5 -1.3 -0.1 -0.7 0.0 -2.3 0.2Japan 4.5 -0.8 2.2 1.2 -0.2 -0.3 -0.6 1.6 2.1United Kingdom 1.8 0.8 -0.4 1.1 -0.6 -0.3 0.6 0.0 1.2Canada 3.2 2.4 1.9 2.0 -0.2 -0.2 2.2 1.7 2.2Other Advanced Economies 5.9 3.2 2.1 3.0 -0.4 -0.4 2.4 2.3 3.6
Newly Industrialized Asian Economies 8.5 4.0 2.1 3.6 -0.6 -0.6 3.0 3.2 3.5
Emerging and Developing
Economies7.4 6.2 5.3 5.6 -0.3 -0.2 5.7 5.5 6.2
Central and Eastern Europe 4.6 5.3 2.0 2.6 0.1 -0.2 3.6 1.9 3.3
Commonwealth of Independent States 4.8 4.9 4.0 4.1 -0.1 0.0 4.3 2.9 4.8
Russia 4.3 4.3 3.7 3.8 -0.3 -0.1 4.6 2.5 4.8Excluding Russia 6.0 6.2 4.7 4.8 0.2 0.2Developing Asia 9.5 7.8 6.7 7.2 -0.4 -0.3 6.9 7.2 7.4China 10.4 9.2 7.8 8.2 -0.2 -0.2 8.9 7.9 8.1
India 10.1 6.8 4.9 6.0 -1.3 -0.6 5.0 5.5 5.9
ASEAN-5 7.0 4.5 5.4 5.8 0.0 -0.3 2.8 7.2 6.6Latin America and the Caribbean 6.2 4.5 3.2 3.9 -0.2 -0.3 3.7 3.0 4.6Brazil 7.5 2.7 1.5 4.0 -1.0 -0.7 1.4 2.9 3.8Mexico 5.6 3.9 3.8 3.5 -0.1 -0.2 3.9 3.2 4.1Middle East and North Africa (MENA) 5.0 3.3 5.3 3.6 -0.2 0.0
Sub-Saharan Africa 5.3 5.1 5.0 5.7 -0.1 0.0South Africa 2.9 3.1 2.6 3.0 0.0 -0.3 2.6 2.7 3.3European Union 2.1 1.6 -0.2 0.5 -0.2 -0.5 0.8 -0.2 1.2World Growth Based on Market Exchange Rates 4.1 2.8 2.6 2.9 -0.1 -0.3 2.3 2.2 3.3
World Trade Volume
(goods and services)12.6 5.8 3.2 4.5 -0.6 -0.7
Advanced Economies 11.5 4.8 2.0 3.9 -2.0 -0.8
Emerging and Developing Economies 15.0 11.3 7.1 7.7 -1.0 -1.0
Advanced Economies 11.4 4.4 1.7 3.3 -0.2 -0.9
Emerging and Developing Economies 14.9 8.8 7.0 6.6 -0.8 -0.4
Oil 27.9 31.6 2.1 -1.0 4.2 6.5 20.8 3.7 -3.3 Nonfuel (average based on world commodity export weights)
26.3 17.8 -9.5 -2.9 2.6 1.4 -6.4 1.9 -5.4
Consumer Prices
Advanced Economies 1.5 2.7 1.9 1.6 -0.1 0.0 2.8 1.7 1.7
Emerging and
Developing 6.1 7.2 6.1 5.8 -0.2 0.2 6.5 5.6 5.3
Source : WEO Outlook Database, 31 October, 2012Databook for DCH; 5th December 2012 Page 227 of 266
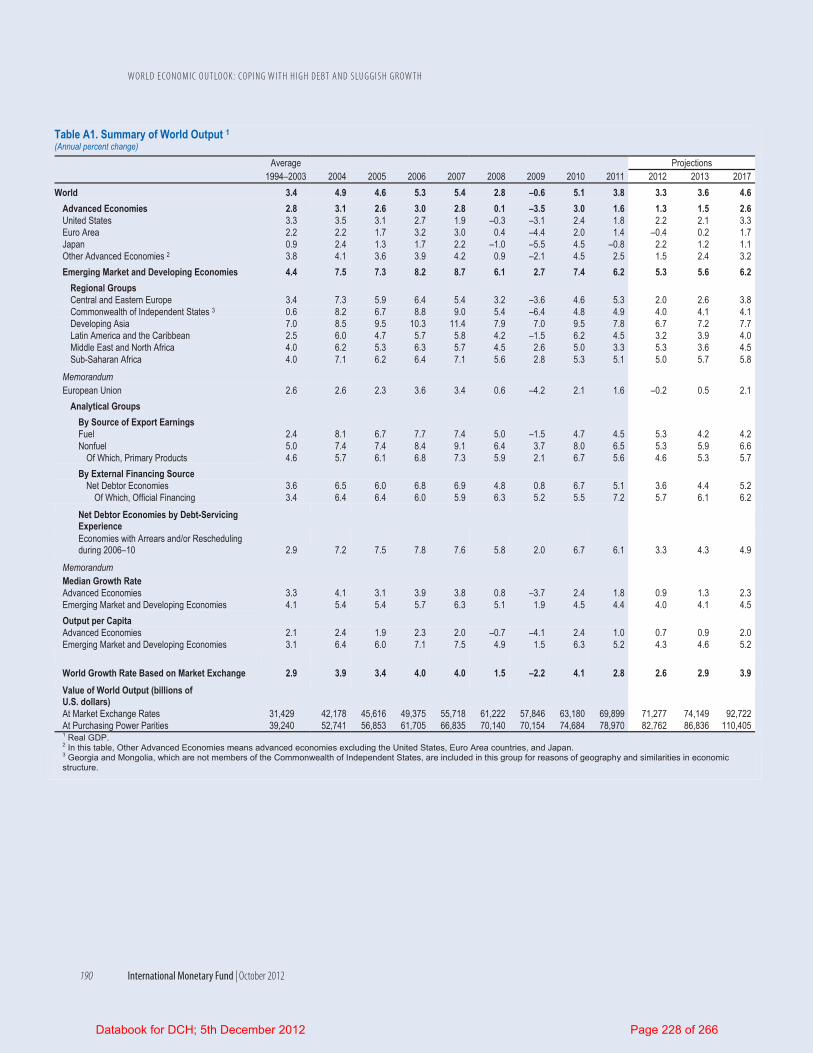
wo r l d e co n o m i c o u t lo o k : co p i n g w i t h h i g h d e bt a n d S lu g g i S h g r ow t h
190 International Monetary Fund | October 2012
Table A1. Summary of World Output 1 (Annual percent change)
Average Projections 1994–2003 2004 2005 2006 2007 2008 2009 2010 2011 2012 2013 2017
World 3.4 4.9 4.6 5.3 5.4 2.8 –0.6 5.1 3.8 3.3 3.6 4.6 Advanced Economies 2.8 3.1 2.6 3.0 2.8 0.1 –3.5 3.0 1.6 1.3 1.5 2.6
United States 3.3 3.5 3.1 2.7 1.9 –0.3 –3.1 2.4 1.8 2.2 2.1 3.3 Euro Area 2.2 2.2 1.7 3.2 3.0 0.4 –4.4 2.0 1.4 –0.4 0.2 1.7 Japan 0.9 2.4 1.3 1.7 2.2 –1.0 –5.5 4.5 –0.8 2.2 1.2 1.1 Other Advanced Economies 2 3.8 4.1 3.6 3.9 4.2 0.9 –2.1 4.5 2.5 1.5 2.4 3.2
Emerging Market and Developing Economies 4.4 7.5 7.3 8.2 8.7 6.1 2.7 7.4 6.2 5.3 5.6 6.2 Regional Groups
Central and Eastern Europe 3.4 7.3 5.9 6.4 5.4 3.2 –3.6 4.6 5.3 2.0 2.6 3.8 Commonwealth of Independent States 3 0.6 8.2 6.7 8.8 9.0 5.4 –6.4 4.8 4.9 4.0 4.1 4.1 Developing Asia 7.0 8.5 9.5 10.3 11.4 7.9 7.0 9.5 7.8 6.7 7.2 7.7 Latin America and the Caribbean 2.5 6.0 4.7 5.7 5.8 4.2 –1.5 6.2 4.5 3.2 3.9 4.0 Middle East and North Africa 4.0 6.2 5.3 6.3 5.7 4.5 2.6 5.0 3.3 5.3 3.6 4.5 Sub-Saharan Africa 4.0 7.1 6.2 6.4 7.1 5.6 2.8 5.3 5.1 5.0 5.7 5.8
Memorandum European Union 2.6 2.6 2.3 3.6 3.4 0.6 –4.2 2.1 1.6 –0.2 0.5 2.1
Analytical Groups By Source of Export Earnings
Fuel 2.4 8.1 6.7 7.7 7.4 5.0 –1.5 4.7 4.5 5.3 4.2 4.2 Nonfuel 5.0 7.4 7.4 8.4 9.1 6.4 3.7 8.0 6.5 5.3 5.9 6.6
Of Which, Primary Products 4.6 5.7 6.1 6.8 7.3 5.9 2.1 6.7 5.6 4.6 5.3 5.7 By External Financing Source
Net Debtor Economies 3.6 6.5 6.0 6.8 6.9 4.8 0.8 6.7 5.1 3.6 4.4 5.2 Of Which, Official Financing 3.4 6.4 6.4 6.0 5.9 6.3 5.2 5.5 7.2 5.7 6.1 6.2
Net Debtor Economies by Debt-Servicing Experience
Economies with Arrears and/or Rescheduling during 2006–10 2.9 7.2 7.5 7.8 7.6 5.8 2.0 6.7 6.1 3.3 4.3 4.9
Memorandum Median Growth Rate Advanced Economies 3.3 4.1 3.1 3.9 3.8 0.8 –3.7 2.4 1.8 0.9 1.3 2.3 Emerging Market and Developing Economies 4.1 5.4 5.4 5.7 6.3 5.1 1.9 4.5 4.4 4.0 4.1 4.5
Output per Capita Advanced Economies 2.1 2.4 1.9 2.3 2.0 –0.7 –4.1 2.4 1.0 0.7 0.9 2.0 Emerging Market and Developing Economies 3.1 6.4 6.0 7.1 7.5 4.9 1.5 6.3 5.2 4.3 4.6 5.2
World Growth Rate Based on Market Exchange 2.9 3.9 3.4 4.0 4.0 1.5 –2.2 4.1 2.8 2.6 2.9 3.9
Value of World Output (billions of U.S. dollars) At Market Exchange Rates 31,429 42,178 45,616 49,375 55,718 61,222 57,846 63,180 69,899 71,277 74,149 92,722 At Purchasing Power Parities 39,240 52,741 56,853 61,705 66,835 70,140 70,154 74,684 78,970 82,762 86,836 110,405
1 Real GDP. 2 In this table, Other Advanced Economies means advanced economies excluding the United States, Euro Area countries, and Japan. 3 Georgia and Mongolia, which are not members of the Commonwealth of Independent States, are included in this group for reasons of geography and similarities in economic structure.
Databook for DCH; 5th December 2012 Page 228 of 266
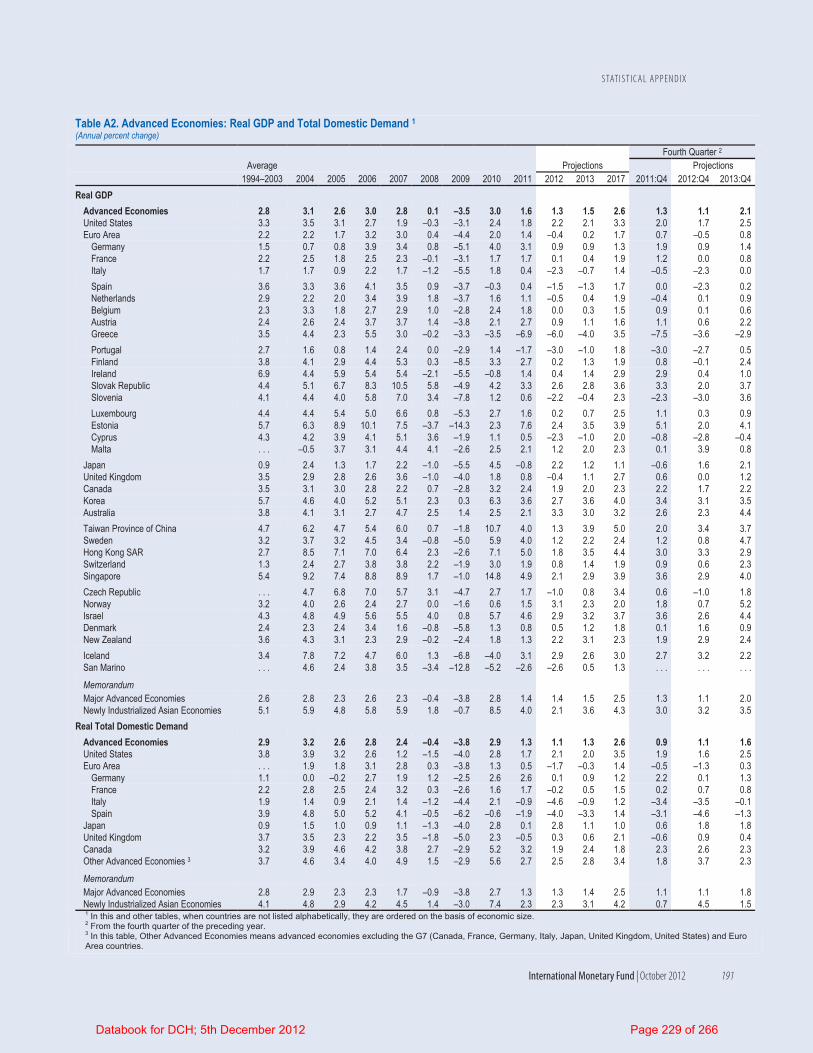
S tat i S t i c a l a p p e n d i x
International Monetary Fund | October 2012 191
Table A2. Advanced Economies: Real GDP and Total Domestic Demand 1 (Annual percent change)
Fourth Quarter 2 Average Projections Projections
1994–2003 2004 2005 2006 2007 2008 2009 2010 2011 2012 2013 2017 2011:Q4 2012:Q4 2013:Q4 Real GDP
Advanced Economies 2.8 3.1 2.6 3.0 2.8 0.1 –3.5 3.0 1.6 1.3 1.5 2.6 1.3 1.1 2.1 United States 3.3 3.5 3.1 2.7 1.9 –0.3 –3.1 2.4 1.8 2.2 2.1 3.3 2.0 1.7 2.5 Euro Area 2.2 2.2 1.7 3.2 3.0 0.4 –4.4 2.0 1.4 –0.4 0.2 1.7 0.7 –0.5 0.8
Germany 1.5 0.7 0.8 3.9 3.4 0.8 –5.1 4.0 3.1 0.9 0.9 1.3 1.9 0.9 1.4 France 2.2 2.5 1.8 2.5 2.3 –0.1 –3.1 1.7 1.7 0.1 0.4 1.9 1.2 0.0 0.8 Italy 1.7 1.7 0.9 2.2 1.7 –1.2 –5.5 1.8 0.4 –2.3 –0.7 1.4 –0.5 –2.3 0.0
Spain 3.6 3.3 3.6 4.1 3.5 0.9 –3.7 –0.3 0.4 –1.5 –1.3 1.7 0.0 –2.3 0.2 Netherlands 2.9 2.2 2.0 3.4 3.9 1.8 –3.7 1.6 1.1 –0.5 0.4 1.9 –0.4 0.1 0.9 Belgium 2.3 3.3 1.8 2.7 2.9 1.0 –2.8 2.4 1.8 0.0 0.3 1.5 0.9 0.1 0.6 Austria 2.4 2.6 2.4 3.7 3.7 1.4 –3.8 2.1 2.7 0.9 1.1 1.6 1.1 0.6 2.2 Greece 3.5 4.4 2.3 5.5 3.0 –0.2 –3.3 –3.5 –6.9 –6.0 –4.0 3.5 –7.5 –3.6 –2.9
Portugal 2.7 1.6 0.8 1.4 2.4 0.0 –2.9 1.4 –1.7 –3.0 –1.0 1.8 –3.0 –2.7 0.5 Finland 3.8 4.1 2.9 4.4 5.3 0.3 –8.5 3.3 2.7 0.2 1.3 1.9 0.8 –0.1 2.4 Ireland 6.9 4.4 5.9 5.4 5.4 –2.1 –5.5 –0.8 1.4 0.4 1.4 2.9 2.9 0.4 1.0 Slovak Republic 4.4 5.1 6.7 8.3 10.5 5.8 –4.9 4.2 3.3 2.6 2.8 3.6 3.3 2.0 3.7 Slovenia 4.1 4.4 4.0 5.8 7.0 3.4 –7.8 1.2 0.6 –2.2 –0.4 2.3 –2.3 –3.0 3.6
Luxembourg 4.4 4.4 5.4 5.0 6.6 0.8 –5.3 2.7 1.6 0.2 0.7 2.5 1.1 0.3 0.9 Estonia 5.7 6.3 8.9 10.1 7.5 –3.7 –14.3 2.3 7.6 2.4 3.5 3.9 5.1 2.0 4.1 Cyprus 4.3 4.2 3.9 4.1 5.1 3.6 –1.9 1.1 0.5 –2.3 –1.0 2.0 –0.8 –2.8 –0.4 Malta . . . –0.5 3.7 3.1 4.4 4.1 –2.6 2.5 2.1 1.2 2.0 2.3 0.1 3.9 0.8
Japan 0.9 2.4 1.3 1.7 2.2 –1.0 –5.5 4.5 –0.8 2.2 1.2 1.1 –0.6 1.6 2.1 United Kingdom 3.5 2.9 2.8 2.6 3.6 –1.0 –4.0 1.8 0.8 –0.4 1.1 2.7 0.6 0.0 1.2 Canada 3.5 3.1 3.0 2.8 2.2 0.7 –2.8 3.2 2.4 1.9 2.0 2.3 2.2 1.7 2.2 Korea 5.7 4.6 4.0 5.2 5.1 2.3 0.3 6.3 3.6 2.7 3.6 4.0 3.4 3.1 3.5 Australia 3.8 4.1 3.1 2.7 4.7 2.5 1.4 2.5 2.1 3.3 3.0 3.2 2.6 2.3 4.4
Taiwan Province of China 4.7 6.2 4.7 5.4 6.0 0.7 –1.8 10.7 4.0 1.3 3.9 5.0 2.0 3.4 3.7 Sweden 3.2 3.7 3.2 4.5 3.4 –0.8 –5.0 5.9 4.0 1.2 2.2 2.4 1.2 0.8 4.7 Hong Kong SAR 2.7 8.5 7.1 7.0 6.4 2.3 –2.6 7.1 5.0 1.8 3.5 4.4 3.0 3.3 2.9 Switzerland 1.3 2.4 2.7 3.8 3.8 2.2 –1.9 3.0 1.9 0.8 1.4 1.9 0.9 0.6 2.3 Singapore 5.4 9.2 7.4 8.8 8.9 1.7 –1.0 14.8 4.9 2.1 2.9 3.9 3.6 2.9 4.0
Czech Republic . . . 4.7 6.8 7.0 5.7 3.1 –4.7 2.7 1.7 –1.0 0.8 3.4 0.6 –1.0 1.8 Norway 3.2 4.0 2.6 2.4 2.7 0.0 –1.6 0.6 1.5 3.1 2.3 2.0 1.8 0.7 5.2 Israel 4.3 4.8 4.9 5.6 5.5 4.0 0.8 5.7 4.6 2.9 3.2 3.7 3.6 2.6 4.4 Denmark 2.4 2.3 2.4 3.4 1.6 –0.8 –5.8 1.3 0.8 0.5 1.2 1.8 0.1 1.6 0.9 New Zealand 3.6 4.3 3.1 2.3 2.9 –0.2 –2.4 1.8 1.3 2.2 3.1 2.3 1.9 2.9 2.4
Iceland 3.4 7.8 7.2 4.7 6.0 1.3 –6.8 –4.0 3.1 2.9 2.6 3.0 2.7 3.2 2.2 San Marino . . . 4.6 2.4 3.8 3.5 –3.4 –12.8 –5.2 –2.6 –2.6 0.5 1.3 . . . . . . . . .
Memorandum Major Advanced Economies 2.6 2.8 2.3 2.6 2.3 –0.4 –3.8 2.8 1.4 1.4 1.5 2.5 1.3 1.1 2.0 Newly Industrialized Asian Economies 5.1 5.9 4.8 5.8 5.9 1.8 –0.7 8.5 4.0 2.1 3.6 4.3 3.0 3.2 3.5
Real Total Domestic Demand Advanced Economies 2.9 3.2 2.6 2.8 2.4 –0.4 –3.8 2.9 1.3 1.1 1.3 2.6 0.9 1.1 1.6
United States 3.8 3.9 3.2 2.6 1.2 –1.5 –4.0 2.8 1.7 2.1 2.0 3.5 1.9 1.6 2.5 Euro Area . . . 1.9 1.8 3.1 2.8 0.3 –3.8 1.3 0.5 –1.7 –0.3 1.4 –0.5 –1.3 0.3
Germany 1.1 0.0 –0.2 2.7 1.9 1.2 –2.5 2.6 2.6 0.1 0.9 1.2 2.2 0.1 1.3 France 2.2 2.8 2.5 2.4 3.2 0.3 –2.6 1.6 1.7 –0.2 0.5 1.5 0.2 0.7 0.8 Italy 1.9 1.4 0.9 2.1 1.4 –1.2 –4.4 2.1 –0.9 –4.6 –0.9 1.2 –3.4 –3.5 –0.1 Spain 3.9 4.8 5.0 5.2 4.1 –0.5 –6.2 –0.6 –1.9 –4.0 –3.3 1.4 –3.1 –4.6 –1.3
Japan 0.9 1.5 1.0 0.9 1.1 –1.3 –4.0 2.8 0.1 2.8 1.1 1.0 0.6 1.8 1.8 United Kingdom 3.7 3.5 2.3 2.2 3.5 –1.8 –5.0 2.3 –0.5 0.3 0.6 2.1 –0.6 0.9 0.4 Canada 3.2 3.9 4.6 4.2 3.8 2.7 –2.9 5.2 3.2 1.9 2.4 1.8 2.3 2.6 2.3 Other Advanced Economies 3 3.7 4.6 3.4 4.0 4.9 1.5 –2.9 5.6 2.7 2.5 2.8 3.4 1.8 3.7 2.3
Memorandum Major Advanced Economies 2.8 2.9 2.3 2.3 1.7 –0.9 –3.8 2.7 1.3 1.3 1.4 2.5 1.1 1.1 1.8 Newly Industrialized Asian Economies 4.1 4.8 2.9 4.2 4.5 1.4 –3.0 7.4 2.3 2.3 3.1 4.2 0.7 4.5 1.5 1 In this and other tables, when countries are not listed alphabetically, they are ordered on the basis of economic size. 2 From the fourth quarter of the preceding year. 3 In this table, Other Advanced Economies means advanced economies excluding the G7 (Canada, France, Germany, Italy, Japan, United Kingdom, United States) and Euro Area countries.
Databook for DCH; 5th December 2012 Page 229 of 266
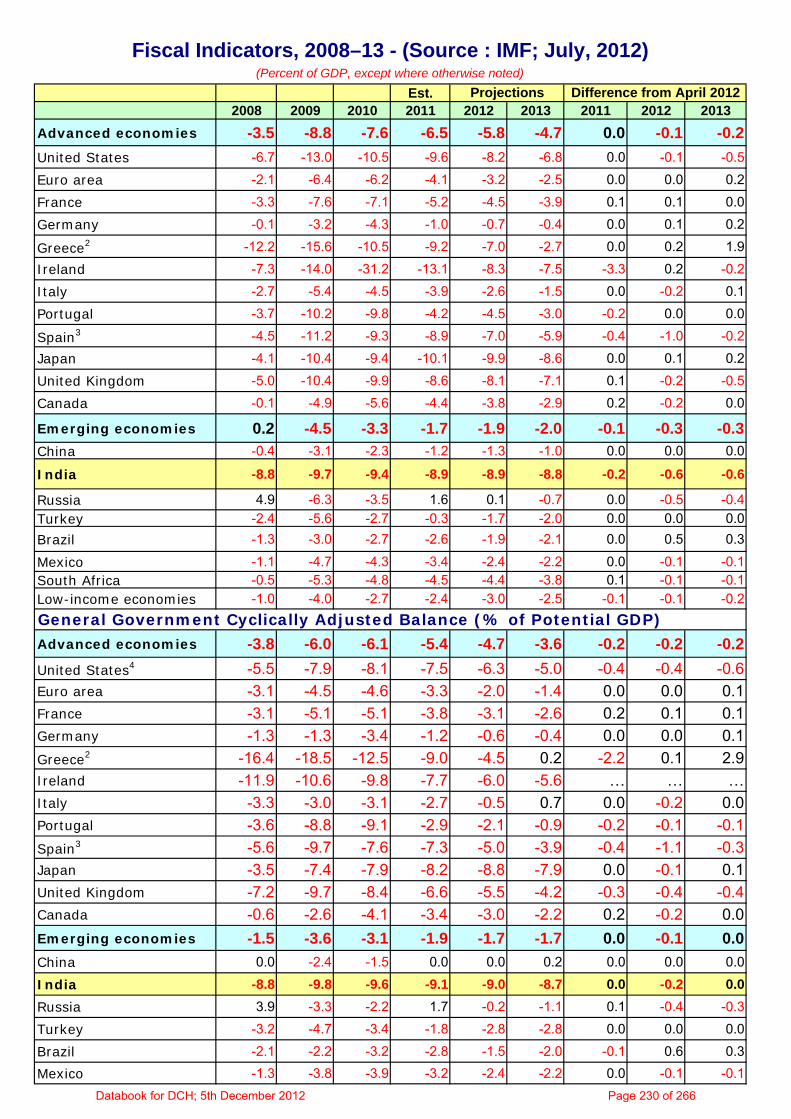
Est.
2008 2009 2010 2011 2012 2013 2011 2012 2013
Advanced economies -3.5 -8.8 -7.6 -6.5 -5.8 -4.7 0.0 -0.1 -0.2
United States -6.7 -13.0 -10.5 -9.6 -8.2 -6.8 0.0 -0.1 -0.5
Euro area -2.1 -6.4 -6.2 -4.1 -3.2 -2.5 0.0 0.0 0.2
France -3.3 -7.6 -7.1 -5.2 -4.5 -3.9 0.1 0.1 0.0
Germany -0.1 -3.2 -4.3 -1.0 -0.7 -0.4 0.0 0.1 0.2
Greece2 -12.2 -15.6 -10.5 -9.2 -7.0 -2.7 0.0 0.2 1.9
Ireland -7.3 -14.0 -31.2 -13.1 -8.3 -7.5 -3.3 0.2 -0.2
Italy -2.7 -5.4 -4.5 -3.9 -2.6 -1.5 0.0 -0.2 0.1
Portugal -3.7 -10.2 -9.8 -4.2 -4.5 -3.0 -0.2 0.0 0.0
Spain3 -4.5 -11.2 -9.3 -8.9 -7.0 -5.9 -0.4 -1.0 -0.2
Japan -4.1 -10.4 -9.4 -10.1 -9.9 -8.6 0.0 0.1 0.2
United Kingdom -5.0 -10.4 -9.9 -8.6 -8.1 -7.1 0.1 -0.2 -0.5
Canada -0.1 -4.9 -5.6 -4.4 -3.8 -2.9 0.2 -0.2 0.0
Emerging economies 0.2 -4.5 -3.3 -1.7 -1.9 -2.0 -0.1 -0.3 -0.3
China -0.4 -3.1 -2.3 -1.2 -1.3 -1.0 0.0 0.0 0.0
India -8.8 -9.7 -9.4 -8.9 -8.9 -8.8 -0.2 -0.6 -0.6
Russia 4.9 -6.3 -3.5 1.6 0.1 -0.7 0.0 -0.5 -0.4 Turkey -2.4 -5.6 -2.7 -0.3 -1.7 -2.0 0.0 0.0 0.0 Brazil -1.3 -3.0 -2.7 -2.6 -1.9 -2.1 0.0 0.5 0.3
Mexico -1.1 -4.7 -4.3 -3.4 -2.4 -2.2 0.0 -0.1 -0.1 South Africa -0.5 -5.3 -4.8 -4.5 -4.4 -3.8 0.1 -0.1 -0.1 Low-income economies -1.0 -4.0 -2.7 -2.4 -3.0 -2.5 -0.1 -0.1 -0.2
Advanced economies -3.8 -6.0 -6.1 -5.4 -4.7 -3.6 -0.2 -0.2 -0.2
United States4 -5.5 -7.9 -8.1 -7.5 -6.3 -5.0 -0.4 -0.4 -0.6 Euro area -3.1 -4.5 -4.6 -3.3 -2.0 -1.4 0.0 0.0 0.1 France -3.1 -5.1 -5.1 -3.8 -3.1 -2.6 0.2 0.1 0.1 Germany -1.3 -1.3 -3.4 -1.2 -0.6 -0.4 0.0 0.0 0.1 Greece2 -16.4 -18.5 -12.5 -9.0 -4.5 0.2 -2.2 0.1 2.9 Ireland -11.9 -10.6 -9.8 -7.7 -6.0 -5.6 … … …Italy -3.3 -3.0 -3.1 -2.7 -0.5 0.7 0.0 -0.2 0.0 Portugal -3.6 -8.8 -9.1 -2.9 -2.1 -0.9 -0.2 -0.1 -0.1 Spain3 -5.6 -9.7 -7.6 -7.3 -5.0 -3.9 -0.4 -1.1 -0.3 Japan -3.5 -7.4 -7.9 -8.2 -8.8 -7.9 0.0 -0.1 0.1 United Kingdom -7.2 -9.7 -8.4 -6.6 -5.5 -4.2 -0.3 -0.4 -0.4 Canada -0.6 -2.6 -4.1 -3.4 -3.0 -2.2 0.2 -0.2 0.0 Emerging economies -1.5 -3.6 -3.1 -1.9 -1.7 -1.7 0.0 -0.1 0.0
China 0.0 -2.4 -1.5 0.0 0.0 0.2 0.0 0.0 0.0
India -8.8 -9.8 -9.6 -9.1 -9.0 -8.7 0.0 -0.2 0.0
Russia 3.9 -3.3 -2.2 1.7 -0.2 -1.1 0.1 -0.4 -0.3
Turkey -3.2 -4.7 -3.4 -1.8 -2.8 -2.8 0.0 0.0 0.0
Brazil -2.1 -2.2 -3.2 -2.8 -1.5 -2.0 -0.1 0.6 0.3 Mexico -1.3 -3.8 -3.9 -3.2 -2.4 -2.2 0.0 -0.1 -0.1
Fiscal Indicators, 2008–13 - (Source : IMF; July, 2012)(Percent of GDP, except where otherwise noted)
Projections Difference from April 2012
General Government Cyclically Adjusted Balance (% of Potential GDP)
Databook for DCH; 5th December 2012 Page 230 of 266
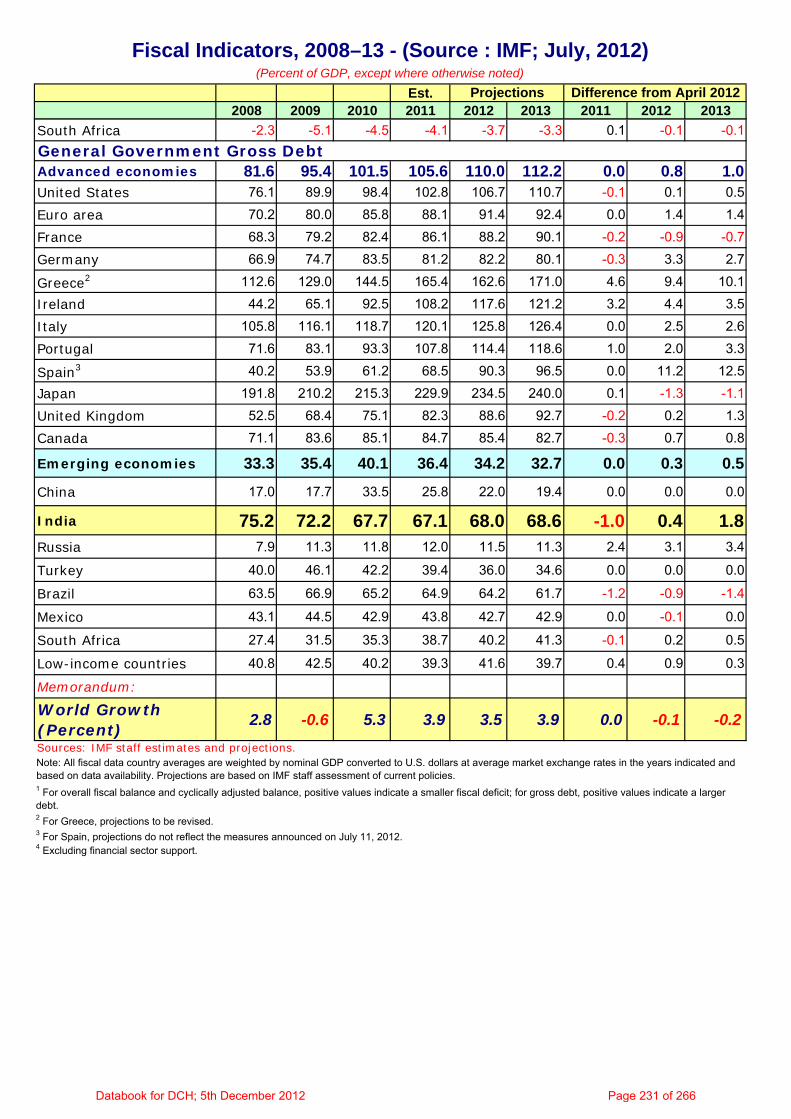
Est.
2008 2009 2010 2011 2012 2013 2011 2012 2013
Fiscal Indicators, 2008–13 - (Source : IMF; July, 2012)(Percent of GDP, except where otherwise noted)
Projections Difference from April 2012
South Africa -2.3 -5.1 -4.5 -4.1 -3.7 -3.3 0.1 -0.1 -0.1
Advanced economies 81.6 95.4 101.5 105.6 110.0 112.2 0.0 0.8 1.0
United States 76.1 89.9 98.4 102.8 106.7 110.7 -0.1 0.1 0.5
Euro area 70.2 80.0 85.8 88.1 91.4 92.4 0.0 1.4 1.4
France 68.3 79.2 82.4 86.1 88.2 90.1 -0.2 -0.9 -0.7
Germany 66.9 74.7 83.5 81.2 82.2 80.1 -0.3 3.3 2.7
Greece2 112.6 129.0 144.5 165.4 162.6 171.0 4.6 9.4 10.1
Ireland 44.2 65.1 92.5 108.2 117.6 121.2 3.2 4.4 3.5
Italy 105.8 116.1 118.7 120.1 125.8 126.4 0.0 2.5 2.6
Portugal 71.6 83.1 93.3 107.8 114.4 118.6 1.0 2.0 3.3
Spain3 40.2 53.9 61.2 68.5 90.3 96.5 0.0 11.2 12.5
Japan 191.8 210.2 215.3 229.9 234.5 240.0 0.1 -1.3 -1.1
United Kingdom 52.5 68.4 75.1 82.3 88.6 92.7 -0.2 0.2 1.3
Canada 71.1 83.6 85.1 84.7 85.4 82.7 -0.3 0.7 0.8
Emerging economies 33.3 35.4 40.1 36.4 34.2 32.7 0.0 0.3 0.5
China 17.0 17.7 33.5 25.8 22.0 19.4 0.0 0.0 0.0
India 75.2 72.2 67.7 67.1 68.0 68.6 -1.0 0.4 1.8
Russia 7.9 11.3 11.8 12.0 11.5 11.3 2.4 3.1 3.4
Turkey 40.0 46.1 42.2 39.4 36.0 34.6 0.0 0.0 0.0
Brazil 63.5 66.9 65.2 64.9 64.2 61.7 -1.2 -0.9 -1.4
Mexico 43.1 44.5 42.9 43.8 42.7 42.9 0.0 -0.1 0.0
South Africa 27.4 31.5 35.3 38.7 40.2 41.3 -0.1 0.2 0.5
Low-income countries 40.8 42.5 40.2 39.3 41.6 39.7 0.4 0.9 0.3
Memorandum:
World Growth (Percent)
2.8 -0.6 5.3 3.9 3.5 3.9 0.0 -0.1 -0.2
4 Excluding financial sector support.
Sources: IMF staff estimates and projections.Note: All fiscal data country averages are weighted by nominal GDP converted to U.S. dollars at average market exchange rates in the years indicated and based on data availability. Projections are based on IMF staff assessment of current policies.1 For overall fiscal balance and cyclically adjusted balance, positive values indicate a smaller fiscal deficit; for gross debt, positive values indicate a larger debt.
General Government Gross Debt
2 For Greece, projections to be revised.3 For Spain, projections do not reflect the measures announced on July 11, 2012.
Databook for DCH; 5th December 2012 Page 231 of 266
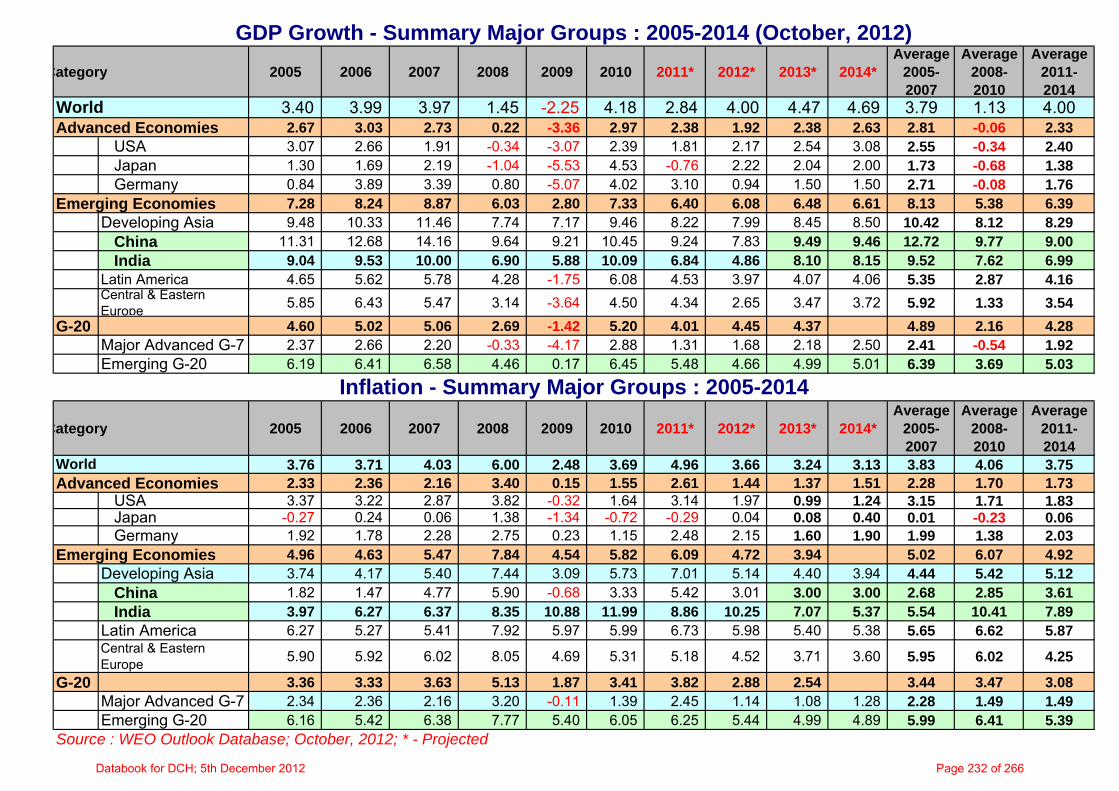
C
C
GDP Growth - Summary Major Groups : 2005-2014 (October, 2012)
ategory 2005 2006 2007 2008 2009 2010 2011* 2012* 2013* 2014*
Average
2005-
2007
Average
2008-
2010
Average
2011-
2014
World 3.40 3.99 3.97 1.45 -2.25 4.18 2.84 4.00 4.47 4.69 3.79 1.13 4.00 Advanced Economies 2.67 3.03 2.73 0.22 -3.36 2.97 2.38 1.92 2.38 2.63 2.81 -0.06 2.33
USA 3.07 2.66 1.91 -0.34 -3.07 2.39 1.81 2.17 2.54 3.08 2.55 -0.34 2.40
Japan 1.30 1.69 2.19 -1.04 -5.53 4.53 -0.76 2.22 2.04 2.00 1.73 -0.68 1.38
Germany 0.84 3.89 3.39 0.80 -5.07 4.02 3.10 0.94 1.50 1.50 2.71 -0.08 1.76
Emerging Economies 7.28 8.24 8.87 6.03 2.80 7.33 6.40 6.08 6.48 6.61 8.13 5.38 6.39
Developing Asia 9.48 10.33 11.46 7.74 7.17 9.46 8.22 7.99 8.45 8.50 10.42 8.12 8.29
China 11.31 12.68 14.16 9.64 9.21 10.45 9.24 7.83 9.49 9.46 12.72 9.77 9.00
India 9.04 9.53 10.00 6.90 5.88 10.09 6.84 4.86 8.10 8.15 9.52 7.62 6.99
Latin America 4.65 5.62 5.78 4.28 -1.75 6.08 4.53 3.97 4.07 4.06 5.35 2.87 4.16 Central & Eastern Europe 5.85 6.43 5.47 3.14 -3.64 4.50 4.34 2.65 3.47 3.72 5.92 1.33 3.54
G-20 4.60 5.02 5.06 2.69 -1.42 5.20 4.01 4.45 4.37 4.89 2.16 4.28
Major Advanced G-7 2.37 2.66 2.20 -0.33 -4.17 2.88 1.31 1.68 2.18 2.50 2.41 -0.54 1.92
Emerging G-20 6.19 6.41 6.58 4.46 0.17 6.45 5.48 4.66 4.99 5.01 6.39 3.69 5.03
Inflation - Summary Major Groups : 2005-2014
ategory 2005 2006 2007 2008 2009 2010 2011* 2012* 2013* 2014*
Average
2005-
2007
Average
2008-
2010
Average
2011-
2014
World 3.76 3.71 4.03 6.00 2.48 3.69 4.96 3.66 3.24 3.13 3.83 4.06 3.75
Advanced Economies 2.33 2.36 2.16 3.40 0.15 1.55 2.61 1.44 1.37 1.51 2.28 1.70 1.73
USA 3.37 3.22 2.87 3.82 -0.32 1.64 3.14 1.97 0.99 1.24 3.15 1.71 1.83 Japan -0.27 0.24 0.06 1.38 -1.34 -0.72 -0.29 0.04 0.08 0.40 0.01 -0.23 0.06
Germany 1.92 1.78 2.28 2.75 0.23 1.15 2.48 2.15 1.60 1.90 1.99 1.38 2.03
Emerging Economies 4.96 4.63 5.47 7.84 4.54 5.82 6.09 4.72 3.94 5.02 6.07 4.92
Developing Asia 3.74 4.17 5.40 7.44 3.09 5.73 7.01 5.14 4.40 3.94 4.44 5.42 5.12
China 1.82 1.47 4.77 5.90 -0.68 3.33 5.42 3.01 3.00 3.00 2.68 2.85 3.61
India 3.97 6.27 6.37 8.35 10.88 11.99 8.86 10.25 7.07 5.37 5.54 10.41 7.89
Latin America 6.27 5.27 5.41 7.92 5.97 5.99 6.73 5.98 5.40 5.38 5.65 6.62 5.87
Central & Eastern Europe 5.90 5.92 6.02 8.05 4.69 5.31 5.18 4.52 3.71 3.60 5.95 6.02 4.25
G-20 3.36 3.33 3.63 5.13 1.87 3.41 3.82 2.88 2.54 3.44 3.47 3.08
Major Advanced G-7 2.34 2.36 2.16 3.20 -0.11 1.39 2.45 1.14 1.08 1.28 2.28 1.49 1.49
Emerging G-20 6.16 5.42 6.38 7.77 5.40 6.05 6.25 5.44 4.99 4.89 5.99 6.41 5.39
Source : WEO Outlook Database; October, 2012; * - Projected
Databook for DCH; 5th December 2012 Page 232 of 266
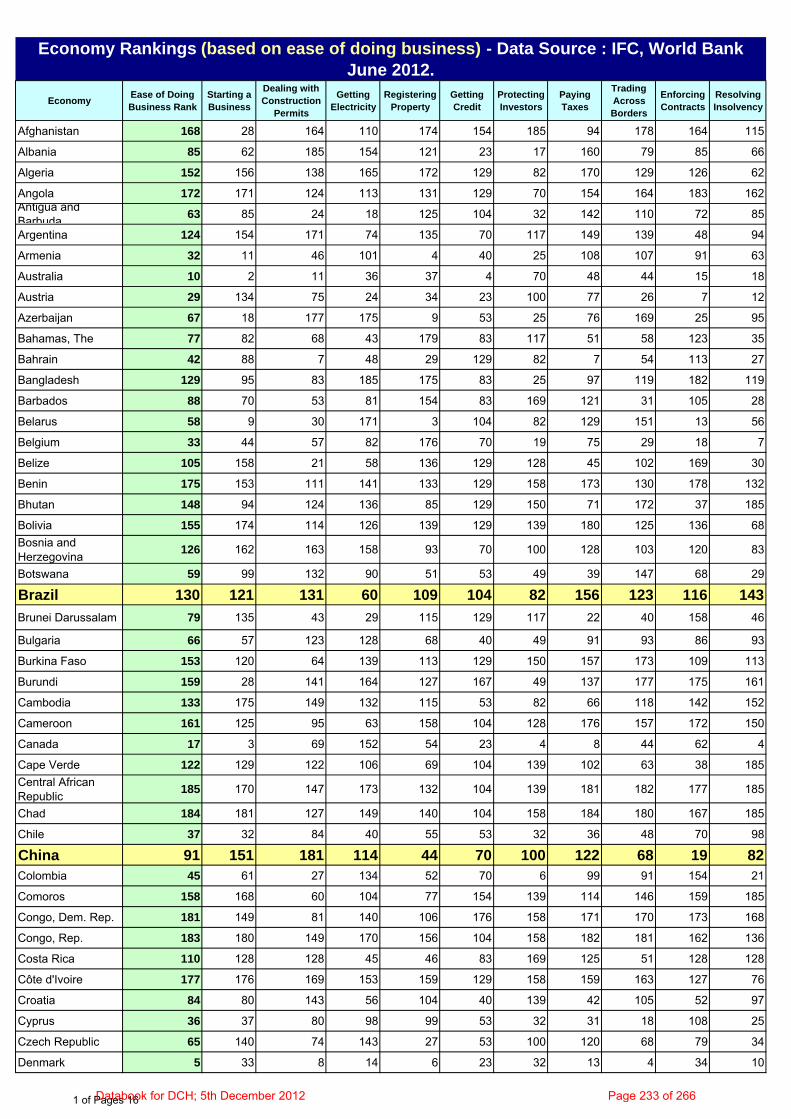
EconomyEase of Doing
Business Rank
Starting a
Business
Dealing with
Construction
Permits
Getting
Electricity
Registering
Property
Getting
Credit
Protecting
Investors
Paying
Taxes
Trading
Across
Borders
Enforcing
Contracts
Resolving
Insolvency
Afghanistan 168 28 164 110 174 154 185 94 178 164 115
Albania 85 62 185 154 121 23 17 160 79 85 66
Algeria 152 156 138 165 172 129 82 170 129 126 62
Angola 172 171 124 113 131 129 70 154 164 183 162Antigua and Barbuda 63 85 24 18 125 104 32 142 110 72 85
Argentina 124 154 171 74 135 70 117 149 139 48 94
Armenia 32 11 46 101 4 40 25 108 107 91 63
Australia 10 2 11 36 37 4 70 48 44 15 18
Austria 29 134 75 24 34 23 100 77 26 7 12
Azerbaijan 67 18 177 175 9 53 25 76 169 25 95
Bahamas, The 77 82 68 43 179 83 117 51 58 123 35
Bahrain 42 88 7 48 29 129 82 7 54 113 27
Bangladesh 129 95 83 185 175 83 25 97 119 182 119
Barbados 88 70 53 81 154 83 169 121 31 105 28
Belarus 58 9 30 171 3 104 82 129 151 13 56
Belgium 33 44 57 82 176 70 19 75 29 18 7
Belize 105 158 21 58 136 129 128 45 102 169 30
Benin 175 153 111 141 133 129 158 173 130 178 132
Bhutan 148 94 124 136 85 129 150 71 172 37 185
Bolivia 155 174 114 126 139 129 139 180 125 136 68Bosnia and Herzegovina 126 162 163 158 93 70 100 128 103 120 83
Botswana 59 99 132 90 51 53 49 39 147 68 29
Brazil 130 121 131 60 109 104 82 156 123 116 143
Brunei Darussalam 79 135 43 29 115 129 117 22 40 158 46
Bulgaria 66 57 123 128 68 40 49 91 93 86 93
Burkina Faso 153 120 64 139 113 129 150 157 173 109 113
Burundi 159 28 141 164 127 167 49 137 177 175 161
Cambodia 133 175 149 132 115 53 82 66 118 142 152
Cameroon 161 125 95 63 158 104 128 176 157 172 150
Canada 17 3 69 152 54 23 4 8 44 62 4
Cape Verde 122 129 122 106 69 104 139 102 63 38 185Central African Republic 185 170 147 173 132 104 139 181 182 177 185
Chad 184 181 127 149 140 104 158 184 180 167 185
Chile 37 32 84 40 55 53 32 36 48 70 98
China 91 151 181 114 44 70 100 122 68 19 82
Colombia 45 61 27 134 52 70 6 99 91 154 21
Comoros 158 168 60 104 77 154 139 114 146 159 185
Congo, Dem. Rep. 181 149 81 140 106 176 158 171 170 173 168
Congo, Rep. 183 180 149 170 156 104 158 182 181 162 136
Costa Rica 110 128 128 45 46 83 169 125 51 128 128
Côte d'Ivoire 177 176 169 153 159 129 158 159 163 127 76
Croatia 84 80 143 56 104 40 139 42 105 52 97
Cyprus 36 37 80 98 99 53 32 31 18 108 25
Czech Republic 65 140 74 143 27 53 100 120 68 79 34
Denmark 5 33 8 14 6 23 32 13 4 34 10
Economy Rankings (based on ease of doing business) - Data Source : IFC, World Bank
June 2012.
1 of Pages 16Databook for DCH; 5th December 2012 Page 233 of 266
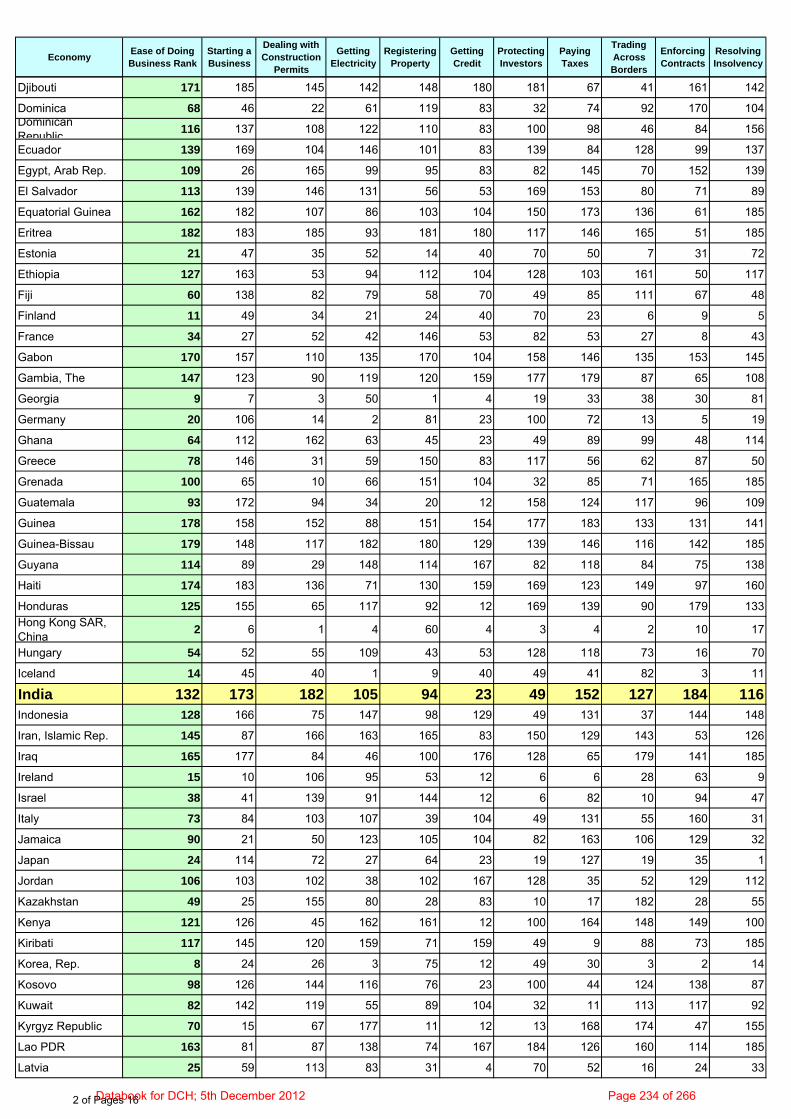
EconomyEase of Doing
Business Rank
Starting a
Business
Dealing with
Construction
Permits
Getting
Electricity
Registering
Property
Getting
Credit
Protecting
Investors
Paying
Taxes
Trading
Across
Borders
Enforcing
Contracts
Resolving
Insolvency
Djibouti 171 185 145 142 148 180 181 67 41 161 142
Dominica 68 46 22 61 119 83 32 74 92 170 104Dominican Republic 116 137 108 122 110 83 100 98 46 84 156
Ecuador 139 169 104 146 101 83 139 84 128 99 137
Egypt, Arab Rep. 109 26 165 99 95 83 82 145 70 152 139
El Salvador 113 139 146 131 56 53 169 153 80 71 89
Equatorial Guinea 162 182 107 86 103 104 150 173 136 61 185
Eritrea 182 183 185 93 181 180 117 146 165 51 185
Estonia 21 47 35 52 14 40 70 50 7 31 72
Ethiopia 127 163 53 94 112 104 128 103 161 50 117
Fiji 60 138 82 79 58 70 49 85 111 67 48
Finland 11 49 34 21 24 40 70 23 6 9 5
France 34 27 52 42 146 53 82 53 27 8 43
Gabon 170 157 110 135 170 104 158 146 135 153 145
Gambia, The 147 123 90 119 120 159 177 179 87 65 108
Georgia 9 7 3 50 1 4 19 33 38 30 81
Germany 20 106 14 2 81 23 100 72 13 5 19
Ghana 64 112 162 63 45 23 49 89 99 48 114
Greece 78 146 31 59 150 83 117 56 62 87 50
Grenada 100 65 10 66 151 104 32 85 71 165 185
Guatemala 93 172 94 34 20 12 158 124 117 96 109
Guinea 178 158 152 88 151 154 177 183 133 131 141
Guinea-Bissau 179 148 117 182 180 129 139 146 116 142 185
Guyana 114 89 29 148 114 167 82 118 84 75 138
Haiti 174 183 136 71 130 159 169 123 149 97 160
Honduras 125 155 65 117 92 12 169 139 90 179 133Hong Kong SAR, China 2 6 1 4 60 4 3 4 2 10 17
Hungary 54 52 55 109 43 53 128 118 73 16 70
Iceland 14 45 40 1 9 40 49 41 82 3 11
India 132 173 182 105 94 23 49 152 127 184 116
Indonesia 128 166 75 147 98 129 49 131 37 144 148
Iran, Islamic Rep. 145 87 166 163 165 83 150 129 143 53 126
Iraq 165 177 84 46 100 176 128 65 179 141 185
Ireland 15 10 106 95 53 12 6 6 28 63 9
Israel 38 41 139 91 144 12 6 82 10 94 47
Italy 73 84 103 107 39 104 49 131 55 160 31
Jamaica 90 21 50 123 105 104 82 163 106 129 32
Japan 24 114 72 27 64 23 19 127 19 35 1
Jordan 106 103 102 38 102 167 128 35 52 129 112
Kazakhstan 49 25 155 80 28 83 10 17 182 28 55
Kenya 121 126 45 162 161 12 100 164 148 149 100
Kiribati 117 145 120 159 71 159 49 9 88 73 185
Korea, Rep. 8 24 26 3 75 12 49 30 3 2 14
Kosovo 98 126 144 116 76 23 100 44 124 138 87
Kuwait 82 142 119 55 89 104 32 11 113 117 92
Kyrgyz Republic 70 15 67 177 11 12 13 168 174 47 155
Lao PDR 163 81 87 138 74 167 184 126 160 114 185
Latvia 25 59 113 83 31 4 70 52 16 24 33
2 of Pages 16Databook for DCH; 5th December 2012 Page 234 of 266
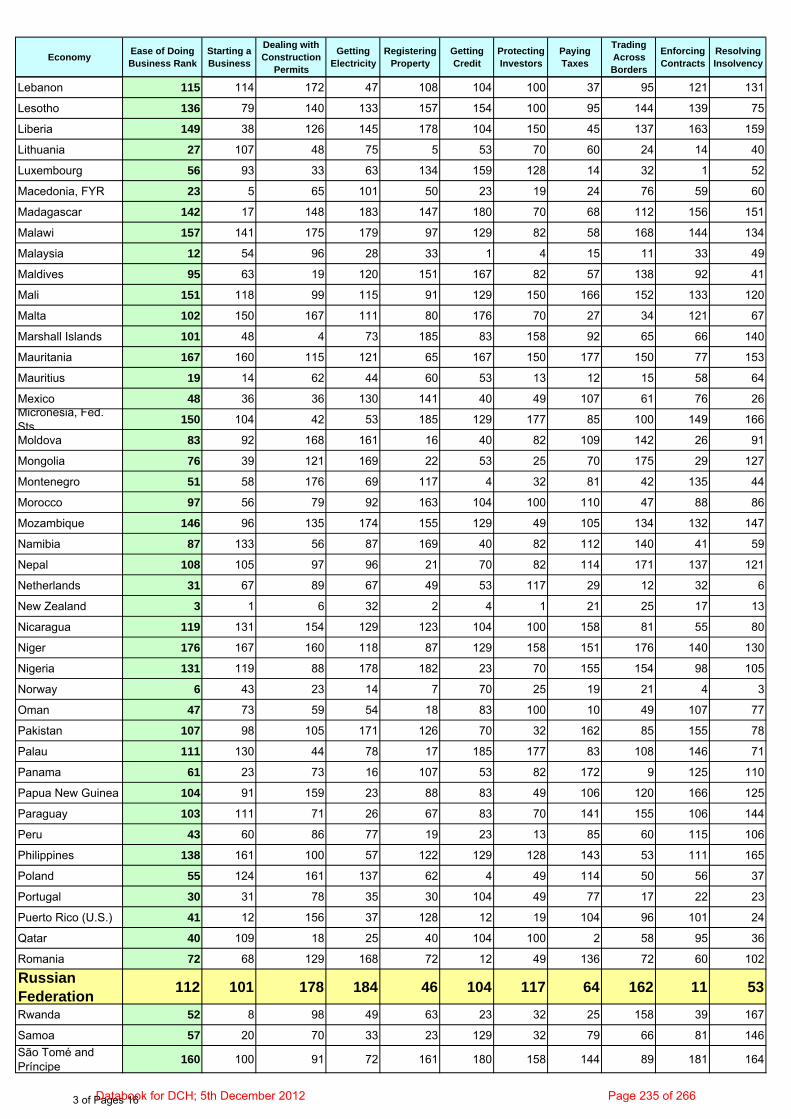
EconomyEase of Doing
Business Rank
Starting a
Business
Dealing with
Construction
Permits
Getting
Electricity
Registering
Property
Getting
Credit
Protecting
Investors
Paying
Taxes
Trading
Across
Borders
Enforcing
Contracts
Resolving
Insolvency
Lebanon 115 114 172 47 108 104 100 37 95 121 131
Lesotho 136 79 140 133 157 154 100 95 144 139 75
Liberia 149 38 126 145 178 104 150 45 137 163 159
Lithuania 27 107 48 75 5 53 70 60 24 14 40
Luxembourg 56 93 33 63 134 159 128 14 32 1 52
Macedonia, FYR 23 5 65 101 50 23 19 24 76 59 60
Madagascar 142 17 148 183 147 180 70 68 112 156 151
Malawi 157 141 175 179 97 129 82 58 168 144 134
Malaysia 12 54 96 28 33 1 4 15 11 33 49
Maldives 95 63 19 120 151 167 82 57 138 92 41
Mali 151 118 99 115 91 129 150 166 152 133 120
Malta 102 150 167 111 80 176 70 27 34 121 67
Marshall Islands 101 48 4 73 185 83 158 92 65 66 140
Mauritania 167 160 115 121 65 167 150 177 150 77 153
Mauritius 19 14 62 44 60 53 13 12 15 58 64
Mexico 48 36 36 130 141 40 49 107 61 76 26Micronesia, Fed. Sts 150 104 42 53 185 129 177 85 100 149 166
Moldova 83 92 168 161 16 40 82 109 142 26 91
Mongolia 76 39 121 169 22 53 25 70 175 29 127
Montenegro 51 58 176 69 117 4 32 81 42 135 44
Morocco 97 56 79 92 163 104 100 110 47 88 86
Mozambique 146 96 135 174 155 129 49 105 134 132 147
Namibia 87 133 56 87 169 40 82 112 140 41 59
Nepal 108 105 97 96 21 70 82 114 171 137 121
Netherlands 31 67 89 67 49 53 117 29 12 32 6
New Zealand 3 1 6 32 2 4 1 21 25 17 13
Nicaragua 119 131 154 129 123 104 100 158 81 55 80
Niger 176 167 160 118 87 129 158 151 176 140 130
Nigeria 131 119 88 178 182 23 70 155 154 98 105
Norway 6 43 23 14 7 70 25 19 21 4 3
Oman 47 73 59 54 18 83 100 10 49 107 77
Pakistan 107 98 105 171 126 70 32 162 85 155 78
Palau 111 130 44 78 17 185 177 83 108 146 71
Panama 61 23 73 16 107 53 82 172 9 125 110
Papua New Guinea 104 91 159 23 88 83 49 106 120 166 125
Paraguay 103 111 71 26 67 83 70 141 155 106 144
Peru 43 60 86 77 19 23 13 85 60 115 106
Philippines 138 161 100 57 122 129 128 143 53 111 165
Poland 55 124 161 137 62 4 49 114 50 56 37
Portugal 30 31 78 35 30 104 49 77 17 22 23
Puerto Rico (U.S.) 41 12 156 37 128 12 19 104 96 101 24
Qatar 40 109 18 25 40 104 100 2 58 95 36
Romania 72 68 129 168 72 12 49 136 72 60 102
Russian
Federation112 101 178 184 46 104 117 64 162 11 53
Rwanda 52 8 98 49 63 23 32 25 158 39 167
Samoa 57 20 70 33 23 129 32 79 66 81 146São Tomé and Príncipe 160 100 91 72 161 180 158 144 89 181 164
3 of Pages 16Databook for DCH; 5th December 2012 Page 235 of 266
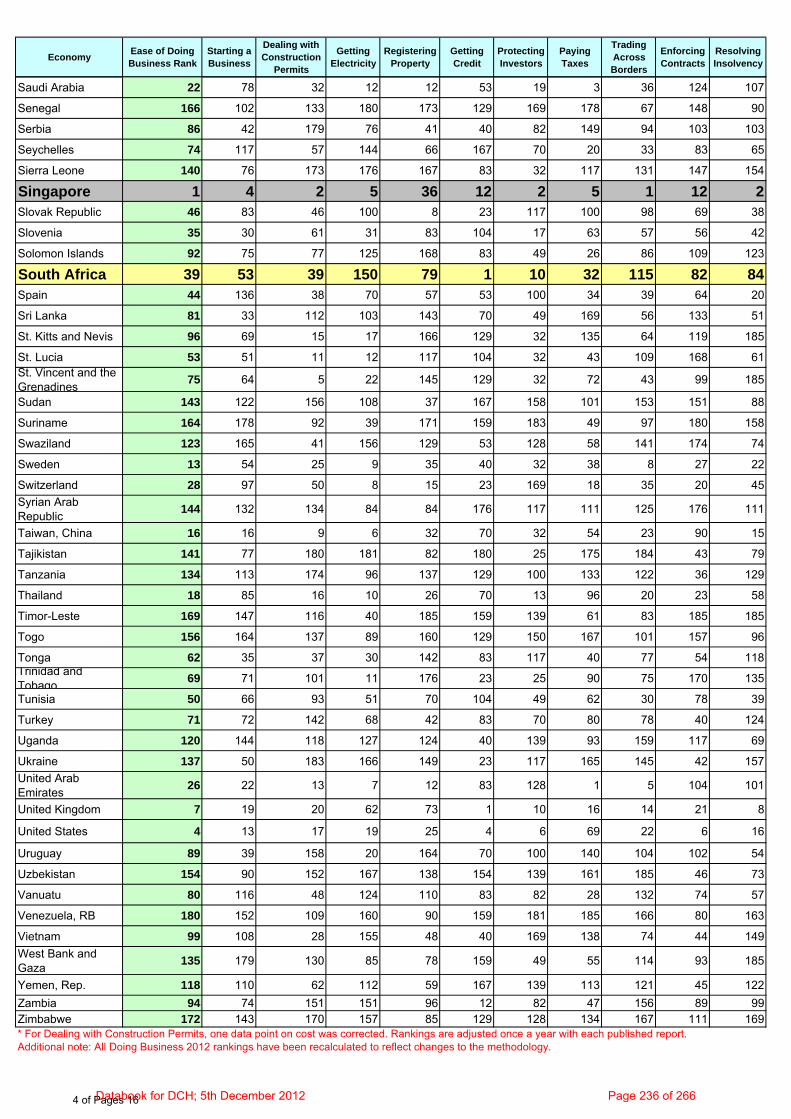
EconomyEase of Doing
Business Rank
Starting a
Business
Dealing with
Construction
Permits
Getting
Electricity
Registering
Property
Getting
Credit
Protecting
Investors
Paying
Taxes
Trading
Across
Borders
Enforcing
Contracts
Resolving
Insolvency
Saudi Arabia 22 78 32 12 12 53 19 3 36 124 107
Senegal 166 102 133 180 173 129 169 178 67 148 90
Serbia 86 42 179 76 41 40 82 149 94 103 103
Seychelles 74 117 57 144 66 167 70 20 33 83 65
Sierra Leone 140 76 173 176 167 83 32 117 131 147 154
Singapore 1 4 2 5 36 12 2 5 1 12 2
Slovak Republic 46 83 46 100 8 23 117 100 98 69 38
Slovenia 35 30 61 31 83 104 17 63 57 56 42
Solomon Islands 92 75 77 125 168 83 49 26 86 109 123
South Africa 39 53 39 150 79 1 10 32 115 82 84
Spain 44 136 38 70 57 53 100 34 39 64 20
Sri Lanka 81 33 112 103 143 70 49 169 56 133 51
St. Kitts and Nevis 96 69 15 17 166 129 32 135 64 119 185
St. Lucia 53 51 11 12 117 104 32 43 109 168 61St. Vincent and the Grenadines 75 64 5 22 145 129 32 72 43 99 185
Sudan 143 122 156 108 37 167 158 101 153 151 88
Suriname 164 178 92 39 171 159 183 49 97 180 158
Swaziland 123 165 41 156 129 53 128 58 141 174 74
Sweden 13 54 25 9 35 40 32 38 8 27 22
Switzerland 28 97 50 8 15 23 169 18 35 20 45Syrian Arab Republic 144 132 134 84 84 176 117 111 125 176 111
Taiwan, China 16 16 9 6 32 70 32 54 23 90 15
Tajikistan 141 77 180 181 82 180 25 175 184 43 79
Tanzania 134 113 174 96 137 129 100 133 122 36 129
Thailand 18 85 16 10 26 70 13 96 20 23 58
Timor-Leste 169 147 116 40 185 159 139 61 83 185 185
Togo 156 164 137 89 160 129 150 167 101 157 96
Tonga 62 35 37 30 142 83 117 40 77 54 118Trinidad and Tobago 69 71 101 11 176 23 25 90 75 170 135
Tunisia 50 66 93 51 70 104 49 62 30 78 39
Turkey 71 72 142 68 42 83 70 80 78 40 124
Uganda 120 144 118 127 124 40 139 93 159 117 69
Ukraine 137 50 183 166 149 23 117 165 145 42 157United Arab Emirates 26 22 13 7 12 83 128 1 5 104 101
United Kingdom 7 19 20 62 73 1 10 16 14 21 8
United States 4 13 17 19 25 4 6 69 22 6 16
Uruguay 89 39 158 20 164 70 100 140 104 102 54
Uzbekistan 154 90 152 167 138 154 139 161 185 46 73
Vanuatu 80 116 48 124 110 83 82 28 132 74 57
Venezuela, RB 180 152 109 160 90 159 181 185 166 80 163
Vietnam 99 108 28 155 48 40 169 138 74 44 149West Bank and Gaza 135 179 130 85 78 159 49 55 114 93 185
Yemen, Rep. 118 110 62 112 59 167 139 113 121 45 122Zambia 94 74 151 151 96 12 82 47 156 89 99Zimbabwe 172 143 170 157 85 129 128 134 167 111 169* For Dealing with Construction Permits, one data point on cost was corrected. Rankings are adjusted once a year with each published report.Additional note: All Doing Business 2012 rankings have been recalculated to reflect changes to the methodology.
4 of Pages 16Databook for DCH; 5th December 2012 Page 236 of 266
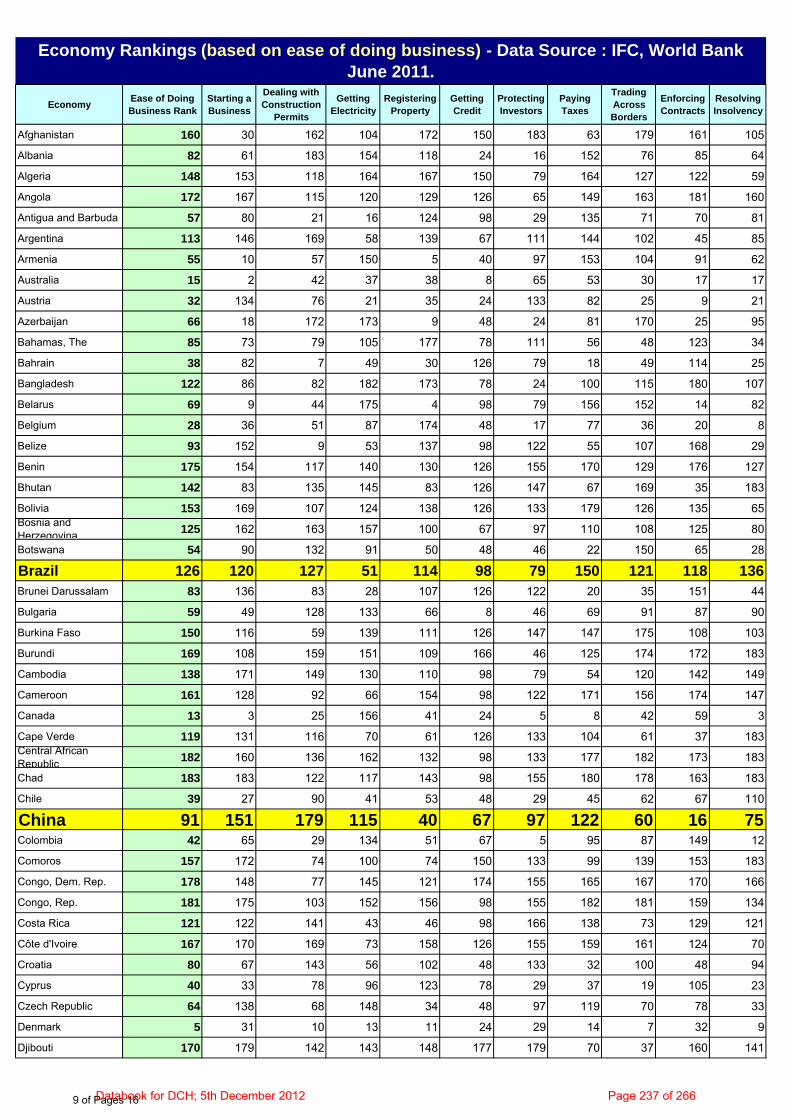
EconomyEase of Doing
Business Rank
Starting a
Business
Dealing with
Construction
Permits
Getting
Electricity
Registering
Property
Getting
Credit
Protecting
Investors
Paying
Taxes
Trading
Across
Borders
Enforcing
Contracts
Resolving
Insolvency
Afghanistan 160 30 162 104 172 150 183 63 179 161 105
Albania 82 61 183 154 118 24 16 152 76 85 64
Algeria 148 153 118 164 167 150 79 164 127 122 59
Angola 172 167 115 120 129 126 65 149 163 181 160
Antigua and Barbuda 57 80 21 16 124 98 29 135 71 70 81
Argentina 113 146 169 58 139 67 111 144 102 45 85
Armenia 55 10 57 150 5 40 97 153 104 91 62
Australia 15 2 42 37 38 8 65 53 30 17 17
Austria 32 134 76 21 35 24 133 82 25 9 21
Azerbaijan 66 18 172 173 9 48 24 81 170 25 95
Bahamas, The 85 73 79 105 177 78 111 56 48 123 34
Bahrain 38 82 7 49 30 126 79 18 49 114 25
Bangladesh 122 86 82 182 173 78 24 100 115 180 107
Belarus 69 9 44 175 4 98 79 156 152 14 82
Belgium 28 36 51 87 174 48 17 77 36 20 8
Belize 93 152 9 53 137 98 122 55 107 168 29
Benin 175 154 117 140 130 126 155 170 129 176 127
Bhutan 142 83 135 145 83 126 147 67 169 35 183
Bolivia 153 169 107 124 138 126 133 179 126 135 65Bosnia and Herzegovina 125 162 163 157 100 67 97 110 108 125 80
Botswana 54 90 132 91 50 48 46 22 150 65 28
Brazil 126 120 127 51 114 98 79 150 121 118 136
Brunei Darussalam 83 136 83 28 107 126 122 20 35 151 44
Bulgaria 59 49 128 133 66 8 46 69 91 87 90
Burkina Faso 150 116 59 139 111 126 147 147 175 108 103
Burundi 169 108 159 151 109 166 46 125 174 172 183
Cambodia 138 171 149 130 110 98 79 54 120 142 149
Cameroon 161 128 92 66 154 98 122 171 156 174 147
Canada 13 3 25 156 41 24 5 8 42 59 3
Cape Verde 119 131 116 70 61 126 133 104 61 37 183Central African Republic 182 160 136 162 132 98 133 177 182 173 183
Chad 183 183 122 117 143 98 155 180 178 163 183
Chile 39 27 90 41 53 48 29 45 62 67 110
China 91 151 179 115 40 67 97 122 60 16 75Colombia 42 65 29 134 51 67 5 95 87 149 12
Comoros 157 172 74 100 74 150 133 99 139 153 183
Congo, Dem. Rep. 178 148 77 145 121 174 155 165 167 170 166
Congo, Rep. 181 175 103 152 156 98 155 182 181 159 134
Costa Rica 121 122 141 43 46 98 166 138 73 129 121
Côte d'Ivoire 167 170 169 73 158 126 155 159 161 124 70
Croatia 80 67 143 56 102 48 133 32 100 48 94
Cyprus 40 33 78 96 123 78 29 37 19 105 23
Czech Republic 64 138 68 148 34 48 97 119 70 78 33
Denmark 5 31 10 13 11 24 29 14 7 32 9
Djibouti 170 179 142 143 148 177 179 70 37 160 141
Economy Rankings (based on ease of doing business) - Data Source : IFC, World Bank
June 2011.
9 of Pages 16Databook for DCH; 5th December 2012 Page 237 of 266
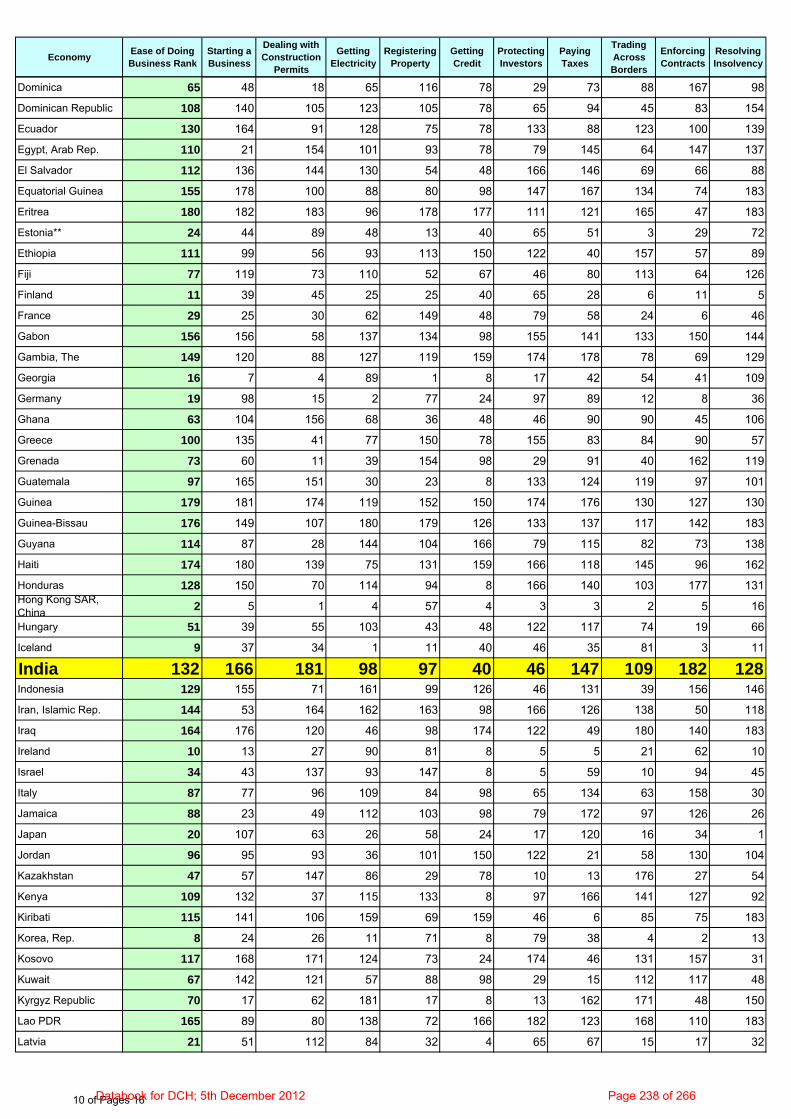
EconomyEase of Doing
Business Rank
Starting a
Business
Dealing with
Construction
Permits
Getting
Electricity
Registering
Property
Getting
Credit
Protecting
Investors
Paying
Taxes
Trading
Across
Borders
Enforcing
Contracts
Resolving
Insolvency
Dominica 65 48 18 65 116 78 29 73 88 167 98
Dominican Republic 108 140 105 123 105 78 65 94 45 83 154
Ecuador 130 164 91 128 75 78 133 88 123 100 139
Egypt, Arab Rep. 110 21 154 101 93 78 79 145 64 147 137
El Salvador 112 136 144 130 54 48 166 146 69 66 88
Equatorial Guinea 155 178 100 88 80 98 147 167 134 74 183
Eritrea 180 182 183 96 178 177 111 121 165 47 183
Estonia** 24 44 89 48 13 40 65 51 3 29 72
Ethiopia 111 99 56 93 113 150 122 40 157 57 89
Fiji 77 119 73 110 52 67 46 80 113 64 126
Finland 11 39 45 25 25 40 65 28 6 11 5
France 29 25 30 62 149 48 79 58 24 6 46
Gabon 156 156 58 137 134 98 155 141 133 150 144
Gambia, The 149 120 88 127 119 159 174 178 78 69 129
Georgia 16 7 4 89 1 8 17 42 54 41 109
Germany 19 98 15 2 77 24 97 89 12 8 36
Ghana 63 104 156 68 36 48 46 90 90 45 106
Greece 100 135 41 77 150 78 155 83 84 90 57
Grenada 73 60 11 39 154 98 29 91 40 162 119
Guatemala 97 165 151 30 23 8 133 124 119 97 101
Guinea 179 181 174 119 152 150 174 176 130 127 130
Guinea-Bissau 176 149 107 180 179 126 133 137 117 142 183
Guyana 114 87 28 144 104 166 79 115 82 73 138
Haiti 174 180 139 75 131 159 166 118 145 96 162
Honduras 128 150 70 114 94 8 166 140 103 177 131Hong Kong SAR, China 2 5 1 4 57 4 3 3 2 5 16
Hungary 51 39 55 103 43 48 122 117 74 19 66
Iceland 9 37 34 1 11 40 46 35 81 3 11
India 132 166 181 98 97 40 46 147 109 182 128Indonesia 129 155 71 161 99 126 46 131 39 156 146
Iran, Islamic Rep. 144 53 164 162 163 98 166 126 138 50 118
Iraq 164 176 120 46 98 174 122 49 180 140 183
Ireland 10 13 27 90 81 8 5 5 21 62 10
Israel 34 43 137 93 147 8 5 59 10 94 45
Italy 87 77 96 109 84 98 65 134 63 158 30
Jamaica 88 23 49 112 103 98 79 172 97 126 26
Japan 20 107 63 26 58 24 17 120 16 34 1
Jordan 96 95 93 36 101 150 122 21 58 130 104
Kazakhstan 47 57 147 86 29 78 10 13 176 27 54
Kenya 109 132 37 115 133 8 97 166 141 127 92
Kiribati 115 141 106 159 69 159 46 6 85 75 183
Korea, Rep. 8 24 26 11 71 8 79 38 4 2 13
Kosovo 117 168 171 124 73 24 174 46 131 157 31
Kuwait 67 142 121 57 88 98 29 15 112 117 48
Kyrgyz Republic 70 17 62 181 17 8 13 162 171 48 150
Lao PDR 165 89 80 138 72 166 182 123 168 110 183
Latvia 21 51 112 84 32 4 65 67 15 17 32
10 of Pages 16Databook for DCH; 5th December 2012 Page 238 of 266
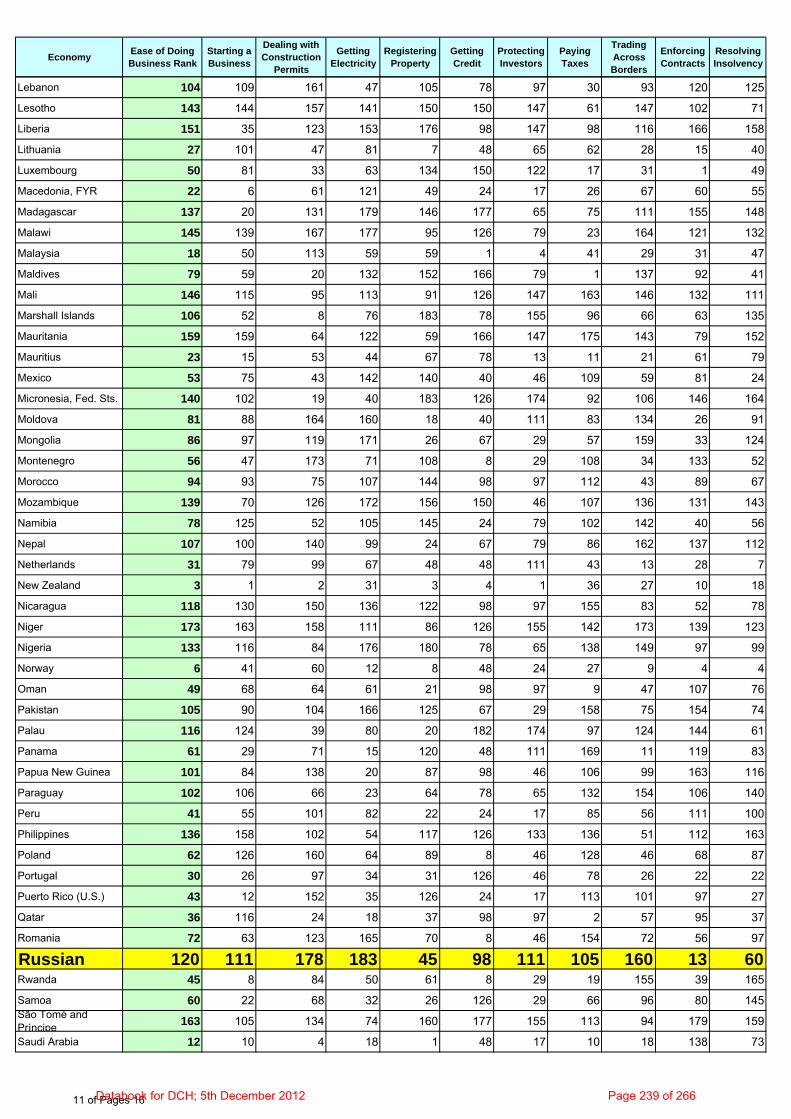
EconomyEase of Doing
Business Rank
Starting a
Business
Dealing with
Construction
Permits
Getting
Electricity
Registering
Property
Getting
Credit
Protecting
Investors
Paying
Taxes
Trading
Across
Borders
Enforcing
Contracts
Resolving
Insolvency
Lebanon 104 109 161 47 105 78 97 30 93 120 125
Lesotho 143 144 157 141 150 150 147 61 147 102 71
Liberia 151 35 123 153 176 98 147 98 116 166 158
Lithuania 27 101 47 81 7 48 65 62 28 15 40
Luxembourg 50 81 33 63 134 150 122 17 31 1 49
Macedonia, FYR 22 6 61 121 49 24 17 26 67 60 55
Madagascar 137 20 131 179 146 177 65 75 111 155 148
Malawi 145 139 167 177 95 126 79 23 164 121 132
Malaysia 18 50 113 59 59 1 4 41 29 31 47
Maldives 79 59 20 132 152 166 79 1 137 92 41
Mali 146 115 95 113 91 126 147 163 146 132 111
Marshall Islands 106 52 8 76 183 78 155 96 66 63 135
Mauritania 159 159 64 122 59 166 147 175 143 79 152
Mauritius 23 15 53 44 67 78 13 11 21 61 79
Mexico 53 75 43 142 140 40 46 109 59 81 24
Micronesia, Fed. Sts. 140 102 19 40 183 126 174 92 106 146 164
Moldova 81 88 164 160 18 40 111 83 134 26 91
Mongolia 86 97 119 171 26 67 29 57 159 33 124
Montenegro 56 47 173 71 108 8 29 108 34 133 52
Morocco 94 93 75 107 144 98 97 112 43 89 67
Mozambique 139 70 126 172 156 150 46 107 136 131 143
Namibia 78 125 52 105 145 24 79 102 142 40 56
Nepal 107 100 140 99 24 67 79 86 162 137 112
Netherlands 31 79 99 67 48 48 111 43 13 28 7
New Zealand 3 1 2 31 3 4 1 36 27 10 18
Nicaragua 118 130 150 136 122 98 97 155 83 52 78
Niger 173 163 158 111 86 126 155 142 173 139 123
Nigeria 133 116 84 176 180 78 65 138 149 97 99
Norway 6 41 60 12 8 48 24 27 9 4 4
Oman 49 68 64 61 21 98 97 9 47 107 76
Pakistan 105 90 104 166 125 67 29 158 75 154 74
Palau 116 124 39 80 20 182 174 97 124 144 61
Panama 61 29 71 15 120 48 111 169 11 119 83
Papua New Guinea 101 84 138 20 87 98 46 106 99 163 116
Paraguay 102 106 66 23 64 78 65 132 154 106 140
Peru 41 55 101 82 22 24 17 85 56 111 100
Philippines 136 158 102 54 117 126 133 136 51 112 163
Poland 62 126 160 64 89 8 46 128 46 68 87
Portugal 30 26 97 34 31 126 46 78 26 22 22
Puerto Rico (U.S.) 43 12 152 35 126 24 17 113 101 97 27
Qatar 36 116 24 18 37 98 97 2 57 95 37
Romania 72 63 123 165 70 8 46 154 72 56 97
Russian 120 111 178 183 45 98 111 105 160 13 60Rwanda 45 8 84 50 61 8 29 19 155 39 165
Samoa 60 22 68 32 26 126 29 66 96 80 145São Tomé and Príncipe 163 105 134 74 160 177 155 113 94 179 159
Saudi Arabia 12 10 4 18 1 48 17 10 18 138 73
11 of Pages 16Databook for DCH; 5th December 2012 Page 239 of 266
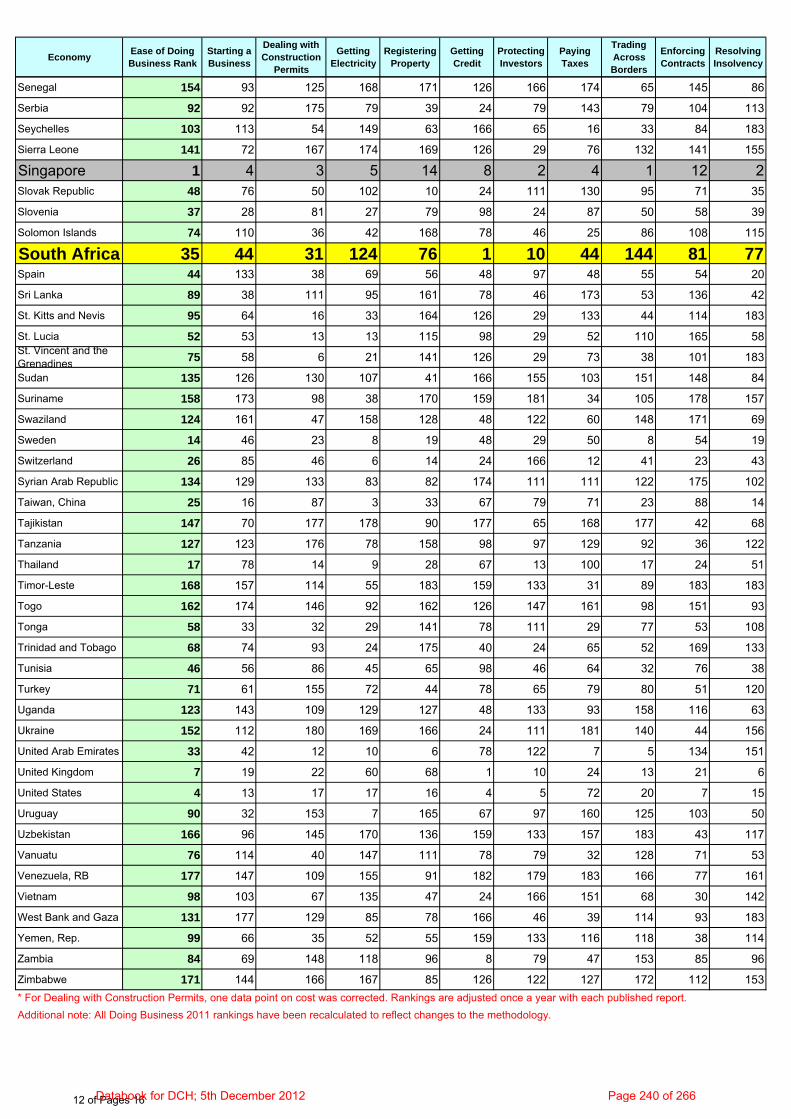
EconomyEase of Doing
Business Rank
Starting a
Business
Dealing with
Construction
Permits
Getting
Electricity
Registering
Property
Getting
Credit
Protecting
Investors
Paying
Taxes
Trading
Across
Borders
Enforcing
Contracts
Resolving
Insolvency
Senegal 154 93 125 168 171 126 166 174 65 145 86
Serbia 92 92 175 79 39 24 79 143 79 104 113
Seychelles 103 113 54 149 63 166 65 16 33 84 183
Sierra Leone 141 72 167 174 169 126 29 76 132 141 155
Singapore 1 4 3 5 14 8 2 4 1 12 2Slovak Republic 48 76 50 102 10 24 111 130 95 71 35
Slovenia 37 28 81 27 79 98 24 87 50 58 39
Solomon Islands 74 110 36 42 168 78 46 25 86 108 115
South Africa 35 44 31 124 76 1 10 44 144 81 77Spain 44 133 38 69 56 48 97 48 55 54 20
Sri Lanka 89 38 111 95 161 78 46 173 53 136 42
St. Kitts and Nevis 95 64 16 33 164 126 29 133 44 114 183
St. Lucia 52 53 13 13 115 98 29 52 110 165 58St. Vincent and the Grenadines 75 58 6 21 141 126 29 73 38 101 183
Sudan 135 126 130 107 41 166 155 103 151 148 84
Suriname 158 173 98 38 170 159 181 34 105 178 157
Swaziland 124 161 47 158 128 48 122 60 148 171 69
Sweden 14 46 23 8 19 48 29 50 8 54 19
Switzerland 26 85 46 6 14 24 166 12 41 23 43
Syrian Arab Republic 134 129 133 83 82 174 111 111 122 175 102
Taiwan, China 25 16 87 3 33 67 79 71 23 88 14
Tajikistan 147 70 177 178 90 177 65 168 177 42 68
Tanzania 127 123 176 78 158 98 97 129 92 36 122
Thailand 17 78 14 9 28 67 13 100 17 24 51
Timor-Leste 168 157 114 55 183 159 133 31 89 183 183
Togo 162 174 146 92 162 126 147 161 98 151 93
Tonga 58 33 32 29 141 78 111 29 77 53 108
Trinidad and Tobago 68 74 93 24 175 40 24 65 52 169 133
Tunisia 46 56 86 45 65 98 46 64 32 76 38
Turkey 71 61 155 72 44 78 65 79 80 51 120
Uganda 123 143 109 129 127 48 133 93 158 116 63
Ukraine 152 112 180 169 166 24 111 181 140 44 156
United Arab Emirates 33 42 12 10 6 78 122 7 5 134 151
United Kingdom 7 19 22 60 68 1 10 24 13 21 6
United States 4 13 17 17 16 4 5 72 20 7 15
Uruguay 90 32 153 7 165 67 97 160 125 103 50
Uzbekistan 166 96 145 170 136 159 133 157 183 43 117
Vanuatu 76 114 40 147 111 78 79 32 128 71 53
Venezuela, RB 177 147 109 155 91 182 179 183 166 77 161
Vietnam 98 103 67 135 47 24 166 151 68 30 142
West Bank and Gaza 131 177 129 85 78 166 46 39 114 93 183
Yemen, Rep. 99 66 35 52 55 159 133 116 118 38 114
Zambia 84 69 148 118 96 8 79 47 153 85 96
Zimbabwe 171 144 166 167 85 126 122 127 172 112 153* For Dealing with Construction Permits, one data point on cost was corrected. Rankings are adjusted once a year with each published report.Additional note: All Doing Business 2011 rankings have been recalculated to reflect changes to the methodology.
12 of Pages 16Databook for DCH; 5th December 2012 Page 240 of 266
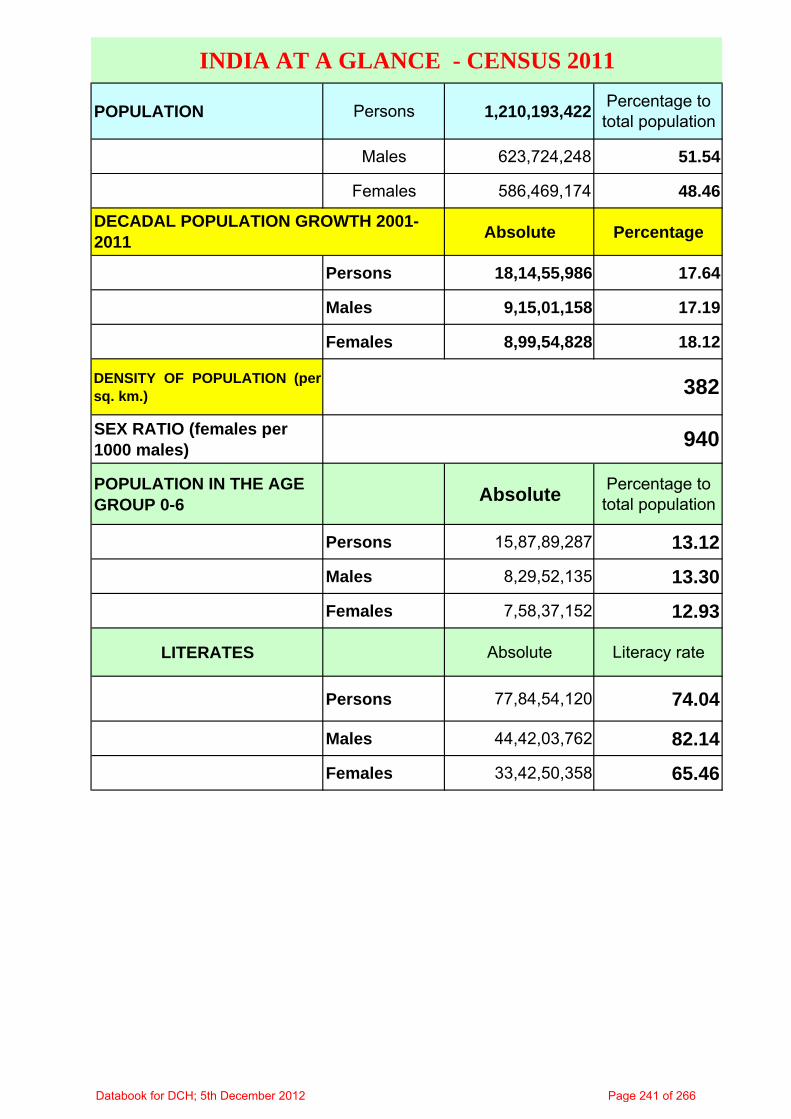
INDIA AT A GLANCE - CENSUS 2011
POPULATION Persons 1,210,193,422 Percentage to total population
Males 623,724,248 51.54
Females 586,469,174 48.46
DECADAL POPULATION GROWTH 2001-2011 Absolute Percentage
Persons 18,14,55,986 17.64
Males 9,15,01,158 17.19
Females 8,99,54,828 18.12
DENSITY OF POPULATION (persq. km.) 382
SEX RATIO (females per 1000 males) 940
POPULATION IN THE AGE GROUP 0-6 Absolute Percentage to
total population
Persons 15,87,89,287 13.12
Males 8,29,52,135 13.30
Females 7,58,37,152 12.93
LITERATES Absolute Literacy rate
Persons 77,84,54,120 74.04
Males 44,42,03,762 82.14
Females 33,42,50,358 65.46
Databook for DCH; 5th December 2012 Page 241 of 266
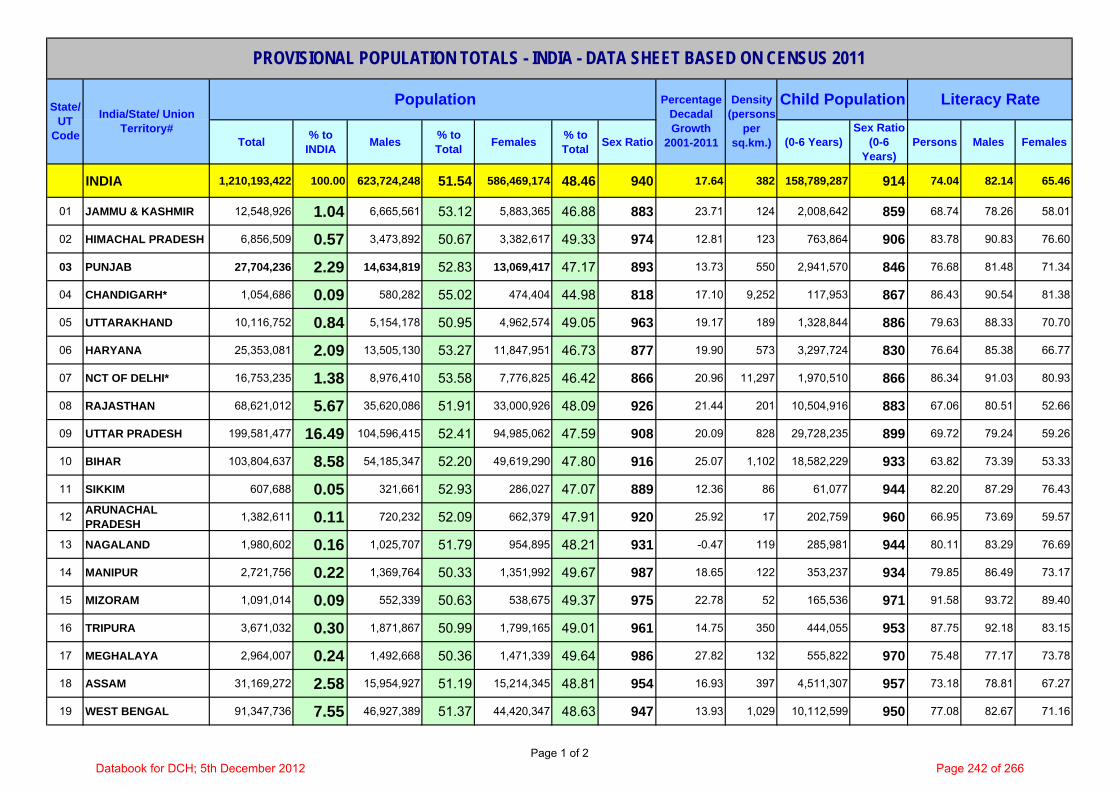
Total % to INDIA Males % to
Total Females % to Total Sex Ratio (0-6 Years)
Sex Ratio (0-6
Years)Persons Males Females
INDIA 1,210,193,422 100.00 623,724,248 51.54 586,469,174 48.46 940 17.64 382 158,789,287 914 74.04 82.14 65.46
01 JAMMU & KASHMIR 12,548,926 1.04 6,665,561 53.12 5,883,365 46.88 883 23.71 124 2,008,642 859 68.74 78.26 58.01
02 HIMACHAL PRADESH 6,856,509 0.57 3,473,892 50.67 3,382,617 49.33 974 12.81 123 763,864 906 83.78 90.83 76.60
03 PUNJAB 27,704,236 2.29 14,634,819 52.83 13,069,417 47.17 893 13.73 550 2,941,570 846 76.68 81.48 71.34
04 CHANDIGARH* 1,054,686 0.09 580,282 55.02 474,404 44.98 818 17.10 9,252 117,953 867 86.43 90.54 81.38
05 UTTARAKHAND 10,116,752 0.84 5,154,178 50.95 4,962,574 49.05 963 19.17 189 1,328,844 886 79.63 88.33 70.70
06 HARYANA 25,353,081 2.09 13,505,130 53.27 11,847,951 46.73 877 19.90 573 3,297,724 830 76.64 85.38 66.77
07 NCT OF DELHI* 16,753,235 1.38 8,976,410 53.58 7,776,825 46.42 866 20.96 11,297 1,970,510 866 86.34 91.03 80.93
08 RAJASTHAN 68,621,012 5.67 35,620,086 51.91 33,000,926 48.09 926 21.44 201 10,504,916 883 67.06 80.51 52.66
09 UTTAR PRADESH 199,581,477 16.49 104,596,415 52.41 94,985,062 47.59 908 20.09 828 29,728,235 899 69.72 79.24 59.26
10 BIHAR 103,804,637 8.58 54,185,347 52.20 49,619,290 47.80 916 25.07 1,102 18,582,229 933 63.82 73.39 53.33
11 SIKKIM 607,688 0.05 321,661 52.93 286,027 47.07 889 12.36 86 61,077 944 82.20 87.29 76.43
12 ARUNACHAL PRADESH 1,382,611 0.11 720,232 52.09 662,379 47.91 920 25.92 17 202,759 960 66.95 73.69 59.57
13 NAGALAND 1,980,602 0.16 1,025,707 51.79 954,895 48.21 931 -0.47 119 285,981 944 80.11 83.29 76.69
14 MANIPUR 2,721,756 0.22 1,369,764 50.33 1,351,992 49.67 987 18.65 122 353,237 934 79.85 86.49 73.17
15 MIZORAM 1,091,014 0.09 552,339 50.63 538,675 49.37 975 22.78 52 165,536 971 91.58 93.72 89.40
16 TRIPURA 3,671,032 0.30 1,871,867 50.99 1,799,165 49.01 961 14.75 350 444,055 953 87.75 92.18 83.15
17 MEGHALAYA 2,964,007 0.24 1,492,668 50.36 1,471,339 49.64 986 27.82 132 555,822 970 75.48 77.17 73.78
18 ASSAM 31,169,272 2.58 15,954,927 51.19 15,214,345 48.81 954 16.93 397 4,511,307 957 73.18 78.81 67.27
19 WEST BENGAL 91,347,736 7.55 46,927,389 51.37 44,420,347 48.63 947 13.93 1,029 10,112,599 950 77.08 82.67 71.16
Population
PROVISIONAL POPULATION TOTALS - INDIA - DATA SHEET BASED ON CENSUS 2011
Literacy RateChild PopulationPercentage Decadal Growth
2001-2011
Density (persons
per sq.km.)
State/ UT
Code
India/State/ Union Territory#
Page 1 of 2Databook for DCH; 5th December 2012 Page 242 of 266
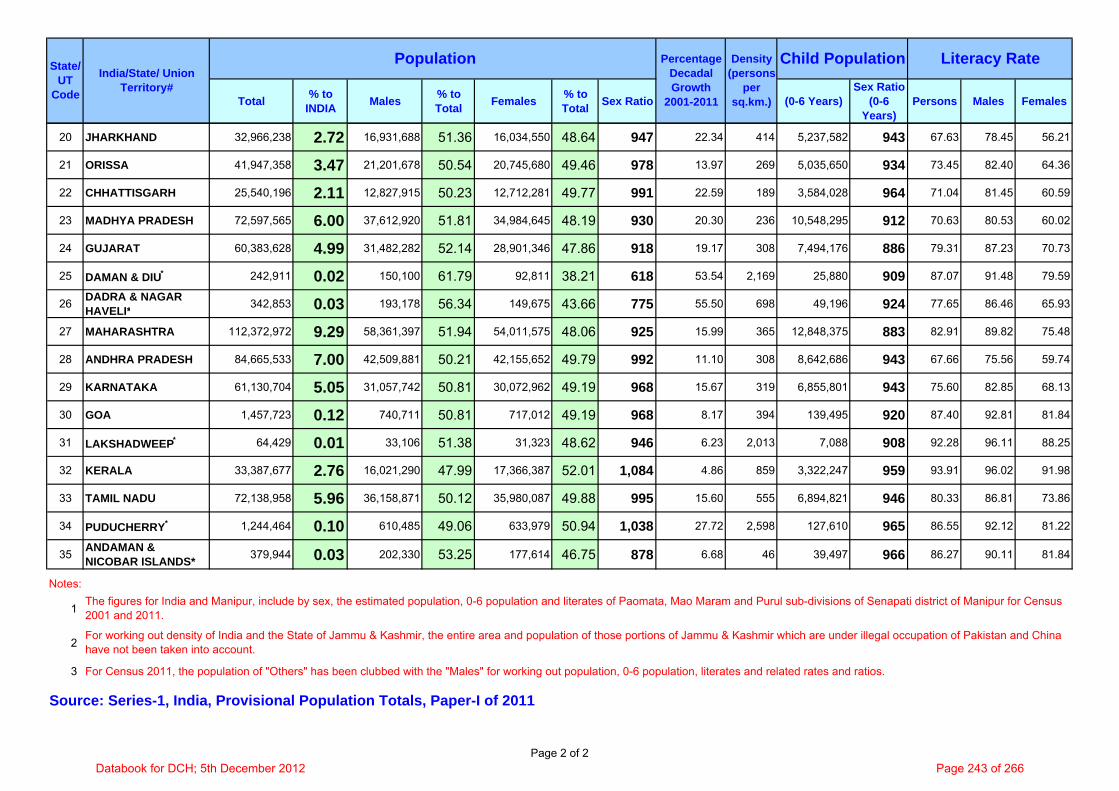
Total % to INDIA Males % to
Total Females % to Total Sex Ratio (0-6 Years)
Sex Ratio (0-6
Years)Persons Males Females
Population Literacy RateChild PopulationPercentage Decadal Growth
2001-2011
Density (persons
per sq.km.)
State/ UT
Code
India/State/ Union Territory#
20 JHARKHAND 32,966,238 2.72 16,931,688 51.36 16,034,550 48.64 947 22.34 414 5,237,582 943 67.63 78.45 56.21
21 ORISSA 41,947,358 3.47 21,201,678 50.54 20,745,680 49.46 978 13.97 269 5,035,650 934 73.45 82.40 64.36
22 CHHATTISGARH 25,540,196 2.11 12,827,915 50.23 12,712,281 49.77 991 22.59 189 3,584,028 964 71.04 81.45 60.59
23 MADHYA PRADESH 72,597,565 6.00 37,612,920 51.81 34,984,645 48.19 930 20.30 236 10,548,295 912 70.63 80.53 60.02
24 GUJARAT 60,383,628 4.99 31,482,282 52.14 28,901,346 47.86 918 19.17 308 7,494,176 886 79.31 87.23 70.73
25 DAMAN & DIU* 242,911 0.02 150,100 61.79 92,811 38.21 618 53.54 2,169 25,880 909 87.07 91.48 79.59
26 DADRA & NAGAR HAVELI* 342,853 0.03 193,178 56.34 149,675 43.66 775 55.50 698 49,196 924 77.65 86.46 65.93
27 MAHARASHTRA 112,372,972 9.29 58,361,397 51.94 54,011,575 48.06 925 15.99 365 12,848,375 883 82.91 89.82 75.48
28 ANDHRA PRADESH 84,665,533 7.00 42,509,881 50.21 42,155,652 49.79 992 11.10 308 8,642,686 943 67.66 75.56 59.74
29 KARNATAKA 61,130,704 5.05 31,057,742 50.81 30,072,962 49.19 968 15.67 319 6,855,801 943 75.60 82.85 68.13
30 GOA 1,457,723 0.12 740,711 50.81 717,012 49.19 968 8.17 394 139,495 920 87.40 92.81 81.84
31 LAKSHADWEEP* 64,429 0.01 33,106 51.38 31,323 48.62 946 6.23 2,013 7,088 908 92.28 96.11 88.25
32 KERALA 33,387,677 2.76 16,021,290 47.99 17,366,387 52.01 1,084 4.86 859 3,322,247 959 93.91 96.02 91.98
33 TAMIL NADU 72,138,958 5.96 36,158,871 50.12 35,980,087 49.88 995 15.60 555 6,894,821 946 80.33 86.81 73.86
34 PUDUCHERRY* 1,244,464 0.10 610,485 49.06 633,979 50.94 1,038 27.72 2,598 127,610 965 86.55 92.12 81.22
35 ANDAMAN & NICOBAR ISLANDS* 379,944 0.03 202,330 53.25 177,614 46.75 878 6.68 46 39,497 966 86.27 90.11 81.84
Notes:
1
2
3 For Census 2011, the population of "Others" has been clubbed with the "Males" for working out population, 0-6 population, literates and related rates and ratios.
Source: Series-1, India, Provisional Population Totals, Paper-I of 2011
The figures for India and Manipur, include by sex, the estimated population, 0-6 population and literates of Paomata, Mao Maram and Purul sub-divisions of Senapati district of Manipur for Census 2001 and 2011.
For working out density of India and the State of Jammu & Kashmir, the entire area and population of those portions of Jammu & Kashmir which are under illegal occupation of Pakistan and China have not been taken into account.
Page 2 of 2Databook for DCH; 5th December 2012 Page 243 of 266
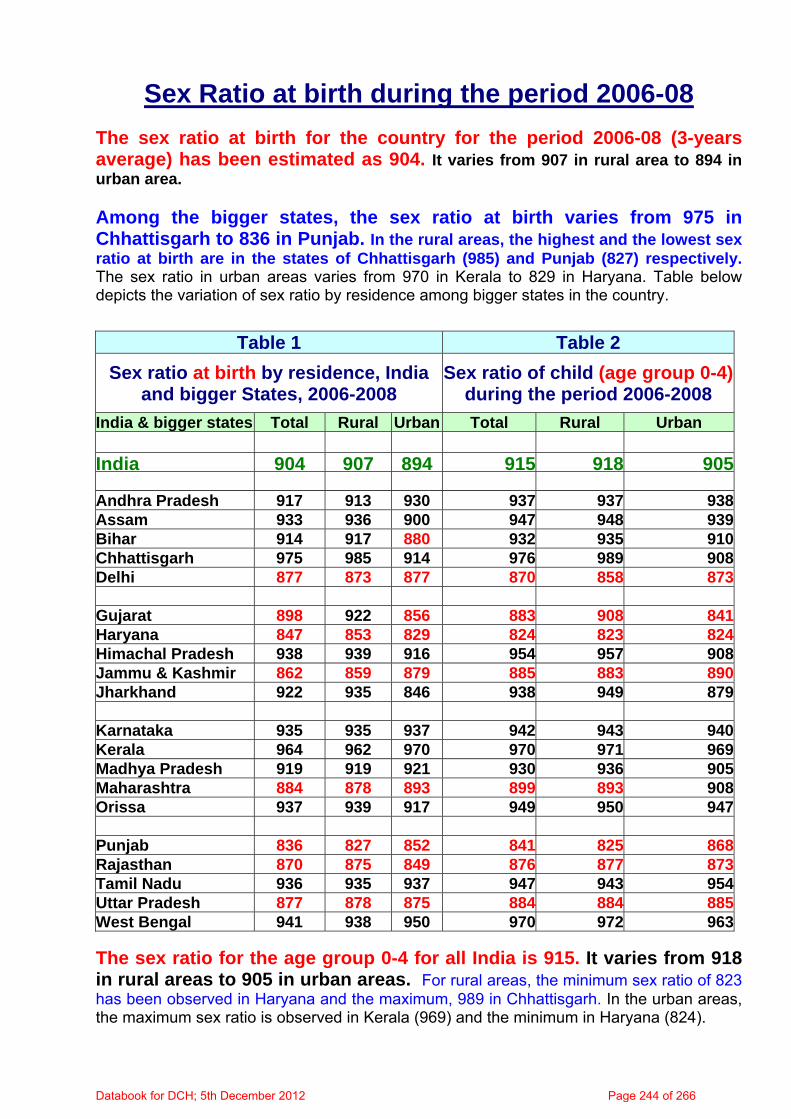
Sex Ratio at birth during the period 2006-08
The sex ratio at birth for the country for the period 2006-08 (3-years average) has been estimated as 904. It varies from 907 in rural area to 894 in urban area. Among the bigger states, the sex ratio at birth varies from 975 in Chhattisgarh to 836 in Punjab. In the rural areas, the highest and the lowest sex ratio at birth are in the states of Chhattisgarh (985) and Punjab (827) respectively. The sex ratio in urban areas varies from 970 in Kerala to 829 in Haryana. Table below depicts the variation of sex ratio by residence among bigger states in the country.
Table 1 Table 2 Sex ratio at birth by residence, India
and bigger States, 2006-2008 Sex ratio of child (age group 0-4)
during the period 2006-2008 India & bigger states Total Rural Urban Total Rural Urban India 904 907 894 915 918 905 Andhra Pradesh 917 913 930 937 937 938Assam 933 936 900 947 948 939Bihar 914 917 880 932 935 910Chhattisgarh 975 985 914 976 989 908Delhi 877 873 877 870 858 873 Gujarat 898 922 856 883 908 841Haryana 847 853 829 824 823 824Himachal Pradesh 938 939 916 954 957 908Jammu & Kashmir 862 859 879 885 883 890Jharkhand 922 935 846 938 949 879 Karnataka 935 935 937 942 943 940Kerala 964 962 970 970 971 969Madhya Pradesh 919 919 921 930 936 905Maharashtra 884 878 893 899 893 908Orissa 937 939 917 949 950 947 Punjab 836 827 852 841 825 868Rajasthan 870 875 849 876 877 873Tamil Nadu 936 935 937 947 943 954Uttar Pradesh 877 878 875 884 884 885West Bengal 941 938 950 970 972 963
The sex ratio for the age group 0-4 for all India is 915. It varies from 918 in rural areas to 905 in urban areas. For rural areas, the minimum sex ratio of 823 has been observed in Haryana and the maximum, 989 in Chhattisgarh. In the urban areas, the maximum sex ratio is observed in Kerala (969) and the minimum in Haryana (824).
Databook for DCH; 5th December 2012 Page 244 of 266
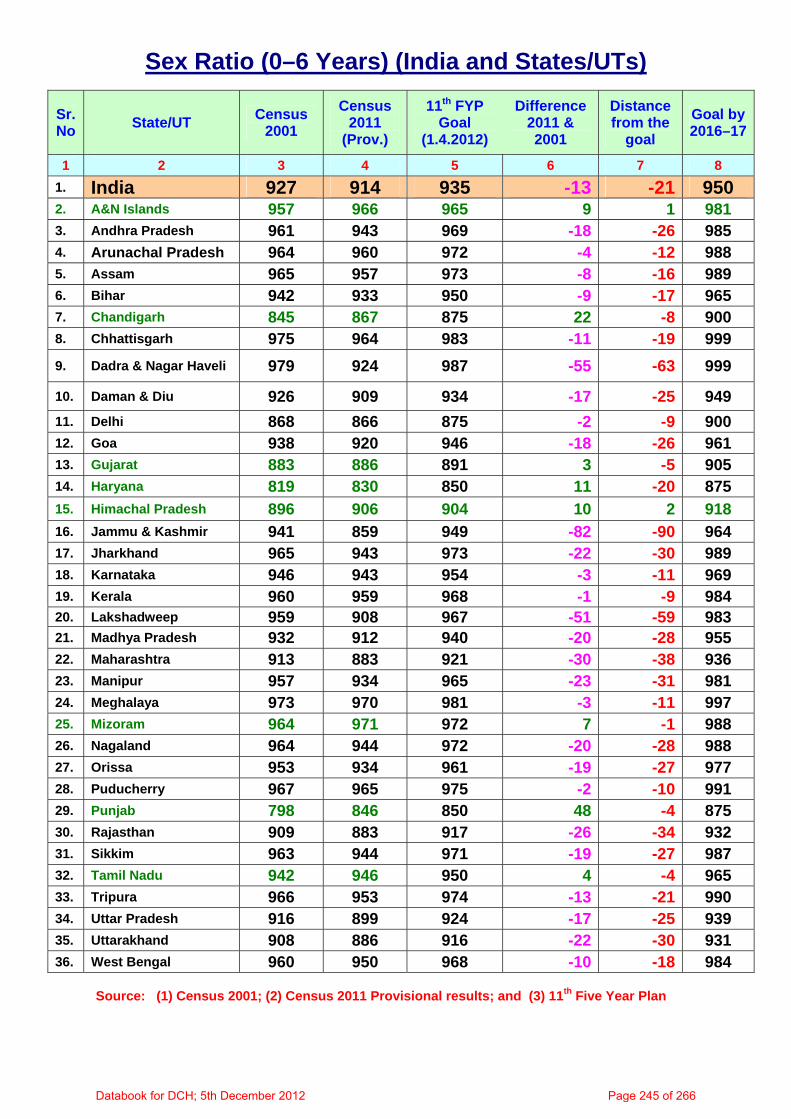
Sex Ratio (0–6 Years) (India and States/UTs)
Sr. No State/UT Census
2001 Census
2011 (Prov.)
11th FYP Goal
(1.4.2012)
Difference 2011 & 2001
Distance from the
goal Goal by 2016–17
1 2 3 4 5 6 7 8 1. India 927 914 935 -13 -21 950 2. A&N Islands 957 966 965 9 1 981 3. Andhra Pradesh 961 943 969 -18 -26 985 4. Arunachal Pradesh 964 960 972 -4 -12 988 5. Assam 965 957 973 -8 -16 989 6. Bihar 942 933 950 -9 -17 965 7. Chandigarh 845 867 875 22 -8 900 8. Chhattisgarh 975 964 983 -11 -19 999 9. Dadra & Nagar Haveli 979 924 987 -55 -63 999
10. Daman & Diu 926 909 934 -17 -25 949 11. Delhi 868 866 875 -2 -9 900 12. Goa 938 920 946 -18 -26 961 13. Gujarat 883 886 891 3 -5 905 14. Haryana 819 830 850 11 -20 875 15. Himachal Pradesh 896 906 904 10 2 918 16. Jammu & Kashmir 941 859 949 -82 -90 964 17. Jharkhand 965 943 973 -22 -30 989 18. Karnataka 946 943 954 -3 -11 969 19. Kerala 960 959 968 -1 -9 984 20. Lakshadweep 959 908 967 -51 -59 983 21. Madhya Pradesh 932 912 940 -20 -28 955 22. Maharashtra 913 883 921 -30 -38 936 23. Manipur 957 934 965 -23 -31 981 24. Meghalaya 973 970 981 -3 -11 997 25. Mizoram 964 971 972 7 -1 988 26. Nagaland 964 944 972 -20 -28 988 27. Orissa 953 934 961 -19 -27 977 28. Puducherry 967 965 975 -2 -10 991 29. Punjab 798 846 850 48 -4 875 30. Rajasthan 909 883 917 -26 -34 932 31. Sikkim 963 944 971 -19 -27 987 32. Tamil Nadu 942 946 950 4 -4 965 33. Tripura 966 953 974 -13 -21 990 34. Uttar Pradesh 916 899 924 -17 -25 939 35. Uttarakhand 908 886 916 -22 -30 931 36. West Bengal 960 950 968 -10 -18 984
Source: (1) Census 2001; (2) Census 2011 Provisional results; and (3) 11th Five Year Plan
Databook for DCH; 5th December 2012 Page 245 of 266
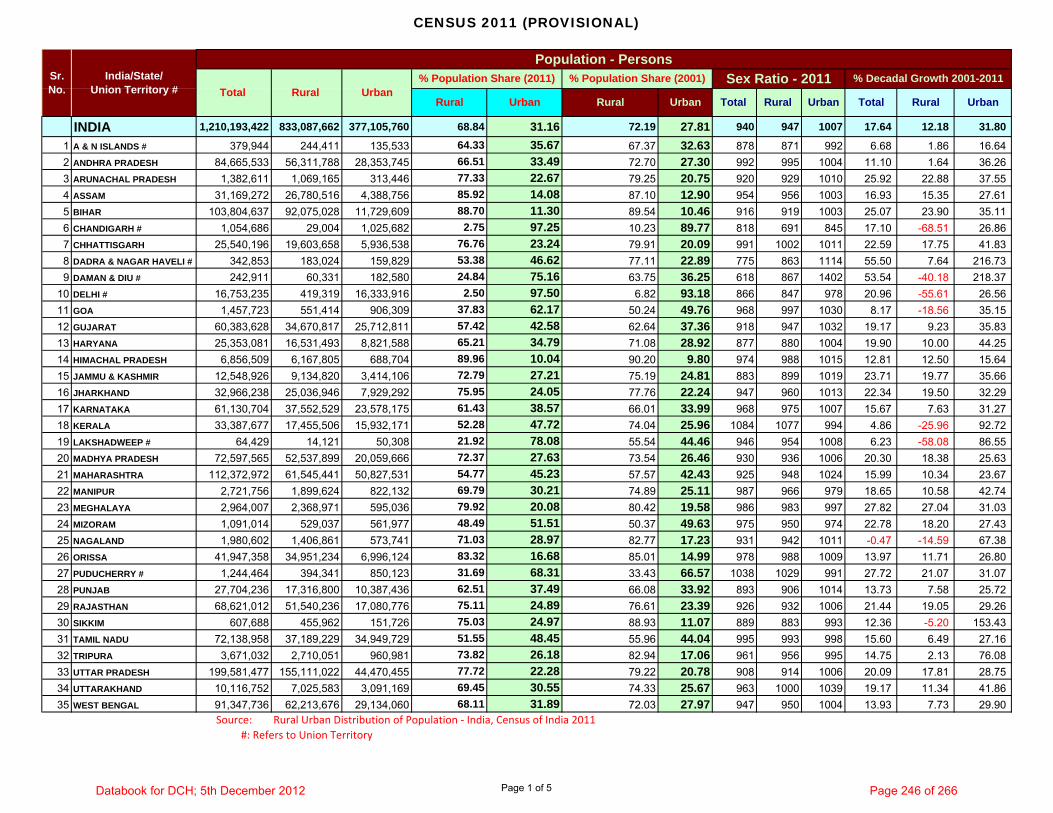
CENSUS 2011 (PROVISIONAL)
INDIA 1,210,193,422 833,087,662 377,105,760 68.84 31.16 72.19 27.81 940 947 1007 17.64 12.18 31.80
1 A & N ISLANDS # 379,944 244,411 135,533 64.33 35.67 67.37 32.63 878 871 992 6.68 1.86 16.642 ANDHRA PRADESH 84,665,533 56,311,788 28,353,745 66.51 33.49 72.70 27.30 992 995 1004 11.10 1.64 36.263 ARUNACHAL PRADESH 1,382,611 1,069,165 313,446 77.33 22.67 79.25 20.75 920 929 1010 25.92 22.88 37.554 ASSAM 31,169,272 26,780,516 4,388,756 85.92 14.08 87.10 12.90 954 956 1003 16.93 15.35 27.615 BIHAR 103,804,637 92,075,028 11,729,609 88.70 11.30 89.54 10.46 916 919 1003 25.07 23.90 35.116 CHANDIGARH # 1,054,686 29,004 1,025,682 2.75 97.25 10.23 89.77 818 691 845 17.10 -68.51 26.867 CHHATTISGARH 25,540,196 19,603,658 5,936,538 76.76 23.24 79.91 20.09 991 1002 1011 22.59 17.75 41.838 DADRA & NAGAR HAVELI # 342,853 183,024 159,829 53.38 46.62 77.11 22.89 775 863 1114 55.50 7.64 216.739 DAMAN & DIU # 242,911 60,331 182,580 24.84 75.16 63.75 36.25 618 867 1402 53.54 -40.18 218.37
10 DELHI # 16,753,235 419,319 16,333,916 2.50 97.50 6.82 93.18 866 847 978 20.96 -55.61 26.5611 GOA 1,457,723 551,414 906,309 37.83 62.17 50.24 49.76 968 997 1030 8.17 -18.56 35.1512 GUJARAT 60,383,628 34,670,817 25,712,811 57.42 42.58 62.64 37.36 918 947 1032 19.17 9.23 35.8313 HARYANA 25,353,081 16,531,493 8,821,588 65.21 34.79 71.08 28.92 877 880 1004 19.90 10.00 44.2514 HIMACHAL PRADESH 6,856,509 6,167,805 688,704 89.96 10.04 90.20 9.80 974 988 1015 12.81 12.50 15.6415 JAMMU & KASHMIR 12,548,926 9,134,820 3,414,106 72.79 27.21 75.19 24.81 883 899 1019 23.71 19.77 35.6616 JHARKHAND 32,966,238 25,036,946 7,929,292 75.95 24.05 77.76 22.24 947 960 1013 22.34 19.50 32.2917 KARNATAKA 61,130,704 37,552,529 23,578,175 61.43 38.57 66.01 33.99 968 975 1007 15.67 7.63 31.2718 KERALA 33,387,677 17,455,506 15,932,171 52.28 47.72 74.04 25.96 1084 1077 994 4.86 -25.96 92.7219 LAKSHADWEEP # 64,429 14,121 50,308 21.92 78.08 55.54 44.46 946 954 1008 6.23 -58.08 86.5520 MADHYA PRADESH 72,597,565 52,537,899 20,059,666 72.37 27.63 73.54 26.46 930 936 1006 20.30 18.38 25.6321 MAHARASHTRA 112,372,972 61,545,441 50,827,531 54.77 45.23 57.57 42.43 925 948 1024 15.99 10.34 23.6722 MANIPUR 2,721,756 1,899,624 822,132 69.79 30.21 74.89 25.11 987 966 979 18.65 10.58 42.7423 MEGHALAYA 2,964,007 2,368,971 595,036 79.92 20.08 80.42 19.58 986 983 997 27.82 27.04 31.0324 MIZORAM 1,091,014 529,037 561,977 48.49 51.51 50.37 49.63 975 950 974 22.78 18.20 27.4325 NAGALAND 1,980,602 1,406,861 573,741 71.03 28.97 82.77 17.23 931 942 1011 -0.47 -14.59 67.3826 ORISSA 41,947,358 34,951,234 6,996,124 83.32 16.68 85.01 14.99 978 988 1009 13.97 11.71 26.8027 PUDUCHERRY # 1,244,464 394,341 850,123 31.69 68.31 33.43 66.57 1038 1029 991 27.72 21.07 31.0728 PUNJAB 27,704,236 17,316,800 10,387,436 62.51 37.49 66.08 33.92 893 906 1014 13.73 7.58 25.7229 RAJASTHAN 68,621,012 51,540,236 17,080,776 75.11 24.89 76.61 23.39 926 932 1006 21.44 19.05 29.2630 SIKKIM 607,688 455,962 151,726 75.03 24.97 88.93 11.07 889 883 993 12.36 -5.20 153.4331 TAMIL NADU 72,138,958 37,189,229 34,949,729 51.55 48.45 55.96 44.04 995 993 998 15.60 6.49 27.1632 TRIPURA 3,671,032 2,710,051 960,981 73.82 26.18 82.94 17.06 961 956 995 14.75 2.13 76.0833 UTTAR PRADESH 199,581,477 155,111,022 44,470,455 77.72 22.28 79.22 20.78 908 914 1006 20.09 17.81 28.7534 UTTARAKHAND 10,116,752 7,025,583 3,091,169 69.45 30.55 74.33 25.67 963 1000 1039 19.17 11.34 41.8635 WEST BENGAL 91,347,736 62,213,676 29,134,060 68.11 31.89 72.03 27.97 947 950 1004 13.93 7.73 29.90
Source: Rural Urban Distribution of Population ‐ India, Census of India 2011#: Refers to Union Territory
Population - PersonsSr. No.
India/State/Union Territory #
% Decadal Growth 2001-2011Sex Ratio - 2011% Population Share (2001)
Total Rural UrbanTotal Rural UrbanTotal Rural Urban
% Population Share (2011)
Rural UrbanRural Urban
Page 1 of 5Databook for DCH; 5th December 2012 Page 246 of 266
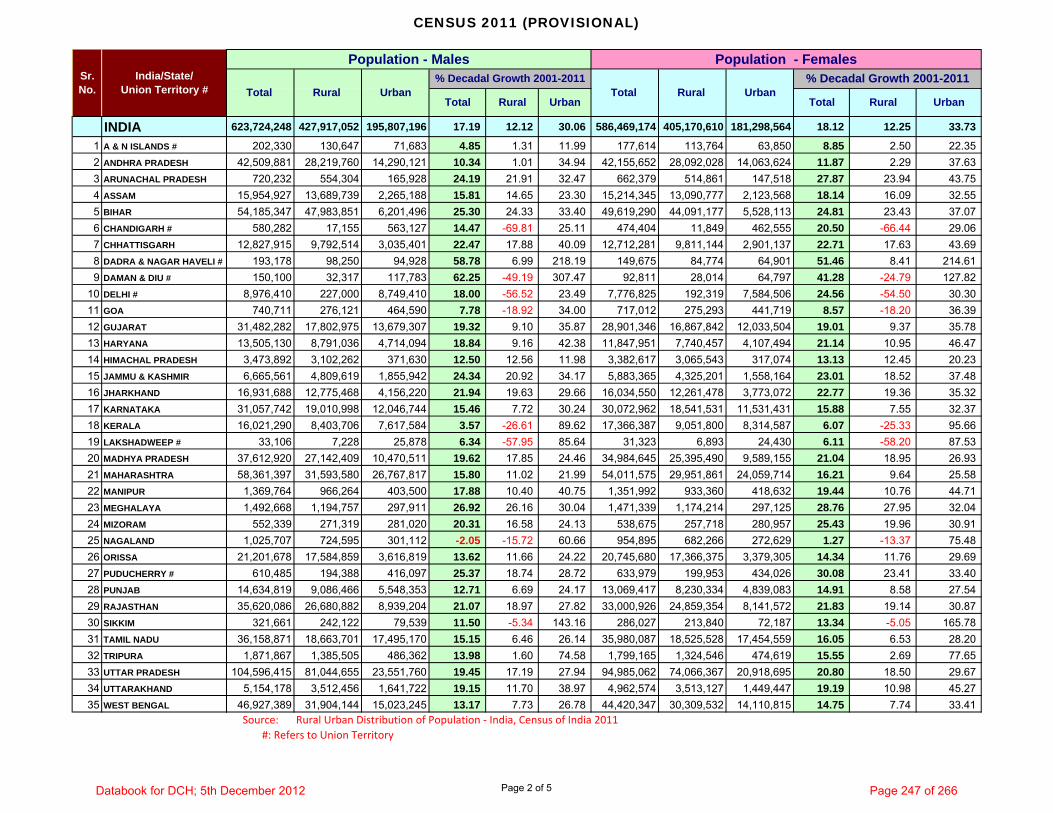
CENSUS 2011 (PROVISIONAL)
INDIA1 A & N ISLANDS #
2 ANDHRA PRADESH
3 ARUNACHAL PRADESH
4 ASSAM
5 BIHAR
6 CHANDIGARH #
7 CHHATTISGARH
8 DADRA & NAGAR HAVELI #
9 DAMAN & DIU #
10 DELHI #
11 GOA
12 GUJARAT
13 HARYANA
14 HIMACHAL PRADESH
15 JAMMU & KASHMIR
16 JHARKHAND
17 KARNATAKA
18 KERALA
19 LAKSHADWEEP #
20 MADHYA PRADESH
21 MAHARASHTRA
22 MANIPUR
23 MEGHALAYA
24 MIZORAM
25 NAGALAND
26 ORISSA
27 PUDUCHERRY #
28 PUNJAB
29 RAJASTHAN
30 SIKKIM
31 TAMIL NADU
32 TRIPURA
33 UTTAR PRADESH
34 UTTARAKHAND
35 WEST BENGAL
Sr. No.
India/State/Union Territory #
623,724,248 427,917,052 195,807,196 17.19 12.12 30.06 586,469,174 405,170,610 181,298,564 18.12 12.25 33.73
202,330 130,647 71,683 4.85 1.31 11.99 177,614 113,764 63,850 8.85 2.50 22.3542,509,881 28,219,760 14,290,121 10.34 1.01 34.94 42,155,652 28,092,028 14,063,624 11.87 2.29 37.63
720,232 554,304 165,928 24.19 21.91 32.47 662,379 514,861 147,518 27.87 23.94 43.7515,954,927 13,689,739 2,265,188 15.81 14.65 23.30 15,214,345 13,090,777 2,123,568 18.14 16.09 32.5554,185,347 47,983,851 6,201,496 25.30 24.33 33.40 49,619,290 44,091,177 5,528,113 24.81 23.43 37.07
580,282 17,155 563,127 14.47 -69.81 25.11 474,404 11,849 462,555 20.50 -66.44 29.0612,827,915 9,792,514 3,035,401 22.47 17.88 40.09 12,712,281 9,811,144 2,901,137 22.71 17.63 43.69
193,178 98,250 94,928 58.78 6.99 218.19 149,675 84,774 64,901 51.46 8.41 214.61150,100 32,317 117,783 62.25 -49.19 307.47 92,811 28,014 64,797 41.28 -24.79 127.82
8,976,410 227,000 8,749,410 18.00 -56.52 23.49 7,776,825 192,319 7,584,506 24.56 -54.50 30.30740,711 276,121 464,590 7.78 -18.92 34.00 717,012 275,293 441,719 8.57 -18.20 36.39
31,482,282 17,802,975 13,679,307 19.32 9.10 35.87 28,901,346 16,867,842 12,033,504 19.01 9.37 35.7813,505,130 8,791,036 4,714,094 18.84 9.16 42.38 11,847,951 7,740,457 4,107,494 21.14 10.95 46.47
3,473,892 3,102,262 371,630 12.50 12.56 11.98 3,382,617 3,065,543 317,074 13.13 12.45 20.236,665,561 4,809,619 1,855,942 24.34 20.92 34.17 5,883,365 4,325,201 1,558,164 23.01 18.52 37.48
16,931,688 12,775,468 4,156,220 21.94 19.63 29.66 16,034,550 12,261,478 3,773,072 22.77 19.36 35.3231,057,742 19,010,998 12,046,744 15.46 7.72 30.24 30,072,962 18,541,531 11,531,431 15.88 7.55 32.3716,021,290 8,403,706 7,617,584 3.57 -26.61 89.62 17,366,387 9,051,800 8,314,587 6.07 -25.33 95.66
33,106 7,228 25,878 6.34 -57.95 85.64 31,323 6,893 24,430 6.11 -58.20 87.5337,612,920 27,142,409 10,470,511 19.62 17.85 24.46 34,984,645 25,395,490 9,589,155 21.04 18.95 26.9358,361,397 31,593,580 26,767,817 15.80 11.02 21.99 54,011,575 29,951,861 24,059,714 16.21 9.64 25.58
1,369,764 966,264 403,500 17.88 10.40 40.75 1,351,992 933,360 418,632 19.44 10.76 44.711,492,668 1,194,757 297,911 26.92 26.16 30.04 1,471,339 1,174,214 297,125 28.76 27.95 32.04
552,339 271,319 281,020 20.31 16.58 24.13 538,675 257,718 280,957 25.43 19.96 30.911,025,707 724,595 301,112 -2.05 -15.72 60.66 954,895 682,266 272,629 1.27 -13.37 75.48
21,201,678 17,584,859 3,616,819 13.62 11.66 24.22 20,745,680 17,366,375 3,379,305 14.34 11.76 29.69610,485 194,388 416,097 25.37 18.74 28.72 633,979 199,953 434,026 30.08 23.41 33.40
14,634,819 9,086,466 5,548,353 12.71 6.69 24.17 13,069,417 8,230,334 4,839,083 14.91 8.58 27.5435,620,086 26,680,882 8,939,204 21.07 18.97 27.82 33,000,926 24,859,354 8,141,572 21.83 19.14 30.87
321,661 242,122 79,539 11.50 -5.34 143.16 286,027 213,840 72,187 13.34 -5.05 165.7836,158,871 18,663,701 17,495,170 15.15 6.46 26.14 35,980,087 18,525,528 17,454,559 16.05 6.53 28.20
1,871,867 1,385,505 486,362 13.98 1.60 74.58 1,799,165 1,324,546 474,619 15.55 2.69 77.65104,596,415 81,044,655 23,551,760 19.45 17.19 27.94 94,985,062 74,066,367 20,918,695 20.80 18.50 29.67
5,154,178 3,512,456 1,641,722 19.15 11.70 38.97 4,962,574 3,513,127 1,449,447 19.19 10.98 45.2746,927,389 31,904,144 15,023,245 13.17 7.73 26.78 44,420,347 30,309,532 14,110,815 14.75 7.74 33.41Source: Rural Urban Distribution of Population ‐ India, Census of India 2011
#: Refers to Union Territory
Population - Males
Urban
Population - Females% Decadal Growth 2001-2011
Total
% Decadal Growth 2001-2011
Rural UrbanTotal Rural Urban Total Rural Urban
Total Rural
Page 2 of 5Databook for DCH; 5th December 2012 Page 247 of 266
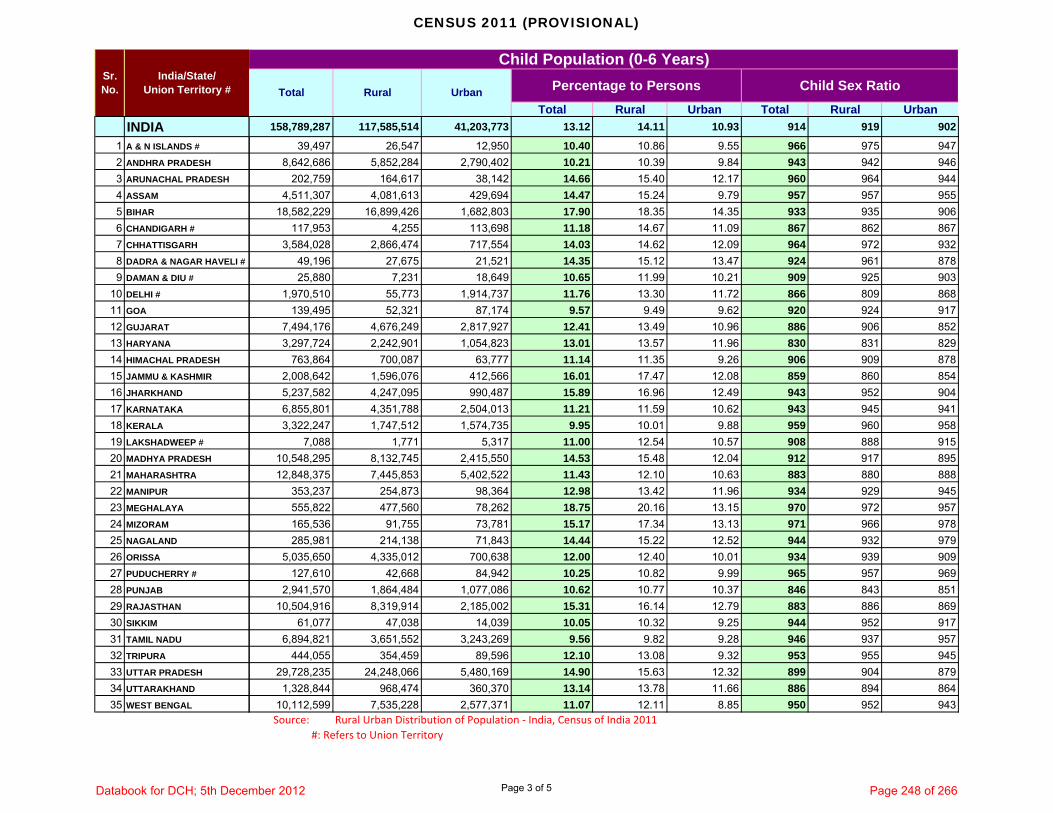
CENSUS 2011 (PROVISIONAL)
INDIA1 A & N ISLANDS #
2 ANDHRA PRADESH
3 ARUNACHAL PRADESH
4 ASSAM
5 BIHAR
6 CHANDIGARH #
7 CHHATTISGARH
8 DADRA & NAGAR HAVELI #
9 DAMAN & DIU #
10 DELHI #
11 GOA
12 GUJARAT
13 HARYANA
14 HIMACHAL PRADESH
15 JAMMU & KASHMIR
16 JHARKHAND
17 KARNATAKA
18 KERALA
19 LAKSHADWEEP #
20 MADHYA PRADESH
21 MAHARASHTRA
22 MANIPUR
23 MEGHALAYA
24 MIZORAM
25 NAGALAND
26 ORISSA
27 PUDUCHERRY #
28 PUNJAB
29 RAJASTHAN
30 SIKKIM
31 TAMIL NADU
32 TRIPURA
33 UTTAR PRADESH
34 UTTARAKHAND
35 WEST BENGAL
Sr. No.
India/State/Union Territory #
Total Rural Urban Total Rural Urban158,789,287 117,585,514 41,203,773 13.12 14.11 10.93 914 919 902
39,497 26,547 12,950 10.40 10.86 9.55 966 975 9478,642,686 5,852,284 2,790,402 10.21 10.39 9.84 943 942 946
202,759 164,617 38,142 14.66 15.40 12.17 960 964 9444,511,307 4,081,613 429,694 14.47 15.24 9.79 957 957 955
18,582,229 16,899,426 1,682,803 17.90 18.35 14.35 933 935 906117,953 4,255 113,698 11.18 14.67 11.09 867 862 867
3,584,028 2,866,474 717,554 14.03 14.62 12.09 964 972 93249,196 27,675 21,521 14.35 15.12 13.47 924 961 87825,880 7,231 18,649 10.65 11.99 10.21 909 925 903
1,970,510 55,773 1,914,737 11.76 13.30 11.72 866 809 868139,495 52,321 87,174 9.57 9.49 9.62 920 924 917
7,494,176 4,676,249 2,817,927 12.41 13.49 10.96 886 906 8523,297,724 2,242,901 1,054,823 13.01 13.57 11.96 830 831 829
763,864 700,087 63,777 11.14 11.35 9.26 906 909 8782,008,642 1,596,076 412,566 16.01 17.47 12.08 859 860 8545,237,582 4,247,095 990,487 15.89 16.96 12.49 943 952 9046,855,801 4,351,788 2,504,013 11.21 11.59 10.62 943 945 9413,322,247 1,747,512 1,574,735 9.95 10.01 9.88 959 960 958
7,088 1,771 5,317 11.00 12.54 10.57 908 888 91510,548,295 8,132,745 2,415,550 14.53 15.48 12.04 912 917 89512,848,375 7,445,853 5,402,522 11.43 12.10 10.63 883 880 888
353,237 254,873 98,364 12.98 13.42 11.96 934 929 945555,822 477,560 78,262 18.75 20.16 13.15 970 972 957165,536 91,755 73,781 15.17 17.34 13.13 971 966 978285,981 214,138 71,843 14.44 15.22 12.52 944 932 979
5,035,650 4,335,012 700,638 12.00 12.40 10.01 934 939 909127,610 42,668 84,942 10.25 10.82 9.99 965 957 969
2,941,570 1,864,484 1,077,086 10.62 10.77 10.37 846 843 85110,504,916 8,319,914 2,185,002 15.31 16.14 12.79 883 886 869
61,077 47,038 14,039 10.05 10.32 9.25 944 952 9176,894,821 3,651,552 3,243,269 9.56 9.82 9.28 946 937 957
444,055 354,459 89,596 12.10 13.08 9.32 953 955 94529,728,235 24,248,066 5,480,169 14.90 15.63 12.32 899 904 879
1,328,844 968,474 360,370 13.14 13.78 11.66 886 894 86410,112,599 7,535,228 2,577,371 11.07 12.11 8.85 950 952 943Source: Rural Urban Distribution of Population ‐ India, Census of India 2011
#: Refers to Union Territory
Child Population (0-6 Years)
Total Rural Urban Percentage to Persons Child Sex Ratio
Page 3 of 5Databook for DCH; 5th December 2012 Page 248 of 266
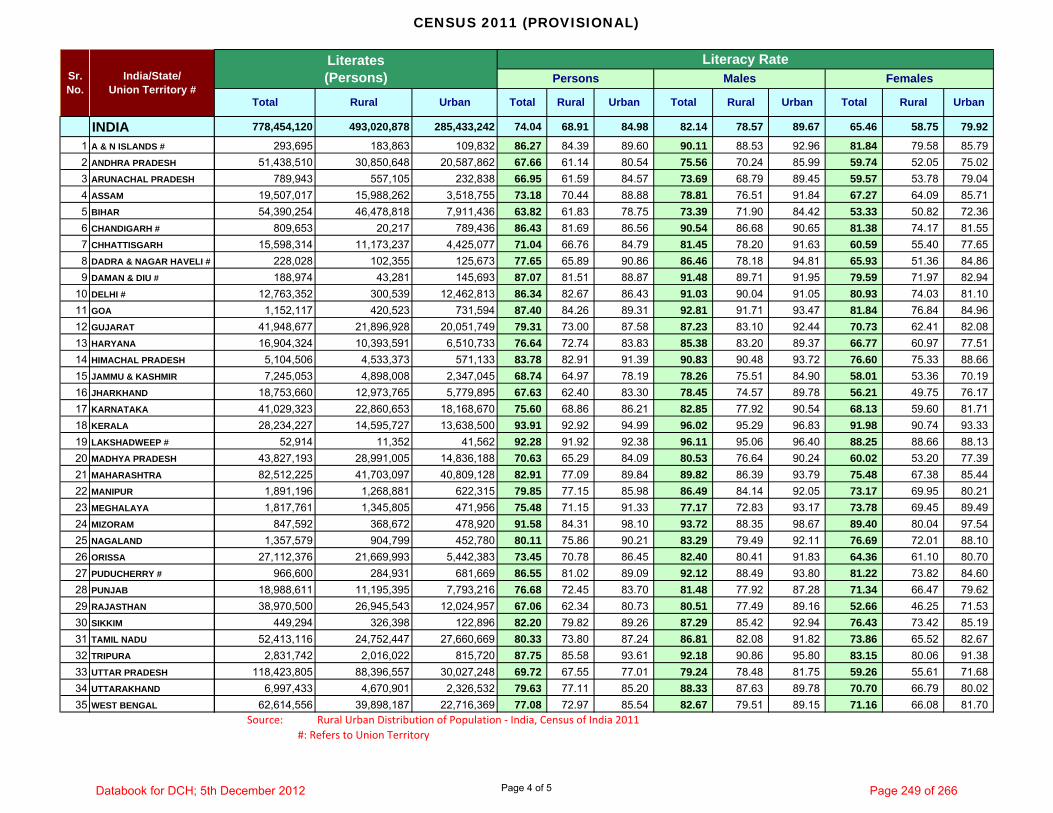
CENSUS 2011 (PROVISIONAL)
INDIA1 A & N ISLANDS #
2 ANDHRA PRADESH
3 ARUNACHAL PRADESH
4 ASSAM
5 BIHAR
6 CHANDIGARH #
7 CHHATTISGARH
8 DADRA & NAGAR HAVELI #
9 DAMAN & DIU #
10 DELHI #
11 GOA
12 GUJARAT
13 HARYANA
14 HIMACHAL PRADESH
15 JAMMU & KASHMIR
16 JHARKHAND
17 KARNATAKA
18 KERALA
19 LAKSHADWEEP #
20 MADHYA PRADESH
21 MAHARASHTRA
22 MANIPUR
23 MEGHALAYA
24 MIZORAM
25 NAGALAND
26 ORISSA
27 PUDUCHERRY #
28 PUNJAB
29 RAJASTHAN
30 SIKKIM
31 TAMIL NADU
32 TRIPURA
33 UTTAR PRADESH
34 UTTARAKHAND
35 WEST BENGAL
Sr. No.
India/State/Union Territory #
778,454,120 493,020,878 285,433,242 74.04 68.91 84.98 82.14 78.57 89.67 65.46 58.75 79.92
293,695 183,863 109,832 86.27 84.39 89.60 90.11 88.53 92.96 81.84 79.58 85.7951,438,510 30,850,648 20,587,862 67.66 61.14 80.54 75.56 70.24 85.99 59.74 52.05 75.02
789,943 557,105 232,838 66.95 61.59 84.57 73.69 68.79 89.45 59.57 53.78 79.0419,507,017 15,988,262 3,518,755 73.18 70.44 88.88 78.81 76.51 91.84 67.27 64.09 85.7154,390,254 46,478,818 7,911,436 63.82 61.83 78.75 73.39 71.90 84.42 53.33 50.82 72.36
809,653 20,217 789,436 86.43 81.69 86.56 90.54 86.68 90.65 81.38 74.17 81.5515,598,314 11,173,237 4,425,077 71.04 66.76 84.79 81.45 78.20 91.63 60.59 55.40 77.65
228,028 102,355 125,673 77.65 65.89 90.86 86.46 78.18 94.81 65.93 51.36 84.86188,974 43,281 145,693 87.07 81.51 88.87 91.48 89.71 91.95 79.59 71.97 82.94
12,763,352 300,539 12,462,813 86.34 82.67 86.43 91.03 90.04 91.05 80.93 74.03 81.101,152,117 420,523 731,594 87.40 84.26 89.31 92.81 91.71 93.47 81.84 76.84 84.96
41,948,677 21,896,928 20,051,749 79.31 73.00 87.58 87.23 83.10 92.44 70.73 62.41 82.0816,904,324 10,393,591 6,510,733 76.64 72.74 83.83 85.38 83.20 89.37 66.77 60.97 77.51
5,104,506 4,533,373 571,133 83.78 82.91 91.39 90.83 90.48 93.72 76.60 75.33 88.667,245,053 4,898,008 2,347,045 68.74 64.97 78.19 78.26 75.51 84.90 58.01 53.36 70.19
18,753,660 12,973,765 5,779,895 67.63 62.40 83.30 78.45 74.57 89.78 56.21 49.75 76.1741,029,323 22,860,653 18,168,670 75.60 68.86 86.21 82.85 77.92 90.54 68.13 59.60 81.7128,234,227 14,595,727 13,638,500 93.91 92.92 94.99 96.02 95.29 96.83 91.98 90.74 93.33
52,914 11,352 41,562 92.28 91.92 92.38 96.11 95.06 96.40 88.25 88.66 88.1343,827,193 28,991,005 14,836,188 70.63 65.29 84.09 80.53 76.64 90.24 60.02 53.20 77.3982,512,225 41,703,097 40,809,128 82.91 77.09 89.84 89.82 86.39 93.79 75.48 67.38 85.44
1,891,196 1,268,881 622,315 79.85 77.15 85.98 86.49 84.14 92.05 73.17 69.95 80.211,817,761 1,345,805 471,956 75.48 71.15 91.33 77.17 72.83 93.17 73.78 69.45 89.49
847,592 368,672 478,920 91.58 84.31 98.10 93.72 88.35 98.67 89.40 80.04 97.541,357,579 904,799 452,780 80.11 75.86 90.21 83.29 79.49 92.11 76.69 72.01 88.10
27,112,376 21,669,993 5,442,383 73.45 70.78 86.45 82.40 80.41 91.83 64.36 61.10 80.70966,600 284,931 681,669 86.55 81.02 89.09 92.12 88.49 93.80 81.22 73.82 84.60
18,988,611 11,195,395 7,793,216 76.68 72.45 83.70 81.48 77.92 87.28 71.34 66.47 79.6238,970,500 26,945,543 12,024,957 67.06 62.34 80.73 80.51 77.49 89.16 52.66 46.25 71.53
449,294 326,398 122,896 82.20 79.82 89.26 87.29 85.42 92.94 76.43 73.42 85.1952,413,116 24,752,447 27,660,669 80.33 73.80 87.24 86.81 82.08 91.82 73.86 65.52 82.67
2,831,742 2,016,022 815,720 87.75 85.58 93.61 92.18 90.86 95.80 83.15 80.06 91.38118,423,805 88,396,557 30,027,248 69.72 67.55 77.01 79.24 78.48 81.75 59.26 55.61 71.68
6,997,433 4,670,901 2,326,532 79.63 77.11 85.20 88.33 87.63 89.78 70.70 66.79 80.0262,614,556 39,898,187 22,716,369 77.08 72.97 85.54 82.67 79.51 89.15 71.16 66.08 81.70
Source: Rural Urban Distribution of Population ‐ India, Census of India 2011#: Refers to Union Territory
UrbanTotal
Literacy RatePersons Males Females
Rural Urban RuralTotal Rural Urban TotalTotal Rural Urban
Literates(Persons)
Page 4 of 5Databook for DCH; 5th December 2012 Page 249 of 266
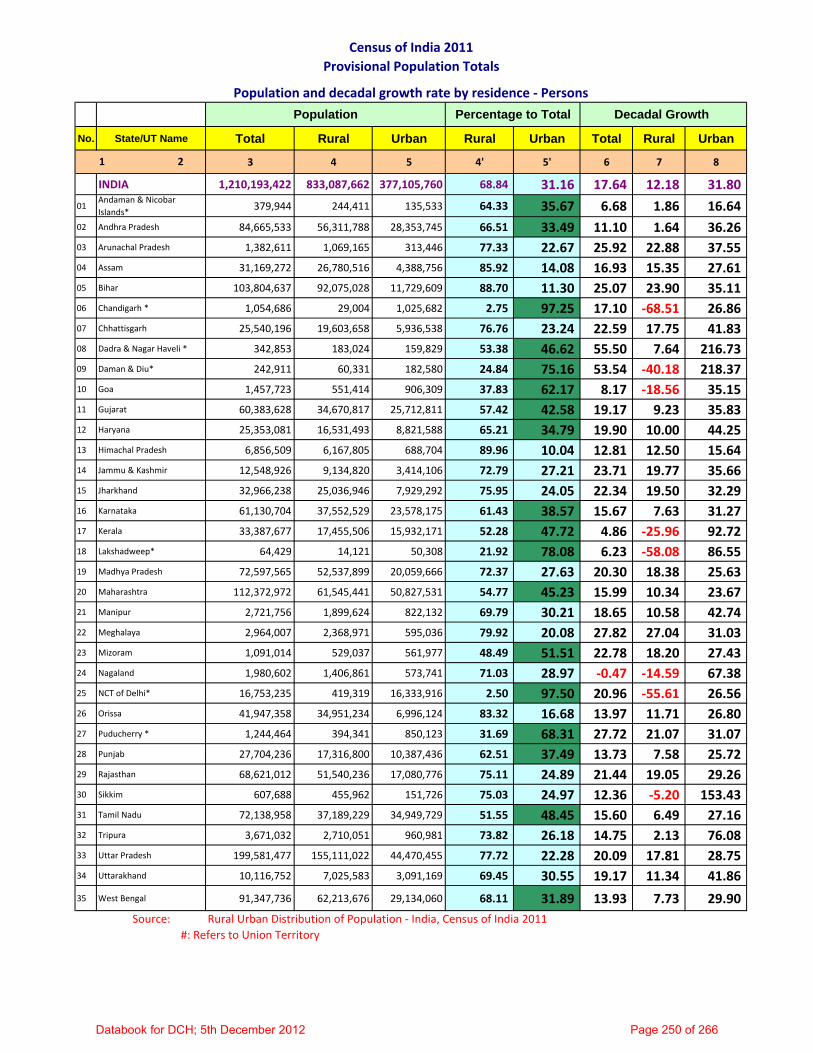
No. State/UT Name Total Rural Urban Rural Urban Total Rural Urban
3 4 5 4' 5' 6 7 8
INDIA 1,210,193,422 833,087,662 377,105,760 68.84 31.16 17.64 12.18 31.8001
Andaman & Nicobar Islands* 379,944 244,411 135,533 64.33 35.67 6.68 1.86 16.64
02 Andhra Pradesh 84,665,533 56,311,788 28,353,745 66.51 33.49 11.10 1.64 36.2603 Arunachal Pradesh 1,382,611 1,069,165 313,446 77.33 22.67 25.92 22.88 37.5504 Assam 31,169,272 26,780,516 4,388,756 85.92 14.08 16.93 15.35 27.6105 Bihar 103,804,637 92,075,028 11,729,609 88.70 11.30 25.07 23.90 35.1106 Chandigarh * 1,054,686 29,004 1,025,682 2.75 97.25 17.10 ‐68.51 26.8607 Chhattisgarh 25,540,196 19,603,658 5,936,538 76.76 23.24 22.59 17.75 41.8308 Dadra & Nagar Haveli * 342,853 183,024 159,829 53.38 46.62 55.50 7.64 216.7309 Daman & Diu* 242,911 60,331 182,580 24.84 75.16 53.54 ‐40.18 218.3710 Goa 1,457,723 551,414 906,309 37.83 62.17 8.17 ‐18.56 35.1511 Gujarat 60,383,628 34,670,817 25,712,811 57.42 42.58 19.17 9.23 35.8312 Haryana 25,353,081 16,531,493 8,821,588 65.21 34.79 19.90 10.00 44.2513 Himachal Pradesh 6,856,509 6,167,805 688,704 89.96 10.04 12.81 12.50 15.6414 Jammu & Kashmir 12,548,926 9,134,820 3,414,106 72.79 27.21 23.71 19.77 35.6615 Jharkhand 32,966,238 25,036,946 7,929,292 75.95 24.05 22.34 19.50 32.2916 Karnataka 61,130,704 37,552,529 23,578,175 61.43 38.57 15.67 7.63 31.2717 Kerala 33,387,677 17,455,506 15,932,171 52.28 47.72 4.86 ‐25.96 92.7218 Lakshadweep* 64,429 14,121 50,308 21.92 78.08 6.23 ‐58.08 86.5519 Madhya Pradesh 72,597,565 52,537,899 20,059,666 72.37 27.63 20.30 18.38 25.6320 Maharashtra 112,372,972 61,545,441 50,827,531 54.77 45.23 15.99 10.34 23.6721 Manipur 2,721,756 1,899,624 822,132 69.79 30.21 18.65 10.58 42.7422 Meghalaya 2,964,007 2,368,971 595,036 79.92 20.08 27.82 27.04 31.0323 Mizoram 1,091,014 529,037 561,977 48.49 51.51 22.78 18.20 27.4324 Nagaland 1,980,602 1,406,861 573,741 71.03 28.97 ‐0.47 ‐14.59 67.3825 NCT of Delhi* 16,753,235 419,319 16,333,916 2.50 97.50 20.96 ‐55.61 26.5626 Orissa 41,947,358 34,951,234 6,996,124 83.32 16.68 13.97 11.71 26.8027 Puducherry * 1,244,464 394,341 850,123 31.69 68.31 27.72 21.07 31.0728 Punjab 27,704,236 17,316,800 10,387,436 62.51 37.49 13.73 7.58 25.7229 Rajasthan 68,621,012 51,540,236 17,080,776 75.11 24.89 21.44 19.05 29.2630 Sikkim 607,688 455,962 151,726 75.03 24.97 12.36 ‐5.20 153.4331 Tamil Nadu 72,138,958 37,189,229 34,949,729 51.55 48.45 15.60 6.49 27.1632 Tripura 3,671,032 2,710,051 960,981 73.82 26.18 14.75 2.13 76.0833 Uttar Pradesh 199,581,477 155,111,022 44,470,455 77.72 22.28 20.09 17.81 28.7534 Uttarakhand 10,116,752 7,025,583 3,091,169 69.45 30.55 19.17 11.34 41.8635 West Bengal 91,347,736 62,213,676 29,134,060 68.11 31.89 13.93 7.73 29.90
Source: Rural Urban Distribution of Population ‐ India, Census of India 2011#: Refers to Union Territory
1 2
Census of India 2011Provisional Population Totals
Population and decadal growth rate by residence ‐ PersonsDecadal Growth Percentage to TotalPopulation
Databook for DCH; 5th December 2012 Page 250 of 266
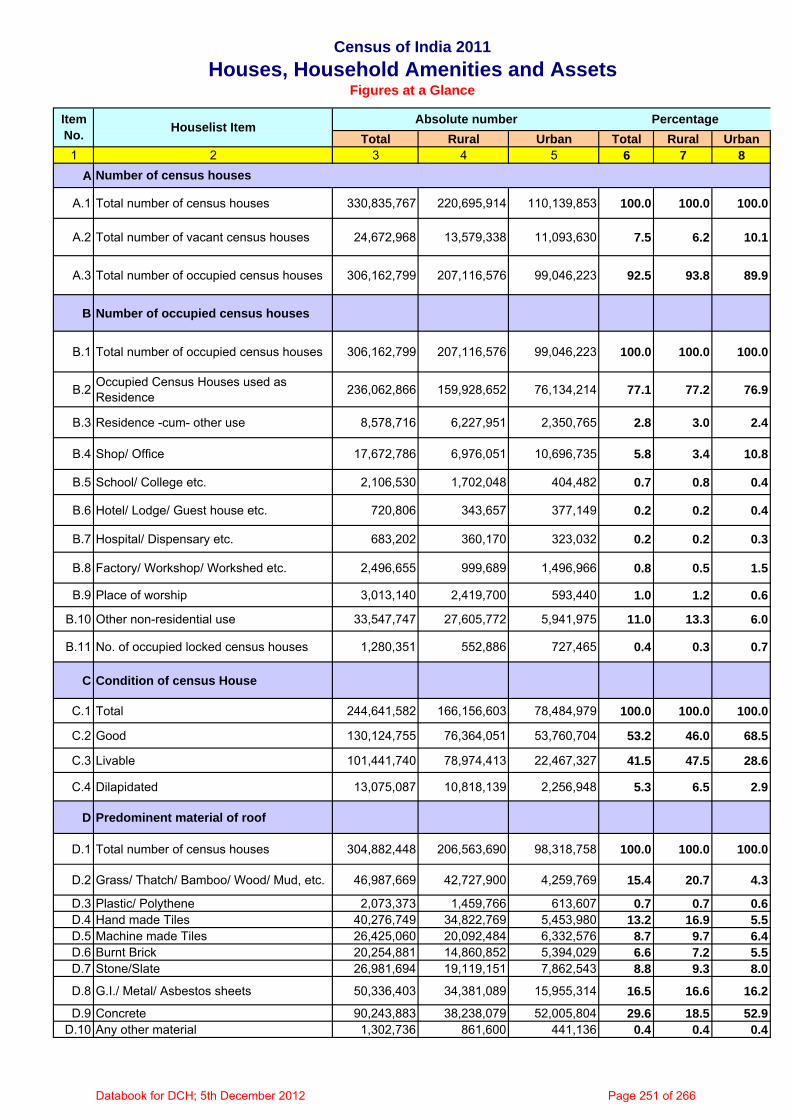
Total Rural Urban Total Rural Urban
1 2 3 4 5 6 7 8
A
A.1 Total number of census houses 330,835,767 220,695,914 110,139,853 100.0 100.0 100.0
A.2 Total number of vacant census houses 24,672,968 13,579,338 11,093,630 7.5 6.2 10.1
A.3 Total number of occupied census houses 306,162,799 207,116,576 99,046,223 92.5 93.8 89.9
B Number of occupied census houses
B.1 Total number of occupied census houses 306,162,799 207,116,576 99,046,223 100.0 100.0 100.0
B.2 Occupied Census Houses used as Residence 236,062,866 159,928,652 76,134,214 77.1 77.2 76.9
B.3 Residence -cum- other use 8,578,716 6,227,951 2,350,765 2.8 3.0 2.4
B.4 Shop/ Office 17,672,786 6,976,051 10,696,735 5.8 3.4 10.8
B.5 School/ College etc. 2,106,530 1,702,048 404,482 0.7 0.8 0.4
B.6 Hotel/ Lodge/ Guest house etc. 720,806 343,657 377,149 0.2 0.2 0.4
B.7 Hospital/ Dispensary etc. 683,202 360,170 323,032 0.2 0.2 0.3
B.8 Factory/ Workshop/ Workshed etc. 2,496,655 999,689 1,496,966 0.8 0.5 1.5
B.9 Place of worship 3,013,140 2,419,700 593,440 1.0 1.2 0.6
B.10 Other non-residential use 33,547,747 27,605,772 5,941,975 11.0 13.3 6.0
B.11 No. of occupied locked census houses 1,280,351 552,886 727,465 0.4 0.3 0.7
C Condition of census House
C.1 Total 244,641,582 166,156,603 78,484,979 100.0 100.0 100.0
C.2 Good 130,124,755 76,364,051 53,760,704 53.2 46.0 68.5
C.3 Livable 101,441,740 78,974,413 22,467,327 41.5 47.5 28.6
C.4 Dilapidated 13,075,087 10,818,139 2,256,948 5.3 6.5 2.9
D Predominent material of roof
D.1 Total number of census houses 304,882,448 206,563,690 98,318,758 100.0 100.0 100.0
D.2 Grass/ Thatch/ Bamboo/ Wood/ Mud, etc. 46,987,669 42,727,900 4,259,769 15.4 20.7 4.3
D.3 Plastic/ Polythene 2,073,373 1,459,766 613,607 0.7 0.7 0.6
D.4 Hand made Tiles 40,276,749 34,822,769 5,453,980 13.2 16.9 5.5
D.5 Machine made Tiles 26,425,060 20,092,484 6,332,576 8.7 9.7 6.4
D.6 Burnt Brick 20,254,881 14,860,852 5,394,029 6.6 7.2 5.5
D.7 Stone/Slate 26,981,694 19,119,151 7,862,543 8.8 9.3 8.0
D.8 G.I./ Metal/ Asbestos sheets 50,336,403 34,381,089 15,955,314 16.5 16.6 16.2
D.9 Concrete 90,243,883 38,238,079 52,005,804 29.6 18.5 52.9
D.10 Any other material 1,302,736 861,600 441,136 0.4 0.4 0.4
Number of census houses
Census of India 2011
Houses, Household Amenities and AssetsFigures at a Glance
Item
No.Houselist Item
Absolute number Percentage
Databook for DCH; 5th December 2012 Page 251 of 266
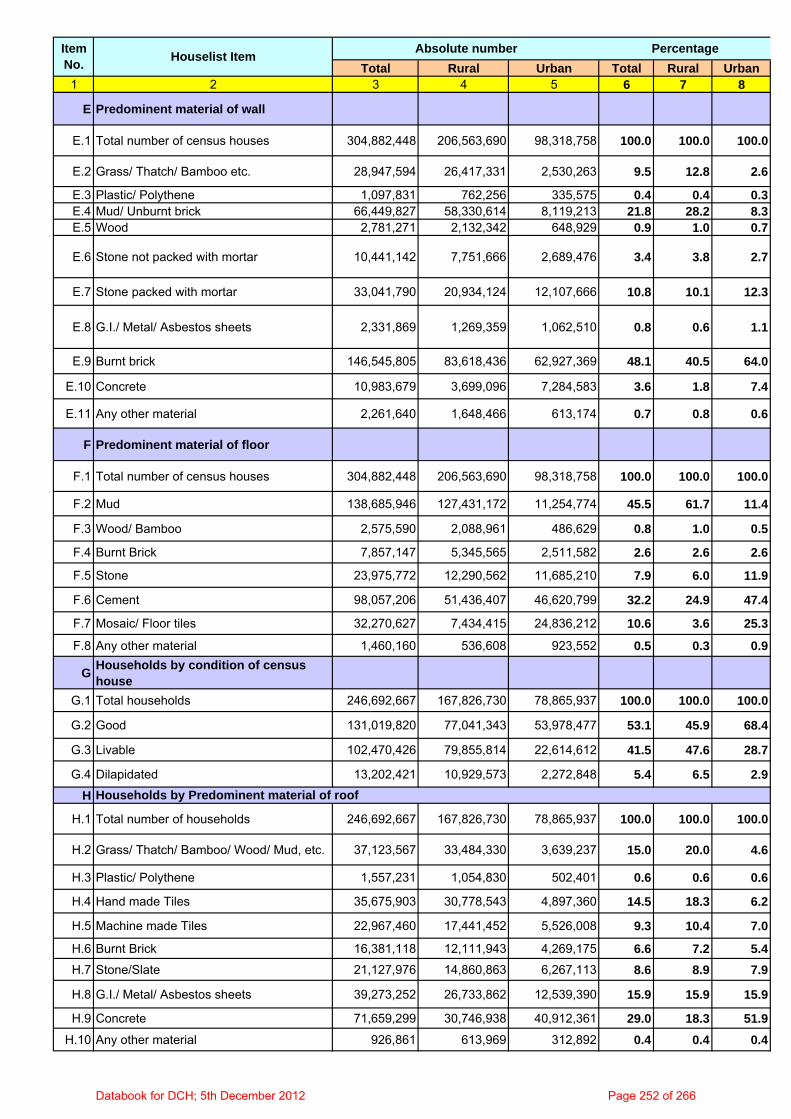
Total Rural Urban Total Rural Urban
1 2 3 4 5 6 7 8
Item
No.Houselist Item
Absolute number Percentage
E Predominent material of wall
E.1 Total number of census houses 304,882,448 206,563,690 98,318,758 100.0 100.0 100.0
E.2 Grass/ Thatch/ Bamboo etc. 28,947,594 26,417,331 2,530,263 9.5 12.8 2.6
E.3 Plastic/ Polythene 1,097,831 762,256 335,575 0.4 0.4 0.3
E.4 Mud/ Unburnt brick 66,449,827 58,330,614 8,119,213 21.8 28.2 8.3
E.5 Wood 2,781,271 2,132,342 648,929 0.9 1.0 0.7
E.6 Stone not packed with mortar 10,441,142 7,751,666 2,689,476 3.4 3.8 2.7
E.7 Stone packed with mortar 33,041,790 20,934,124 12,107,666 10.8 10.1 12.3
E.8 G.I./ Metal/ Asbestos sheets 2,331,869 1,269,359 1,062,510 0.8 0.6 1.1
E.9 Burnt brick 146,545,805 83,618,436 62,927,369 48.1 40.5 64.0
E.10 Concrete 10,983,679 3,699,096 7,284,583 3.6 1.8 7.4
E.11 Any other material 2,261,640 1,648,466 613,174 0.7 0.8 0.6
F Predominent material of floor
F.1 Total number of census houses 304,882,448 206,563,690 98,318,758 100.0 100.0 100.0
F.2 Mud 138,685,946 127,431,172 11,254,774 45.5 61.7 11.4
F.3 Wood/ Bamboo 2,575,590 2,088,961 486,629 0.8 1.0 0.5
F.4 Burnt Brick 7,857,147 5,345,565 2,511,582 2.6 2.6 2.6
F.5 Stone 23,975,772 12,290,562 11,685,210 7.9 6.0 11.9
F.6 Cement 98,057,206 51,436,407 46,620,799 32.2 24.9 47.4
F.7 Mosaic/ Floor tiles 32,270,627 7,434,415 24,836,212 10.6 3.6 25.3
F.8 Any other material 1,460,160 536,608 923,552 0.5 0.3 0.9
GHouseholds by condition of census
house
G.1 Total households 246,692,667 167,826,730 78,865,937 100.0 100.0 100.0
G.2 Good 131,019,820 77,041,343 53,978,477 53.1 45.9 68.4
G.3 Livable 102,470,426 79,855,814 22,614,612 41.5 47.6 28.7
G.4 Dilapidated 13,202,421 10,929,573 2,272,848 5.4 6.5 2.9
H
H.1 Total number of households 246,692,667 167,826,730 78,865,937 100.0 100.0 100.0
H.2 Grass/ Thatch/ Bamboo/ Wood/ Mud, etc. 37,123,567 33,484,330 3,639,237 15.0 20.0 4.6
H.3 Plastic/ Polythene 1,557,231 1,054,830 502,401 0.6 0.6 0.6
H.4 Hand made Tiles 35,675,903 30,778,543 4,897,360 14.5 18.3 6.2
H.5 Machine made Tiles 22,967,460 17,441,452 5,526,008 9.3 10.4 7.0
H.6 Burnt Brick 16,381,118 12,111,943 4,269,175 6.6 7.2 5.4
H.7 Stone/Slate 21,127,976 14,860,863 6,267,113 8.6 8.9 7.9
H.8 G.I./ Metal/ Asbestos sheets 39,273,252 26,733,862 12,539,390 15.9 15.9 15.9
H.9 Concrete 71,659,299 30,746,938 40,912,361 29.0 18.3 51.9
H.10 Any other material 926,861 613,969 312,892 0.4 0.4 0.4
Households by Predominent material of roof
Databook for DCH; 5th December 2012 Page 252 of 266
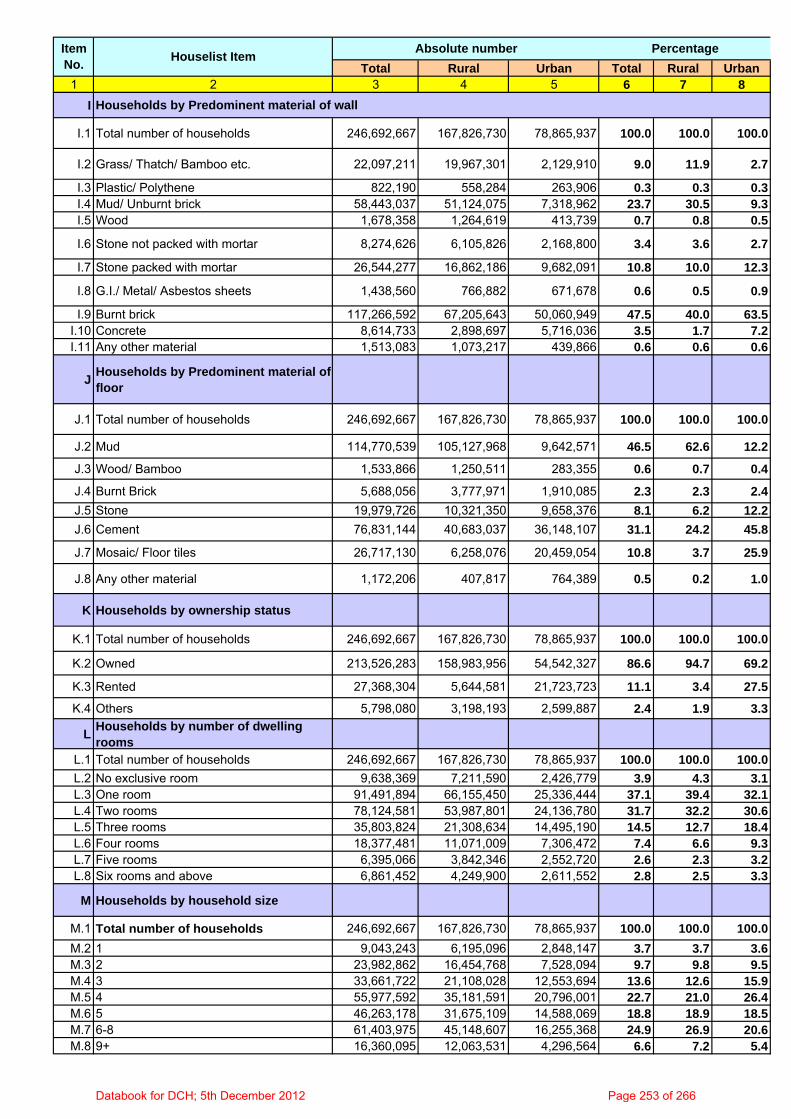
Total Rural Urban Total Rural Urban
1 2 3 4 5 6 7 8
Item
No.Houselist Item
Absolute number Percentage
I
I.1 Total number of households 246,692,667 167,826,730 78,865,937 100.0 100.0 100.0
I.2 Grass/ Thatch/ Bamboo etc. 22,097,211 19,967,301 2,129,910 9.0 11.9 2.7
I.3 Plastic/ Polythene 822,190 558,284 263,906 0.3 0.3 0.3
I.4 Mud/ Unburnt brick 58,443,037 51,124,075 7,318,962 23.7 30.5 9.3
I.5 Wood 1,678,358 1,264,619 413,739 0.7 0.8 0.5
I.6 Stone not packed with mortar 8,274,626 6,105,826 2,168,800 3.4 3.6 2.7
I.7 Stone packed with mortar 26,544,277 16,862,186 9,682,091 10.8 10.0 12.3
I.8 G.I./ Metal/ Asbestos sheets 1,438,560 766,882 671,678 0.6 0.5 0.9
I.9 Burnt brick 117,266,592 67,205,643 50,060,949 47.5 40.0 63.5
I.10 Concrete 8,614,733 2,898,697 5,716,036 3.5 1.7 7.2
I.11 Any other material 1,513,083 1,073,217 439,866 0.6 0.6 0.6
JHouseholds by Predominent material of
floor
J.1 Total number of households 246,692,667 167,826,730 78,865,937 100.0 100.0 100.0
J.2 Mud 114,770,539 105,127,968 9,642,571 46.5 62.6 12.2
J.3 Wood/ Bamboo 1,533,866 1,250,511 283,355 0.6 0.7 0.4
J.4 Burnt Brick 5,688,056 3,777,971 1,910,085 2.3 2.3 2.4
J.5 Stone 19,979,726 10,321,350 9,658,376 8.1 6.2 12.2
J.6 Cement 76,831,144 40,683,037 36,148,107 31.1 24.2 45.8
J.7 Mosaic/ Floor tiles 26,717,130 6,258,076 20,459,054 10.8 3.7 25.9
J.8 Any other material 1,172,206 407,817 764,389 0.5 0.2 1.0
K Households by ownership status
K.1 Total number of households 246,692,667 167,826,730 78,865,937 100.0 100.0 100.0
K.2 Owned 213,526,283 158,983,956 54,542,327 86.6 94.7 69.2
K.3 Rented 27,368,304 5,644,581 21,723,723 11.1 3.4 27.5
K.4 Others 5,798,080 3,198,193 2,599,887 2.4 1.9 3.3
LHouseholds by number of dwelling
rooms
L.1 Total number of households 246,692,667 167,826,730 78,865,937 100.0 100.0 100.0
L.2 No exclusive room 9,638,369 7,211,590 2,426,779 3.9 4.3 3.1
L.3 One room 91,491,894 66,155,450 25,336,444 37.1 39.4 32.1
L.4 Two rooms 78,124,581 53,987,801 24,136,780 31.7 32.2 30.6
L.5 Three rooms 35,803,824 21,308,634 14,495,190 14.5 12.7 18.4
L.6 Four rooms 18,377,481 11,071,009 7,306,472 7.4 6.6 9.3
L.7 Five rooms 6,395,066 3,842,346 2,552,720 2.6 2.3 3.2
L.8 Six rooms and above 6,861,452 4,249,900 2,611,552 2.8 2.5 3.3
M Households by household size
M.1 Total number of households 246,692,667 167,826,730 78,865,937 100.0 100.0 100.0
M.2 1 9,043,243 6,195,096 2,848,147 3.7 3.7 3.6
M.3 2 23,982,862 16,454,768 7,528,094 9.7 9.8 9.5
M.4 3 33,661,722 21,108,028 12,553,694 13.6 12.6 15.9
M.5 4 55,977,592 35,181,591 20,796,001 22.7 21.0 26.4
M.6 5 46,263,178 31,675,109 14,588,069 18.8 18.9 18.5
M.7 6-8 61,403,975 45,148,607 16,255,368 24.9 26.9 20.6
M.8 9+ 16,360,095 12,063,531 4,296,564 6.6 7.2 5.4
Households by Predominent material of wall
Databook for DCH; 5th December 2012 Page 253 of 266
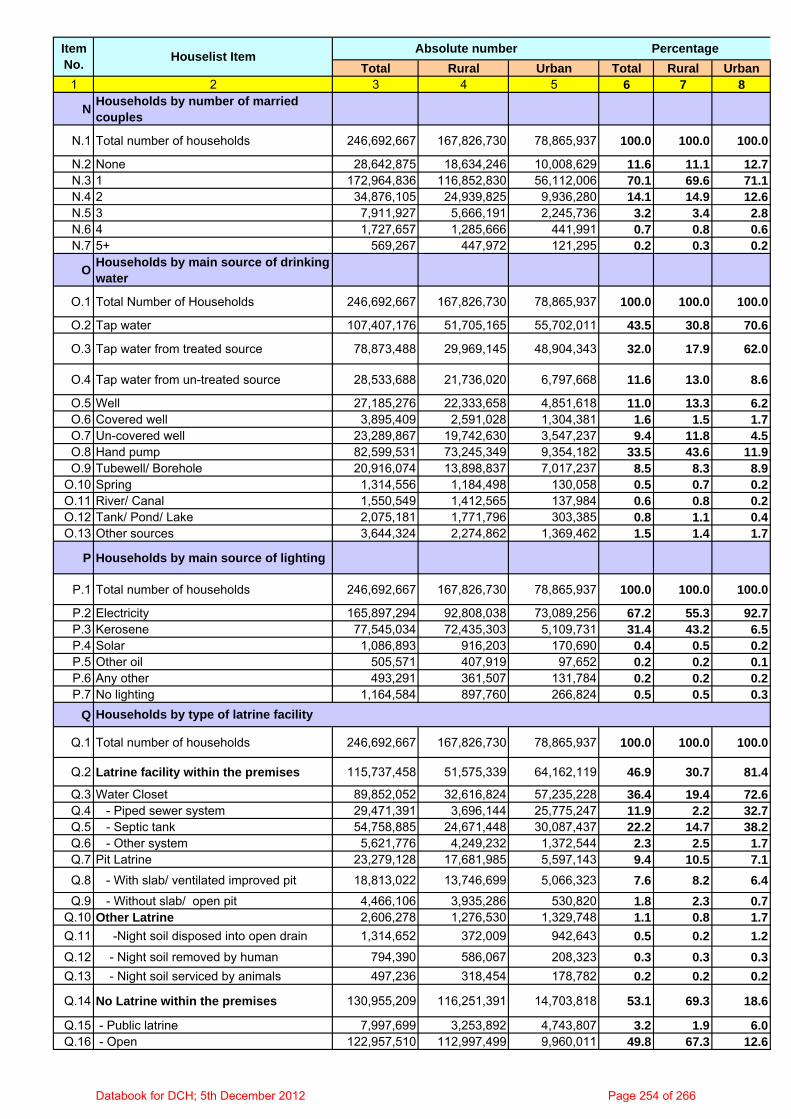
Total Rural Urban Total Rural Urban
1 2 3 4 5 6 7 8
Item
No.Houselist Item
Absolute number Percentage
NHouseholds by number of married
couples
N.1 Total number of households 246,692,667 167,826,730 78,865,937 100.0 100.0 100.0
N.2 None 28,642,875 18,634,246 10,008,629 11.6 11.1 12.7
N.3 1 172,964,836 116,852,830 56,112,006 70.1 69.6 71.1
N.4 2 34,876,105 24,939,825 9,936,280 14.1 14.9 12.6
N.5 3 7,911,927 5,666,191 2,245,736 3.2 3.4 2.8
N.6 4 1,727,657 1,285,666 441,991 0.7 0.8 0.6
N.7 5+ 569,267 447,972 121,295 0.2 0.3 0.2
OHouseholds by main source of drinking
water
O.1 Total Number of Households 246,692,667 167,826,730 78,865,937 100.0 100.0 100.0
O.2 Tap water 107,407,176 51,705,165 55,702,011 43.5 30.8 70.6
O.3 Tap water from treated source 78,873,488 29,969,145 48,904,343 32.0 17.9 62.0
O.4 Tap water from un-treated source 28,533,688 21,736,020 6,797,668 11.6 13.0 8.6
O.5 Well 27,185,276 22,333,658 4,851,618 11.0 13.3 6.2
O.6 Covered well 3,895,409 2,591,028 1,304,381 1.6 1.5 1.7
O.7 Un-covered well 23,289,867 19,742,630 3,547,237 9.4 11.8 4.5
O.8 Hand pump 82,599,531 73,245,349 9,354,182 33.5 43.6 11.9
O.9 Tubewell/ Borehole 20,916,074 13,898,837 7,017,237 8.5 8.3 8.9
O.10 Spring 1,314,556 1,184,498 130,058 0.5 0.7 0.2
O.11 River/ Canal 1,550,549 1,412,565 137,984 0.6 0.8 0.2
O.12 Tank/ Pond/ Lake 2,075,181 1,771,796 303,385 0.8 1.1 0.4
O.13 Other sources 3,644,324 2,274,862 1,369,462 1.5 1.4 1.7
P Households by main source of lighting
P.1 Total number of households 246,692,667 167,826,730 78,865,937 100.0 100.0 100.0
P.2 Electricity 165,897,294 92,808,038 73,089,256 67.2 55.3 92.7
P.3 Kerosene 77,545,034 72,435,303 5,109,731 31.4 43.2 6.5
P.4 Solar 1,086,893 916,203 170,690 0.4 0.5 0.2
P.5 Other oil 505,571 407,919 97,652 0.2 0.2 0.1
P.6 Any other 493,291 361,507 131,784 0.2 0.2 0.2
P.7 No lighting 1,164,584 897,760 266,824 0.5 0.5 0.3
Q
Q.1 Total number of households 246,692,667 167,826,730 78,865,937 100.0 100.0 100.0
Q.2 Latrine facility within the premises 115,737,458 51,575,339 64,162,119 46.9 30.7 81.4
Q.3 Water Closet 89,852,052 32,616,824 57,235,228 36.4 19.4 72.6
Q.4 - Piped sewer system 29,471,391 3,696,144 25,775,247 11.9 2.2 32.7
Q.5 - Septic tank 54,758,885 24,671,448 30,087,437 22.2 14.7 38.2
Q.6 - Other system 5,621,776 4,249,232 1,372,544 2.3 2.5 1.7
Q.7 Pit Latrine 23,279,128 17,681,985 5,597,143 9.4 10.5 7.1
Q.8 - With slab/ ventilated improved pit 18,813,022 13,746,699 5,066,323 7.6 8.2 6.4
Q.9 - Without slab/ open pit 4,466,106 3,935,286 530,820 1.8 2.3 0.7
Q.10 Other Latrine 2,606,278 1,276,530 1,329,748 1.1 0.8 1.7
Q.11 -Night soil disposed into open drain 1,314,652 372,009 942,643 0.5 0.2 1.2
Q.12 - Night soil removed by human 794,390 586,067 208,323 0.3 0.3 0.3
Q.13 - Night soil serviced by animals 497,236 318,454 178,782 0.2 0.2 0.2
Q.14 No Latrine within the premises 130,955,209 116,251,391 14,703,818 53.1 69.3 18.6
Q.15 - Public latrine 7,997,699 3,253,892 4,743,807 3.2 1.9 6.0
Q.16 - Open 122,957,510 112,997,499 9,960,011 49.8 67.3 12.6
Households by type of latrine facility
Databook for DCH; 5th December 2012 Page 254 of 266
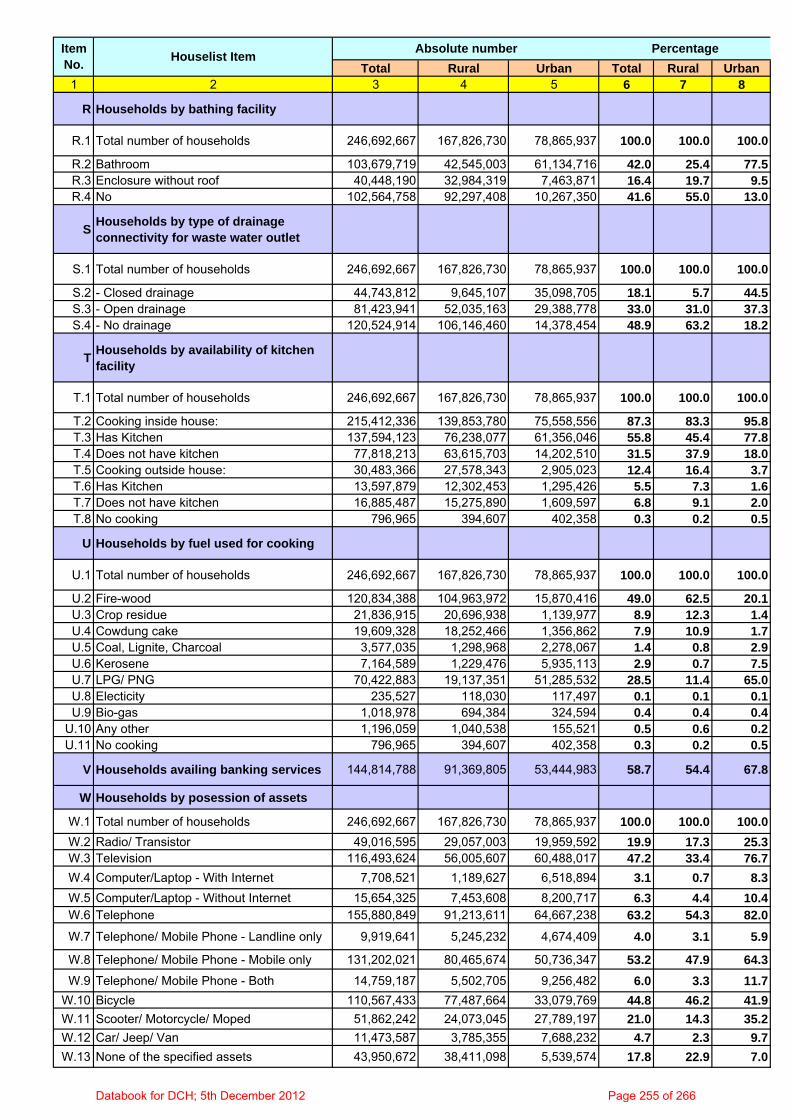
Total Rural Urban Total Rural Urban
1 2 3 4 5 6 7 8
Item
No.Houselist Item
Absolute number Percentage
R Households by bathing facility
R.1 Total number of households 246,692,667 167,826,730 78,865,937 100.0 100.0 100.0
R.2 Bathroom 103,679,719 42,545,003 61,134,716 42.0 25.4 77.5
R.3 Enclosure without roof 40,448,190 32,984,319 7,463,871 16.4 19.7 9.5
R.4 No 102,564,758 92,297,408 10,267,350 41.6 55.0 13.0
SHouseholds by type of drainage
connectivity for waste water outlet
S.1 Total number of households 246,692,667 167,826,730 78,865,937 100.0 100.0 100.0
S.2 - Closed drainage 44,743,812 9,645,107 35,098,705 18.1 5.7 44.5
S.3 - Open drainage 81,423,941 52,035,163 29,388,778 33.0 31.0 37.3
S.4 - No drainage 120,524,914 106,146,460 14,378,454 48.9 63.2 18.2
THouseholds by availability of kitchen
facility
T.1 Total number of households 246,692,667 167,826,730 78,865,937 100.0 100.0 100.0
T.2 Cooking inside house: 215,412,336 139,853,780 75,558,556 87.3 83.3 95.8
T.3 Has Kitchen 137,594,123 76,238,077 61,356,046 55.8 45.4 77.8
T.4 Does not have kitchen 77,818,213 63,615,703 14,202,510 31.5 37.9 18.0
T.5 Cooking outside house: 30,483,366 27,578,343 2,905,023 12.4 16.4 3.7
T.6 Has Kitchen 13,597,879 12,302,453 1,295,426 5.5 7.3 1.6
T.7 Does not have kitchen 16,885,487 15,275,890 1,609,597 6.8 9.1 2.0
T.8 No cooking 796,965 394,607 402,358 0.3 0.2 0.5
U Households by fuel used for cooking
U.1 Total number of households 246,692,667 167,826,730 78,865,937 100.0 100.0 100.0
U.2 Fire-wood 120,834,388 104,963,972 15,870,416 49.0 62.5 20.1
U.3 Crop residue 21,836,915 20,696,938 1,139,977 8.9 12.3 1.4
U.4 Cowdung cake 19,609,328 18,252,466 1,356,862 7.9 10.9 1.7
U.5 Coal, Lignite, Charcoal 3,577,035 1,298,968 2,278,067 1.4 0.8 2.9
U.6 Kerosene 7,164,589 1,229,476 5,935,113 2.9 0.7 7.5
U.7 LPG/ PNG 70,422,883 19,137,351 51,285,532 28.5 11.4 65.0
U.8 Electicity 235,527 118,030 117,497 0.1 0.1 0.1
U.9 Bio-gas 1,018,978 694,384 324,594 0.4 0.4 0.4
U.10 Any other 1,196,059 1,040,538 155,521 0.5 0.6 0.2
U.11 No cooking 796,965 394,607 402,358 0.3 0.2 0.5
V Households availing banking services 144,814,788 91,369,805 53,444,983 58.7 54.4 67.8
W Households by posession of assets
W.1 Total number of households 246,692,667 167,826,730 78,865,937 100.0 100.0 100.0
W.2 Radio/ Transistor 49,016,595 29,057,003 19,959,592 19.9 17.3 25.3
W.3 Television 116,493,624 56,005,607 60,488,017 47.2 33.4 76.7
W.4 Computer/Laptop - With Internet 7,708,521 1,189,627 6,518,894 3.1 0.7 8.3
W.5 Computer/Laptop - Without Internet 15,654,325 7,453,608 8,200,717 6.3 4.4 10.4
W.6 Telephone 155,880,849 91,213,611 64,667,238 63.2 54.3 82.0
W.7 Telephone/ Mobile Phone - Landline only 9,919,641 5,245,232 4,674,409 4.0 3.1 5.9
W.8 Telephone/ Mobile Phone - Mobile only 131,202,021 80,465,674 50,736,347 53.2 47.9 64.3
W.9 Telephone/ Mobile Phone - Both 14,759,187 5,502,705 9,256,482 6.0 3.3 11.7
W.10 Bicycle 110,567,433 77,487,664 33,079,769 44.8 46.2 41.9
W.11 Scooter/ Motorcycle/ Moped 51,862,242 24,073,045 27,789,197 21.0 14.3 35.2
W.12 Car/ Jeep/ Van 11,473,587 3,785,355 7,688,232 4.7 2.3 9.7
W.13 None of the specified assets 43,950,672 38,411,098 5,539,574 17.8 22.9 7.0
Databook for DCH; 5th December 2012 Page 255 of 266
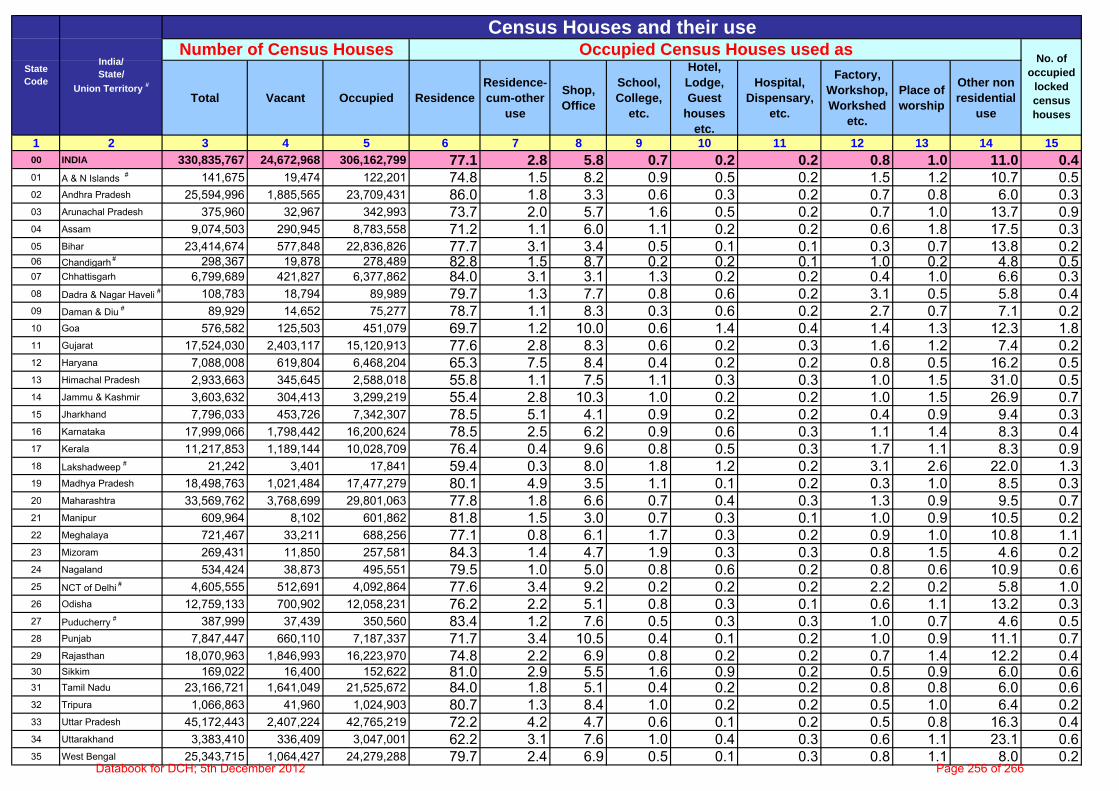
State
Code
India/
State/
Union Territory #
Census Houses and their useNumber of Census Houses Occupied Census Houses used as
No. of
occupied
locked
census
houses
Total Vacant Occupied Residence
Residence-
cum-other
use
Shop,
Office
School,
College,
etc.
Hotel,
Lodge,
Guest
houses
etc.
Hospital,
Dispensary,
etc.
Factory,
Workshop,
Workshed
etc.
Place of
worship
Other non
residential
use
1 2 3 4 5 6 7 8 9 10 11 12 13 14 15
00 INDIA 330,835,767 24,672,968 306,162,799 77.1 2.8 5.8 0.7 0.2 0.2 0.8 1.0 11.0 0.401 A & N Islands # 141,675 19,474 122,201 74.8 1.5 8.2 0.9 0.5 0.2 1.5 1.2 10.7 0.502 Andhra Pradesh 25,594,996 1,885,565 23,709,431 86.0 1.8 3.3 0.6 0.3 0.2 0.7 0.8 6.0 0.303 Arunachal Pradesh 375,960 32,967 342,993 73.7 2.0 5.7 1.6 0.5 0.2 0.7 1.0 13.7 0.904 Assam 9,074,503 290,945 8,783,558 71.2 1.1 6.0 1.1 0.2 0.2 0.6 1.8 17.5 0.305 Bihar 23,414,674 577,848 22,836,826 77.7 3.1 3.4 0.5 0.1 0.1 0.3 0.7 13.8 0.206 Chandigarh # 298,367 19,878 278,489 82.8 1.5 8.7 0.2 0.2 0.1 1.0 0.2 4.8 0.507 Chhattisgarh 6,799,689 421,827 6,377,862 84.0 3.1 3.1 1.3 0.2 0.2 0.4 1.0 6.6 0.308 Dadra & Nagar Haveli # 108,783 18,794 89,989 79.7 1.3 7.7 0.8 0.6 0.2 3.1 0.5 5.8 0.409 Daman & Diu # 89,929 14,652 75,277 78.7 1.1 8.3 0.3 0.6 0.2 2.7 0.7 7.1 0.210 Goa 576,582 125,503 451,079 69.7 1.2 10.0 0.6 1.4 0.4 1.4 1.3 12.3 1.811 Gujarat 17,524,030 2,403,117 15,120,913 77.6 2.8 8.3 0.6 0.2 0.3 1.6 1.2 7.4 0.212 Haryana 7,088,008 619,804 6,468,204 65.3 7.5 8.4 0.4 0.2 0.2 0.8 0.5 16.2 0.513 Himachal Pradesh 2,933,663 345,645 2,588,018 55.8 1.1 7.5 1.1 0.3 0.3 1.0 1.5 31.0 0.514 Jammu & Kashmir 3,603,632 304,413 3,299,219 55.4 2.8 10.3 1.0 0.2 0.2 1.0 1.5 26.9 0.715 Jharkhand 7,796,033 453,726 7,342,307 78.5 5.1 4.1 0.9 0.2 0.2 0.4 0.9 9.4 0.316 Karnataka 17,999,066 1,798,442 16,200,624 78.5 2.5 6.2 0.9 0.6 0.3 1.1 1.4 8.3 0.417 Kerala 11,217,853 1,189,144 10,028,709 76.4 0.4 9.6 0.8 0.5 0.3 1.7 1.1 8.3 0.918 Lakshadweep # 21,242 3,401 17,841 59.4 0.3 8.0 1.8 1.2 0.2 3.1 2.6 22.0 1.319 Madhya Pradesh 18,498,763 1,021,484 17,477,279 80.1 4.9 3.5 1.1 0.1 0.2 0.3 1.0 8.5 0.320 Maharashtra 33,569,762 3,768,699 29,801,063 77.8 1.8 6.6 0.7 0.4 0.3 1.3 0.9 9.5 0.721 Manipur 609,964 8,102 601,862 81.8 1.5 3.0 0.7 0.3 0.1 1.0 0.9 10.5 0.222 Meghalaya 721,467 33,211 688,256 77.1 0.8 6.1 1.7 0.3 0.2 0.9 1.0 10.8 1.123 Mizoram 269,431 11,850 257,581 84.3 1.4 4.7 1.9 0.3 0.3 0.8 1.5 4.6 0.224 Nagaland 534,424 38,873 495,551 79.5 1.0 5.0 0.8 0.6 0.2 0.8 0.6 10.9 0.625 NCT of Delhi # 4,605,555 512,691 4,092,864 77.6 3.4 9.2 0.2 0.2 0.2 2.2 0.2 5.8 1.026 Odisha 12,759,133 700,902 12,058,231 76.2 2.2 5.1 0.8 0.3 0.1 0.6 1.1 13.2 0.327 Puducherry # 387,999 37,439 350,560 83.4 1.2 7.6 0.5 0.3 0.3 1.0 0.7 4.6 0.528 Punjab 7,847,447 660,110 7,187,337 71.7 3.4 10.5 0.4 0.1 0.2 1.0 0.9 11.1 0.729 Rajasthan 18,070,963 1,846,993 16,223,970 74.8 2.2 6.9 0.8 0.2 0.2 0.7 1.4 12.2 0.430 Sikkim 169,022 16,400 152,622 81.0 2.9 5.5 1.6 0.9 0.2 0.5 0.9 6.0 0.631 Tamil Nadu 23,166,721 1,641,049 21,525,672 84.0 1.8 5.1 0.4 0.2 0.2 0.8 0.8 6.0 0.632 Tripura 1,066,863 41,960 1,024,903 80.7 1.3 8.4 1.0 0.2 0.2 0.5 1.0 6.4 0.233 Uttar Pradesh 45,172,443 2,407,224 42,765,219 72.2 4.2 4.7 0.6 0.1 0.2 0.5 0.8 16.3 0.434 Uttarakhand 3,383,410 336,409 3,047,001 62.2 3.1 7.6 1.0 0.4 0.3 0.6 1.1 23.1 0.635 West Bengal 25,343,715 1,064,427 24,279,288 79.7 2.4 6.9 0.5 0.1 0.3 0.8 1.1 8.0 0.2
Databook for DCH; 5th December 2012 Page 256 of 266
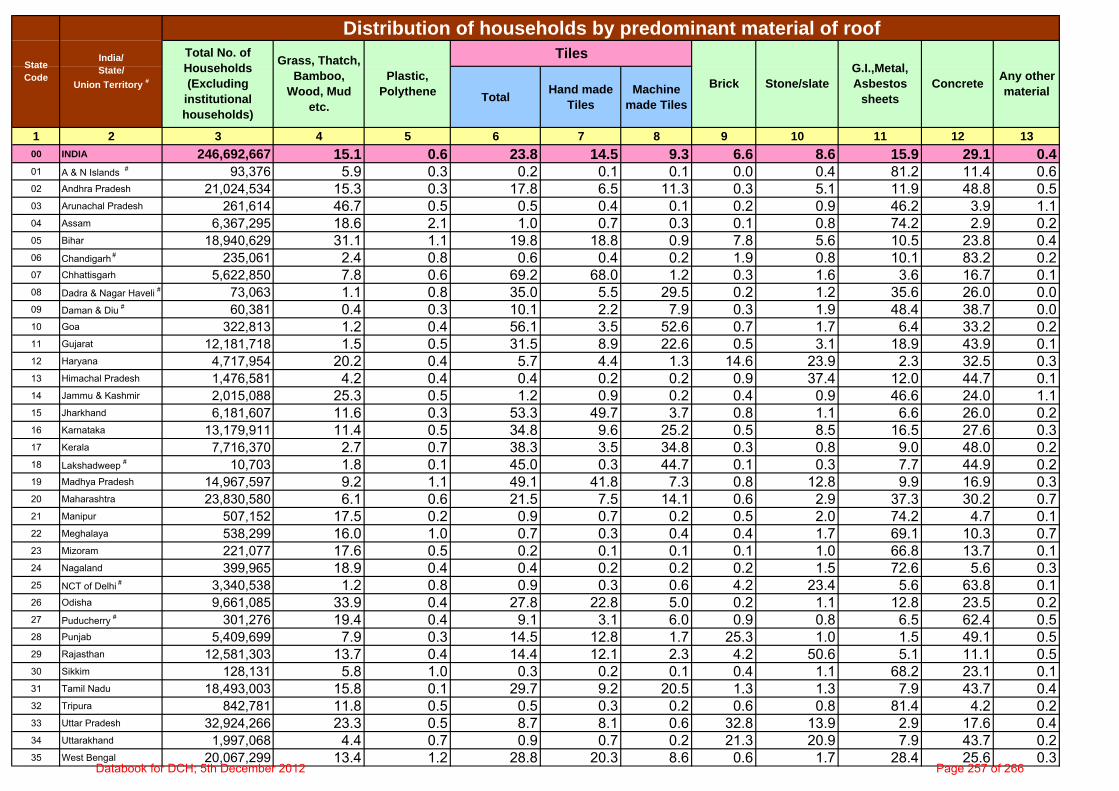
State
Code
India/
State/
Union Territory #
Distribution of households by predominant material of roofTotal No. of
Households
(Excluding
institutional
households)
Grass, Thatch,
Bamboo,
Wood, Mud
etc.
Plastic,
Polythene
Tiles
Brick Stone/slate
G.I.,Metal,
Asbestos
sheets
ConcreteAny other
materialTotal
Hand made
Tiles
Machine
made Tiles
1 2 3 4 5 6 7 8 9 10 11 12 13
00 INDIA 246,692,667 15.1 0.6 23.8 14.5 9.3 6.6 8.6 15.9 29.1 0.401 A & N Islands # 93,376 5.9 0.3 0.2 0.1 0.1 0.0 0.4 81.2 11.4 0.602 Andhra Pradesh 21,024,534 15.3 0.3 17.8 6.5 11.3 0.3 5.1 11.9 48.8 0.503 Arunachal Pradesh 261,614 46.7 0.5 0.5 0.4 0.1 0.2 0.9 46.2 3.9 1.104 Assam 6,367,295 18.6 2.1 1.0 0.7 0.3 0.1 0.8 74.2 2.9 0.205 Bihar 18,940,629 31.1 1.1 19.8 18.8 0.9 7.8 5.6 10.5 23.8 0.406 Chandigarh # 235,061 2.4 0.8 0.6 0.4 0.2 1.9 0.8 10.1 83.2 0.207 Chhattisgarh 5,622,850 7.8 0.6 69.2 68.0 1.2 0.3 1.6 3.6 16.7 0.108 Dadra & Nagar Haveli # 73,063 1.1 0.8 35.0 5.5 29.5 0.2 1.2 35.6 26.0 0.009 Daman & Diu # 60,381 0.4 0.3 10.1 2.2 7.9 0.3 1.9 48.4 38.7 0.010 Goa 322,813 1.2 0.4 56.1 3.5 52.6 0.7 1.7 6.4 33.2 0.211 Gujarat 12,181,718 1.5 0.5 31.5 8.9 22.6 0.5 3.1 18.9 43.9 0.112 Haryana 4,717,954 20.2 0.4 5.7 4.4 1.3 14.6 23.9 2.3 32.5 0.313 Himachal Pradesh 1,476,581 4.2 0.4 0.4 0.2 0.2 0.9 37.4 12.0 44.7 0.114 Jammu & Kashmir 2,015,088 25.3 0.5 1.2 0.9 0.2 0.4 0.9 46.6 24.0 1.115 Jharkhand 6,181,607 11.6 0.3 53.3 49.7 3.7 0.8 1.1 6.6 26.0 0.216 Karnataka 13,179,911 11.4 0.5 34.8 9.6 25.2 0.5 8.5 16.5 27.6 0.317 Kerala 7,716,370 2.7 0.7 38.3 3.5 34.8 0.3 0.8 9.0 48.0 0.218 Lakshadweep # 10,703 1.8 0.1 45.0 0.3 44.7 0.1 0.3 7.7 44.9 0.219 Madhya Pradesh 14,967,597 9.2 1.1 49.1 41.8 7.3 0.8 12.8 9.9 16.9 0.320 Maharashtra 23,830,580 6.1 0.6 21.5 7.5 14.1 0.6 2.9 37.3 30.2 0.721 Manipur 507,152 17.5 0.2 0.9 0.7 0.2 0.5 2.0 74.2 4.7 0.122 Meghalaya 538,299 16.0 1.0 0.7 0.3 0.4 0.4 1.7 69.1 10.3 0.723 Mizoram 221,077 17.6 0.5 0.2 0.1 0.1 0.1 1.0 66.8 13.7 0.124 Nagaland 399,965 18.9 0.4 0.4 0.2 0.2 0.2 1.5 72.6 5.6 0.325 NCT of Delhi # 3,340,538 1.2 0.8 0.9 0.3 0.6 4.2 23.4 5.6 63.8 0.126 Odisha 9,661,085 33.9 0.4 27.8 22.8 5.0 0.2 1.1 12.8 23.5 0.227 Puducherry # 301,276 19.4 0.4 9.1 3.1 6.0 0.9 0.8 6.5 62.4 0.528 Punjab 5,409,699 7.9 0.3 14.5 12.8 1.7 25.3 1.0 1.5 49.1 0.529 Rajasthan 12,581,303 13.7 0.4 14.4 12.1 2.3 4.2 50.6 5.1 11.1 0.530 Sikkim 128,131 5.8 1.0 0.3 0.2 0.1 0.4 1.1 68.2 23.1 0.131 Tamil Nadu 18,493,003 15.8 0.1 29.7 9.2 20.5 1.3 1.3 7.9 43.7 0.432 Tripura 842,781 11.8 0.5 0.5 0.3 0.2 0.6 0.8 81.4 4.2 0.233 Uttar Pradesh 32,924,266 23.3 0.5 8.7 8.1 0.6 32.8 13.9 2.9 17.6 0.434 Uttarakhand 1,997,068 4.4 0.7 0.9 0.7 0.2 21.3 20.9 7.9 43.7 0.235 West Bengal 20,067,299 13.4 1.2 28.8 20.3 8.6 0.6 1.7 28.4 25.6 0.3
Databook for DCH; 5th December 2012 Page 257 of 266
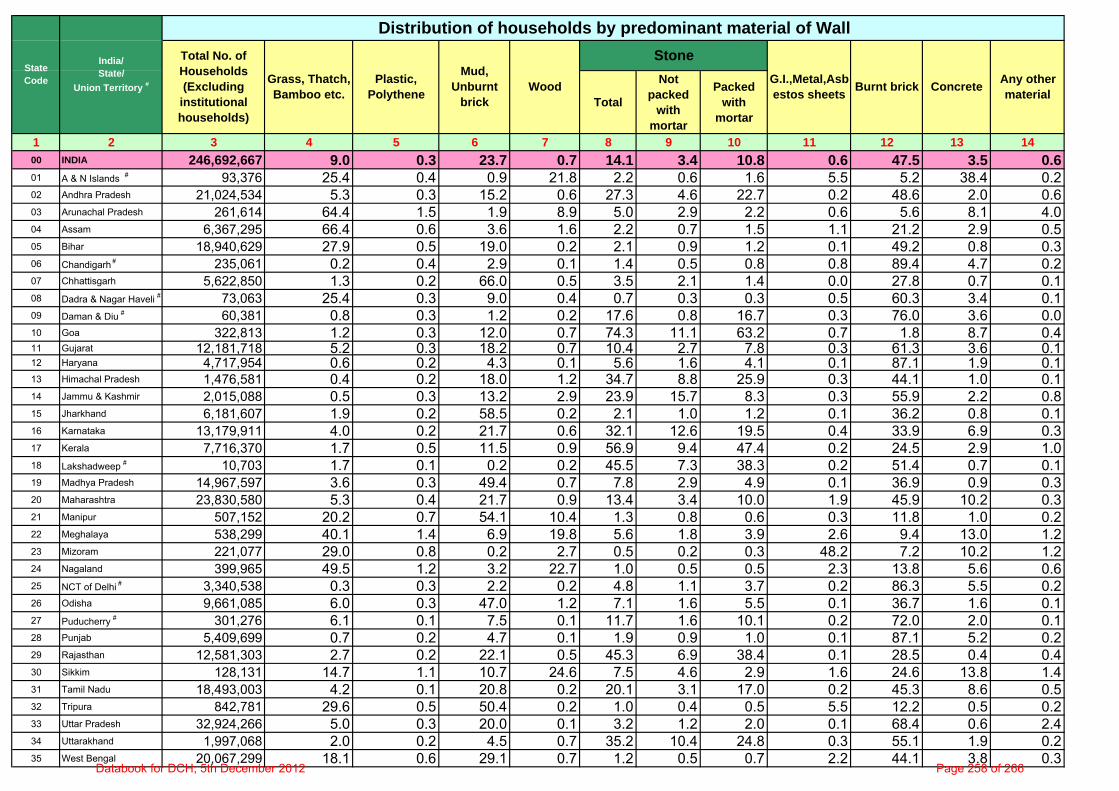
State
Code
India/
State/
Union Territory #
Distribution of households by predominant material of Wall
Total No. of
Households
(Excluding
institutional
households)
Grass, Thatch,
Bamboo etc.
Plastic,
Polythene
Mud,
Unburnt
brick
Wood
Stone
G.I.,Metal,Asb
estos sheetsBurnt brick Concrete
Any other
materialTotal
Not
packed
with
mortar
Packed
with
mortar
1 2 3 4 5 6 7 8 9 10 11 12 13 14
00 INDIA 246,692,667 9.0 0.3 23.7 0.7 14.1 3.4 10.8 0.6 47.5 3.5 0.601 A & N Islands # 93,376 25.4 0.4 0.9 21.8 2.2 0.6 1.6 5.5 5.2 38.4 0.202 Andhra Pradesh 21,024,534 5.3 0.3 15.2 0.6 27.3 4.6 22.7 0.2 48.6 2.0 0.603 Arunachal Pradesh 261,614 64.4 1.5 1.9 8.9 5.0 2.9 2.2 0.6 5.6 8.1 4.004 Assam 6,367,295 66.4 0.6 3.6 1.6 2.2 0.7 1.5 1.1 21.2 2.9 0.505 Bihar 18,940,629 27.9 0.5 19.0 0.2 2.1 0.9 1.2 0.1 49.2 0.8 0.306 Chandigarh # 235,061 0.2 0.4 2.9 0.1 1.4 0.5 0.8 0.8 89.4 4.7 0.207 Chhattisgarh 5,622,850 1.3 0.2 66.0 0.5 3.5 2.1 1.4 0.0 27.8 0.7 0.108 Dadra & Nagar Haveli # 73,063 25.4 0.3 9.0 0.4 0.7 0.3 0.3 0.5 60.3 3.4 0.109 Daman & Diu # 60,381 0.8 0.3 1.2 0.2 17.6 0.8 16.7 0.3 76.0 3.6 0.010 Goa 322,813 1.2 0.3 12.0 0.7 74.3 11.1 63.2 0.7 1.8 8.7 0.411 Gujarat 12,181,718 5.2 0.3 18.2 0.7 10.4 2.7 7.8 0.3 61.3 3.6 0.112 Haryana 4,717,954 0.6 0.2 4.3 0.1 5.6 1.6 4.1 0.1 87.1 1.9 0.113 Himachal Pradesh 1,476,581 0.4 0.2 18.0 1.2 34.7 8.8 25.9 0.3 44.1 1.0 0.114 Jammu & Kashmir 2,015,088 0.5 0.3 13.2 2.9 23.9 15.7 8.3 0.3 55.9 2.2 0.815 Jharkhand 6,181,607 1.9 0.2 58.5 0.2 2.1 1.0 1.2 0.1 36.2 0.8 0.116 Karnataka 13,179,911 4.0 0.2 21.7 0.6 32.1 12.6 19.5 0.4 33.9 6.9 0.317 Kerala 7,716,370 1.7 0.5 11.5 0.9 56.9 9.4 47.4 0.2 24.5 2.9 1.018 Lakshadweep # 10,703 1.7 0.1 0.2 0.2 45.5 7.3 38.3 0.2 51.4 0.7 0.119 Madhya Pradesh 14,967,597 3.6 0.3 49.4 0.7 7.8 2.9 4.9 0.1 36.9 0.9 0.320 Maharashtra 23,830,580 5.3 0.4 21.7 0.9 13.4 3.4 10.0 1.9 45.9 10.2 0.321 Manipur 507,152 20.2 0.7 54.1 10.4 1.3 0.8 0.6 0.3 11.8 1.0 0.222 Meghalaya 538,299 40.1 1.4 6.9 19.8 5.6 1.8 3.9 2.6 9.4 13.0 1.223 Mizoram 221,077 29.0 0.8 0.2 2.7 0.5 0.2 0.3 48.2 7.2 10.2 1.224 Nagaland 399,965 49.5 1.2 3.2 22.7 1.0 0.5 0.5 2.3 13.8 5.6 0.625 NCT of Delhi # 3,340,538 0.3 0.3 2.2 0.2 4.8 1.1 3.7 0.2 86.3 5.5 0.226 Odisha 9,661,085 6.0 0.3 47.0 1.2 7.1 1.6 5.5 0.1 36.7 1.6 0.127 Puducherry # 301,276 6.1 0.1 7.5 0.1 11.7 1.6 10.1 0.2 72.0 2.0 0.128 Punjab 5,409,699 0.7 0.2 4.7 0.1 1.9 0.9 1.0 0.1 87.1 5.2 0.229 Rajasthan 12,581,303 2.7 0.2 22.1 0.5 45.3 6.9 38.4 0.1 28.5 0.4 0.430 Sikkim 128,131 14.7 1.1 10.7 24.6 7.5 4.6 2.9 1.6 24.6 13.8 1.431 Tamil Nadu 18,493,003 4.2 0.1 20.8 0.2 20.1 3.1 17.0 0.2 45.3 8.6 0.532 Tripura 842,781 29.6 0.5 50.4 0.2 1.0 0.4 0.5 5.5 12.2 0.5 0.233 Uttar Pradesh 32,924,266 5.0 0.3 20.0 0.1 3.2 1.2 2.0 0.1 68.4 0.6 2.434 Uttarakhand 1,997,068 2.0 0.2 4.5 0.7 35.2 10.4 24.8 0.3 55.1 1.9 0.235 West Bengal 20,067,299 18.1 0.6 29.1 0.7 1.2 0.5 0.7 2.2 44.1 3.8 0.3
Databook for DCH; 5th December 2012 Page 258 of 266
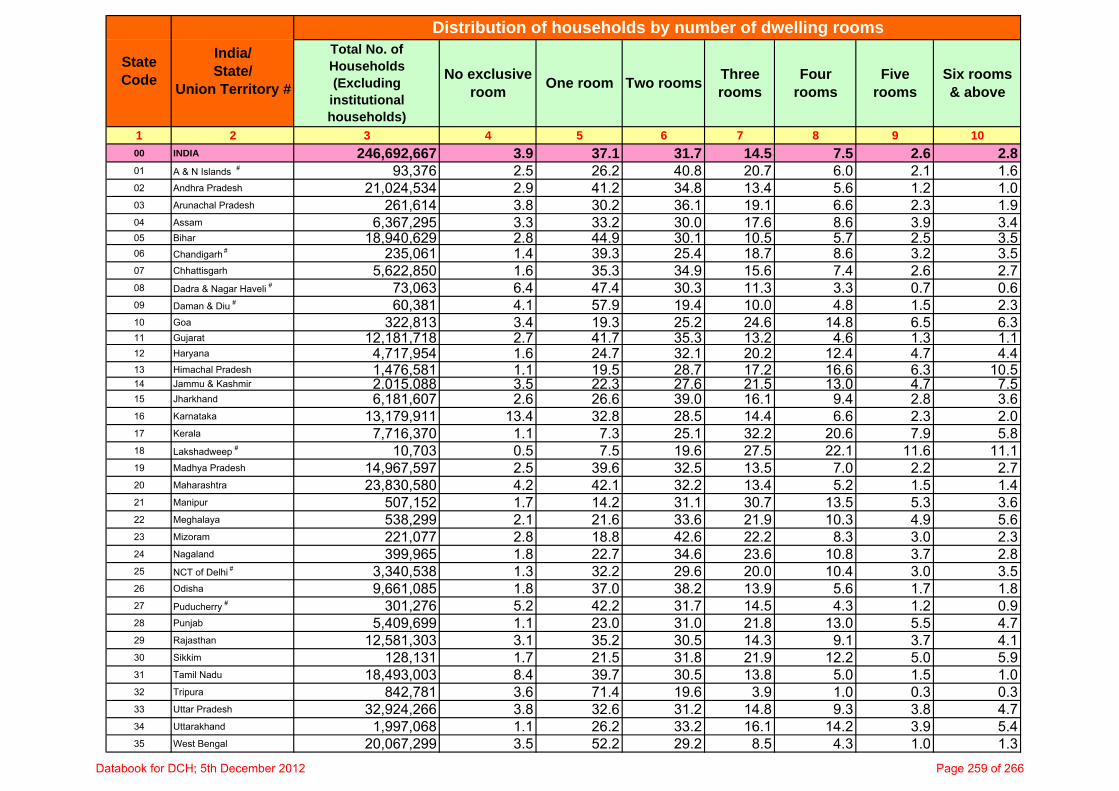
State
Code
India/
State/
Union Territory #
Distribution of households by number of dwelling rooms
Total No. of
Households
(Excluding
institutional
households)
No exclusive
roomOne room Two rooms
Three
rooms
Four
rooms
Five
rooms
Six rooms
& above
1 2 3 4 5 6 7 8 9 10
00 INDIA 246,692,667 3.9 37.1 31.7 14.5 7.5 2.6 2.801 A & N Islands # 93,376 2.5 26.2 40.8 20.7 6.0 2.1 1.602 Andhra Pradesh 21,024,534 2.9 41.2 34.8 13.4 5.6 1.2 1.003 Arunachal Pradesh 261,614 3.8 30.2 36.1 19.1 6.6 2.3 1.904 Assam 6,367,295 3.3 33.2 30.0 17.6 8.6 3.9 3.405 Bihar 18,940,629 2.8 44.9 30.1 10.5 5.7 2.5 3.506 Chandigarh # 235,061 1.4 39.3 25.4 18.7 8.6 3.2 3.507 Chhattisgarh 5,622,850 1.6 35.3 34.9 15.6 7.4 2.6 2.708 Dadra & Nagar Haveli # 73,063 6.4 47.4 30.3 11.3 3.3 0.7 0.609 Daman & Diu # 60,381 4.1 57.9 19.4 10.0 4.8 1.5 2.310 Goa 322,813 3.4 19.3 25.2 24.6 14.8 6.5 6.311 Gujarat 12,181,718 2.7 41.7 35.3 13.2 4.6 1.3 1.112 Haryana 4,717,954 1.6 24.7 32.1 20.2 12.4 4.7 4.413 Himachal Pradesh 1,476,581 1.1 19.5 28.7 17.2 16.6 6.3 10.514 Jammu & Kashmir 2,015,088 3.5 22.3 27.6 21.5 13.0 4.7 7.515 Jharkhand 6,181,607 2.6 26.6 39.0 16.1 9.4 2.8 3.616 Karnataka 13,179,911 13.4 32.8 28.5 14.4 6.6 2.3 2.017 Kerala 7,716,370 1.1 7.3 25.1 32.2 20.6 7.9 5.818 Lakshadweep # 10,703 0.5 7.5 19.6 27.5 22.1 11.6 11.119 Madhya Pradesh 14,967,597 2.5 39.6 32.5 13.5 7.0 2.2 2.720 Maharashtra 23,830,580 4.2 42.1 32.2 13.4 5.2 1.5 1.421 Manipur 507,152 1.7 14.2 31.1 30.7 13.5 5.3 3.622 Meghalaya 538,299 2.1 21.6 33.6 21.9 10.3 4.9 5.623 Mizoram 221,077 2.8 18.8 42.6 22.2 8.3 3.0 2.324 Nagaland 399,965 1.8 22.7 34.6 23.6 10.8 3.7 2.825 NCT of Delhi # 3,340,538 1.3 32.2 29.6 20.0 10.4 3.0 3.526 Odisha 9,661,085 1.8 37.0 38.2 13.9 5.6 1.7 1.827 Puducherry # 301,276 5.2 42.2 31.7 14.5 4.3 1.2 0.928 Punjab 5,409,699 1.1 23.0 31.0 21.8 13.0 5.5 4.729 Rajasthan 12,581,303 3.1 35.2 30.5 14.3 9.1 3.7 4.130 Sikkim 128,131 1.7 21.5 31.8 21.9 12.2 5.0 5.931 Tamil Nadu 18,493,003 8.4 39.7 30.5 13.8 5.0 1.5 1.032 Tripura 842,781 3.6 71.4 19.6 3.9 1.0 0.3 0.333 Uttar Pradesh 32,924,266 3.8 32.6 31.2 14.8 9.3 3.8 4.734 Uttarakhand 1,997,068 1.1 26.2 33.2 16.1 14.2 3.9 5.435 West Bengal 20,067,299 3.5 52.2 29.2 8.5 4.3 1.0 1.3
Databook for DCH; 5th December 2012 Page 259 of 266
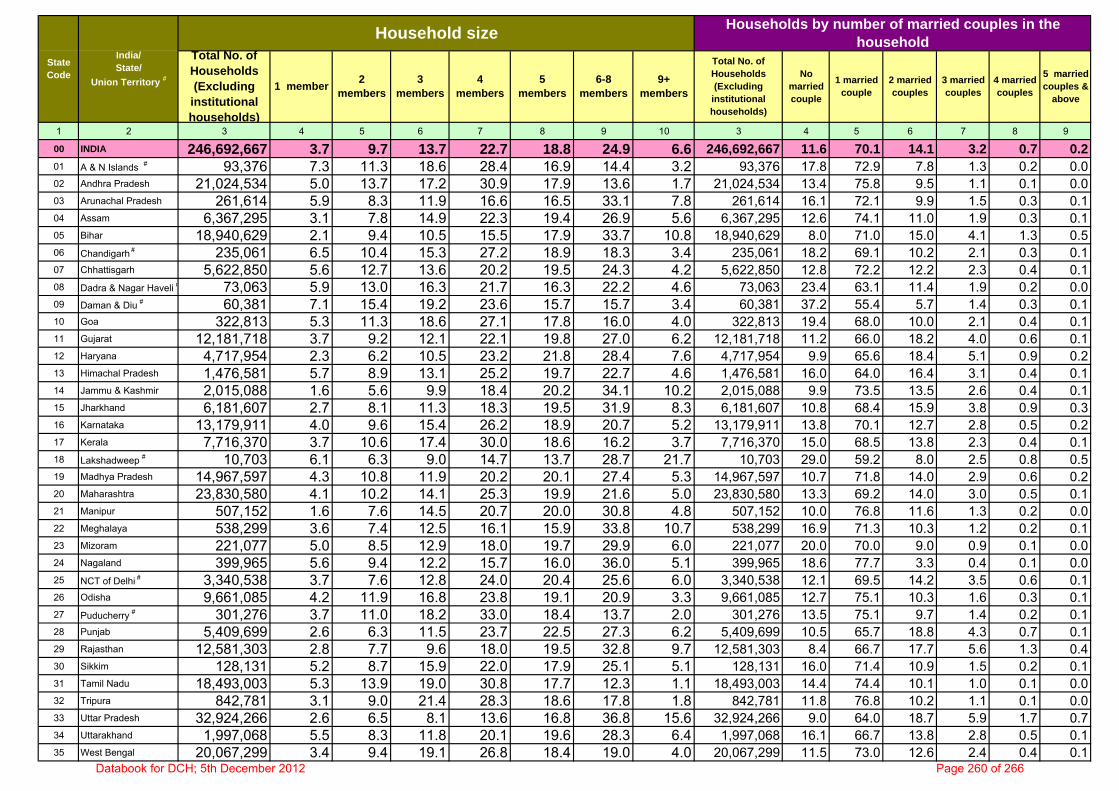
#
State
Code
India/
State/
Union Territory #
Household sizeHouseholds by number of married couples in the
householdTotal No. of
Households
(Excluding
institutional
households)
1 member2
members
3
members
4
members
5
members
6-8
members
9+
members
Total No. of
Households
(Excluding
institutional
households)
No
married
couple
1 married
couple
2 married
couples
3 married
couples
4 married
couples
5 married
couples &
above
1 2 3 4 5 6 7 8 9 10 3 4 5 6 7 8 9
00 INDIA 246,692,667 3.7 9.7 13.7 22.7 18.8 24.9 6.6 246,692,667 11.6 70.1 14.1 3.2 0.7 0.2
01 A & N Islands # 93,376 7.3 11.3 18.6 28.4 16.9 14.4 3.2 93,376 17.8 72.9 7.8 1.3 0.2 0.002 Andhra Pradesh 21,024,534 5.0 13.7 17.2 30.9 17.9 13.6 1.7 21,024,534 13.4 75.8 9.5 1.1 0.1 0.003 Arunachal Pradesh 261,614 5.9 8.3 11.9 16.6 16.5 33.1 7.8 261,614 16.1 72.1 9.9 1.5 0.3 0.104 Assam 6,367,295 3.1 7.8 14.9 22.3 19.4 26.9 5.6 6,367,295 12.6 74.1 11.0 1.9 0.3 0.105 Bihar 18,940,629 2.1 9.4 10.5 15.5 17.9 33.7 10.8 18,940,629 8.0 71.0 15.0 4.1 1.3 0.506 Chandigarh # 235,061 6.5 10.4 15.3 27.2 18.9 18.3 3.4 235,061 18.2 69.1 10.2 2.1 0.3 0.107 Chhattisgarh 5,622,850 5.6 12.7 13.6 20.2 19.5 24.3 4.2 5,622,850 12.8 72.2 12.2 2.3 0.4 0.108 Dadra & Nagar Haveli 73,063 5.9 13.0 16.3 21.7 16.3 22.2 4.6 73,063 23.4 63.1 11.4 1.9 0.2 0.009 Daman & Diu # 60,381 7.1 15.4 19.2 23.6 15.7 15.7 3.4 60,381 37.2 55.4 5.7 1.4 0.3 0.110 Goa 322,813 5.3 11.3 18.6 27.1 17.8 16.0 4.0 322,813 19.4 68.0 10.0 2.1 0.4 0.111 Gujarat 12,181,718 3.7 9.2 12.1 22.1 19.8 27.0 6.2 12,181,718 11.2 66.0 18.2 4.0 0.6 0.112 Haryana 4,717,954 2.3 6.2 10.5 23.2 21.8 28.4 7.6 4,717,954 9.9 65.6 18.4 5.1 0.9 0.213 Himachal Pradesh 1,476,581 5.7 8.9 13.1 25.2 19.7 22.7 4.6 1,476,581 16.0 64.0 16.4 3.1 0.4 0.114 Jammu & Kashmir 2,015,088 1.6 5.6 9.9 18.4 20.2 34.1 10.2 2,015,088 9.9 73.5 13.5 2.6 0.4 0.115 Jharkhand 6,181,607 2.7 8.1 11.3 18.3 19.5 31.9 8.3 6,181,607 10.8 68.4 15.9 3.8 0.9 0.316 Karnataka 13,179,911 4.0 9.6 15.4 26.2 18.9 20.7 5.2 13,179,911 13.8 70.1 12.7 2.8 0.5 0.217 Kerala 7,716,370 3.7 10.6 17.4 30.0 18.6 16.2 3.7 7,716,370 15.0 68.5 13.8 2.3 0.4 0.118 Lakshadweep # 10,703 6.1 6.3 9.0 14.7 13.7 28.7 21.7 10,703 29.0 59.2 8.0 2.5 0.8 0.519 Madhya Pradesh 14,967,597 4.3 10.8 11.9 20.2 20.1 27.4 5.3 14,967,597 10.7 71.8 14.0 2.9 0.6 0.220 Maharashtra 23,830,580 4.1 10.2 14.1 25.3 19.9 21.6 5.0 23,830,580 13.3 69.2 14.0 3.0 0.5 0.121 Manipur 507,152 1.6 7.6 14.5 20.7 20.0 30.8 4.8 507,152 10.0 76.8 11.6 1.3 0.2 0.022 Meghalaya 538,299 3.6 7.4 12.5 16.1 15.9 33.8 10.7 538,299 16.9 71.3 10.3 1.2 0.2 0.123 Mizoram 221,077 5.0 8.5 12.9 18.0 19.7 29.9 6.0 221,077 20.0 70.0 9.0 0.9 0.1 0.024 Nagaland 399,965 5.6 9.4 12.2 15.7 16.0 36.0 5.1 399,965 18.6 77.7 3.3 0.4 0.1 0.025 NCT of Delhi # 3,340,538 3.7 7.6 12.8 24.0 20.4 25.6 6.0 3,340,538 12.1 69.5 14.2 3.5 0.6 0.126 Odisha 9,661,085 4.2 11.9 16.8 23.8 19.1 20.9 3.3 9,661,085 12.7 75.1 10.3 1.6 0.3 0.127 Puducherry # 301,276 3.7 11.0 18.2 33.0 18.4 13.7 2.0 301,276 13.5 75.1 9.7 1.4 0.2 0.128 Punjab 5,409,699 2.6 6.3 11.5 23.7 22.5 27.3 6.2 5,409,699 10.5 65.7 18.8 4.3 0.7 0.129 Rajasthan 12,581,303 2.8 7.7 9.6 18.0 19.5 32.8 9.7 12,581,303 8.4 66.7 17.7 5.6 1.3 0.430 Sikkim 128,131 5.2 8.7 15.9 22.0 17.9 25.1 5.1 128,131 16.0 71.4 10.9 1.5 0.2 0.131 Tamil Nadu 18,493,003 5.3 13.9 19.0 30.8 17.7 12.3 1.1 18,493,003 14.4 74.4 10.1 1.0 0.1 0.032 Tripura 842,781 3.1 9.0 21.4 28.3 18.6 17.8 1.8 842,781 11.8 76.8 10.2 1.1 0.1 0.033 Uttar Pradesh 32,924,266 2.6 6.5 8.1 13.6 16.8 36.8 15.6 32,924,266 9.0 64.0 18.7 5.9 1.7 0.734 Uttarakhand 1,997,068 5.5 8.3 11.8 20.1 19.6 28.3 6.4 1,997,068 16.1 66.7 13.8 2.8 0.5 0.135 West Bengal 20,067,299 3.4 9.4 19.1 26.8 18.4 19.0 4.0 20,067,299 11.5 73.0 12.6 2.4 0.4 0.1
Databook for DCH; 5th December 2012 Page 260 of 266
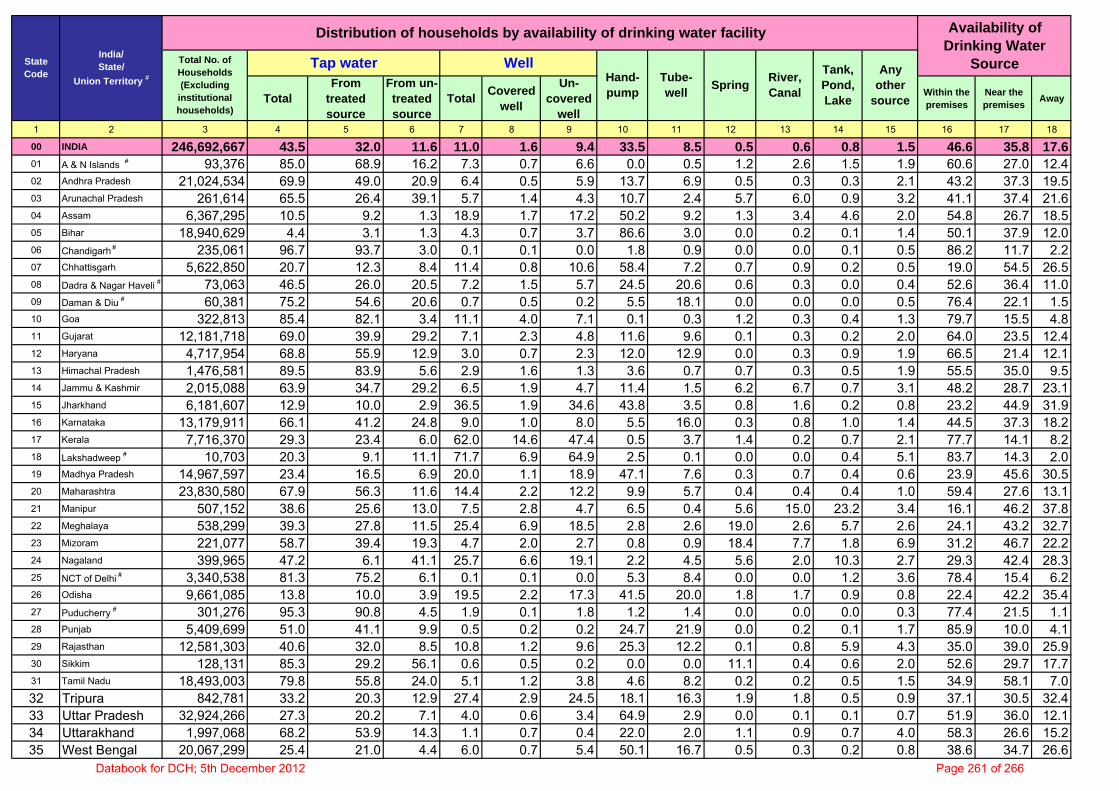
State
Code
India/
State/
Union Territory #
Distribution of households by availability of drinking water facility Availability of
Drinking Water
SourceTotal No. of
Households
(Excluding
institutional
households)
Tap water WellHand-
pump
Tube-
wellSpring
River,
Canal
Tank,
Pond,
Lake
Any
other
sourceTotal
From
treated
source
From un-
treated
source
TotalCovered
well
Un-
covered
well
Within the
premises
Near the
premisesAway
1 2 3 4 5 6 7 8 9 10 11 12 13 14 15 16 17 18
00 INDIA 246,692,667 43.5 32.0 11.6 11.0 1.6 9.4 33.5 8.5 0.5 0.6 0.8 1.5 46.6 35.8 17.6
01 A & N Islands # 93,376 85.0 68.9 16.2 7.3 0.7 6.6 0.0 0.5 1.2 2.6 1.5 1.9 60.6 27.0 12.402 Andhra Pradesh 21,024,534 69.9 49.0 20.9 6.4 0.5 5.9 13.7 6.9 0.5 0.3 0.3 2.1 43.2 37.3 19.503 Arunachal Pradesh 261,614 65.5 26.4 39.1 5.7 1.4 4.3 10.7 2.4 5.7 6.0 0.9 3.2 41.1 37.4 21.604 Assam 6,367,295 10.5 9.2 1.3 18.9 1.7 17.2 50.2 9.2 1.3 3.4 4.6 2.0 54.8 26.7 18.505 Bihar 18,940,629 4.4 3.1 1.3 4.3 0.7 3.7 86.6 3.0 0.0 0.2 0.1 1.4 50.1 37.9 12.006 Chandigarh # 235,061 96.7 93.7 3.0 0.1 0.1 0.0 1.8 0.9 0.0 0.0 0.1 0.5 86.2 11.7 2.207 Chhattisgarh 5,622,850 20.7 12.3 8.4 11.4 0.8 10.6 58.4 7.2 0.7 0.9 0.2 0.5 19.0 54.5 26.508 Dadra & Nagar Haveli # 73,063 46.5 26.0 20.5 7.2 1.5 5.7 24.5 20.6 0.6 0.3 0.0 0.4 52.6 36.4 11.009 Daman & Diu # 60,381 75.2 54.6 20.6 0.7 0.5 0.2 5.5 18.1 0.0 0.0 0.0 0.5 76.4 22.1 1.510 Goa 322,813 85.4 82.1 3.4 11.1 4.0 7.1 0.1 0.3 1.2 0.3 0.4 1.3 79.7 15.5 4.811 Gujarat 12,181,718 69.0 39.9 29.2 7.1 2.3 4.8 11.6 9.6 0.1 0.3 0.2 2.0 64.0 23.5 12.412 Haryana 4,717,954 68.8 55.9 12.9 3.0 0.7 2.3 12.0 12.9 0.0 0.3 0.9 1.9 66.5 21.4 12.113 Himachal Pradesh 1,476,581 89.5 83.9 5.6 2.9 1.6 1.3 3.6 0.7 0.7 0.3 0.5 1.9 55.5 35.0 9.514 Jammu & Kashmir 2,015,088 63.9 34.7 29.2 6.5 1.9 4.7 11.4 1.5 6.2 6.7 0.7 3.1 48.2 28.7 23.115 Jharkhand 6,181,607 12.9 10.0 2.9 36.5 1.9 34.6 43.8 3.5 0.8 1.6 0.2 0.8 23.2 44.9 31.916 Karnataka 13,179,911 66.1 41.2 24.8 9.0 1.0 8.0 5.5 16.0 0.3 0.8 1.0 1.4 44.5 37.3 18.217 Kerala 7,716,370 29.3 23.4 6.0 62.0 14.6 47.4 0.5 3.7 1.4 0.2 0.7 2.1 77.7 14.1 8.218 Lakshadweep # 10,703 20.3 9.1 11.1 71.7 6.9 64.9 2.5 0.1 0.0 0.0 0.4 5.1 83.7 14.3 2.019 Madhya Pradesh 14,967,597 23.4 16.5 6.9 20.0 1.1 18.9 47.1 7.6 0.3 0.7 0.4 0.6 23.9 45.6 30.520 Maharashtra 23,830,580 67.9 56.3 11.6 14.4 2.2 12.2 9.9 5.7 0.4 0.4 0.4 1.0 59.4 27.6 13.121 Manipur 507,152 38.6 25.6 13.0 7.5 2.8 4.7 6.5 0.4 5.6 15.0 23.2 3.4 16.1 46.2 37.822 Meghalaya 538,299 39.3 27.8 11.5 25.4 6.9 18.5 2.8 2.6 19.0 2.6 5.7 2.6 24.1 43.2 32.723 Mizoram 221,077 58.7 39.4 19.3 4.7 2.0 2.7 0.8 0.9 18.4 7.7 1.8 6.9 31.2 46.7 22.224 Nagaland 399,965 47.2 6.1 41.1 25.7 6.6 19.1 2.2 4.5 5.6 2.0 10.3 2.7 29.3 42.4 28.325 NCT of Delhi # 3,340,538 81.3 75.2 6.1 0.1 0.1 0.0 5.3 8.4 0.0 0.0 1.2 3.6 78.4 15.4 6.226 Odisha 9,661,085 13.8 10.0 3.9 19.5 2.2 17.3 41.5 20.0 1.8 1.7 0.9 0.8 22.4 42.2 35.427 Puducherry # 301,276 95.3 90.8 4.5 1.9 0.1 1.8 1.2 1.4 0.0 0.0 0.0 0.3 77.4 21.5 1.128 Punjab 5,409,699 51.0 41.1 9.9 0.5 0.2 0.2 24.7 21.9 0.0 0.2 0.1 1.7 85.9 10.0 4.129 Rajasthan 12,581,303 40.6 32.0 8.5 10.8 1.2 9.6 25.3 12.2 0.1 0.8 5.9 4.3 35.0 39.0 25.930 Sikkim 128,131 85.3 29.2 56.1 0.6 0.5 0.2 0.0 0.0 11.1 0.4 0.6 2.0 52.6 29.7 17.731 Tamil Nadu 18,493,003 79.8 55.8 24.0 5.1 1.2 3.8 4.6 8.2 0.2 0.2 0.5 1.5 34.9 58.1 7.032 Tripura 842,781 33.2 20.3 12.9 27.4 2.9 24.5 18.1 16.3 1.9 1.8 0.5 0.9 37.1 30.5 32.433 Uttar Pradesh 32,924,266 27.3 20.2 7.1 4.0 0.6 3.4 64.9 2.9 0.0 0.1 0.1 0.7 51.9 36.0 12.134 Uttarakhand 1,997,068 68.2 53.9 14.3 1.1 0.7 0.4 22.0 2.0 1.1 0.9 0.7 4.0 58.3 26.6 15.235 West Bengal 20,067,299 25.4 21.0 4.4 6.0 0.7 5.4 50.1 16.7 0.5 0.3 0.2 0.8 38.6 34.7 26.6
Databook for DCH; 5th December 2012 Page 261 of 266
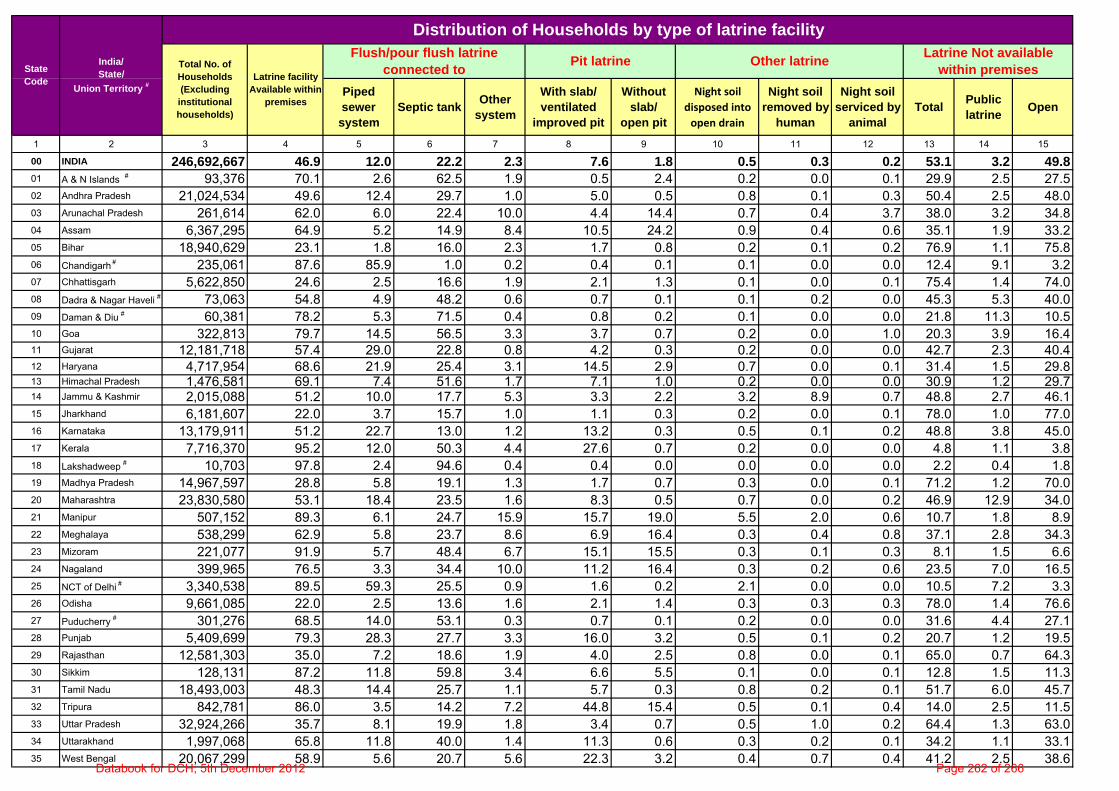
State
Code
India/
State/
Union Territory #
Distribution of Households by type of latrine facility
Total No. of
Households
(Excluding
institutional
households)
Latrine facility
Available within
premises
Flush/pour flush latrine
connected toPit latrine Other latrine
Latrine Not available
within premises
Piped
sewer
system
Septic tankOther
system
With slab/
ventilated
improved pit
Without
slab/
open pit
Night soil disposed into
open drain
Night soil
removed by
human
Night soil
serviced by
animal
TotalPublic
latrineOpen
1 2 3 4 5 6 7 8 9 10 11 12 13 14 15
00 INDIA 246,692,667 46.9 12.0 22.2 2.3 7.6 1.8 0.5 0.3 0.2 53.1 3.2 49.8
01 A & N Islands # 93,376 70.1 2.6 62.5 1.9 0.5 2.4 0.2 0.0 0.1 29.9 2.5 27.502 Andhra Pradesh 21,024,534 49.6 12.4 29.7 1.0 5.0 0.5 0.8 0.1 0.3 50.4 2.5 48.003 Arunachal Pradesh 261,614 62.0 6.0 22.4 10.0 4.4 14.4 0.7 0.4 3.7 38.0 3.2 34.804 Assam 6,367,295 64.9 5.2 14.9 8.4 10.5 24.2 0.9 0.4 0.6 35.1 1.9 33.205 Bihar 18,940,629 23.1 1.8 16.0 2.3 1.7 0.8 0.2 0.1 0.2 76.9 1.1 75.806 Chandigarh # 235,061 87.6 85.9 1.0 0.2 0.4 0.1 0.1 0.0 0.0 12.4 9.1 3.207 Chhattisgarh 5,622,850 24.6 2.5 16.6 1.9 2.1 1.3 0.1 0.0 0.1 75.4 1.4 74.008 Dadra & Nagar Haveli # 73,063 54.8 4.9 48.2 0.6 0.7 0.1 0.1 0.2 0.0 45.3 5.3 40.009 Daman & Diu # 60,381 78.2 5.3 71.5 0.4 0.8 0.2 0.1 0.0 0.0 21.8 11.3 10.510 Goa 322,813 79.7 14.5 56.5 3.3 3.7 0.7 0.2 0.0 1.0 20.3 3.9 16.411 Gujarat 12,181,718 57.4 29.0 22.8 0.8 4.2 0.3 0.2 0.0 0.0 42.7 2.3 40.412 Haryana 4,717,954 68.6 21.9 25.4 3.1 14.5 2.9 0.7 0.0 0.1 31.4 1.5 29.813 Himachal Pradesh 1,476,581 69.1 7.4 51.6 1.7 7.1 1.0 0.2 0.0 0.0 30.9 1.2 29.714 Jammu & Kashmir 2,015,088 51.2 10.0 17.7 5.3 3.3 2.2 3.2 8.9 0.7 48.8 2.7 46.115 Jharkhand 6,181,607 22.0 3.7 15.7 1.0 1.1 0.3 0.2 0.0 0.1 78.0 1.0 77.016 Karnataka 13,179,911 51.2 22.7 13.0 1.2 13.2 0.3 0.5 0.1 0.2 48.8 3.8 45.017 Kerala 7,716,370 95.2 12.0 50.3 4.4 27.6 0.7 0.2 0.0 0.0 4.8 1.1 3.818 Lakshadweep # 10,703 97.8 2.4 94.6 0.4 0.4 0.0 0.0 0.0 0.0 2.2 0.4 1.819 Madhya Pradesh 14,967,597 28.8 5.8 19.1 1.3 1.7 0.7 0.3 0.0 0.1 71.2 1.2 70.020 Maharashtra 23,830,580 53.1 18.4 23.5 1.6 8.3 0.5 0.7 0.0 0.2 46.9 12.9 34.021 Manipur 507,152 89.3 6.1 24.7 15.9 15.7 19.0 5.5 2.0 0.6 10.7 1.8 8.922 Meghalaya 538,299 62.9 5.8 23.7 8.6 6.9 16.4 0.3 0.4 0.8 37.1 2.8 34.323 Mizoram 221,077 91.9 5.7 48.4 6.7 15.1 15.5 0.3 0.1 0.3 8.1 1.5 6.624 Nagaland 399,965 76.5 3.3 34.4 10.0 11.2 16.4 0.3 0.2 0.6 23.5 7.0 16.525 NCT of Delhi # 3,340,538 89.5 59.3 25.5 0.9 1.6 0.2 2.1 0.0 0.0 10.5 7.2 3.326 Odisha 9,661,085 22.0 2.5 13.6 1.6 2.1 1.4 0.3 0.3 0.3 78.0 1.4 76.627 Puducherry # 301,276 68.5 14.0 53.1 0.3 0.7 0.1 0.2 0.0 0.0 31.6 4.4 27.128 Punjab 5,409,699 79.3 28.3 27.7 3.3 16.0 3.2 0.5 0.1 0.2 20.7 1.2 19.529 Rajasthan 12,581,303 35.0 7.2 18.6 1.9 4.0 2.5 0.8 0.0 0.1 65.0 0.7 64.330 Sikkim 128,131 87.2 11.8 59.8 3.4 6.6 5.5 0.1 0.0 0.1 12.8 1.5 11.331 Tamil Nadu 18,493,003 48.3 14.4 25.7 1.1 5.7 0.3 0.8 0.2 0.1 51.7 6.0 45.732 Tripura 842,781 86.0 3.5 14.2 7.2 44.8 15.4 0.5 0.1 0.4 14.0 2.5 11.533 Uttar Pradesh 32,924,266 35.7 8.1 19.9 1.8 3.4 0.7 0.5 1.0 0.2 64.4 1.3 63.034 Uttarakhand 1,997,068 65.8 11.8 40.0 1.4 11.3 0.6 0.3 0.2 0.1 34.2 1.1 33.135 West Bengal 20,067,299 58.9 5.6 20.7 5.6 22.3 3.2 0.4 0.7 0.4 41.2 2.5 38.6
Databook for DCH; 5th December 2012 Page 262 of 266
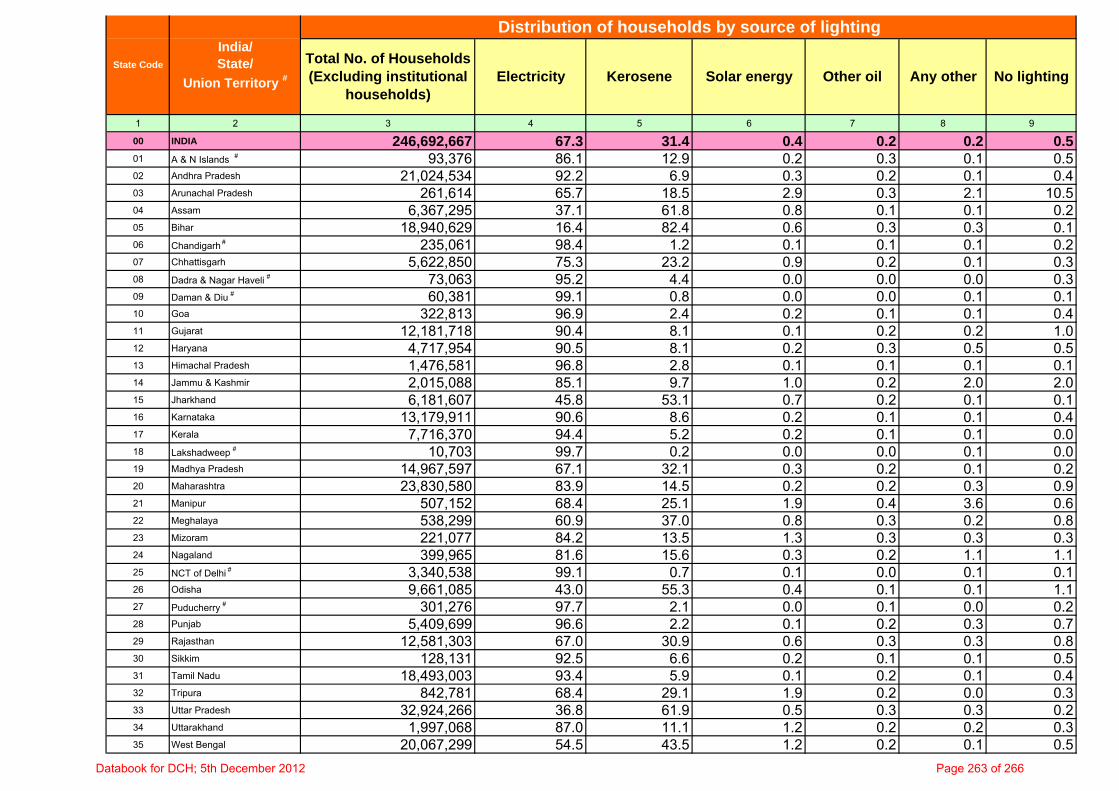
State Code
India/
State/
Union Territory #
Distribution of households by source of lighting
Total No. of Households
(Excluding institutional
households)
Electricity Kerosene Solar energy Other oil Any other No lighting
1 2 3 4 5 6 7 8 9
00 INDIA 246,692,667 67.3 31.4 0.4 0.2 0.2 0.501 A & N Islands # 93,376 86.1 12.9 0.2 0.3 0.1 0.502 Andhra Pradesh 21,024,534 92.2 6.9 0.3 0.2 0.1 0.403 Arunachal Pradesh 261,614 65.7 18.5 2.9 0.3 2.1 10.504 Assam 6,367,295 37.1 61.8 0.8 0.1 0.1 0.205 Bihar 18,940,629 16.4 82.4 0.6 0.3 0.3 0.106 Chandigarh # 235,061 98.4 1.2 0.1 0.1 0.1 0.207 Chhattisgarh 5,622,850 75.3 23.2 0.9 0.2 0.1 0.308 Dadra & Nagar Haveli # 73,063 95.2 4.4 0.0 0.0 0.0 0.309 Daman & Diu # 60,381 99.1 0.8 0.0 0.0 0.1 0.110 Goa 322,813 96.9 2.4 0.2 0.1 0.1 0.411 Gujarat 12,181,718 90.4 8.1 0.1 0.2 0.2 1.012 Haryana 4,717,954 90.5 8.1 0.2 0.3 0.5 0.513 Himachal Pradesh 1,476,581 96.8 2.8 0.1 0.1 0.1 0.114 Jammu & Kashmir 2,015,088 85.1 9.7 1.0 0.2 2.0 2.015 Jharkhand 6,181,607 45.8 53.1 0.7 0.2 0.1 0.116 Karnataka 13,179,911 90.6 8.6 0.2 0.1 0.1 0.417 Kerala 7,716,370 94.4 5.2 0.2 0.1 0.1 0.018 Lakshadweep # 10,703 99.7 0.2 0.0 0.0 0.1 0.019 Madhya Pradesh 14,967,597 67.1 32.1 0.3 0.2 0.1 0.220 Maharashtra 23,830,580 83.9 14.5 0.2 0.2 0.3 0.921 Manipur 507,152 68.4 25.1 1.9 0.4 3.6 0.622 Meghalaya 538,299 60.9 37.0 0.8 0.3 0.2 0.823 Mizoram 221,077 84.2 13.5 1.3 0.3 0.3 0.324 Nagaland 399,965 81.6 15.6 0.3 0.2 1.1 1.125 NCT of Delhi # 3,340,538 99.1 0.7 0.1 0.0 0.1 0.126 Odisha 9,661,085 43.0 55.3 0.4 0.1 0.1 1.127 Puducherry # 301,276 97.7 2.1 0.0 0.1 0.0 0.228 Punjab 5,409,699 96.6 2.2 0.1 0.2 0.3 0.729 Rajasthan 12,581,303 67.0 30.9 0.6 0.3 0.3 0.830 Sikkim 128,131 92.5 6.6 0.2 0.1 0.1 0.531 Tamil Nadu 18,493,003 93.4 5.9 0.1 0.2 0.1 0.432 Tripura 842,781 68.4 29.1 1.9 0.2 0.0 0.333 Uttar Pradesh 32,924,266 36.8 61.9 0.5 0.3 0.3 0.234 Uttarakhand 1,997,068 87.0 11.1 1.2 0.2 0.2 0.335 West Bengal 20,067,299 54.5 43.5 1.2 0.2 0.1 0.5
Databook for DCH; 5th December 2012 Page 263 of 266
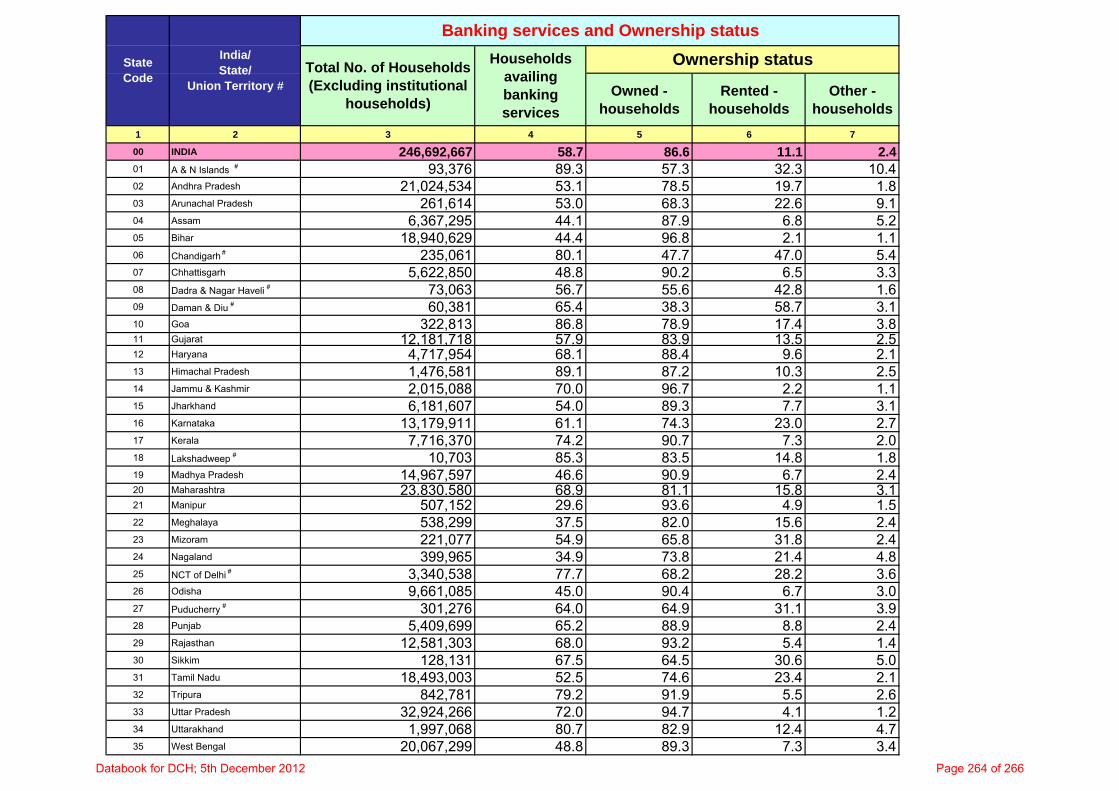
State
Code
India/
State/
Union Territory #
Banking services and Ownership status
Total No. of Households
(Excluding institutional
households)
Households
availing
banking
services
Ownership status
Owned -
households
Rented -
households
Other -
households
1 2 3 4 5 6 7
00 INDIA 246,692,667 58.7 86.6 11.1 2.4
01 A & N Islands # 93,376 89.3 57.3 32.3 10.402 Andhra Pradesh 21,024,534 53.1 78.5 19.7 1.803 Arunachal Pradesh 261,614 53.0 68.3 22.6 9.104 Assam 6,367,295 44.1 87.9 6.8 5.205 Bihar 18,940,629 44.4 96.8 2.1 1.106 Chandigarh # 235,061 80.1 47.7 47.0 5.407 Chhattisgarh 5,622,850 48.8 90.2 6.5 3.308 Dadra & Nagar Haveli # 73,063 56.7 55.6 42.8 1.609 Daman & Diu # 60,381 65.4 38.3 58.7 3.110 Goa 322,813 86.8 78.9 17.4 3.811 Gujarat 12,181,718 57.9 83.9 13.5 2.512 Haryana 4,717,954 68.1 88.4 9.6 2.113 Himachal Pradesh 1,476,581 89.1 87.2 10.3 2.514 Jammu & Kashmir 2,015,088 70.0 96.7 2.2 1.115 Jharkhand 6,181,607 54.0 89.3 7.7 3.116 Karnataka 13,179,911 61.1 74.3 23.0 2.717 Kerala 7,716,370 74.2 90.7 7.3 2.018 Lakshadweep # 10,703 85.3 83.5 14.8 1.819 Madhya Pradesh 14,967,597 46.6 90.9 6.7 2.420 Maharashtra 23,830,580 68.9 81.1 15.8 3.121 Manipur 507,152 29.6 93.6 4.9 1.522 Meghalaya 538,299 37.5 82.0 15.6 2.423 Mizoram 221,077 54.9 65.8 31.8 2.424 Nagaland 399,965 34.9 73.8 21.4 4.825 NCT of Delhi # 3,340,538 77.7 68.2 28.2 3.626 Odisha 9,661,085 45.0 90.4 6.7 3.027 Puducherry # 301,276 64.0 64.9 31.1 3.928 Punjab 5,409,699 65.2 88.9 8.8 2.429 Rajasthan 12,581,303 68.0 93.2 5.4 1.430 Sikkim 128,131 67.5 64.5 30.6 5.031 Tamil Nadu 18,493,003 52.5 74.6 23.4 2.132 Tripura 842,781 79.2 91.9 5.5 2.633 Uttar Pradesh 32,924,266 72.0 94.7 4.1 1.234 Uttarakhand 1,997,068 80.7 82.9 12.4 4.735 West Bengal 20,067,299 48.8 89.3 7.3 3.4
Databook for DCH; 5th December 2012 Page 264 of 266
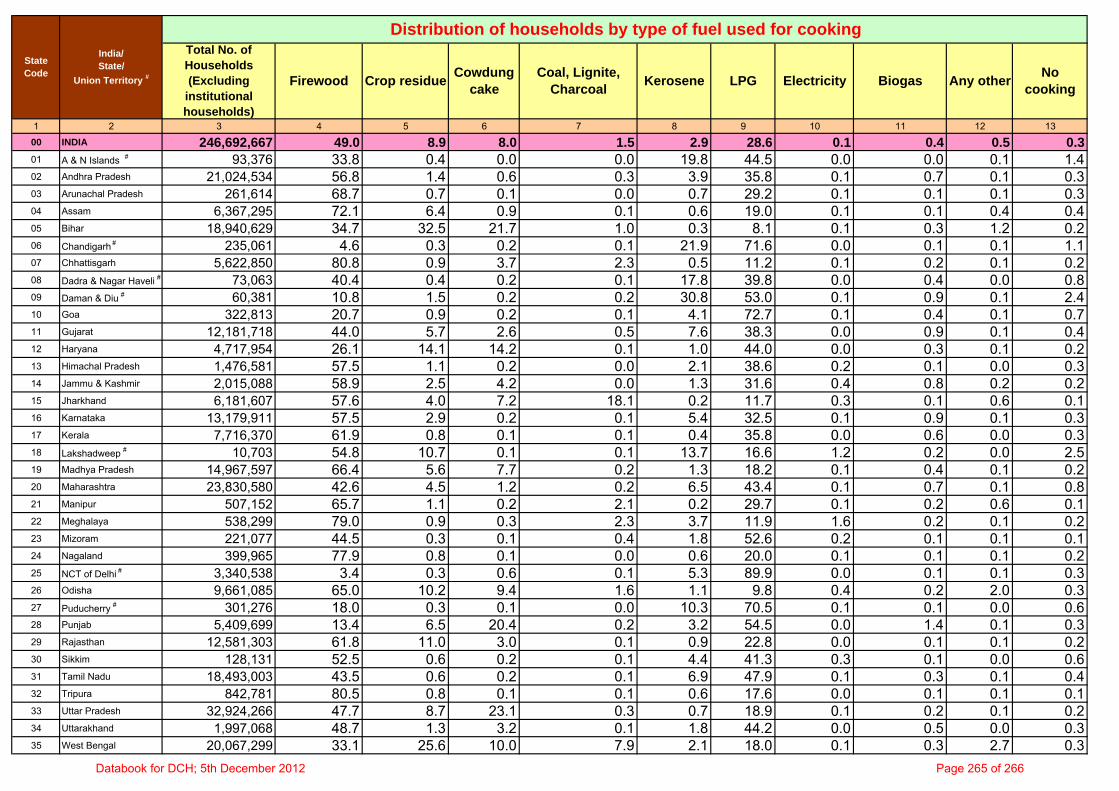
State
Code
India/
State/
Union Territory #
Distribution of households by type of fuel used for cookingTotal No. of
Households
(Excluding
institutional
households)
Firewood Crop residueCowdung
cake
Coal, Lignite,
CharcoalKerosene LPG Electricity Biogas Any other
No
cooking
1 2 3 4 5 6 7 8 9 10 11 12 13
00 INDIA 246,692,667 49.0 8.9 8.0 1.5 2.9 28.6 0.1 0.4 0.5 0.3
01 A & N Islands # 93,376 33.8 0.4 0.0 0.0 19.8 44.5 0.0 0.0 0.1 1.402 Andhra Pradesh 21,024,534 56.8 1.4 0.6 0.3 3.9 35.8 0.1 0.7 0.1 0.303 Arunachal Pradesh 261,614 68.7 0.7 0.1 0.0 0.7 29.2 0.1 0.1 0.1 0.304 Assam 6,367,295 72.1 6.4 0.9 0.1 0.6 19.0 0.1 0.1 0.4 0.405 Bihar 18,940,629 34.7 32.5 21.7 1.0 0.3 8.1 0.1 0.3 1.2 0.206 Chandigarh # 235,061 4.6 0.3 0.2 0.1 21.9 71.6 0.0 0.1 0.1 1.107 Chhattisgarh 5,622,850 80.8 0.9 3.7 2.3 0.5 11.2 0.1 0.2 0.1 0.208 Dadra & Nagar Haveli # 73,063 40.4 0.4 0.2 0.1 17.8 39.8 0.0 0.4 0.0 0.809 Daman & Diu # 60,381 10.8 1.5 0.2 0.2 30.8 53.0 0.1 0.9 0.1 2.410 Goa 322,813 20.7 0.9 0.2 0.1 4.1 72.7 0.1 0.4 0.1 0.711 Gujarat 12,181,718 44.0 5.7 2.6 0.5 7.6 38.3 0.0 0.9 0.1 0.412 Haryana 4,717,954 26.1 14.1 14.2 0.1 1.0 44.0 0.0 0.3 0.1 0.213 Himachal Pradesh 1,476,581 57.5 1.1 0.2 0.0 2.1 38.6 0.2 0.1 0.0 0.314 Jammu & Kashmir 2,015,088 58.9 2.5 4.2 0.0 1.3 31.6 0.4 0.8 0.2 0.215 Jharkhand 6,181,607 57.6 4.0 7.2 18.1 0.2 11.7 0.3 0.1 0.6 0.116 Karnataka 13,179,911 57.5 2.9 0.2 0.1 5.4 32.5 0.1 0.9 0.1 0.317 Kerala 7,716,370 61.9 0.8 0.1 0.1 0.4 35.8 0.0 0.6 0.0 0.318 Lakshadweep # 10,703 54.8 10.7 0.1 0.1 13.7 16.6 1.2 0.2 0.0 2.519 Madhya Pradesh 14,967,597 66.4 5.6 7.7 0.2 1.3 18.2 0.1 0.4 0.1 0.220 Maharashtra 23,830,580 42.6 4.5 1.2 0.2 6.5 43.4 0.1 0.7 0.1 0.821 Manipur 507,152 65.7 1.1 0.2 2.1 0.2 29.7 0.1 0.2 0.6 0.122 Meghalaya 538,299 79.0 0.9 0.3 2.3 3.7 11.9 1.6 0.2 0.1 0.223 Mizoram 221,077 44.5 0.3 0.1 0.4 1.8 52.6 0.2 0.1 0.1 0.124 Nagaland 399,965 77.9 0.8 0.1 0.0 0.6 20.0 0.1 0.1 0.1 0.225 NCT of Delhi # 3,340,538 3.4 0.3 0.6 0.1 5.3 89.9 0.0 0.1 0.1 0.326 Odisha 9,661,085 65.0 10.2 9.4 1.6 1.1 9.8 0.4 0.2 2.0 0.327 Puducherry # 301,276 18.0 0.3 0.1 0.0 10.3 70.5 0.1 0.1 0.0 0.628 Punjab 5,409,699 13.4 6.5 20.4 0.2 3.2 54.5 0.0 1.4 0.1 0.329 Rajasthan 12,581,303 61.8 11.0 3.0 0.1 0.9 22.8 0.0 0.1 0.1 0.230 Sikkim 128,131 52.5 0.6 0.2 0.1 4.4 41.3 0.3 0.1 0.0 0.631 Tamil Nadu 18,493,003 43.5 0.6 0.2 0.1 6.9 47.9 0.1 0.3 0.1 0.432 Tripura 842,781 80.5 0.8 0.1 0.1 0.6 17.6 0.0 0.1 0.1 0.133 Uttar Pradesh 32,924,266 47.7 8.7 23.1 0.3 0.7 18.9 0.1 0.2 0.1 0.234 Uttarakhand 1,997,068 48.7 1.3 3.2 0.1 1.8 44.2 0.0 0.5 0.0 0.335 West Bengal 20,067,299 33.1 25.6 10.0 7.9 2.1 18.0 0.1 0.3 2.7 0.3
Databook for DCH; 5th December 2012 Page 265 of 266
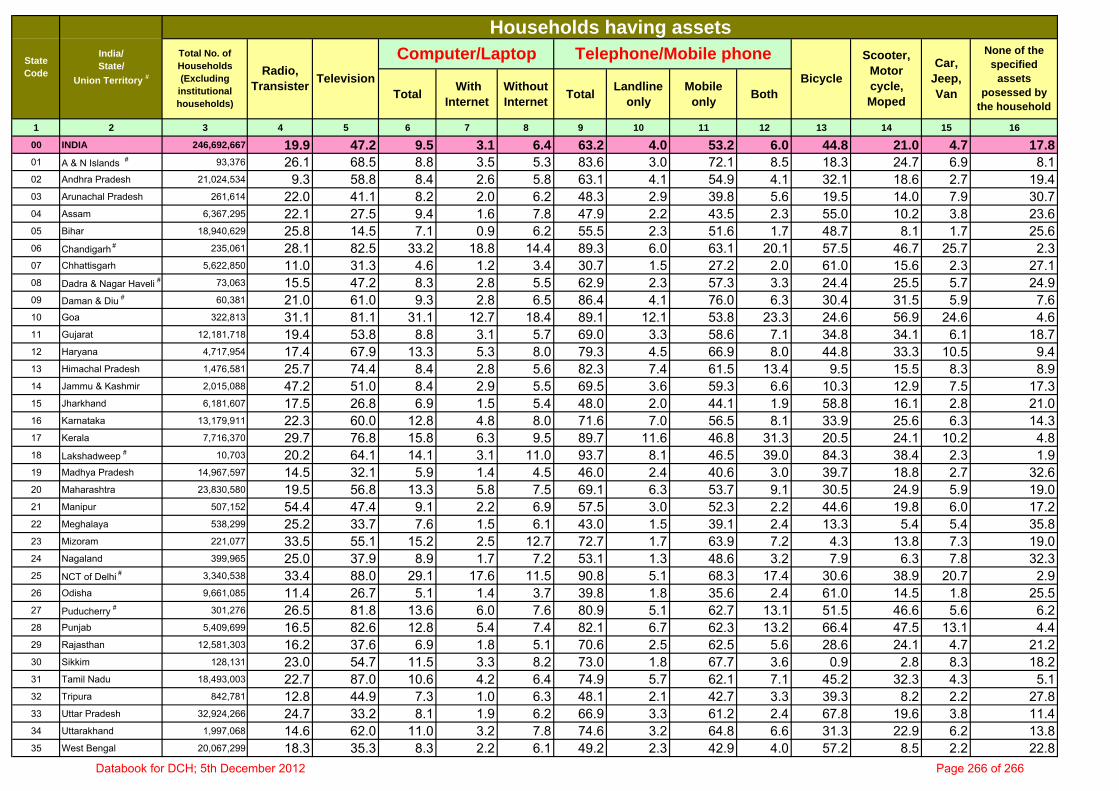
State
Code
India/
State/
Union Territory #
Households having assets
Total No. of
Households
(Excluding
institutional
households)
Radio,
TransisterTelevision
Computer/Laptop Telephone/Mobile phone
Bicycle
Scooter,
Motor
cycle,
Moped
Car,
Jeep,
Van
None of the
specified
assets
posessed by
the householdTotal
With
Internet
Without
InternetTotal
Landline
only
Mobile
onlyBoth
1 2 3 4 5 6 7 8 9 10 11 12 13 14 15 16
00 INDIA 246,692,667 19.9 47.2 9.5 3.1 6.4 63.2 4.0 53.2 6.0 44.8 21.0 4.7 17.8
01 A & N Islands # 93,376 26.1 68.5 8.8 3.5 5.3 83.6 3.0 72.1 8.5 18.3 24.7 6.9 8.102 Andhra Pradesh 21,024,534 9.3 58.8 8.4 2.6 5.8 63.1 4.1 54.9 4.1 32.1 18.6 2.7 19.403 Arunachal Pradesh 261,614 22.0 41.1 8.2 2.0 6.2 48.3 2.9 39.8 5.6 19.5 14.0 7.9 30.704 Assam 6,367,295 22.1 27.5 9.4 1.6 7.8 47.9 2.2 43.5 2.3 55.0 10.2 3.8 23.605 Bihar 18,940,629 25.8 14.5 7.1 0.9 6.2 55.5 2.3 51.6 1.7 48.7 8.1 1.7 25.606 Chandigarh # 235,061 28.1 82.5 33.2 18.8 14.4 89.3 6.0 63.1 20.1 57.5 46.7 25.7 2.307 Chhattisgarh 5,622,850 11.0 31.3 4.6 1.2 3.4 30.7 1.5 27.2 2.0 61.0 15.6 2.3 27.108 Dadra & Nagar Haveli # 73,063 15.5 47.2 8.3 2.8 5.5 62.9 2.3 57.3 3.3 24.4 25.5 5.7 24.909 Daman & Diu # 60,381 21.0 61.0 9.3 2.8 6.5 86.4 4.1 76.0 6.3 30.4 31.5 5.9 7.610 Goa 322,813 31.1 81.1 31.1 12.7 18.4 89.1 12.1 53.8 23.3 24.6 56.9 24.6 4.611 Gujarat 12,181,718 19.4 53.8 8.8 3.1 5.7 69.0 3.3 58.6 7.1 34.8 34.1 6.1 18.712 Haryana 4,717,954 17.4 67.9 13.3 5.3 8.0 79.3 4.5 66.9 8.0 44.8 33.3 10.5 9.413 Himachal Pradesh 1,476,581 25.7 74.4 8.4 2.8 5.6 82.3 7.4 61.5 13.4 9.5 15.5 8.3 8.914 Jammu & Kashmir 2,015,088 47.2 51.0 8.4 2.9 5.5 69.5 3.6 59.3 6.6 10.3 12.9 7.5 17.315 Jharkhand 6,181,607 17.5 26.8 6.9 1.5 5.4 48.0 2.0 44.1 1.9 58.8 16.1 2.8 21.016 Karnataka 13,179,911 22.3 60.0 12.8 4.8 8.0 71.6 7.0 56.5 8.1 33.9 25.6 6.3 14.317 Kerala 7,716,370 29.7 76.8 15.8 6.3 9.5 89.7 11.6 46.8 31.3 20.5 24.1 10.2 4.818 Lakshadweep # 10,703 20.2 64.1 14.1 3.1 11.0 93.7 8.1 46.5 39.0 84.3 38.4 2.3 1.919 Madhya Pradesh 14,967,597 14.5 32.1 5.9 1.4 4.5 46.0 2.4 40.6 3.0 39.7 18.8 2.7 32.620 Maharashtra 23,830,580 19.5 56.8 13.3 5.8 7.5 69.1 6.3 53.7 9.1 30.5 24.9 5.9 19.021 Manipur 507,152 54.4 47.4 9.1 2.2 6.9 57.5 3.0 52.3 2.2 44.6 19.8 6.0 17.222 Meghalaya 538,299 25.2 33.7 7.6 1.5 6.1 43.0 1.5 39.1 2.4 13.3 5.4 5.4 35.823 Mizoram 221,077 33.5 55.1 15.2 2.5 12.7 72.7 1.7 63.9 7.2 4.3 13.8 7.3 19.024 Nagaland 399,965 25.0 37.9 8.9 1.7 7.2 53.1 1.3 48.6 3.2 7.9 6.3 7.8 32.325 NCT of Delhi # 3,340,538 33.4 88.0 29.1 17.6 11.5 90.8 5.1 68.3 17.4 30.6 38.9 20.7 2.926 Odisha 9,661,085 11.4 26.7 5.1 1.4 3.7 39.8 1.8 35.6 2.4 61.0 14.5 1.8 25.527 Puducherry # 301,276 26.5 81.8 13.6 6.0 7.6 80.9 5.1 62.7 13.1 51.5 46.6 5.6 6.228 Punjab 5,409,699 16.5 82.6 12.8 5.4 7.4 82.1 6.7 62.3 13.2 66.4 47.5 13.1 4.429 Rajasthan 12,581,303 16.2 37.6 6.9 1.8 5.1 70.6 2.5 62.5 5.6 28.6 24.1 4.7 21.230 Sikkim 128,131 23.0 54.7 11.5 3.3 8.2 73.0 1.8 67.7 3.6 0.9 2.8 8.3 18.231 Tamil Nadu 18,493,003 22.7 87.0 10.6 4.2 6.4 74.9 5.7 62.1 7.1 45.2 32.3 4.3 5.132 Tripura 842,781 12.8 44.9 7.3 1.0 6.3 48.1 2.1 42.7 3.3 39.3 8.2 2.2 27.833 Uttar Pradesh 32,924,266 24.7 33.2 8.1 1.9 6.2 66.9 3.3 61.2 2.4 67.8 19.6 3.8 11.434 Uttarakhand 1,997,068 14.6 62.0 11.0 3.2 7.8 74.6 3.2 64.8 6.6 31.3 22.9 6.2 13.835 West Bengal 20,067,299 18.3 35.3 8.3 2.2 6.1 49.2 2.3 42.9 4.0 57.2 8.5 2.2 22.8
Databook for DCH; 5th December 2012 Page 266 of 266
Top Related