


Languages
Pages
Legal

1
Physiopad: Development of a non-invasive game controller toolkit to study physiological responses for Game User Re-
search
Diogo Cró Rodrigues
Thesis to obtain a master’s degree in Computer Engineering
Supervisor: Sergi Bermúdez i Badia, Universidade da Madeira
February of 2018

2
(This is blank)

3
Acknowledgements
I would like to start by thanking Sergi, my supervisor. Without his guidance
and support, I would never be completing this project.
I also thank, John Muñoz, who had always 5 minutes to discuss the project
and the directions that I should take. Also, thank you, Teresa, for all the sup-
port provided teaching me how to use ExerPong.
Also, I would like to thank all the present and former members of the Neu-
roRehabLab research group that I met during this project. I appreciated all
the suggestions, questions, feedback and support.
I would like to thank all my friends who supported me through this journey.
Lastly, and more importantly, I would like to show my gratitude to my family,
to whom I am eternally grateful for the opportunity they gave me to pursue
and continue my education until this day.
Thank you!

4
(This is blank)
5
Resumo
Jogos afectivos são jogos que usam as respostas fisiológicas do jogador para
criar um ambiente adequado ao estado emocional do jogador. A instigação
de jogos afectivos tem sido explorada nos últimos anos. Contudo, estas ex-
periência ainda requerem sistemas complexos e complicados de utilizar.
Nesta dissertação, é proposta a construção de um dispositivo capaz de ler
dados fisiológicos de forma não invasiva e que seja fácil de utilizar. Este dis-
positivo lê o ritmo cardíaco e os níveis de excitação do jogador e foi criado
software para interligar com o dispositivo. Utilizando uma replica de um co-
mando da PlayStation 3 e um BITalino foi criado um dispositivo que faz a
aquisição do sinal PPG e sinal EDA durante o jogo. O software analisa os si-
nais do comando e calcula o ritmo cardíaco e mede os níveis de excitação em
tempo real. Uma experiência utilizando feedback positivo e feedback nega-
tive foi feita com o objectivo de testar a integração entre software e hard-
ware. Ainda irá levar algum tempo até dispositivos deste género serem dis-
ponibilizados comercialmente, mas os resultados são promissores. O cálculo
do ritmo cardíaco em tempo real é capaz de calcular o ritmo cardamos com
apenas uma diferença de 5 batimentos por minuto em relação ao ritmo car-
díaco real do jogador. Apesar de os testes com o EDA serem inconclusivos,
pode-se verificar que foi possível construir um sistema para ler dados fisio-
lógicos mais económico que os seus pares, sem comprometer a fiabilidade
dos dados.
Palavras-chave:
Jogos afectivos, jogos adaptivos, comando biofeedback, toolkit, investigação
de jogos

6
(This is blank)

7
Abstract
Affective games are a genre of games that use the physiological responses
from the player to adapt the gameplay to a more enjoyable emotional state
and experience. Physiological responses and affective games have been
studied vastly over the years. However, the setups used in these interven-
tions are very intrusive and are complex to set up. In this project, it is pur-
posed to build a non-invasive and easy-to-set-up toolkit that records physio-
logical data. This toolkit records the player's heart rate and arousal levels and
was decomposed into software and hardware. Using a PS3 game controller
replica and a BITalino, a physiological game controller which can record Pho-
toplethysmogram (PPG) and Electrodermal activity (EDA) during gameplay
was built. The software interfaces with the gamepad, processes the physio-
logical signals, calculates the heart rate and arousal and send this infor-
mation to the game. An experiment with a positive biofeedback condition
and negative biofeedback condition was conducted. This experiment showed
that even though more work must be done until these types of device could
be commercially available, the results are promising. This toolkit, first proto-
type, heart rate values, when compared with other more traditional acquisi-
tion devices, were very similar, being on average only 5 BMP lower than the
actual heart rate, proving that is possible to build more affordable non-inva-
sive physiological hardware without compromising the signal's accuracy.
Keywords:
Affective games, adaptive games, biofeedback controller, toolkit, Game User
research.

8
(This is blank)

9
Table of contents Acknowledgements .......................................................................................................... 3
Resumo ............................................................................................................................. 5
Palavras-chave: ................................................................................................................. 5
Abstract ............................................................................................................................ 7
Keywords: ......................................................................................................................... 7
Table of contents .............................................................................................................. 9
List of figures .................................................................................................................. 11
Acronyms ........................................................................................................................ 13
1. Introduction............................................................................................................. 15
1.1. Motivation........................................................................................................ 15
1.2. Topic Overview ................................................................................................ 15
1.3. Objectives ........................................................................................................ 16
1.4. Thesis outline ................................................................................................... 17
2. State of the art ........................................................................................................ 19
2.1. Game User Research ........................................................................................ 19
2.2. Physiological signals ......................................................................................... 22
2.3. Physiology in game development .................................................................... 25
2.4. Developing affective games ............................................................................. 28
2.5. Recording physiological signals ....................................................................... 31
3. Development ........................................................................................................... 35
3.1. Hardware ......................................................................................................... 35
3.1.1. Hardware development process model ....................................... 35
3.1.2. Requirements .................................................................................. 36
3.1.3. Gamepad map for hand placement ............................................. 36
3.1.4. Testing ECG positions on the hand ............................................... 38
3.1.5. Testing PPG on the hand ............................................................... 41
3.1.6. Testing PPG position on the controller ......................................... 42
3.1.7. Placing EDA on the controller ........................................................ 45
3.2. Software ........................................................................................................... 47
3.2.1. Software development method .................................................... 47
3.2.2. Requirements .................................................................................. 47

10
3.2.3. Technologies and software used .................................................. 49
3.2.4. Software Architecture .................................................................... 51
3.2.5. Implementation .............................................................................. 53
4. Validation Experiment ............................................................................................. 61
4.1. Experiment Description ................................................................................... 61
4.1.1. Hardware ......................................................................................... 61
4.1.2. Software........................................................................................... 61
4.1.1. Setup ................................................................................................ 63
4.1.2. Protocol ........................................................................................... 64
4.1.3. Questionnaires................................................................................ 65
4.2. Experiment Results .......................................................................................... 66
4.2.1. Usability ........................................................................................... 66
4.2.1. Game Experience ............................................................................ 66
4.2.2. Electrodermal activity sensor ........................................................ 70
4.2.3. Photoplethysmogram sensor ........................................................ 71
5. Final considerations ................................................................................................ 75
5.1. Conclusion ........................................................................................................ 75
5.2. Limitations ....................................................................................................... 76
5.3. Future Work ..................................................................................................... 76
6. References ............................................................................................................... 79
7. Attachments ............................................................................................................ 85
7.1. Arousal algorithm ............................................................................................ 85
7.2. Heart rate algorithm ........................................................................................ 87
7.3. EDA correlation table ....................................................................................... 88
7.4. System usability scale Questionnaire .............................................................. 89
7.5. Game experience questionnaire ...................................................................... 90

11
List of figures
Figure 1 – Game development flow using GUR [1] .......................................... 19
Figure 2 – Methods used in game user research [2] ....................................... 20
Figure 3 - Example of a perfect ECG signal[5] .................................................. 23
Figure 4 - An expected PPG signal [7] ............................................................... 24
Figure 5 - Ideal EDA response [10] .................................................................... 24
Figure 6 - Biofeedback loop [21] ........................................................................ 26
Figure 7 - Game flow and emotions associated to automate adaptation [29]
.............................................................................................................................. 29
Figure 8 - Suggestion to describe the fun factor and gameplay in MDA [34]31
Figure 9 - Example of a system setup using Biopac [32] ................................. 32
Figure 10 – Facial EMG and EDA setup [12] ...................................................... 33
Figure 11 - Emopad prototype [59] ................................................................... 34
Figure 12 - Subject playing GTA game for the heat map experiment ............ 37
Figure 13 - Left image is a subject's hands after session and right picture after
editing to enhance grey areas ........................................................................... 37
Figure 14 - Result of the experiment after all players' hands overlapped .... 38
Figure 15 -BITalino’s ECG connector [51] .......................................................... 39
Figure 16 – Four configurations chosen to test ECG ....................................... 39
Figure 17 - ECG signal peak detection using PhysioLab .................................. 40
Figure 18 - Signal to noise ratio result from the 4 ECG positions .................. 40
Figure 19 – Five positions defined to test PPG ................................................. 41
Figure 20 – Signal to noise ratio for each position of the experiment .......... 42
Figure 21 - PPG Position tested on the controller............................................ 43
Figure 22 - Comparison of User’s 3 hear rate from smartwatch (red) and
Gamepad (green) ................................................................................................ 44
Figure 23 - Comparison of User’s 2 hear rate from smartwatch (red) and
Gamepad (green) ................................................................................................ 45
Figure 24 - EDA electrodes placed with blue tack ............................................ 46
Figure 25 - Final game controller prototype ..................................................... 46
Figure 26 – Architecture of the signal acquisition software ............................ 51
Figure 27 – GUI of a new signal being added ................................................... 54

12
Figure 28 – Player configuration GUI ................................................................ 54
Figure 29 – GUI to add a new Device ................................................................ 54
Figure 30 – Signal acquisition full scene ........................................................... 55
Figure 31 – Custom File explorer to load a saved configuration .................... 55
Figure 32 - Full view of the Signal Processing scene with two filters applied to
PPG ....................................................................................................................... 56
Figure 33 - Example 2 toggles for two filters. New filter's toggle is placed here
.............................................................................................................................. 56
Figure 34 – Full view of the Signal Visualization Scene .................................... 57
Figure 35 - Event logger with two logs .............................................................. 58
Figure 36 - Screenshot of ExerPong .................................................................. 62
Figure 37 - Snapshot of the OpenSignals software ......................................... 62
Figure 38 – setup used for the validation experiment .................................... 63
Figure 39 - Positive feedback algorithm to change the ball's speed and the
paddle's size ........................................................................................................ 64
Figure 40 - Negative feedback algorithm to change the ball's speed and the
paddle's size ........................................................................................................ 64
Figure 41 – Game Experience Questionnaire result comparison between
condition 2 and 3 ................................................................................................ 67
Figure 42 -ball speed comparison between no biofeedback, positive and
negative feedback ............................................................................................... 68
Figure 43-Paddle size comparison between no biofeedback, positive and
negative feedback ............................................................................................... 69
Figure 44 - number of lost balls in each condition .......................................... 70
Figure 45 - biosignalsplux and physiopad's EDA correlation (p-values) ........ 71
Figure 46 - Arrousal values during each condition .......................................... 71
Figure 47 – HR comparison of one subject during a session .......................... 72
Figure 48 – HR comparison of one subject during a session .......................... 72
Figure 49 - Heart rates comparison between conditions ............................... 74

13
Acronyms
BPM – Beats per minute
CSV – Comma separated value
DDA – Dynamic difficulty adjustment
ECG – Electrocardiogram
EDA – Electrodermal Activity
EEG – Electroencephalogram
EKG – Electrocardiogram
EMG – Electromyography
GUR – Game User Research
GSR – Galvanic skin response
IDE – Integrated development environment
HR – Heart rate
HRV – Hear rate variability
MAE – Mean absolute error
ME – Mean error
PPG – Photoplethysmogram
RSME – Root square mean error
S/N – Signal to noise ratio
SBL – Skin conductance baseline level
SC – Skin conductance
SCR – Skin conductance response
SUS – System usability scale
TEMP – Temperature sensor
UMa – University of Madeira

14
(This is blank)

15
1. Introduction
In this chapter, I will succinctly introduce the topic for this master's thesis and
there are four main sections. Firstly, I start by stating the motivation for this
master's thesis. Secondly, A brief introduction to the topic of research and its
context in the project. In the two-remaining sections, I describe the objective
of the project and the document’s structure.
1.1. Motivation
In recent years, psychophysiological information has been introduced in
video games and game research. Some of these signals are Electrocardio-
gram (ECG) or Photoplethysmogram (PPG), both used to estimate the heart
rate. Electrodermal Activity (EDA) is used to measure arousal, frustration and
skin temperature. To capture signals of this nature is, usually, required a vast
and complex hardware and software system implementation. Most of these
systems are very intrusive, require expertise on the physiological field and
are time consuming to setup. Often, research of this nature, calls for an ex-
pert to set up everything. Making a post-analysis of interventions is compli-
cated due to a lack of synchronization between the physiological data and
the game itself. Thus, it is proposed the implementation of a game controller
which can record physiological information in a non-intrusive and very easy
to set up configuration, where the end user only needs to grab the controller
and play the game. Moreover, it is also proposed to create a software to in-
terface with the game controller, record the physiological signals and syn-
chronise with game events.
1.2. Topic Overview
Game User Research (GUR) is a field of game development that focuses on
the gameplay and how the player feels playing the game rather than finding
bugs. To access the players' emotional state various methodologies, from
other subjects, have been implemented in GUR. Some examples are obser-
vation, questionnaires, think-aloud protocol, focus groups or recording phys-
iological signal from the user. The majority of these methods have some kind
of bias due to the interpretation of event by the player or by the researcher.
Physiological signals, however, rarely lie, because they are hard to control
and the response is as true as possible.
Physiology has been used for many years in game development. More than
just recording the signals and interpret then after a session, games have been
using physiology to change the output of the game, increasing the game ex-
perience and producing unique experiences. Games that use these signals
are called biofeedback games. The biofeedback can be direct or indirect. The

16
biofeedback is direct when the player can manipulate the physiological signal
such as flexing a muscle or breathing. Physiology is indirect when a player is
not capable of controlling the biosignal. Examples could be the level of ex-
citement or the heart rate. Games that have some form of adaptation and
the user is not able to figure out how the physiological data is manipulating
the games or does not even notices the changes are called affective games.
Still, if for some reason in an affective game, the user becomes aware of the
physiological changes and is able to manipulate the signals willingly that
game becomes a simple biofeedback game.
There are vast options for signal acquisition system. Some are very accurate
but very expensive also, Other are priced lower but are not so accurate. Tak-
ing this into consideration the game designer and researcher are able to com-
promise and choose the best hardware whilst fitting their needs. Many sig-
nals can be recorded with physiological acquisition hardware. Electrodermal
Activity is used to record the emotional arousal during game play. Electrocar-
diogram or Photoplethysmogram are commonly used to calculate the heart
rate, in beats per minute of the user. Electroencephalography is used to rec-
ord the brain and is possible to assess arousal and attention. Finally, Electro-
myography (EMG), when placed on a muscle can detect even the slightest
activation on a that muscle.
1.3. Objectives
The main purpose of this thesis is the construction of a non-invasive game
controller that records biological signals from its users using it for Game User
Research and for biofeedback adaptive games. Taking this goal into consid-
eration, the project calls for both hardware and software implementations.
Concerning hardware, the wireless gamepad, called Physiopad, needs to be
integrated with a device that can record the physiological data wirelessly. The
Physiopad should be non-intrusive with the most natural interaction possi-
ble, easy-to-setup, and easily replicable.
Regarding the software, there is the need for an interface which manages the
physiological data and can interact with video games. This software will be
receiving the raw signal from the selected physiological device, will have to
enable the researcher to add filters to the signals and manipulate them. Also,
the software will be calculating live results metrics, such as heart rate per
minute (BPM) or arousal and sending these results to a biofeedback game.
Finally, the software will need to collect data from the game and store it with
the signals and metrics.
As a mean to validate both hardware and software, a proof of concept exper-
iment will be implemented using a biofeedback video game.

17
1.4. Thesis outline
This document is structured in six different chapters. The first chapter is the
introduction where the motivation and objectives, for this thesis, are. Chapter
two is separated in five main topics. Starting by describing what is Game User
Research and why it is used, then an overview of physiological signals and.
Topic 3 and 4 are a literature review of affective gaming. A review of hardware
to record physiological signals can be found on topic 5. Chapter three consist
of the implementation of the hardware and software. There are described
the requirements for hardware and software, the tools and materials used.
The method and experiment designed to evaluate the performance of the
Physiopad and its signal acquisition software can be found under Chapter
four. Also, in chapter four, the results discussion is presented, and the main
conclusions and future work are in chapter five. Finally, chapter six are the
references used during this work, and chapter seven some attachments can
be found.

18
19
2. State of the art
This section is dedicated to the literature review. In this literature review is
possible to find a description of Game User Research and its methods, fol-
lowed by an overview of the most used physiological measurements. Then, a
definition of affective gaming and the difference between it and biofeedback
games. How affective games are developed and the hardware devices avail-
able to record physiological data are the last two topics to be reviewed.
2.1. Game User Research
Lennart Nacke in [1] defines Game User Research is and how it is applied in
the context of game development. The author describes that while Quality
assurance focuses on finding the bugs and other technical problems in
games, Game User Research (GUR) focuses on the game experience and how
the player relates to the game. GUR uses many methods that are originally
from different domains. Human factors, human-computer interaction, and
psychology are some domains that inspired the Game User Research field.
When a game designer creates a game, there are multiple experiences that
he is trying to transmit to the player, accordingly to the author. Game user
researchers use various techniques to observe and understand how the
player interacts with the game and which are the players' responses through
the gameplay. Note that the aim in GUR is not to evaluate the user but to
analyse the game and then report back to the game designer the changes
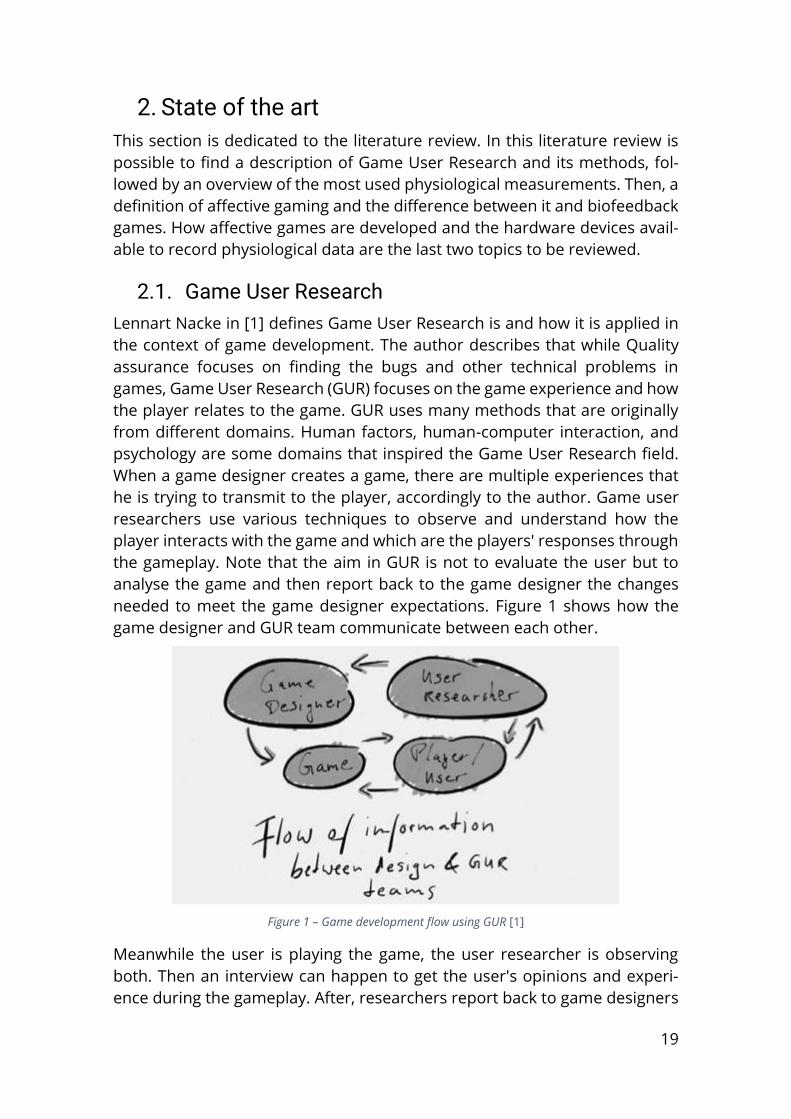
needed to meet the game designer expectations. Figure 1 shows how the
game designer and GUR team communicate between each other.
Figure 1 – Game development flow using GUR [1]
Meanwhile the user is playing the game, the user researcher is observing
both. Then an interview can happen to get the user's opinions and experi-
ence during the gameplay. After, researchers report back to game designers

20
the results and observations, who iterates the game and adapts it, to, accord-
ing to the author, a more compelling game.
The author presents some methods being used by researchers that also aim
to retrieve the emotional state of the player and confirm whether is was the
emotion which the game designer was trying to emulate. The methods de-
scribed by the Nacke are (1) behavioural observation, (2) think-aloud proto-
col, (3) interviews, (4) questionnaires, (5) focus groups, (6) heuristic evalua-
tion, (7) game metrics and (8) physiological game evaluation. A summary of
each protocol follows below.
Figure 2 – Methods used in game user research [2]
Behavioural observation
Nacke states that for many, it is one of the best methods available because
of its simple nature, the game designer or researcher can simply observe to
the player and his gameplay. Much more complex environments are possible
to accomplish such as using various cameras to record the session. One of
the downfalls of this technique is that the observer must make assumptions
and infer what the user is feeling and why he reacts in that manner. Another
benefit is that the game designer can see the reactions (body language and
expressions) in real time.
Think-Aloud Protocol
This methodology was initially used to test the usability of a product and can
be seen as adding a new layer to the behavioural observation. This approach
adds a narrative from the player. The author states that the user is supposed
21
to speak out-loud what he is thinking and feeling during the interaction. This
narrative is often recorded to be analysed after the session. This will require
some expertise from the player and he has to feel comfortable to speak what
he is feeling during gameplay. Also, this is not a natural activity so an addi-
tional moderator might be required to help the player narrate the events.
This could add some bias as the narrative may interrupt the player’s thought
process.
Interviews
The interviews’ quality is dependent on the quality of the interviewers. This
method allows a deep understanding of the emotions, reactions and opinion
of the user and can have an even deeper understanding using follow-up
questions. Data is usually hard to analyse and sometimes common themes
do not emerge from the interviews. Furthermore, the author defends that
there is some bias associated with the answer given by the user.
Questionnaires
This method is described by Nacke as being widely used in GUR to collect a
large volume of reports from various players. Metrics can rise from question-
naires, and data is usually much easier to analyse than Interviews. It is time
efficient because multiple testers can be filling the questionnaire simultane-
ously. On the other hand, it lacks the depth that interviews have since there
are no follow-up questions.
Focus Groups
Focus groups consist in gathering various players and let them talk about the
game experience. They are allowed to speak about whatever they feel like,
but there is a moderator trying to convey to more important matters. Nacke
suggests that focus groups should, preferably, be used in early phases of the
game development rather than final versions of games. A disadvantage of
this method is that some of the players may pick on the others feedback and
not be completely honest. Also, if there are more dominant users the others
might not have an opportunity to express their belief.
Heuristic Evaluation
Nacke describes this method as the "discount usability method" because it is
applied to a few GUR experts. They play the game and evaluate the game
experience based on a bunch of parameters. With this approach, the experts
determine if the game fits the designer's intentions and figure out which is-
sues may arise from non-compliance. There are many heuristics proposed
and each fit a certain kind of game. There is no common set of heuristic so it
may be difficult to choose the best for the game in question. Also, an expert
22
may miss a problem that only novice players experience, so this method
should be complemented with another method that includes novice players.
Game metrics
Nacke [1] states that game metrics are one of the most recent methods to be
embraced by GUR. This approach is essentially logging all the player interac-
tion. Game variables, player position and other information that may be rel-
evant to the gameplay. All these metrics are saved for analysis and are very
complete. The issue is that the researcher will need software to go through
all this data fast. This is an interesting approach because for every event hap-
pening a lot of information is recorded and the researcher and game de-
signer can make more informed decisions.
Physiological game evaluation
The author describes physiological game evaluation as the process of acquir-
ing data from the player, directly. This information is collected from the sur-
face of our body and is collected as energy measures. Usually, these sensors
are placed on the skin surface. Whilst manipulating elements inside the game
the measures are recorded and later the designer can rearrange the game-
play to fit the desired response from the player. These responses are usually
hard to control, hence they are as true to the player emotion or state as pos-
sible. Since there is no bias from the player opinion or researcher interpreta-
tion this method seems to have a big potential to help evaluating players'
responses to gameplay. A downside is that this method is not fully explored
and data may be hard to analyse and interpret if the researcher is not familiar
with physiological data. Plus, extracting emotions from this kind of infor-
mation can be very difficult and there is still no full proof method to extract
emotions.
To conclude, Game User Research has various methodologies that can be
implemented to evaluate how the player is interacting and reacting to a
game. So, a combination of these methods should be used. Physiological
game information is an interesting approach that can remove the bias factor
that most of the other approaches suffer. Due to the difficulty of extracting
emotions through physiology, it should not be used alone. Other, more tra-
ditional methods, as observation, should be applied at the same time to get
the full picture of gameplay and players’ emotions.
2.2. Physiological signals
There are plenty of physiological measures that can be recorded or extracted
from signals. Some are easy and intuitive to use others require some exper-
tise on the field or an intense amount of time processing and analysis.

23
Electroencephalography
Commonly recognized as EEG, Electroencephalography is one of the most
used methods to study the human brain. EEG usually uses some sensors
placed on certain areas of the head. One configuration of sensor used is the
10-20 system [3]. EEG has various bands based on the frequency of the sig-
nals. The delta band is linked to sleep and increases near tumour locations.
The Theta frequencies are linked with attention and mental demand. The
Beta band is also associated with attention and vigilance. Finally, the Gama
band is linked, again, with attention, object recognition and arousal. [4]
Cardiovascular measures
The more traditional method to record the heart's health is Electrocardio-
gram, ECG or EKG. ECG shows the changes in electrical potential of the heart.
Figure 3 - Example of a perfect ECG signal[5]
The peaks represented by the letter R, in figure 3 occur when the ventricles
contract [5]. The difference between each consecutive peak is called heart
rate variability (HRV) [6]. ECG usually is recorded using 3 electrodes: Positive,
negative and neutral. Another form of calculating heart rate is using Photo-
plethysmogram (PPG). PPG measures the blood flow and is usually placed on
a ear lobe or tip of a finger [7].

24
Figure 4 - An expected PPG signal [7]
With PPG, HRV is also possible to be calculated. The real time heart rate value
in beats per minute (BPM) can be achieved using the following formula: heart
rate (BPM) = 60 seconds/time of peak's occurrence. [7]
Electrodermal Activity
EDA is also known as skin conductance (SC) or galvanic skin response (GSR).
EDA uses two bipolar electrodes, one sends a constant electrical charge to
the other and these changes are the values measured by EDA. [8] The units
used for EDA are microsiemens. This measurement has been linked to emo-
tional arousal [9]. The more aroused a person is higher the EDA value.
Figure 5 - Ideal EDA response [10]
EDA can be decomposed into two components. The tonic component or skin
conductance baseline level (SBL) and the phasic component or skin conduct-

25
ance responses (SCR) that are the peaks. A peak is usually regarded as a re-
sponse a certain stimulus. There is usually a delay in the response that can
go up to 3 seconds. For real-time SCR detecting a threshold of 0.05 microsie-
mens is suggested. [11]
Electromyography
Electromyography or EMG is, usually, placed over a certain muscle and serves
to record the level of that muscle's activation. EMG detects contractions or
flexions in a muscle. When a muscle is activated an electrical signal is sent to
the muscle and EMG record those changes. One common use of EMG is to
identify emotions using the facial muscles. Regarding game experience, these
emotions can translate to a positive or a negative reaction from the player.[2]
Summarizing, There are various physiological signals that can be used for
multiple purposes. EEG can be used to detect arousal or players’ attention.
ECG or PPG are used to calculate heart rate values or to extract HRV. EDA
signals can be used to detect the emotional arousal level of a player during
game play. To access whether a muscle or group of muscles are activated
EMG can be used. EMG also can detect positive and negative emotions, if
placed on the user's face.
2.3. Physiology in game development
Earlier, the use of physiology or biosignals for Game User Research was de-
scribed to be used to assess the emotional response to a stimulus in game.
Although this is extremely informative to the game designer, the usage of
these signals could be more effective. These signals can be part of the game-
play and act as an additional input to the game. Games which use the physi-
ological signals as input to the game and consequently change the state of
the game are known as adaptive games.
As early as 1984 some companies like Atari, Inc. (New York, USA) tried to build
games that would change based on the player’s physiology. The Atari
Mindlink used EMG placed on the forehead but it was never commercialized
because it gave headaches to the players. Around the same year, a Canadian
company developed a racing game using GSR. Later, Nintendo1 built a ver-
sion of Tetris, for the Nintendo 64 console, that adapted the velocity of the
game based on the player's heart rate [12]. More recently, Nintendo had an-
nounced Wii Vitality [13], but it never reached the market. Ubisoft2 has Ozen3,
an app for iPhone and iPad that teaches to relax by breathing. Even Sony has
a patent for a sensor capable of recognizing emotions [14].
1 Nintendo Company, Limited (Kyoto, Japan) 2 Ubisoft Entertainment S.A (Paris, France) 3 http://experience-ozen.com/en-GB

26
These are some examples that big companies in the gaming industry are try-
ing to push games that use biosignals as a mean to amplify the game experi-
ence. But not only big companies are working on these games. The indie
game industry has also developed some adaptive games such as NeverMind4
from Flying Mollusk (California, USA) or Unyte: Interactive Meditation5 from
Unyte Health Inc. (Toronto, Canada).
The Unyte game and Ozen are examples of games that were designed for
train relaxation and stress relieve. Bersak et al. [15] also built a two-player
racing relax-to-win game which made the player go faster the more relaxed
he was. Space Connection was developed to promote collaboration between
teenagers by controlling their physiological responses [16]. This genre of
games provides an explicit feedback of the player's signals and the player is
supposed to reach an optimal state. This way the player learns how to control
his own physiology and relax, for instance, in a more stressful situation. [17]
Others have not built games but applications using biofeedback as well [18]–
[20].
Figure 6 - Biofeedback loop [21]
The biofeedback loop explains (figure 6) how games and the applications
mentioned before, use the physiological data to adapt their output. The sig-
nals are recorded using hardware built for the effect. This hardware then
sends the physiological state to the software, the software applies changes
to visual, audio and/or game mechanics and then those changes are output-
ted to the user.
Rosalind Picard described affective computing as "computing that relates to,
arises from, or influences emotions" [22]. The aim of affective computing is
4 http://nevermindgame.com/ 5 http://unyte.com/
27
to create computers that have the capability of recognising emotions,
through the physiological signals of its user and respond accordingly. In-
spired by this new subject, Bersak et al. introduced the term affective feed-
back [15] opposing to simple biofeedback. The authors state that with bio-
feedback the player learns to control their emotions based on the infor-
mation that the system (game or other software) provides, whereas with af-
fective feedback the game also adjusts to the user based on his emotional
state.
Moreover, there are two kinds of biofeedback: direct and indirect feedback
[23]. The direct feedback is used as a mere input to the game, it acts the same
way a click of a button (or sequence of buttons), after the input an action
inside the game is expected. For instance, in a boat game using respiration
to control the boat's velocity, the respiration is considered a direct input.
Some examples of direct biosignals are: respiration, contracting a muscle,
eye gaze or other signals which the player can directly control. On the other
hand, indirect feedback is when the biosignals are not controlled directly by
the user. These signals usually change the ambient of the game or add/re-
move powers. An example is [24] that used HRV and GSR to change the envi-
ronment, adding and removing filters to the screen. Examples of indirect sig-
nals are heart rate, stress, attention. Nacke et al., further states in [23] that
with the combination of direct and indirect biofeedback is possible to in-
crease the levels of emersion and satisfaction. Direct and indirect biofeed-
back loosely translates to implicit and explicit feedback [25]. Explicit feedback
is the biofeedback that is presented to the player to facilitate control over the
signals, whereas implicit feedback are all the biosignals that are not pre-
sented to the user, consequently the player may not even be aware of the
changes.
To differentiate games in which the user knows how their physiology ma-
nipulates the game from those where the user was not able to figure out
which elements were changed, the concept of affective games was born
[26]. Affective games may use affective feedback and change the gameplay
amplifying or minimizing the player's emotions. In a sense, the player is not
aware of the changes in the game and which physiological responses han-
dle that change. To sum up, the authors describe that a game is affective if
the player is not aware of the complete cycle of the biofeedback loop. Con-
sequently, in biofeedback games, the player is fully aware of the biofeed-
back loop. There is a fine line separating both games. For instance, when
playing an affective game, if the player becomes familiar with the biofeed-
back loop, then that game becomes a simple biofeedback game.
To summarize, physiology has been used in game development for more
than 30 years, manipulating the state of the user to create more immersive

28
and compelling games. Research shows that players enjoy this kind of inter-
action and this is shifting, somehow, how we consume games and, in a way,
how games respond (the physiological data) to the user. Affective games are
games where the user has no perception of the changes in gameplay, or can-
not control his biosignals. However, if one becomes aware of how biosignals
are affecting the game, it becomes a biofeedback game.
The next section is dedicated to how can one build games that are affective
and the frameworks that are available.
2.4. Developing affective games
Even games that are not affective always have in mind the engagement of
the player and how much the game is enjoyable to play. After all, all games
are designed to be played. So, even non-affective games have some sort of
adaptation. Usually in the form of game difficulty adjustment (easy, medium,
hard, expert). In a limited way, this is an attempt from the designer to create
an engaging game. The problem here is that the perception of level difficulty
from the player can be different from the game designer [27]. Therefore, us-
ing adaptation decreases the gap of level perception and the game is, in the-
ory, engaging for all kind of players, from novice to expert.
The adaptation can be made within two opposing patterns: positive or nega-
tive feedback. The former increases the gap between the desired emotional
state and the actual state, while the latter reduces this gap [28]. In-game a
combination of both loops can be used. The positive feedback is used as a
challenge to the player and the negative loop to maintain a desired state.

29
Figure 7 - Game flow and emotions associated to automate adaptation [29]
Figure 7 shows the flow channel which is the channel that the game designer
wants the player to be through all game experience in both adaptive and non-
adaptive games. The authors introduce a small change. Using three emotions
(anxiety, engagement and boredom) it is possible to know if the player is in-
side the flow channel or not, thus changing the game whether the player is
in the flow state or not. Using this approach, the user is always engaged with
the game providing a better game experience. In a high flow state the low-
frequency power of HRV decreases and there is a higher respiration depth
[30].
Gilleade et al. in [26] present three models to design games: Challenge me,
Assist Me and Emote me. Challenge me consists in creating strategies to in-
crease the difficulty of the game based on the player’s state. Using the play-
er's physiology, one can place the player in a difficulty setting more appropri-
ate. Also, the increase of difficulty can be adjusted based on both the perfor-
mance and state of the player. On the other hand, assist me, has the main
goal of assisting the player along the gameplay. Some actions that are trivial
for some players may be difficult to others. Measuring the level of frustration
of the player, the in-game location and the objective, the game designer can
figure out why the player is feeling frustrated and give a clue making the ob-
jective simpler. For instance, if the player is looking for a special character in
the game and can't find him, using the frustration of the player as input, the

30
game could make the character reach the player, or place the character in a
place where he would be more visible to the player. Two different kinds of
frustration can arise [27]. At-game frustration which translates to the player
not being able to use the input source as desired, such as when a sequence
of fast commands is needed but the player is never able to complete the se-
quence. In-game frustration is related to the inability of completing a mission
or not knowing how to proceed to the next game scene. Emote me, is thought
to generate emotions during the gameplay. Every game designer when builds
the game wants the player to feel a certain emotion, hence the soundtrack
changes throughout the game, for example. However, a state that triggers a
determined emotion for the game designer could trigger another in the user.
Therefore, measuring the player’s emotions the game designer can change
the surroundings to trigger the desired emotion based on the current emo-
tion. The two first modes of adaptation serve as support to the Dynamic Dif-
ficulty Adjustment (DDA) [31]. Traditional DDA is based on the performance
of the player, meaning that the difficulty adjustment is made through positive
feedback. This can be taxing on the player, though. A better way to imple-
ment the DDA is using the affective state of the player and decide whether to
apply positive or negative feedback. Changchun Liu et al. demonstrated that
DDA based on the player's physiology increased performance when com-
pared to traditional DDA [32]. The authors suggest that a combination of both
should be used though.
In [33] the authors describe three game task types that can be used to com-
plement the physiology to be used in DDA. Explicit tasks are those defined by
the game designer. They are mandatory for the player and are usually pro-
posed as objectives, missions or goals. Examples are defeating a final boss or
grab a key to unlock a door. Implicit tasks are the ones that the player is sup-
posed to complete but is not obligated to continue the game. For instance,
not dying or complete a mission without being found by the enemy. Lastly,
player-driven tasks are tasks that are created by the user's imagination.
These tasks are common in games that have an open world map and some
examples of these tasks can be destroying all the blocks in Super Mário6 or
driving by the rules in Grand Theft Auto7. Another notable example is Mine-
craft8 in which all its success is due to the player-driven tasks that each player
creates during gameplay.
A game can be divided in three components: rules of the games, the system,
which is how the rules apply to the game and how rules interact with the
6 Game owned by Nintendo Company, Limited (Kyoto, Japan). 7 Game developed by Rockstars Games (New York, USA). 8 Game owned by Microsoft Corporation (Washington, USA) created by Mojang (Stock-
holm, Sweden).

31
player, and the fun factor. The MDA approach [34] is a traditional framework
that establishes three design components that correspond with the latter
components. Mechanics are about the game rules and actions which the
player can perform. Dynamics correspond to the system component and
which mechanics are available at one point of the game and how inputs from
the player manipulate the game are defined here. Aesthetics characterise the
fun in a game and the emotional state of the player.
Figure 8 - Suggestion to describe the fun factor and gameplay in MDA [34]
In conclusion, many approaches can be used to develop a game. The funda-
mental factor is to keep the level of engagement through all the gameplay.
This is a priority in traditional and affective games. Keeping in mind the three
modes of adaptation from Gilleade et al., Challenge me, Assist me and Emote
me it is possible to build more continuous game flows that adapt to every
player. Although the games may be affective, former methods used in tradi-
tional game development should not be ignored but included when making
affective games. Finally, games that record physiology usually require extra
and dedicated hardware to record these signals. One ought to further study
the hardware already built by researchers and those available commercially.
2.5. Recording physiological signals
All the affective games need, somehow, a piece of hardware that enables the
recording of the signals. The hardware, sometimes, is custom-made and built
by the researchers [6] and [23], other times some commercial available phys-
iological system is used [12], [16], [19], [35]. Plus, some use DYI development
kits such Arduino9 (New York, USA) [36].
BIOPAC Systems Inc.10 (California, USA) is a company that provides a variety
of systems that can be used to record physiological signals from the user.
The system configuration is very versatile and can be used to monitor static
9 https://www.arduino.cc/ 10 https://www.biopac.com/research/

32
or mobile users, has data logging capabilities and integrated software to see
all the data. The systems can record ECG, EMG, EEG, HRV, respiration and
others that can be found on the website, both in animals or humans. The
company provides from the electrodes to data analysis or software to stimu-
late the user. The prices are available upon consultation and depend on the
setup required. Biopac states on its web page that is one of the most used
systems in Universities [37]. Systems from this company have been used in
[7], [32], [15].
Figure 9 - Example of a system setup using Biopac [32]
A different hardware solution available is the biosignalsplux11 [38] from PLUX,
wireless biosignals, S.A. (Lisbon, Portugal) which has a big range of sensors
also available such as ECG [39], EDA [40], EEG [41], EMG [42], respiration [43],
temperature [44], blood pulse [45] and accelerometer [46]. It is a high-end
acquisition system that works via Bluetooth and has an optional internal
memory, making it portable not needing a computer at all times. It has up to
four input analogue channels with a resolution of 16 bits and a sampling rate
of 3 kHz. The biosignalsplux Solo is the cheapest kit available and costs 405.00
euros, however has only one input channel. The biosignalsplux Explorer kit is
available with four input channels and four sensors included at 995.00 euros.
The OpenSignals12 [47] is an open-source software that is available to record
and analyse the signals.
11 http://biosignalsplux.com 12 http://biosignalsplux.com/en/software/opensignals

33
The portuguese company, Plux, has another hardware acquisition system. It
is an Arduino based acquisition system that was developed thinking about
researchers and enthusiasts with little background in signal processing called
BITalino [48]. Similarly, to the biosignalsplux system, the BITalino also, con-
nects via Bluetooth, has the same number of analogue inputs but in a lower
bitrate (10 bits), and a sampling rate up to 1 kHz. Additionally, two digital in-
puts can be converted to analogue inputs up to 6 bits [49]. Concerning the
sensors, EMG [50], ECG [51], EDA [52], accelerometer [53] and pulse sensors
[54] are available for this board. Three distinct solutions are available. In the
board version, the hardware is sold as one-piece ready to be tested, the
plugged version the sensors and the main board are separated and can be
easily attached as pleased and the freestyle version the sensors are also sep-
arated from the main board enabling people to use their own custom sen-
sors [48].
Figure 10 – Facial EMG and EDA setup [12]
However, these systems can be complex and cumbersome for the user. If
these sensors are placed on the hand, they limit the use of said hand so phys-
iology cannot be combined with traditional input devices like keyboard and
mouse or even a game controller. Some companies have devoted their time
to build less invasive hardware. MindWave is an example of a headset that
uses a single electrode to record EEG signals [55]. On the EMG and muscle
movement recognition ground, there is the Myo Armband. An armband that
is capable to detect various arm and hand movements and send them to a
computer or mobile device using Bluetooth [56]. Most of the smartwatches,
nowadays, come equipped with PPG and are able to measure pretty accurate
heart rate values [57]. Additionally, even the smartphone cameras with some
image processing software that can measure the heart rate [58].
To enable easy recording of physiological signals and the use of game con-
trollers at the same time, researchers have tried to come up gamepads at-
tached with physiological sensors. Previous work such as the Emopad tries

34
to gather the physiological data on a controller in a way that the user only
has to worry about grabbing the controller and play [59].
Figure 11 - Emopad prototype [59]
The controller chosen, a PlayStation 313 replica, has embedded GSR, PPG,
TEMP and FORCE sensors and their placement can be seen in figure 11.
These sensors connect to the MSP430 TI [60] micro controller. The GSR and
TEMP sensors were custom built and the circuitry is available in [59]. In Stan-
ford a similar controller inspired on the Xbox 36014 controller, has been im-
plemented [61]. This controller can record the heart rate, respiration and
temperature of the player during gameplay.
To conclude, there are a great number of hardware devices ready to record
and process physiological signals, but most of them require a various num-
ber or electrodes placed on the correct site or are bulky and too expensive
for the common user. Solutions such as Emopad are interesting because they
facilitate the acquisition of signals and are not obstructive to the user and the
researcher does not have to verify if the electrodes are in the correct position.
The player just should grab the gamepad and play the game. Emopad and
the controller from Stanford could be the first steps towards the adaptation
of physiologically capable controllers by the casual player at home.
13 Console owned by Sony Corporation (Tokyo, Japan). 14 Console owned by Microsoft Corporation (Washington, USA).

35
3. Development
This thesis’ results in the creation of two artefacts: a software one, and a
hardware one. For both, the requirements were not well defined and changes
to the existing ones could be necessary. For this reason, the development
process chosen was prototyping. With prototyping, one can easily build a
functional part of the system, evaluate and iterate based on the result. Even
tough prototyping was used for the hardware and software development,
different methods were applied. More information on the model processes
can be found below (See section 3.1.1. for the hardware development pro-
cess and section 3.2.1. for the software development). The development of
the hardware and the software were done side by side but as independent
systems, consequently the description of their implementation will be sepa-
rated to ease the description of both systems' implementation. The following
section is dedicated to the hardware and the second to the software imple-
mentation.
3.1. Hardware
In this section, one can find all the procedures and experiments elaborated
while building the game controller. All the experiments are described chron-
ologically from the earliest experiment to the latest. From the list of hardware
solution visited on the literature review (section 2.5.), the hardware platform
chosen to record physiology was the BITalino. This decision was based on (1)
the affordability of the platform, when compared with others, (2) the porta-
bility of the system and (3) the ease of use and the support community built
around the platform. BITalino has a forum15 on its website with an active
community which is a plus for people that have never used physiological de-
vices before.
3.1.1. Hardware development process model
For the hardware development, throwaway prototyping was used. Throwa-
way prototyping aims to build fast and cheap prototypes based on the re-
quirements that are less well understood, giving the developer a better un-
derstanding of them. After, a final version is built using the knowledge ac-
quired with the prototype. With a lack of knowledge in electronics and phys-
iological signals, the throwaway approach was the most suited method. This
way, the cost of the controllers' prototypes could be lowered. For instance,
15 http://forum.bitalino.com/

36
using blue tag and tape to place electrodes on the controller, instead of per-
forating the controller for each new position tested. After each discarded pro-
totype, a part of the controller emerged resulting as the final prototype.
3.1.2. Requirements
This section is dedicated to the requirements definition for the controller.
Below, a list of the functional and non-functional requirements that emerged
during the development of the controller.
3.1.2.1. Functional Requirements
RF#1 - The gamepad must be able to record the heart rate.
RF#2 - The gamepad must be able to record the engagement of a player.
RF#3 - The gamepad must take less than a minute to be ready to use.
RF#4 - The gamepad must be non-invasive.
RF#5 - The gamepad must work, at least, on pc.
3.1.2.2. Non-Functional Requirements
NFR#1 - The gamepad ought to be a commercial game controller.
NFR#2 - The gamepad ought to maintain the original structure.
NFR#3 - The gamepad ought to be replicable.
NFR#4 - The gamepad ought to be easily used by average gamers.
3.1.3. Gamepad map for hand placement
The main goal of this experiment was to understand how people hold and
interact with the gamepad. With a map of where the hand touches on the
game controller, we can determine the best spot to place the electrodes and
sensor on a Gamepad. The experiment consists in people interacting with a
tinted controller during some time. Finishing the interaction, the tint is trans-
ferred to the hand based on how the user holds the gamepad. The figure 13
(left) shows the palm of a tester after the experiment.
For the interaction, the Grand theft Auto III16 was used because it has driving,
shooting and character movement during its gameplay. The controller used
was a wired replica of a PlayStation 3 controller. This controller is usually
cheap and available in most online stores. Each session took 15 minutes and
the tester ought to play through the missions in the game. There were 10
16 Game developed by Rockstars Games (New York, USA).

37
testers, all male, ageing from 19 to 22. All the subjects are experienced gam-
ers.
Figure 12 - Subject playing GTA game for the heat map experiment
After the test, the users would have their hand tinted where they were hold-
ing the controller. To enhance the tinted part all images were edited using
the photos app available on Windows 10. All images got the same manipula-
tion: (1) enhancement was enabled; (2) the brightness was brought down to
-17; (3) the contrast was put on 100; and (3) highlights and shadows were
set -10. The rest of the editable options were left untouched. Figure 13
shows an example of tinted hand, before and after the manipulation.
Figure 13 - Left image is a subject's hands after session and right picture after editing to enhance grey areas

38
To analyse the result all edited hands were overlapped using the free editing
software GIMP17. The hands were cropped to only the parts that were in con-
tact with the controller. To overlap all the images, opacity was scaled down
to 70%. With this we can analyse the overlapping areas and see that the
greyer areas are the ones which touched the controller the most. In figure 14
it is possible to see that the best positions to place electrodes are on the tip
of the middle, ring and pinkie fingers and the top part of the palm.
Figure 14 - Result of the experiment after all players' hands overlapped
3.1.4. Testing ECG positions on the hand
One of the goals, for this thesis, is to have the less invasive controller so the
ECG should also be placed on the controller. Thus, this test had the objective
to find which configuration of positions would be the best for ECG recording.
To record the ECG signal an older version of BITalino plugged board [62] was
used, as well as its ECG sensor [51], which was the most recent version at the
time and the BITalino software OpenSignals. A post-analysis was done using
PhysioLab18 [63] in order to calculate the heart rate (BPM) during the session
and also the signal to noise ratio (S/N). Unable to figure out the noise of the
ECG sensor and BITalino, the noise was computed using a gaussian noise
17 https://www.gimp.org/ 18 https://neurorehabilitation.m-iti.org/tools/physiolab

39
function available on MATLAB. This will not give the accurate signal to noise
ratio of the signal but will give a mean to compare the S/N ratio between
positions.
The figure 15 shows the ECG sensor connector for BITalino. To represent
each electrode and an easier visual understanding, the positive, reference
and negative connectors were renamed to left (L), centre (C) and right (R),
respectively.
Figure 15 -BITalino’s ECG connector [51]
For the positioning of the electrodes four configurations were defined. Figure
16 shows the positions of each electrode for each of the 4 distinct positions
using the tags R, Land C tags described before.
Figure 16 – Four configurations chosen to test ECG
Each session was composed of four one-minute ECG recordings, one record-
ing for each configuration. This protocol was applied to 5 male users ageing

40
from 18 to 22. All user were students from the computer engineering pro-
gram from University of Madeira (UMa).
For the most part, one can observe that the peak detection was accurate as
seen in figure 17.
Figure 17 - ECG signal peak detection using PhysioLab
The HR values were also between the expected values when resting. So, the
deciding factor would be the signal to noise ratio. As a result, the best config-
uration was 3 as observed on the plot below. The average HR result for this
position was 76 BPM. Hence the configuration selected to be implemented in
our gamepad was configuration 3.
Figure 18 - Signal to noise ratio result from the 4 ECG positions

41
3.1.5. Testing PPG on the hand
With further research on the BITalino platform, a pulse sensor [54] was
found. This sensor can record the PPG signal which, also, can be used to ex-
tract heart rate. The advantage of PPG over ECG is that PPG only uses one
dry electrode where the ECG uses three wet electrodes. A disadvantage is
that PPG is less accurate than ECG and is sensitive to movement. Knowing
the drawbacks, it was still a possibility to study because of the fewer elec-
trodes, that translates to less space needed inside the controller to accom-
modate all the electrodes and sensors. So, as was done for the ECG sensor,
a similar test was done for the pulse sensor. Again, using the BITalino plugged
board and the pulse sensor to acquire data. The recording was done using
the OpenSignals Software. The HR was calculated after the sessions using the
PhysioLab software. This time, five different configurations were chosen as
seen in figure 19.
Figure 19 – Five positions defined to test PPG
The recording was done while resting and with the less movement possible
from the user to have the most accurate signal. For each session, all the five
configurations were recorded for one minute each. For this experiment, 5
users were selected from the computer engineering course at UMa. The ages
ranged from 19 to 22. Each user did one session. Similar to the ECG test, the
42
HR values were inside the resting spectrum, and a signal to noise ratio was
calculated. Again, a Gaussian function to compute the noise was used.
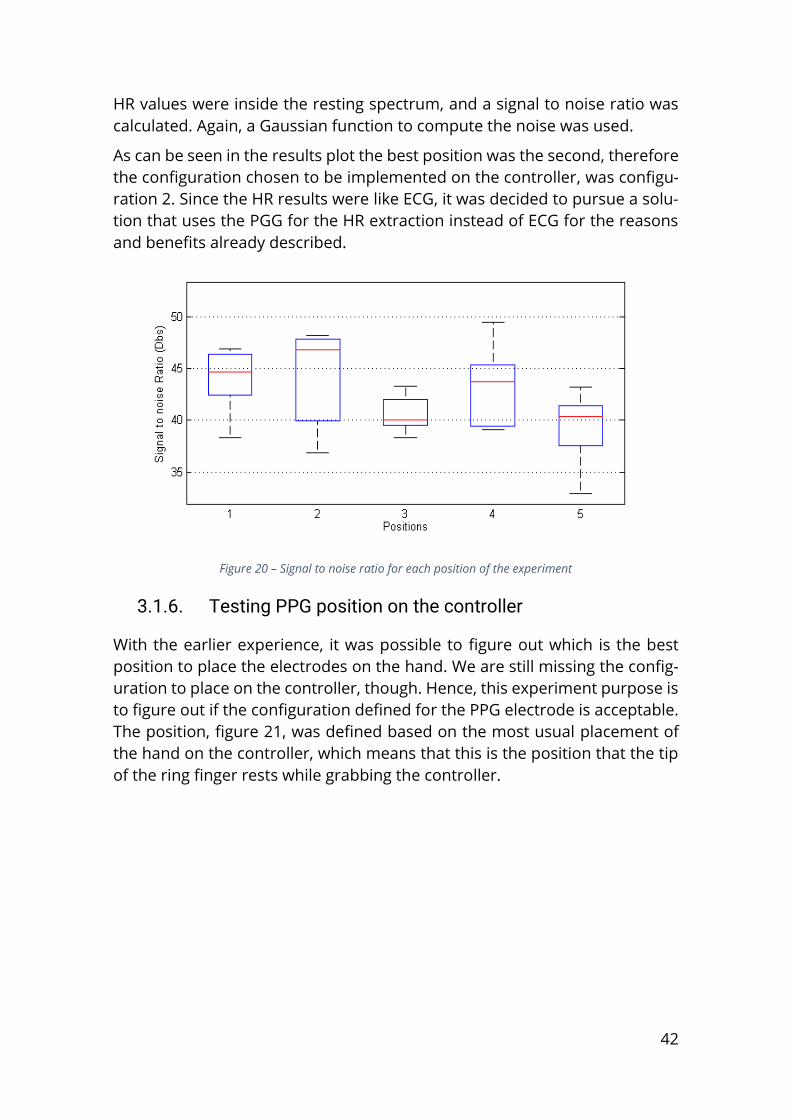
As can be seen in the results plot the best position was the second, therefore
the configuration chosen to be implemented on the controller, was configu-
ration 2. Since the HR results were like ECG, it was decided to pursue a solu-
tion that uses the PGG for the HR extraction instead of ECG for the reasons
and benefits already described.
Figure 20 – Signal to noise ratio for each position of the experiment
3.1.6. Testing PPG position on the controller
With the earlier experience, it was possible to figure out which is the best
position to place the electrodes on the hand. We are still missing the config-
uration to place on the controller, though. Hence, this experiment purpose is
to figure out if the configuration defined for the PPG electrode is acceptable.
The position, figure 21, was defined based on the most usual placement of
the hand on the controller, which means that this is the position that the tip
of the ring finger rests while grabbing the controller.

43
Figure 21 - PPG Position tested on the controller
This experiment consisted of playing a game during a period while extracting
two PPG signals from dissimilar sources: from the gamepad (BITalino plat-
form) and from the Smartwatch LG moto 360 [64]. The smartwatch acted as
a mean to compare the signals recorded from the gamepad. The aim was not
to compare the exact same heart rate value in any determined time, but to
observe if the changes (increases and decreases) in the heart rate from
smartwatch are also seen in the controller heart rate values. The assumption
is that the PPG from the smartwatch is accurate enough to give reliable heart
rate values even during exercise.
It was decided to use WRC 4 FIA World Rally Championship19 game for this ex-
periment. It is a rally game and the testers played the biggest track available
averaging an eight-minute interaction with the controller. Six subjects were
selected for this experiment. All subject were experienced gamers and ages
ranged from 19 to 23. The smartwatch was placed on the left wrist of all test-
ers. To record the PPG from the controller the OpenSignals was used. Using
the PhysioLab software it was possible to extract the heart rate per minute
(BPM). To extract the heart rate from the smartwatch was used a software
developed by the NeuroRehabLab research group20 that saves, every second,
the current heart rate to a file. For both, the controller and the smartwatch
19 Developed by Milestone S.r.l. (Milan, Italy) 20 https://neurorehabilitation.m-iti.org/lab/

44
were given a 30 seconds period to stabilise the heart rate before the experi-
ment.
Since the acquisition system for each PPG signals was different as its sam-
pling rates, it was needed to resize some of the samples, making them com-
parable. Using the imresize [65] function available in MATLAB, the smaller
samples were stretched to match the bigger one. The imresize function re-
ceives two arguments: the input to be resized and the factor of the resize.
Two different comparisons were done with this experiment. The first, the raw
heart rate values from the controller and the data from the smartwatch. The
second, all the outliers (more than 170 bpm and less than 40 bpm) were re-
moved the from the raw heart rate value of the controller using PhysioLab.
This was done to remove all the artefacts introduced due to the movement
of the finger from the sensor.
Due to the way, each system functioned and the human capability to start
recording both systems at the precise same time, some apparent delay may
be added.
Since the objective was to understand if the reading from the smartphone
and the gamepad would be similar and not testing que performance of the
real-time hear rate detection algorithm, only a visual analysis was done.
Figure 22 - Comparison of User’s 3 hear rate from smartwatch (red) and Gamepad (green)
In figure 22 is possible to see that there are some discrepancies that could
be from the natural movement of the finger. However, a trend is observed
and it is believed that the real-time algorithm can reduce greatly the noise
caused by the hand’s movement.

45
Figure 23 - Comparison of User’s 2 hear rate from smartwatch (red) and Gamepad (green)
Figure 23 is another example that is possible to observe some overlapping of
both signals.
Taking into consideration the nature of competitive games, some artefacts
from hand movement are expected. All the subjects stated that the position
was comfortable and it was placed right where they lay their finger. Listening
to the users and knowing that the real-time algorithm for heart rate can re-
duce the abrupt changes in HR because or movement this position was ac-
cepted and chosen as the final position for PPG.
3.1.7. Placing EDA on the controller
Testing EDA signals quality can be very difficult due to its ever-changing na-
ture and there are no baselines that one can follow. Fortunately, one of the
standard positions to measure EDA is on the fingers [66]. Contrary to ECG,
that it is was needed to test the best position to record the signal, EDA was
defined to be used with the index finger and middle finger or middle finger
and ring finger. The player can choose the most comfortable configuration
as long as the fingers are on the electrodes. For this prototype, copper coins
were chosen. The coins have a nice texture and are easy to feel, so it is pos-
sible to know whether the fingers are on the electrodes or not.

46
Figure 24 - EDA electrodes placed with blue tack
As a first approach, the electrodes were fixed with some blue tack. It eased
the electrodes' replacement and position adjustment. Some informal tests
were made with four players to adjust the electrodes. The players were just
asked to grab the gamepad and try to reach the coins in a natural position.
The electrodes were adjusted as needed and EDA's electrodes were fixed to
the controller with hot glue.
Figure 25 - Final game controller prototype
During the experiment, it was noticed that with the blue tack the EDA signal
was affected greatly by the PPG sensor. The hot glue, isolated more the EDA

47
signal reducing significantly the noise caused by the PPG. There is still some
noise though.
3.2. Software
This is the software that is responsible to record, manipulate and send the
physiological measures to the game and retrieve from the game, events that
the game designer understands as meaningful for the interaction (e.g.: Char-
acter died, level completed, final boss appears). This section is dedicated to
its implementation. Starting from the requirements that were defined for this
software and the distinct phases of the implementation and the reasoning
behind some changes that were made along the way as a mean to ease the
user experience and reduce the set up time that is needed for each experi-
ment.
3.2.1. Software development method
For the software development, the approach chosen was evolutionary proto-
typing. Contrary to the throwaway method, the evolutionary method focus
on the development of the well understood requirements and each resulting
prototype is part of the final product. Each prototype is built upon the previ-
ous prototype. With the experience gained on each cycle, new requirements
may rise and poorly understand become clearer [67]. A clear set of starting
requirements was defined making this approach more suitable. Plus, the im-
plementation of each part is built to take part in the final system. So, every
cycle of the development a design phase is mandatory before the coding
part. This way, the code will be cleaner and well-structured which helps the
continuous implementation of the software.
3.2.2. Requirements
The first action taken for the development of the software was to look to
other software implementations ([47], [63], [68] and [69]) that could record
biosignals. With this approach, one can understand which features a soft-
ware of this nature requires and what is usually implemented so the resulting
product usage feels natural to the researcher, with no big learning curve.
One feature that is a must in all similar software is real-time visualisation of
the signals acquired. This allows the researcher to make sure the signals are
being read from the device. Related to the signals visualization is the, also,
the real-time visualization of the features that are being extracted from the
signals (e.g. HR, arousal). This ensures the researcher that the recordings are
meaningful based on the expected result for each feature.

48
Even though a game controller that records physiological data was built, the
software must work with different physiological devices or a different config-
uration of the same device. The software must be open to the extension and
implementation of new physiological devices.
All the features chosen by the researcher should be sent to the designated
game so the game can use those values to change its state or environment.
The communication on the other way should also be possible. The software
should receive game events from the game being tested. With game event
tagging is possible to retrieve more meaningful conclusions to the results ob-
served during the experiments as well as a correlation between physiology
and game events.
Adding filters, through the software, to the signals is also a need to maximize
the signal quality and more precisely extract features from the signals.
Finally, all the features selected by the researcher and all the game event that
happened during the session must be saved to be analysed later.
At the start of the implementation of the software, not all requirements had
been defined. Many of the requirements rose at the end of each cycle of the
development with suggestions from other developers. The complete list of
the software requirements, both functional and non-functional, can be found
below.
3.2.2.1. Functional Requirements
FR#1 - The software must record multiple physiological signals.
FR#2 - The software must support multiple hardware devices at the same
time.
FR#3 - The software must enable more than one player in each session.
FR#4 - The software must save signals configurations.
FR#5 - The software must load previously saved configurations.
FR#6 - The software must show the signals in real-time.
FR#7 - The software must have filters to be added to the signals.
FR#8 - The software must let to add multiple filters to one signal.
FR#9 - The software must show the effect of the filter in real-time.
FR#10 - The software must calculate features in real-time.
FR#11 - The software must have a time counter.
FR#12 - The software must have an event logger.
FR#13 - The software must have shortcuts to add repetitive events.

49
FR#14 - The software must send the physiological features to the games.
FR#15 - The software must log events coming from the game.
FR#16 - The software must save the raw data coming from the hardware de-
vice.
FR#17 - The software must save the physiological features calculation and
events logged at 1 Hz.
FR#18 - The software must record heart rate.
FR#19 - The software must record engagement/stress.
3.2.2.2. Non-functional Requirements
NFR#1 - The software ought to be simple to use
NFR#2 - The software ought to be easy to learn
NFR#3 - The software ought to work in as many OS as possible
NFR#4 - The software ought to allow all devices to player configurations
NFR#5 - The software ought not to be CPU bound intensive
The key features that this software has, are:
• Support multiple physiological devices at the same time;
• Possibility to add as many filters as needed to each signal in real time;
• Two-way communication with games, sending the physiological data
and receiving game events;
• Event logging. The research can attach a tag at any time during the
session and;
• Open-source - open sourcing this software will make it easier to in-
crease the number of different physiological devices available in the
software as well as the different filters and feature extraction.
3.2.3. Technologies and software used
The BITalino website provides several API for different technologies. An-
droid21, MATLAB22, raspberry pi23, Arduino, Unity3D24 or Visual C#25. However
not every technology is suitable for this project, like the Internet of Things
(IoT). Let us look at some of these technologies that are interesting. We will
be focusing on Android, JAVA, Visual C#, MATLAB and Unity.
21 Mobile OS from Google, Inc. (California, USA) 22 Software Developed by MathWorks, Inc. (Massachusetts, USA) 23 Single board pc developed by Raspberry Pi Foundation (Cambridge, UK) 24 Game engine owned by Unity Technologies (California, USA) 25 Technology developed by Microsoft Corporation (Washington, USA)

50
Android is a very interesting path to take. This would render possible a port-
able setup to follow the controller. However, the power of computing re-
quired to record and show real time physiological signals is not commonly
available on affordable mobile platforms. Therefore, this kind of technology
is not yet suitable, but in a couple of years, this might be one of the best
solutions.
MATLAB is a very interesting option where its ecosystem already provides a
lot of functions and options to process, filter and plot signals. From all these
technologies MATLAB might be the most complete and prepared to process
this type of signals and it is a software used by many people in the electrical
engineering and signal processing domain. However, the aim of this thesis is
to provide a system to be used inside the game development community
thus MATLAB might not suit this requirement since it is not broadly used by
game designers and developers.
JAVA and C# are similar technologies that allow developing for various sys-
tems. Java runs on a Java virtual Machine which makes Java coded software
available to Linux, MacOS, Windows, and Android and web, which is a plus.
The C# environment builds for all the above but Linux, plus iOS devices and
windows store apps. So, using one of these technologies would be advisable
because they handle almost every system. Another advantage of Java is that
that has some frameworks designed to process biosignals [70].The deciding
factor would practically be based on the preference on the language. How-
ever, there is also a plugin for Unity3d available.
Unity3D is a game engine where one can build 2D and 3D games. Even
though the software being built is not a game, Unity is widely used for game
development. This means that game designers, and game researchers are
familiar with this kind software. Also, has the advantage of building for mul-
tiple platforms (e.g., windows, MacOS, Linux, Android, Web, iOS and game
consoles). Unity supports 3 languages: JavaScript, C# and boolang. Another
plus is that Unity and C# are widely used inside the NeuroRehabLab research
group. Integration with other software developed by the group will be much
easier and seamless. Therefore, For this project, it was decided to use Unity
and C#
A code editor is needed to write code. Unity comes prepacked with MonoDE-
velop26 an Integrated Development Environment (IDE). Despite this, unity
also supports Visual Studio27. Visual Studio has a great integration with Unity
and eases the process of debugging, so it was chosen over MonoDevelop.
26 MonoDevelop is an open-source IDE maintained by Xamarin, owned by Microsoft, and the
MonoDevelop community. 27 IDE developed by Microsoft Corporation (Washington, USA).

51
Lastly, to keep code up-to-date and to protect earlier versions of the working
software, version control was used. Version control sits well with prototyping
because it is simple to revert code changes and return to an earlier stable
version of the software. The most commonly used source control technology
nowadays is Git28. Subsequently, the code was stored on Bitbucket29, which
is one of the many Git solutions available on the market these days. To inter-
face with bitbucket, Source Tree30 was used and it is a free software that is
owned, also, by Atlassian.
Summing up, the technologies and software adopted for this project were:
Unity 3D, Visual Studio 2017 and C# for the software implementation. Source
Tree and Git were used for version control.
3.2.4. Software Architecture
The architecture chosen for this software was based on components where
each of them is an independent part of the software. This means that these
components can be reused in other similar applications. This architecture
has been updated along with the implementation of each requirement and.
As a result, there are 8 independent components that are being described
next.
Figure 26 – Architecture of the signal acquisition software
28 Technology developed by Linus Torvalds, creator of Linux. 29 An online Git repository solution own by Atlassian (Sidney, Australia) 30 Software interface for Git repositories developed by Atlassian (Sidney, Australia)

52
3.2.4.1. Devices component
This component is responsible for managing all the psychophysiological
hardware devices implementations. New devices Implementations can be
added to this component as needed. A DeviceManager class exists to ease
adding, updating and removing devices during run time. With this compo-
nent, is possible to have more than one piece of hardware acquiring data at
the same time.
3.2.4.2. Players Component
This component manages all the players during run time. Equal to the device
component, a manager is available. Each player has a colour attribute to be
easily distinguished, and a Signals Component to manage the signals that be-
long to each player.
The player also has a name attribute limited to 3 characters. Each signal pre-
pends to its name the corresponding player, so the character limit prevents
long signal names.
Decoupling the hardware devices from the players eases the use of this soft-
ware with a bigger range of setup configurations. For instance, using the
same hardware for multiple users at the same time or one user using multi-
ple hardware devices.
3.2.4.3. Signals Component
This component is responsible for managing the signals for each player. A
signal has many attributes such as the device from where it should the read-
ing data, the filters applied to the signal or its name. Taking a deeper look
into the repository31, it is possible the see the full list of properties and attrib-
utes. Here is also the implementation for each signal. Implementations for
PPG, EDA, ECG and ACC are available. More signals or implementations to the
same signal can be added if needed though. Each signal has a method Calcu-
late() where it is implemented the feature that is derived from the signal (for
instance PPG calculates heart rate per minute (BPM)).
3.2.4.4. Filters Component
Filters can be added during run time and the signal is updated in real time.
Combining the Decorator and the Single Responsibility design patterns it was
possible to do this. The decorator design pattern adds the functionality im-
plemented by the filter to the signals and the Single Responsibility design
pattern is responsible for activating or deactivating filters.
3.2.4.5. Events Component
31 https://bitbucket.org/drmoistbread/acqsys
53
Events can be generated by the game being tested or manually entered by
the game researcher during the experiment. In this component, the events
are sorted and organized chronologically. Each event has a brief description
of the event and the event’s time of occurrence. These events, simplify the
work of the researcher in analysing the information after the experiment.
3.2.4.6. Data Logger Component
This component logs all the data to a comma separated value (CSV) file. The
data is: (1) the players, (2) the features extracted from each player’s signal, (3)
the events for each player and (4) a time tag, in seconds.
3.2.4.7. DrawSignal Component
Here is where all the signals are plotted on a real-time graph that then can
be displayed on the GUI. Here, the plot limits inside the GUI and the basic
manipulation of the plot (X or Y axis translation and Y axis scaling) are set.
3.2.4.8. GUI Component
This is the component that is responsible for displaying everything. In the
Unity environment, each different view of the page is called a Scene. Each
scene has its GUI manager that displays the players, the devices, the signals,
the timer, and everything else that is displayed on the screen.
3.2.5. Implementation
The acquisition software has 3 main purposes: (1) Signal Acquisition, (2) Sig-
nal Processing and (3) Signal Visualization. Each of the functionalities ended
up divided in what, inside the Unity3D software, are called Scenes. Each
Scene corresponds to a page if one is familiar with web development or
screens if one is into mobile development. This section describes each Scene
in detail and the operations that are available. Therefore, 3 Scenes emerged
during the development of this software. The first, Signal Acquisition, is
where all the signals, the players, and the connection, to hardware devices,
is added. Signal Processing, as the name suggests is the Scene where one can
add, remove and edit filters to a specific signal. Signal visualization is the main
Scene of this software. This is the scene responsible to send the physiological
information to the game and receive from it all the game information, real
time visualization of the signals and their features, logging notable events
and record the signals to a file.
3.2.5.1. Signal Acquisition Scene.
As mentioned, this is the Scene where one configures the signals to be ac-
quired. To add a new signal, 5 pieces of information are needed. The name
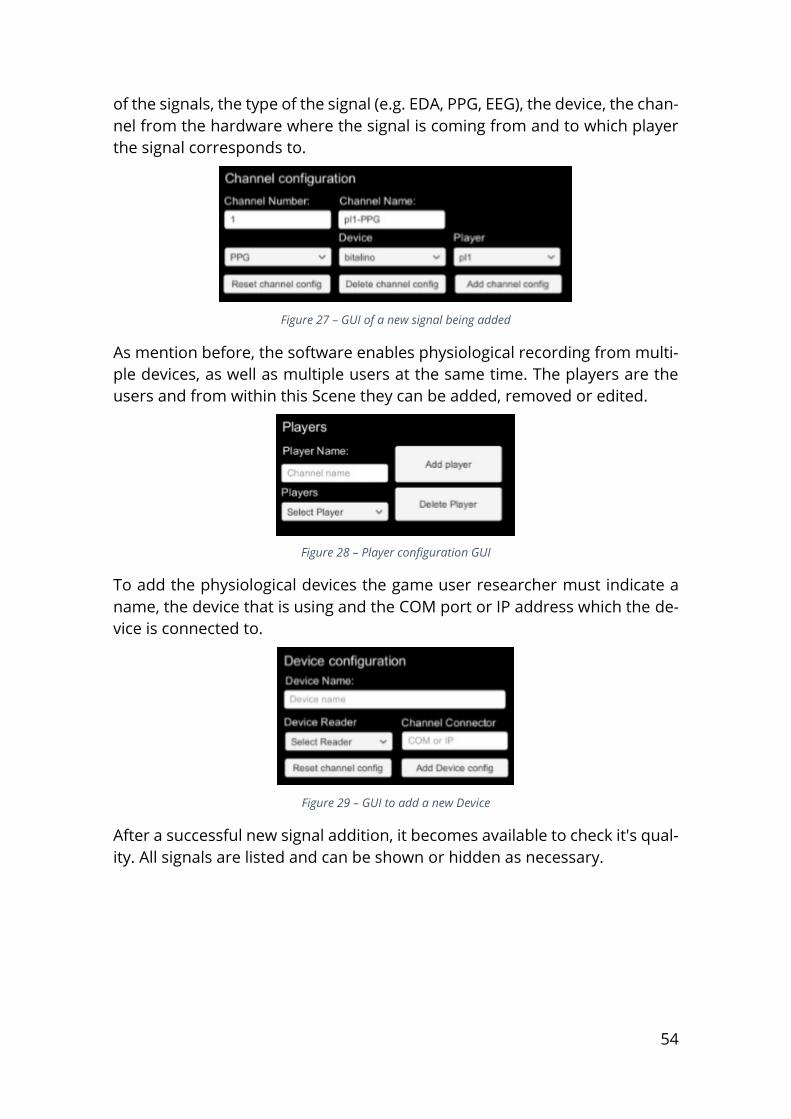
54
of the signals, the type of the signal (e.g. EDA, PPG, EEG), the device, the chan-
nel from the hardware where the signal is coming from and to which player
the signal corresponds to.
Figure 27 – GUI of a new signal being added
As mention before, the software enables physiological recording from multi-
ple devices, as well as multiple users at the same time. The players are the
users and from within this Scene they can be added, removed or edited.
Figure 28 – Player configuration GUI
To add the physiological devices the game user researcher must indicate a
name, the device that is using and the COM port or IP address which the de-
vice is connected to.
Figure 29 – GUI to add a new Device
After a successful new signal addition, it becomes available to check it's qual-
ity. All signals are listed and can be shown or hidden as necessary.

55
Figure 30 – Signal acquisition full scene
To allow such range of devices configuration, as described in section 3.2.2.,
the signals' configuration can become cumbersome if there are many de-
vices, signals and users. Moreover, having to reconfigure everything each
time a test occurs, is not optimal. Consequently, all the configurations can be
saved to an XML file which is then used to load all the configuration every
time they are needed. Additionally, configurations made on one machine can
be transported to another using this configuration file. It is possible to save
as many configurations as desired.
Figure 31 – Custom File explorer to load a saved configuration
3.2.5.2. Signal Processing
Signal Processing is the second scene of the software. In this scene is possible
to add filtering to the signals. Filters can be added and removed and the
changes are all monitored in real-time.

56
Figure 32 - Full view of the Signal Processing scene with two filters applied to PPG
This allows the researcher to maximize the quality of the signal for each user,
resulting in cleaner outputs. New filters can be added by implementing the
IFilter interface and adding the corresponding toggle in the scene.
Figure 33 - Example 2 toggles for two filters. New filter's toggle is placed here
Each signal can have as many filters added as needed. At the same time, a
real-time visualization of the extracted feature (a PPG signals extracts heart
rate values) from the signal is displayed. With this information, the researcher
can manipulate the signal, knowing how it will disrupt the feature.
It is always possible to move back to Signal Acquisition to change any of the
signals, devices or player, without losing the filters already added. When fin-
ished here, one moves to the signals visualisation that is described next.
3.2.5.3. Signal Visualisation
This is the scene where the researchers will spend most of his time. In Signal
visualization, one is similarly able to visualise the signal in real time as well as
all the features that are being extracted from the signals.

57
Figure 34 – Full view of the Signal Visualization Scene
The novelty is the Event manager and the capability to add an event and tag
the signal responses with events. There are 3 possible forms to add a new
event.
Firstly, the researcher can add events manually by clicking the button Add new
event. An input box will appear and the event message is written and saved.
It is important to note that each event saves the time of its occurrence. Con-
sidering that registering an event takes a few seconds, there would be some
difference on the time of occurrence and the time tagged on the event. To
tackle this problem the time of occurrence is saved right after the Add new
event button is clicked. This way the delay in the actual happening of an event
and the event log is the reaction time of the researcher. Another problem
that could arise is some other event happening while another is being saved.
Hence, the second possibility to add an event is using one of the ten shortcuts
available to add more frequent events. This removes the time spent adding
the message manually to every event and letting the researcher focus on the
user and not in the software. In figure 34, is possible to see the button with
the shortcuts to events. The plus sign means that there is no event associated
with that shortcut and one can be associated. When a shortcut has an event,
a number appears. Clicking on the number on the keyboard will add it. Lastly,
the game itself can send automatic and pre-determined game events to the
software. Examples of these would be a player that died, a level completed,
a rare item found. An event logger is also present in the scene where all the
events added are shown and display the time of occurrence.

58
Figure 35 - Event logger with two logs
To start this communication, a Start Recording button is available. This starts
a timer and if the software is being used to create a biofeedback game or an
affective game, the features' values are sent to the game for the game adap-
tation. The features are sent every second. Also, log files are created. One,
that saves the features every second and events that happened that second.
The other, the raw data sent by the physiological device to the software.
These logs can be used for post session data analysis. To stop the experiment
the researcher just needs to press Stop Recording and the game communi-
cation will be terminated and log files will be saved. This software is to be
used only to record and visualise signals in real-time. For offline evaluation,
other software such as OpenSignals or PhysioLab is required.
3.2.5.4. Arousal algorithm
From the EDA signal, it is possible to assess the arousal levels of a person.
The implementation of this algorithm is based on [11], which does not need
a baseline reading at rest and compare it to the data read. This eases the
process to set up the controller and reduces the time in pre-game configura-
tions. Another benefit is the simplicity of the algorithm which does not re-
quire almost any signal manipulation or separation of the signal in tonic and
phasic. In this implementation, the arousal value lies between 0 and 10. 0 is
considered relaxed and 10 is considered very aroused.
To implement this algorithm, it is needed to have the values in microsiemens,
so if they are not in the correct units it is needed to convert the values. Two
vectors are used with the same size: one that is used as a threshold and the
other saves the last 100 values from the signal. The threshold value is the
median value of the vector. Using median over EDA prevents ouliers or ate-
fects due to movement influence the result. Then if the EDA value is greater
than the (threshold + 0.05 microsiemens) then the arousal is increased and
the threshold is updated. If the EDA value is lower than the (threshold - 0.05
microsiemens) then the arousal level is decreased. To prevent a drastic in-
crease and decrease in arousal levels a timer of 3 seconds is set every time
there is an update in arousal levels.

59
The implementation can be found in Attachment 1 in this thesis. For more
detailed information visit the online repository32.
3.2.5.5. Heart rate algorithm
This algorithm works for both ECG and PPG signals. The accuracy in ECG was
not tested, though. This algorithm was adapted from the Unity 5 tutorial33
project to detect the heart rate from ECG. The first step is to find the peak.
The peaks are found using a threshold that is 70% of the maximum peak de-
tected. After a peak is detected a timer is set just to make sure that it does
not detect the same peak twice. Then, the instant HR value is calculated di-
viding 60 by peak's time. To remove hand movement, if the instant heart rate
is below 40 or above 130, the value is discarded. If not it is added to an array
that has the last 100 instant HR. The HR value outputted by the algorithm, in
BPM, is the median of the 100 previous instant HR. Using the median in place
of mean reduces the influence of big outliers. The implementation, in c#, can
be found in Attachment 2.
32 https://bitbucket.org/drmoistbread/acqsys 33 http://bitalino.com/en/learn/tutorials

60

61
4. Validation Experiment
This section is reserved for the discussion of the results of the final validation
experiment and its description. One will start with the description of the ma-
terials used on the experiment and the protocol used. Later, an analysis to
the data collected on each session and the results.
4.1. Experiment Description
This experiment serves three purposes. The first purpose is to validate the
software and hardware built during this project. This validation is done
through an affective game. The second purpose is to verify the quality of the
signals recorded and algorithms implemented (heart rate and arousal).
Lastly, a comparison between positive and negative biofeedback is done to
further investigate the effects of each form of feedback.
4.1.1. Hardware
The hardware used for the experiment was: (1) the controller built during this
thesis (Physiopad) as an input device for the game, (2) the BiosignalPlux de-
vice to record EDA an ECG, (3) a laptop to run the affective game and the
signal acquisition software developed, (4) a mobile station used to record and
save the data from the BiosignalsPlux and (5) a television that acted as mon-
itor where the game was played. The mobile station is a normal desktop com-
puter that was built on a rack with wheels and has a touchscreen display.
4.1.2. Software
The software used in this experiment was: (1) the signal acquisition software
developed in this project, (2) an affective game and (3) OpenSignals which
was used to interface with BiosignalPlux. The affective game chosen for the
experiements was Exerpong [71]. This game has been developed inside the
neurorehablab at University of Madeira and it suports physiology sent
through a UDP connection. The main goal of this game is to destroy all
colourful blocks (see Figure 36) using the ball and at the same time do not let
the ball reach the bottom of the screen. This is accomplished with the paddle
(green rectangle, Figure 36). Moving the paddle right and left and let the ball
bounce on it will send the ball back to the top to destroy some more block.
When all blocks are destroyed a new level appears. Each new level the block
are displayed differently and the game has 4 levels that cicle endlessly. On
the top right corner there is a display that shows the realtime heartrate of
the player and a threshold where the player should meet with his physiology.

62
Figure 36 - Screenshot of ExerPong
OpenSignals is an open source acquisition software in real time developed
by the Portuguese company Plux, manufacturers of the BITalino and biosig-
nalsPlux devices. The software allows to record every channel available in the
biosignalsPlux and as it was developed the same company was chosen over
other software. The software while recording displays the time elapsed and
the signals. All signals being capture are shown together as shown on Figure
37, and some can be chosen to be display individually. As a bonus the soft-
ware shows either the raw data from the device or the actual value for a cer-
tain sensor. For instance can show the raw data of the EDA signal or the EDA
signal converted to microsiemens.
Figure 37 - Snapshot of the OpenSignals software

63
4.1.1. Setup
Figure 38 displays all the hardware and software used in the experiment.
From the left, there is the mobile station with the OpenSignal, in the middle
the laptop used running the software develop and the TV running the game.
The player sat on the chair and the controller was placed in front of the sub-
ject.
Figure 38 – setup used for the validation experiment
The BiosignalsPlux was connected to the mobile station, where OpenSignal
was installed, through Bluetooth. The BiosignalsPlux was used to compare
the controller's signal quality. The two electrodes of the EDA sensor were
placed on the left wrist of all participant because it was the nearest arm to
the mobile station. The ECG sensor had its electrodes placed on the chest of
all players.
The television was connected to the laptop using an HDMI cable. The acqui-
sition software was on the laptop screen and the affective game on the tele-
vision. The controller was, also, connected to the laptop via USB.
For this experiment, all the previous mechanics were removed and 3 condi-
tions were implemented. For the adaptation, only the velocity of the ball and
size of the paddle was manipulated. Condition 1 was not affective and used
a positive feedback to increase the ball velocity every 3 seconds. Every 5 balls
lost the ball velocity was decremented in 3 units. Every time the ball touched
the paddle the paddle's size was decreased and every ball lost the paddle's
size was increased. Condition 2 and 3 used the physiology recorded with the
controller to adapt the game and for both, the heart rate values changed the

64
paddle's size and arousal the ball's velocity. Condition 2 was implemented
using, again, positive feedback and the adaptation rules are shown in figure
38. Condition 3 used negative feedback as figure 39 shows.
Figure 39 - Positive feedback algorithm to change the ball's speed and the paddle's size
Figure 40 - Negative feedback algorithm to change the ball's speed and the paddle's size
4.1.2. Protocol
In this experiment, there were 9 subjects all students or former students at
an engineering course at University of Madeira. The subjects' ages ranged
from 20 to 32 averaging 23 years old. From the 9 subject only one was a fe-
male, the remaining 8 were all men. All the subjects were experienced player
with multiple years of experience in multiplayer games and competitive gam-
ing. Some of the subjects were even game developers.
The very first thing done in each session with the subject was to explain the
porpuse of the experiment, explain the game being played and explained
how the controller worked and what data was being collected from the Physi-
opad. Also, they were explain that the biosignalsplux was being used just to
65
compare the quality of the signals and that this device was not part of the
necessary equipment required to use play the affective game. Also they were
told that they would playing four different condition, however the subject
were never informed how the physiology was manipulating the game or even
if the condition being played was using the biofeedback or not.
Every session included playing each condition for four minutes. Before each
condition, the biosignals were recorded for 1 minute to act a baseline. To
reduce bias the starting condition was changed in each session then follow-
ing an incremental order. For instance, if the session started on condition 1
the order would be condition 1, condition 2 and condition 3. If started on
condition 2, the order would go condition 2, condition 3 and condition 1.
Lastly, starting from condition 3, the order was condition 3, condition 1 and
condition 2. As explained before, condition 1 did not use biofeedback at all,
condition 2 was using positive biofeedback and condition 3 negative biofeed-
back.
After the first session every player was asked to fill a questionnaire regarding
the usability of the controller. The questionnaire chosen for this purpose was
the system usability scale, SUS. To compare the game experience in each con-
dition played and how the players perceived the game the game experience
questionnaire was used. This last questionnaire was answered by the subject
in the end of each condition being played. To ease the data processing and
the filling of each questionnaire, these were presented to the user, using
google forms, online. Both the SUS and game experience questionnaire were
anonymous and the only personal information asked was the age and gender
for statistics.
4.1.3. Questionnaires
Plus, two questionnaires were answered, the system usability scale question-
naire [72] was used to access how usable the gamepad was during gameplay.
This questionnaire was presented after the first condition tested by each
user. To access the game experience the game experience questionnaire [73]
was used. This questionnaire was answered after each condition. The ques-
tionnaire is modular and has 3 core sections. The core questionnaire itself, a
module for the social presence and a post-game analysis. There is also a
short core questionnaire to be used during the session while the game is be-
ing played. Since the game did not have any social component, the social part
of the questionnaire was discarded. Plus, the objective was to evaluate the
gameplay so only the core part of the questionnaire was used, in this exper-
iment. No questions were asked during the gameplay, so the player would

66
not lose focus nor externally influence the physiological responses. The re-
sults of the game experience questionnaire are divided in six sections: com-
petence, sensory and imaginative immersion, flow, tension / annoyance,
Challenge and Negative and positive affect. Due to the length of the ques-
tionnaire and the number of times the questionnaire is answered the immer-
sion section was, also removed, because it was not relevant for the compari-
son.
The two questionnaires used in the experiment are present in the attach-
ments section (7.) to a more detailed view of the questions asked.
4.2. Experiment Results
4.2.1. Usability
In regard to usability, as expected, the game controller scored well. To assess
the usability was used the System Usability Scale (SUS). The SUS results range
from 0 to 100, 0 not usable at all and 100 extremelly usable. The Physiopad
scored 88 out of 100. This means that the system built was highly usable and
some users reported that would use the controller at home. One user re-
ported that the BiosignalsPlux setup was much more intrusive and hard to
use and would never use a similar system, but the controller was very easy
to use.
This result shows that was possible to build a usable controller that does not
require much expertise on the field of biosignals. Contrary, to the other con-
trollers, presented in the literature review, which used custom electronics
and hardware specially built to the effect, the Physiopad, uses a commercially
available platform that can be used by anyone.
4.2.1. Game Experience
Regarding the comparison between positive and negative biofeedback it was
used the game experience questionnaire [73]. This questionnaire has 6 com-
ponents: competence, flow, tension/annoyance, challenge, negative affect
and positive affect. In figure 41 is possible to see the results of the question-
naire between both conditions.

67
Figure 41 – Game Experience Questionnaire result comparison between condition 2 and 3
Statistical analysis was done to these results applying the Wilcoxon paired
test. Competence and positive affect did not show significant differences be-
tween, but a trend can be observed. It had been theorised that competence
positive affect in negative feedback should be higher. The gaming proficiency
of the subjects could influence these results since the game difficulty increase
is not necessarily a bad thing. However, a different result could be achieved
if the user has no or little game experience. On the other side, the subjects
felt that the flow, tension and challenge were higher. Thus, in general, results
follow the literature which states positive feedback is used to increase the
player's mastery in the game. Following the increase of tension, negative af-
fect was also higher in condition 2. No significant changes between condition
2 and condition 3 components were found. More tests with a higher number
of subjects should be done to confirm the identified trends.
Now onto the analysis of the game variables. Starting with the ball speed one
can see in Figure 42 the average ball speed for the was 9.72 BPM for the pos-
itive feedback and 5.15 BPM for negative feedback. The signed paired test
revealed that this difference is significative and that the ball moves faster
with positive feedback making the game more engaging. Further, the stand-
ard deviation has a big difference between conditions. The value for positive
is 3.95 and 0.26 for negative biofeedback. This big difference is a result of
some users being relaxed while playing the positive condition which led to an
even more relaxed situation, resulting in a very low-ball velocity. In compari-
son to the non-biofeedback condition the positive feedback condition, the
ball speed was very similar and one can think that there is no difference using
biofeedback or not. However, a more detailed inspection show that the ball
speed in the positive feedback condition reached higher speeds. So, in the-
ory, the positive biofeedback was able to challenge more the players, making
the game more compelling.

68
Figure 42 -ball speed comparison between no biofeedback, positive and negative feedback
Regarding the size of the paddle, in figure 43, the positive biofeedback aver-
aged 5.72 while the negative one averaged 5.02. Though this difference is not
significant it is possible to observe that the positive condition engaged more
the user which led to higher paddle sizes. The high-level value for the nega-
tive feedback can be explained by the fact that even though the negative
feedback tends to relax the user, the players were engaged in this condition.
However, some users were so relaxed during this condition that the paddle
size was as small as 2.0. This could be due to the expertise of the user playing
the game and the dexterity developed by being avid game players. Compar-
ing the biofeedback condition to the non-biofeedback, both have significant
higher results. Using the Wilcoxon paired test to compare the non-biofeed-
back condition to the positive and negative feedback, individually, they re-
turned p-values of 0.0078 and 0.0195, respectively,

69
Figure 43-Paddle size comparison between no biofeedback, positive and negative feedback
Finally, taking lost balls into consideration one can see again big differences.
Again, using the Wilcoxon paired test to verify whether these differences
were significative or not. The non-biofeedback condition compared to the
positive feedback has a p-value of 0.0078 confirming that the difference is
significant. A similar result is observed on the comparison of the non-bio-
feedback condition with the negative feedback condition. The p-value is
0.0039. On the other hand, there are no significant differences between the
biofeedback condition, even though a noticeable trend is present. As ex-
pected the negative feedback resulted in very few balls lost, 2 balls on aver-
age. Now, if one is remembered of the ball speeds between positive feedback
and no biofeedback, where although the difference in averages were not to
different, but the individual speeds, for some users, were higher on the pos-
itive feedback, the balls lost were lower on average. This difference in almost
17 balls between condition could indicate that the positive feedback was able
to increase the difficulty, higher ball velocities, it was a difficulty that corre-
spondent to the level of the player. Also, with less lost balls the flow of the
game was less broken.

70
Figure 44 - number of lost balls in each condition
4.2.2. Electrodermal activity sensor
Another objective was to study the quality of the signal and how reliable the
readings from the gamepad were in comparison to the BiosignalsPlux hard-
ware. Starting with the EDA the objective was to find a correlation between
both signals. If there were a correlation that would mean that the Physiopad's
EDA was somehow accurate, it behaved as expected and meaningful infor-
mation could be extracted from the EDA. The MATLAB corr function [73] was
used, it returns both the correlation coefficient (rho) and the probability value
(p-value) of the two signals. The correlation coefficient indicates the correla-
tion and values range from -1 to 1. One indicates that there is a correlation,
Minus One indicates that there is an inverted correlation and 0 indicates that
there is no correlation between two signals. The p-value is the probability of
the null hypothesis that there is no correlation between two signals. If the p-
value is below 0.05 then we can refuse the null hypothesis meaning that there
is a correlation between signals.
Figure 45 shows the correlation between the EDA signal from the bioplux and
the EDA from the physiopad. As one can observe there is no meaningful cor-
relation. Some signals show an inverted correlation, however, others show
no correlation at all. A detailed inspection of each reading one can see a lot
noise in each signal. At this point, it was hypothesised that there was some
sort of crosstalk between devices. The manufacturers of the biosignals acqui-
sition devices were inquired about this possibility and they confirmed that if
two electrodes from different devices are too close some interference may
occur. Since all electrodes were placed on the left-hand palm, there is a high

71
probability of interference. Therefore, the EDA analysis of the signals should
be repeated using sensors in distant parts of the body (different hands, for
instance).
Figure 45 - biosignalsplux and physiopad's EDA correlation (p-values)
Comparing the results of the arousal levels during gameplay there were no
significant difference across conditions. Again, due to the proximity of the
EDA electrodes of both devices, a cross talk between devices is highly possi-
ble which justify these results.
Figure 46 - Arrousal values during each condition
4.2.3. Photoplethysmogram sensor
On the other hand, the results concerning the HR algorithm look promising.
The heart rate values from the software developed were tested against the
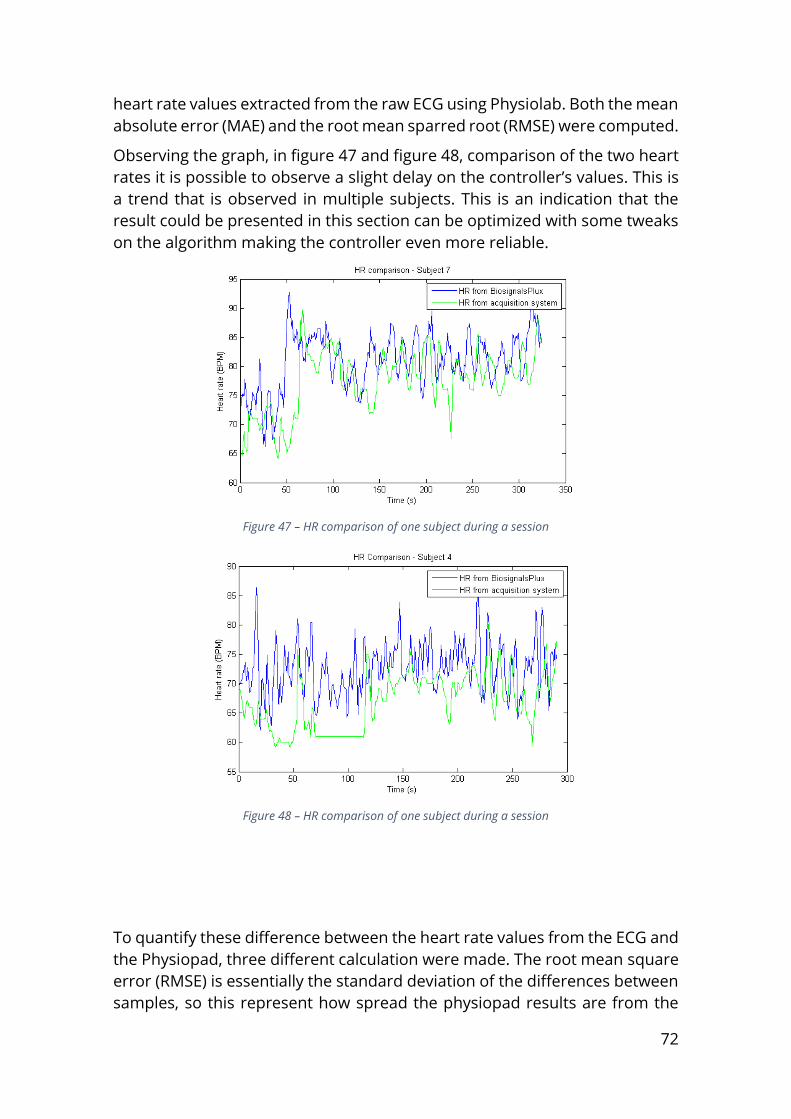
72
heart rate values extracted from the raw ECG using Physiolab. Both the mean
absolute error (MAE) and the root mean sparred root (RMSE) were computed.
Observing the graph, in figure 47 and figure 48, comparison of the two heart
rates it is possible to observe a slight delay on the controller’s values. This is
a trend that is observed in multiple subjects. This is an indication that the
result could be presented in this section can be optimized with some tweaks
on the algorithm making the controller even more reliable.
Figure 47 – HR comparison of one subject during a session
Figure 48 – HR comparison of one subject during a session
To quantify these difference between the heart rate values from the ECG and
the Physiopad, three different calculation were made. The root mean square
error (RMSE) is essentially the standard deviation of the differences between
samples, so this represent how spread the physiopad results are from the

73
ECG. The two last measures were the mean absolute error MAE and the mean
error (ME). The mean absolute error is the mean of all the absolute differ-
ences of the two signals and is always positive. Finally, the mean error is sim-
ilar to MAE but is only the difference between samples. The values can be
positive or negative and indicate if the observed value is above or below the
expected value.
Respectively, the results were 5.10 BPM, for MAE, and 9.47, for RMSE. These
results were computed using all the 27 signals recorded (9 subjects, 3 condi-
tions each) during the experiment.
The result shows that the heart rate from Physiopad is, on average, on aver-
age, off by 5 BPM. The mean error (ME) which averages -4.8 heartbeats, indi-
cates that the heart rate value is usually below the real heart value by 5 BPM.
As theorised in section 3.1.6, the heart rate algorithm was able to remove
most of the noise added by hand movements.
As explained in section 4. both the heart rate and arousal were used to ma-
nipulate game variables, hear rate changed the paddle size increasing and
decreasing it and the arousal was used to map the ball velocity. To under-
stand fully the effect of the physiology a comparison between condition was
done, regarding the game variables and, also, the physiological information.
Once again, using the Wilcoxon paired test, a statistical analysis was done to
find whether the differences were significant. Starting with the overall heart
rates values in Figure 49, which is the mean of all heart rates values during
each session, we have slightly higher values on condition two averaging 71.28
BPM while condition 3 averaged 68.99 BPM. Even though this difference is
not significant, this is the expected outcome. Also comparing the standard
deviation of the condition, one can see that the positive feedback has a
greater while negative feedback that tends to balance the actual state of the
player is lower. Condition 2 has a standard deviation of 8.36 while condition
3 value for standard deviation is 7.92.

74
Figure 49 - Heart rates comparison between conditions
On a final note, the heart rate algorithm showed promising result and prob-
ably some optimization could lead to even better performance. On EDA and
arousal, no correlation was found. More tests are needed to assert the sig-
nal's quality. Regarding positive and negative feedback, the results showed
that even though negative affect and tension was superior on positive feed-
back, positive and competence were similar in both conditions. A different
result might be seen if the subjects were not avid gamers.

75
5. Final considerations
Closing this dissertation, in this final chapter, there are the main conclusions
of the work, the limitations that this project suffered and some suggestions
of future work that could diminish issues regarding limitations or some fur-
ther investigations and studies to develop a better version of both hardware
and software.
5.1. Conclusion
The goal of this project was to build a physiological acquisition gamepad that
was non-invasive and easy-to-set-up. Along with the hardware, a software
should be developed as interface between hardware and games. This was
motivated due to the complex and expensive systems, which required exten-
sive knowledge in the physiological field.
Physiological adaptive games have been a subject of numerous studies over
the recent years. The physiological signals are divided into two types. Direct
biofeedback signals, these are the signals that can be easily manipulated by
the user, such as respiration, eye tracking or doing a certain movement.
Games that only use this type of signals are known as Biofeedback games
because the player is a direct participant in the biofeedback loop. Heart rate
or arousal levels are examples of indirect biofeedback. In this category, one
can find all the physiological signals that the user is not able to control will-
ingly. Games that use this kind of biofeedback are considered affective
games because the player is not a direct participant of the biofeedback loop.
The user is unaware of the changes made inside the game. However, as soon
as the user becomes aware of the biosignals and is able to influence them,
even an affective game becomes a simple biofeedback game.
BITalino is a physiological device built thinking about researchers and enthu-
siasts that want to acquire physiological date but have little knowledge on the
field. The BITalino team has worked to ease the use of physiological signals
embedded in day-to-day items.
Following the literature, PPG and EDA signals were chosen to the part of the
hardware to assess the heart rate and arousal during gameplay. A
PlayStation 3 controller replica as chosen as input. BITalino was used to ease
the replicability of the controller. Various tests were done to see how user
holds the controller and the best positions to place the electrodes for each
signal. Noticing that, usually the synchronization of game events and physio-
logical data is cumbersome this was one of the focus of this software. The
software is also able to record multiple players at the same time with multiple
devices connected to the same user if needed. Also, this software acts as a

76
bridge between the gamepad physiology and games to enable the creation
of affective games.
To evaluate the software and hardware a biofeedback game called ExerPong
was used. Nine subjects played 3 different conditions of the game. One con-
dition with no biofeedback and the others using either only positive biofeed-
back or only negative feedback. Also, a comparison between the Physiopad
physiological data and BiosignalsPlux was done to test the signals' accurary.
The heart rate showed promising results, being, on average only 5 heartbeats
below the real heart rate. Derived from the proximity of the Physiopad EDA
sensor and the control EDA, a lot of noise was added to the signals, therefore
more tests should be done to analyse the signal responses. Overall, the pos-
itive feedback, as the literature suggested, showed increased results in ten-
sion, in negative affective and in flow in comparison to negative feedback.
To complement this work, more test should be done to assert the EDA signal
quality and use a bigger sample that includes subjects lacking gaming expe-
rience. To facilitate the gathering of information by the researcher a second
iteration of the software should allow the researcher to choose which feature
is extracted from each signal.
5.2. Limitations
Every project is bound to some form of constrain, whether time related, num-
ber of subjects being evaluated, or even the materials that are available at
that moment, be it software or hardware related.
The lack of EDA results are the major limitation of this work. Although the
number of subjects used in the experiments could be higher, the main objec-
tive was to validate the integration of the software with the hardware which
was possible to do.
On the software side no usability test was performed. This should be done in
the future, because one can have even the best physiological input device
available but if its interface and configuration is not simple and easy to learn
it is very hard to get people using it.
5.3. Future Work
As discussed in section 4.2.2., the lack of results concerning EDA data, request
more tests. These tests should add another layer and assess positive or neg-
ative emotions. This will give better insight on why the arousal is changing as
is possible to infer what emotion the player is feeling. It is different to be
aroused because of excitement or frustration. Frustration can lead to bore-
dom meaning a decrease in arousal levels.
77
Further research should be done to make the controller wireless and the
BITalino more compact. More sensors, for instance, skin temperature or
force could be added to increase forms of adaptation during gameplay.
Tests with more interactive games which provide a richer game experience
should be encouraged to study further the positive and negative feedback.
On the side of software, more filters should be added to accommodate the
different needs each signal may require. The feature extraction could be ab-
stracted from the type of the signal. This would make possible to more easily
extract different features from each signal or even more than one feature
(e.g. HR and HVR) simultaneously. Plus, a usability test to the software should
be done do understand where one as to improve or what might still be miss-
ing.

78

79
6. References
[1] L. E. Nacke, “Games User Research and Physiological Game Evaluation,”
in Game User Experience Evaluation, Springer International, 2015, pp. 63–
86.
[2] L. E. Nacke, “An Introduction to Physiological Player Metrics for
Evaluating Games,” in Game Analytics: Maximizing the Value of Player
Data, Springer International, 2013, pp. 585–619.
[3] R. W. Homan, J. Herman, and P. Purdy, “Cerebral location of
international 10–20 system electrode placement,” Electroencephalogr.
Clin. Neurophysiol., vol. 66, no. 4, pp. 376–382, Apr. 1987.
[4] D. A. Pizzagalli, “Electroencephalography and High-Density
Electrophysiological Source Localization,” in HANDBOOK OF
PSYCHOPHYSIOLOGY, THIRD EDIT., J. T. Cacioppo, L. G. Tassinary, and G.
G. Berntson, Eds. Cambridge University Press, 2007, pp. 56–84.
[5] S. A. Israel, J. M. Irvine, A. Cheng, M. D. Wiederhold, and B. K.
Wiederhold, “ECG to identify individuals,” Pattern Recognit., vol. 38, pp.
133–142, 2005.
[6] G. A. Reyes, D. Paso, W. Langewitz, L. J. M. Mulder, A. Van Roon, and S.
Duschek, “The utility of low frequency heart rate variability as an index
of sympathetic cardiac tone: A review with emphasis on a reanalysis of
previous studies.”
[7] S. Das, S. Pal, and M. Mitra, “Real time heart rate detection from PPG
signal in noisy environment,” 2016 Int. Conf. Intell. Control. Power
Instrumentation, ICICPI 2016, pp. 70–73, 2017.
[8] D. C. Fowles, M. J. Christie, R. Edelberg, W. W. GRINGS, D. T. Lykken, and
P. H. Venables, “Publication Recommendations for Electrodermal
Measurements,” Psychophysiology, vol. 18, no. 3, pp. 232–239, May
1981.
[9] J. M. Kivikangas, I. Ekman, G. Chanel, S. Järvelä, B. Cowley, M. Salminen,
P. Henttonen, and N. Ravaja, “Review on psychophysiological methods
in game research.”
[10] D. Leiner, A. Fahr, and H. Früh, “EDA Positive Change: A Simple
Algorithm for Electrodermal Activity to Measure General Audience
Arousal During Media Exposure,” Commun. Methods Meas., vol. 6, no. 4,
pp. 237–250, 2012.
[11] L. Chittaro and R. Sioni, “Affective computing vs. Affective placebo:
Study of a biofeedback- controlled game for relaxation training,” Int. J.
Hum. Comput. Stud., vol. 72, no. 8–9, pp. 663–673, 2014.
80
[12] L. E. Nacke, “Directions in Physiological Game Evaluation and
Interaction,” CHI 2011 BBI Work. Proc., pp. 1–4, 2011.
[13] “Wii Vitality Sensor | Nintendo | FANDOM powered by Wikia.” [Online].
Available:
http://nintendo.wikia.com/wiki/Wii_Vitality_Sensor?file=Wii_Vitality_Se
nsor_-_C2.jpg. [Accessed: 06-Sep-2017].
[14] O. Kalinli-Akbacak, “108 271°,” US 20140112556 A1, 2014.
[15] D. Bersak, G. McDarby, N. Augenblick, P. McDarby, D. McDonnell, B.
McDonald, and R. Karkun, “Intelligent biofeedback using an immersive
competitive environment,” Most, no. July, 2001.
[16] J. E. Muñoz, A. Gonçalves, T. Vieira, D. Cró, Y. Chisik, and S. Bermúdez i
Badia, “Space Connection - A Multiplayer Collaborative Biofeedback
Game to Promote Empathy in Teenagers: A Feasibility Study,” Proc. 3rd
Int. Conf. Physiol. Comput. Syst., pp. 88–97, 2016.
[17] R. Bhandari, A. Parnandi, E. Shipp, B. Ahmed, and R. Gutierrez-Osuna,
“Music-based respiratory biofeedback in visually-demanding tasks.”
[18] J. Healey and R. W. Picard, “StartleCam: A Cybernetic Wearable Camera.”
[19] J. Hernandez, D. McDuff, X. Benavides, J. Amores, P. Maes, and R. Picard,
“AutoEmotive: Bringing Empathy to the Driving Experience to Manage
Stress,” Proc. 2014 companion Publ. Des. Interact. Syst. - DIS Companion
’14, pp. 53–56, 2014.
[20] F. Arafsha, K. M. Alam, and A. El Saddik, “EmoJacket: Consumer centric
wearable affective jacket to enhance emotional immersion,” 2012 Int.
Conf. Innov. Inf. Technol. IIT 2012, no. March 2014, pp. 350–355, 2012.
[21] “File:Biofeedback en.svg - Wikimedia Commons.” [Online]. Available:
https://commons.wikimedia.org/wiki/File:Biofeedback_en.svg.
[Accessed: 07-Sep-2017].
[22] R. W. Picard, “Affective Computing,” MIT Press, no. 321, pp. 1–16, 1995.
[23] L. E. Nacke, M. Kalyn, C. Lough, and R. L. Mandryk, “Biofeedback Game
Design: Using Direct and Indirect Physiological Control to Enhance
Game Interaction.”
[24] A. Dekker, “Please Biofeed the Zombies: Enhancing the Gameplay and
Display of a Horror Game Using Biofeedback.”
[25] K. Kuikkaniemi, T. Laitinen, M. Turpeinen, T. Saari, I. Kosunen, and N.
Ravaja, “The Influence of Implicit and Explicit Biofeedback in First-
Person Shooter Games.”
[26] K. Mark Gilleade, A. Dix, and J. Allanson, “Affective Videogames and

81
Modes of Affective Gaming: Assist Me, Challenge Me, Emote Me.”
[27] K. M. Gilleade and A. Dix, “Using frustration in the design of adaptive
videogames,” Proc. 2004 ACM SIGCHI Int. Conf. Adv. Comput. Entertain.
Technol., pp. 228–232, 2004.
[28] B. Bontchev, “Adaptation in affective video games: A literature review,”
Cybern. Inf. Technol., vol. 16, no. 3, pp. 3–34, 2016.
[29] G. Chanel, C. Rebetez, M. Bétrancourt, and T. Pun, “Emotion
Assessment From Physiological Signals for Adaptation of Game
Difficulty,” Syst. HUMANS, vol. 41, no. 6, 2011.
[30] L. Harmat, O. de Manzano, T. Theorell, L. Hogman, H. Fischer, and F.
Ullén, “Physiological correlates of the flow experience during computer
game playing,” Int. J. Psychophysiol., vol. 97, no. 1, pp. 1–7, 2015.
[31] R. Hunicke and V. Chapman, “AI for Dynamic Difficulty Adjustment in
Games.”
[32] C. Liu, P. Agrawal, N. Sarkar, S. Chen, and al Changchun Liu, “Dynamic
Difficulty Adjustment in Computer Games Through Real-Time Anxiety-
Based Affective Feedback Dynamic Difficulty Adjustment in Computer
Games Through Real-Time Anxiety-Based Affective Feedback DDA
Through Real-Time Affective Feedback,” Int. J. Human-Computer Interact.
INTL. J. HUMAN–COMPUTER Interact. J. Human–Computer Interact. J.
Human–Computer Interact., vol. 256, no. 6, pp. 506–529, 2009.
[33] C. Murphy, D. Chertoff, M. Guerrero, and K. Moffitt, DESIGN BETTER
GAMES! FLOW, MOTIVATION, & FUN in Design and Development of Training
Games: Practical Guidelines from a Multi-Disciplinary Perspective (chapter
five). 2013.
[34] R. Hunicke, M. LeBlanc, and R. Zubek, “MDA: A Formal Approach to
Game Design and Game Research,” Work. Challenges Game AI, pp. 1–4,
2004.
[35] R. L. Mandryk, M. Kalyn, Y. Dang, A. Doucette, B. Taylor, and S.
Dielschneider, “Turning off-the-shelf games into biofeedback games,”
in Proceedings of the 14th international ACM SIGACCESS conference on
Computers and accessibility - ASSETS ’12, 2012, p. 199.
[36] J. Van Leeuwen, P. J. Stappers, M. Lamers, and M. Thissen, “BioPong:
Adaptive Gaming Using Biofeedback,” Proc. Chi Sparks 2014 Conf., pp.
100–103, 2014.
[37] “97% of the World’s Top Universities Use BIOPAC Systems | BIOPAC.”
[Online]. Available: https://www.biopac.com/worlds-top-universities-
use-biopac-systems/. [Accessed: 08-Sep-2017].

82
[38] PLUX Wireless Biosignals S.A., “biosignalsplux Explorer - PLUX Store.”
[Online]. Available: https://store.plux.info/kits/215-biosignals-explorer-
820201001.html#/28-ac_plug_type-europe_cee_7/137-xtra_care_pack-
none/139-internal_memory-no. [Accessed: 08-Sep-2017].
[39] PLUX Wireless Biosignals S.A., “Biosignalplux - Electrocardiography
(ECG) Sensor Data Sheet.”
[40] PLUX Wireless Biosignals S.A., “Bioplux - Electrodermal Activity (EDA)
Sensor Data Sheet.”
[41] PLUX Wireless Biosignals S.A., “Electroencephalography (EEG) Sensor
Data Sheet.”
[42] PLUX Wireless Biosignals S.A., “Bioplux - Electromyography (EMG)
Sensor Data Sheet.”
[43] PLUX Wireless Biosignals S.A., “biosignalsplux - Piezoelectric
Respiration (PZT) Sensor Data Sheet.”
[44] PLUX Wireless Biosignals S.A., “biosignalsplux - Temperature (NTC)
Sensor Data Sheet.”
[45] PLUX Wireless Biosignals S.A., “Bioplux - Blood Volume Pulse (BVP)
Sensor Data Sheet.”
[46] PLUX Wireless Biosignals S.A., “bioplux - Accelerometer (ACC) Sensor
Data Sheet.”
[47] P. W. B. S.A., “OpenSignals (r)evolution Software Data Sheet.” [Online].
Available:
http://biosignalsplux.com/datasheets/OpenSignals_Datasheet.pdf.
[Accessed: 08-Sep-2017].
[48] H. P. Silva, A. Fred, and R. Martins, “Biosignals for Everyone.”
[49] H. P. Silva, J. Guerreiro, A. Lourenço, A. Fred, and R. Martins, “BITalino:
A novel hardware framework for physiological computing,” Int. Conf.
Physiol. Comput. Syst. PhyCS 2014, no. January, pp. 246–253, 2014.
[50] PLUX Wireless Biosignals S.A., “BITalino - Electromyography (EMG)
Sensor Data Sheet.”
[51] PLUX Wireless Biosignals S.A., “BITalino - Electrocardiography ( ECG )
Sensor Data Sheet,” 2015.
[52] PLUX Wireless Biosignals S.A., “Electrodermal Activity (EDA) Sensor Data
Sheet,” 2015.
[53] PLUX Wireless Biosignals S.A., “BITalino - Accelerometer ( ACC ) Sensor
Data SheeT,” 2015.

83
[54] Pulse Sensor, “Pulse Sensor Getting Started Guide,” 2015.
[55] “NeuroSky - MindWave.” [Online]. Available:
https://store.neurosky.com/pages/mindwave. [Accessed: 10-Sep-
2017].
[56] “Tech Specs | Myo Battery Life, Dimensions, Compatibility, and More.”
[Online]. Available: https://www.myo.com/techspecs. [Accessed: 10-
Sep-2017].
[57] D. Phan, L. Y. Siong, P. N. Pathirana, and A. Seneviratne, “Smartwatch:
Performance evaluation for long-term heart rate monitoring,” in 2015
International Symposium on Bioelectronics and Bioinformatics (ISBB),
2015, pp. 144–147.
[58] Sungjun Kwon, Hyunseok Kim, and Kwang Suk Park, “Validation of heart
rate extraction using video imaging on a built-in camera system of a
smartphone,” in 2012 Annual International Conference of the IEEE
Engineering in Medicine and Biology Society, 2012, pp. 2174–2177.
[59] P. H. F. Bacchini, J. O. Ferreira, and T. M. Barbosa, “Emopad: An Affective
Gamepad,” Int. J. Comput. Appl., vol. 102, no. 15, pp. 975–8887, 2014.
[60] “MSP430 Datasheet, PDF - Alldatasheet.” [Online]. Available:
http://www.alldatasheet.com/view.jsp?Searchword=Msp430&gclid=Cj
wKCAjw_8jNBRB-
EiwA96Yp1tPisDM3BJ8WgyAksH5bm7VwCYoKJynYrXH2SUk5jOWyyqim
RPlL-hoCRyMQAvD_BwE. [Accessed: 08-Sep-2017].
[61] A. Antil, “Video Game Controller Designed To Sense Emotions.” [Online].
Available: http://ashacks.blogspot.pt/2014/04/video-game-controller-
designed-to-sense.html. [Accessed: 03-Oct-2015].
[62] PLUX Wireless Biosignals S.A., “BITalino Plugged Kit Data Sheet,” p.
1000, 2015.
[63] J. E. Muñoz, E. R. Gouveia, M. S. Cameirão, and S. Bermudez i Badia,
“PhysioLab - a multivariate physiological computing toolbox for ECG,
EMG and EDA signals: a case of study of cardiorespiratory fitness
assessment in the elderly population,” Multimed. Tools Appl., no. July, pp.
1–26, 2017.
[64] “Moto 360 | Motorola.” [Online]. Available:
https://www.motorola.com.au/products/moto-360. [Accessed: 10-Sep-
2017].
[65] “Resize image - MATLAB imresize.” [Online]. Available:
https://www.mathworks.com/help/images/ref/imresize.html.
[Accessed: 10-Sep-2017].

84
[66] “Where should I place the EDA electrodes? - BITalino Forum.” [Online].
Available: http://forum.bitalino.com/viewtopic.php?t=99. [Accessed:
11-Sep-2017].
[67] A. M. Davis, “Operational prototyping: a new development approach,”
IEEE Softw., vol. 9, no. 5, pp. 70–78, Sep. 1992.
[68] A. Blanch, F. Balada, and A. Aluja, “ARTICLE IN PRESS Presentation and
AcqKnowledge: An application of software to study human emotions
and individual differences,” Methods Programs Biomed, 2012.
[69] “Repidly: A Lightweight Tool for the Collaborative Analysis of Biosignals
and Gameplay Videos.” [Online]. Available:
https://medium.com/human-computer-interaction-and-games-
research/repidly-a-lightweight-tool-for-the-collaborative-analysis-of-
biosignals-and-gameplay-videos-db687a8a098.
[70] E. M. Peck, E. Easse, N. Marshall, W. Stratton, and L. F. Perrone, “FlyLoop:
A Micro Framework for Rapid Development of Physiological Computing
Systems.”
[71] C. Paper, J. E. Mu, M. Interactiv, S. Berm, and B. Universidade,
“Modulation of Physiological Responses and Activity Levels During
Exergame Experiences Modulation of Physiological Responses and
Activity Levels During Exergame Experiences,” no. September, 2016.
[72] J. Brooke, “SUS - A quick and dirty usability scale,” Usability Eval. Ind., vol.
189, no. 194, pp. 4–7, 1996.
[73] W. a. IJsselsteijn, Y. a. W. de Kort, and K. Poels, “Game Experience
Questionnaire,” pp. 1–9, 2013.

85
7. Attachments
7.1. Arousal algorithm public float Calculate() { _threshold = GetThreshold(); foreach (double signal in GetBuffer()) { double resistance = 1 - (signal / 1024); double edaValue = 1 / resistance; UpdateArousalLevels(edaValue); updatePreviousBuffer(edaValue); } return Arousal; } private void UpdateArousalLevels(double edaValue) { if (!_updatedBuffer[bufferSize - 1].HasValue) return; if (edaValue > _threshold + 0.05 && _lastArousalUpdateInSeconds + 3 < _timeInSeconds) { _lastArousalUpdateInSeconds = _timeInSeconds; Arousal++; if (Arousal > 10) Arousal = 10; Array.Copy(_updatedBuffer, 0, _bufferToCompare, 0, _bufferToCom-pare.Length - 1); _threshold = GetThreshold(); } else if (edaValue < _threshold - 0.05 && _lastArousalUpdateInSeconds + 3 < _timeInSeconds) { _lastArousalUpdateInSeconds = _timeInSeconds; Arousal--; if (Arousal < 0) Arousal = 0; Array.Copy(_updatedBuffer, 0, _bufferToCompare, 0, _bufferToCom-pare.Length - 1); _threshold = GetThreshold(); } else if (_updatedBuffer.Average() == 1f) { Arousal = 0; } } private void updatePreviousBuffer(double signal) { if (!_updatedBuffer[bufferSize - 1].HasValue) { for (int i = 0; i < bufferSize; i++) { if (!_updatedBuffer[i].HasValue) { _updatedBuffer[i] = signal; break; ; }

86
} } else { Array.Copy(_updatedBuffer, 1, _updatedBuffer, 0, bufferSize - 1); _updatedBuffer[bufferSize - 1] = signal; } } private double GetThreshold() { if (!_updatedBuffer[bufferSize - 1].HasValue) return 0; return Mean.Calculate(_bufferToCompare); //return _bufferToCompare.Average(); }
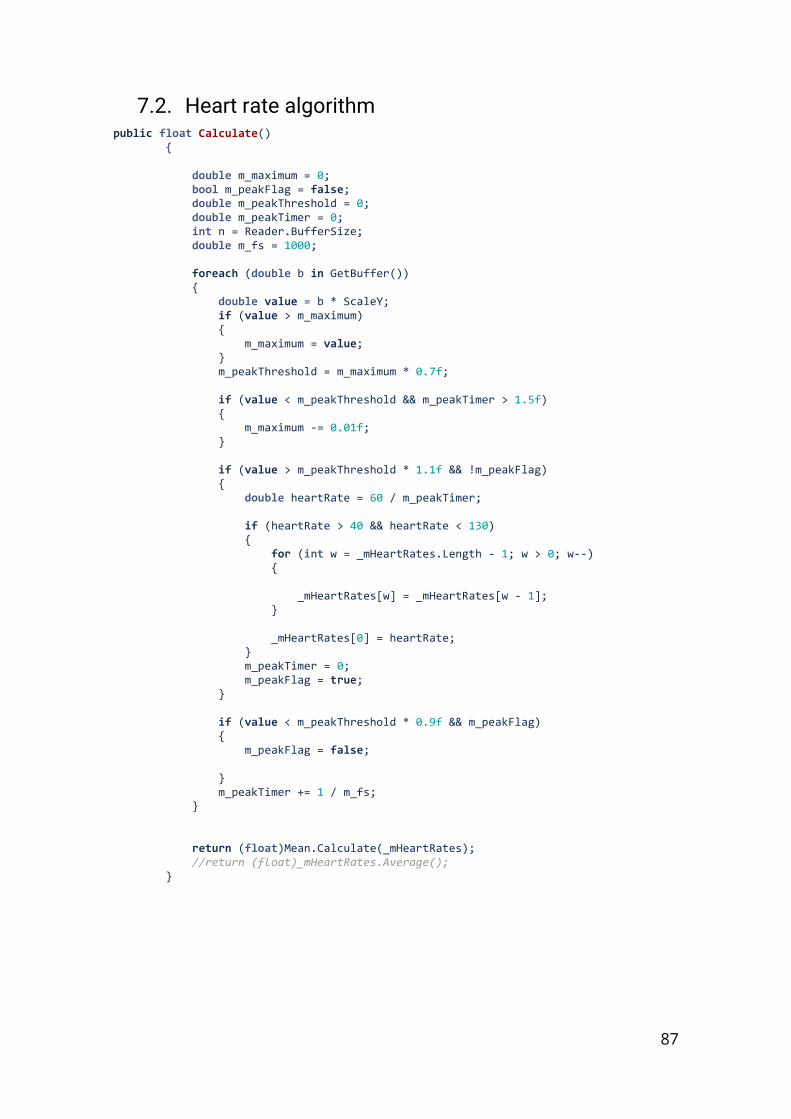
87
7.2. Heart rate algorithm public float Calculate() { double m_maximum = 0; bool m_peakFlag = false; double m_peakThreshold = 0; double m_peakTimer = 0; int n = Reader.BufferSize; double m_fs = 1000; foreach (double b in GetBuffer()) { double value = b * ScaleY; if (value > m_maximum) { m_maximum = value; } m_peakThreshold = m_maximum * 0.7f; if (value < m_peakThreshold && m_peakTimer > 1.5f) { m_maximum -= 0.01f; } if (value > m_peakThreshold * 1.1f && !m_peakFlag) { double heartRate = 60 / m_peakTimer; if (heartRate > 40 && heartRate < 130) { for (int w = _mHeartRates.Length - 1; w > 0; w--) { _mHeartRates[w] = _mHeartRates[w - 1]; } _mHeartRates[0] = heartRate; } m_peakTimer = 0; m_peakFlag = true; } if (value < m_peakThreshold * 0.9f && m_peakFlag) { m_peakFlag = false; } m_peakTimer += 1 / m_fs; } return (float)Mean.Calculate(_mHeartRates); //return (float)_mHeartRates.Average(); }

88
7.3. EDA correlation table
# Correlation coefficient RHO P-value
1 0.00 0.69
2 -0.08 0.00
3 0.01 0.00
4 0.01 -0.01
5 0.00 0.60
6 0.00 0.09
7 0.34 0.00
8 0.63 0.00
9 -0.62 0.00
10 0.00 0.99
11 0.00 0.61
12 0.00 0.27
13 0.21 0.00
14 0.17 0.00
15 0.00 0.27
16 -0.70 0.00
17 0.44 0.00
18 0.24 0.00
19 0.09 0.00
20 0.00 0.14
21 0.00 -0.02
22 -0.29 0.00
23 -0.65 0.00
24 -0.82 0.00
25 -0.66 0.00
26 -0.82 0.00
27 0.56 0.00
Table 1 - Correlation between EDA from biopluxsignals and Phyiopad’s EDA

89
7.4. System usability scale Questionnaire

90
7.5. Game experience questionnaire
Top Related