


Languages
Pages
Legal


Health Inequities in British Columbia
Discussion Paper
November 2008

Health Inequities in British Columbia: Discussion Paper
2
This discussion paper is being distributed by the Health
Offi cers Council of BC.
See Publications at www.phabc.org
Purpose of this Document:
The intent of this paper is to use BC data to describe
health inequities in this province, and to discuss
policy options that offer the greatest opportunities to
effectively address those inequities.
Acknowledgements:
This paper draws on many local, national and
international sources for which we are grateful. We are
thankful for the feedback and consultation provided by
BC’s public health community and the wide variety of
stakeholders interested in addressing health inequities.
PHS003-019

Health Inequities in British Columbia: Discussion Paper
3
Table of Contents
Acronyms . . . . . . . . . . . . . . . . . . . . . . . . . . . . . . . . . . . . . . . . . . . . . . . . . . . . . . . . . . . . 6
Executive Summary . . . . . . . . . . . . . . . . . . . . . . . . . . . . . . . . . . . . . . . . . . . . . . . . . . . . 7
The Concept of Health Inequity . . . . . . . . . . . . . . . . . . . . . . . . . . . . . . . . . . . . . . . . . . . . . . . . . . . . .7
Health Inequities in British Columbia . . . . . . . . . . . . . . . . . . . . . . . . . . . . . . . . . . . . . . . . . . . . . . . . .8
Determinants of Health and Health Inequities . . . . . . . . . . . . . . . . . . . . . . . . . . . . . . . . . . . . . . . . . . .8
The Case for Addressing Health Inequities . . . . . . . . . . . . . . . . . . . . . . . . . . . . . . . . . . . . . . . . . . . . .9
Health Care Expenditures vs. Investments in Other Social Programs . . . . . . . . . . . . . . . . . . . . . . . . .9
The Benefi ts of Addressing Health Inequities . . . . . . . . . . . . . . . . . . . . . . . . . . . . . . . . . . . . . . . . . .10
Demonstrated Success Around the World . . . . . . . . . . . . . . . . . . . . . . . . . . . . . . . . . . . . . . . . . . . .10
Guiding Principles & Key Policy Considerations in Addressing Health Inequities . . . . . . . . . . . . . . . .10
Policy Options for Consideration . . . . . . . . . . . . . . . . . . . . . . . . . . . . . . . . . . . . . . . . . . . . . . . . . . . .11
Purpose of this Report . . . . . . . . . . . . . . . . . . . . . . . . . . . . . . . . . . . . . . . . . . . . . . . . 15
Limitations . . . . . . . . . . . . . . . . . . . . . . . . . . . . . . . . . . . . . . . . . . . . . . . . . . . . . . . . . 16
I. What are Health Inequities? . . . . . . . . . . . . . . . . . . . . . . . . . . . . . . . . . . . . . . . . . . . 17
Social Gradients in Health and Health Risks . . . . . . . . . . . . . . . . . . . . . . . . . . . . . . . . . . . . . . . . . . . . .18
Determinants of Health and Health Inequities . . . . . . . . . . . . . . . . . . . . . . . . . . . . . . . . . . . . . . . . . . . .18
Upstream (Structural) Social Determinants of Health . . . . . . . . . . . . . . . . . . . . . . . . . . . . . . . . . . . . .21
Downstream Social Determinants of Health . . . . . . . . . . . . . . . . . . . . . . . . . . . . . . . . . . . . . . . . . . .22
‘Reverse Causality’ . . . . . . . . . . . . . . . . . . . . . . . . . . . . . . . . . . . . . . . . . . . . . . . . . . . . . . . . . . . . . .23
A Lesson for Policymakers: Focusing on the Upstream . . . . . . . . . . . . . . . . . . . . . . . . . . . . . . . . . . . .25
II. Health Inequities in British Columbia . . . . . . . . . . . . . . . . . . . . . . . . . . . . . . . . . . . . 27
The ‘BC Paradox’ . . . . . . . . . . . . . . . . . . . . . . . . . . . . . . . . . . . . . . . . . . . . . . . . . . . . . . . . . . . . . . . . .27
Inequities in BC . . . . . . . . . . . . . . . . . . . . . . . . . . . . . . . . . . . . . . . . . . . . . . . . . . . . . . . . . . . . . . . . . . .28
Inequities in Life Expectancy by Geographic Location . . . . . . . . . . . . . . . . . . . . . . . . . . . . . . . . . . .28
Inequities in Income . . . . . . . . . . . . . . . . . . . . . . . . . . . . . . . . . . . . . . . . . . . . . . . . . . . . . . . . . . . . .29
Inequities in the Prevalence of Chronic Disease . . . . . . . . . . . . . . . . . . . . . . . . . . . . . . . . . . . . . . . .37
Inequities in Mental Wellness . . . . . . . . . . . . . . . . . . . . . . . . . . . . . . . . . . . . . . . . . . . . . . . . . . . . . .39
Inequities in Self-perceptions of Health . . . . . . . . . . . . . . . . . . . . . . . . . . . . . . . . . . . . . . . . . . . . . . .41
Inequities in Perceptions of Unmet Health Needs . . . . . . . . . . . . . . . . . . . . . . . . . . . . . . . . . . . . . .42
Health Inequities in British Columbia: Discussion Paper
4
Inequities in Accessing Services . . . . . . . . . . . . . . . . . . . . . . . . . . . . . . . . . . . . . . . . . . . . . . . . . . . .43
Inequities in Behavioural Risk Factors . . . . . . . . . . . . . . . . . . . . . . . . . . . . . . . . . . . . . . . . . . . . . .44
III. The Case for Addressing Health Inequities . . . . . . . . . . . . . . . . . . . . . . . . . . . . . . . . 48
General Economic Impact of Health Inequities . . . . . . . . . . . . . . . . . . . . . . . . . . . . . . . . . . . . . . . . . . . .48
Chronic Disease . . . . . . . . . . . . . . . . . . . . . . . . . . . . . . . . . . . . . . . . . . . . . . . . . . . . . . . . . . . . . . . . . .49
Poverty . . . . . . . . . . . . . . . . . . . . . . . . . . . . . . . . . . . . . . . . . . . . . . . . . . . . . . . . . . . . . . . . . . . . . . . . .49
Food Insecurity . . . . . . . . . . . . . . . . . . . . . . . . . . . . . . . . . . . . . . . . . . . . . . . . . . . . . . . . . . . . . . . . . . .49
Lack of Access to Education and Low Literacy . . . . . . . . . . . . . . . . . . . . . . . . . . . . . . . . . . . . . . . . . . .51
Education . . . . . . . . . . . . . . . . . . . . . . . . . . . . . . . . . . . . . . . . . . . . . . . . . . . . . . . . . . . . . . . . . . . . .51
Literacy . . . . . . . . . . . . . . . . . . . . . . . . . . . . . . . . . . . . . . . . . . . . . . . . . . . . . . . . . . . . . . . . . . . . . .51
Early Childhood Development: Unequal Opportunities, Unequal Outcomes . . . . . . . . . . . . . . . . . . . . .52
Inadequate Housing, Homelessness and Unhealthy Communities . . . . . . . . . . . . . . . . . . . . . . . . . . . . .53
Inadequate Housing . . . . . . . . . . . . . . . . . . . . . . . . . . . . . . . . . . . . . . . . . . . . . . . . . . . . . . . . . . . . .53
Homelessness . . . . . . . . . . . . . . . . . . . . . . . . . . . . . . . . . . . . . . . . . . . . . . . . . . . . . . . . . . . . . . . . .53
Unhealthy Communities . . . . . . . . . . . . . . . . . . . . . . . . . . . . . . . . . . . . . . . . . . . . . . . . . . . . . . . . . .54
Failure of Underregulated Market Mechanisms . . . . . . . . . . . . . . . . . . . . . . . . . . . . . . . . . . . . . . . . . . .55
Health Care Expenditures vs. Investments in Other Social Programs . . . . . . . . . . . . . . . . . . . . . . . . . . .56
The Cost of Inaction . . . . . . . . . . . . . . . . . . . . . . . . . . . . . . . . . . . . . . . . . . . . . . . . . . . . . . . . . . . . . . .58
Benefi ts of Addressing Inequities . . . . . . . . . . . . . . . . . . . . . . . . . . . . . . . . . . . . . . . . . . . . . . . . . . . . . .58
IV. Health Inequity Policy Considerations . . . . . . . . . . . . . . . . . . . . . . . . . . . . . . . . . . 60
Success in Other Jurisdictions. . . . . . . . . . . . . . . . . . . . . . . . . . . . . . . . . . . . . . . . . . . . . . . . . . . . . . . .60
The UK . . . . . . . . . . . . . . . . . . . . . . . . . . . . . . . . . . . . . . . . . . . . . . . . . . . . . . . . . . . . . . . . . . . . . . .60
Sweden . . . . . . . . . . . . . . . . . . . . . . . . . . . . . . . . . . . . . . . . . . . . . . . . . . . . . . . . . . . . . . . . . . . . . .61
Ireland . . . . . . . . . . . . . . . . . . . . . . . . . . . . . . . . . . . . . . . . . . . . . . . . . . . . . . . . . . . . . . . . . . . . . . .62
Other Jurisdictions . . . . . . . . . . . . . . . . . . . . . . . . . . . . . . . . . . . . . . . . . . . . . . . . . . . . . . . . . . . . . .62
Success in Canada . . . . . . . . . . . . . . . . . . . . . . . . . . . . . . . . . . . . . . . . . . . . . . . . . . . . . . . . . . . . . . . .63
Quebec . . . . . . . . . . . . . . . . . . . . . . . . . . . . . . . . . . . . . . . . . . . . . . . . . . . . . . . . . . . . . . . . . . . . . .63
Newfoundland & Labrador . . . . . . . . . . . . . . . . . . . . . . . . . . . . . . . . . . . . . . . . . . . . . . . . . . . . . . . .64
National Public Pensions . . . . . . . . . . . . . . . . . . . . . . . . . . . . . . . . . . . . . . . . . . . . . . . . . . . . . . . . .64
Guiding Principles and Key Considerations for Addressing Health Inequities in BC . . . . . . . . . . . . . . . .65
Guiding Principles . . . . . . . . . . . . . . . . . . . . . . . . . . . . . . . . . . . . . . . . . . . . . . . . . . . . . . . . . . . . . . .65

Health Inequities in British Columbia: Discussion Paper
5
Key Considerations . . . . . . . . . . . . . . . . . . . . . . . . . . . . . . . . . . . . . . . . . . . . . . . . . . . . . . . . . . . . .65
V. Policy Options for Reducing Health Inequities . . . . . . . . . . . . . . . . . . . . . . . . . . . . . 67
1. Income & Food Security . . . . . . . . . . . . . . . . . . . . . . . . . . . . . . . . . . . . . . . . . . . . . . . . . . . . . . . . . .68
Income . . . . . . . . . . . . . . . . . . . . . . . . . . . . . . . . . . . . . . . . . . . . . . . . . . . . . . . . . . . . . . . . . . . . . . .68
Food . . . . . . . . . . . . . . . . . . . . . . . . . . . . . . . . . . . . . . . . . . . . . . . . . . . . . . . . . . . . . . . . . . . . . . .69
2. Education and Literacy . . . . . . . . . . . . . . . . . . . . . . . . . . . . . . . . . . . . . . . . . . . . . . . . . . . . . . . . . . .69
3. Early Childhood Development . . . . . . . . . . . . . . . . . . . . . . . . . . . . . . . . . . . . . . . . . . . . . . . . . . . . .70
4. Housing & Healthy Built Environments . . . . . . . . . . . . . . . . . . . . . . . . . . . . . . . . . . . . . . . . . . . . . . . .71
Housing . . . . . . . . . . . . . . . . . . . . . . . . . . . . . . . . . . . . . . . . . . . . . . . . . . . . . . . . . . . . . . . . . . . . . .71
Healthy Built Environments . . . . . . . . . . . . . . . . . . . . . . . . . . . . . . . . . . . . . . . . . . . . . . . . . . . . . . . .72
5. Health Care . . . . . . . . . . . . . . . . . . . . . . . . . . . . . . . . . . . . . . . . . . . . . . . . . . . . . . . . . . . . . . . . . . . .72
VI. Conclusion . . . . . . . . . . . . . . . . . . . . . . . . . . . . . . . . . . . . . . . . . . . . . . . . . . . . . . . 74
Appendix 1 . . . . . . . . . . . . . . . . . . . . . . . . . . . . . . . . . . . . . . . . . . . . . . . . . . . . . . . . . . 76
A Framework for Action . . . . . . . . . . . . . . . . . . . . . . . . . . . . . . . . . . . . . . . . . . . . . . . . . . . . . . . . . . . . .76
The Commission’s Principles of Action . . . . . . . . . . . . . . . . . . . . . . . . . . . . . . . . . . . . . . . . . . . . . . .76
The Commission’s Overarching Recommendations . . . . . . . . . . . . . . . . . . . . . . . . . . . . . . . . . . . . .77
References . . . . . . . . . . . . . . . . . . . . . . . . . . . . . . . . . . . . . . . . . . . . . . . . . . . . . . . . . . 78

Health Inequities in British Columbia: Discussion Paper
6
Acronyms
CFAI . . . . . . . . . . . . . . . . . . . . . . . . . . . . . . . . . . . . . . . . . . . . . . . Community Food Action Initiative (BC)
CPP . . . . . . . . . . . . . . . . . . . . . . . . . . . . . . . . . . . . . . . . . . . . . . . . . . . . . . . . . . . . Canada Pension Plan
CSDH . . . . . . . . . . . . . . . . . . .Commission on Social Determinants of Health (World Health Organization)
CVD . . . . . . . . . . . . . . . . . . . . . . . . . . . . . . . . . . . . . . . . . . . . . . . . . . . . . . . . . . . cardiovascular disease
ECD . . . . . . . . . . . . . . . . . . . . . . . . . . . . . . . . . . . . . . . . . . . . . . . . . . . . . . early childhood development
EU . . . . . . . . . . . . . . . . . . . . . . . . . . . . . . . . . . . . . . . . . . . . . . . . . . . . . . . . . . . . . . . . . . European Union
GBA . . . . . . . . . . . . . . . . . . . . . . . . . . . . . . . . . . . . . . . . . . . . . . . . . gender and diversity-based analysis
GDP . . . . . . . . . . . . . . . . . . . . . . . . . . . . . . . . . . . . . . . . . . . . . . . . . . . . . . . . . . gross domestic product
GIS . . . . . . . . . . . . . . . . . . . . . . . . . . . . . . . . . . . . . . . . . . . . . Guaranteed Income Supplement (Canada)
LEo . . . . . . . . . . . . . . . . . . . . . . . . . . . . . . . . . . . . . . . . . . . . . . . . . . . . . . . . . . . . . . . . . . life expectancy
NGO . . . . . . . . . . . . . . . . . . . . . . . . . . . . . . . . . . . . . . . . . . . . . . . . . . . . .non-governmental organization
NHS . . . . . . . . . . . . . . . . . . . . . . . . . . . . . . . . . . . . . . . . . . . . . . . . . . . . . . . National Health Service (UK)
OAS . . . . . . . . . . . . . . . . . . . . . . . . . . . . . . . . . . . . . . . . . . . . . . . . . . . . . . . . Old Age Security (Canada)
OECD . . . . . . . . . . . . . . . . . . . . . . . . . . . . . . . Organization for Economic Cooperation and Development
PHAC . . . . . . . . . . . . . . . . . . . . . . . . . . . . . . . . . . . . . . . . . . . . . . . . . . .Public Health Agency of Canada
PHO . . . . . . . . . . . . . . . . . . . . . . . . . . . . . . . . . . . . . . . . . . . . . . . . . . . . . . Provincial Health Offi cer (BC)
PHSA . . . . . . . . . . . . . . . . . . . . . . . . . . . . . . . . . . . . . . . . . . . . .Provincial Health Services Authority (BC)
QPP . . . . . . . . . . . . . . . . . . . . . . . . . . . . . . . . . . . . . . . . . . . . . . . . . . . . Quebec Pension Plan (Canada)
SDH . . . . . . . . . . . . . . . . . . . . . . . . . . . . . . . . . . . . . . . . . . . . . . . . . . . . . . social determinants of health
SPA . . . . . . . . . . . . . . . . . . . . . . . . . . . . . . . . . . . . . . . . . . . . . . . . . . . . . . .Spouse’s Allowance (Canada)
WHO . . . . . . . . . . . . . . . . . . . . . . . . . . . . . . . . . . . . . . . . . . . . . . . . . . . . . . . . World Health Organization

Health Inequities in British Columbia: Discussion Paper
7
Executive Summary
The World Health Organization (WHO) Commission on Social Determinants of Health and Canada’s Chief
Public Health Offi cer have both recently issued reports on health inequities.
This discussion paper is intended to contribute to a better understanding of health inequities and the extent
to which they exist in British Columbia, support informed discussion about health inequities among a broad
range of audiences, and promote consideration of policy approaches for tackling this issue. It is not intended
to be a comprehensive literature review. In addition to the WHO and Canada’s Chief Public Health Offi cer,
many well-known and respected national and international offi ces and organizations have produced such
reviews and this report has drawn heavily from those existing pieces of work.
The intent of this paper is to use BC data to describe the existing of health inequities in this province, and to
discuss policy options that offer the greatest opportunities to effectively address those inequities.
The Concept of Health Inequity
Inequities in health are the focus of this paper. Such inequities concern systematic differences in health
status between different socioeconomic groups. But what exactly does that entail, and what is the difference
between health inequalities, disparities, and inequities (three terms that are often used interchangeably)?
Within any country, differences in health can be observed across the population. Genetic and constitutional
variations ensure that the health of individuals varies, as it does for any other physical characteristic. The
prevalence of ill health also differs between different age groups, with older people tending to be sicker than
younger people, due to the natural ageing process. Biologically, women in older industrialized countries
demonstrate an advantage in survival over men at every stage of life.
These types of unavoidable differences are considered health inequalities or disparities. A genetic
predisposition to heart disease or diabetes, for example, is not more likely to exist among people in Prince
George than in Burnaby, or among people earning minimum wage compared to millionaires in the province.
The World Health Organization (WHO) defi nes health equity as “the absence of unfair and avoidable
or remediable differences in health among populations or groups defi ned socially, economically,
demographically or geographically.”
Using the WHO defi nition, British Columbia could be said to have health equity if the general health of people
throughout the province was not unduly affected by where they live or their position within the socioeconomic
hierarchy. Regardless of whether you were a sales manager on Vancouver Island, a forestry worker in the
Cariboo, a bank teller in the Okanagan, or an unemployed individual in Vancouver, your chances for enjoying
good health and reaching the normal life expectancy for people of your sex in the province would be about
the same.
Health Inequities in British Columbia: Discussion Paper
8
Health Inequities in British Columbia
As demonstrated in the data presented in this report, BC’s population does not have health equity. In
this province, as in other jurisdictions in the developed world, health tends to be unevenly distributed
among social groups within the population on a gradient corresponding to socioeconomic status. The
data in this report show that, in general, people from more advantaged socioeconomic groups enjoy
longer life expectancy and better health than people from less advantaged groups. Inequities are refl ected
by consistent differences in the prevalence of chronic diseases (e.g., heart disease, kidney disease and
diabetes) among people from the highest and lowest income and education groups across the province; the
lower a person is on the socioeconomic hierarchy, the greater their risk of developing these diseases.
While on the whole, British Columbians are among the healthiest people in the world, there is a relatively
large number of disadvantaged people in the province – the unemployed and working poor, children and
families living in poverty, people with addictions and/or mental illness, Aboriginal people, new immigrants, the
homeless, and others – all of whom experience signifi cantly lower levels of health than the average British
Columbian. In fact, BC has the highest rates of poverty (particularly child poverty) in Canada. This presents
a paradox: despite having by some measures the best overall health outcomes in Canada, BC also has the
highest rates of socioeconomic disadvantage in the country. This ‘BC paradox’ can be explained by two
factors:
The overall average health status data in BC for measures such as life expectancy do not reveal the 1.
signifi cant inequities that exist within the province. For example, there is a ten year difference in life
expectancy for people in Richmond compared to people in the downtown eastside of Vancouver.
BC has not always been behind the rest of the country in measures such as childhood poverty rates. It 2.
is only over the past decade that BC has fallen behind the other provinces, to a large extent because
of proactive and successful anti-poverty strategies introduced in provinces such as Quebec and
Newfoundland. The overall poverty rates in BC families have been relatively stable over the last ten years
(except for lone-parent families). But, in the coming years, as we start to see expected health status
improvements in the provinces that have been more aggressive in reducing poverty (it is likely too early to
see those improvements just yet), BC is also likely to fall behind in its average health status as well.
Determinants of Health and Health Inequities
According to the WHO Commission on the Social Determinants of Health “the poor health of the poor, the
social gradients in health within countries and the marked health inequities between countries are caused by
the unequal distribution of power, income, goods and services.”
To fully understand why there is unequal distribution of money, power, material goods and services, one
needs to look further upstream, at the structural roots of health inequities – within the education, taxation
and health care systems, in labour and housing markets, and in urban planning and government regulation.
These structural components of our socioeconomic system shape the differential vulnerability of people to
health-affecting conditions and are powerful determinants of health.

Health Inequities in British Columbia: Discussion Paper
9
Unlike the behavioural determinants of health (downstream factors), these upstream factors are ones over
which individuals have no direct personal control, but which can only be altered through social and economic
policies and political processes. A ‘real life’ example will help demonstrate the importance of addressing
upstream factors.
The Case for Addressing Health Inequities
In addition to the strong moral argument for addressing health inequities based on principles of social justice
and equality, a powerful economic case can be made for reducing the gap in health status between the
richest and poorest sectors of our society. This case involves recognizing the substantial social, economic
and political costs associated with widespread inequities in health, and the benefi t of improved overall health
for individuals, communities and society as a whole.
A recent report that focused on identifying the cost of poverty in the US concluded that the total cost of
poverty was estimated to be $1.5 trillion in 2005 US dollars. In European research, health inequities-related
losses are estimated to be €1 trillion per year in the EU, or 9.4 percent of GDP. In terms of a local estimate,
the BC Healthy Living Alliance has estimated that three major risk factors associated with poverty and health
inequity (tobacco use, physical inactivity and overweight/obesity) cost the BC economy approximately $3.8
billion annually. If we extrapolate a high level estimate of the proportion of health care costs in BC attributable
to inequities by calculating 20% of the total annual health care spending in BC ($13 billion) we also get a very
high number ($2.6 billion annually).
Health Care Expenditures vs. Investments in Other Social Programs
What is the solution to reducing health inequities related costs? It has been noted that the level of
expenditure on health care is not necessarily a dominant factor in determining the health of a population. This
observation is well supported by comparing Cuba and the United States on life expectancy and health care
spending. Cuba, with an average life expectancy of 77.1 years, is ranked 28th in the world, just behind the
US (78.0 years). However, the annual per capita spending on health care in Cuba is among the lowest in the
world; at $186 it is a small fraction of the $4500 per person spent in the US.
It appears that simply spending more money on health care is not the most effective strategy for increasing
the overall health of a population. The Public Health Agency of Canada (PHAC) has reached this same
conclusion. PHAC has stated that “there is mounting evidence that the contribution of medicine and health
care is quite limited, and that spending more on health care will not result in signifi cant further improvements
in population health. On the other hand, there are strong and growing indications that other factors such as
living and working conditions are crucially important for a healthy population.”
Canadian senator Wilbert Keon, co-chair of the Senate Standing Committee on Social Affairs, Science &
Technology, has taken this line of thinking one step further. He has gone so far as to call increased health
care spending a threat to population health:

Health Inequities in British Columbia: Discussion Paper
10
“…increased expenditures on health care are likely impacting negatively on the general health of our
population by virtue of diminished investments in other areas like education (especially early childhood
education), public housing, income security and other public services.”
Senator Wilbert J. Keon
Quoted in The Hill Times, 2008
The Benefi ts of Addressing Health Inequities
Evidence and experience have shown that action on reducing health inequities has many potential benefi ts
for the health system, health outcomes and the overall quality of life of Canadians in the following three ways.
Given that there is a gradient of health status across the entire range of socio-economic determinants, 1.
addressing health inequities will improve the health of all.
Better health enables more people to participate in the economy, reducing the costs of lost productivity. 2.
Healthier employees, customers and communities will positively affect economic growth and the fi nancial
bottom line of BC companies by increasing competitiveness, productivity and profi tability.
A further advantage of addressing health inequities is the potential for stemming the rapid increase 3.
in usage of health services. Easing the demand for services would decrease system cost drivers,
reduce pressures on the delivery of health services, and, over the long term, contribute to the fi nancial
sustainability of our health care system.
Demonstrated Success Around the World
While health inequities exist for every nation in the world, many countries, especially in Europe (for
example the UK, Sweden and Ireland) have developed dedicated, coordinated, and signifi cantly resourced
intersectoral strategies for reducing health inequities that are demonstrating positive outcomes. Quebec
and Newfoundland & Labrador have also successfully implemented provincial anti-poverty strategies. At the
national level, Canada has signifi cantly decreased poverty amongst seniors over the past forty years, through
the introduction of various employment and income-based public pensions. These achievements are
encouraging for BC, as they provide a model for addressing health inequities in this province.
Guiding Principles & Key Policy Considerations in Addressing Health Inequities
Based on a review of promising practices in other jurisdictions, guiding principles for a well-founded and
effective policy approach to addressing health inequities include:
Levelling up, not down. The goal should be to continuously raise standards of health, education, living
and working conditions and social well-being for all citizens; the challenge is to achieve both a raising and
a levelling of the social gradient in these areas by ensuring that the most disadvantaged benefi t most.
Not making the inequities worse – helping the worst-off fi rst. Universal interventions can have the
unintended effect of providing the most help to the groups who need it least and therefore increasing
inequities. It will be important to develop intervention programs based on a combined universal/targeted
Health Inequities in British Columbia: Discussion Paper
11
approach (i.e., additional targeted interventions may be needed for the more disadvantaged members of
society).
Using a combination of regulatory and structural interventions for greatest impact in reducing
socioeconomic stratifi cation.
Recognizing that complex problems require complex solutions; health inequities must be addressed on
many fronts, through multiple, interrelated strategies.
A review of the efforts in other jurisdictions reveals a number of common features, presented here as key
considerations for any activity undertaken in British Columbia to reduce health inequities:
Making the reduction of health inequities a government and societal priority and allocating resources
accordingly;
Developing a multisectoral approach involving cooperation across all levels and areas of government, and
across the public, private, NGO and community sectors; and,
Setting clear goals and targets for all initiatives, and tracking progress on specifi c measures related to
health inequity as part of a continuous improvement process.
Policy Options for Consideration
Based on the information, evidence and promising practices identifi ed in this paper, taken together with the
input obtained through a province-wide consultative process, fi ve broad policy areas for reducing health
inequities are offered for consideration. These policy areas and associated policy options are:
1. Income and Food Security
Ensuring adequate incomes and access to affordable, nutritious food:
Minimum Wage – Increasing the minimum wage and indexing it to the annual cost of living. It is
important that the minimum wage refl ect a ‘living wage’ in order to eliminate the situation faced by the
working poor – people working full time but still facing poverty.
Earned Income Benefi t – Ensuring that federal and provincial earned income benefi ts work to
augment the incomes of people who are normally in the paid labour force.
Federal Child Benefi t – Combining the Canada Child Tax Benefi t base benefi t and National Child
Benefi t Supplement into a single refundable benefi t and making it available to all low-income families, with
no reduction of other benefi ts to offset the increase. Considering revising income thresholds and benefi t
reductions to avoid undue hardship on lower-income families as their work incomes rise.
Income Assistance – Increasing welfare rates and indexing the rates to annual increases in the cost
of living. About half of the increase will be required to make up for the erosion in purchasing power since
1994. Considering a mechanism to improve the income status of pregnant women.
Food Security – Developing a healthy eating and food security strategy that includes:
Ensuring income assistance rates are determined with consideration for the actual cost of food.
Health Inequities in British Columbia: Discussion Paper
12
Addressing issues of availability and accessibility determined by the food system by engaging
stakeholders (particularly local governments) to pursue strategies and community-based food
security initiatives that focus on capacity building and community development.
Nutrition – Supporting stronger labelling requirements on all packaged foods, banning trans-fats,
reducing salt content requirements, restricting advertisements and sales of junk foods, implementing
subsidy programs for nutritional foods, and promoting nutrient fortifi cation (e.g., folic acid).
2. Education and Literacy
Increasing access to education, improving educational outcomes, and enhancing literacy skills:
Strong Start Program - Enhancing the Strong Start program so that it is based on evidence of what
works, is appropriately funded, and has a strong evaluation component.
Child Care Subsidy Program - Reinvesting in the Child Care Subsidy Program.
Community Links - Enhancing the Community Links program, that provides resources to students
from disadvantaged backgrounds, to help reduce the number of students who drop out from high school.
BC Loan Reduction Program - Reinvesting in the BC Loan Reduction Program to encourage more
low-income students to attend university.
Support for Low-Income Students - Strengthening support for low income students by extending
fi nancial support to students in one-year programs.
Adult Literacy, Education & Training - Increasing resources for adult literacy, basic education and
skills training.
3. Early Childhood Development
Ensuring that children are provided as many advantages as possible for optimal development:
Affordable High Quality Child Care and Other Early Learning Programs – Developing an
affordable, accessible, high quality child care system and early learning opportunities for British Columbia
(e.g., full-day kindergarten options for children aged three to fi ve, such as those being explored by BC’s
provincial government).
These programs and services should be fl exible, and meet the developmental, language, literacy and
cultural needs of all children. They should also provide additional opportunities for the early identifi cation
of developmental delays, disabilities and other risk factors and appropriate referrals, encourage parent
participation, enhance parents’ understanding of child development through information, support and role
modelling, build supportive social networks amongst children and families, and support and enhance the
economic security of women and families.
Healthier Families – Improving the health of children and families through policies that promote
comprehensive, quality and affordable early childhood development and parenting services and programs
ensuring that priority is given to those neighbourhoods and communities with the highest numbers of
vulnerable children. Particular consideration should be given to the following components of early childhood
development that have been shown to be successful and are recommended by First Call: BC Child and
Youth Advocacy Coalition:

Health Inequities in British Columbia: Discussion Paper
13
Early Childhood Development (ECD) public health initiatives (e.g., home visits of all newborns by
community health nurses, and vision, hearing, dental and speech screening).
Adequately resourced and well-coordinated supports for parents, families and other caregivers (e.g.,
information, resources and workshops about child development and parenting, clothing exchanges and
toy lending, drop-in, emergency and respite childcare, and outreach through mobile drop-in programs
and playground programs).
Targeted early intervention strategies and services (e.g., supports for high-risk mothers during the pre
and post-natal period, and specifi c supports for children with developmental delays, disabilities, and
behavioural issues).
Strategies to improve access to ECD resources:
Community based information and referral services (e.g., well-resourced information and referral
services to help families connect with ECD supports and services as well as broader community
resources).
Designated resources for access and participation (e.g., proactive outreach strategies such as
resources for transportation, translation, interpretation, literacy assistance, or provision of food and
childcare as part of programs in order to address barriers to access).
In order to maximize effectiveness, it is further recommended that these services be delivered by an ECD
Central hub and co-located with child and family-friendly agencies (e.g., family resource centres, schools,
libraries, neighbourhood houses, community centres). Consideration should be given to prorating charges
according to family income with low or no fees required for low income families.
4. Housing and Healthy Built Environments
Ensuring access to safe, affordable housing and enhancing the health and liveability of neighbourhoods:
Affordable Housing – Ensuring there is an adequate supply of appropriate, safe and affordable
housing for low-income families and individuals.
Housing First – Developing policies to provide a range of housing and related supports for the
homeless, and particularly for those with mental illness and/or addictions. A full continuum of housing
options should be provided and matched to individuals’ needs, including emergency and temporary
accommodation (e.g., shelters), transition housing, and supportive (e.g., group homes often with on-site
staff) and supported housing (e.g., co-operatives or independent apartments with off-site staff or case
management support).
Healthy Built Environments – Exploring policy options focused on making changes to the built
environment such as:
Increasing housing density
Increasing the usage of mixed land-use patterns
Increasing the connectivity of urban streets to enable easier (shortest distance) walking between
locations
Improving public transit as an effective alternative to the automobile
Health Inequities in British Columbia: Discussion Paper
14
Increasing the supply of recreation facilities and parks
Enhancing streetscape design to improve aesthetics and safety for pedestrians and cyclists (e.g.,
adequate lighting, pedestrian crossings, sidewalks, bike paths)
Improving physical access to healthy foods and discouraging junk foods through zoning and
neighbourhood design where needed to support grocery stores, farmers’ markets and restaurants
5. Health Care
Ensuring equal access to health services, and ensuring health care programs and services apply an
‘inequities lens’:
Making health inequities reduction a health sector priority
Engaging with other sectors toward reducing health inequities
Integrating inequities reduction into health programs and services
Strengthening knowledge development and exchange
Reducing fi nancial and other barriers to preventive and curative health care services
Providing information to patients in a format that they can understand
Many different actions could be taken within each of these fi ve policy option areas. The actions identifi ed
here have been selected because they have been articulated in existing documents or through consultative
processes as being promising practices. When implementing any one of these actions, there is a great
deal of best practices literature that should be consulted regarding criteria for designing and implementing
programs and policies most effectively.
It is also critical to note that of all the policy options presented here, this paper supports the conclusion of the
BC Healthy Living Alliance which has said that, “No single policy will be effective in itself. What is required is
an integrated approach that will deal with the complex problems of health inequities from various angles.”
Health Inequities in British Columbia: Discussion Paper
15
Purpose of this Report
This discussion paper is intended to contribute to a better understanding of health inequities and the extent
to which they exist in British Columbia, support informed discussion about health inequities among a broad
range of audiences, and promote consideration of policy approaches for tackling this issue.
To that end, the paper:
Explains the concept of health inequity and the social determinants of health
Examines the extent of health inequities in British Columbia
Outlines some of the social and economic costs of health inequities, as well the benefi ts of addressing
health inequities
Provides a number of health inequity policy considerations
Presents policy options for consideration towards addressing health inequities
It is important to note that this paper is not intended to be a comprehensive literature review with policy
recommendations fl owing directly from that review. Many well-known and respected national offi ces and
organizations (e.g., Canada’s Chief Public Health Offi cer, the Senate Sub-Committee on Population Health)
and international organizations (e.g., the World Health Organization) have produced papers thoroughly
describing the social determinants of health, identifying the causality behind and scope of health inequities,
and proposing solutions based on best practices to reduce health inequities. This report has drawn heavily
from (and referenced where appropriate) those existing pieces of work.
The intent of this paper is to use BC data to describe the health inequities in this province, and to discuss
policy options in fi ve areas that have emerged through a local and ongoing consultative process that has
included workshops, discussions, and reviews of this paper by key stakeholders interested in addressing
health inequities. Those stakeholders represent various sectors including several provincial ministries, all of
BC’s health authorities, academia, non-profi t organizations, municipal organizations and others.

Health Inequities in British Columbia: Discussion Paper
16
Limitations
The data presented in this paper provide a broad picture of health inequities in British Columbia for men and
women from the general population. It must be acknowledged, however, that members of some specifi c
population groups in the province (e.g., First Nations’ people) are at a higher statistical risk for developing
chronic disease and experiencing health inequities than are people from the general population.
To ensure the high-level consistency and applicability of the fi ndings and policy considerations presented
in this report, the authors have deliberately excluded application of a health inequities lens to First Nations
people and fi rst generation immigrants. A proper assessment of health inequities for these more vulnerable
population groups requires different considerations from those used in the current paper, with a sharp
focus on more specifi cally relevant data, and required ownership of the process by the affected groups –
particularly First Nations communities.
A gender and diversity-based analysis (GBA) of the information contained in this paper would greatly
enhance our understanding of health inequities and where to focus efforts on addressing them. During the
winter, 2008/09, the Provincial Health Services Authority (PHSA) intends to undertake a GBA of this paper
with an eye toward developing a policy discussion paper for further consideration by relevant stakeholders.

Health Inequities in British Columbia: Discussion Paper
17
I. What are Health Inequities?
Inequities in health are the central focus of this paper. Such inequities concern systematic differences
in health status between different socioeconomic groups. But what exactly does that entail, and what
is the difference between health inequalities, disparities, and inequities (three terms that are often used
interchangeably)?
Within any country, differences in health can be observed across the population. Genetic and constitutional
variations ensure that the health of individuals varies, as it does for any other physical characteristic. The
prevalence of ill health also differs between different age groups, with older people tending to be sicker than
younger people, because of the natural ageing process. Biologically, women in older industrialized countries
demonstrate an advantage in survival over men at every stage of life. Chance also plays a role in everyone’s
life, with luck deciding which individuals avoid a particular infectious disease or hazard and which succumb.1
These types of unavoidable differences are considered health inequalities or disparities. A genetic
predisposition to heart disease or diabetes, for example, is not more likely to exist among people in Prince
George than in Burnaby, or among people earning minimum wage compared to millionaires in the province.
The World Health Organization (WHO) defi nes health equity as “the absence of unfair and avoidable or
remediable differences in health among population groups defi ned socially, economically, demographically or
geographically.”2 Health inequities, therefore, involve more than inequality – whether in health determinants
or outcomes, or in access to the resources needed to improve and maintain health.
The key concept within this defi nition is ‘the absence of unfair and avoidable or remediable differences in
health.’ Health inequities are health differences which are: socially produced; systematic in their distribution
across the population; and unfair.3 Identifying a health difference as inequitable is not an objective
description, but necessarily implies an appeal to ethical norms.4 Because they are systematic and socially
produced, the further implication is that they are modifi able.5
When disadvantaged social groups—such as the poor, racial/ethnic minorities, women, or other groups
who have persistently experienced social disadvantage or discrimination—systematically experience worse
health or greater health risks than more advantaged social groups (‘social advantage’ refers to one’s relative
position in a social hierarchy determined by wealth, power, and/or prestige), inequities can be said to exist.
Using the WHO defi nition, British Columbia could be said to have health equity if the general health of people
throughout the province was not unduly affected by where they live or their position within the socioeconomic
hierarchy. So regardless of whether you were a sales manager on Vancouver Island, a forestry worker in the
Cariboo, a bank teller in the Okanagan, or unemployed in Vancouver, your chances for enjoying good health
and reaching the normal life expectancy for people of your sex in the province would be about the same.
As we shall see from the data presented in this report, this is certainly not the case in BC. Unfortunately,
some BC residents will die younger or become disabled because they are worse off socio-economically.
A description of these health inequities, their associated costs and what might be done to address them,
constitutes the bulk of this report.

Health Inequities in British Columbia: Discussion Paper
18
While health inequities exist for every nation in the world, jurisdictions that have committed to specifi c
objectives for reduced inequities in health and are supported by appropriately integrated social, economic
and health policies, are achieving progress toward their objectives. This is good news for BC, as it provides
a model for addressing health inequities in this province.
Social Gradients in Health and Health Risks
In BC as in other jurisdictions in the developed world, health tends to be unevenly distributed among social
groups within the population on a gradient corresponding to socioeconomic status. In general, people from
more advantaged socioeconomic groups enjoy longer life expectancy and better health than people from
less advantaged groups.
“We have a great deal of knowledge of the causes of non-communicable disease that represents the
major burden of disease for people at the lower end of the social gradient in middle and high income
countries…underweight, overweight, smoking, alcohol consumption, hypertension, sexual behaviour…
the question is how these causes, and their inequitable distribution come about. That is, what are the
causes of the causes? This brings us to the social determinants of health and health equity.”
World Health Organization
Achieving Health Equity: From Root Causes to Fair Outcomes, 2007.6
This correlation between health and socioeconomic status has been observed for many different health
conditions, populations, and settings. In the UK, the correlation was starkly revealed by a series of studies
(the Whitehall research)7 which categorized British civil servants into socioeconomic groups based on their
occupation – from unskilled manual labourers to the highest government executives. The result revealed a
clear gradient in morbidity and mortality rates across the entire socioeconomic hierarchy, with health status
consistently improving in relation to position in the hierarchy. This gradient existed even though none of the
civil servants were fi nancially poor, and all had free access to medical care through the UK’s National Health
Service.
These results clearly revealed that in addition to obvious health-affecting behaviours, factors related to
socioeconomic position (e.g., educational level, income, working conditions, psychosocial stress) also
have an impact on the health of people. These factors are commonly referred to as social determinants
of health (SDH). They constitute long-term, systemic infl uences on health and must be distinguished from
behavioural determinants of health (e.g., smoking). Because inequities in the SDH are avoidable, they are
also fundamentally different from the unavoidable genetic determinants of health. Let us look briefl y at the full
list of determinants of health, and where the social determinants fi t into that list.
Determinants of Health and Health Inequities
According to the WHO Commission on the Social Determinants of Health “the poor health of the poor, the
social gradient in health within countries, and the marked health inequities between countries are caused by
the unequal distribution of power, income, goods and services.”8
Health Inequities in British Columbia: Discussion Paper
19
To fully understand why there is unequal distribution of money, power, material goods and services, one
needs to look further upstream, at the structural roots of health inequities – within the education, taxation
and health care systems, in labour and housing markets, and in urban planning and government regulation.
These structural components of our socioeconomic system shape the differential vulnerability of people to
health-affecting conditions and are powerful determinants of health.
The federal government notes that at every stage of life, health is determined by complex interactions
between social and economic factors, the physical environment and individual characteristics and behavior.
These factors are referred to as ‘determinants of health’. They do not exist in isolation from each other. It is
the combined infl uence of the determinants of health that determines health status.9
The following are the commonly acknowledged key determinants of health.10,11 They have been organized
into economic and social determinants (also referred to in this paper as structural or ‘upstream’ factors) and
community and individual characteristics (also referred to in this paper as ‘downstream’ factors).12
Economic and Social Determinants (‘Upstream’ Factors):
Macroeconomic policies – Includes taxation, monetary and international trade policies.
Culture, ethnicity and values – Includes issues of racism, marginalization and traditional beliefs and
practices.
Governance – includes form of government (e.g., parliamentary democracy), political values (e.g.,
welfare state) and control of corruption.
Income and social status – Differences in income signifi cantly affect the availability and quality of
many health-infl uencing factors, including good food, shelter, education and health services. Lower
income and status also results in less control over life circumstances and discretion to act, which are key
infl uences in peoples’ health.
Employment and working conditions – Adverse working conditions (e.g., exposure to hazards, lax
safety standards, lack of control) can present health risks that are more prevalent for people from lower
paid occupational groups.
Education and literacy – Differences in educational level are associated with differences in health
awareness, health literacy skills and socioeconomic status, all of which are related to health inequity.
Early childhood development – Children from disadvantaged families tend to do less well at
school, are less likely to graduate from high school, and as adults, are less successful in attaining and
holding well-paid jobs. These limitations, stemming from issues of childhood development, contribute to
signifi cant social disadvantage and health inequity.
Community and Individual Characteristics (‘Downstream’ Factors):
Physical (built) environments – Differences in the distribution and quality of environmental
factors (e.g., clean water, air and soil, housing) between urban and rural locations and among different
neighbourhoods, and differences in the built environment (e.g., playgrounds, walking trails, sidewalks)
from one area to another can contribute to inequities in health.
Social support networks – Support from families, friends and communities is associated with better
health. Such social support networks could be very important in helping people solve problems and deal

Health Inequities in British Columbia: Discussion Paper
20
with adversity, as well as helping them maintain a sense of mastery and control over life circumstances.
The caring and respect that occurs in social relationships, and the resulting sense of satisfaction and well-
being seem to act as a buffer against health problems.
Social environments – The importance of social support also extends to the broader community.
When individuals are engaged with their social environment (e.g., as volunteers, as members of a
community organization) they develop enhanced strategies to cope with changes and foster health.
Access to effective health care services – Access to universally insured care remains largely
unrelated to income; however, many low- and moderate-income Canadians have limited or no access to
health services such as eye care, dentistry, mental health counselling and prescription drugs – all of which
has an impact on health outcomes.
Risk behaviours – This refers to risky behaviours individuals engage in such as smoking, alcohol or
drug use, poor dietary choices, physical inactivity, and risky sexual behaviour.
Personal health practices and coping skills – This refers to actions by which individuals can
prevent diseases and promote self-care, cope with challenges, and develop self-reliance, solve problems
and make choices that enhance health.
Gender – Gender refers to the array of society-determined roles, personality traits, attitudes, behaviours,
values, and the relative power and infl uence that society ascribes to the two sexes on a differential
basis. ‘Gendered’ norms infl uence the health system’s practices and priorities. Many health issues are
a function of gender-based social status or roles. Differences in the distribution of material and social
resources between men and women can contribute to health inequity. For example, lone-parent families
are almost always headed by women. In BC, lone-parent families are also much more likely to live in
poverty than any other type of household group.
Biology and genetic endowment - The basic biology and organizational make-up of the human
body are a fundamental determinant of health.
Causes of Health Inequities Health inequities stem largely from an unequal distribution of (or exposure to) signifi cant determinants of
health. People from lower socioeconomic groups tend to be more exposed to health hazards in the physical
environment, experience more psychosocial stress, suffer more material deprivation (e.g., poor nutrition,
inadequate housing) and have fewer opportunities to make health-promoting behavioural choices such as
getting regular physical exercise.13 Increased exposure to stress, as well as a lack of resources, skills, social
support and connection to the community can contribute to less healthy coping skills and poorer health
behaviours such as smoking, over-consumptions of alcohol and less healthy eating habits.14 These same
people are often less likely to have the opportunity to use health care, usually because of direct or indirect
fi nancial barriers. As a result, people from lower income groups are subject to higher rates of disease and
disability than are people with higher income levels.15,16
The WHO’s Commission on Social Determinants of Health (CSDH) has developed a conceptual framework
that identifi es the major categories of social determinants and the processes and pathways that generate
health inequities.17 (see Figure 1)

Health Inequities in British Columbia: Discussion Paper
21
Figure 1. Commission on Social Determinants of Health Conceptual Framework
Source: CSDH Final Report, 2008 (Amended from Solar & Irwin, 2007).
The extent of the difference in health status between people from the bottom and the top of the
socioeconomic hierarchy is a measure of the health inequity of a society. In order to understand how
such health inequity develops, it is necessary to closely examine the relationship between the upstream
determinants of health (the far left, lightly shaded box on this diagram, that includes elements of the
socioeconomic and political context and the middle, medium shaded box on this diagram that includes
social position, education, occupation, income, gender and ethnicity/race) and the downstream determinants
of health (the darkly shaded box on this diagram that includes material circumstances, social cohesion,
psychosocial factors, behaviours and biological factors, as well as the health-care system).
The framework shows how social, economic and political mechanisms give rise to a set of socioeconomic
positions, whereby populations are stratifi ed according to education, occupation, income, gender, ethnicity
and race. These socioeconomic positions in turn shape specifi c determinants of health (downstream
factors). Based on their respective social status, individuals experience differences in exposure and
vulnerability to health-compromising conditions.18
Upstream (Structural) Social Determinants of Health
Peoples’ lives are shaped by a wider set of forces: economics, social policies and politics. This
socioeconomic and political context is broadly defi ned to include all social and political mechanisms that
generate, confi gure and maintain social hierarchies, including (but not limited to): policies concerning the
labour market, the educational system, medical care, public health, and housing distribution; political
institutions and governance processes; and, other cultural and societal biases, norms and values. “Among
the contextual factors that most powerfully affect health are the welfare state and its redistributive policies (or
the absence of such policies).”19
Socioeconomic
& political context
Social position
Education
Occupation
Health-Care System
SOCIAL DETERMINANTS OF HEALTH AND HEALTH INEQUITIES
Income
Gender
Ethnicity / Race
Governance
Cultural and
societal norms
and values
Policy
(Macroeconomic,
Social, Health)
Material circumstances
Social cohesion
Psychosocial factors
Behaviours
Biological factors
Distribution of health
and well-being
Health Inequities in British Columbia: Discussion Paper
22
These social structures and processes contribute to social stratifi cation – “the systematically unequal
distribution of power, prestige and resources among groups in society.”20
The most common proxies used to measure social stratifi cation include income, education and occupation.
Income and education can be understood as social outcomes of the stratifi cation process, while occupation
serves as a proxy for social stratifi cation. Social class, gender and ethnicity also operate as important
structural determinants.
Downstream Social Determinants of Health
The upstream or structural determinants shape the distribution of downstream social determinants of health.
There are differential exposures to disease-causing infl uences in early life, social and physical environments
and work experiences, associated with social stratifi cation. Depending on the nature of these infl uences,
different groups will have different experiences of material conditions, behavioural options, and psychosocial
support, which make them more or less vulnerable to poor health.21
Many risk factors for morbidity and mortality are more prevalent in lower socioeconomic groups, and it is
these inequalities in exposure to specifi c health determinants which should be seen as the main explanation
of health inequities. These ‘downstream’ risk factors fall into several categories described next.
Socioeconomic disadvantage may affect health through various downstream mechanisms: material
deprivation, social cohesion (supports), psychosocial risk factors, risk behaviours, biological factors, and
access to effective health services.
‘Material deprivation’ associated with low income includes exposure to environmental toxicants
(e.g., poor air quality, lead and other heavy metals, etc), inadequate housing and homelessness, poor
working conditions (e.g., injuries, toxic exposure) and inadequate access to healthy food and facilities
for physical activity.
‘Social cohesion’ or ‘social capital’ is “looked upon as an extension of social relationships and
the norms of reciprocity, infl uencing health by way of the social support mechanisms that these
relationships provide to those who participate on them.”22
A third group of specifi c determinants which contribute to the explanation of health inequities
are ‘psychosocial risk factors’. Those who are in a low socioeconomic position on average
experience more psychosocial stress in the form of negative life events (e.g., loss of loved ones,
fi nancial diffi culties), daily hassles, ‘effort-reward imbalance’ (high levels of effort without appropriate
material and immaterial rewards), and a combination of high demands and low control. These forms
of psychosocial stress can in their turn lead to ill-health, either by affecting biology (e.g., compromised
immune systems) or by inducing risk-taking behaviours.
Another group of contributory factors are health-related ‘behavioural risk factors’ such as
smoking, inadequate diet, excessive alcohol and/or drug consumption, and lack of physical
exercise, that infl uence an individual’s health. While these are behaviours of individuals and to some
extent refl ect personal choice, for people living on low incomes in inadequate housing and poor

Health Inequities in British Columbia: Discussion Paper
23
neighbourhoods, there is often little opportunity to access healthy food or recreational facilities. Hence
these behaviours are far more prevalent among the disadvantaged and marginalized.
Biological risk factors, i.e. an individual’s genetic make-up and predisposition towards particular
conditions and/or disease infl uence health outcomes, but these risk factors can be exacerbated by (or
alternatively, mitigated by) other determinants of health.
Finally, the health system plays an important role in mediating the differential consequences of illness
in people’s lives. Social stratifi cation determines differential access to and utilization of health care,
with consequences for the inequitable promotion of health and well-being, disease prevention, and
illness recovery and survival.
‘Reverse Causality’
Although Figure 1 suggests causality moving in a single direction (downstream), in fact, the causal pathway is
not so straightforward, with downstream factors feeding back to infl uence less immediate (upstream) factors,
and health outcomes themselves infl uencing preceding factors along the causal pathway. For example, a
chronic condition such as type 2 diabetes – which can often be attributed to both socioeconomic factors
(e.g., poverty, which makes it challenging to buy healthy food and exercise) and behavioural factors (e.g.,
diet) – can lead to more complicated health conditions like kidney disease. Kidney disease, in turn can
further increase the negative impact on an individual’s situation, affecting their employment status, fi nancial
circumstances (material factors) and even their position within the socioeconomic hierarchy.
“[The link between the social determinants and health] is a two-way street. Health is a product of
income, employment, housing, education and other factors. At the same time, health is itself a resource
for seeking and securing adequate income, employment, housing, education and others. It is a resource
for living.”
Health Nexus and Ontario Chronic Disease Prevention Alliance
Primer to Action: Social Determinants of Health, 2008.23
The reverse causation theory - that poor health limits the ability to engage in paid work and, therefore, leads
to poverty - has, for the most part, been discredited in the literature as the main direction of causality.24
For example, longitudinal studies (which take a life-course approach) such as those conducted in England
or reviewed by Michaela Benzeval and Ken Judge, have consistently seen poverty occurring before and
leading to ill health.25 According to another reviewer, “most of the studies reviewed … conclude that reverse
causation is not a serious problem and that the main direction of infl uence is from poverty to poor(er)
health.”26
Two ‘real life’ examples will help demonstrate the infl uence of upstream and downstream factors.
Julie’s Story
Julie (Julie’s name has been changed to protect her identity) is a single woman in her 40’s who lives in a
rural and remote location in BC with her two children.27 Julie struggles with obesity and has diabetes which

Health Inequities in British Columbia: Discussion Paper
24
is poorly controlled. During the past several years, Julie’s primary health care nurse encouraged her to lose
weight by eating a nutritious and balanced diet, and following an exercise program. The nurse also provided
information to Julie about how she could more regularly monitor and control her diabetes. Over time, the
nurse has grown increasingly frustrated with Julie, who has not changed her diet or engaged in exercise,
lost any weight, or in any way attempted to control her diabetes more effectively. Julie, meanwhile, has also
grown increasingly frustrated because she feels that the nurse doesn’t understand the reality and pressures
of her life, which make it extremely diffi cult for her to follow the nurse’s advice.
As the frequency of the confrontations about Julie’s continuing poor health increased between the two
women, Julie thought it might help improve the nurse’s understanding of her situation if she showed her a
picture of where she lives. To one appointment Julie brought a picture of her house…essentially it is a poorly
constructed shack with a roof that is covered with a tarp. Julie explained to the nurse that she has a leaky
roof and no running water. Julie further explained that as part of her daily routine, she has to fetch water
and cut wood to feed the stove that heats the house. Julie continued with her story….she lives ten miles
from town and has no car, so she must rely on the schedules and kindness of others to assist with getting
groceries home. Several factors combined make it impossible for Julie to access fresh fruit and vegetables
for her family: 1) the fact that she is on welfare, has a limited budget, and fruits and vegetables are more
costly in rural and remote communities makes it diffi cult for her to afford them, and 2) the fact that she is not
able to shop frequently makes it impossible for her to keep fresh produce in the house, even if she were able
to afford them.
After hearing more about Julie’s living conditions and life stressors, the nurse came to develop a greater
understanding of the many barriers that keep Julie from being healthy. She realized that Julie spends a
signifi cant amount of time and energy dealing with basic issues related to her own and her children’s survival
(e.g., fetching water, heating the house, dealing with the leaky roof, fi guring out how to get food home). She
came to understand further that this situation, compounded by the stress associated with living in poverty,
leaves Julie with no time and energy left over to take care of her own health in terms of eating a nutritious
diet, engaging in exercise, or taking other necessary steps to control her diabetes.
Dana’s Story
Dana (Dana’s name has been changed in order to protect her identity) is a woman in her thirties from
the Cowichan Valley area of Vancouver Island.28 She was the oldest of three children, all born before her
mother was 22. As a teen, her mother had suffered a nervous breakdown and had spent time in a hospital
psychiatric unit, where she met Dana’s father, who was an alcoholic.
While her children were still very young, Dana’s mother left her husband after he physically assaulted her.
Dana’s childhood years were marked by poverty, hardship and frequent moves. By grade fi ve she had
already attended four different schools, and over the course of her childhood experienced three different
step-fathers. At 16, Dana left school and began living with a 25-year-old man. She had her fi rst child at 17
and by the time she was 21, she was a single parent living on welfare with two young children.
Over the next ten years Dana repeated with her children many of the experiences she lived through as a
child. Although she completed her high school and various employment training programs, the demands
of raising her children – including a third son with muscular dystrophy – prevented her from accepting more
than part-time work. This made her dependent on income assistance and other forms of government
support. Following a particularly desperate period in her life, during which she made repeated visits to a
Health Inequities in British Columbia: Discussion Paper
25
hospital emergency department demanding help, she was arrested and committed to a two-week stay in
a psychiatric unit where, she says, “they discovered my need for help was real.” Like her mother, Dana has
experienced physical abuse from a partner. She also has issues with chronic pain and depression, and says
she has always lived with the fear of poverty and her inability to provide for her children.
Looking on the broad circumstances of Dana’s life and those of her mother, the repeating patterns are
evident. These are lives shaped from their earliest years by social determinants that set the parameters for
the socioeconomic and health outcomes that follow. Although it is clear nobody would freely choose a life
of poverty and deprivation for themselves and their children, we see generation after generation of people
fi nding themselves in these circumstances. Breaking these patterns requires social, economic and political
policies that effectively address such social determinants as early childhood development, income security
and housing/homelessness toward reducing health inequity for all groups within the population.
A Lesson for Policymakers: Focusing on the Upstream
Health planners and policymakers have something to learn from examining Julie’s and Dana’s lives. It is clear
that in order for Julie and Dana (and the many individuals who live in circumstances similar to theirs) to be
able to improve their health status, focusing on individual health behaviour will be ineffective; the social and
economic determinants of health such as housing, income and food security fi rst need to be addressed.
This approach is supported by the US’s Institute of Medicine which has concluded that such factors as
“stress, insuffi cient fi nancial and social supports, poor diet, environmental exposures, community factors and
characteristics, and many other health risks,” which contribute signifi cantly to the risk of disease and death,
are probably more effectively addressed at the level of community and environmental interventions than
through individual-level interventions.29
To fully understand why people with less money and education tend to experience more health problems
than people higher up the scale on those measures, we need to look further upstream, at the structural roots
of health inequity – within the education, taxation and health care systems, in labour and housing markets,
and in urban planning and government regulation. These structural components of our socioeconomic
system shape the differential vulnerability of people to health-affecting conditions and are powerful
determinants of health.
Unlike the behavioural determinants of health, these upstream factors are ones over which individuals have
no direct personal control, but which can only be altered through social and economic policies and political
processes. When planning initiatives to improve health outcomes, it is imperative to “recognize that people
live in social, political and economic systems that shape behaviours and access to the resources they need
to maintain good health,”30 and that “while biological interventions and exhortations to individuals to change
their behaviours are easier to administer, changes in social factors, policies, and norms are necessary for
improvement and maintenance of population health.”
For policymakers, this means looking well beyond measures targeting health affecting behaviours – such as
smoking cessation or wellness promotion campaigns. For real traction on achieving gains in health equity,
the focus must be on tackling the upstream, macroenvironmental factors – the social determinants of health
– and ensuring that measures toward this end are included as an integral part of any policy package. As the
WHO’s Commission on Social Determinants of Health (CSDH) notes, “Strengthening health equity…means
Health Inequities in British Columbia: Discussion Paper
26
going beyond contemporary concentration on the immediate causes of disease. More than any other global
health endeavour, the Commission focuses on the ‘causes of the causes’ – the fundamental global and
national structures of social hierarchy and the socially determined conditions these create in which people
grow, live, work and age.”31
The Commission identifi ed three principles of action, which it used to structure its overarching
recommendations and the entire fi nal report.* They are:
Improve the conditions of daily life – the circumstances in which people are born, grow, live, work, and 1.
age.
Tackle the inequitable distribution of power, money, and resources – the structural drivers of those 2.
conditions of daily life – globally, nationally, and locally.
Measure the problem, evaluate action, expand the knowledge base, develop a workforce that is trained in 3.
the social determinants of health, and raise public awareness about the social determinants of health.
* See Appendix 1 for more detail re: the CSDH’s Framework for Action, principles, and overarching recommendations.
Health Inequities in British Columbia: Discussion Paper
27
II. Health Inequities in British Columbia
The ‘BC Paradox’
On the whole, British Columbians are among the healthiest people in the world. Average life expectancy at
birth (LEo) for BC men is higher than the life expectancy for men in any other province of the country,32 and
BC men assumed the front rank in life expectancy globally in 2003, after surpassing the Japanese.33 It is
also interesting to note that BC men’s LEo is also increasing at almost twice the rate for BC women.
BC women also have a relatively high average life expectancy, and live longer on average than their male
counterparts. BC women currently rank third (based on the most recent data) against the leading nations for
LEo, behind only Japan and Spain.34
British Columbia also has the lowest rates of smoking and obesity and the highest rate of physical activity in
the country.35
While these comparative measures refl ect favourably on the overall health of British Columbians, they do
not tell the whole story. It must also be noted that although British Columbians currently enjoy a relatively
high average level of health, improvements in BC’s and Canada’s health statistics are not keeping up with
the improvements being made in many of the other healthiest nations of the world.36 The average life
expectancy for both BC men and women, for example, is rising much less quickly than the life expectancies
for men and women in Japan and a number of European nations. In fact, according to trending data, by
2010, BC women are projected to fall from third to seventh place behind the women of Japan, Spain,
Australia, Japan, France, Italy and Switzerland.37
And, even more serious, is the fact that in the midst of this picture of general good health there is a relatively
large number of disadvantaged people in this province – the unemployed and working poor, children and
families living in poverty, people with addictions and/or mental illness, Aboriginal people, the homeless, and
others – who experience signifi cantly lower levels of health than others.
In fact, BC has the highest rates of poverty (see Figure 3) and particularly child poverty (see Figure 5) in
Canada. This presents a paradox: despite having by some measures the best overall health outcomes in
Canada, BC also has the highest rates of socioeconomic disadvantage in the country. This ‘BC paradox’
can be explained by two factors:
The overall average health status data in BC for measures such as life expectancy do not reveal the 1.
signifi cant inequities that exist within the province – averages conceal differences. For example, looking
at just one indicator of health inequity among British Columbians, there is a difference of almost ten years
between the average life expectancy for people in Richmond (84.81 years) and people in the downtown
eastside of Vancouver (75.01 years).38 Similar inequities of health are refl ected by differences in the
prevalence of chronic disease for people from the highest and lowest income groups, as will be shown
later in this report.
BC has not always been behind the rest of the country in measures such as childhood poverty rates. It is 2.
only over the past decade that BC has fallen behind the other provinces (See Figure 3), to a large extent
Health Inequities in British Columbia: Discussion Paper
28
because of proactive and successful anti-poverty strategies introduced in provinces such as Quebec
and Newfoundland†. As shown in Figure 4, the overall poverty rates in BC families have been relatively
stable over the period (except for female lone-parent families). But, in the coming years, as we start to
see expected health status improvements in the provinces that have been more aggressive in reducing
poverty (it is likely too early to see those improvements just yet), BC is also likely to fall behind in its
average health status as well.
A further consideration is the time lag in the causal link between performance on the social determinants
of health (including educational achievement, poverty, early childhood development, housing, etc.) and
outcomes on health measures such as life expectancy. The full impact of the effects of the upstream
determinants of health may not yet be fully realized or apparent from our current population health statistics.
Inequities in BC
Inequities in Life Expectancy by Geographic Location
Life expectancy is a commonly used general measure for comparing the relative health of populations. If
life expectancy is used as an indicator for health inequity across BC’s geographic regions, we can see that
the highest life expectancies are found in the southern, urban areas, and the lowest in the north and central
coast regions (see Figure 2). The gap of 10-14 years in average life expectancy between these regions
constitutes a signifi cant degree of health inequity.
† During the past decade, both provinces have made signifi cant progress in decreasing their poverty rates (see Figure 3).
In 1983 Newfoundland had the highest poverty rate in the country at 20.2%. It stayed quite high for several years after that, hovering around 16%. It declined for a few years
and then increased steadily again until it reached a spike in 1995 with a poverty rate of 17.1%. In 2006 it had a poverty rate of 7.6%. In eleven years, that represents a 9.5%
reduction.
Although it had some minor dips between 1984 and 1992, Quebec’s poverty rate was on an overall incline during the seventeen years between 1980 and 1997, when it peaked
at a poverty rate of 19.3%. Since 1997, it has been on a steady decline and is now at 11.6% (a 7.7% decline over nine years from its highest point).

Health Inequities in British Columbia: Discussion Paper
29
Figure 2. Life expectancy by geographic region in BC (2001 – 2005)
(Data source: BC Health Data Warehouse and BC STATS fi ve year data from 2001 to 2005)
Inequities in Income
Poverty
Although the primary social determinants of health (SDH) are closely interrelated, poverty is arguably the
most dominant factor within the SDH matrix. And on this measure, British Columbia stands apart from the
rest of Canada.
Stikine
Fort Nelson
Prince George
Nechako
Peace River North
Quesnel
Cariboo-Chilcotin
Burns Lake
Terrace
Kamloops
Merritt
Kitimat
Snow Country
Golden
Peace River South
Telegraph Creek
Bella Coola Valley
Fernie
Smithers
Lillooet
Hope
Alberni
Windermere
Revelstoke
Vernon
North Thompson
Howe Sound
100 Mile House
Nelson
Nisga'a
South Cariboo
Arrow Lakes
Campbell River
Princeton
Vancouver Island North
Creston
Kootenay Lake
Kimberley
Cranbrook
Powell River
Queen Charlotte
Prince Rupert
Kettle Valley
Vancouver Island North
Upper Skeena
Sooke
Trail
Campbell River
Salmon Arm
Keremeos
Agassiz-Harrison
Sunshine Coast
Enderby
Vancouver Island West
Grand Forks
Central Coast
Kitimat
Mission
Central Coast
Courtenay
Lake Cowichan
Queen Charlotte
Kitimat
Nanaimo
Central Coast
Chilliwack
Maple Ridge
Central Coast
Prince Rupert
Central Coast
Central Coast
Vancouver Island West
Saanich
Life Expectancy at Birth
70.2 - 74.5
74.6 - 77.4
77.5 - 78.4
78.5 - 79.2
79.3 - 79.7
79.8 - 80.2
80.3 - 80.9
81.0 - 81.6
81.7 - 83.0
83.1 - 85.4
Delta
Richmond
BurnabyWestside
North Vancouver
Midtown
Richmond
North East
Delta
City Centre
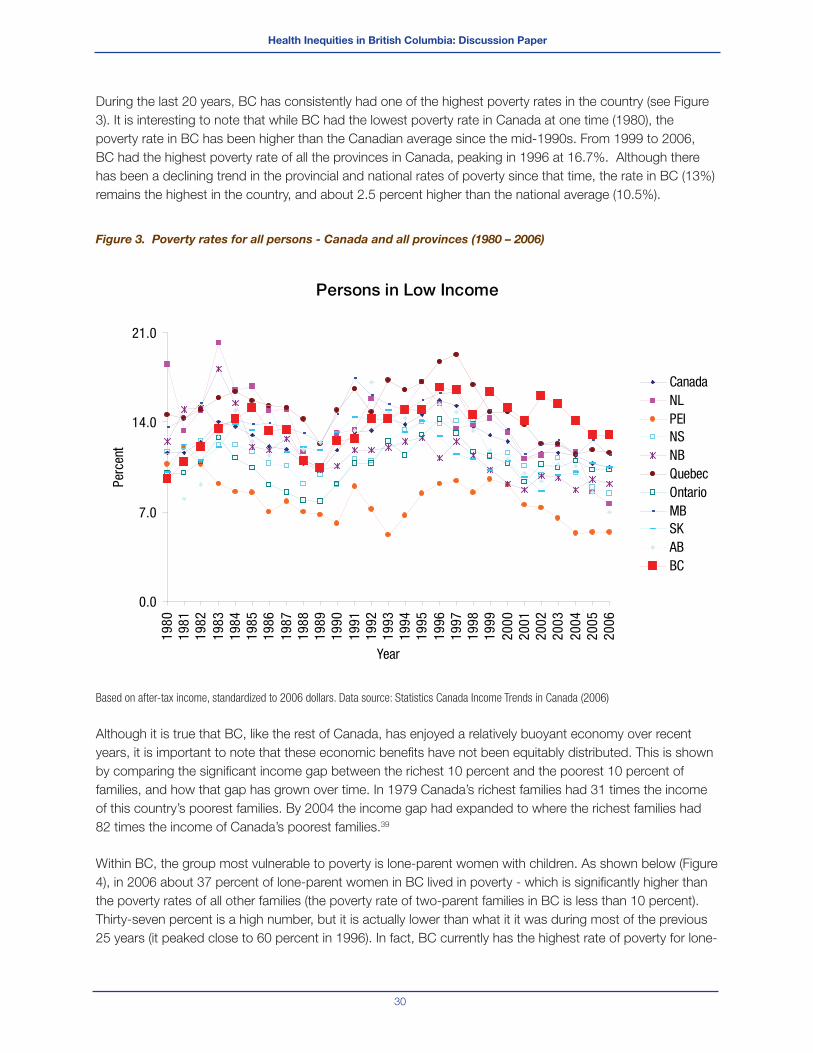
Health Inequities in British Columbia: Discussion Paper
30
During the last 20 years, BC has consistently had one of the highest poverty rates in the country (see Figure
3). It is interesting to note that while BC had the lowest poverty rate in Canada at one time (1980), the
poverty rate in BC has been higher than the Canadian average since the mid-1990s. From 1999 to 2006,
BC had the highest poverty rate of all the provinces in Canada, peaking in 1996 at 16.7%. Although there
has been a declining trend in the provincial and national rates of poverty since that time, the rate in BC (13%)
remains the highest in the country, and about 2.5 percent higher than the national average (10.5%).
Figure 3. Poverty rates for all persons - Canada and all provinces (1980 – 2006)
Based on after-tax income, standardized to 2006 dollars. Data source: Statistics Canada Income Trends in Canada (2006)
Although it is true that BC, like the rest of Canada, has enjoyed a relatively buoyant economy over recent
years, it is important to note that these economic benefi ts have not been equitably distributed. This is shown
by comparing the signifi cant income gap between the richest 10 percent and the poorest 10 percent of
families, and how that gap has grown over time. In 1979 Canada’s richest families had 31 times the income
of this country’s poorest families. By 2004 the income gap had expanded to where the richest families had
82 times the income of Canada’s poorest families.39
Within BC, the group most vulnerable to poverty is lone-parent women with children. As shown below (Figure
4), in 2006 about 37 percent of lone-parent women in BC lived in poverty - which is signifi cantly higher than
the poverty rates of all other families (the poverty rate of two-parent families in BC is less than 10 percent).
Thirty-seven percent is a high number, but it is actually lower than what it it was during most of the previous
25 years (it peaked close to 60 percent in 1996). In fact, BC currently has the highest rate of poverty for lone-
Persons in Low Income
0.0
7.0
14.0
21.0
1980
1981
1982
1983
1984
1985
1986
1987
1988
1989
1990
1991
1992
1993
1994
1995
1996
1997
1998
1999
2000
2001
2002
2003
2004
2005
2006
Year
Perc
ent
CanadaNLPEINSNBQuebecOntarioMBSKABBC

Health Inequities in British Columbia: Discussion Paper
31
parent families in Canada.40 As a direct result of this, BC also has the highest rate of childhood poverty in the
country (see Figure 5).
Figure 4. BC poverty rates by family type (1980-2006)
Based on after-tax income, standardized to 2006 dollars. Data source: Statistics Canada Income Trends in Canada (2006)
Figure 5. Child poverty rates by province - 2005
Based on after-tax income, standardized to 2006 dollars. Data source: Statistics Canada Income Trends in Canada (2006)
0.0
10.0
20.0
30.0
40.0
50.0
60.0
1980
1981
1982
1983
1984
1985
1986
1987
1988
1989
1990
1991
1992
1993
1994
1995
1996
1997
1998
1999
2000
2001
2002
2003
2004
2005
2006
Elderly Married Couples (couple means no children)
Non-Elderly Married Couples
Two-Parent Families
Female Lone-parent families
Per
cent
age
16.1
14.4
12.411.8
11.3
9.7 9.38.7
6.9
4.0
11.3
0.0
2.0
4.0
6.0
8.0
10.0
12.0
14.0
16.0
18.0
British Columbia
Saskachewan
ManitobaOntario
New BrunswickQuebec
Newfoundland & Labrador
Nova ScotiaAlberta
Prince Edward Island
Canada
Per
cent
age
Health Inequities in British Columbia: Discussion Paper
32
There is also considerable inequity in the geographic distribution of poverty, socioeconomic disadvantage
and educational concerns across BC. As shown in Figure 6, the poorest regions are the rural and northern
areas of the province. The exception is Vancouver, which ranks in the middle on the socioeconomic index.
One may have expected Vancouver to rank higher, however, it is clearly being infl uenced by the data coming
from seriously socioeconomically disadvantaged neighbourhoods such as the city’s downtown eastside. On
the other hand, the urban centres of Vancouver and Victoria, along with portions of the Okanagan and the
Kootenays have the highest educational levels in the province. It is no surprise that educational levels by
region across the province correspond quite closely to regional income levels.
Generally, children from families with lower income and lower levels of education have poorer overall health
and higher rates of cognitive diffi culties, behavioural issues, hyperactivity and obesity through childhood.41,42
The consequences of these disadvantages include children growing into adults with lower educational
attainment, weaker literacy and communication skills, fewer employment opportunities and poorer overall
physical and mental health.43

Health Inequities in British Columbia: Discussion Paper
33
Figure 6. Regional distribution of average socioeconomic condition and educational level in BC (2005)

Health Inequities in British Columbia: Discussion Paper
34
Food security
Food security is closely related to poverty. People are defi ned as being food insecure when they lack physical
and economic access to suffi cient, safe and nutritious food at all times to meet their dietary needs for an
active and healthy life.44
As shown in Figure 7, the areas where food insecurity across the province is greatest are the northwest part
of BC, as well as the southern half of the province, particularly Central Vancouver Island, Fraser East and
Kootenay/Boundary areas.
Figure 7. Regional distribution of food insecure households in BC (2005)
Data source: Statistics Canada, Canadian Community Health Survey (CCHS) Cycle 3.1 Share File (2005).
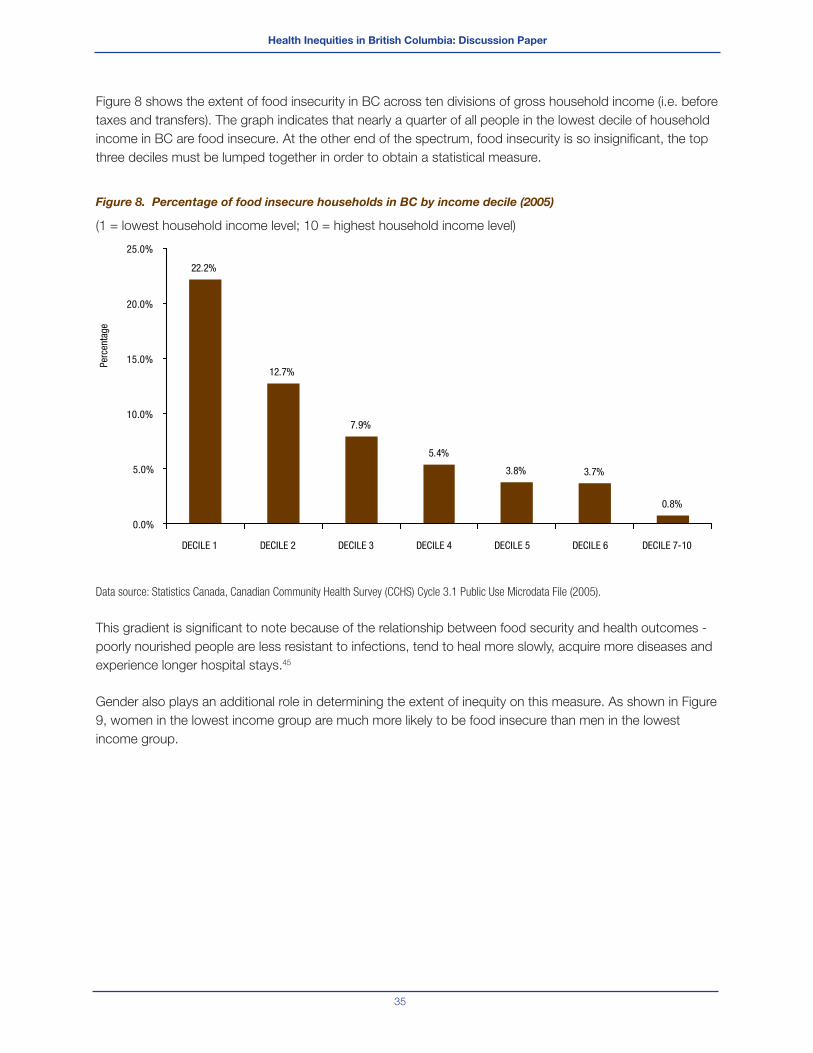
Health Inequities in British Columbia: Discussion Paper
35
Figure 8 shows the extent of food insecurity in BC across ten divisions of gross household income (i.e. before
taxes and transfers). The graph indicates that nearly a quarter of all people in the lowest decile of household
income in BC are food insecure. At the other end of the spectrum, food insecurity is so insignifi cant, the top
three deciles must be lumped together in order to obtain a statistical measure.
Figure 8. Percentage of food insecure households in BC by income decile (2005)
(1 = lowest household income level; 10 = highest household income level)
Data source: Statistics Canada, Canadian Community Health Survey (CCHS) Cycle 3.1 Public Use Microdata File (2005).
This gradient is signifi cant to note because of the relationship between food security and health outcomes -
poorly nourished people are less resistant to infections, tend to heal more slowly, acquire more diseases and
experience longer hospital stays.45
Gender also plays an additional role in determining the extent of inequity on this measure. As shown in Figure
9, women in the lowest income group are much more likely to be food insecure than men in the lowest
income group.
22.2%
12.7%
7.9%
5.4%
3.8% 3.7%
0.8%
0.0%
5.0%
10.0%
15.0%
20.0%
25.0%
DECILE 1 DECILE 2 DECILE 3 DECILE 4 DECILE 5 DECILE 6 DECILE 7-10
Perc
enta
ge
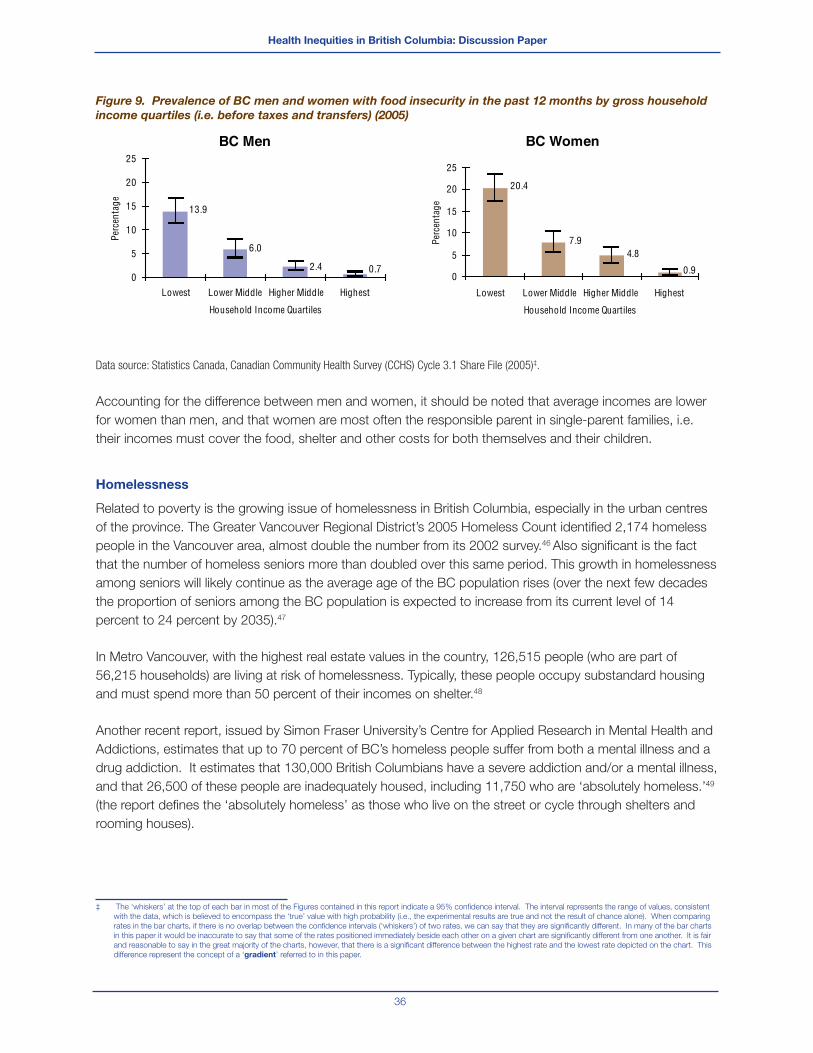
Health Inequities in British Columbia: Discussion Paper
36
Figure 9. Prevalence of BC men and women with food insecurity in the past 12 months by gross household
income quartiles (i.e. before taxes and transfers) (2005)
BC Men
0.72.4
6.0
13.9
0
5
10
15
20
25
Lowest Lower Middle Higher Middle Highest
Household Income Quartiles
Perc
enta
ge
BC Women
0.9
7.9
20.4
0
5
10
15
20
25
Perc
enta
ge
Lowest Lower Middle Higher Middle Highest
Household Income Quartiles
4.8
Data source: Statistics Canada, Canadian Community Health Survey (CCHS) Cycle 3.1 Share File (2005)‡.
Accounting for the difference between men and women, it should be noted that average incomes are lower
for women than men, and that women are most often the responsible parent in single-parent families, i.e.
their incomes must cover the food, shelter and other costs for both themselves and their children.
Homelessness
Related to poverty is the growing issue of homelessness in British Columbia, especially in the urban centres
of the province. The Greater Vancouver Regional District’s 2005 Homeless Count identifi ed 2,174 homeless
people in the Vancouver area, almost double the number from its 2002 survey.46 Also signifi cant is the fact
that the number of homeless seniors more than doubled over this same period. This growth in homelessness
among seniors will likely continue as the average age of the BC population rises (over the next few decades
the proportion of seniors among the BC population is expected to increase from its current level of 14
percent to 24 percent by 2035).47
In Metro Vancouver, with the highest real estate values in the country, 126,515 people (who are part of
56,215 households) are living at risk of homelessness. Typically, these people occupy substandard housing
and must spend more than 50 percent of their incomes on shelter.48
Another recent report, issued by Simon Fraser University’s Centre for Applied Research in Mental Health and
Addictions, estimates that up to 70 percent of BC’s homeless people suffer from both a mental illness and a
drug addiction. It estimates that 130,000 British Columbians have a severe addiction and/or a mental illness,
and that 26,500 of these people are inadequately housed, including 11,750 who are ‘absolutely homeless.’49
(the report defi nes the ‘absolutely homeless’ as those who live on the street or cycle through shelters and
rooming houses).
‡ The ‘whiskers’ at the top of each bar in most of the Figures contained in this report indicate a 95% confi dence interval. The interval represents the range of values, consistent
with the data, which is believed to encompass the ‘true’ value with high probability (i.e., the experimental results are true and not the result of chance alone). When comparing
rates in the bar charts, if there is no overlap between the confi dence intervals (‘whiskers’) of two rates, we can say that they are signifi cantly different. In many of the bar charts
in this paper it would be inaccurate to say that some of the rates positioned immediately beside each other on a given chart are signifi cantly different from one another. It is fair
and reasonable to say in the great majority of the charts, however, that there is a signifi cant difference between the highest rate and the lowest rate depicted on the chart. This
difference represent the concept of a ‘gradient’ referred to in this paper.
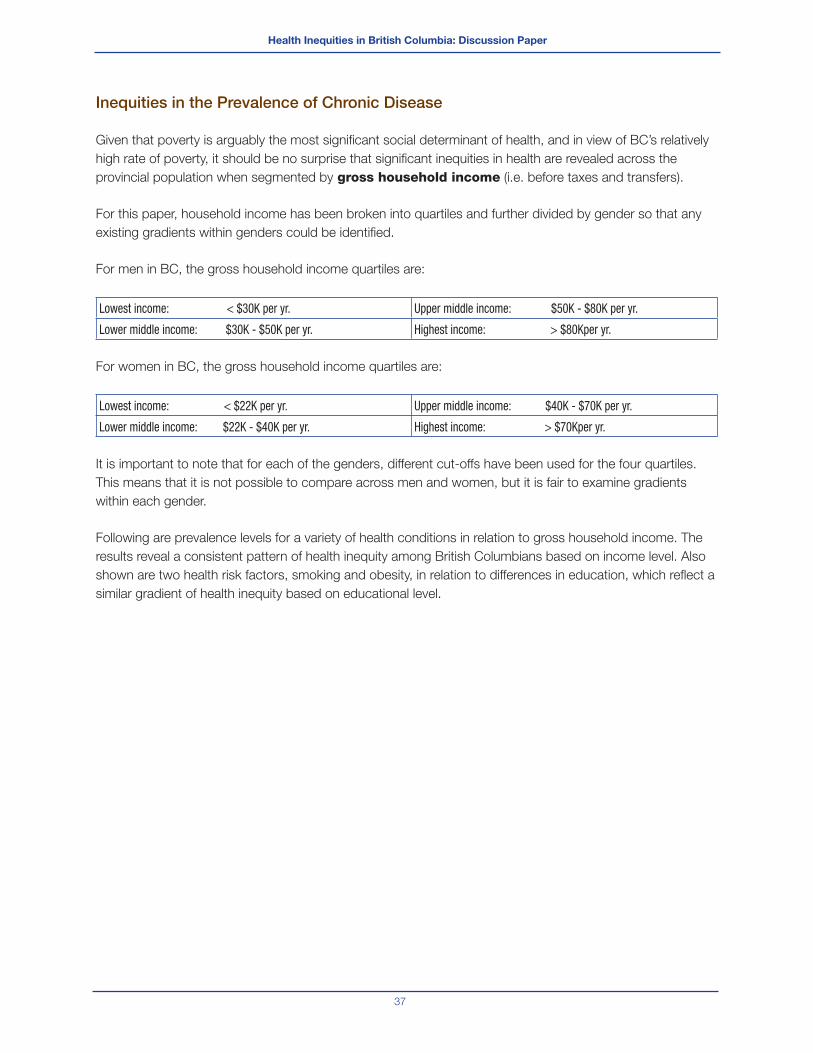
Health Inequities in British Columbia: Discussion Paper
37
Inequities in the Prevalence of Chronic Disease
Given that poverty is arguably the most signifi cant social determinant of health, and in view of BC’s relatively
high rate of poverty, it should be no surprise that signifi cant inequities in health are revealed across the
provincial population when segmented by gross household income (i.e. before taxes and transfers).
For this paper, household income has been broken into quartiles and further divided by gender so that any
existing gradients within genders could be identifi ed.
For men in BC, the gross household income quartiles are:
Lowest income: < $30K per yr. Upper middle income: $50K - $80K per yr.
Lower middle income: $30K - $50K per yr. Highest income: > $80Kper yr.
For women in BC, the gross household income quartiles are:
Lowest income: < $22K per yr. Upper middle income: $40K - $70K per yr.
Lower middle income: $22K - $40K per yr. Highest income: > $70Kper yr.
It is important to note that for each of the genders, different cut-offs have been used for the four quartiles.
This means that it is not possible to compare across men and women, but it is fair to examine gradients
within each gender.
Following are prevalence levels for a variety of health conditions in relation to gross household income. The
results reveal a consistent pattern of health inequity among British Columbians based on income level. Also
shown are two health risk factors, smoking and obesity, in relation to differences in education, which refl ect a
similar gradient of health inequity based on educational level.
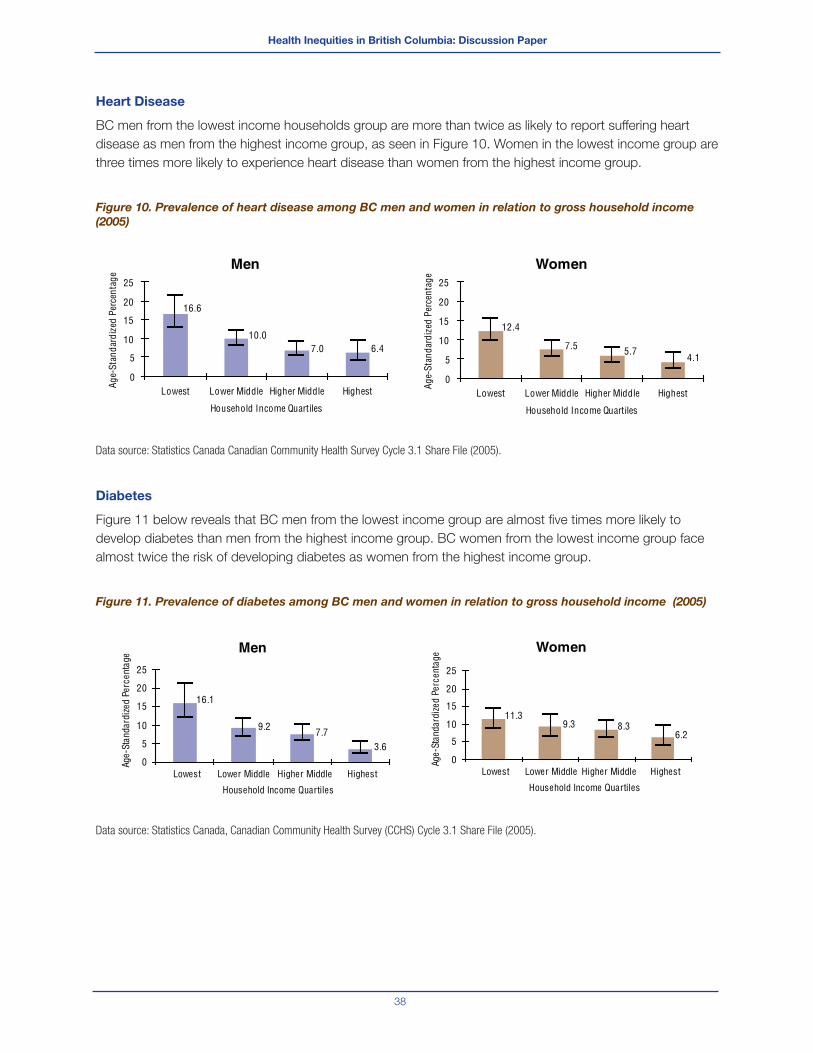
Health Inequities in British Columbia: Discussion Paper
38
Heart Disease
BC men from the lowest income households group are more than twice as likely to report suffering heart
disease as men from the highest income group, as seen in Figure 10. Women in the lowest income group are
three times more likely to experience heart disease than women from the highest income group.
Figure 10. Prevalence of heart disease among BC men and women in relation to gross household income
(2005)
Data source: Statistics Canada Canadian Community Health Survey Cycle 3.1 Share File (2005).
Diabetes
Figure 11 below reveals that BC men from the lowest income group are almost fi ve times more likely to
develop diabetes than men from the highest income group. BC women from the lowest income group face
almost twice the risk of developing diabetes as women from the highest income group.
Figure 11. Prevalence of diabetes among BC men and women in relation to gross household income (2005)
Data source: Statistics Canada, Canadian Community Health Survey (CCHS) Cycle 3.1 Share File (2005).
Men
6.47.010.0
16.6
0
5
10
15
20
25
Lowest Lower Middle Higher Middle Highest
Household Income Quartiles
Age-
Stan
dard
ized
Per
cent
age
Women
4.15.77.5
12.4
0
5
10
15
20
25
Lowest Lower Middle Higher Middle Highest
Household Income Quartiles
Age-
Stan
dard
ized
Per
cent
age
Men
16.1
9.2 7.73.6
0
5
10
15
20
25
Lowest Lower Middle Higher Middle Highest
Household Income Quartiles
Age-
Stan
dard
ized
Per
cent
age Women
6.28.39.3
11.3
0
5
10
15
20
25
Lowest Lower Middle Higher Middle Highest
Household Income Quartiles
Age-
Stan
dard
ized
Per
cent
age
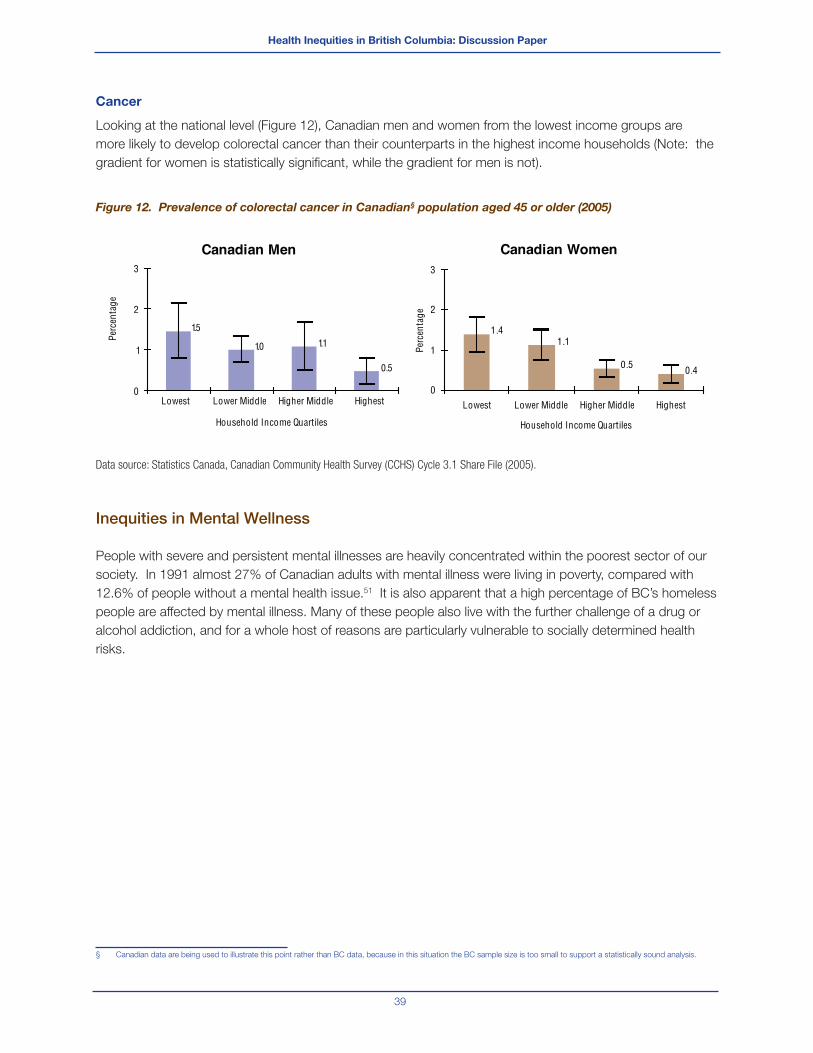
Health Inequities in British Columbia: Discussion Paper
39
Cancer
Looking at the national level (Figure 12), Canadian men and women from the lowest income groups are
more likely to develop colorectal cancer than their counterparts in the highest income households (Note: the
gradient for women is statistically signifi cant, while the gradient for men is not).
Figure 12. Prevalence of colorectal cancer in Canadian§ population aged 45 or older (2005)
Data source: Statistics Canada, Canadian Community Health Survey (CCHS) Cycle 3.1 Share File (2005).
Inequities in Mental Wellness
People with severe and persistent mental illnesses are heavily concentrated within the poorest sector of our
society. In 1991 almost 27% of Canadian adults with mental illness were living in poverty, compared with
12.6% of people without a mental health issue.51 It is also apparent that a high percentage of BC’s homeless
people are affected by mental illness. Many of these people also live with the further challenge of a drug or
alcohol addiction, and for a whole host of reasons are particularly vulnerable to socially determined health
risks.
§ Canadian data are being used to illustrate this point rather than BC data, because in this situation the BC sample size is too small to support a statistically sound analysis.
Canadian Men
0.5
1.11.0
1.5
0
1
2
3
Canadian Women
0.40.5
1.11.4
0
1
2
3
Lowest Lower Middle Higher Middle Highest
Household Income QuartilesPe
rcen
tage
Perc
enta
ge
Lowest Lower Middle Higher Middle Highest
Household Income Quartiles

Health Inequities in British Columbia: Discussion Paper
40
Figure 13 demonstrates that individuals in higher income quartiles have signifi cantly higher self-perceived
mental health than individuals in the lower income quartiles (especially the lowest).
Figure 13. Self-perceived mental health as excellent or very good among BC men and women (2005)
Data source: Statistics Canada, Canadian Community Health Survey (CCHS) Cycle 3.1 Share File (2005).
There is some evidence that demonstrates that mental health issues such as depressive and anxiety
disorders are disabling and can prevent sufferers from carrying out their tasks at home and in employment
and thus have adverse economic implications for the individual, their families and society. Irrespective of the
average per capita income of a society, persons who are at the bottom end of the social hierarchy are at a
greater risk of suffering from these disorders than those who are at the upper end.52
Depression, an important public-health problem, and one of the leading causes of disease burden worldwide
is often comorbid with other chronic diseases and can worsen their associated health outcomes.53 The
comorbid state of depression incrementally worsens health compared with depression alone, with any of the
chronic diseases alone, and with any combination of chronic diseases without depression.54
Men
78.874.7
68.6
57.3
45
55
65
75
85
Women
76.371.6
67.4
56.8
45
55
65
75
85
Lowest Lower Middle Higher Middle Highest
Household Income Quartiles
Age-
Stan
dard
ized
Per
cent
age
Lowest Lower Middle Higher Middle Highest
Household Income Quartiles
Age-
Stan
dard
ized
Per
cent
age
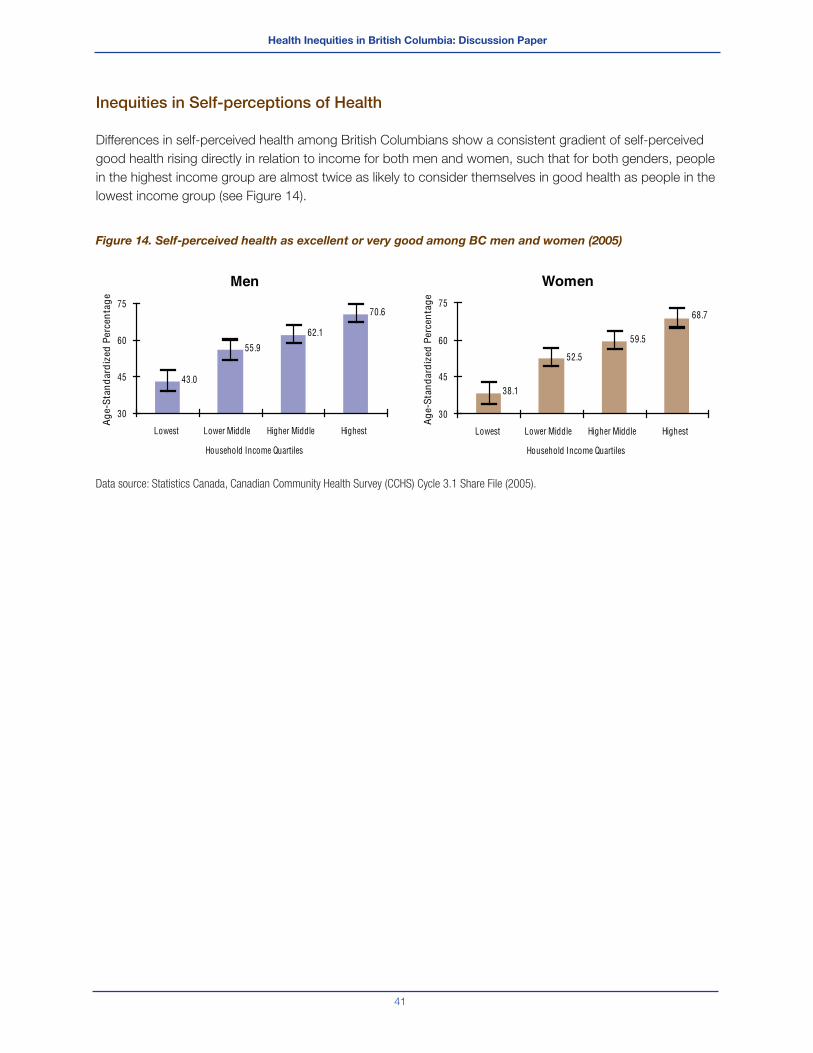
Health Inequities in British Columbia: Discussion Paper
41
Inequities in Self-perceptions of Health
Differences in self-perceived health among British Columbians show a consistent gradient of self-perceived
good health rising directly in relation to income for both men and women, such that for both genders, people
in the highest income group are almost twice as likely to consider themselves in good health as people in the
lowest income group (see Figure 14).
Figure 14. Self-perceived health as excellent or very good among BC men and women (2005)
Data source: Statistics Canada, Canadian Community Health Survey (CCHS) Cycle 3.1 Share File (2005).
Men
70.6
62.1
55.9
43.0
30
45
60
75
Lowest Lower Middle Higher Middle Highest
Household Income Quartiles
Ag
e-S
tan
dar
diz
ed P
erce
nta
ge
Women
68.7
59.5
52.5
38.1
30
45
60
75
Lowest Lower Middle Higher Middle Highest
Household Income Quartiles
Ag
e-S
tan
dar
diz
ed P
erce
nta
ge

Health Inequities in British Columbia: Discussion Paper
42
Inequities in Perceptions of Unmet Health Needs
Overall, women in BC are more likely than men to report their health needs are not being met, typically due to
waiting times, service availability (when and where required) and personal circumstances.55 For both BC men
and women there is a gradient related to unmet health needs – individuals in lower income households are
almost twice as likely as those in higher income households to report unmet health needs during the previous
12 months (see Figure 15).
Figure 15. Unmet health care needs in the previous 12 months for BC men and women -
by income level (2005)
Data source: Statistics Canada, Canadian Community Health Survey (CCHS) Cycle 3.1 Share File (2005).
The reasons for the gradient are varied; unfortunately, some people face barriers to health care services
including physical inaccessibility, socio-cultural issues, language barriers, or the cost of non-insured services
(e.g., eye and dental care, mental health counselling and prescription drugs).56
Men
7.910.59.8
15.4
0
5
10
15
20
25
Lowest Lower Middle Higher Middle Highest
Household Income Quartiles
Age-
Stan
dard
ized
Per
cent
age
Women
9.6
13.412.8
18.2
0
5
10
15
20
25
Lowest Lower Middle Higher Middle Highest
Household Income Quartiles
Age-
Stan
dard
ized
Per
cent
age
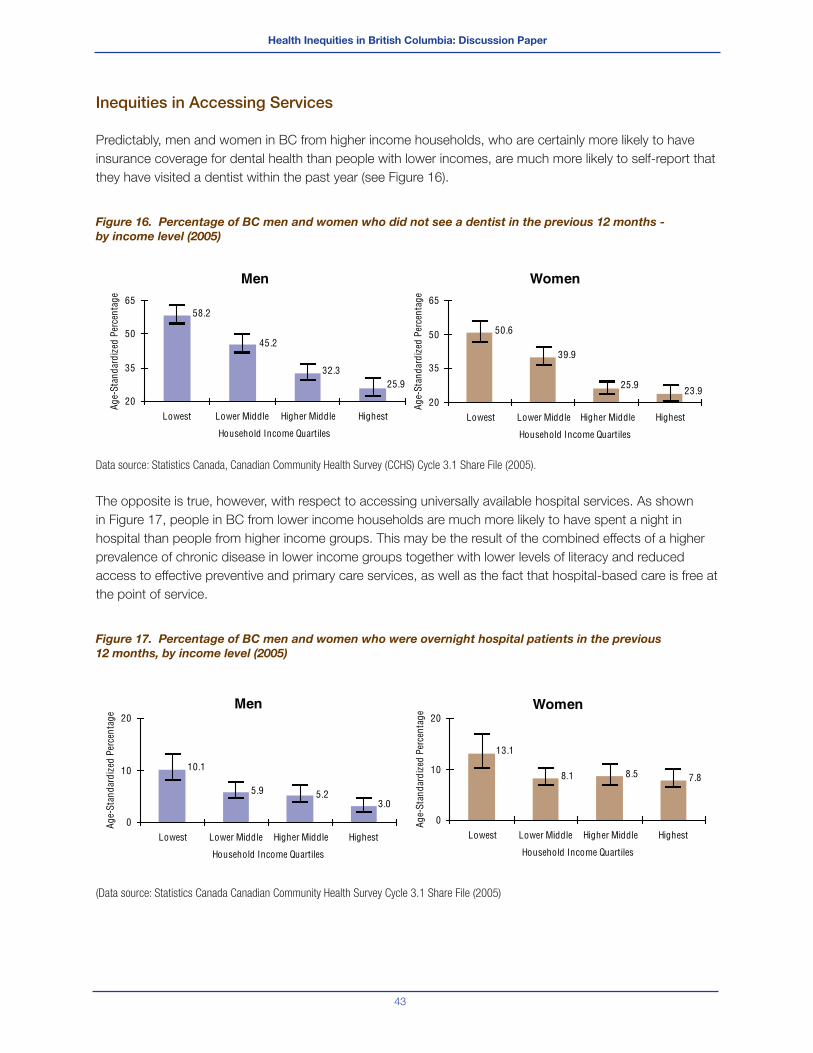
Health Inequities in British Columbia: Discussion Paper
43
Inequities in Accessing Services
Predictably, men and women in BC from higher income households, who are certainly more likely to have
insurance coverage for dental health than people with lower incomes, are much more likely to self-report that
they have visited a dentist within the past year (see Figure 16).
Figure 16. Percentage of BC men and women who did not see a dentist in the previous 12 months -
by income level (2005)
Data source: Statistics Canada, Canadian Community Health Survey (CCHS) Cycle 3.1 Share File (2005).
The opposite is true, however, with respect to accessing universally available hospital services. As shown
in Figure 17, people in BC from lower income households are much more likely to have spent a night in
hospital than people from higher income groups. This may be the result of the combined effects of a higher
prevalence of chronic disease in lower income groups together with lower levels of literacy and reduced
access to effective preventive and primary care services, as well as the fact that hospital-based care is free at
the point of service.
Figure 17. Percentage of BC men and women who were overnight hospital patients in the previous
12 months, by income level (2005)
(Data source: Statistics Canada Canadian Community Health Survey Cycle 3.1 Share File (2005)
Men
25.932.3
45.2
58.2
20
35
50
65
Lowest Lower Middle Higher Middle Highest
Household Income Quartiles
Age-
Stan
dard
ized
Per
cent
age
Women
23.925.9
39.9
50.6
20
35
50
65
Lowest Lower Middle Higher Middle Highest
Household Income Quartiles
Age-
Stan
dard
ized
Per
cent
age
Men
3.05.25.9
10.1
0
10
20
Lowest Lower Middle Higher Middle Highest
Household Income Quartiles
Age-
Stan
dard
ized
Per
cent
age
Women
7.88.58.1
13.1
0
10
20
Lowest Lower Middle Higher Middle Highest
Household Income Quartiles
Age-
Stan
dard
ized
Per
cent
age

Health Inequities in British Columbia: Discussion Paper
44
Inequities in Behavioural Risk Factors
As discussed earlier, health inequities emerge from a combination of structural (upstream) elements of the
socioeconomic system, over which individuals have little control, and from behavioural (downstream) factors
as well as access to health care services. The most common behavioural factors related to health inequity
are smoking, physical inactivity, poor diet and obesity, all of which tend to be most prevalent among the
lowest income and education groups. It is important to note that although these behavioural factors are
ostensibly within the realm of individual control, they cannot be considered separately from upstream social
determinants of health such as income. For example, as will be shown below, the higher prevalence of
obesity among people in the lowest income group can be related in part to food costs and the relatively low
cost of energy dense/nutrient poor foods with high fat and sugar content.
Smoking
Smoking is associated with a range of chronic diseases, including cancer, chronic lung disease,
cardiovascular disease (CVD) and stroke. Even in BC, with the lowest percentage of smokers among
Canadian provinces, smoking is directly associated with over 5,000 deaths a year.57 As shown in Figures 18
and 19 below, the incidence of smoking among British Columbians follows a consistent and very signifi cant
gradient in relation to both household income and educational level.
Figure 18. Prevalence of daily smokers among BC men and women in relation to household income (2005)
Data source: Statistics Canada, Canadian Community Health Survey (CCHS) Cycle 3.1 Share File (2005).
Men
8.2
14.615.4
24.2
0
10
20
30
Lowest Lower Middle Higher Middle Highest
Household Income Quartiles
Ag
e-S
tan
dar
diz
ed P
erce
nta
ge Women
7.711.2
15.7
21.7
0
10
20
30
Lowest Lower Middle Higher Middle Highest
Household Income Quartiles
Ag
e-S
tan
dar
diz
ed P
erce
nta
ge
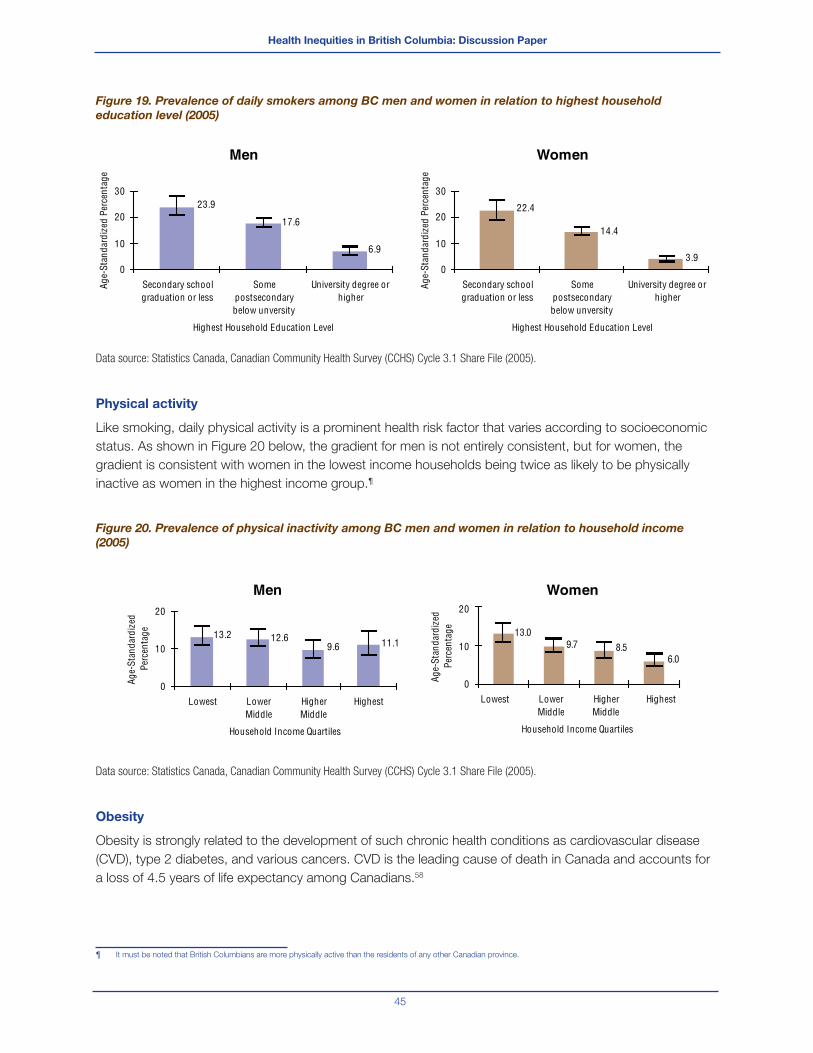
Health Inequities in British Columbia: Discussion Paper
45
Figure 19. Prevalence of daily smokers among BC men and women in relation to highest household
education level (2005)
Data source: Statistics Canada, Canadian Community Health Survey (CCHS) Cycle 3.1 Share File (2005).
Physical activity
Like smoking, daily physical activity is a prominent health risk factor that varies according to socioeconomic
status. As shown in Figure 20 below, the gradient for men is not entirely consistent, but for women, the
gradient is consistent with women in the lowest income households being twice as likely to be physically
inactive as women in the highest income group.¶
Figure 20. Prevalence of physical inactivity among BC men and women in relation to household income
(2005)
Data source: Statistics Canada, Canadian Community Health Survey (CCHS) Cycle 3.1 Share File (2005).
Obesity
Obesity is strongly related to the development of such chronic health conditions as cardiovascular disease
(CVD), type 2 diabetes, and various cancers. CVD is the leading cause of death in Canada and accounts for
a loss of 4.5 years of life expectancy among Canadians.58
¶ It must be noted that British Columbians are more physically active than the residents of any other Canadian province.
Men
6.9
17.6
23.9
0
10
20
30
Secondary schoolgraduation or less
Somepostsecondarybelow unversity
University degree orhigher
Highest Household Education Level
Age-
Stan
dard
ized
Per
cent
age
Women
3.9
14.4
22.4
0
10
20
30
Secondary schoolgraduation or less
Somepostsecondarybelow unversity
University degree orhigher
Highest Household Education Level
Age-
Stan
dard
ized
Per
cent
age
Men
11.19.612.613.2
0
10
20
Lowest LowerMiddle
HigherMiddle
Highest
Household Income Quartiles
Age-
Stan
dard
ized
Pe
rcen
tage
Women
6.08.59.7
1 3.0
0
10
20
Lowest LowerMiddle
HigherMiddle
Highest
Household Income Quartiles
Age-
Stan
dard
ized
Pe
rcen
tage
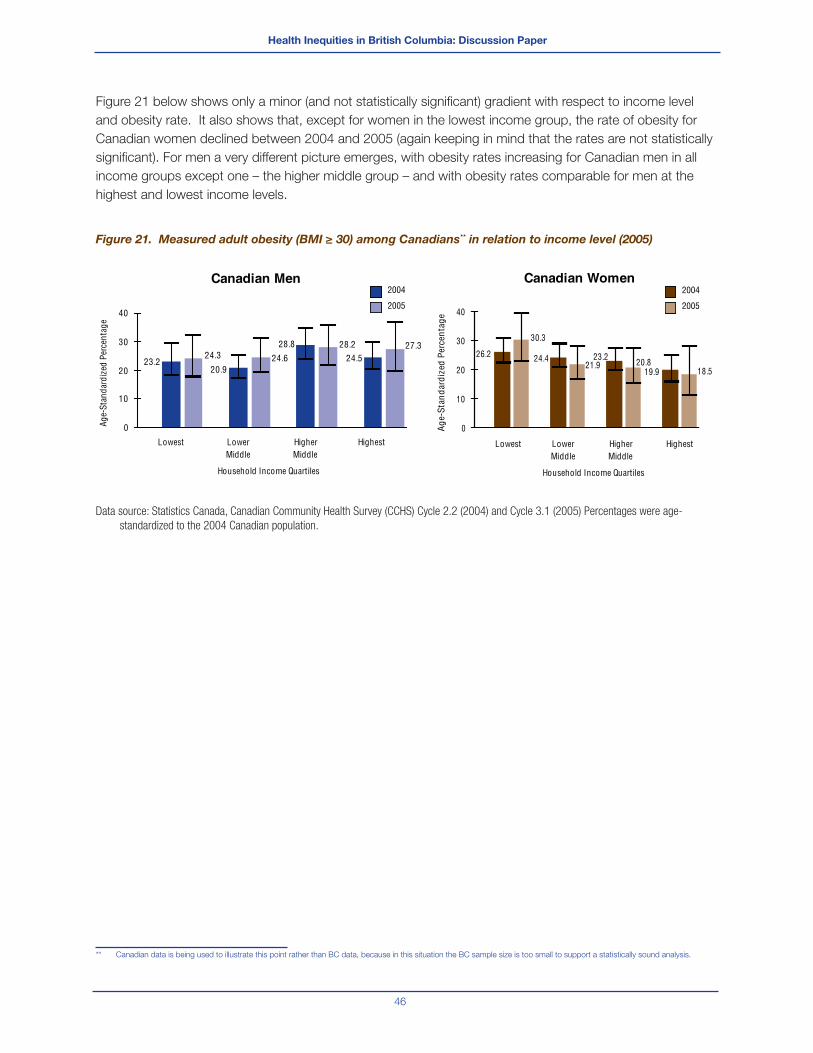
Health Inequities in British Columbia: Discussion Paper
46
Figure 21 below shows only a minor (and not statistically signifi cant) gradient with respect to income level
and obesity rate. It also shows that, except for women in the lowest income group, the rate of obesity for
Canadian women declined between 2004 and 2005 (again keeping in mind that the rates are not statistically
signifi cant). For men a very different picture emerges, with obesity rates increasing for Canadian men in all
income groups except one – the higher middle group – and with obesity rates comparable for men at the
highest and lowest income levels.
Figure 21. Measured adult obesity (BMI ≥ 30) among Canadians** in relation to income level (2005)
Data source: Statistics Canada, Canadian Community Health Survey (CCHS) Cycle 2.2 (2004) and Cycle 3.1 (2005) Percentages were age-
standardized to the 2004 Canadian population.
** Canadian data is being used to illustrate this point rather than BC data, because in this situation the BC sample size is too small to support a statistically sound analysis.
Canadian Men
28.8
0
10
20
30
40
Lowest LowerMiddle
HigherMiddle
Highest
Household Income Quartiles
Age-
Stan
dard
ized
Per
cent
age
2004
2005
27.328.2
24.624.323.2
20.924.5
Canadian Women
18.520.821.9
30.3
19.9
23.224.4
0
10
20
30
40
Age-
Stan
dard
ized
Per
cent
age
2004
2005
26.2
Lowest LowerMiddle
HigherMiddle
Highest
Household Income Quartiles
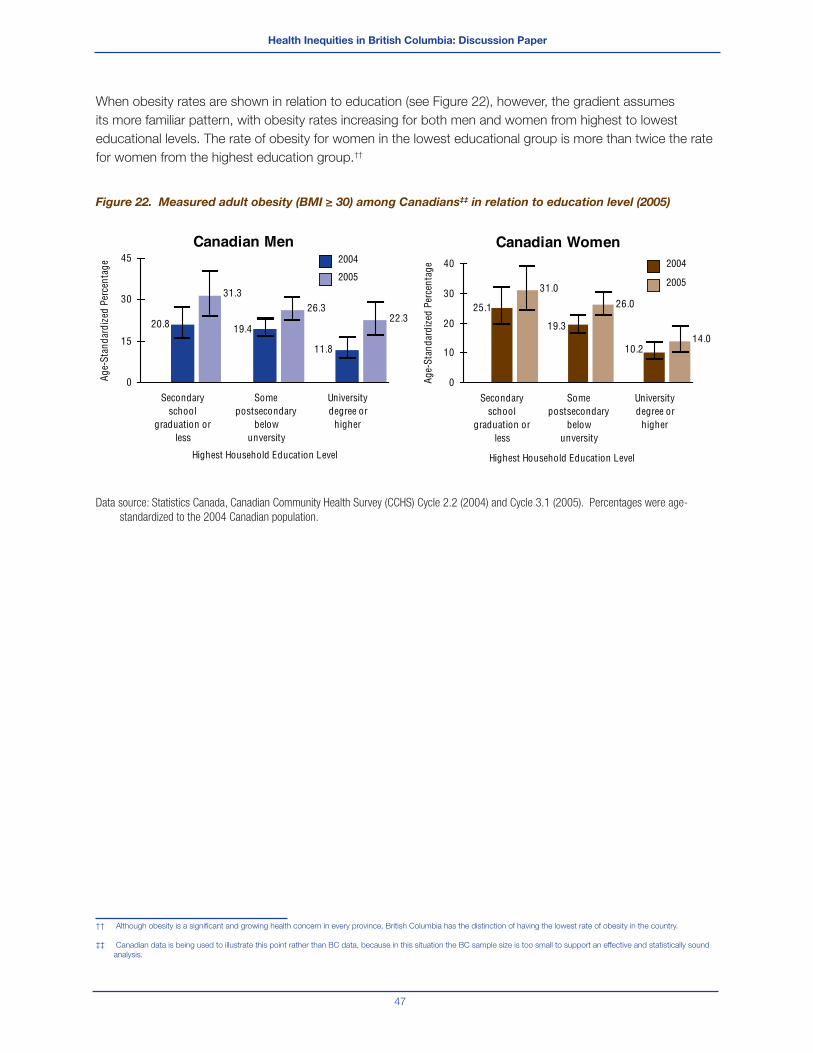
Health Inequities in British Columbia: Discussion Paper
47
When obesity rates are shown in relation to education (see Figure 22), however, the gradient assumes
its more familiar pattern, with obesity rates increasing for both men and women from highest to lowest
educational levels. The rate of obesity for women in the lowest educational group is more than twice the rate
for women from the highest education group.††
Figure 22. Measured adult obesity (BMI ≥ 30) among Canadians‡‡ in relation to education level (2005)
Data source: Statistics Canada, Canadian Community Health Survey (CCHS) Cycle 2.2 (2004) and Cycle 3.1 (2005). Percentages were age-
standardized to the 2004 Canadian population.
†† Although obesity is a signifi cant and growing health concern in every province, British Columbia has the distinction of having the lowest rate of obesity in the country.
‡‡ Canadian data is being used to illustrate this point rather than BC data, because in this situation the BC sample size is too small to support an effective and statistically sound
analysis.
Canadian Men
31.3
20.8 19.4
11.8
26.322.3
0
15
30
45
Secondaryschool
graduation orless
Somepostsecondary
belowunversity
Universitydegree or
higher
Highest Household Education Level
Age-
Stan
dard
ized
Per
cent
age 2004
2005
Canadian Women
26.0
10.2
19.3
25.1
31.0
14.0
0
10
20
30
40
Secondaryschool
graduation orless
Somepostsecondary
belowunversity
Universitydegree or
higher
Highest Household Education Level
Age-
Stan
dard
ized
Per
cent
age 2004
2005
Health Inequities in British Columbia: Discussion Paper
48
III. The Case for Addressing Health Inequities
In addition to the argument for addressing health inequities based on principles of social justice and
equality, a powerful economic case can be made for reducing the gap in health status between the richest
and poorest sectors of our society. This ‘case’ involves recognizing the substantial social, economic and
political costs associated with widespread inequities in health, and the benefi t of improved overall health for
individuals, communities and society as a whole.
These costs and benefi ts as well as some of the best practices evidence that supports interventions to
reduce health inequities are provided next.
General Economic Impact of Health Inequities
Health disparities are health system cost drivers. Because they are more often and more severely sick or
injured, people in the lowest quartile of income groups use approximately twice as much in the way of health
care services as those in the highest quartile. On the basis of an estimation of health care resources used
by Canadian households, one estimate is that approximately 20% of the total health care spending may be
attributable to income disparities.59
One team of researchers, Jerrold Oppenheim and Theo MacGregor, legal and energy consultants, presented
their fi ndings on the costs of poverty to the U.S. House of Representatives Committee on Ways and
Means Hearing on the Economic and Societal Costs of Poverty.60 Oppenheim and MacGregor’s report
includes factors such as transfers from government programs, direct costs to victims of crime, and some
unemployment costs. The report calculates avoidable annual costs of poverty using 2005 data for four
broad categories: crime, health, unemployment/underemployment, and current anti-poverty investments.
The total cost of poverty was estimated to be $1.5 trillion in 2005 US dollars. While not entirely generalizable
to the Canadian context, this report does give an idea of the enormous costs to society that accrue from
uncorrected health inequities.
The economic impact of health inequity has also been assessed in European research that distinguishes
between health as a ‘capital good’§§ (i.e. associated with labour productivity) and as a ‘consumption good’¶¶
(i.e. contributing to an individual’s happiness and well-being). Although the health inequities-related losses
ascribed to health as a capital good appear modest in relative terms (1.4 percent of GDP), they are signifi cant
in absolute terms (€141 billion per year). Valuing health as a consumption good, however, reveals the much
larger estimated impact of €1 trillion per year, or 9.4 percent of GDP stemming from health inequities. The
separately calculated impact on costs of social security and health care systems and health care support
these conclusions. Across the 25 European Union nations, inequities-related health issues are estimated to
account for 15 percent of social security system costs and 20 percent of health care system costs in the EU
as a whole.61
The BC Healthy Living Alliance estimates that three major risk factors associated with poverty and health
inequity (tobacco use, physical inactivity and overweight/obesity) “cost the BC economy approximately
§§ Included in the measure of health as a ‘capital good’ are the following GDP income components: wages and salaries, fi rm profi ts, mixed income, etc., and total income.
¶¶ Included in the measure of health as a ‘consumption good’ are the following: mortality, morbidity (40% of mortality) and total health.

Health Inequities in British Columbia: Discussion Paper
49
$3.8 billion annually.”62 If we extrapolate a high level estimate of the proportion of health care costs in BC
attributable to inequities by calculating 20% of the total annual health care spending in BC ($13 billion)163 we
also get a very high number ($2.6 billion annually).
The methodology of these various cost analyses can be questioned, but from the magnitude of the impacts
being examined, it is fair to conclude that the general costs to society associated with poverty and health
inequities are signifi cant and wide-reaching. In the following pages, some of the costs of specifi c health
inequities will be examined more closely.
Chronic Disease
Preventable chronic diseases such as type 2 diabetes and heart disease are huge drivers of cost within
our health care system, and their incidence and prevalence rates are climbing steadily. In Canada, chronic
disease accounts for approximately 67 percent of all direct health care costs and 60 percent of total indirect
costs, including lost productivity and foregone income.63 Investments and efforts to address the social
determinants of chronic disease toward reducing their prevalence would almost certainly contribute to
reduced overall health care costs and the greater sustainability of our health care system.
As noted in the previous section, the prevalence rates for these chronic diseases refl ect the health inequity
within our society. For example, men in BC’s lowest income households (earning less than $30,000/year) are
more than twice as likely to have heart disease than men with household incomes of more than $50,000 per
year. Similarly, BC women in the lowest income households (earning less than $22,000/year) are more than
three times as likely to have heart disease as women in households earning more than $40,000 per year.
The implication is clear. Efforts to address these health inequities could achieve a signifi cant reduction in the
prevalence of chronic disease, and a corresponding decrease in the demand for health services related to
those conditions.
Poverty
A US study claims the potential economic savings from the eradication of poverty in that country are so
substantial that it would be cost-effective to give cash grants to every low-income American household.64
The study estimates the cost of such a plan at $397 billion a year, but contends that giving more money to all
American families for spending on food, housing and other necessities, would raise education levels, reduce
crime, reduce homelessness, and in so doing, greatly increase the health of the nation. Through these
outcomes, the authors contend that even a simple cash grant scheme like this would save the US economy
almost four times its cost.
Food Insecurity
As reported previously, there is a large difference in reported food insecurity between households in the
lowest and highest income levels. There is also evidence that individuals with higher social and economic
status more regularly consume nutritious foods.65 It is important to note the great number of children living
in those households reporting food insecurity may be going to school hungry or poorly nourished, which

Health Inequities in British Columbia: Discussion Paper
50
means that their energy levels, memory, problem-solving skills, creativity, concentration and behaviour are all
negatively impacted.66
For low-income individuals, maintaining a nutritious diet can be a signifi cant challenge. In 2007 the average
cost of a nutritious monthly basket of food in BC was $715, representing 43 percent of the income of a
family of four on income assistance.
British Columbia’s Provincial Health Offi cer underlined the connection between income and food security in
his 2005 annual report and made sixteen recommendations for individuals, communities and governments to
address the problem. As he put it, “A collaborative effort at the community, provincial and national levels is
needed to address the underlying cause of household food insecurity – poverty.”67
In recognition of the strong correlation between food security and income security, a set of policy
considerations recently presented for discussion by PHSA all involve measures to increase income security.68
The report in which those considerations were presented notes that people with low-incomes spend a
disproportionate and signifi cantly high amount of their income on housing, which results in less money for
food and other essentials. It further proposes that although there is no existing research on this issue, it can
be assumed that in most cases low-income British Columbians would use additional income to improve their
living conditions, with increased food security and improved nutrition as a natural consequence. Among
poor families, increased income would almost certainly translate into better nutrition for their families.
The Community Food Action Initiative (CFAI) is a health promotion initiative of BC’s provincial government
aimed at increasing food security for all British Columbians. The CFAI is a collaborative effort of BC’s six
health authorities and the BC Ministry of Health. In a recent report69 the CFAI notes that although policies
that improve income security for British Columbians can provide an essential foundation for improving food
security, such policies should also be considered within a broader context. In addition to addressing the
issue of affordability, it also identifi es issues of availability and accessibility, which are determined by the
industrialized food system. It proposes that in order to address these issues most effectively, stakeholder
engagement is critical and identifi es local governments as a key stakeholder group. The CFAI recently
published a resource guide70 that further builds on this work by providing strategies and local examples of
community-based food security initiatives that focus on capacity building and community development. In
this resource guide, some of the many ways different local governments in BC are taking action to strengthen
their local food systems are highlighted.
The CFAI guide notes that improving food security involves integrating health, economic, ecological and
social factors, and action to increase food security can be seen as a continuum that ranges from providing
emergency food for those in need, to building capacity and access within the community, to redesigning the
local food system for sustainability.
Health Inequities in British Columbia: Discussion Paper
51
Lack of Access to Education and Low Literacy
Education
There are signifi cant differences in educational outcomes across BC’s various school populations, and
often dramatic differences across the provinces’ school districts. More generally, there are signifi cant social
gradients in childhood development, educational accomplishment, and literacy.71
Toward levelling the social gradient in education, the BC Progress Board, in its 2006 report on the social
condition in BC, recommended specifi c actions at all four levels of the learning ladder (early childhood,
primary and secondary schooling, post-secondary education, and adult training)72, including the need
to consolidate the administration of programs designed to lower the social gradient like Strong Start,
CommunityLinks and child care programs in an agency whose primary purpose is to enhance the
development of children.
In terms of childhood education, BC’s Provincial Health Offi cer (PHO) notes in his 2006 Annual Report that
there are several groups of students who do not do very well in school settings and whose developmental
and health status can be severely compromised.73 These are children in government care, those who have
been abused or have challenging home lives, those whose sexual orientations are not shared by the majority
of other students, and those who are marginalized or street involved. There are many overlaps among these
groups. Many come from families with low socio-economic status, and a disproportionate number of these
marginalized students are Aboriginal. The school is often not a welcoming place for them and so they are at
higher risk of dropping out, engaging in risky behaviours, running away from home, and/or becoming street-
involved. The PHO recommends that these at-risk students require special attention if they are to thrive as
healthy adults.
Literacy
An Expert Panel brought together by the Canadian Public Health Association defi nes health literacy as “the
ability to access, understand, evaluate and communicate information as a way to promote maintain and
improve health in a variety of settings across the life-course.”74
Research suggests that levels of literacy and health literacy vary signifi cantly from jurisdiction to jurisdiction
in Canada and among different population groups.75 The Expert Panel on Health Literacy (referenced above)
recently identifi ed that seniors, recent immigrants, those with lower levels of education and with low French
or English profi ciency and people receiving social assistance tend to have lower levels of literacy and health
literacy. Both are related to health outcomes and those with lower skill levels are more likely to experience
negative health outcomes. Low levels of health literacy present a formidable challenge to the effective,
widespread (and increasing) use of patient self management of chronic disease. Other outcomes of low
literacy and health literacy include lower incomes and less community engagement, which are associated
with poorer health and quality of life.
Although the evidence of the fi nancial costs associated with low health literacy in Canada is sparse, there
is enough Canadian and American research to suggest that policies designed to raise average health
Health Inequities in British Columbia: Discussion Paper
52
literacy levels might lead to improvements in population health and concomitant reductions in health costs.76
Attention should be directed to the population groups described previously that appear most likely to have
low levels of health literacy. These include seniors, recent immigrants, those with lower levels of education
and low French or English profi ciency, people with lower incomes and Aboriginal people. Policies and
programs are required to reduce the numerous and interconnected individual and system barriers to health
literacy.
Early Childhood Development: Unequal Opportunities,
Unequal Outcomes
Healthy early childhood development is a powerful determinant of health.77 Research shows that the
emotional, social and cognitive development of infants and children not only determines their immediate
health status, but contributes to lifelong competence, achievement and long-term health and social
outcomes.78 Early experiences can exert a powerful infl uence in altering well-being, building coping abilities
and competencies and helping make children physically strong and emotionally healthy.79
Children from disadvantaged backgrounds tend to be less ready for school from the start, and their
educational impairment can continue throughout their school years, as evidenced by behavioural problems,
lower cognitive performance, increased likelihood of dropping out of high school, and lower rates of
participation in post-secondary education.
Studies have shown, however, that disadvantaged children who participate in quality early childhood
development programs have higher educational and occupational outcomes, including staying in school
longer and earning higher wages later in life.80 Quality childcare programs also provide support to the family
by helping reduce stress on parents and enabling them to pursue employment or education opportunities.
In terms of a cost-benefi t analysis, there is a growing body of evidence that some of the greatest returns on
taxpayer’s investments are those targeted to Canada’s youngest citizens.81 Every dollar spent in ensuring
a healthy start in the early years will reduce the long-term costs associated with health care, addictions,
crime, unemployment and welfare.82 As well, it will ensure Canadian children become better educated, well
adjusted and more productive adults.83
Studies in the US have shown that increased investments in pre-school education for low-income families
have a benefi t-cost ratio of about 9:1.84 International research indicates that the return on investment
can be as high as $7.00 for every $1.00 invested when children living in high risk situations are provided
appropriate early support.85 Overall, strong evidence exists for the net benefi t preschool programs provide for
disadvantaged children - i.e. they demonstrate cost savings from the societal, general public and program
participants’ perspective. Benefi t/cost ratios range from 3.8 to a high of 8.7.86
A considerable body of economic evaluation evidence is also available for universal day care or preschool
programs. A recent cost-benefi t analysis undertaken in Canada showed that for every $1.00 invested
in licensed high quality childcare for children and their families, at least $2.00 of taxpayer’s money is
saved in the long-term.87 A review of fi ve economic evaluations of day care or preschool programs (one
set in Canada, one set in the UK and three set in the US)88 measured program benefi ts such as child
developmental effects, increased labour force participation, decreased welfare payments, increased lifetime

Health Inequities in British Columbia: Discussion Paper
53
income, and decreased crime. Results from these fi ve economic evaluations indicate that day care or
preschool programs are cost-saving from the societal perspective.
Inadequate Housing, Homelessness and Unhealthy
Communities
Inadequate Housing
Housing, particularly in a country with Canada’s climate, is one of the most basic requirements for a healthy
life. All people need housing that is permanent, decent, affordable, and accessible if we are to realize our
potential in society.89
The relationship between housing and health is complex, and has been investigated in numerous studies.90,91
Some researchers have identifi ed a subset of seven dimensions of housing as potentially infl uential factors on
health: physical hazards including chemical and biological exposure, physical design, social dimensions of
housing, psychological, political and fi nancial dimensions of housing and location. There is a growing body
of evidence that housing circumstances affect the mental health of families and individuals, has an impact on
educational outcomes for children, and infl uences how well new immigrants are able to integrate into a new
society.92,93
The housing need is being addressed to some extent through the government’s housing strategy, Housing
Matters BC and through other programs, but the need for affordable housing in BC remains greater than the
supply. In 2008, there were 11,000 households on the wait list for subsidized units with BC Housing.94 BC
has the highest core housing need in Canada, since 15% of citizens spend more than 30% of their income
on housing. When adequate house repair and size is factored in, the proportion of those spending in excess
of 30% climbs substantially: 43% of renters and 24% of home owners.95 When people spend excessive
amounts of income on housing, fewer resources are available for other health essentials.96 The impacts on
children in families spending the majority of their income on rent are particularly severe, including a high risk
of malnutrition and higher risk of respiratory and other diseases.97
According to the Canadian Policy Research Network in its report “Housing is Good Social Policy,” the
cost to our society of not providing appropriate housing far exceeds the cost of doing so, when all factors
are considered. On the other hand, studies suggest that affordable housing improves health outcomes
by: freeing up resources for nutritious food and other essentials, reducing stress, exposure to allergens,
neurotoxins and other dangers, and providing stability enabling patients with chronic diseases to access and
maintain the level of care they need.98
Homelessness
From a public health perspective, perhaps the most acute manifestations of the housing issue relate to
homelessness. The homeless population in Vancouver increased signifi cantly between 2002 and 2005 – and
half of those persons were not staying in emergency shelters but living outside.99

Health Inequities in British Columbia: Discussion Paper
54
Homelessness has very serious negative health consequences associated with it. Poor health is shown to
cause homelessness, but poor health is both caused by and exacerbated by homelessness. Those sleeping
rough or living in hostels have a higher risk of death and disease than those who are well-housed (mortality
rates for people who are homeless can be up to 10 times higher than people who are adequately housed).100
Homeless people have a range of chronic health problems due to their extreme poverty, lack of stable
housing and exposure to the elements on the street. They are less likely to receive adequate medical care
and more likely to draw upon emergency medical services.101
There is a strong economic rationale for transitioning the homeless into supportive housing. In British
Columbia, a recent report has estimated that the current annual cost of maintaining a homeless person with
a dual diagnosis of mental illness and drug addiction living on the street (including health and prison system
costs only) is $55,000 per year. Based on an estimated 11,750 of such individuals throughout the province,
this amounts to a total annual expenditure of about $644 million.102
The same report proposes that by providing adequate housing and related support for this population,
annual health and prison system costs could be cut by $211 million, reducing the cost of support for each of
these people by a third, to $37,000 per year.
Unhealthy Communities
How communities are planned and built can signifi cantly impact the health of the people living there. The
phrase ‘built environment’ refers to the surroundings that we humans have created. These surroundings
include both indoor and outdoor places and vary from large-scale urban areas to smaller rural development
and personal spaces.103 Built environments can infl uence physical and mental health through factors such
as community design, adequate housing, access to safe water, good sanitation, safe neighbourhoods, and
adequate access to education, recreational services, public transit and child care.104 In essence, the built
structure provides the setting for many of the social determinants of health.105
In a recent evidence review, the majority of the research examined found a clear relationship between the
built environment, physical activity and body weight.106 More specifi cally, the following relationships were
identifi ed:
Walkable neighbourhoods are associated with changes in travel behaviour (i.e., less driving and more
walking, cycling and use of public transit)
Walkable neighbourhoods are associated with lower body weights
Increased density is associated with less pollution
Pedestrian-friendly streetscapes encourage physical activity
Pedestrian-friendly streetscapes are associated with fewer traffi c accidents and less crime
Public transit encourages physical activity
Improving the food environment can improve nutrition
The conclusion of this review was that there is strong support for making changes to the built environment to
help promote healthy body weight and improve population health.
Health Inequities in British Columbia: Discussion Paper
55
Failure of Underregulated Market Mechanisms
To a certain extent, the existence of health inequity in our society represents a failure of the laissez faire
economic model under which we live. Under ideal conditions, the free coordination of individuals produces
an outcome that is not only in the best interest of the individual but also represents the best possible
outcome for society. The neoclassical model, on which this ideal view is based, is based on the following
central assumptions:107
All costs and benefi ts are internal (or ‘private’): All the costs and benefi ts associated with a given choice
are taken into account and borne by the person making that choice.
Rationality: Individuals maximize some objective function (e.g., their utility function) under the constraints
they face, weighing the cost they would expect to incur with the expected benefi ts of the choice in
question. The decision ultimately taken is the one that maximizes net benefi ts (or utility).
Perfect information: Individuals have complete information about the expected consequences of their
actions.
Preferences are time-consistent (or put simply: individuals face no serious self-control problems).
If these assumptions are met, there is no justifi cation for public policy intervention. In reality, however, one or
more of the above assumptions often do not hold true. The end result is that the market – left alone – does
not achieve the outcome most desirable for society.
An example of how this market failure occurs is helpful to examine. One of the functional strengths of our
market-based economy rests on an assumption of all citizens being rational and well informed about the
goods and services they consume. This assumption, however, is based on the construct of an ideal market
in which all consumers are equally able to assess the costs and benefi ts of the choices presented to them.
Signifi cantly, this scenario does not take into account the extraordinary power of advertising as an infl uence
on consumer decisions. The ability of advertising and marketing to infl uence consumers to make choices
that are not in their best interests for health is well established, and evidenced by the epidemic of obesity in
our society. Customers of fast food restaurants, for example, are invariably presented with options for ‘super
sizing’ their meal choices, and high-fat/high-sugar junk foods are treated by many families as a normal part of
their daily diet.
In these and other respects, advertising has contributed to a failure of the market mechanism that hinges
on consumers making informed, rational choices that maximize their benefi t. In fact, the most successful
advertising motivates consumer choice on the basis of emotion rather than reason. These concerns are
made more serious by the extent of advertising directed at children, especially regarding food products that
contribute to the rising incidence of childhood obesity.
Counteracting the impact of advertising for products and behaviours associated with negative health
outcomes (e.g., tobacco, alcohol, fast food, soft drinks) through government-funded public information
campaigns is only part of the solution. The vast resources and creativity of advertisers will always limit
the effectiveness of public awareness initiatives. Ultimately, the failure of the market mechanism to ensure
rational, healthy choices by consumers – and the consequent health problems and related cost impacts
on our health care system – has created a situation where public policy intervention is justifi ed. Such
public policy has long been used in British Columbia for the regulation of tobacco and alcohol, and is now
Health Inequities in British Columbia: Discussion Paper
56
increasingly emerging in other areas toward serving the same goal of improved population health (e.g.,
eliminating low-nutritional junk food from vending machines in schools).
Another example arises in the area of ‘externalities’. Many industries in the market such as tobacco, soft
drink, fast food and car manufacturers are not responsible for the damage their products cause to the
health of the population. If the huge health care costs that these products cause were built into their pricing,
consumption would likely decrease substantially.
In summary, where any of these conditions are not being met in the marketing of a product (e.g., there is
a lack of rational, well-informed consumers and/or producers who are not responsible for externalities),
economists recognized (even before the recent, massive failure of fi nancial institutions) that there is a need for
government intervention when the market mechanism has failed and is causing societal harm.
Health Care Expenditures vs. Investments in Other Social
Programs
In comparative reviews of population health levels among developed nations, it has been observed that the
overall health of a population declines as economic inequality within the population increases.108 In Sweden
and Norway, for example, where economic disparity is relatively limited, people enjoy longer average life
spans than do people in the US, the wealthiest nation in the world, but also one with signifi cant economic
disparity. Similarly Japan, with the longest life expectancy in the world, has a narrower gap in income
distribution than most countries in the developed world. From these observations it seems that economic
equality can be more important than wealth for the overall health of a population.
It is interesting to note that countries characterized by higher social spending in support of policies to reduce
social, economic and health inequalities are not, as a result, disadvantaged in their ability to compete in
trade with other nations. Sweden, for example, is ranked fourth in the world by the World Economic Forum,
for the competitiveness of its economy, just behind Denmark, the country with the lowest rate of childhood
poverty in Europe. The US is fi rst and Canada is 13th on this widely-accepted annual ranking of global
competitiveness.109
On a related point, it has been noted that the level of expenditure on health care is not necessarily a
dominant factor in determining the health of a population. This observation is well supported by comparing
Cuba and the United States on life expectancy and health care spending. Cuba, with an average life
expectancy of 77.1 years, is ranked 28th in the world, just behind the US (78.0 years). However, the annual
per capita spending on health care in Cuba is among the lowest in the world; at $186 it is a small fraction of
the $4500 per person spent in the US.110
A recent report by an expert commission on health inequalities in Europe also came to the disturbing
conclusion that the health gap between Europe’s most affl uent and least affl uent citizens has actually
increased during the past twenty years, despite substantial improvements in health care systems.111
From the foregoing it appears that simply spending more money on health care is not the most effective
strategy for increasing the overall health of a population, whereas efforts to reduce social and economic
inequities are likely to be more effective in leading to overall improvements in population health.

Health Inequities in British Columbia: Discussion Paper
57
Another US study takes issue with the current concentration of investment in medical technologies as an
avenue for improving population health. Although technological advances have certainly contributed to longer
life expectancy, producing an average incremental gain in life span of about one percent a year over the past
100 years, given the prodigious levels of investment in the technologies of medical care – at billions of dollars
a year – this modest annual gain hardly seems impressive. In fact from a cost-benefi t perspective, there is
weak support for investing in new medical technologies to achieve gains in population health. Although there
will always be a need for medical innovation, to achieve real progress in population health these efforts would
be much more effective in combination with initiatives to reduce health inequities.112
In support of this position, researchers reviewed US vital statistics from 1996 to 2002 to determine the
number of deaths averted through medical advances in comparison with the number of deaths that would
have been averted if mortality rates among adults with lesser education were raised to the rate for college-
educated adults. The results showed that medical advances averted about 178,193 deaths during the
study period, while correcting disparities in education-associated mortality rates would have saved almost
eight times as many lives (1,369,335 lives) over the same period. From this perspective, spending massive
amounts of money on medical advances instead of addressing the social determinants of health (in this case,
improved access to education) does not serve the public health needs of the nation.113
The Public Health Agency of Canada (PHAC) has reached this same conclusion. PHAC has stated that
“there is mounting evidence that the contribution of medicine and health care is quite limited, and that
spending more on health care will not result in signifi cant further improvements in population health. On the
other hand, there are strong and growing indications that other factors such as living and working conditions
are crucially important for a healthy population.”114
“The kind of communities that we develop is a more important determinant of health status of the
population than the kind of health care we construct.”
Vancouver Island Health Authority
Understanding the Social Determinants of Health, 2006.115
Canadian senator Wilbert J. Keon, co-chair of the Senate Standing Committee on Social Affairs, Science &
Technology, has taken this line of thinking one step further. He has gone so far as to call increased health
care spending a threat to population health:
“Increased expenditures on health care are likely impacting negatively on the general health of our
population by virtue of diminished investments in other areas like education (especially early childhood
education), public housing, income security and other public services.”
Senator Wilbert Keon
Quoted in The Hill Times, 2008.116

Health Inequities in British Columbia: Discussion Paper
58
The Cost of Inaction
Some of the direct costs to the health care system resulting from health inequities have been identifi ed, and
these costs will only grow if the causes of health inequities are not addressed. There are also indirect costs
such as lost productivity, that have negative repercussions for the entire economy.117
Some of the signifi cant costs to the private sector associated with health-care spending and unhealthy
populations will be examined next.118 First, businesses bear a portion of the burden of supporting public
health-care spending through taxation. When health-care costs rise in our publicly funded system, higher
taxes may affect Canadian businesses’ ability to grow and compete in the global economy. Second,
businesses suffer when their workforce is unhealthy, as demonstrated through the costs of both absenteeism
and presenteeism, a phenomenon whereby workers are physically present at work, but less than maximally
productive due to fatigue, stress, mental illness or other health issues.119 In 2006, the Halifax Chamber of
commerce estimated that the province of Nova Scotia lost $1.185 billion in productivity due to absenteeism.
One study suggests that employers can lose “up to 32 times as much productivity from presenteeism
as from absenteeism.”120 Third, Canada’s current tight labour market means that employers are fi nding
themselves engaging in aggressive competition for workers. Employers recognize the importance of keeping
their workers healthy so that business can continue.
Both government and business are negatively affected by poor health and health-care costs; both have
tremendous economic and social gains to make when good population health is achieved. Recent reports
and evidence reviews have suggested that investing in health should not just be seen as a cost to society,
but also as a potential driver of economic growth.121
Benefi ts of Addressing Inequities
Evidence and experience have shown that action on reducing health inequities has many potential benefi ts
for the health system, health outcomes and the overall quality of life of Canadians in the following three
ways.122
Given that there is a gradient of health status across the entire range of socio-economic determinants, 1.
addressing health inequities will improve the health of all.
Better health enables more people to participate in the economy, reducing the costs of lost productivity. 2.
Addressing inequities by tackling the socio-economic determinants of health will also result in healthier
employees, customers and communities generally. This, in turn, will positively affect economic growth
and the fi nancial bottom line of companies by increasing competitiveness, productivity and profi tability.
A further advantage of addressing health inequities is the potential for stemming the rapid increase in 3.
usage of health services. Easing the demand for services would decrease cost drivers, reduce pressures
on the delivery of health services, and, over the long term, contribute to the fi nancial sustainability of our
health care system.
It is important to note that a comprehensive review of economic evaluations of prevention initiatives,
commissioned by the Canadian Medical Association and released in May, 2004 by the Canadian Coalition
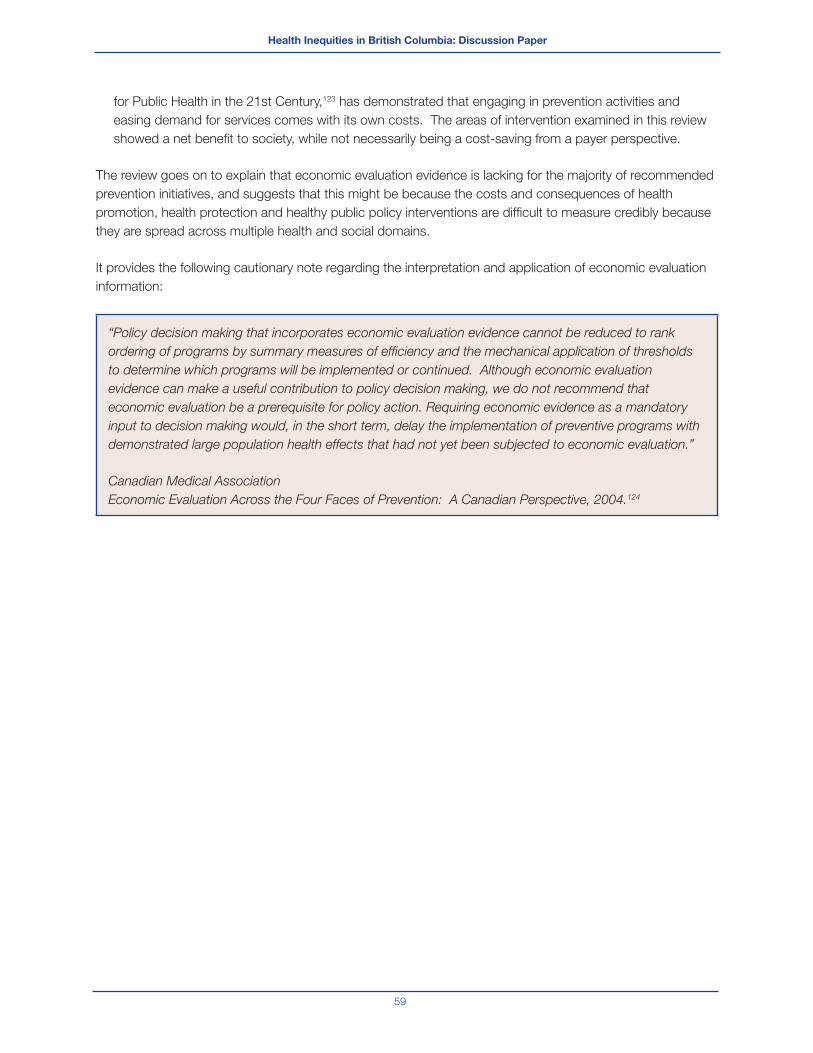
Health Inequities in British Columbia: Discussion Paper
59
for Public Health in the 21st Century,123 has demonstrated that engaging in prevention activities and
easing demand for services comes with its own costs. The areas of intervention examined in this review
showed a net benefi t to society, while not necessarily being a cost-saving from a payer perspective.
The review goes on to explain that economic evaluation evidence is lacking for the majority of recommended
prevention initiatives, and suggests that this might be because the costs and consequences of health
promotion, health protection and healthy public policy interventions are diffi cult to measure credibly because
they are spread across multiple health and social domains.
It provides the following cautionary note regarding the interpretation and application of economic evaluation
information:
“Policy decision making that incorporates economic evaluation evidence cannot be reduced to rank
ordering of programs by summary measures of effi ciency and the mechanical application of thresholds
to determine which programs will be implemented or continued. Although economic evaluation
evidence can make a useful contribution to policy decision making, we do not recommend that
economic evaluation be a prerequisite for policy action. Requiring economic evidence as a mandatory
input to decision making would, in the short term, delay the implementation of preventive programs with
demonstrated large population health effects that had not yet been subjected to economic evaluation.”
Canadian Medical Association
Economic Evaluation Across the Four Faces of Prevention: A Canadian Perspective, 2004.124

Health Inequities in British Columbia: Discussion Paper
60
IV. Health Inequity Policy Considerations
Success in Other Jurisdictions
In 1980, Great Britain’s Black report on inequalities in health marked a milestone in understanding how
social conditions shape health inequity.125 Black and his colleagues revealed a basic conundrum – that
health inequalities in Britain had worsened over the decades since the introduction of the National Health
Service in 1948. They contended, however, that the inequalities were not the result of a failure of the health
care system, but stemmed from an increase in social inequalities. They argued that reducing the health gap
between privileged and disadvantaged social groups in Britain would require reducing the social inequalities,
through ambitious intersectoral interventions involving education, housing and social welfare reforms, in
addition to improved clinical care.
The Black Report inspired similar national inquiries in such countries as the Netherlands, Spain and Sweden.
By the late 1990s, health equity and the social determinants of health were being embraced as explicit policy
concerns by countries across the European Union in response to mounting evidence that existing health and
social policies were not reducing persistent gaps in health equality.126 Reducing inequities in health is now
an objective for public health policies in many countries around the world. Several countries have proposed
goals to reduce the gap in health status for specifi c groups by amounts ranging from 10 to 50 percent.127
In Europe, the UK, Sweden and Ireland are three countries that have made signifi cant efforts to address
health inequity through broad-based policies directed at the structural determinants of health, and it is
informative to look more closely at what actions they have taken.
The UK
In 1998, the UK government conducted a study of health inequalities, examining the social, economic and
environmental factors affecting peoples’ health, and a summary report provided forty recommendations
to tackle the underlying issues at the root of health disparities. It also emphasized that addressing the
short-term consequences of ill health is not enough and that efforts must be made in partnership with the
voluntary, community and business sectors, as well as individual citizens to prevent ill health and promote
healthy living.128
In 1999, “The National Health Services (NHS) Plan: A Plan for Investment, A Plan for Reform” committed
government to local targets to reduce health inequalities with reinforcement from proposed national health
inequalities targets.129 A cross-cutting federal review followed in 2002 that examined how government
spending could be applied to greatest effect on health inequalities.130
Based on this research and advice, the Department of Health committed to reducing inequalities in health
outcomes by 10% by the year 2010 as measured by infant mortality and life expectancy at birth. A high-level,
government-wide strategy called “A Programme for Action” was then developed. The fi rst principle of the
strategy was to stop the UK’s health gap from widening further, before trying to narrow it.131
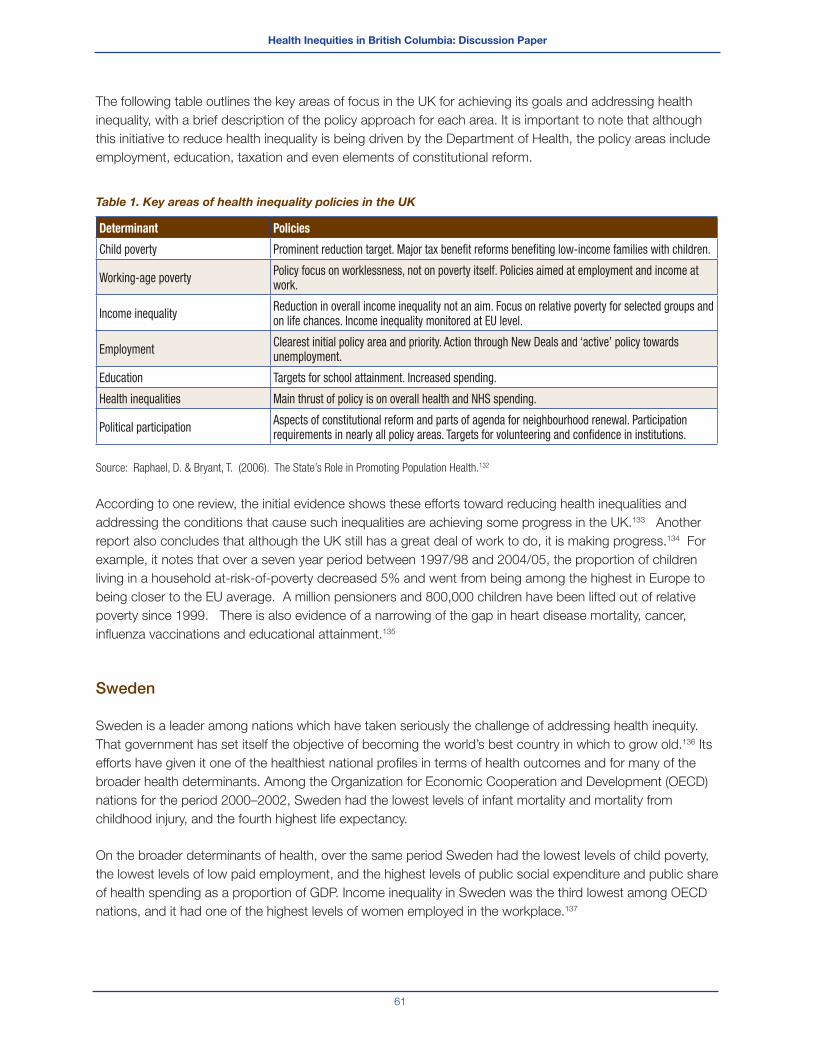
Health Inequities in British Columbia: Discussion Paper
61
The following table outlines the key areas of focus in the UK for achieving its goals and addressing health
inequality, with a brief description of the policy approach for each area. It is important to note that although
this initiative to reduce health inequality is being driven by the Department of Health, the policy areas include
employment, education, taxation and even elements of constitutional reform.
Table 1. Key areas of health inequality policies in the UK
Determinant Policies
Child poverty Prominent reduction target. Major tax benefi t reforms benefi ting low-income families with children.
Working-age poverty Policy focus on worklessness, not on poverty itself. Policies aimed at employment and income at work.
Income inequality Reduction in overall income inequality not an aim. Focus on relative poverty for selected groups and on life chances. Income inequality monitored at EU level.
Employment Clearest initial policy area and priority. Action through New Deals and ‘active’ policy towards unemployment.
Education Targets for school attainment. Increased spending.
Health inequalities Main thrust of policy is on overall health and NHS spending.
Political participation Aspects of constitutional reform and parts of agenda for neighbourhood renewal. Participation requirements in nearly all policy areas. Targets for volunteering and confi dence in institutions.
Source: Raphael, D. & Bryant, T. (2006). The State’s Role in Promoting Population Health.132
According to one review, the initial evidence shows these efforts toward reducing health inequalities and
addressing the conditions that cause such inequalities are achieving some progress in the UK.133 Another
report also concludes that although the UK still has a great deal of work to do, it is making progress.134 For
example, it notes that over a seven year period between 1997/98 and 2004/05, the proportion of children
living in a household at-risk-of-poverty decreased 5% and went from being among the highest in Europe to
being closer to the EU average. A million pensioners and 800,000 children have been lifted out of relative
poverty since 1999. There is also evidence of a narrowing of the gap in heart disease mortality, cancer,
infl uenza vaccinations and educational attainment.135
Sweden
Sweden is a leader among nations which have taken seriously the challenge of addressing health inequity.
That government has set itself the objective of becoming the world’s best country in which to grow old.136 Its
efforts have given it one of the healthiest national profi les in terms of health outcomes and for many of the
broader health determinants. Among the Organization for Economic Cooperation and Development (OECD)
nations for the period 2000–2002, Sweden had the lowest levels of infant mortality and mortality from
childhood injury, and the fourth highest life expectancy.
On the broader determinants of health, over the same period Sweden had the lowest levels of child poverty,
the lowest levels of low paid employment, and the highest levels of public social expenditure and public share
of health spending as a proportion of GDP. Income inequality in Sweden was the third lowest among OECD
nations, and it had one of the highest levels of women employed in the workplace.137
Health Inequities in British Columbia: Discussion Paper
62
These results can be directly attributed to the Swedish government’s explicit recognition of the broad
social determinants of health and its willingness to tackle the socioeconomic structural reforms required for
reducing health inequity. This recognition is refl ected in the following statement from a Swedish Ministry of
Health and Social Affairs report:
“A universal welfare policy and an active labour-market policy are characteristic features of the Swedish
social model and their poverty rates have for many years been very low compared to Canada, especially for
lone parents. Sweden’s welfare system includes general health care and social care, social insurance that
provides fi nancial security in illness, disability and old age and for families with young children and basic
supplementary protection in the form of fi nancial assistance.” 138
It also has a long-term vision, however, to set specifi c priorities based on its own areas of greatest need.
For example, for the period 2006-2008, it intends to create more jobs, reduce ill-health at work and tackle
homelessness (to name only a few priorities). It has made efforts to improve coordination across local,
regional and national authorities, and has even created a commission whose work is focused on particularly
vulnerable service users.
Ireland
After extensive consultations with stakeholders (including people experiencing poverty), a 10-year National
Anti-Poverty Strategy was launched in 1997, which identifi ed specifi c poverty reduction targets.139 Plans
to reach the targets included a combination of new and existing measures focused on children – early
childhood development and care, improving education and health outcomes, and income support. Ireland’s
results so far are impressive. The rate of people experiencing consistent poverty dropped from 15.1% in
1994 to 5.3% in 2001. In the year between 2003 and 2004, the rate for children under age 15 dropped from
12.2% to 9.5%.
Other Jurisdictions
A recent WHO document analyzed 18 case studies from a variety of high, middle and low income
countries.140 The case studies outlined diverse experiences of action across sectors with positive impacts
for health and health equity. The 18 case studies represented a broad array of initiatives that ranged from
relatively small-scale programs that used a community development approach with a marginalized group in
one city, to broad, policy-focused initiatives from national governments.
Initiatives were planned and implemented at national, regional and local levels. In the 18 case studies
reviewed, true cooperation in planning, implementation and evaluation was facilitated when it took place
at several levels simultaneously, especially if the work at each of those levels was integrated through policy
or legislation. Almost all of the 18 case studies reported some positive outcomes that were thought to be
attributable to intersectoral collaboration.
These various efforts worldwide are supported by a wide variety of policy approaches, taking place at many
levels and across many sectors. What is clear for any policy approach to tackling health inequity, is that it
must acknowledge a distinction between the behavioural determinants and the social determinants of health.
To be successful, interventions to improve health equity must address structural factors (e.g., inequalities in

Health Inequities in British Columbia: Discussion Paper
63
income and education) as well as physical and social environments. Interventions targeted only at changing
adverse health behaviours will have limited overall success, offering only microenvironmental solutions to a
macroenvironmental problem.141
A commitment to improving health equity ultimately requires addressing not only the disadvantaged
circumstances and health-damaging behaviours of the poorest groups in our society, but also the systemic
differences in life chances, living standards and lifestyles associated with people’s unequal positions in
society.
Success in Canada
In Canada, we have never had a national anti-poverty strategy, but Quebec and Newfoundland & Labrador,
however, both have provincial strategies.
Quebec
In Quebec, the anti-poverty strategy was initiated by a broad-based citizens’ movement called “Le Collectif
pour un Quebec Sans Pauvrete” which involves 30 provincial organizations and 15 regional groups aiming
to fi ght poverty and social exclusion at their root causes. In 1998 the Collectif formed and held public
consultations which resulted in the unanimous adoption of the Act to Combat Poverty and Social Exclusion142
by the provincial legislature in 2002. Quebec is currently the only jurisdiction in Canada to enact a law to
combat poverty and social exclusion.
Quebec’s overall goal is to achieve one of the lowest levels of poverty among industrialized societies by
2013. In Quebec, like in the EU, there is a commitment to the larger objectives of reducing social exclusion,
prejudice and inequalities that are detrimental to social cohesion and to encouraging participation in
community life and social development.
To achieve this goal, the government proposed different approaches, which included implementing
prevention measures, strengthening the social and economic safety net, promoting access to employment,
encouraging the involvement of society as a whole, and ensuring consistent and coherent intervention.143
An advisory committee that included members from anti-poverty groups and from various sectors of
Quebec society ensures there is citizen engagement in the ongoing implementation and evaluation of the
strategy. The Act also calls for a monitoring, research and discussion centre which is charged with the task
of recommending a series of poverty and social exclusion indicators. Quebec’s goals, targets and initiatives
also come with signifi cant budgets. In its 20045-05 Budget, the Government of Quebec announced that
a total of $2.5 billion would be allocated over fi ve years to carry out the provisions of the Act to Combat
Poverty and Social Exclusion.144
It is premature to assess the success of Quebec’s strategy to combat poverty and social exclusion, but
available data show that the proportion of people living on low incomes in the province has decreased
steadily from 1997 to 2006. According to a progress report on Quebec’s action plan, the number of
recipients of last-resort fi nancial assistance has decreased from 404,360 in 2003 to 379,694 in 2007.145
Health Inequities in British Columbia: Discussion Paper
64
There were also about 20,000 fewer children living in families receiving last-resort fi nancial assistance in 2007
(119,939 children) than in 2003 (139,869 children) – a reduction of 14.2%.
Newfoundland & Labrador
In 2006, Newfoundland & Labrador became the second province in Canada to adopt a comprehensive
poverty reduction strategy. In contrast to Quebec, the strategy was initiated by government, and stemmed
from a 2003 election promise and Speech from the Throne in 2005, in which the government pledged to
transform Newfoundland & Labrador from a province with the most poverty to a province with the least
poverty over the next decade. Community groups, business and labour were involved in designing the
strategy and its associated initiatives. Consultation continues to be a central part of the strategy, as does
strong coordination across different parts of government.
As in Quebec, the Government of Newfoundland & Labrador uses a defi nition of poverty that not only
refl ects a lack of adequate fi nancial resources but also includes social exclusion. The specifi c goals of the
province’s Poverty Reduction Strategy include: improved access and coordination of services for those with
low incomes, a stronger social safety net, improved earned incomes, improved early childhood development,
and a better educated population.146 To fulfi ll these four goals, a number of initiatives have been undertaken
such as: tax reductions for low-income individuals and families; measures to enhance both the supply
and demand for labour; increased social and fi nancial supports, increased access to affordable housing;
improved access to health programs and other essential services; enhanced justice system supports; and
actions to strengthen early learning and child care programs, improve the primary and secondary school
system, and provide greater access to post-secondary education, literacy, and adult basic education.147
Poverty indicators are also a key part of the strategy. As in Quebec, resources are attached to the plans.
Budget 2006 committed over $30.5 million in 2006-07 to develop and implement an integrated package of
20 initiatives aimed at reducing poverty in Newfoundland & Labrador, and $64 million annually thereafter.148
Budget 2007 promised an additional $28.9 million for the poverty reduction strategy, for a total annualized
investment of over $91 million.149
National Public Pensions
At the national level, Canada and its provinces have made policy decisions that have signifi cantly reduced
poverty amongst seniors over the past forty years.150 At the start of the last century, public pensions were
non-existent. At that time, Canadian seniors were much more likely to be economically disadvantaged
than the general population, and, as a result, were at risk of much poorer health.151 When Old Age Security
(OAS) was introduced in 1952, it was Canada’s fi rst universal pension. In the three decades following the
creation of the OAS, other pensions were made available: the employment-based Canada Pension Plan
(CPP) and Quebec Pension Plan (QPP), the income-tested Guaranteed Income Supplement (GIS), and an
income tested Spouse’s Allowance (SPA) and Widowed Spouse’s Allowance.152 Provincial/territorial income
supplements for seniors were also added along the way. Today, over 95% of seniors receive income from
OAS, GIS or SPA. As well, 96% of senior men and 86% of senior women receive CPP/QPP benefi ts. As
Canada’s public pension system matured, more seniors than ever became eligible for benefi ts and their after-
tax income increased by 18% between 1980 and 2003.153 This maturation has been cited as a key factor
in the major shift of Canada’s prevalence of low-income among seniors – from one of the highest among
industrialized nations in the 1970s to one of the lowest today.154,155
Health Inequities in British Columbia: Discussion Paper
65
Guiding Principles and Key Considerations for Addressing
Health Inequities in BC
Guiding Principles
Based on a review of promising practices in other jurisdictions, guiding principles and key considerations for
a well-founded and effective policy approach to addressing health inequities include:
Levelling up, not down. The goal should be to continuously raise standards of health, education, living
and working conditions and social well-being for all citizens; the challenge is to achieve both a raising and
a levelling of the social gradient in these areas by ensuring that the most disadvantaged benefi t most.
Not making the inequities worse – helping the worst-off fi rst. Universal interventions can have the
unintended effect of providing the most help to the groups who need it least and therefore increasing
inequity. It will be important to develop intervention programs based on a combined universal/targeted
approach (i.e., additional targeted interventions may be needed for the more disadvantaged members of
society).
Using a combination of regulatory and structural interventions for greatest impact in reducing
socioeconomic stratifi cation.
Recognizing that complex problems require complex solutions; health inequities must be addressed on
many fronts, through multiple, interrelated strategies.
Key Considerations
Addressing the social determinants of health that contribute to health inequity must be a 1.
government priority, and resources must be allocated accordingly.Those jurisdictions that are making signifi cant progress in addressing the social determinants of health
(e.g., Newfoundland, Quebec, UK, Sweden) have specifi cally identifi ed it as a government priority,
and have allocated signifi cant resources towards the efforts. If such objectives are not supported by
government as a priority and resourced appropriately, they stand little chance of overall success.
Reducing health inequities requires a multisectoral approach, involving cooperation 2.
across all levels and areas of government, business and society.Health inequities develop from such social determinants as income, education, living and working
conditions, gender and ethnicity (to name only a few) – areas well beyond the normal reach of health
policy. Therefore, to effectively address health inequity, an organized, multisectoral approach is required,
involving various ministries of government in a coordinated policy approach, and involving all levels of
government ranging from local to national.156 The business sector has a key role to play in addressing
inequities, in order to ensure employees, customers and communities are as healthy as possible.
Non-governmental organizations (NGOs) and the community sectors, including labour unions and faith
organizations, also have an important role to play, as do community members themselves.

Health Inequities in British Columbia: Discussion Paper
66
Setting targets and tracking progress is part of the continuous improvement process.3.
All jurisdictions with fully-developed strategies for reducing health inequity have established clear targets
for their initiatives, and have developed results-based (as distinct from activity-based) mechanisms for
tracking results. Results are analyzed and programs and polices are revised accordingly, effectively
closing the feedback loop and contributing to a process of continuous improvement.
Health Inequities in British Columbia: Discussion Paper
67
V. Policy Options for Reducing Health Inequities
In the previous section, an examination is presented of the most serious health inequities in BC and the
social determinants of health contributing to those inequities. The case is made as to why addressing the
social determinants of health is advisable – from both an economic perspective (costs and benefi ts), as well
as a health outcome perspective. Information from other jurisdictions that have implemented strategies to
address poverty and the social determinants of health is reviewed. Guiding principles and key considerations
for addressing health inequities in are identifi ed.
Based on the information, evidence and promising practices identifi ed in this paper, taken together with the
input obtained through a broad province-wide consultative process, fi ve broad policy areas for reducing
health inequities are offered for consideration. These policy areas are:
Income and food security (ensuring adequate incomes and access to affordable, nutritious food) 1.
Education and literacy (increasing access to education, improving educational outcomes, and enhancing 2.
literacy skills)
Early childhood development (ensuring that children are provided as many advantages as possible for 3.
optimal development)
Housing and healthy built environments (ensuring access to safe, affordable housing and enhancing the 4.
liveability of neighbourhoods)
Health care (ensuring equitable access to health services, and ensuring health care programs and 5.
services apply an inequities lens)
It is important to recognize that many specifi c actions could be taken within each of these policy areas.
The options identifi ed here have been selected because they have been identifi ed in other expert-informed
documents or through consultative processes as being promising practices with likelihood of success in
BC. In implementing any one of these actions, there is a great deal of best practices literature that can be
consulted regarding criteria for designing and implementing programs and policies most effectively.
It is also critical to note that of all the policy options presented here, this paper supports the conclusion of the
BC Healthy Living Alliance which has said that, “No single policy will be effective in itself. What is required is
an integrated approach that will deal with the complex problems of health inequity from various angles.”157

Health Inequities in British Columbia: Discussion Paper
68
1. Income & Food Security
Income
Among all the policy areas for addressing the social determinants of health and reducing health inequity,
none is more signifi cant than that of income security and measures for reducing poverty in the province.
Toward reducing poverty and increasing income security for British Columbians, areas of consideration for
policy include***:
Minimum Wage – Increasing the minimum wage and indexing it to the annual cost of living. It is important
that the minimum wage refl ect a ‘living wage’ in order to eliminate the situation faced by the working poor –
people working full time but still facing poverty.
Earned Income Benefi t – Ensuring that federal and provincial earned income benefi ts work to augment
the incomes of people who are normally in the paid labour force. People in low-wage jobs, people who
cannot get enough work to meet their basic requirements and people who have to periodically rely on
employment insurance could all realize signifi cant economic improvement from a well-designed plan for
earned income benefi ts.
Federal Child Benefi t – Combining the Canada Child Tax Benefi t base benefi t and National Child
Benefi t Supplement into a single refundable benefi t and making it available to all low-income families, with
no reduction of other benefi ts (e.g., provincial income assistance rates) to offset the increase in the federal
benefi t. Considering revising income thresholds and benefi t reductions to avoid undue hardship on lower-
income families as their work incomes rise.
Income Assistance – Increasing welfare rates and indexing the rates to annual increases in the cost of
living. About half of the increase will be required to make up for the erosion in purchasing power since 1994.
Considering a mechanism to improve the income status of pregnant women (e.g., create a maternal nutrition
benefi t to start once pregnancy is confi rmed, that becomes the Child Benefi t once the birth is registered).
Such a benefi t would be cost-neutral if the Child Benefi t program was terminated 6 months earlier than at
present.†††
*** These policy options and the supporting arguments for them are described in more detail in the PHSA report “A Review of Policy Options for Increasing Food Security and
Income Security in British Columbia” (September, 2007). Recommendations re: a strong federal Earned Income Tax Benefi t, and income assistance benefi ts can be found in the
BC Progress Board report “The Social Condition in British Columbia” (December, 2006).
††† This recommendation was put forward in the BC Provincial Health Offi cer’s Report “A Review of Infant Mortality in British Columbia: Opportunities for Prevention” (October,
2003).

Health Inequities in British Columbia: Discussion Paper
69
Food
Some specifi c policy options in support of increased food security and improved overall nutrition for British
Columbians include‡‡‡:
Food Security – Developing a healthy eating and food security strategy.
Ensuring income assistance rates are determined with consideration for the actual cost of food.
Addressing issues of availability and accessibility determined by the food system by engaging
stakeholders (particularly local governments) to pursue strategies and community-based food security
initiatives that focus on capacity building and community development.
BC’s Community Food Action Initiative has identifi ed some examples from across the province of the
many different ways local governments in BC are taking action to strengthen their local food systems:
Establishing community gardens
Creating farmers’ markets
Engaging neighbourhood planning to enhance food access
Supporting local food production
Providing healthy food options in public buildings
Creating community capacity to meet current and future food needs
Conducting assessments and developing proactive charters and policies
Nutrition – Supporting stronger labelling requirements on all packaged foods, banning trans-fats, reducing
salt content requirements, restricting advertisements and sales of junk foods, implementing subsidy
programs for nutritional foods, and promoting nutrient fortifi cation (e.g., folic acid).
2. Education and Literacy
There are several policy options that could be pursued at various levels of the learning ladder in order to
improve educational outcomes in BC and reduce educational disparities. These include§§§:
Strong Start Program - Enhancing the Strong Start program (a pre-kindergarten program providing
children with linguistic, physical and social skills training through about 200 schools in BC) so that it is
appropriately funded, and has a strong evaluation component.
Child Care Subsidy Program - Reinvesting in the Child Care Subsidy Program.
Community Links - Enhancing the Community Links program, that provides resources (e.g., school
breakfasts and lunches, counselling) to students from disadvantaged backgrounds, to help reduce the
number of students who drop out from high school.
‡‡‡ These policy options are described in more detail in the PHSA Report “A Seat at the Table: Resource Guide for Local Governments to Promote Food Secure Communities”
(June, 2008).
§§§ These policy options are described in more detail in the BC Progress Board report “The Social Condition in British Columbia” (December, 2006), p. iii.

Health Inequities in British Columbia: Discussion Paper
70
BC Loan Reduction Program - Reinvesting in the BC Loan Reduction Program to encourage more
low-income students to attend university.
Support for Low-Income Students - Strengthening support for low income students by extending
fi nancial support to students in one-year programs.
Adult Literacy, Education & Training - Increasing resources for adult literacy, basic education and
skills training.
3. Early Childhood Development
Toward supporting early childhood development and healthier families, policy areas for consideration
include¶¶¶:
Affordable High Quality Child Care and Other Early Learning Programs – Developing an
affordable, accessible, high quality child care system and early learning opportunities for British Columbia
(e.g., full-day kindergarten options for children aged three to fi ve, such as those being explored by BC’s
provincial government****).
These programs and services should be fl exible, and meet the developmental, language, literacy and
cultural needs of all children††††. They should also provide additional opportunities for the early identifi cation
of developmental delays, disabilities and other risk factors and appropriate referrals, encourage parent
participation, enhance parents’ understanding of child development through information, support and role
modelling, build supportive social networks amongst children and families, and support and enhance the
economic security of women and families.
Healthier Families – Improving the health of children and families through policies that promote
comprehensive, quality and affordable early childhood development and parenting services and programs
ensuring that priority is given to those neighbourhoods and communities with the highest numbers of
vulnerable children. Particular consideration should be given to the following components of early childhood
development that have been shown to be successful and are recommended by First Call: BC Child and
Youth Advocacy Coalition‡‡‡‡:
Early Childhood Development (ECD) public health initiatives (e.g., home visits of all newborns by
community health nurses, and vision, hearing, dental and speech screening).
Adequately resourced and well-coordinated supports for parents, families and other caregivers (e.g.,
information, resources and workshops about child development and parenting, clothing exchanges and
toy lending, drop-in, emergency and respite childcare, and outreach through mobile drop-in programs
and playground programs).
¶¶¶ These policy options are in alignment with the policies for consideration outlined by the BC Healthy Living Alliance in its paper “Discussion Paper: Healthy Futures for BC
Families” (September, 2008).
**** The Honourable Steven L. Point, Lieutenant-Governor of BC. (2008). Speech from the Throne: Opening of the Fourth Session, Thirty-Eighth Parliament, Province of British
Columbia, February 12, 2008. Retrieved August 8, 2008 from http://qp.gov.bc.ca/38th4th/4-8-38-4.htm.
†††† The characteristics of best practices childcare and other early learning programs are outlined by First Call: BC Child & Youth Advocacy Coalition in “Early Childhood
Development in BC: First Call’s Framework for Action” (Original March, 2003; Revised 2008).
‡‡‡‡ These ECD supports and services are recommended and expanded upon in more detail by First Call: BC Child & Youth Advocacy Coalition in “Early Childhood Development in
BC: First Call’s Framework for Action” (Original March, 2003; Revised 2008). The specifi c programs/initiatives listed here are examples for illustrative purposes – more options
are provided in the First Call report.

Health Inequities in British Columbia: Discussion Paper
71
Targeted early intervention strategies and services (e.g., supports for high-risk mothers during the pre
and post-natal period, and specifi c supports for children with developmental delays, disabilities, and
behavioural issues).
Strategies to improve access to ECD resources:
Community based information and referral services (e.g., well-resourced information and referral
services to help families connect with ECD supports and services as well as broader community
resources).
Designated resources for access and participation (e.g., proactive outreach strategies such as
resources for transportation, translation, interpretation, literacy assistance, or provision of food and
childcare as part of programs in order to address barriers to access).
In order to maximize effectiveness, it is further recommended that these services be delivered by an ECD
Central hub and co-located with child and family-friendly agencies (e.g., family resource centres, schools,
libraries, neighbourhood houses, community centres). Consideration should be given to prorating charges
according to family income with low or no fees required for low income families.
4. Housing & Healthy Built Environments
Housing
Policy areas for ensuring that all British Columbians are able to enjoy safe affordable housing include§§§§:
Affordable Housing – Ensuring there is an adequate supply of appropriate, safe and affordable housing
for low-income families and individuals. Some of the housing need is being addressed through the
government’s housing strategy, Housing Matters BC and several other programs, but the demand is greater
than the current supply.
Housing First – Developing policies to provide a range of housing and related supports for the homeless,
and particularly for those with mental illness and/or addictions. A full continuum of housing options should
be provided and matched to individuals’ needs, including emergency and temporary accommodation (e.g.,
shelters), transition housing, and supportive (e.g., group homes often with on-site staff) and supported
housing (e.g., co-operatives or independent apartments with off-site staff or case management support).
It will be imperative for non-profi t organizations, the private sector and all levels of government to work
together and coordinate their efforts and investments to develop this full continuum of housing for those in
need.
Carter & Polevychok (2004)158 clearly illustrate the role that housing plays in people’s lives and the central role
housing plays in the success of other social policy initiatives. As BC takes steps towards further developing
a continuum of housing options, it will be important to consult best practices documents like Carter &
Polevychok’s that propose meaningful housing program changes,159 as well as how to make housing
policy a more effective social policy instrument (housing policy has to be designed not just to improve the
§§§§ These policy interventions are in alignment with those in BCHLA’s paper “Discussion Paper: Healthy Futures for BC Families” (September, 2008).
Health Inequities in British Columbia: Discussion Paper
72
circumstances of low-income and special needs households, but also to facilitate policy development in
other areas like immigration, health, education and social assistance) .160
Healthy Built Environments
Policy options favourable to the development of supportive communities that help to improve health
outcomes and reduce health inequities should focus on changes to the built environment, such as¶¶¶¶:
Increasing housing density
Increasing the usage of mixed land-use patterns
Increasing the connectivity of urban streets to enable easier (shortest distance) walking between locations
Improving public transit as an effective alternative to the automobile
Increasing the supply of recreation facilities and parks
Enhancing streetscape design to improve aesthetics and safety for pedestrians and cyclists (e.g.,
adequate lighting, pedestrian crossings, sidewalks, bike paths, traffi c slowing)
Improving physical access to healthy foods and discouraging junk foods through zoning and
neighbourhood design where needed to support grocery stores, farmers’ markets and restaurants
5. Health Care
Toward enhancing health outcomes and improving access to health services for all British Columbians, some
policy options for the health care sector include*****:
Making health inequities reduction a health sector priority - Coordinating efforts on several
fronts, with health sector leadership facilitating the roles of the health sector and encouraging policy action
in other sectors.
Engaging with other sectors toward reducing health inequities - Requiring participation from
those sectors whose work aligns with key health determinants, and also including an extension to the
public, private and voluntary sectors.
Integrating inequities reduction into health programs and services – Articulating objectives,
deliverables and expected outcomes. Focusing on the needs of disadvantaged populations, and on
mitigating the causes and effect of other determinants of health through interventions with disadvantaged
populations (with public health services and clinical prevention services having a particular emphasis).
Strengthening knowledge development and exchange – Documenting disparities, developing
evidenced-based policies, evaluating interventions, and communicating results.
¶¶¶¶These interventions are supported by the best available evidence and are presented in the PHSA report “Creating a Healthier Built Environment in British Columbia” (September,
2007).
***** The fi rst four policy options for consideration are described in more detail by the Health Disparities Task Group of the Federal/Provincial/Territorial Advisory Committee on
Population Health and Health Security in its report “Reducing Health Disparities – Roles of the Health Sector: Discussion Paper” (December, 2004). The last two policy options
are intended to address inequities identifi ed previously in this report.
Health Inequities in British Columbia: Discussion Paper
73
Reducing fi nancial and other barriers to health care - Aiming to ensure equitable, timely
access to effective preventive and curative health care services.
Providing information to patients in a format that they can understand – Providing health
information to patients that is accessible, regardless of their level of literacy or health literacy.

Health Inequities in British Columbia: Discussion Paper
74
VI. Conclusion
British Columbia is characterized by a relatively high level of health inequity, such that people from more
advantaged socioeconomic groups enjoy signifi cantly better health and longer lives than people from less
advantaged groups. The extent of such health inequity among British Columbians constitutes an important
issue that deserves the careful attention of policymakers and the BC government and society as a whole.
Both government and business are negatively affected by poor health and health-care costs; both have
tremendous economic and social gains to make when good health is achieved and equitably distributed.
Addressing inequities by tackling the socio-economic determinants of health will result in healthier citizens,
healthier employees, healthier customers and healthier communities generally. This, in turn, will reduce
pressures on our health care system and contribute to its sustainability over the longer-term, while also
positively affecting economic growth in BC.
The encouraging news is that there is a growing body of evidence that health inequities can successfully
be addressed. Around the world, and especially in Europe, many countries have developed dedicated,
coordinated intersectoral strategies for reducing health inequity that are demonstrating positive outcomes.
Quebec and Newfoundland & Labrador have also implemented provincial anti-poverty strategies.
These jurisdictions have been successful because they have been operating at many levels to address both
the social and economic determinants of health (e.g., income and education), as well as behavioural risk
factors related to adverse health outcomes. Experience and evidence has demonstrated that interventions
targeted only at changing adverse health behaviours will have limited overall success, offering only
microenvironmental solutions to a macroenvironmental problem.
A review of the efforts in other jurisdictions reveals a number of common features, presented in this report as
key considerations for any initiatives or policies that may be undertaken in British Columbia to reduce health
inequity. These considerations include: making the reduction of health inequity a government and societal
priority and allocating resources accordingly; developing a multisectoral approach involving cooperation
across all levels and areas of government, and across the public, private, NGO and community sectors; and
setting clear goals and targets for all initiatives, and tracking progress on specifi c measures related to health
inequity as part of a continuous improvement process.
The policy options presented in this report have been highlighted for their potential to address the social
determinants of health and begin the process of addressing health inequities. For the great majority of the
policy options, a strong economic case can be made; for others the case is based more on the expected
health outcomes. Going forward, the body of literature on health inequities would benefi t greatly from solid
outcome, process and economic evaluations.
Canada’s Chief Public Health Offi cer sums it up well when he says, “Although clarifi cation and better
understanding is needed in many areas [in terms of what social policies and programs are most effective at
addressing health inequities], waiting for all the answers is not an acceptable option given what is already
known, what can be done and the consequences of neglect while waiting.”161
The WHO Commission on the Social Determinants of Health supports this sentiment. In its recent report on
addressing health inequities through action on the social determinants of health162 it noted a signifi cant lack

Health Inequities in British Columbia: Discussion Paper
75
of medical randomized controlled trials that document evidence of what can be done and what is likely to
work in practice to improve health and reduce health inequities. It argues that “this lack cannot be a barrier
to making judgements with the current evidence” and goes on to incorporate evidence from observational
studies, case studies, fi eld visits, expert and lay knowledge and community intervention trials to inform its
recommendations for action, which is similar to the approach taken in developing this report.
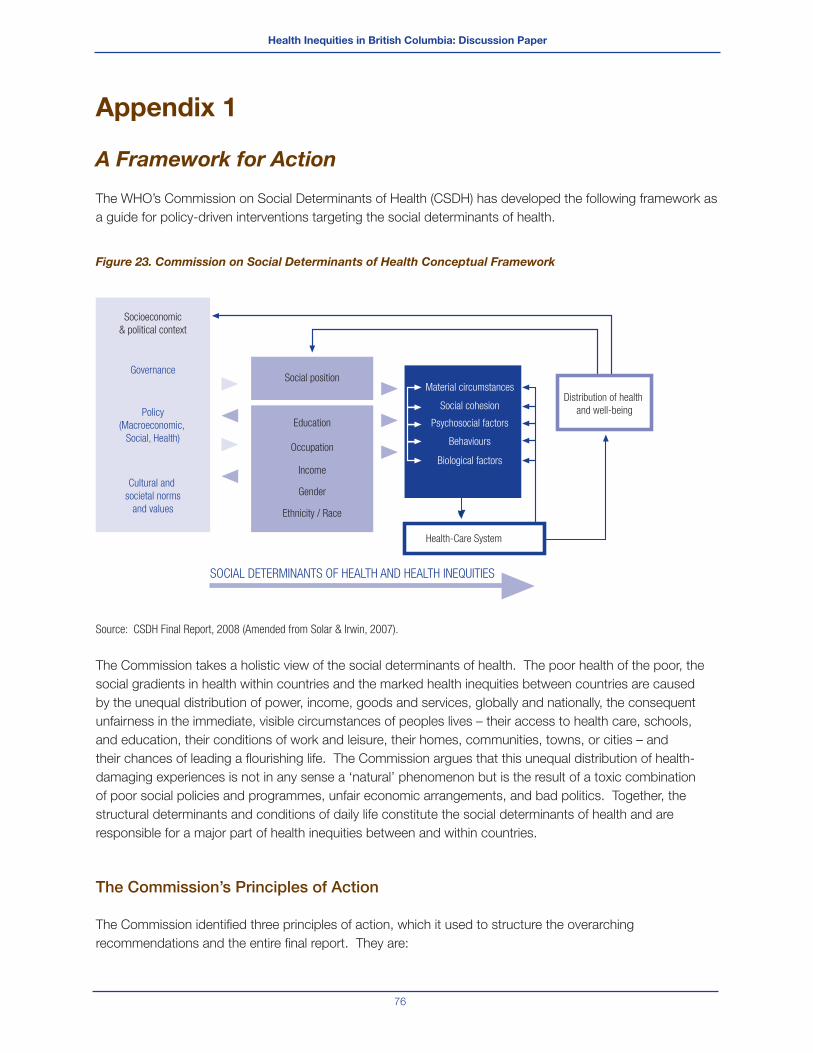
Health Inequities in British Columbia: Discussion Paper
76
Appendix 1
A Framework for Action
The WHO’s Commission on Social Determinants of Health (CSDH) has developed the following framework as
a guide for policy-driven interventions targeting the social determinants of health.
Figure 23. Commission on Social Determinants of Health Conceptual Framework
Source: CSDH Final Report, 2008 (Amended from Solar & Irwin, 2007).
The Commission takes a holistic view of the social determinants of health. The poor health of the poor, the
social gradients in health within countries and the marked health inequities between countries are caused
by the unequal distribution of power, income, goods and services, globally and nationally, the consequent
unfairness in the immediate, visible circumstances of peoples lives – their access to health care, schools,
and education, their conditions of work and leisure, their homes, communities, towns, or cities – and
their chances of leading a fl ourishing life. The Commission argues that this unequal distribution of health-
damaging experiences is not in any sense a ‘natural’ phenomenon but is the result of a toxic combination
of poor social policies and programmes, unfair economic arrangements, and bad politics. Together, the
structural determinants and conditions of daily life constitute the social determinants of health and are
responsible for a major part of health inequities between and within countries.
The Commission’s Principles of Action
The Commission identifi ed three principles of action, which it used to structure the overarching
recommendations and the entire fi nal report. They are:
Socioeconomic
& political context
Social position
Education
Occupation
Health-Care System
SOCIAL DETERMINANTS OF HEALTH AND HEALTH INEQUITIES
Income
Gender
Ethnicity / Race
Governance
Cultural and
societal norms
and values
Policy
(Macroeconomic,
Social, Health)
Material circumstances
Social cohesion
Psychosocial factors
Behaviours
Biological factors
Distribution of health
and well-being
Health Inequities in British Columbia: Discussion Paper
77
Improve the conditions of daily life – the circumstances in which people are born, grow, live, work, and age.1.
Tackle the inequitable distribution of power, money, and resources – the structural drivers of those 2.
conditions of daily life – globally, nationally, and locally.
Measure the problem, evaluate action, expand the knowledge base, develop a workforce that is trained in 3.
the social determinants of health, and raise public awareness about the social determinants of health.
These three principles of action identifi ed by the Commission are embodied in the three overarching
recommendations below. The Commission states that if action is taken in accordance with these
recommendations, and with the more detailed recommendations in subsequent chapters of its fi nal report,
it will be possible to achieve a more equitable realization of the rights to the conditions necessary to achieve
the highest attainable standard of health.
The Commission’s Overarching Recommendations
1. Improve Daily Living Conditions
Improve the well-being of girls and women and the circumstances in which their children are born, put major
emphasis on early child development and education for girls and boys, improve living and working conditions
and create social protection policy supportive of all, and create conditions for a fl ourishing older life. Policies
to achieve these goals will involve civil society, governments, and global institutions.
2. Tackle the Inequitable Distribution of Power, Money, and Resources
In order to address health inequities, and inequitable conditions of daily living, it is necessary to address
inequities – such as those between men and women – in the way society is organized. This requires a strong
public sector that is committed, capable, and adequately fi nanced. To achieve that requires more than
strengthened government – it requires strengthened governance: legitimacy, space, and support for civil
society, for an accountable private sector, and for people across society to agree public interests and reinvest
in the value of collective action. In a globalized world, the need for governance dedicated to equity applies
equally from the community level to global institutions.
3. Measure and Understand the Problem and Assess the Impact of Action
Acknowledging that there is a problem, and ensuring that health inequity is measured – within countries
and globally – is a vital platform for action. National governments and international organizations, supported
by WHO, should set up national and global health equity surveillance systems for routine monitoring of
health inequity and the social determinants of health and should evaluate the health equity impact of
policy and action. Creating the organizational space and capacity to act effectively on health inequity
requires investment in training of policy-makers and health practitioners and public understanding of social
determinants of health. It also requires a stronger focus on social determinants in public health research.
Health Inequities in British Columbia: Discussion Paper
78
References
1 World Health Organization. (2007). Concepts and Principles
for Tackling Social Inequities in Health: Levelling up Part 1.
University of Liverpool, England: WHO Collaborating Centre for
Policy Research on Social Determinants of Health, p. 2.
2 WHO Equity Team working defi nition, cited in Commission on
Social Determinants of Health, A Conceptual Framework for
Action on the Social Determinants of Health, Draft Discussion
Paper for the Commission on Social Determinants of Health,
(April, 2007), Geneva: WHO, p. 7.
3 Dahlgren, G. & Whitehead, M. (2006). European Strategies
for Tackling Social Inequities in Health: Levelling up Part 2.
Copenhagen, Denmark: WHO.
4 Braveman, P. & Gruskin, S. (2003). Defi ning equity in health.
Journal of Epidemiology and Community Health 2003, 57, 254-
258.
5 World Health Organization. (2007). Concepts and Principles
for Tackling Social Inequities in Health: Levelling up Part 1.
University of Liverpool, England: WHO Collaborating Centre for
Policy Research on Social Determinants of Health, p. 2.
6 Commission on Social Determinants of Health. (2007). Achieving
Health Equity: From Root Causes to Fair Outcomes. Interim
Statement. Geneva: WHO, p. 17.
7 Marmot, M.G., Smith, G.D., Stansfeld, S., Patel, C., North, F.,
Head, J., White, I., Brunner, E., & Feeney, A. (1991). Health
inequalities among British civil-servants—the Whitehall II Study.
Lancet, 337, 1387–1393.
8 Commission on Social Determinants of Health. (2008). Closing
the Gap in a Generation: Health Equity Through Action on the
Social Determinants of Health. Final Report of the Commission
on Social Determinants of Health. Geneva: WHO, Executive
Summary.
9 Public Health Agency of Canada. What Determines Health?
Retrieved on July 13, 2008 from http://www.phac-aspc.gc.ca/
ph-sp/determinants/index.html
10 Ibid.
11 Commission on Social Determinants of Health. (2008). Closing
the Gap in a Generation: Health Equity Through Action on the
Social Determinants of Health. Final Report of the Commission
on Social Determinants of Health. Geneva: WHO, Executive
Summary.
12 Macintyre, S. (2007). Inequalities in Health in Scotland: What
are They and What Can we Do About Them? Prepared by the
Medical Research Council Social & Public Health Sciences Unit
for the Ministerial Task Force on Health Inequalities.
13 Commission on Social Determinants of Health. (2007). Achieving
Health Equity: From Root Causes to Fair Outcomes. Interim
Statement. Geneva: WHO.
14 Ibid.
15 Institute of Medicine. (2001). Health and Behaviour: The
Interplay of Biological, Behavioural and Societal Infl uences.
Washington, DC: National Academies Press.
16 Commission on Social Determinants of Health. (April, 2007). A
Conceptual Framework for Action on the Social Determinants of
Health. Draft Discussion Paper for the Commission on Social
Determinants of Health. Geneva: WHO.
17 Commission on Social Determinants of Health. (2008). Closing
the Gap in a Generation: Health Equity Through Action on the
Social Determinants of Health. Final Report of the Commission
on Social Determinants of Health. Geneva: WHO.
18 Commission on Social Determinants of Health. (April, 2007). A
Conceptual Framework for Action on the Social Determinants of
Health. Draft Discussion Paper for the Commission on Social
Determinants of Health. Geneva: WHO, p. 49.
19 Ibid., p.34.
20 Ibid., p.16.
21 Ibid.
22 Ibid., p.40.
23 Health Nexus & Ontario Chronic Disease Prevention Alliance.
(2008). Primer to Action: Social Determinants of Health.
Toronto, Ontario: Authors
24 Hayward, K., with assistance from V. Hayward, L. Pannozzo and
R. Colman. (Draft Report March, 2008). The Health Costs of
Poverty in Canada: A Literature Review of the Evidence and
Methodologies Needed to Produce a Full Report. Halifax, NS: GPI
Atlantic.
25 Benzeval, M., & Judge, K. (2001). Income and health: The time
dimension. Social Science & Medicine, 52, 1371-1390. See
also: Benzeval, M., A. Dilnot, K. Judge, & J. Taylor. “Income and
health over the lifecourse: Evidence and policy implications,” in
Understanding Health Inequalities, ed. Graham, H. Buckingham,
UK: Open University Press, 2001. http://195.89.185.89/bd.cgi/
openup/isb?0335205534.

Health Inequities in British Columbia: Discussion Paper
79
26 Phipps, S. (2008). The Impact of Poverty on Health: A Scan of
Research Literature. Ottawa, Ontario: Canadian Institute for
Health Information, p.13.
27 Julie’s story was relayed to Dr. John Millar, Executive Director,
Population Health Surveillance & Disease Control Planning,
Provincial Health Services Authority, in 1998 by Julie’s primary
health care nurse.
28 Ocean, C. (2005). Policies of Exclusion, Poverty & Health:
Stories From the Front. Wellbeing through Inclusion Socially and
Economically (WISE).
29 Smedley, B. & Syme, S.L. (2000). Promoting Health: Intervention
Strategies from Social and Behavioural Research. Prepared for
the Institute of Medicine. Washington, DC: National Academy
Press.
30 Institute of Medicine. (2001). Health and Behaviour: The
Interplay of Biological, Behavioural and Societal Infl uences.
Washington DC: National Academy Press.
31 Commission on Social Determinants of Health. (2008). Closing
the Gap in a Generation: Health Equity Through Action on the
Social Determinants of Health. Final Report of the Commission
on Social Determinants of Health. Geneva: WHO, p. 42.
32 Statistics Canada. (2008). Report on the Demographic Situation
in Canada: 2005 and 2006, Catalogue No. 91-209-XIE, 2008.
33 Provincial Health Services Authority. (April, 2007). Life
Expectancy as a Measure of Population Health : Comparing
British Columbia with Other Olympic and Paralympic Winter
Games Host Jurisdictions.
34 Ibid.
35 Statistics Canada. (2008). Health Indicators Catalogue No. 82-
221-XWE.
36 Ibid.
37 Ibid.
38 Vancouver Coastal Health. (March, 2008). VCH Population
Health Report 2008. Retrieved April 21, 2008 from http://www.
vch.ca/population/
39 Canadian Centre for Policy Alternatives. http://www.
policyalternatives.ca/
40 Statistics Canada. (2008). Persons in Low Income Before Tax
2002-2006. http://www40.statcan.ca/l01/cst01/famil41a.htm
41 Veuglers, P. & Fitzgerald, A. (September 13, 2005). Prevalence
of and risk factors for childhood overweight and obesity.
Canadian Medical Association Journal, 173(3).
42 Ross, D. & Roberts, P. (1999). Income and child well-being: A
new perspective on the poverty debate. Canadian Council on
Social Development. Retrieved on February 25, 2008 from
http://www.ccsd.ca/pubs/inkids/index.htm
43 Reynolds, A. Temple, J., Robertson, D. & Mann, E. (2001). Long-
term effects of an early childhood intervention on education
achievement and juvenile arrest – 15-year-follow-up of low
income children in public schools. Journal of the American
Medical Association, 285(18), 2339-2346.
44 Agriculture Canada. (1998). Canada’s Action Plan on Food
Security.
45 Che, J., Chen, J. (2001). Food Insecurity in Canadian
Households. Statistics Canada: Health Reports 12(4), 11-22.
46 Greater Vancouver Regional District. (September 2005). On
Our Streets and in Our Shelters: Results of the 2005 Greater
Vancouver Homeless Count. Retrieved January, 2008 from
www.gvrd.bc.ca (currently www.metrovancouver.org/Pages/
default.aspx)
47 Urban Futures. Seniors’ Housing Demand in British Columbia
Over the Next Thirty Years. Report Number 65. Retrieved July
17, 2008 from www.urbanfutures.com
48 Greater Vancouver Regional District. (September 2005). On
Our Streets and in Our Shelters: Results of the 2005 Greater
Vancouver Homeless Count. Retrieved January, 2008 from
www.gvrd.bc.ca (currently www.metrovancouver.org/Pages/
default.aspx)
49 Patterson, M., Somers, J., McIntosh, K., Shiell, A. & Frankish
C.J. (February, 2008). Housing and Support for Adults with
Severe Addictions and/or Mental Illness in British Columbia.
Centre for Applied Research in Mental Health and Addiction,
Faculty of Health Sciences, Simon Fraser University.
50 Brunner, E., & Marmot, M. (2006). Social organization, stress
and health. In M. Marmot & R. Wilkinson, Social Determinants of
Health. London: Oxford University Press, p. 13.
51 Wilton, R. (2004). Putting policy into practice? Poverty and
people with serious mental illness. Social Science & Medicine,
58, 25–39.
52 Patel, V. (2001). Is depression a disease of poverty? Regional
Health Forum, 5(1).
53 Tandon, A. & Patel, V. (2007). Depression, chronic diseases,
and decrements in health: results from the World Health Surveys.
The Lancet, 370(9590), p. 851-858.
Health Inequities in British Columbia: Discussion Paper
80
54 Patel, V. (2001). Is depression a disease of poverty? Regional
Health Forum, 5(1).
55 Chen, J., Hou, F., Sanmarin, C., Tremblay, S. & Berthelot, J.M.
(2002). “Unmet health care needs.” Canadian Social Trends,
Winter, 2002, p. 18.
56 Jones, D. B. (2008). Report on the State of Public Health in
Canada, p. 3. Offi ce of the Chief Public Health Offi cer of Canada,
p. 59.
57 Ministry of Health, Government of British Columbia. Tobacco
Facts. Retrieved June 22, 2008 from www.tobaccofacts.org
58 Manuel, D.G., Leung, M., Nguyen, K., Tanuseputro, P., &
Johansen, H. (2003). Burden of cardiovascular disease in
Canada. The Canadian Journal of Cardiology, 19(9),997-1004.
59 Mustard, C.A. et al. Paying Taxes and Using Health Care
Services: The Distributional Consequences of Taxed Financed
Universal Health Insurance in a Canadian Province. Paper
presented at conference on the state of living standards and
quality of life in Canada, Ottawa, October 30-31, 1998. Cited
in “Reducing Health Disparities – Roles of the Health Sector
Discussion Paper”, prepared by the Health Disparities Task
Group of the Federal/Provincial/Territorial Advisory Committee on
Population Health and Health Security (December, 2004).
60 Oppenheim, J., & MacGregor, T. (April, 2007). The economics
of poverty: How investments to eliminate poverty benefi t all
Americans. Journal of Energy Assistance, 1(2).
61 Mackenbach, J.P., Meerding, W. J. & Kunst, A.E. (2007).
Economic Implications of Socio-economic Inequalities in Health
in the European Union. Rotterdam, The Netherlands: European
Commission, p.39.
62 BC Healthy Living Alliance (February, 2005). The Winning
Legacy: A Plan for Improving the Health of British Columbians by
2010, p. 2.
63 BC Progress Board. (July 2007). Strategic Considerations for
BC’s Future: Issues and Trends 2007 Report, p 30.
64 Oppenheim, J., & MacGregor, T. (April, 2007). The economics
of poverty: How investments to eliminate poverty benefi t all
Americans. Journal of Energy Assistance, 1(2).
65 Jones, D. B. (2008). Report on the State of Public Health in
Canada, p. 3. Offi ce of the Chief Public Health Offi cer of Canada,
p. 41.
66 Ibid.
67 Kendall, P. R. W. (2006). Food, Health and Well-Being in British
Columbia - Provincial Health Offi cer’s Annual Report 2005.
Victoria, BC: Offi ce of the Provincial Health Offi cer, p. xix.
68 Provincial Health Services Authority. (September, 2007). A
Review of Policy Options for Increasing Food Security and
Income Security in British Columbia: A Discussion Paper.
69 Provincial Health Services Authority. (March, 2008). Community
Food Assessment Guide. Community Food Action Initiative.
70 Provincial Health Services Authority (June, 2008). A Seat at the
Table: Resource Guide for Local Governments to Promote Food
Secure Communities.
71 Banting, K. (2006). The Social Condition in British Columbia.
Vancouver, BC: BC Progress Board.
72 Ibid.
73 Kendall, P.R.W. (March, 2008). An Ounce of Prevention
Revisited: A Review of Health Promotion and Selected Outcomes
for Children and Youth in BC schools – Provincial Health Offi cer’s
Annual Report 2006. Victoria, BC: BC’s Provincial Health Offi cer.
74 Rootman, I. & Gordon-El-Bihbety, D. (2008). A Vision for a Health
Literate Canada: Report of the Expert Panel on Health Literacy.
Ottawa, Ontario: Canadian Public Health Association, p. 11.
75 Canadian Public Health Association. (2008). A Vision for a Health
Literate Canada: Report of the Expert Panel on Health Literacy, p.
22.
76 Ibid.
77 Federal/Provincial/Territorial Advisory Committee on Population
Health. (1999). Investing in Early Child Development: The Health
Sector Contribution. Ottawa: Author.
78 Hertzman, C. (2000). The case for an early childhood
development strategy. Canadian Journal of Policy Research,
1(2): 11-18.
79 Health Canada. (2003). The Well-being of Canada’s Young
Children: Government of Canada Report. Ottawa: Author.
80 Karoly, L., Bigelow, J. (2005). The Economics of Investing in
Universal Preschool in California. RAND Corporation.
81 Coffey, C. (2003). Never Too Early to Invest in Children: Early
Childhood Education and Care Matters to Business! Retrieved
on January 4, 2008 from http://www.voicesforchildren.ca/report-
Sept2003-1.htm#11
82 Grunewald, R. & Rolnick, A. (2003). Early childhood
development: Economic development with a high public return.
The Region Supplement. Retrieved on January 8, 2008 from
http://minneapolisfed.org/research/studies/earlychild/

Health Inequities in British Columbia: Discussion Paper
81
83 Grunewald, R. & Rolnick, A. (June, 2005). Early Childhood
Development on a Large Scale. Minnesota: Federal Reserve
Bank of Minneapolis.
84 Mackenbach, J.P., Meerding, W. J. & Kunst, A.E. (2007).
Economic Implications of Socio-economic Inequalities in Health
in the European Union. Rotterdam, The Netherlands: European
Commission.
85 First Call: BC Child & Youth Advocacy Coalition. (2008). Early
Childhood Development in BC: First Call’s Framework for Action,
p. 17.
86 Canadian Medical Association. (May, 2004). Economic
Evaluation Across the Faces of Prevention: A Canadian
Perspective, p. 28.
87 First Call: BC Child & Youth Advocacy Coalition. (2008). Early
Childhood Development in BC: First Call’s Framework for Action,
p. 17.
88 Canadian Medical Association. (May, 2004). Economic
Evaluation Across the Faces of Prevention: A Canadian
Perspective.
89 Health Nexus & Ontario Chronic Disease Prevention Alliance.
(2008). Primer to Action: Social Determinants of Health.
Toronto, Ontario: Authors.
90 Carter, T. & Polevychok, C. (December, 2004). Housing is Good
Social Policy: Research Report F/50. Ottawa, Ontario: Canadian
Policy Research Networks Inc, p. 14.
91 Jones, D. B. (2008). Report on the State of Public Health in
Canada. Offi ce of the Chief Public Health Offi cer of Canada, pp.
45-46.
92 Fuller-Thomson, E., Hulchanski, D. & Wang, S. (2000). The
health-housing relationship: What do we know? Reviews on
Environmental Health, 15(1-2), 109-134.
93 Dunn, J. R. (2003). A needs, gaps and opportunities assessment
of research. Housing as a Socio-Economic Determinant of
Health. The Canadian Institute of Health Research.
94 Personal communication with Lia Nicholoyiannis, Housing
Administrative Support, Metro Vancouver Housing Corporation,
April 7, 2008, cited in BC Healthy Living Alliance unpublished
draft paper Policy Dialogue: Every Child, a Healthy Child, June,
2008, p. 8.
95 Canadian Mortgage and Housing Corporation. (2007).
Dimensions of Core Housing Need in Canada. Ottawa: Author.
96 The Social Determinants of Health Across the Lifespan
Conference Participants. (Resolved December 1, 2002; Ratifi ed
February 10, 2003). Strengthening the Social Determinants
of Health: The Toronto Charter for a Healthy Canada. York
University, Toronto. Retrieved June 1, 2008 from http://www.
atkinson.yorku.ca/SHPM/torontoCharter1.pdf
97 Sharfstein, J. & Sandel, M. (1998). Inadequate housing: A
health crisis for the children of the poor. Journal of Housing &
Community Development, 55(4).
98 Lubell, J., Crain, R. & Cohen, R. (2007). The Positive Impacts
of Affordable Housing on Health. Washington, D.C.: Centre for
Housing Policy and Enterprise Community Partners.
99 Social Planning and Research Council of BC. (October
15, 2007). In the Proper Hands: SPARC BC Research on
Homelessness and Housing. Retrieved February 24, 2008 from
www.sparc.bc.ca
100 Guirguis-Younger, M., Runnels, V., & Aubry, T. (2003). A Study of
the Deaths of Persons who are Homeless in Ottawa – A Social
and Health Investigation. Ottawa: Saint Paul University and the
Centre for Research on Community Services.
101 Caputo, T., Weiler, R., and Anderson, J. (1996). The Street
Lifestyle Study. Ottawa: Health Canada.
102 Laird, G. (2007). Shelter - Homelessness in a growth economy:
Canada’s 21st century paradox. A Report for the Sheldon Chumir
Foundation for Ethics in Leadership. Calgary, Alberta.
103 Provincial Health Services Authority. (September, 2008).
Foundations for a Healthier Built Environment: Summary Paper.
104 Commission on Social Determinants of Health. (2007).
Achieving health equity: from root causes to fair outcomes.
Interim Statement. Geneva: World Health Organization.
105 Frohlich, K., Ross, N. & Richmond, C. (2006). Health disparities
in Canada today: Some evidence and a theoretical framework.
Health Policy, 79, 132-143.
106 Provincial Health Services Authority. (September, 2007).
Creating a Healthier Built Environment in British Columbia.
107 The Oxford Health Alliance. (n.d.). Chronic Disease: An
Economic Perspective. Retrieved July 1, 2008 from www.oxha.
org.
108 Oppenheim, J., & MacGregor, T. (April, 2007). The economics
of poverty: How investments to eliminate poverty benefi t all
Americans. Journal of Energy Assistance, 1(2), pp. 10-12.
109 World Economic Forum. (October 31, 2007). The Global
Competitiveness Report 2007-2008. Retrieved April, 2008 from
www.weforum.org

Health Inequities in British Columbia: Discussion Paper
82
110 University of California. Atlas of Global Inequality. Accessed May
14, 2008 at http://ucatlas.ucsc.edu/
111 Mackenbach, J. (October, 2005). Health Inequities: Europe in
Profi le. Brussels: UK Presidency of the EU.
112 Woolf, S.H., Johnson, R.E., Phillips, R.L. (2007). Giving
everyone the health of the educated: An examination of whether
social change would save more lives than medical advances.
American Journal of Public Health, 97(4).
113 Ibid.
114 Public Health Agency of Canada. Population Health Approach.
Accessed April 14, 2008 at http://www.phac-aspc.gc.ca/ph-sp/
determinants/determinants_e.html
115 Vancouver Island Health Authority. (May, 2006). Understanding
the Social Determinants of Health: A Discussion Paper from the
Offi ce of the Chief Medical Health Offi cer.
116 Keon, W. (2008). Health for all: Questions from the past,
lessons for the future. The Hill Times, January 21, 2008, p. 26.
117 Health Disparities Task Group of the Federal/Provincial/Territorial
Advisory Committee on Population Health and Health Security.
(December, 2004). Reducing Health Disparities – Roles of the
Health Sector: Discussion Paper.
118 The Conference Board of Canada’s Roundtable on the Socio-
Economic Determinants of Health. (2008). Submission to the
Senate Subcommittee on Population Health in Response to
Population Health Policy: Issues and Options – Fourth Report of
the Senate Subcommittee on Population Health, June 29, 2008.
119 Koopman, C., Pelletier, K., Murray, J., Sharda, C., Berger, M.,
Turpin, R., Hackleman, P, Gibson, P., Holmes, D. & Bendel,
T. (January, 2002). Stanford Presenteeism Scale. Journal of
Occupational & Environmental Medicine, 44(1), 14-20.
120 Marcus, C.A. (2001). ’Presenteeism’: A clear view of a
growing problem. Compensation & Benefi ts Management,
Winter, 2001, p.56.
121 Mackenbach, J.P., Meerding, W.J. & Kunst, A.E. (2007).
Economic Implications of Socio-economic Inequalities in Health
in the European Union. Rotterdam, The Netherlands: European
Commission.
122 Health Disparities Task Group of the Federal/Provincial/Territorial
Advisory Committee on Population Health and Health Security.
(December, 2004). Reducing Health Disparities – Roles of the
Health Sector: Discussion Paper, p. vii.
123 Goldsmith, L., Hutchison, B., & Hurley, J. (May, 2004). Economic
Evaluation Across the Four Faces of Prevention: A Canadian
Perspective. Canadian Medical Association.
124 Ibid., pp. vi-vii.
125 Black, D. (Chair). (1980). Inequalities in Health: Report of a
Research Working Group. London: The Stationery Offi ce.
126 Commission on Social Determinants of Health. (April, 2007). A
Conceptual Framework for Action on the Social Determinants of
Health. Draft Discussion Paper for the Commission on Social
Determinants of Health. Geneva: WHO.
127 Crombie, I., Irvine, L., Elliott, L., Wallace, H. (2005). Closing the
Health Inequalities Gap: An International Perspective. WHO.
128 Acheson, D. (Chair). (1998). Independent Inquiry into Inequalities
in Health: Report.
129 Department of Health. (July, 2000). The NHS Plan: A Plan for
Investment, a Plan for Reform. London: The Stationery Offi ce.
130 Department of Health. (November, 2002). Tackling Health
Inequalities – 2002 Cross-cutting Review. London: The
Stationery Offi ce.
131 Department of Health. (2003). Tackling Healt Inequalities: A
Programme for Action. London: The Stationery Offi ce.
132 Raphael, D. & Bryant, T. (2006). The State’s Role in Promoting
Population Health. Health Policy, 78, 2006, p. 11.
133 Ibid.
134 National Council of Welfare. (2007). Solving Poverty: Four
Cornerstones of a Workable National Strategy for Canada, 126.
135 Department of Health. (2005). Tackling Health Inequalities: Status
Report on the Programme for Action. London: The Stationery
Offi ce.
136 Swedish Ministry of Health and Social Affairs. (2006). Sweden’s
Strategy Report for Social Protection and Social Inclusion 2006-
2008. http://ec.europe.eu/employment_social/social_inclusion/
naps_en.htm
137 Ibid.
138 National Council of Welfare. (2007). Solving Poverty: Four
Cornerstones of a Workable National Strategy for Canada, 126,
p. 4.
139 Ibid.
140 Public Health Agency of Canada. (2008). Health Equity Through
Intersectoral Actions: An Analysis of 18 Country Case Studies.
Prepared for the World Health Organization.
141 Ibid.
Health Inequities in British Columbia: Discussion Paper
83
142 Quebec National Assembly. (2002). Bill 112: An Act to Combat
Poverty and Social Exclusion. R.S.Q.
143 Ibid.
144 Collin, C. (October, 2007). Poverty Reduction Strategies
in Quebec and in Newfoundland and Labrador. Library of
Parliament Publications List PRB 07-23E Retrieved August 15,
2008 from http://www.parl.gc.ca/information/library/PRBpubs/
prb0723-e.htm
145 Comite consultative de lutte contre la pauvrete et l’exclusion
sociale. (2007). Planning, Aims and Objectives 2006-2009.
Government of Quebec, cited in Chantal Collin, 2007.
146 Collin, C. (October, 2007). Poverty Reduction Strategies
in Quebec and in Newfoundland and Labrador. Library of
Parliament Publications List PRB 07-23E Retrieved August 15,
2008 from http://www.parl.gc.ca/information/library/PRBpubs/
prb0723-e.htm
147 Government of Newfoundland and Labrador. (June, 2006).
Reducing Poverty: An Action Plan for Newfoundland and
Labrador. Poverty Reduction Strategy, Department of Human
Resources, Labour and Employment, pp.13-15.
148 Ibid, p. 16.
149 Government of Newfoundland and Labrador. (April 26, 2007).
Budget 2007, Budget Highlights, cited in Chantal Collin, 2007.
150 Jones, D. B. (2008). Report on the State of Public Health in
Canada. Offi ce of the Chief Public Health Offi cer of Canada, p.
3.
151 National Advisory Council on Aging. (2006). Seniors in Canada
2006 Report Card.
152 Canadian Museum of Civilization Corporation. (n.d.). The History
of Canada’s Public Pensions. Retrieved on February 6, 2008,
from http://www.civilization.ca/hist/pensions/cppm1952_e.html
153 Statistics Canada. (2007). A Portrait of Seniors in Canada.
Catalogue no. 89-519. Ottawa.
154 Canadian Population Health Initiative. (2004). Improving the
Health of Canadians. Canadian Institute for Health Information.
155 Canadian Institute for Health Information. (Personal
communications on seniors poverty rates received on September
27, 2007) cited in Jones, D.B. (2008). Report on the State of
Public Health in Canada. Offi ce of the Chief Public Health Offi cer
of Canada, p. 3.
156 Public Health Agency of Canada. (2008). Health Equity Through
Intersectoral Actions: An Analysis of 18 Country Case Studies.
Prepared for the World Health Organization.
157 BC Healthy Living Alliance. (September, 2008). Discussion
Paper: Healthy Futures for BC Families, p. 19.
158 Carter, T. & Polevychok, C. (December, 2004). Housing is Good
Social Policy: Research Report F/50. Ottawa, Ontario: Canadian
Policy Research Networks Inc., p. 14.
159 Ibid, pp. 35-39.
160 Ibid, pp. 30-33.
161 Jones, D. B. (2008). Report on the State of Public Health in
Canada, p. 3. Offi ce of the Chief Public Health Offi cer of Canada,
p.3.
162 Commission on Social Determinants of Health. (2008). Closing
the Gap in a Generation: Health Equity Through Action on the
Social Determinants of Health. Final Report of the Commission
on Social Determinants of Health. Geneva: WHO.
163 BC Ministry of Health. (June, 2008). Ministry of Health 2007/08
Annual Service Plan Report.
Top Related