


Languages
Pages
Legal


Journal of Engineering Science and Technology Vol. 10, No.11 (2015) 1422 - 1440 © School of Engineering, Taylor’s University
1422
PHOTOVOLTAIC BASED SHUNT ACTIVE FILTER FOR POWER QUALITY IMPROVEMENT USING ICOSΦ THEORY
VIJAYAKUMAR G.1,*, ANITA R.
2
1Department of EEE, K.S.R. College of Engineering, Tamil Nadu, India 2Department of EEE, Institute of Road and Transport Technology, Tamil Nadu, India
*Corresponding Author: [email protected]
Abstract
This paper presents an optimal operation of Photovoltaic based Shunt Active
Filter as (PV-SAF) for significant energy conservation, harmonic mitigation and reactive power compensation. When the PV system generates excessive or equal
power required to the load demand, then the coordinating logic disconnects the
service grid from the load and with a consequent reduction of panel tariff and
global warming gasses. The PV module is connected to the DC side of SAF
through the DC-DC converter. Converter switch is controlled by fuzzy based Perturb & Observe (P&O) Maximum Power Point Tracking (MPPT) algorithm
and it eliminates the drawback in the conventional PV system. The reference
currents are extracted by the Fuzzy logic controller based ICosΦ control strategy.
This proposed PV-SAF, if connected at the terminals of a small industry or a
home or a small enlightening institution can avoid the use of interruptible power
supply and individual stabilizer. An emulation using MATLAB Simulink is presented to validate the advantage of the proposed system.
Keywords: Shunt active filter, Perturb & Observe, Maximum power point tracking,
DC-DC converter, Energy conservation.
1. Introduction
Recently, the percentage of the sensitive loads such as computers, medical
equipment and devices in Information Technology has increased. These sensitive
loads are operated continuously during a 24 hours period and require reliable
power supply. If supplying unreliable power these devices bring severe losses to
the domestic and industrial customers. Then again, increase the EMI problem;
real and reactive power losses, which can cause harmonics phenomena on the line
current. So the power qualities become more important to maintain the safety of

Photovoltaic Based Shunt Active Filter for Power Quality Improvement . . . . 1423
Journal of Engineering Science and Technology November 2015, Vol. 10(11)
Nomenclatures
CSI Changes in output current
CSV Changes in output voltage
IL Load current
Is Source current
MPPT Maximum power point tracking
P&O Perturb and observe
PPV Photovoltaic power
PV Photovoltaic
SAF Shunt active filter
Ta, Ty Ambient temperature
THD Total harmonic distortion
Vm Peak instantaneous voltage
VSI Voltage source inverter
electrical devices and customer satisfaction. The proposed PV-SAF is connected
in shunt with the three-phase distribution system. The PV based SAF injects
current of the same amplitude and reverse phase to that of the load current into the
ac system, in order to compensate the source current.
The DC-link voltage is decreasing during the compensation. The SAF supported
DC-link capacitor consumes more power from the distribution system for the
continuous compensation. Taking these aspects into account, renewable power
generation system integrated with SAF is proposed in this work. The PV-SAF is
proposed for source current harmonic reduction, supply of real and reactive power
to the load and satisfies the load demand. The interfacing inductor provides the
isolation and filtering between the three-leg VSI and the distribution system.
At present, the nations have increased the use of PV system in the power
system application. PV-SAF system has become favorable solutions for frequent
power interruptions in a day [1]. ICosØ Control algorithm is attractive that the
control scheme should be applicable in any practical power system under the
operating conditions such as balanced source/load and unbalanced source/load. In
the frequency domain, the device switching frequency of the SAF is kept
generally more than twice the highest compensating harmonic frequency for
effective compensation [2]. Correction in the time domain is based on the
principle of holding the instantaneous values within some reasonable tolerances.
An instantaneous error function is computed on-line, which is the difference
between actual and reference current/voltage waveform. The greatest advantage
of time domain correction is its fast response to changes in power system [3]. It is
easy to implement and has very little computational burden.
The Mamdani type of fuzzy controller used for the control of SAF gives better
results compared with the PI controller, but it has the drawback of a larger
number of fuzzy sets and 49 rules. Though several control techniques and
strategies had been developed there were still filter performance contradictions
[4], these became primarily motivation for the current paper. This paper is
focusing the performance of fuzzy logic controller based Icos ∅ algorithm, which
is prominent one to analyze under transients. To validate current THD

1424 Vijayakumar G. and Anita R.
Journal of Engineering Science and Technology November 2015, Vol. 10(11)
observations, extensive simulations were performed and the detailed simulation
results are included.
2. System Configuration
The power circuit of the proposed Photo-voltaic System based SAF topology
namely PV-SAF is presented. The PV-SAF is designed to compensate the current
disturbance at the load side. It is also designed to inject the real power generated
by the PV system to load on whole day [5]. The PV-SAF consists of PV array,
rectifier, converter, energy storage unit, VSI, filters and switches S1, S2, S3, P1, P2,
P3 and R1, R2. The proposed circuit topology of the three phase PV-SAF is shown
in Fig. 1. The proposed three phase PV-SAF operates in two modes as in Table 1:
1) compensation mode and 2) UPS Energy conservation mode. In the first mode,
under normal condition the semiconductor S1, S2, S3 switches are turned ON and
R1, R2 turned OFF. When SAF detects difference in the current, then the SAF
enter into compensation mode through the inductor. Three phase AC current is
injected in shunt with desired magnitude, phase angle and wave shape for the
compensation. In the second mode, when the PV system generates excessive or
equal real power to the load demand, then the SAF enters into a UPS energy
conservation mode. The system aims to transfer the power generated on the PV
system to the AC load through the three-phase Voltage Source Inverter (VSI).
The excessive power generation of the PV system turns ON the switch R1 and
turns OFF the switch R2. During this mode, the switches S1, S2, S3 are turned OFF
and the switches P1, P2 and P3 are turned ON as presented in Table 2.
Table 1. Control signals for semiconductor switches.
Mode Control Signals
S1 S2 S3 P1 P2 P3
Compensation 1 1 1 1 1 1
UPS Energy Conservation 0 0 0 1 1 1
Fig. 1. Block diagram of the proposed PV-SAF.

Photovoltaic Based Shunt Active Filter for Power Quality Improvement . . . . 1425
Journal of Engineering Science and Technology November 2015, Vol. 10(11)
Table 2. Battery control.
Condition
Control
Signals Battery Charging Unit
R1 R2
PPV ≥ PL 1 0 PV system
PPV < PL 1 1 PV system & Rectifier
3. Detection of Disturbance
In I cos ∅ algorithm, the grid source is required to supply only the real component
of the load current. Remaining parts of load current i.e., reactive component and
harmonics are to be compensated by the shunt active filter. The three phase
instantaneous fundamental component of voltages can be represented [6] by
Equation (1),
= ; = − 120 ; = + 120 (1)
where, a, b, c is phases a, b, c, respectively, Vm is peak value of the instantaneous
voltage; the load current (IL) contains fundamental and harmonic components.
The fundamental component of the load current (ILfa) is separated with the help of
biquad low pass filter. Its output is fundamental component is delayed by 900 as
represented by Equations (2), (3) and (4).
= , − ∅ − 90 (2)
= , − ∅ − 120 − 90 (3)
= , − ∅ + 120 − 90 (4)
The real part of the fundamental component of load current is estimated as, at
the time of negative zero crossing of the input voltage of phase a, i.e., ωt =1800,
instantaneous value of fundamental component of load current is im cos Ø. The
magnitude of the desired source current "I#$%&" can be expressed as the magnitude
of real component of fundamental load current in the respective phases, i.e., for
phase a it can be written as"I#$%&" = 'ReI*+'. To ensure balanced, sinusoidal
currents to be drawn from the source, the magnitude of the desired source current
can be expressed as the average of the magnitudes of the real components of the
fundamental load currents in the three phases is gives as in Eq. (5).
",-." ='/.012'3'/.014'3'/.015'
6 ; ",-." ='012' 7, ∅238'014' 7, ∅43'015' 7,∅5
6 (5)
The voltage fluctuations in DC bus voltage of shunt active filter are also
sensed and given to fuzzy controller, which calculates the current to be taken
from the source to meet power loss in the inverter. This current is added to the
average value of "I#$%&". The three phase source voltages are used as templates to
generate unit amplitude sine waves in phase with source voltages and they are
expressed as Eq. (6),
9 = 1 ; 9 = 1 − 120 ;; 9 = 1 + 120 (6)
The desired (reference) source currents in the three phases are obtained by
multiplying reference source currents with unit amplitude templates of the

1426 Vijayakumar G. and Anita R.
Journal of Engineering Science and Technology November 2015, Vol. 10(11)
phase to ground source voltages in the three phases as given in Eqs. (7), (8) and
(9) respectively.
,-. = ",-." : 9 = ",-." (7)
,-. = ",-." : 9 = ",-." − 120 (8)
,-. = ",-." : 9 = ",-." + 120 (9)
The equivalent block diagram of Icos ∅ algorithm is shown in Fig.2.
Fig. 2. Block diagram implementation of ;<=>∅ algorithm for a phase.
The compensation currents to be injected by the shunt active filter are the
difference between the actual load currents and the desired source currents
represented in Eq. (10)
7? = − ,-.; 87? = − ,-.; 87? = − ,-. (10)
During the transient condition the DC link capacitor voltage is varying, in
order to obtain the power loss in the capacitor is calculated by fuzzy rule based
method as shown in Fig. 3.
Fig. 3. Fuzzy based power loss calculation in inverter.

Photovoltaic Based Shunt Active Filter for Power Quality Improvement . . . . 1427
Journal of Engineering Science and Technology November 2015, Vol. 10(11)
4. PV Array Modeling
PV arrays are built up with combined series/parallel combination of PV solar
cells. The PV array requires DC-DC converter to regulate the output voltage
under the sudden changes in weather conditions, which change the solar
irradiation level as well as cell operating temperature. An equivalent circuit model
of photovoltaic cell with DC-DC converter is shown in Fig. 4. The output voltage
of the PV cell is a function of photo current that is mainly determined by load
current depending on the solar irradiation level during the operation [7]. The PV
cell output voltage is expressed as in Eq. (11).
7 = @AB5. C D0E30FG050F
H − I, (11)
Fig. 4. PV Modeling boost converter with P&O MPPT algorithm.
where, e is the charge of electron, Vc is the output voltage of PV cell in volts, Iph
is the photo current in A, I0 is the reverse saturation current of diode, k is
Boltzmann constant, Ic is the cell output current in A, R is the cell internal
resistance, Tc is the operating temperature of the reference cell 25 0c.
The design parameters Iph, Io, Rs and Tc are determined from the data sheet and
I-V characteristics of the PV array [8]. The operating temperature of solar cell
varies as a function of solar irradiation level and ambient temperature. The effect
of change in ambient temperature and solar irradiation levels are represented in
the model by the temperature coefficients CTV and CTI are given in Eqs. (11) and
(12). Where, βK= 0.004 and γK= 0.06.Ta and Ty represent the ambient temperature
of the cell and atmosphere.
MN = 1 + OBP − PQ (12)
M0 = 1 +r
T
S
γ PQ − P (13)

1428 Vijayakumar G. and Anita R.
Journal of Engineering Science and Technology November 2015, Vol. 10(11)
Fig. 5. Functional of photovoltaic array block diagram.
5. Control Method
5.1. PV MPP tracking control
Currently the most popular MPPT algorithm is Perturb and Observe (P&O) [9],
where the current/voltage is repeatedly perturbed by a fixed amount in a given
direction, and the direction is changed only if the algorithm detects a drop in
power between steps. In the proposed work each perturbation of the controller
gives a reference voltage, which is compared with the instantaneous PV module
output voltage and the error is fed to a fuzzy controller, which in turns decides the
duty cycle of the DC/DC converter. The process of perturbation is repeated
periodically until the MPP is reached [10].
The computation of actual state (k) and previous state (k-1) of the
parameters V and I are considered. The power is calculated from the product
of actual and previous state V & I. According to the condition as represented
in Fig. 6, the increment or decrement of reference voltage of the PWM pulse
generator is obtained. The Simulink block diagram of the fuzzy controller
based P&O MPPT is shown in Fig. 7. The inputs and output of fuzzy
controller are expressed as a set of linguistics variables as shown in Fig. 7.
Follows: NB-Negative Big, NS-Negative Small, Z-Zero, PS-Positive Small
and PB-Positive Big. The output of the fuzzy is chosen form a set of semantic
rules that lead to track the maximum power point of PV array. The set of rules
chosen are shown in Fig. 8 and Table 3.

Photovoltaic Based Shunt Active Filter for Power Quality Improvement . . . . 1429
Journal of Engineering Science and Technology November 2015, Vol. 10(11)
Fig. 6. Flow chart of P&O MPPT algorithm.
Fig. 7. Control structure of fuzzy P&O MPPT.
Table 3. Fuzzy rules for P&O MPPT method.
E/CE NB NS ZE PS PB
NB ZE ZE PB PB PB
NS ZE ZE PS PS PS
ZE PS ZE ZE ZE NS
PS NS NS NS ZE ZE
PB NB NB NB ZE ZE

1430 Vijayakumar G. and Anita R.
Journal of Engineering Science and Technology November 2015, Vol. 10(11)
Fig. 8. Membership function for variable E, change in error CE and output.
5.2. SAF controller
The control system of SAF with fuzzy controller is shown in Fig. 9. This
compensator solves harmonic problems in the source side. In the conventional
controllers like P, PI and PID, the control parameters are fixed at the time of
design. Hence, the conventional controllers offer good performance only for the
linear system. When the operating point of the system is changed, the parameters
of the conventional controllers should be designed again, and some trials and
prior information of the systems are needed to design the parameters. The fuzzy
controller overcomes the drawbacks of the conventional controllers [11-12]. The
DC-bus voltage is first sensed and compared with DC reference voltage and error
signal is generated. The error signal and its derivative are applied to fuzzy logic
controller. Error signal is applied to Memory block and its output is subtracted
from the error signal to obtain derivative of error signal.

Photovoltaic Based Shunt Active Filter for Power Quality Improvement . . . . 1431
Journal of Engineering Science and Technology November 2015, Vol. 10(11)
Fig. 9. Control of SAF.
The processed error signal is modulated using Sinusoidal Pulse Width
Modulation (SPWM) to produce the required pulse to VSI for compensate the
load voltage and current. To compare a sinusoidal frequency 50 Hz with a
triangular carrier waveform Vcarrier with 20 kHz signal to produce the PWM pulses
for three phase SAF. When the control signal is greater than the carrier signal, the
switches are turned on, and their counter switches are turned off. The output
voltage of the inverter mitigates harmonics. The two inputs and the output use
seven triangular membership functions namely Negative Big (NB), Negative
Medium (NM), Negative Small (NS), Zero (ZE), Positive Small (PS), Positive
Medium (PM), Positive Big (PB). The type and number of membership functions
(MFs) decides the computational efficiency of a FLC. The shape of fuzzy set
affects how well a fuzzy system of If–then rules approximate a function. The
membership values of input and output variables are shown in Fig. 10. Each input
has seven linguistic variables; therefore there are 49 input label pairs. A rule table
relating each one of 49 input label pairs to respective output label is given in
Table 5 and the Eqs. (20) and (21).
R8STTUT = "-." − ',' (20)
CE8Change8in8error = 8S − S − 1 (21)
Table 4. Fuzzy rules for SAF voltage regulation.
E/CE NB NM NS ZE PS PM PB
NB PB PB PB PM PM PS ZE
NM PB PB PM PM PS ZE NS
NS PB PM PM PS ZE NS NM
ZE PM PM PS ZE NS NM NM
PS PM PS ZE NS NM NM NB
PM PS ZE NS NM NM NB NB
PB ZE NS NM NM NB NB NB

1432 Vijayakumar G. and Anita R.
Journal of Engineering Science and Technology November 2015, Vol. 10(11)
Fig. 10. Membership function for variable E, change in error CE and output.
6. Simulation and Experimental Results
The performance of the proposed PV-SAF simulated under three cases.
Balanced/unbalanced source, balanced/unbalanced nonlinear load and UPS
energy conservation mode.
Table 5 Design specifications for a three-phase PV-SAF simulated system
Description Parameter Value Unit
AC Supply Nominal Line Voltage 400 V
Frequency 50 Hz
Load Load Resistance 360 Ω
Load Inductance 2 mH
Ripple Filter Filter Inductance 40 mH
SAF
Filter Capacitance 25 µF
Inductor 438 µH
DC capacitor 2800 µF
DC bus voltage 700 V
PV Module
DC-DC converter
No. of Solar cells 320 36
Nominal Voltage 48 V

Photovoltaic Based Shunt Active Filter for Power Quality Improvement . . . . 1433
Journal of Engineering Science and Technology November 2015, Vol. 10(11)
Simulated results are presented for two cases. For these cases, the system
frequency is maintained at 50 Hz and sample time is chosen to be 50 µsec. The
input voltage of 400 V three-phase AC supply is given to load through three-
phase programmable AC source. The switched-mode PWM VSI is made to
operate at 1800 conduction mode. Three-phase VSI is operated by six gate pulses
generated from the PWM pulse generator. The PWM generator has pulse
amplitude of 1V for all the six pulses. The system parameters considered for the
analysis of the proposed PV-SAF are furnished in Table 5.
6.1. Case A: Balanced and unbalanced load
To analyze the performance of the proposed system under balanced load
conditions, source voltage as well as source current is set as sinusoidal but not in
phase. The SAF is required to compensate the reactive power only. At t=0.1, the
inverter is switched on. At this instant the inverter starts injecting the
compensating current so as to compensate the phase difference between the
source voltage and current. The supply current is the sum of load current and
injected SAF output current. During the initial period, there is no load deviation
in the load. Hence, the programmable three-phase AC voltage source feeds the
total active power of 2000 W to the load. Figure 11 shows the waveforms of load
current (a), grid current (b), SAF compensating current (c) and neutral current (d).
It’s observed From Fig. 11(e) the real power generated from PV system is supply
to the load required demand.
Fig. 11. Load current (a), source current (b), Injected current (c),
neutral current (d) and reactive power compensation
(e) under dynamic load changes.
During the unbalanced load condition, the transient load current changes
occurs at times t=0.2s and 0.3s. It reduces the supplied active power of source
from 2000 W to 1500 W as shown in Fig. 12. The resultant active power of the

1434 Vijayakumar G. and Anita R.
Journal of Engineering Science and Technology November 2015, Vol. 10(11)
load oscillates at 0.16 seconds and it stabilizes at 0.18 sec. During the period, the
reactive power supplied by the source is reduced from 600 VAR to 210 VAR.
Fig. 12. Source, injected and load real power under dynamic load condition.
The SAF responds to the current transient and injects a reactive power of 500
VAR to restore the reactive power of the load. The results confirm the good
dynamic performance of the SAF for a rapid change in the load current. The FFT
of the grid current before and after compensation is carried out. The current THD
is reduced from 21.54% to 1.53% as shown in Fig. 13.
Fig. 13. Phase A current THD spectrum before and after compensation.
Photovoltaic Based Shunt Active Filter for Power Quality Improvement . . . . 1435
Journal of Engineering Science and Technology November 2015, Vol. 10(11)
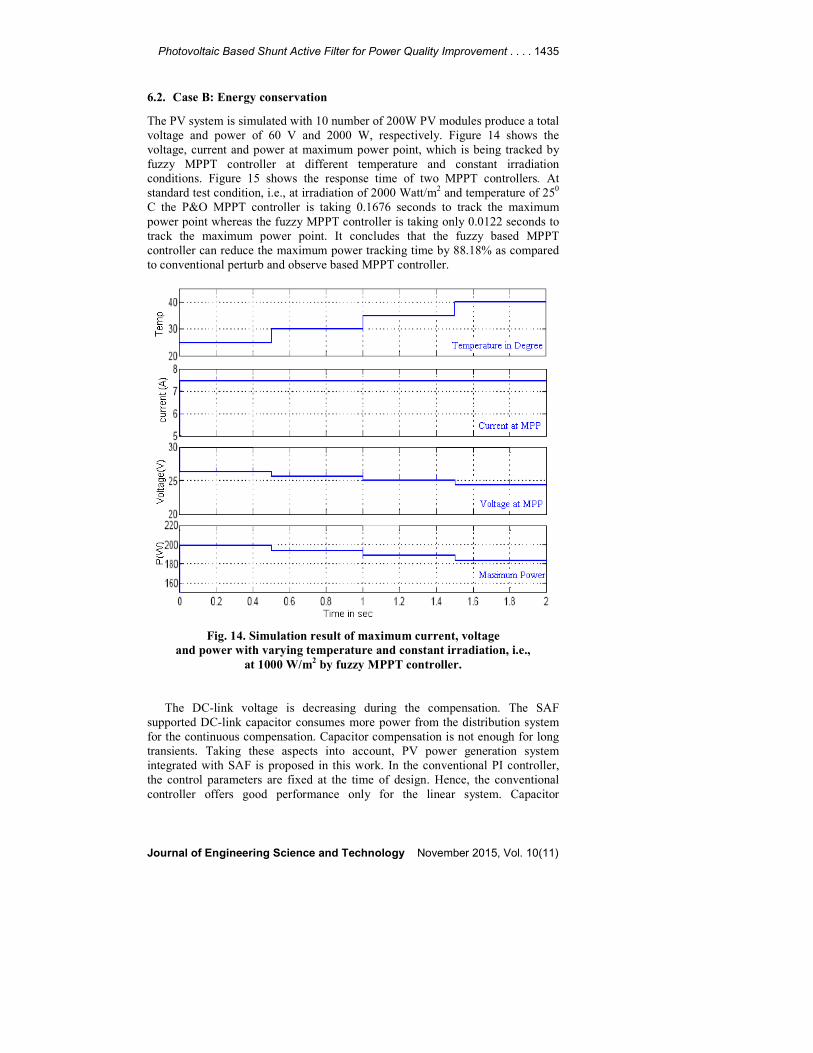
6.2. Case B: Energy conservation
The PV system is simulated with 10 number of 200W PV modules produce a total
voltage and power of 60 V and 2000 W, respectively. Figure 14 shows the
voltage, current and power at maximum power point, which is being tracked by
fuzzy MPPT controller at different temperature and constant irradiation
conditions. Figure 15 shows the response time of two MPPT controllers. At
standard test condition, i.e., at irradiation of 2000 Watt/m2 and temperature of 250
C the P&O MPPT controller is taking 0.1676 seconds to track the maximum
power point whereas the fuzzy MPPT controller is taking only 0.0122 seconds to
track the maximum power point. It concludes that the fuzzy based MPPT
controller can reduce the maximum power tracking time by 88.18% as compared
to conventional perturb and observe based MPPT controller.
Fig. 14. Simulation result of maximum current, voltage
and power with varying temperature and constant irradiation, i.e.,
at 1000 W/m2 by fuzzy MPPT controller.
The DC-link voltage is decreasing during the compensation. The SAF
supported DC-link capacitor consumes more power from the distribution system
for the continuous compensation. Capacitor compensation is not enough for long
transients. Taking these aspects into account, PV power generation system
integrated with SAF is proposed in this work. In the conventional PI controller,
the control parameters are fixed at the time of design. Hence, the conventional
controller offers good performance only for the linear system. Capacitor

1436 Vijayakumar G. and Anita R.
Journal of Engineering Science and Technology November 2015, Vol. 10(11)
maximum overshoot and transient settling time as improved by fuzzy based
control as shown in Fig. 15.
Fig. 15. Panel output by MPP Tracking P&O fuzzy logic controller method.
From Table 6 it’s observed the fuzzy based ICosΦ controller is superior to the
conventional PI control. When the power generation on the PV system is greater
than the load demand, then the coordinating logic presented in the Table 2,
connects the output of the PV system to manage the load demand. The RMS
value of the supply voltage, injected voltage and load voltage of the SAF for
energy conservation mode are shown in Fig. 16.
Table 6 PV-SAF response comparison.
Case under
consideration
Maximum
overshoot
Transient
settling time
Source
current
THD %
conventional PI 96.5 0.053 7.26
Fuzzy 118.9 0.018 1.16
In this case, the SAF injects the nominal voltage of 400 V in parallel with the
load. On examining the results, it is found that the proposed SAF is able to
conserve the energy. This case provides an additional financial benefit to the users
by reducing the power consumption from the utility grid. The active and reactive
powers of the SAF in energy conservation mode are shown in Fig. 17. In this
case, the SAF injects an active power of 2000 W and reactive power of 500 VAR
to the load. The FFT analysis has been carried out for the balanced/unbalanced
source and balanced/unbalanced load to determine the THD, which is illustrated
in Table 7.

Photovoltaic Based Shunt Active Filter for Power Quality Improvement . . . . 1437
Journal of Engineering Science and Technology November 2015, Vol. 10(11)
(a) Supply voltage
(b) Injected voltage
(c) Load voltage
Fig. 16. Supply injected and load voltage of the 3-phase PV-SAF.
Fig. 17. Source injected and load active and reactive power of the PV-SAF.

1438 Vijayakumar G. and Anita R.
Journal of Engineering Science and Technology November 2015, Vol. 10(11)
Table 7. THD comparison without SAF compensation under different cases.
Source/load
Fundamental
component of source
current (p.u.)
THD in source
current (%)
Phases A B C A B C
Balanced source
balanced nonlinear
load
0.778 0.778 0.778 18.43 18.43 18.43
Unbalanced source
balanced nonlinear
load
0.516 0.759 0.328 19.23 20.90 25.40
Balanced source
unbalanced
Nonlinear load
0.676 0.741 0.627 21.54 22.40 20.90
6.3. Case C: Comparative study of experimental results
The experimental setup of PV-SAF as shown in Fig. 18. The result demonstrates
the energy saving capability of the proposed SAF. The conventional SAFs
presented in the literatures are only used for the compensation of current
harmonics and reactive power. In the proposed SAF, additional function is added
to fully utilize the energy generated by the PV power system.
Fig. 18. Overall PV-SAF experimental setup.
It also helps to reduce the energy consumption of load from the three-phase
utility distribution system. When the proposed coordinating logic, which is loaded
in the FPGA controller detects the excessive or equal power generated by the PV
system, the SAF enters into the energy conservation mode by disconnecting the
three-phase supply voltage from the load and it configures that parallel to feed the
real power generated on the PV system to load. The performance of PV-SAF
demonstrates under unbalanced load in which, the current draw by load is
integrated with harmonics. Figures 19(a) to (e) illustrates the performance of PV-
SAF under Unbalanced sinusoidal voltage condition, THD for without SAF
controller is 21.54%; THD for ICOSΦ method with PI Controller is 7.57%; THD

Photovoltaic Based Shunt Active Filter for Power Quality Improvement . . . . 1439
Journal of Engineering Science and Technology November 2015, Vol. 10(11)
for ICOSΦ method with Fuzzy Controller is 3.6%. Figure 19(f) illustrates the
capacitor voltage is maintained as constant magnitude.
Figure 19(c) illustrates the performance of PV-SAF injected current under un-
balanced load condition, Even though the PI controller maintains the source
current is inphase, but the current spike are increase the THD level as shown in
the Table 8. It is observed that the proposed fuzzy controller based P&O MPPT
controller tracked the maximum power generated by the PV array with 88.18 %
of efficiency and also the proposed SAF ICOSΦ control maintains the THD
below 5% as per IEEE519 standards.
(a) (b) (c)
(d) (e) (f)
Fig. 19. SAF results under Unbalanced load condition.
Table 8. PV-SAF response comparison.
Method
THD in source current (%)
Balanced
source
&load
Unbalanced
source &
balanced load
balanced source
&Unbalanced
load
Without SAF 18.43 19.23 21.54
SAF with PI 7.26 7.35 7.57
PV-SAF
ICOSΦ 3.42 3.58 3.6
7. Conclusion
This paper presents a novel application of utilizing a PV solar system as SAF for
harmonic mitigation, reactive power compensation and neutral current
compensation at the point of common coupling (PCC) at a small industry. A DC-
DC converter with fuzzy controller based P&O MPPT algorithm is implemented
to track the maximum power point of the PV array. When the operating point of
view the system is changed, the parameters of the conventional controllers should
be designed again, and some trials and prior information of the systems are
needed to design the parameters. The fuzzy controller overcomes the drawbacks
of the conventional controllers. A fast convergence with small oscillation at the
maximum power point can be achieved by this method. This novel PV-SAF can
reduce the energy consumption from the three phase utility grid, when the PV
system generates excessive power or equal power to the load demand. Further, it
reduces the energy consumption tariff and avoids the use of stabilizer for the

1440 Vijayakumar G. and Anita R.
Journal of Engineering Science and Technology November 2015, Vol. 10(11)
individual equipment at a residence, small industry, etc. The simulation and
experimental results shows that the PV-SAF performance is satisfactory in
mitigating the current harmonics for the operation over 24×7 hours and reduces
the THD level as per the IEEE519 standard.
References
1. Vijayakumar, G.; and Anita, R. (2013). Renewable energy interfaced SAF
using PI controller based ant colony and swarm optimization algorithms.
Australian Journal of Basic and Applied Sciences, 7(8), 110-119.
2. El-Habrouk, M.; and Darwish, M.K. (2000). Active power filters: a review.
IEEE Proceedings on Electric Power Applications, 5(1), 403-413.
3. Akagi,H,; and Kanazawa,Y. (1984), Instantaneous Reactive Power
Compensators Comprising Switching Devices without Energy Storage
Components. IEEE Transactions on Industry Applications, 20(3), 625-630.
4. Salmeron, P.; and Herrera, R.S. (2006). Distorted and Unbalanced Systems
Compensation within Instantaneous Reactive Power Framework. IEEE
Transactions on Power Delivery, 2(3), 1655-1662.
5. Mohan, N.; and Undeland, T.M. (2006), Power Electronics Converters:
Applications and Design, Third Edition, Jhon Wiley & Sons Asia Pvt. Ltd.,
Singapore, 172-178.
6. Bhuvaneswari G,; and Nair, M.G. (2008). Design, Simulation, and Analog
Circuit Implementation of a Three-Phase Shunt Active Filter using the ICosΦ
Algorithm. IEEE Transactions on Power Delivery, 23(1), 1222-1235.
7. Altas, H.; and Sharaf, A.M. (2007). A photovoltaic array simulation model
for MATLAB simulink GUI environment. in proceeding ICCEP’07
Conference 2007. Trabzon, 341-345.
8. El-Tayyan, A.A.; (2011), PV system behavior based on datasheet, Journal of
Electron Devices, 9(1), 335-341.
9. Bader, N.; and Alajmi. (2013), A Maximum Power Point Tracking Technique
for Partially Shaded Photovoltaic Systems in Micro grids. IEEE Transaction
on Industrial Electronics, 60(4), 1596-1606.
10. Elgendy, M.A.; and Zahawi, B. (2012). Assessment of perturb and observe
MPPT algorithm implementation techniques for PV pumping applications.
IEEE Transaction on Sustainable Energy, 3(1), 21-33.
11. Jain, S.K. (2002), Fuzzy Logic Controlled Shunt Active Power Filter for
Power Quality Improvement. IEEE Proceedings Electric Power
Applications, 149(5), 317-328.
12. Kirawanich, P.; and Connell, R.M. (2004). Fuzzy Logic Control of an Active
Power Line Conditioner. IEEE Transactions on Power Electronics, 19(6),
1574-1585.
Top Related