


Languages
Pages
Legal


1
Phase IV Deliverables for Objectives H, J and K
(Energy Component)

2
Table of Contents
1. Introduction 6
2. Pump Selection Extension Program 7
Objectives of this project: 7
2.1. Executive Summary of the outcomes: 8
2.2. A brief description of pump characteristics 9
2.3. Investigation of existing pump selection practices of farmers 11
2.4. Investigation of pump selection methodology of pump vendors 13
2.4.1. Summary of Investigations 14
2.5. Operational efficiencies of pump sets on field 15
2.5.1. Comparison of operational efficiencies with pump characteristics 18
2.5.2. Insights from Garaj, Aurangabad field visit 19
2.6. Case Studies on Pump Selection 20
2.6.1. Case Studies: 22
Case I: Farmer 1: Umbarda bazar, Washim 22
Case II: Farmer 2: Yevta, Washim 23
Case III: Farmer 3, Garaj, Aurangabad 24
Case IV: Farmer 4, Dhorapgaon, Buldhana 25
Case V: Farmer 5, Junoni-Walgud, Osmanabad 26
Case VI: Farmer 6, Junoni-Walgud, Osmanabad 27
2.6.2. Summary of findings 28
2.6.3. Way forward 30
3. Irrigation infrastructure: Water transfer structures 31
3.1. Washim village cluster 32
Type II: Borewell to open well water transfers 32
General points: 32
Reasons for looking for more than 1 water source and water transfers: 33
Energy requirement: 33
Investments: 35
Type III: Minor irrigation tank to field 36
Analysis of energy usage for Type III water transfers in Umbarda and Yevta 37
3.2. Yavatmal village cluster 38
3.3. Osmanabad village cluster 40
4. Estimates of water and energy off-season consumption [H] 41

3
4.1. Executive Summary 41
4.2. Details about methodology used for estimation: 41
4.3. Fortnightly energy consumption for year 2019-20 43
4.4. Summer or Offseason consumption 45
Appendix I 47
Appendix II 48
References 50

4
List of Figures
Figure 1: Characteristics of a Texmo borewell pump measured in the lab. The grey box
indicates the head and flow rates available in the company catalogue. This is a 5 star rated
pump. 9
Figure 2: Series of Texmo 3 HP submersible open-well pumps 10
Figure 3: On-field Efficiencies of Ag pump sets (measurements taken on the field in the month
of Feb 2020, Sept/Oct2020 in Washim cluster and Dec 2020 in Aurangabad cluster) 16
Figure 4: Efficiency variation when drip and sprinkler system are connected to the same pump
(Farmer 1: ISI rated pump. Farmer 2: Non-ISI rated pump) 17
Figure 5: Results of pump selection exercise 21
Figure 6: Estimated v/s actual energy consumption (including water transfers) 35
Figure 7: Cropped area for year 2019-20 (Kharif and Rabi) and for year 2020-21 (Kharif) 42
Figure 8: Crop wise estimated v/s actual energy consumption 42
Figure 9: Energy consumption in summer months (2020) 43
List of Tables
Table 1: Villages from which data was collected 11
Table 2: Criteria of pump set selection by farmers 11
Table 3: A general criteria followed by one of the pump set distributors 13
Table 4: On-field efficiencies of ISI marked pump sets 18
Table 5: General details of farmers included in the pump selection exercise 20
Table 6: Example of energy and cost savings if a 5 HP capacity pump (oversized) is replaced
with the 3 HP pump 21
Table 7: Disparity in registered and actual on-ground data 32
Table 8: Estimation of energy consumption throughout the season for major crops in Washim
village cluster 34
Table 9: Estimation of energy consumption for Type III water transfers in Washim cluster 37
5
Table 10: Details about area and energy consumption for major crops in Yehala and Kondhai
villages 38
Table 11: Detailed calculations for input power required for given configuration 46
Table 12: Calculations for energy usage and savings for configurations in Table 11 46
Table 13: Details of instruments used during field measurements 47
Table 14: Description of energy and water meters installed 47
6
1. Introduction
The objectives being addressed from the MoU are:
● H. Calculation of water productivity
● J: Design of extension program to improve pump selection
● K: Village level irrigation and energy infrastructure documentation
The deliverables of Phase IV are:
● H.3 Estimates of water and energy off-season consumption
● J.1 Report on current practices of water infrastructure, pump set and pipeline selection.
● J.2 Analysis of operational efficiencies of existing pump sets on the field, and
guidelines for pump and pipeline selection.
● K.1 Irrigation/ energy infrastructure analysis along with water transfers structures
Chapter 2 deals with pump selection study [J1, J2] and chapters 3 and 4 include irrigation
infrastructure analysis, water transfers and energy consumption [H3 and K1].

7
2. Pump Selection Extension Program
The poor operational efficiency of agricultural pumps is a well-documented phenomenon,
attributed in a very broad sense to low tariffs for agriculture. There have been numerous high
efficiency pump dissemination programs over the last 50 years to address this gap. However,
it is not clear what effect these programs have had at the end of the program, partly due to a
lack of documentation or its availability in the public domain, and due to an absence of holistic
or extended evaluation (Prayas (Energy Group), et al., 2018). Most of them have been pilot
projects conducted in pockets, and is unlikely that the lessons have been incorporated into any
lasting practices or policies (Khobragade, 2018) (Prayas (Energy Group), et al., 2018). In
addition, the energized irrigation sector in Maharashtra is very dynamic, due to changing
cropping and irrigation practices, as well as the steady growth in the number of pumps being
used.
Selecting an appropriate pump is the most effective part of energy efficiency and electricity
distribution infrastructure cost reduction, in the case of pumps. It is also very important for
proper irrigation management. Hence, this project has been undertaken with a view to analyse
Irrigation Pumping System (IPS) selection and usage in Vidarbha and Marathwada, and thereby
develop an extension program for the same, as well as give higher level feedback for policy
changes.
This report includes the insights from primary interactions with various stakeholders, results
from the on-field efficiency measurements with different irrigation systems, comparison of
existing pump sets with the actual practical need, case studies of pump selection and lab
exercise to understand variation in pump performance wrt changes in voltage and loads. The
design of the extension program for improving IPS selection will be delivered in Phase V.
Objectives of this project:
1. To design an extension program for appropriate pump selection which will accomplish
the following:
● Reduce energy consumption
● Reduce the load on distribution system due to pump sets being downsized
● Give farmers confidence in the pump selection process
2. Identify improvements in labelling on pumps to make selection easier
8
3. Identify avenues / institutions to codify these practices of pump selection, efficiency
measurements, labelling
2.1. Executive Summary of the outcomes:
● 48 farmers, and 9 vendors, from the districts of Aurangabad, Buldhana, Hingoli,
Washim, Osmanabad and Yavatmal districts were surveyed to find out how farmers
select pumps.
● Quality of electricity supply is one of the most important factors for all farmers:
o Pumps should have reasonable performance at low voltages.
o Pumps should have high enough flow rates so that irrigation can be completed
quickly due to the lack of reliability of the quality and duration of electricity
supply.
● Cost matters, and the local pumps are cheaper. However, there is a greater infiltration
of ISI mark pumps with programs like PoCRA, and also because these manufacturers
have adapted products to higher performance at low voltages.
● Farmers follow the advice of the vendors, plumbers, and electricians for selection.
Vendors stated that they ask the farmers details about field distance from well, depth of
well, pipe diameter, and recommend pumps based on broad requirements.
● Recently, Texmo Company conducted a training session for shop owners and pump
installers in Buldhana. Companies like Texmo and CRI have developed pump selector
programs (software).
● An analysis of 31 farmers who had recently purchased pumps indicated that 29%
farmers had oversized pumps, hence the load could reduce by 2 kW per farmer, leading
to an overall load reduction of 13%.
● 29 out of 31 pumps were not selected for the appropriate duty point and a detailed
analysis shows a potential saving of 15% energy.
● PoCRA’s subsidy is such that the farmers need to spend Rs. 4000 – 6000 (not a big
difference) whether it is 3 HP or 5 HP, and hence sometimes tilts them towards 5 HP.
● It was observed that many farmers can satisfy their requirement with a capacity less
than 5 HP, but they select a 5 HP pump or higher due to the fact that MSEDCL has the

9
same tariff for 3 and 5 HP pump sets. The current tariff structure has been set according
to (0 to 5 HP, 5 to 7.5 HP, and > 7.5 HP). Taking into account the 15% reduction in
energy by using 3 HP capacity pumps instead of 5 HP, a one more category of 0 to 3
HP pump in addition to the current tariff structure can have a significant impact on the
pump selection criteria.
● The standards for Ag pumps specify very basic information for labelling. Some
information is not given to farmers unless they ask for it. In addition, this information
format is complex, and should be presented in a farmer-friendly manner, in the local
language, if farmers are to be more aware of proper pump selection.
2.2. A brief description of pump characteristics
A pump has varying efficiencies and flow rates at different heads. An appropriate selection
means, selecting a pump such that the operating head, or the head in the field (depth of water
+ frictional head + pressure required for sprinkler/ drip) matches with the duty point of the
pump, or the head where the efficiency is maximum (Best Efficiency Point). Also, the HP
should be such that the pump can supply the required flow rates at the operational head, and
yet the HP should not be more than required.
Figure 1: Characteristics of a Texmo borewell pump measured in the lab. The grey box
indicates head and flow rates available in the company catalogue. This is a 5 star rated pump.

10
Figure 1 shows a sample pump characteristic. The Best Efficiency Point of this pump is at 80m,
and the range as specified by the manufacturer (over which standards are met) is indicated by
the grey box. If the pump was only required to run at a single point or a small range, selecting
a pump would be straightforward. However, it is sometimes possible that the range over which
the pump is required to run is much larger.
Farmers use a pump for furrow and the same pump is used for drip/ sprinkler where the head
increases by 25 – 30m (this is in addition to variation in the level of the water), but the flow
rate is much lower. This could create a problem in selection because often the characteristics
provided by the manufacturer do not indicate the lower side of flow rates. Hence the farmer
may purchase a larger than necessary pump considering a very high head.
Figure 2: Series of Texmo 3 HP submersible open-well pumps
For example in Figure 2 the characteristics stop at 4.4 lps at a 26m head, whereas drip/ sprinkler
have been observed operating at 2.2 lps. But it will not be clear from this catalogue that this
pump could operate a drip/ sprinkler for a certain configuration, and a farmer may select a 5
HP pump even when a 3 HP pump may fulfil the need.
11
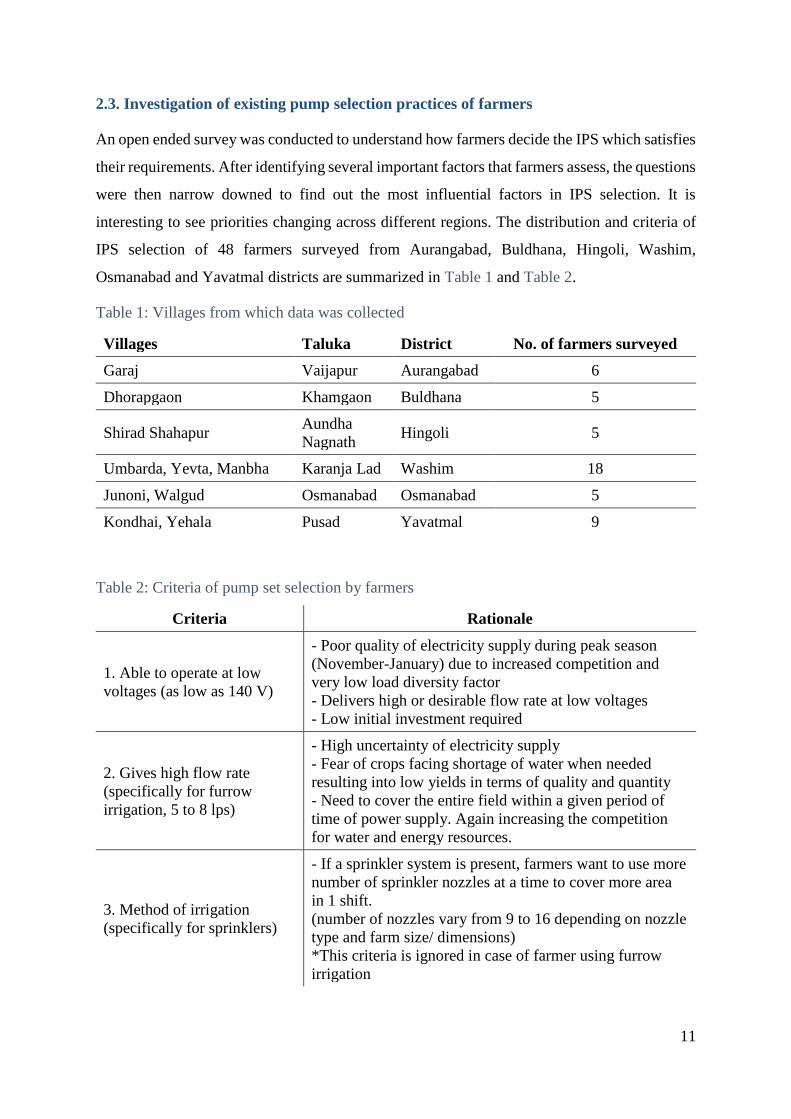
2.3. Investigation of existing pump selection practices of farmers
An open ended survey was conducted to understand how farmers decide the IPS which satisfies
their requirements. After identifying several important factors that farmers assess, the questions
were then narrow downed to find out the most influential factors in IPS selection. It is
interesting to see priorities changing across different regions. The distribution and criteria of
IPS selection of 48 farmers surveyed from Aurangabad, Buldhana, Hingoli, Washim,
Osmanabad and Yavatmal districts are summarized in Table 1 and Table 2.
Table 1: Villages from which data was collected
Villages Taluka District No. of farmers surveyed
Garaj Vaijapur Aurangabad 6
Dhorapgaon Khamgaon Buldhana 5
Shirad Shahapur Aundha
Nagnath Hingoli 5
Umbarda, Yevta, Manbha Karanja Lad Washim 18
Junoni, Walgud Osmanabad Osmanabad 5
Kondhai, Yehala Pusad Yavatmal 9
Table 2: Criteria of pump set selection by farmers
Criteria Rationale
1. Able to operate at low
voltages (as low as 140 V)
- Poor quality of electricity supply during peak season
(November-January) due to increased competition and
very low load diversity factor
- Delivers high or desirable flow rate at low voltages
- Low initial investment required
2. Gives high flow rate
(specifically for furrow
irrigation, 5 to 8 lps)
- High uncertainty of electricity supply
- Fear of crops facing shortage of water when needed
resulting into low yields in terms of quality and quantity
- Need to cover the entire field within a given period of
time of power supply. Again increasing the competition
for water and energy resources.
3. Method of irrigation
(specifically for sprinklers)
- If a sprinkler system is present, farmers want to use more
number of sprinkler nozzles at a time to cover more area
in 1 shift.
(number of nozzles vary from 9 to 16 depending on nozzle
type and farm size/ dimensions)
*This criteria is ignored in case of farmer using furrow
irrigation
12
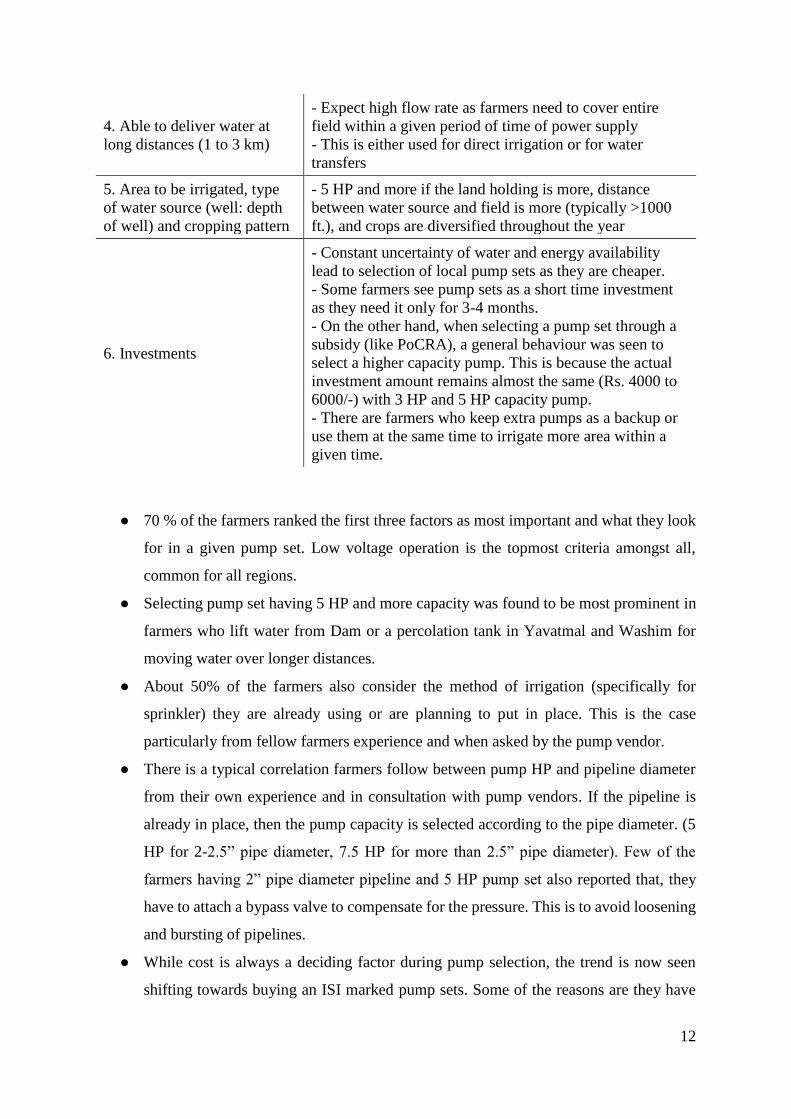
4. Able to deliver water at
long distances (1 to 3 km)
- Expect high flow rate as farmers need to cover entire
field within a given period of time of power supply
- This is either used for direct irrigation or for water
transfers
5. Area to be irrigated, type
of water source (well: depth
of well) and cropping pattern
- 5 HP and more if the land holding is more, distance
between water source and field is more (typically >1000
ft.), and crops are diversified throughout the year
6. Investments
- Constant uncertainty of water and energy availability
lead to selection of local pump sets as they are cheaper.
- Some farmers see pump sets as a short time investment
as they need it only for 3-4 months.
- On the other hand, when selecting a pump set through a
subsidy (like PoCRA), a general behaviour was seen to
select a higher capacity pump. This is because the actual
investment amount remains almost the same (Rs. 4000 to
6000/-) with 3 HP and 5 HP capacity pump.
- There are farmers who keep extra pumps as a backup or
use them at the same time to irrigate more area within a
given time.
● 70 % of the farmers ranked the first three factors as most important and what they look
for in a given pump set. Low voltage operation is the topmost criteria amongst all,
common for all regions.
● Selecting pump set having 5 HP and more capacity was found to be most prominent in
farmers who lift water from Dam or a percolation tank in Yavatmal and Washim for
moving water over longer distances.
● About 50% of the farmers also consider the method of irrigation (specifically for
sprinkler) they are already using or are planning to put in place. This is the case
particularly from fellow farmers experience and when asked by the pump vendor.
● There is a typical correlation farmers follow between pump HP and pipeline diameter
from their own experience and in consultation with pump vendors. If the pipeline is
already in place, then the pump capacity is selected according to the pipe diameter. (5
HP for 2-2.5” pipe diameter, 7.5 HP for more than 2.5” pipe diameter). Few of the
farmers having 2” pipe diameter pipeline and 5 HP pump set also reported that, they
have to attach a bypass valve to compensate for the pressure. This is to avoid loosening
and bursting of pipelines.
● While cost is always a deciding factor during pump selection, the trend is now seen
shifting towards buying an ISI marked pump sets. Some of the reasons are they have

13
improved performance at low voltages, the mandate given by various government
programs such as PoCRA and a word of mouth about a particular pump manufacturer.
● None of the farmers from the surveyed sample goes into technical details about pump
duty point, operational characteristics and what standard accessories can be used to
improve the performance or reduce pump burnouts.
2.4. Investigation of pump selection methodology of pump vendors
Role of a pump set distributor is to calculate the required head and flow rate based on the
information provided by farmers. This information contains details about type of water source,
depth, area to be irrigated, pipeline details and irrigation method used. About 9 pump
distributors were visited to gauge their methodology in pump selection.
Based on the information provided by farmers, if open well depth is within 50 ft. and pipeline
length is within 2000 ft. with 2.5” diameter, then the total dynamic head is calculated first (5
to 7 lps flow rate is assumed for calculations). From the calculated value, a 5 HP capacity
model having 30 to 36m head as rated value is suggested by the pump distributors. If the
pipeline length is greater than 2000 ft. then pump sets rated head value more than 30m are
suggested.
Hence, a regional generalization in the selection process is there as pump distributors have an
overall idea of water sources, well depths, soil types, energy availability and quality, and
cropping pattern.
Pump selector programs developed and owned by Texmo and CRI companies are being used
by one of the pump distributors in Buldhana. Recently, Texmo Company conducted a training
session for shop owners and pump installers in Buldhana. The objective was to create
awareness about pump calculations.
Table 3: A general criteria followed by one of the pump set distributors
Length of the pipeline Pump capacity and Head
3 HP 5 HP 7.5 HP
< 2000 ft. 26 m 30 to 36 m -
2000 to 3000 ft. 44 m 48 m 48 to 56 m
> 3000 ft. - 48 m 48 to 56 m
*This approach is followed by a distributor selling Lubi company’s pump sets in Washim.

14
2.4.1. Summary of Investigations
● Role played by the local plumber and/ or electrician and the pump vendor in the entire
pump set selection process is significant in deciding the particular model of the same
HP, the pump manufacturer and other accessories.
● During on field measurements in September-October 2020, actual power ratings are
found to be higher than the sanctioned load as told by the farmers (e.g. 4 to 5 kW for 3
HP pump). This might be because of installation of higher capacity pumps (oversized)
or high energy consumption of locally made non-ISI market pump sets. This was
different from what we found during the initial visit in February 2020, that the input
power for a 3 HP pump varied from 2.3-3.8 kW and that for a 5 HP varied from 3.8-5.7
kW. Hence we can say that, there are farmers using pumps of the stated rating as well
as oversized pumps as compared to sanctioned load.
● The head range is wide for many farmers which is due to diversified crops with different
irrigation methods. The pump capacities were suitable for furrow irrigation of most of
the crops.
● Variation in the water column height (mbgl) seasonally leads to the selection of pumps
that can operate at a higher head or oversizing. But the operating efficiency was found
to be less than 10% when operated at low heads and in case of surface irrigation (during
Kharif and at the start of Rabi season).
● Poor quality of electricity supply during peak season (November-January) including
frequent tripping, DT failures, forces farmers to go for pumps that are able to run at low
voltages and giving desired flow rate over the higher static and dynamic head. This in
turn leads to poor efficiencies, poor performance of irrigation systems, higher
investments and wastage of time, energy and money.
● Farmers also keep more than 1 pump set as a backup option in case of pump burnouts.
40 out of 48 surveyed farmers (~85%) have more than 1 pump set.
● Additional head of drip or sprinkler system is taken into account when suggesting a
pump. However, it was also found out that if a farmer wants to install a drip or sprinkler
system on the existing pump set, then the pump is considered to match up with the
additional head and deliver required output. This raises a question about oversizing of
existing pump sets.

15
● Energy aspect is generally disregarded by the farmers while pump selection due to lack
of awareness about energy efficiency, technological attributes and low electricity
tariffs.
There is no straight answer to farmers’ agriculture pump set selection criteria, however a
general inclination is towards low voltage compatibility and high flow rate expectation at a
given head. Other two parameters are previous own experience and knowledge gained from
the fellow farmers for certain pump HP.
2.5. Operational efficiencies of pump sets on field
Now that we have an overall idea of common pump selection practices by farmers, the second
important task is to find out the operating characteristics (variation of flow rate with depth of
water) and efficiencies of the pump sets installed by the farmers.
One of the important determinants of the efficiency of a pump depends on the best efficiency
point, or the pressure head it is rated for, and the pressure head it actually operates at in the
field. Other determinants are operating voltage, age of the pump, etc. The head will depend on
the depth of water which varies with season, as well as with time during the irrigation cycle.
Operating head also depends on the piping infrastructure, drip or sprinkler system will also add
an additional head.
A sample set of 20 farmers was selected representing different soil types, crops, irrigation
methods, water column heights, and distance from source to field, etc. Instantaneous
measurements were taken for 8 farmers and for the rest 12 farmers who were irrigating their
fields, 3 to 4 measurements were taken throughout a day to track variation in the efficiency wrt
head.
In order to understand the complete operating characteristics and efficiencies of existing IPS,
it is important to analyse the case when pumps are operating at low voltages and high static
head in the peak season. Follow up measurements on the same pump sets in Washim and a
similar study in Aurangabad and Buldhana are planned in Rabi and summer season.
The head also depends on the depth of water (or water column height i.e. static head) which
varies with season, as well as the time in the irrigation cycle. This is because, when the farmer

16
begins to irrigate the water level is high, but the level drops at the end of the day due to the fact
that the rate of pumping out is more than the yield of well (inflow of water).
Figure 3: On-field Efficiencies of Ag pump sets (measurements taken on the field in the
month of Feb 2020, Sept/Oct2020 in Washim cluster and Dec 2020 in Aurangabad cluster)
Figure 3 indicates variation in pump set efficiencies wrt total dynamic head for different
irrigation systems (ISI as well as non-ISI rated pump sets). There are 63 measurements taken
on-field in Washim and Aurangabad clusters. Average efficiency is found out to be 19% with
a standard deviation of 11.8.
For heads less than 10 meters, pump efficiencies are found out to be less than 10%. One of the
reasons for this can be very low head value and hence low hydraulic output for the same
electrical input. Less than 30% efficiencies were calculated for surface irrigation methods
except for few farmers who have high frictional heads (due to large distance between source
17
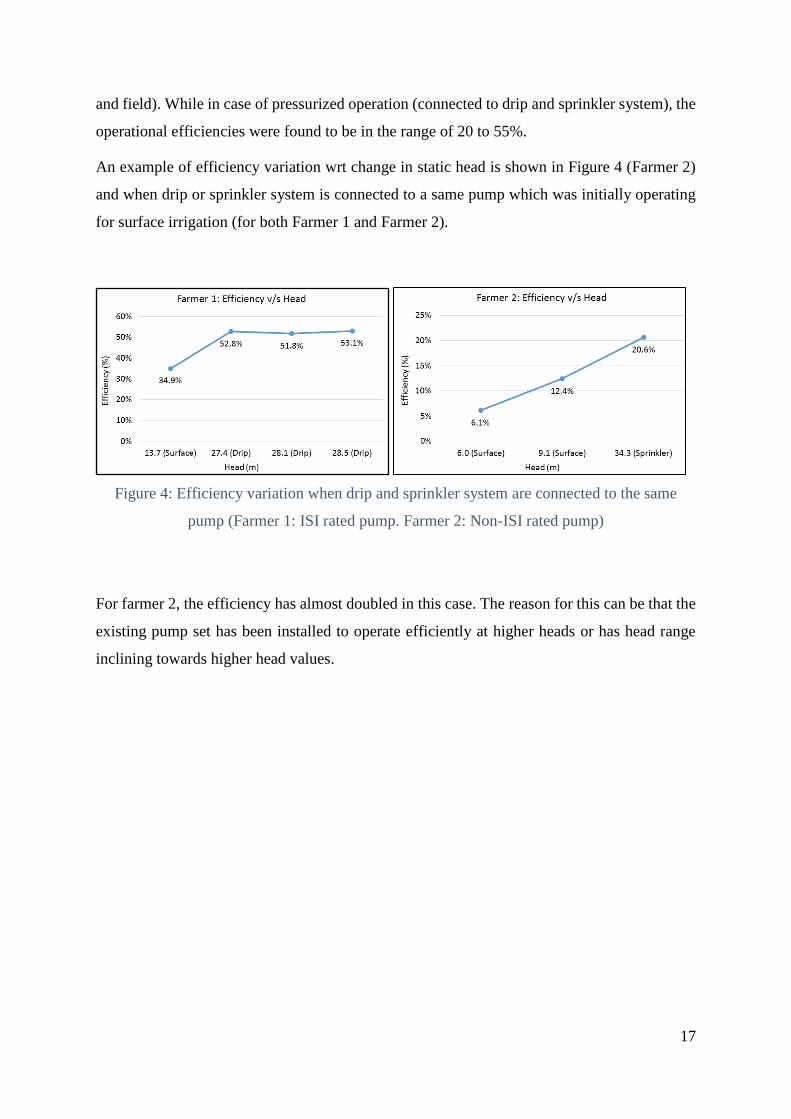
and field). While in case of pressurized operation (connected to drip and sprinkler system), the
operational efficiencies were found to be in the range of 20 to 55%.
An example of efficiency variation wrt change in static head is shown in Figure 4 (Farmer 2)
and when drip or sprinkler system is connected to a same pump which was initially operating
for surface irrigation (for both Farmer 1 and Farmer 2).
Figure 4: Efficiency variation when drip and sprinkler system are connected to the same
pump (Farmer 1: ISI rated pump. Farmer 2: Non-ISI rated pump)
For farmer 2, the efficiency has almost doubled in this case. The reason for this can be that the
existing pump set has been installed to operate efficiently at higher heads or has head range
inclining towards higher head values.

18
2.5.1. Comparison of operational efficiencies with pump characteristics
On-field measured efficiencies of ISI rated pump sets that are subsidized through PoCRA and
otherwise are tabulated in Table 4. (In Aurangabad and Washim village clusters)
Table 4: On-field efficiencies of ISI marked pump sets
Farmer HP
rating
Total
dynamic
head (m)
Flow
rate (m3/
hr)
Electrical input
measured (kW)
Mechanical
output
(kW)
Efficiency
*Farmer
1 3
28 12.6 1.8 0.96 52%
14 18.6 2 0.71 35%
Farmer 2 7.5 40 20 5.3 2.15 41%
38 14 6.3 1.43 27%
Farmer 3 5 39 16.1 5.7 1.71 29%
Farmer 4 5 36 15 5.6 1.48 27%
Farmer 5 5 5 23 5.0 0.34 7%
34 12 5.0 1.11 22%
Farmer 6 7.5 21 19 5.6 1.12 20%
Farmer 7 5 29 12 5.2 0.98 19%
Farmer 8 5 16 19 5.0 0.82 16%
Farmer 9 5 16 19 5.4 0.80 15%
Farmer
10 5 7 16 5.4 0.31 6%
Farmer
11 5 5 14 4.4 0.19 4%
All measurements were recorded on farmers having dug well as a water source because static
head could not be observed for bore wells. All measurements are done on open well
submersible pumps.
*ISI market Mono-block pump set, not subsidized through PoCRA.
The average efficiency is found to be 23% and a standard deviation of 13%, with more than
35% efficiency measured in case of only 2 pump sets. The efficiencies are very low considering
the ISI rated pump sets and even if the operating head is within the rated head range (for
efficiency values of 19 to 29%). For other cases, one of the reasons could be operating a pump
meant for high head application at lower head values. If compared to standards, the efficiencies
are found out to be much lower than defined (35 to 58%) (BIS, 2018).
19
2.5.2. Insights from Garaj, Aurangabad field visit
● 65 pump sets are subsidized through PoCRA in the year 2019-20.
● It was observed that more than 50% of the beneficiaries (farmers) are not using the
pumps purchased through PoCRA (ISI rated) and have kept these pump sets as a back-
up option.
● Almost all of the farmers applied for a higher capacity (5 HP) pump irrespective of the
actual requirement. There are 3 major reasons for this, MSEDCLs tariff structure (same
tariff for 0 to 5 HP load), almost similar actual investments for 3 and 5 HP pump sets,
and lack of awareness about pump selection practices.
● For some of the pump sets subsidized through PoCRA (applicable only for 3 and 5 HP
pump sets), 7.5 HP rating is mentioned on the pump test report, but the bill is given for
5 HP pump set. The pump characteristics as received from the pump vendors and
Agriculture Assistant barely match with the actual measurements.
● Also similar pump test reports and characteristics are maintained/ submitted for
different pump sets. The maintenance of correct pump characteristics and test reports
is a serious issue, and due to this limitation comparison of measured efficiencies with
pump characteristics was not studied.

20
2.6. Case Studies on Pump Selection
In this section, we tried to find out the reasons for efficiency variation and understand the actual
requirements of pump characteristics for a certain field configuration. It is necessary to find
out the characteristics of the existing pump farmers are using, how they are using it, what is
the energy consumption, costs associated with it, and if the farmers have selected an
appropriate pump set.
Table 5 gives a general overview of this exercise with 31 farmers from different agro-climatic
zones. The farmers who have recently purchased a pump through PoCRA and otherwise were
selected randomly. After understanding the cropping pattern, irrigation practices and field
configurations, verification is done if the selected pumps are appropriate or oversized (of higher
capacity than required) for each of these farmers. If a pump is oversized, a best suited pump is
suggested and an estimation of energy and cost savings is done.
From the exercise, 29% pumps (9 out of 31 samples) were found to be oversized. This can lead
to reduction of at least 13% load (~2 kW per pump). 29 out of 31 pumps were not appropriately
selected, and hence would operate inefficiently. Appropriate selection can lead to a 15%
reduction in energy usage.
Table 5: General details of farmers included in the pump selection exercise
Washim
(Umbarda, Yevta,
Manbha, Pilkheda)
Aurangabad
(Garaj)
Osmanabad
(Junoni,
Walgud)
Buldhana
(Dhorapgaon)
No. of
farmers in
exercise
15 6 5 5
Cropping
pattern
Soybean, Cotton,
Legumes, Wheat,
Gram, Orange,
Lemon, vegetables,
Sugarcane
Cotton, Maize,
Ginger, Wheat,
Onion, Gram,
Vegetables,
Sweet Orange
Soybean,
Wheat,
Sorghum,
Onion, Gram,
Vegetables
Cotton, Legumes,
Soybean, Wheat,
Onion, Gram,
Pulses, Sugarcane,
Lemon, Vegetables
Water
sources
Open well,
borewell, irrigation
tank
Open well, bore
well, farm pond
Open well,
borewell,
irrigation tank
Open well, bore
well, Nala
Well
depths 30 to 60 ft. 50 to 70 ft. 30 to 50 ft. 50 to 75 ft.
Irrigation
practice
Mixed
combination of all
3 methods
All 3 types.
More farmers
using Drip
system
All 3 types.
More farmers
using Surface
method.
All 3 types. More
farmers using
Sprinkler system.

21
Figure 5: Results of pump selection exercise
As indicated in Figure 5, 9 oversized pump sets were found out from a sample of 31 farmers.
These include ISI rated (subsidized through PoCRA) and non-ISI rated pump sets as well. The
oversized pump results into more energy consumption than actually needed and thereby
increasing the costs associated with it. Selection of oversized pumps also increases the initial
investment for farmers. And if these pumps are subsidized through PoCRA, unnecessarily more
subsidy for 5 HP pump set (75% of the total bill amount/ claimed amount, maximum subsidy
allowed Rs. 15,000/-) gets sanctioned to a farmer who practically needs a 3 HP pump. (Rs.
5000 to 6000/- difference between the prices of 3 and 5 HP pump sets.)
On the other hand, considering a scenario where there are 20 farmers each sanctioned with 5
HP capacity pumps on 1 Distribution Transformer (DT) of 100 kVA capacity. If 5 of these
farmers have oversized pumps than required or sanctioned, it will increase the load on that DT
and eventually resulting in overloading problems and tripping. Therefore, this increases
challenges on the MSEDCL side too.
Table 6: Example of energy and cost savings if 5 HP (oversized) is replaced with 3 HP pump
5 HP pump 3 HP pump
Initial investment for a farmer (Rs.) 16,500.00 10,000.00
*Energy consumed (kWh/ year) 5,422 3,253
*Energy saved (kWh/ year) 2,169
*Cost saved for farmer (Rs./ year) 6,500.00
*Cost of energy savings (Rs./ year) 8,676.00
Subsidy cost saved (Rs.) 5,000.00 to 6,000.00
Cost saved for MSEDCL (Rs.) Infrastructure cost (average Rs. 1 lakh) goes down
and more connection can be managed
*Energy consumption and cost savings are calculated for 1 acre of land. Detailed calculations
are given in the Appendix II (Table 11 and Table 12).
0
5
10
15
20
Washim Aurangabad Buldhana Osmanabad
Num
ber
of
pum
p s
ets
Results of Pump Selection Exercise
Total configurations
checked
Oversized Pumps found

22
2.6.1. Case Studies:
A detailed exercise was carried out for all 31 farmers checking the appropriateness of existing
pump sets and selecting a best suited pump for given configurations. This is to build on the
understanding from interviews about case to case as well as regional variation in selection of
pumps and to make a comprehensive extension program. This exercise will also help in
building some thumb rules for creating pump selection guidelines as there are a number of
factors to be considered. 6 such case studies are mentioned in this section from a sample of 31
farmers.
Case I: Farmer 1: Umbarda bazar, Washim
Parameters Details
Soil type Clayey loam
Cropping details Crop
Cotton
Tur
Wheat
Gram
Guava
Acres
2
4 and 1.5
3
2
1.5
Irrigation Method
Surface + Sprinkler
Surface + Drip
Surface
Sprinkler
Drip
Water source details Type:
Depth:
Diameter:
Water column change:
Open well
40 ft.
20 ft.
4 to 25 ft.
Pipeline details Material:
Diameter:
Length:
PVC + HDPE
2” and 2.5”
200 to 900 ft.
Irrigation infrastructure
details
Sprinkler:
Drip:
9 nozzles
1.5 X 4 ft. spacing
Existing pump set details Capacity:
Model:
Head range:
Flow rate range:
Overall efficiency:
5 HP
CRI: CSM 46 (ISI rated)
46 to 29 m
8 to 14 lps
40%
Actual characteristics
required for given
configurations
Head range:
Flow rate range:
Pump Capacity:
35 to 15 m
2 to 6 lps
3 HP
Suggested model Silver: M 101
Head range:
Flow rate range:
3 HP
36 to 12 m
2 to 7 lps

23
Based on the field configurations, the operating head range is 35 to 15 m with flow rate
requirement of 2 to 6 lps. But the existing pump set has a best operating head range of 46 to 29
m and 8 to 14 lps, which is very high compared to the actual requirement of the farmer. This is
the typical case of selecting a pump with higher capacity (an oversized pump). As found out
from the in-depth interview with the farmer, two major reasons for selecting the existing pump
are the unreliable supply of electricity, and area under cultivation is more with a mix of
irrigation methods. The pump vendors also support this fact of recommending a higher head
pump keeping in mind the unreliable electricity supply, cropping pattern and water source
details.
The on-field measurements in the month of February 2020, a flow rate of 12 lps was measured
for surface irrigation method at 29 m head with < 30% efficiency. Farmer also said that the
flow rate seems to be very high as it breaks the bunds of furrows or at times.
A 3 HP pump set as suggested will be an appropriate choice in this case.
Case II: Farmer 2: Yevta, Washim
Parameters Details
Soil type Clayey loam
Cropping details Crop
Cotton
Tur
Wheat
Water Melon
Acres
4
2
4
1
Irrigation Method
Surface
Surface
Surface
Drip
Water source details Type:
Depth:
Diameter:
Water column change:
Open well
60 ft.
16 ft.
10 to 40 ft.
Pipeline details Material:
Diameter:
Length:
HDPE
2.5” and 3”
3000 to 4000 ft.
Irrigation infrastructure details Drip: 1.5 ft. X 4 ft. spacing
Existing pump set details Capacity:
Head range:
Flow rate range:
Overall efficiency:
5 HP CRI: CV 1 HD (2 stage)
41 to 24
8 to 13 lps
50%
Actual characteristics required
for given configurations
Head range:
Flow rate range:
Pump Capacity:
41 to 33 m
2 to 6 lps
5 HP

24
This pump set is correctly sized with head range and pump capacity both fitting to the actual
requirements. The required head value is on a higher side majorly due to frictional head as the
water is getting transferred over a distance of 4,000 ft. (~1.2 km) from open well to farm.
However, from the on-field measurements in September-October 2020, it was found that the
flow rate was 4 lps at 39 m head with an overall efficiency of 32%. This might be because the
flow rate measured (4 lps) was beyond the range of pump characteristics (8 to 13 lps). Hence,
low efficiency was obtained even if the operating head is within the recommended range.
Follow-up flow rate and efficiency measurements will be taken for this farmer in different
seasons (Rabi and summer) to check the on ground performance.
Case III: Farmer 3, Garaj, Aurangabad
Parameters Details
Soil type Clayey
Cropping details Crop
Cotton
Maize
Ginger
Wheat
Gram
Acres
6
2
2
1
2
Irrigation Method
Surface
Surface
Drip
Surface
Surface
Water source details Type:
Depth:
Diameter:
Water column change:
Open well
60 ft.
20 ft.
5 to 30 ft.
Pipeline details Material:
Diameter:
Length:
PVC + HDPE
2”
200 to 300 ft.
Irrigation infrastructure details Drip: 1 X 5 ft. spacing
Existing pump set details Capacity:
Model:
Head range:
Flow rate range:
Overall efficiency:
5 HP
HO-82 (ISI rated)
37 to 24 m
8.8 to 14 lps
41.5 to 45.8%
Actual characteristics required
for given configurations
Head range:
Flow rate range:
Pump Capacity:
40 to 16 m
3 to 6 lps
5 HP
3 HP (if pipe dia increased)
Suggested model Silver: M 121
Head range:
Flow rate range:
5 HP
44 to 16 m
4 to 9 lps

25
In this case, for the given configurations, the selected pump set matches in terms of pump
capacity (5 HP), but the operating head range is very small (37 to 24 m). As the farmer is
irrigating most of his crops with surface irrigation method, the total dynamic head in this case
will vary between 16 to 20 m, again out of the existing pumps characteristics. Hence, a pump
set with greater head range as suggested is suitable for this farmer.
Apart from this, the maximum head is when a drip system is connected to the pump. Existing
pipe diameter is 2”, with a frictional head of 5.5 m and additional 25 m head due to the drip
system making it total 40 m head (static + frictional + drip). Flow rate required to cover the
field using drip irrigation is 3.6 lps. This needs more electrical input (>3 kW) which is beyond
the capacity of 3 HP pump, and hence a 5 HP capacity pump is suggested for this farmer.
However, if the pipe diameter is increased to 2.5” only in case of the drip system, the frictional
head gets reduced to 1.8 m and a total dynamic head becomes 36 m with electrical input now
required close to 3 kW at 40% overall efficiency. This will save the energy consumption and
hence the cost associated with it. This will also reduce the initial investment of the farmer (Rs.
6000 to 7000/- cost difference between 3 HP and 5 HP pump sets).
Case IV: Farmer 4, Dhorapgaon, Buldhana
Parameters Details
Soil type Clayey
Cropping details Crop
Cotton
Wheat
Sugarcane
Onion
Potato
Acres
1.5
1.5
1
2
0.6
Irrigation Method
Drip
Surface
Surface
Sprinkler + Drip
Sprinkler
Water source details Type:
Depth:
Diameter:
Water column change:
Open well
78 ft.
18 ft.
10 to 50 ft.
Pipeline details Material:
Diameter:
Length:
PVC
2.5”
100 to 1300 ft.
Irrigation infrastructure
details
Sprinkler:
Drip:
12 nozzles
1 X 4 ft. spacing
Existing pump set details Capacity:
Model:
3 HP
CRI: CSM 45

26
Head range:
Flow rate range:
Overall efficiency:
28 to 19 m
9 to 2 lps
-
Actual characteristics
required for given
configurations
Head range:
Flow rate range:
Pump Capacity:
44 to 16 m
2 to 6 lps
5 HP
Suggested model CRI: CSM-3H
Head range:
Flow rate range:
5 HP
45 to 17 m
2 to 7 lps
This is the only case of undersized pump set. Taking into account the irrigation methods used
for different crops and the distance between water source and field, a 4 HP capacity pump is
required. But, since 4 HP pumps are not easily available in the market, a 5 HP capacity pump
is suggested for this farmer. However, the farmer has installed a 3 HP pump set (CRI: CSM
45, BEE 5 star rated) and is satisfied with the performance.
This particular case needs a more detailed survey and on-field observations to understand the
effect of land slope on pump performance and its ability to provide expected flow rates at
respective heads.
Case V: Farmer 5, Junoni-Walgud, Osmanabad
Parameters Details
Soil type Clayey loam
Cropping details Crop
Soyabean
Jowar
Wheat
Fodder
Drumsticks
Acres
3
3
1
1.5
3
Irrigation Method
Surface
Surface
Surface
Surface
Drip (~1200 trees)
Water source details Type: Percolation tank
Pipeline details Material:
Diameter:
Length:
PVC
2.5”
1000 to 10000 ft.
Irrigation infrastructure
details
Drip: 10 X 10 ft. spacing
Existing pump set details Capacity:
Model:
Head range:
Flow rate range:
5 HP
CRI: CSM 44 (ISI rated)
43 to 11 m
2 to 9 lps
27
Overall efficiency: 40%
Actual characteristics
required for given
configurations
Head range:
Flow rate range:
Pump Capacity:
42 to 16 m
2 to 6 lps
5 HP
The field configurations are within the characteristics of the selected pump set and capacity is
matching correctly. The required head value is on a higher side majorly due to frictional head
as the water is getting transferred over a distance of 10,000 ft. (~3 km) from percolation tank
to the field. This particular pump set is appropriately sized.
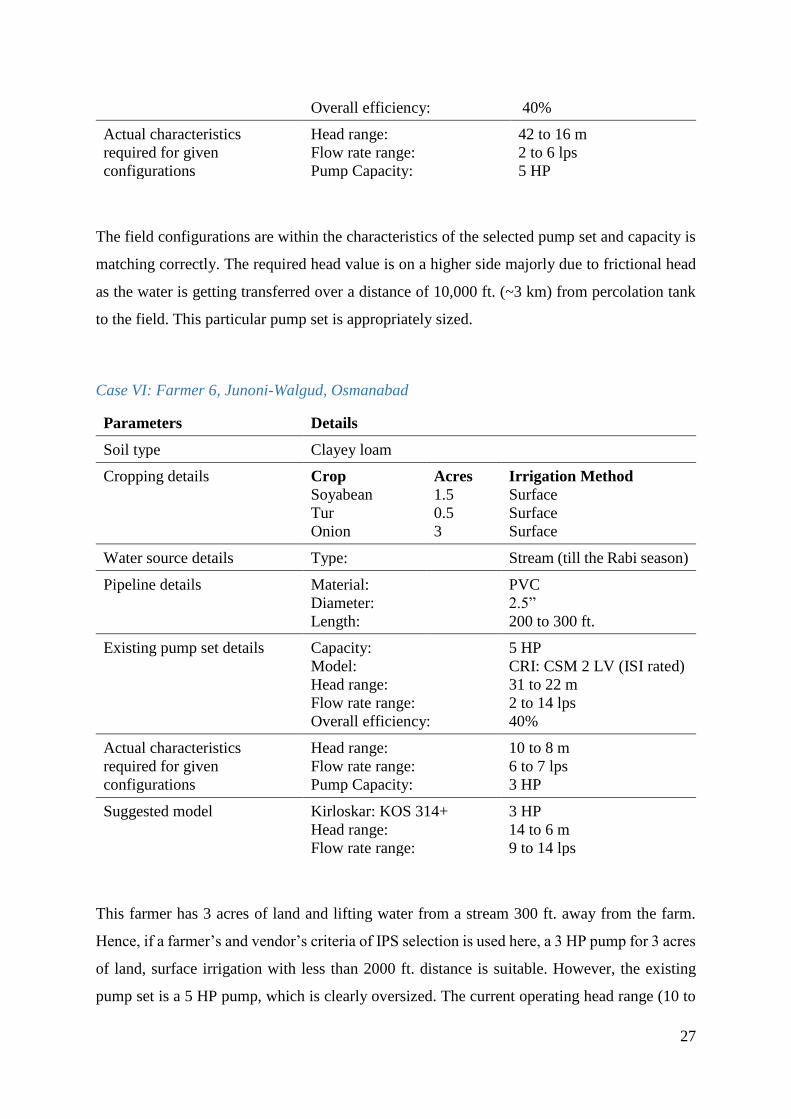
Case VI: Farmer 6, Junoni-Walgud, Osmanabad
Parameters Details
Soil type Clayey loam
Cropping details Crop
Soyabean
Tur
Onion
Acres
1.5
0.5
3
Irrigation Method
Surface
Surface
Surface
Water source details Type: Stream (till the Rabi season)
Pipeline details Material:
Diameter:
Length:
PVC
2.5”
200 to 300 ft.
Existing pump set details Capacity:
Model:
Head range:
Flow rate range:
Overall efficiency:
5 HP
CRI: CSM 2 LV (ISI rated)
31 to 22 m
2 to 14 lps
40%
Actual characteristics
required for given
configurations
Head range:
Flow rate range:
Pump Capacity:
10 to 8 m
6 to 7 lps
3 HP
Suggested model Kirloskar: KOS 314+
Head range:
Flow rate range:
3 HP
14 to 6 m
9 to 14 lps
This farmer has 3 acres of land and lifting water from a stream 300 ft. away from the farm.
Hence, if a farmer’s and vendor’s criteria of IPS selection is used here, a 3 HP pump for 3 acres
of land, surface irrigation with less than 2000 ft. distance is suitable. However, the existing
pump set is a 5 HP pump, which is clearly oversized. The current operating head range (10 to

28
8m) is beyond the pump characteristics (31 to 22m). Hence, performance at these head values
cannot be guaranteed.
However, the 7/12 extract and the PoCRA inspection teams report shows that, this particular
farmer has selected a pump set to be used for an open well. Hence, more follow-up needs to be
taken and an on-field survey is necessary to check if there is any elevation difference between
the stream and the field. Also if the pump is being used for water transfers from stream to well.
2.6.2. Summary of findings
● 29% pumps (9 out of 31 samples) were found to be oversized. Installing correctly sized
pump sets for these configurations can lead to a reduction of at least 13% load (~2 kW
per pump).
● Only 2 out of 31 sample pumps are found to be selected for the correct operating head
range (case II and V) that also matches the pump capacity.
● From the feedback from the farmers, the reasons for selecting higher capacity pumps
as told by farmers are:
o Drip or sprinkler system needs very high pressure heads and farmers want to
operate more number of nozzles at one time
o Due to unreliable supply of electricity: farmers want to ensure high flow rates
whenever there is power supply
o If a farmer needs 3 HP pump, but can get a 5 HP pump from a subsidy with
similar investments of about (Rs. 4000 to 6000/-), a higher capacity pump is
selected.
o Because of MSEDCL’s tariff structure, a minimum load of 5 HP is considered.
(0 to 5 HP, 5 to 7.5 HP, 7.5 to 10 HP).
o 4 HP pump set is found to be suitable for 4 out of 31 farmers. However, pump
sets having capacities other than 3, 5, 7.5 HP are not available in the market.
The reasons for the same need to be analysed further.
● One case of undersized pump (case study IV) was found in Buldhana. For the farmer
the existing 3 HP pump seems to be working fine, but as per the field configurations,
selecting a higher capacity pump is recommended. One of the reasons could be the
existing pump set is a BEE 5 star rated pump. This particular case requires the on-field
survey, as the exact land slope and terrain details are unknown.
29
● Operating head range does not match with the recommended characteristics even if the
pump set HP is appropriate. This results in lowered operational efficiency, and ~10-
15% higher energy consumption than required.
● Pumps that are used for water transfers over long distances are found to be appropriately
selected and fitting the given head range. This is mostly due to high frictional head
value.
● The savings for specific farmers have been calculated in the case studies. But
considering the broader picture of current practices in the state, then a considerable
amount of energy and costs associated with it can be saved at all levels (farmer,
MSEDCL and Government).
● Since pump capacities can be reduced for 25% of the pumps, more number of farmers
can be connected to the grid for a certain cost. Cost of pumps, whether paid for by
government schemes for farmers, goes down.
● Pump set standards can play a crucial role in improving the overall pumping systems
efficiency. The new IS 14220:2018 open well submersible pump set standard states the
parameters to be marked by the manufacturer on the pump set. It includes details about
rated voltage, duty point, overall efficiency, operating head range (BIS, 2018).
However, in addition to this the labelling needs to include variation of flow rate with
head, variation with voltage, operating voltage range instead of stating only the best
operating point. This is because, in a practical scenario, hardly any pump will operate
at the given best operating point. This will also help pump vendors and the farmers to
select a pump which is suitable for the actual on-field configuration.
● There is a wide head range at which the pump operates practically, considering the
variation in irrigation methods and the season of irrigation. A feedback mechanism
between the farmers/ vendors and the pump manufacturers should be there to optimise
this structure of practical requirements.
● Along with defining proper standards and feedback to manufacturers and the
government, increased awareness among farmers will make it easy to improve the
systems performance as the problem of improper selection of pump sets will be taken
care of up to some extent.
● There is no generalized methodology to improve the effectiveness of the overall system.
Different options are available and have been studied in the past for improving the
30
effectiveness from selection of appropriate pump set to replacing the complete system
with more efficient.
● Agriculture demand side management (AgDSM) is one such project that was
implemented on a pilot scale across the country. AgDSM involved two components,
one is the rectification and replacement of pump accessories (pipelines, valves, etc.)
and the other is replacement of the entire pump set. Studies from both approaches
reported about 19 to 34% energy savings and increased energy consumption by 11 to
12% due to increased pump discharge (Khobragade, 2018).
● But, a major problem faced in these AgDSM projects is the problems with power supply
quality and access. The quality of power supply is a critical issue not only affects the
pump selection practices by farmers but also results in inefficiency of IPS. Hence,
energy infrastructure development must be conjointly done.
2.6.3. Way forward
A comprehensive and synchronized approach is needed to highlight and deal with the
challenges at each level. We need to discuss with various stakeholders in the IPS ecosystem to
understand their response to our findings from the field and suggested guidelines.

31
3. Irrigation infrastructure: Water transfer structures
Analysis of water transfer structures is crucial from both energy and water perspectives as it is
further increasing the competition for water and energy resources. Factors documented and
analysed in this study are the reasons for transferring water between two sources, seasonal as
well as regional variation in type and frequency of transfers, crops for which transfers are being
done specifically, and the energy associated with it.
We define water transfers as, when water is not pumped directly from the water source into the
field or it is pumped over the longer distances. There are 3 main types of water transfers as
indicated below:
● Type I: Pumped out of open well or bore well or canal in Kharif (or during a rotation),
and transferred to farm ponds for use in Rabi.
● Type II: Pumped from a borewell into a shallower source such as open well or farm
pond and thereafter pumped into the field, so as to provide a high enough discharge
required for furrow irrigation or to use more nozzles during sprinkler irrigation.
● Type III: Pumping long distances (in km) from a river or dam or irrigation tank into the
field.
For Type II transfers, a detailed analysis has been done which involves identifying the reasons
for looking for more than 1 water source, additional investments in it, their benefits to farmers,
and estimates of energy usage in each of these types of water transfers.
At the end of the section, for Type III water transfers an estimation of energy consumption for
individual lift irrigation method and potential energy savings based on the findings from
previous studies on cooperative lift irrigation schemes are included.

32
3.1. Washim village cluster
There are two major types of water transfers seen in Washim village cluster, borewell to open
well and minor irrigation tank to the fields. The data has been collected from 3 villages,
Umbarda Bazar, Yevta and Manbha as these are connected by the same Ag feeder network.
Type II: Borewell to open well water transfers
General points:
● Open well is used as a storage tank to store the water pumped from borewell. The
average borewell depth is 200 to 500 ft.
● 70 to 80% of the farmers having both borewell and open well, transfer water from
borewell to open well. This water transfer is due to the low flow rate when water is
pumped from the borewell. If borewell is used directly, it takes more time to irrigate
with a surface irrigation method and when connected to drip or sprinkler infrastructure
the desired number nozzles and emitters cannot be used.
● In general large farmers are also likely to have both borewell and open well, and hence
water transfer phenomenon is common with them.
● During the start of the Rabi season, very few cases have been observed where borewell
is directly used as a water source for the first 2 watering. After that, water gets
transferred to the open wells due to low flow rate as the water table goes down further.
Table 7: Disparity in registered and actual on-ground data
Village
Number of borewells Number of open wells
registered in
Talathi office
Feedback from
farmers
registered in
Talathi office
Feedback from
farmers
Umbarda 24 30 to 40 190 > 200
Yevta 40 >100 - -
Manbha 56 >100 412 400 to 450
*Depth of bore wells and open wells was found to be varying from 200 to 500 ft. and 25 to 60
ft. respectively.
33
Reasons for looking for more than 1 water source and water transfers:
● The number of borewells as a source of irrigation are increasing as it saves time as well
as money. Every year an attempt is made by 4 to 5 farmers to dig a borewell. In the last
5 years, the number of borewells have increased 3 fold in these villages.
● There are two important reasons for this, one is to satisfy the crop water requirements
of already sown crops (Wheat, Tur, Turmeric, Sugarcane, etc.). The other reason is to
cultivate more crops and improve the returns. The water transfer starts from the month
of December and lasts until April-May. But, the water availability decreases
(subsequently hours of pumping gets reduced) as we go from December to May.
● Another reason is low yield of open wells and the water is not sufficient. Some of the
open wells were reported to get dried up even in the month of January. (not able to
provide last 1 to 2 watering to Wheat)
● For some percentage of farmers, the piping to the field, or drip /sprinkler infrastructure,
is connected from a main water source (like open well), hence water from other
source(s) is first transferred into the main source and then to the fields.
● Most of the farmers need water for only 3 to 4 months (in Rabi season) to irrigate
Cotton, Tur, and Wheat. And if the open well yield is low, they are not able to satisfy
the crop water needs, hence they attempt to dig a well.
Energy requirement:
● Minimum 5 HP capacity pump has been installed by most farmers.
● Borewell is in operation from November till May for the 4 to 8 hours of electricity
availability. Number of hours of operation vary depending on the crop and the season.
Farmers generally find it convenient for them to transfer water from borewell to open
well during the night time electricity supply.
● According to front-line workers in MSEDCL, water transfers from one source to
another might be 30-40 percent of the load in Karanja sub-division (season not
specified).
● The estimation of energy consumed in water transfers for major crops in the Washim
cluster is given in Table 8. Energy required for each crop is calculated based on the
average irrigation depth, hours of irrigation in different months, volume of water
transferred, total number of irrigations, assuming a 5 HP capacity pump set and 90%
distribution losses.

34
Table 8: Estimation of energy consumption throughout the season for major crops in Washim
village cluster
Crops
Energy Consumption for direct
irrigation (without transfer)
Energy Consumption with
water transfers
kWh/ acre kWh/ unit
volume of water
kWh/
acre
kWh/ unit
volume of water
Soybean (Kharif) 61 0.14 - -
Cotton (Long
Kharif) 184 0.2 278 0.48
Tur (Long
Kharif) 92 0.14 139 0.41
Wheat (Rabi) 367 0.22 1039 0.65
Gram (Rabi) 83 0.24 157 -
Orange (year
round) 673 0.29 1790 1.11
Papaya (year
round) 300 0.29 831 1.11
Table 8 shows the large variation in kWh/ acre of crop sowed. The energy consumed per acre
(kWh/ acre) is found out to be very low in case of Soybean (mostly considered as a rain-fed
crop and irrigation is given only in the dry spells if needed), but for Cotton and Tur (long
Kharif) around 40% increased consumption can be seen (few water transfers are involved for
irrigations done in October to December). From Rabi crops such as Wheat and Gram, the ratio
of energy in water transfers to energy for direct irrigation per acre is about 60%.
In case of kWh/ volume of water used for irrigation, the energy consumed is almost 3 times for
farmers doing water transfers. And in the case of Orange, the energy consumed per unit volume
transferred and used is likely to be higher than 1.1 kWh. The energy used for water transfers
are estimated for horticulture crops and shown in Figure 6.

35
Figure 6: Estimated v/s actual energy consumption (including water transfers)
Investments:
● It takes 4 to 5 months to dig an open well. Cost of digging the open well varies from
Rs. 3 to 6 lakhs depending on the depth of the well, type of soil, etc. This is more time
consuming, requires high investment and planning.
● On the other hand, only a day is needed to dig a borewell and costs at Rs. 90/- per foot.
And additional cost of pipes and electrical cables (Rs. 30,000 to 50,000/-) and (Total
cost less than Rs. 1 to 2 lakhs).
● However, it is highly unreliable that the water is available where the borewell is dug.
One of the farmers reported that 4 out of 5 attempts of borewell were failure events
with each attempt costing between Rs. 20,000 to 30,000 /-.
● But, as mentioned above, most farmers need water only for 3 to 4 months (in Rabi
season). If the bore fails they can dig up another one, but constructing an open well
does not provide this flexibility. This is one of the reasons for the rapid increase of
unaccounted load in the last 10 years. Even if the borewell is not successful at first
attempt, farmers try multiple times at different locations or in the same bore to greater
depths.
36
Type III: Minor irrigation tank to field
● Yevta minor irrigation tank has a water storage capacity of 2.39 million metric cube
and irrigation capacity of 377 hectares. (as per completion report of irrigation
department)
● About 70 to 80 farmers from Umbarda (43) and Yevta (33) (total 76 in year 2019-20)
are currently lifting water from the tank.
● Major crop irrigated by lifting the water from tank in year 2019-20 is Wheat with an
area of 32.9 hectares. (~9% of reported irrigation capacity) (as per Rabi crop report
2019-20, irrigation department)
● Farmers transfer water over a distance of a few meters to more than a kilometre.
● Water is available till the month of February-March. (3 to 4 months of water usage)
● Farmers have to pay water tax for lifting water from the tank. The fees are charged
based on the per hectare land to be irrigated. But, there is no limit on water to be lifted
from the tank. The irrigation department is not able to monitor the water usage by each
farmer as it is a complex, time consuming process.
● While giving permission to lift water from a tank, the irrigation department does not
keep a check on farmers if they have legal electricity connections or not. Also, there
are no guidelines to limit the capacity of pump sets used for lifting water and the
distance to which the water gets transferred.
● Hence, access to water is renewed every year, but the energy availability and access is
taken for granted.
37
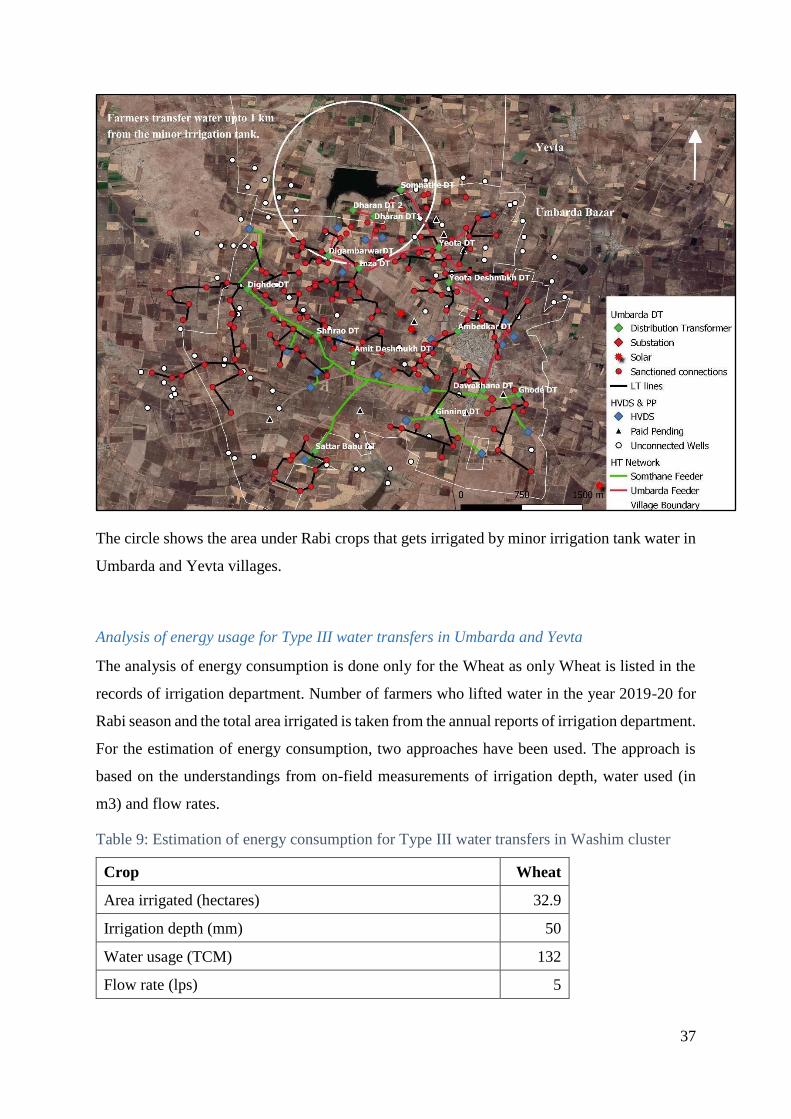
The circle shows the area under Rabi crops that gets irrigated by minor irrigation tank water in
Umbarda and Yevta villages.
Analysis of energy usage for Type III water transfers in Umbarda and Yevta
The analysis of energy consumption is done only for the Wheat as only Wheat is listed in the
records of irrigation department. Number of farmers who lifted water in the year 2019-20 for
Rabi season and the total area irrigated is taken from the annual reports of irrigation department.
For the estimation of energy consumption, two approaches have been used. The approach is
based on the understandings from on-field measurements of irrigation depth, water used (in
m3) and flow rates.
Table 9: Estimation of energy consumption for Type III water transfers in Washim cluster
Crop Wheat
Area irrigated (hectares) 32.9
Irrigation depth (mm) 50
Water usage (TCM) 132
Flow rate (lps) 5
38
Overall efficiency (%) 20
Hours of irrigation 762
Total number of irrigations 8
Energy consumption (MWh) 18
Energy consumption (kWh/ m3) 0.20
Average distance of water transfers is considered to be 1500 ft. (500m)
3.2. Yavatmal village cluster
● Yehala and Kondhai villages have 3 different water sources viz. dam, open well and
borewell. Number of borewells are very less in both villages.
● About 90% of the farmers in Yehala (~200) and 10-15 farmers in Kondhai (total 210 in
year 2019-20) are currently lifting water from the tank lift water from the Adhar Pus
Dam. Average length of water transfer is 2000 ft. but there are few farmers having
pipeline length up to 6000 ft.
● Major crops irrigated by lifting the water from the dam in year 2019-20 are given in
Table 10. (as per Rabi crop report 2019-20, irrigation department). Farmers have started
cultivating crops such as Banana, Sugarcane and Turmeric, but the percentage is very
low (only 3 to 5 hectares area).
● Farmers have to pay water tax for lifting water from the dam. It is charged based on the
per hectare land to be irrigated for different crops. But, there is no limit on water to be
lifted from the tank. The irrigation department is not able to monitor the water usage
by each farmer as it is a complex, time consuming process.
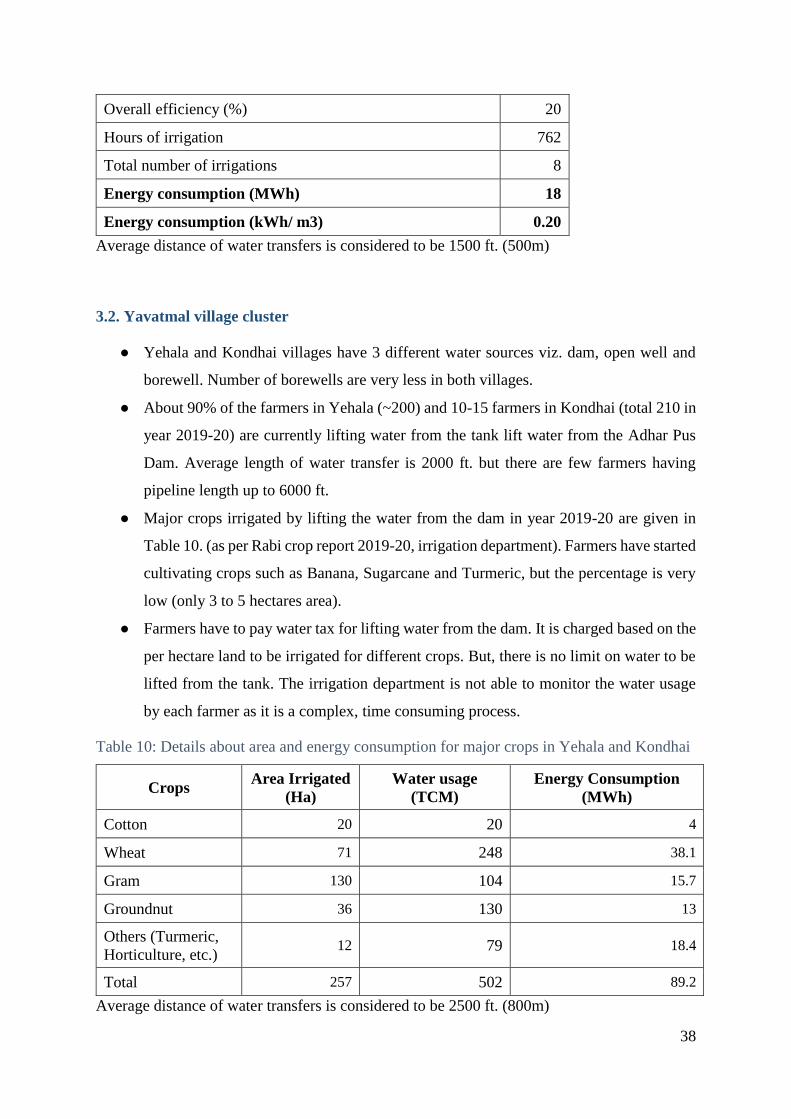
Table 10: Details about area and energy consumption for major crops in Yehala and Kondhai
Crops Area Irrigated
(Ha)
Water usage
(TCM)
Energy Consumption
(MWh)
Cotton 20 20 4
Wheat 71 248 38.1
Gram 130 104 15.7
Groundnut 36 130 13
Others (Turmeric,
Horticulture, etc.) 12 79 18.4
Total 257 502 89.2
Average distance of water transfers is considered to be 2500 ft. (800m)

39
We looked at the data for 7 cooperative lift irrigation schemes for Sugarcane in Kolhapur and
Sangli districts. For 5 of the cooperatives, average energy consumption was 2 kWh/ ha-mm.
For the remaining 2 cooperatives, the consumption wsa 5 kWh/ ha-mm and 6 kWh/ ha-mm
respectively. This was majorly due to the small pipe diameter used for transferring water which
increases the frictional head.
Contrary to this, for individual lift irrigation, we observed that on average the energy
consumption was 3 kWh/ha-mm for the same terrain.
This indicates that at least 30% energy can be saved by implementing a cooperative irrigation
scheme. In the case of Washim and Yavatmal village clusters also (individual lift irrigation),
very high energy consumption has been observed. Hence, it will be worthwhile to do a
feasibility analysis of implementing a cooperative scheme at these locations.

40
3.3. Osmanabad village cluster
● The borewell depth in a Junoni - Walgud village ranges between 200 to 700 ft. and the
average depth of open wells is 40 ft.
● About 60-70% farmers have at least 1 borewell in addition to open well irrespective of
land holding size.
● It is observed that borewell water is mainly used to ensure Rabi crops (as open wells
are on the verge of getting dry in November and have lesser yields) and to support year
round crops.
● Farmers not having open well, have preferred borewell as the capital cost for borewell
is 4 times less than that of digging open well.
● The borewell pumping hours in Rabi season varies between 4 to 8 hours as per
requirement of crops sown (average twice a week). This results in energy consumption
of average 800 kWh per farmer.
● The borewell pumping hours in a summer limits to 2 to 3 hours as availability of water
decreases. This average energy consumption is 230 kWh per farmer.
● One of the farmers took help from Groundwater Survey & Development Agency, GoM
before BW construction. Their investigation showed that water holding capacity of
stratum in a Junoni village is less, hence the stratum cannot store water effectively.

41
4. Estimates of water and energy off-season consumption [H]
The crop water requirements for major crops in the Washim cluster are calculated using the
water balance model. Also, FGDs and in depth interviews were carried out with farmers to
understand their irrigation practices. Based on this, energy consumption for each crop was
estimated. This exercise is important because the estimation will help us understand the on-
ground scenario and identify the reasons for differences between actual versus estimated
consumption. After classifying the focus areas, a more refined model can then be developed,
validated and used to gauge the extent of energy security and access in other parts also.
4.1. Executive Summary
● The estimated energy consumption curve follows the similar trend as that of actual
energy consumption on both Umbarda and Somthane feeders, except for July and
December to January period. Some of the reasons for the difference between actual and
estimated consumption could be assumption that Wheat sowing was done in December
and interrupted supply in peak Rabi months.
● Estimation of energy usage for horticulture crops including water transfers is 972.3
MWh, for Wheat it is 1261.5 MWh and Cotton the energy usage is 1606.3 MWh.
● 40% of the farmers do water transfers from borewell to open well for crops such as
Wheat, Orange and Papaya. Total energy usage for these transfers is estimated to be
435 MWh.
● The area under horticulture in Washim cluster is increasing in the year 2020-21, and
hence the demand for energy is also increasing.
4.2. Details about methodology used for estimation:
● Feeder energy consumption data for Umbarda and Somthana Ag feeder in Karanja Lad,
Washim for year 2019-20 (June 2019 to June 2020).
● Villages: Total 9 villages, Umbarda Bazar., Yevta, Manbha, Pilkheda, Sukali, Dudhora,
Pimpri Warghat, Somthana, and Wadgaon
● Soil type: 90% Clayey, 5% Clay loam and 3% and Gravelly clay loam
● Water sources:
o Open wells: usage throughout the season, storage tank during water transfers
42
o Borewells (November to May): 30 to 40% of the farmers using borewell for
water transfer to open well. Crops: Cotton, Tur, Wheat, Gram, Orange, Papaya,
Lemon
o Yevta irrigation tank (November to till Feb/ March): Water transfer distance
varies from few meters to more than 1 km. Crops: Cotton, Tur, Wheat, Gram
● Cropped area information used as received from Krishi office indicated in Figure 7.
Area under horticulture crops can be seen increased in year 2020-21. Other category
includes Vegetables, Sugarcane, Turmeric, etc.
● Crop water requirement calculations are done based on a point water balance model
that computes the generation of stocks and flow arising from the water cycle.
● Water transfers are taken into account from the month of December and continue till
May in case of Cotton, Tur, Wheat (Figure 8) and Orange, Papaya (Figure 9). No water
transfers are considered for Lemon as there are very few farmers who need to do that
(as per feedback from a sample of farmers growing Lemon, Yevta).
● Pump efficiency varies from 5% in monsoon (for irrigations during dry spell, August-
September) to 30% in January and then further reducing.
● The estimation assumes that 50% cropped area is irrigated by borewells from mid-
December which is a common practice in the region. This is based on the FGDs and
primary surveys conducted in the month of February 2020. However, 2019 and 2020
have been good rainfall years, bore-well usage is likely to have reduced and/ or delayed.
This will be verified in the Rabi season field visit and the estimations will be adjusted
according to that.

43
Figure 7: Cropped area for year 2019-20 (Kharif and Rabi) and for year 2020-21 (Kharif)
4.3. Fortnightly energy consumption for year 2019-20
Figure 8: Crop wise estimated v/s actual energy consumption
Major demand for irrigation and energy consumption is in Rabi season for Cotton, Tur, Wheat,
and other Horticulture crops. Peak energy demand was calculated from December to February
considering the crop water requirement and water transfers, but the actual feeder energy
consumption was observed to be less. One of the reasons could be that actual water usage
differs for farmers based on the water availability in their wells and climatic conditions. Also,
there are farmers who do not irrigate Cotton and Soybean (rainfed). Hence, only 70% of the

44
area under Cotton and Soybean is taken into consideration. This particular assumption will be
verified with the Krishi office and farmers in next field visit.
On the other hand, for summer months the actual feeder energy consumption is seen much
higher than estimated. The exact reason is not known at present, but one of the reasons could
be more than 1 water transfer before actual irrigation. For example, few of the farmers have
more than 1 borewell and transfer water from both borewells to open well. In that the energy
consumption for water transferred will be twice of what has been considered now. The Green
colour boxes represent this additional energy involved in water transfers.
Interrupted supply in peak Rabi months due to DT failures and breakdowns could also be the
reason for the difference between actual and estimated energy consumption especially for
December to January. A small farmer might irrigate the same parcel of land again if he was not
able to irrigate in the first go, however for the medium to large farmers the entire area might
not get irrigated, in spite of using multiple pumps. The difference was also observed at the start
of December (Nov 28 to Dec 12), this is because we have assumed that the Wheat sowing will
start in December, but some farmers also start at the end of November or irrigate their fields
before sowing.
Other than this period, the estimated energy consumption curve follows the similar trend as
that of actual energy consumption on both Umbarda and Somthane feeders.
45
4.4. Summer or Offseason consumption
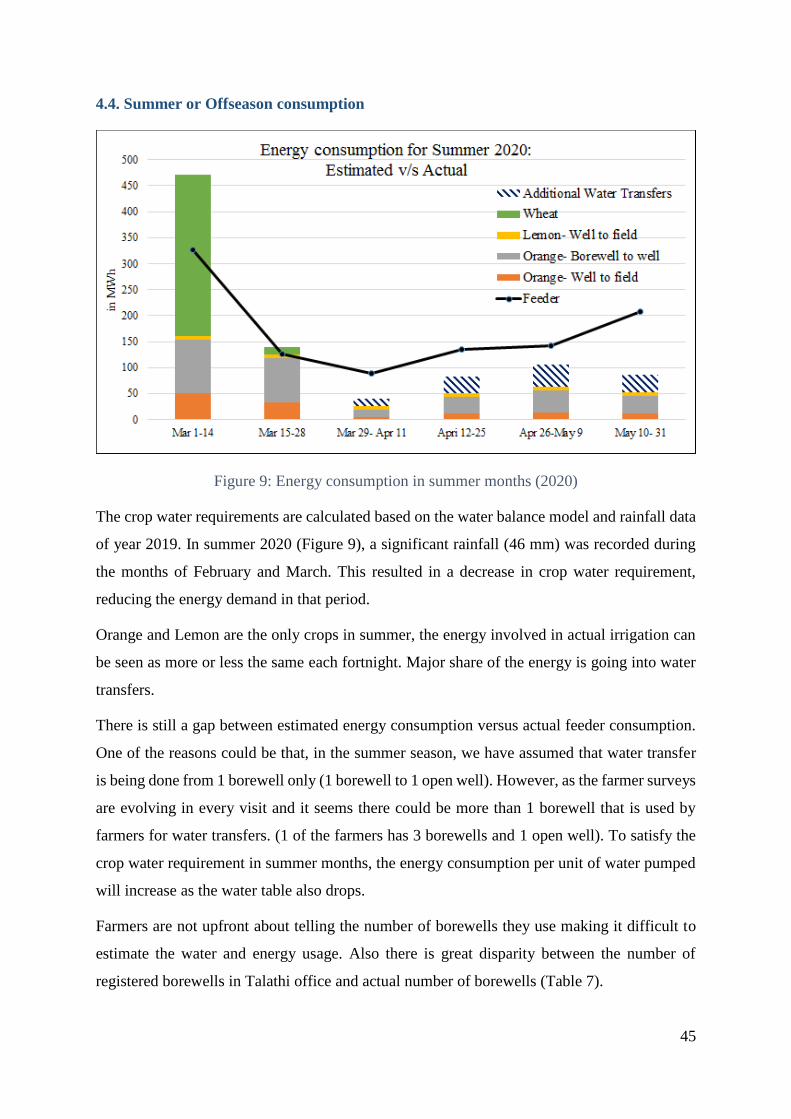
Figure 9: Energy consumption in summer months (2020)
The crop water requirements are calculated based on the water balance model and rainfall data
of year 2019. In summer 2020 (Figure 9), a significant rainfall (46 mm) was recorded during
the months of February and March. This resulted in a decrease in crop water requirement,
reducing the energy demand in that period.
Orange and Lemon are the only crops in summer, the energy involved in actual irrigation can
be seen as more or less the same each fortnight. Major share of the energy is going into water
transfers.
There is still a gap between estimated energy consumption versus actual feeder consumption.
One of the reasons could be that, in the summer season, we have assumed that water transfer
is being done from 1 borewell only (1 borewell to 1 open well). However, as the farmer surveys
are evolving in every visit and it seems there could be more than 1 borewell that is used by
farmers for water transfers. (1 of the farmers has 3 borewells and 1 open well). To satisfy the
crop water requirement in summer months, the energy consumption per unit of water pumped
will increase as the water table also drops.
Farmers are not upfront about telling the number of borewells they use making it difficult to
estimate the water and energy usage. Also there is great disparity between the number of
registered borewells in Talathi office and actual number of borewells (Table 7).

46
To show the consumption that could be possible with these extra borewells, additional water
transfers are calculated and added in summer months (blue hatch) to show if there were 1 more
additional borewell for all farmers, how much consumption it could be.
The aggregation in March first and second week is seen considering the last irrigation for
Wheat for some of the farmers. This particular phenomenon will be verified and the estimation
will be refined after the field visit.
To comment on the actual water usage by farmers’ one round of measurements was done in
Kharif 2020. Following that, investigations will be done in Rabi and Summer 2020 season as
well as the data from installed energy meters will give us a clear picture of water and energy
usage patterns.

47
● Appendix I
Standard protocol for recording measurements:
● General survey: Crop, cropped area, crop spacing, method of irrigation, soil type,
water source dimensions, pipeline details
● Measurements: Voltage, current, power, power factor, head, flow rate, length of
pipelines
Sr
.
N
o.
Pum
p set
type
Ma
ke
Rated Details Measured details
Overall
Efficienc
y (%) Pow
er
Hea
d
Flo
w
rate
Overall
Efficienc
y
Pow
er
Stat
ic
Hea
d
Flo
w
rate
Velocit
y
1
2
3
4
5
*Duty point details of some of the open well submersible pump sets were not available.

48
● Appendix II
Table 11: Detailed calculations for input power required for given configuration
Crop Area
(acre)
Irrigatio
n method
Flow
rate
(lps)
Head
(m)
Irrigati
on
depth
(mm)
Hydraulic
Power
(kW)
Overal
l Effie.
(%)
Input
power
reqd.
(kW)
Cotton 2 Furrow 6 15.2 50 0.8 0.35 2.4
Cotton 2 Sprinkler 3 35.0 6 0.9 0.35 2.4
Tur 4 Furrow 6 19.6 50 1.1 0.35 3.1
Tur 1.5 Drip 2 31.5 20 0.7 0.35 2.0
Wheat 3 Furrow 6 15.4 50 0.8 0.35 2.4
Gram 2 Sprinkler 3 38.0 12 0.9 0.35 2.7
Guava 1.5 Drip 2 35.0 20 0.8 0.35 2.2
Table 12: Calculations for energy usage and savings for configurations in Table 11
Existing pump set: 5 HP Existing pump set: 5 HP
Time reqd. for 1
irrigation (hr)
No. of
irrigations
Energy usage
(kWh/Ac)*
Energy usage
(kWh/Ac)*
20.2 5 253 152
5.4 2 27 16
20.2 3 76 46
14.9 3 149 89
30.4 8 405 243
10.8 2 54 32
14.9 90 4459 2676
Total Units 5422 3253
Energy savings (kWh/ year) 2169
Cost savings (Rs./year) 8,676.00
*HP ~ kW
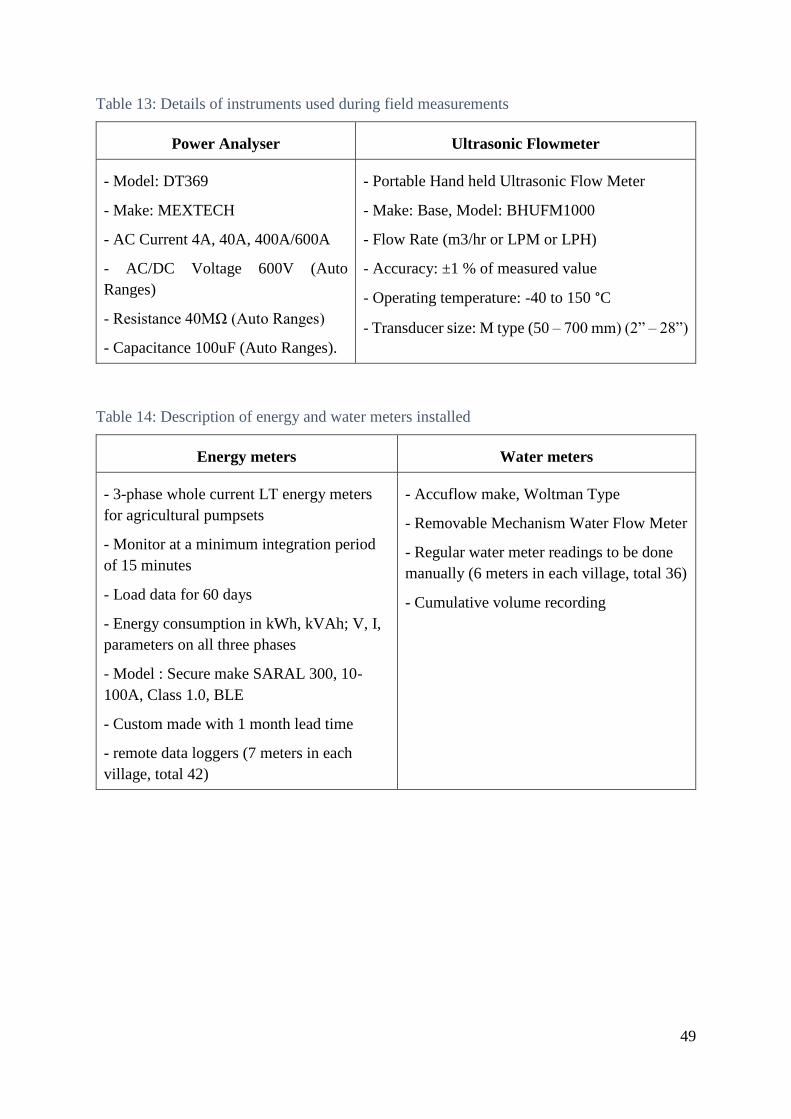
49
Table 13: Details of instruments used during field measurements
Power Analyser Ultrasonic Flowmeter
- Model: DT369
- Make: MEXTECH
- AC Current 4A, 40A, 400A/600A
- AC/DC Voltage 600V (Auto
Ranges)
- Resistance 40MΩ (Auto Ranges)
- Capacitance 100uF (Auto Ranges).
- Portable Hand held Ultrasonic Flow Meter
- Make: Base, Model: BHUFM1000
- Flow Rate (m3/hr or LPM or LPH)
- Accuracy: ±1 % of measured value
- Operating temperature: -40 to 150 °C
- Transducer size: M type (50 – 700 mm) (2” – 28”)
Table 14: Description of energy and water meters installed
Energy meters Water meters
- 3-phase whole current LT energy meters
for agricultural pumpsets
- Monitor at a minimum integration period
of 15 minutes
- Load data for 60 days
- Energy consumption in kWh, kVAh; V, I,
parameters on all three phases
- Model : Secure make SARAL 300, 10-
100A, Class 1.0, BLE
- Custom made with 1 month lead time
- remote data loggers (7 meters in each
village, total 42)
- Accuflow make, Woltman Type
- Removable Mechanism Water Flow Meter
- Regular water meter readings to be done
manually (6 meters in each village, total 36)
- Cumulative volume recording
50
● References
BIS. (2018). Openwell Submersible Pumpset Specification (First Revision) (IS 14220 : 2018).
Bureau of Indian Standards.
Khobragade, S. P. (2018, June). Investigating Agriculture Demand Side Management through
ESCO – (A case study of Solapur Pump replacement Project). Retrieved from Centre
for Technology Alternatives for Rural Areas, CTARA:
(http://www.ctara.iitb.ac.in/en/mtech-project/) (Last accessed on:22/07/2020)
Prayas (Energy Group), Kelkar, M., Chunekar, A., Mulay, S., Doolla, S., & Banerjee, R.
(2018). EVALUATING ENERGY EFFICIENCY PROGRAMMES IN INDIA. Pune,
India: Prayas (Energy Group).
Top Related