


Languages
Pages
Legal

Modern Practices for the Design and Planning of Underground Mines
Rob McGill
Head of Mining
WorleyParsonsTWP
Contents
• Underground Mining Trends
• Mine Life-cycle
• Key Success Factors for Mine Planning and Design
• Mine Planning Process and Tools
• Examples of Outputs
• Expected developments in Underground Mining
• Conclusion

Underground Mining Trends
• Low commodity prices/tight margins • Fewer projects meeting hurdle rates • Access to funding/risk aversion • Deeper underground deposits • Higher opex costs • Safety and regulation • But demand for commodities will be lasting • Increased underground focus
– Mature pits – Environmental pressures
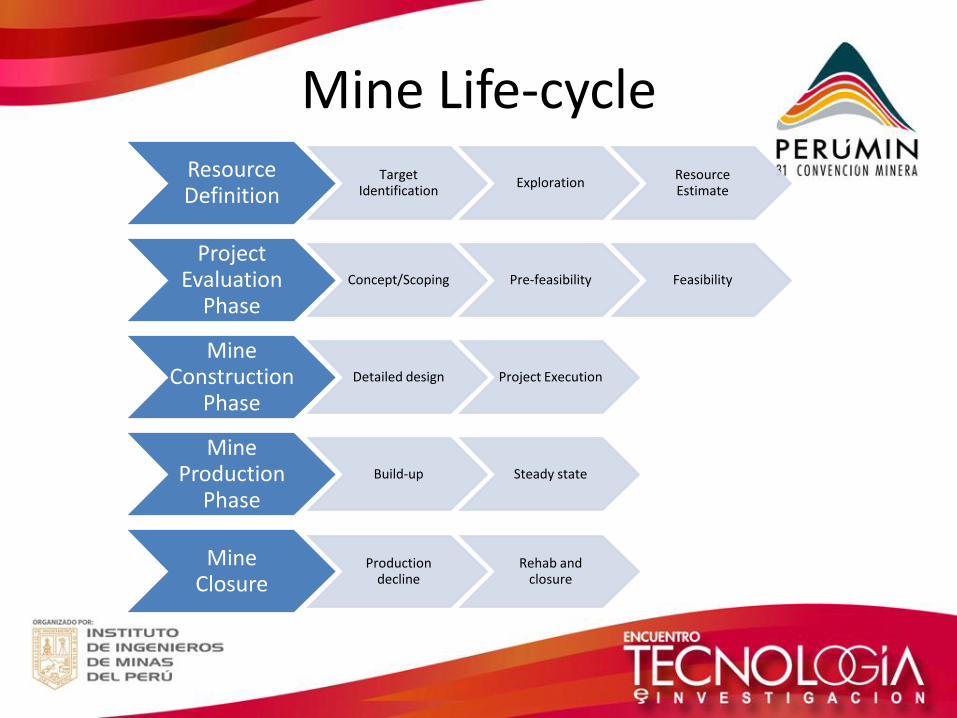
Mine Life-cycle Resource Definition
Target Identification
Exploration Resource Estimate
Project Evaluation
Phase Concept/Scoping Pre-feasibility Feasibility
Mine Construction
Phase Detailed design Project Execution
Mine Production
Phase Build-up Steady state
Mine Closure
Production decline
Rehab and closure

Value Curve
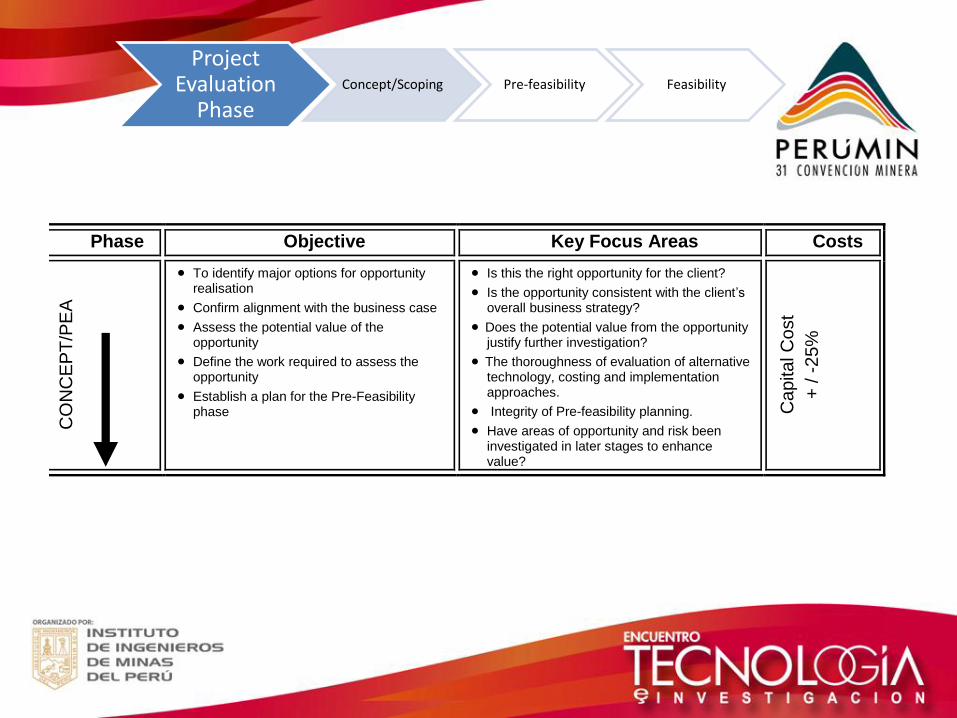
Project Evaluation
Phase Concept/Scoping Pre-feasibility Feasibility
Phase Objective Key Focus Areas Costs
CO
NC
EP
T/P
EA
To identify major options for opportunity realisation
Confirm alignment with the business case
Assess the potential value of the opportunity
Define the work required to assess the opportunity
Establish a plan for the Pre-Feasibility phase
Is this the right opportunity for the client?
Is the opportunity consistent with the client’s overall business strategy?
Does the potential value from the opportunity justify further investigation?
The thoroughness of evaluation of alternative technology, costing and implementation approaches.
Integrity of Pre-feasibility planning.
Have areas of opportunity and risk been investigated in later stages to enhance value?
Capital C
ost
+ /
-25%
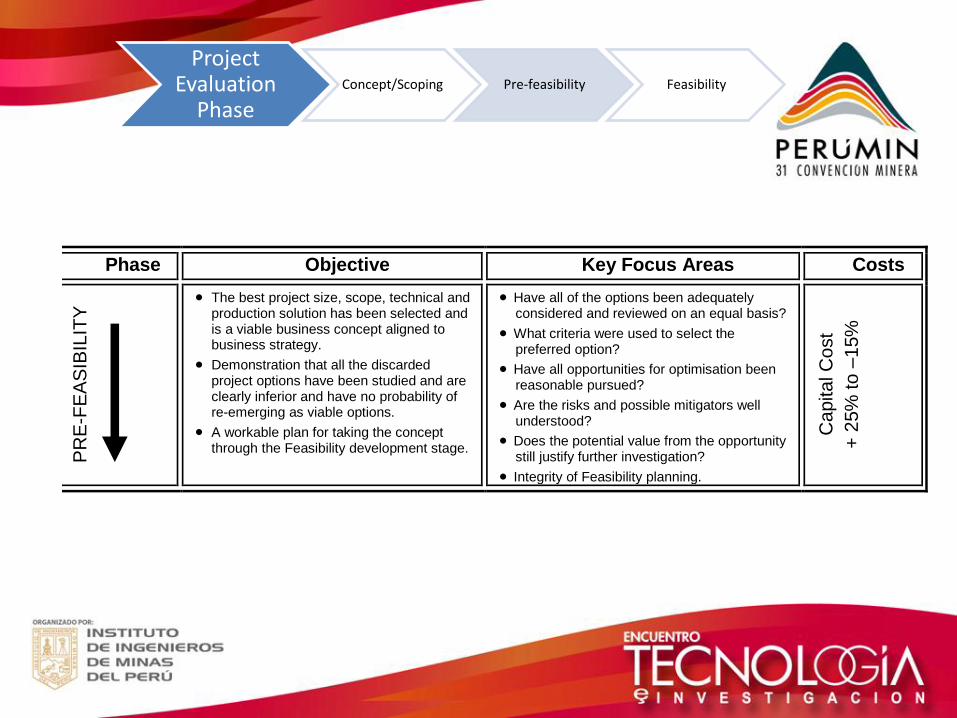
Project Evaluation
Phase Concept/Scoping Pre-feasibility Feasibility
Phase Objective Key Focus Areas Costs
PR
E-F
EA
SIB
ILIT
Y The best project size, scope, technical and
production solution has been selected and is a viable business concept aligned to business strategy.
Demonstration that all the discarded project options have been studied and are clearly inferior and have no probability of re-emerging as viable options.
A workable plan for taking the concept through the Feasibility development stage.
Have all of the options been adequately considered and reviewed on an equal basis?
What criteria were used to select the preferred option?
Have all opportunities for optimisation been reasonable pursued?
Are the risks and possible mitigators well understood?
Does the potential value from the opportunity still justify further investigation?
Integrity of Feasibility planning.
Capital C
ost
+ 2
5%
to –
15%

Project Evaluation
Phase Concept/Scoping Pre-feasibility Feasibility
Phase Objective Key Focus Areas Costs
FE
AS
IBIL
ITY
Develop a Proven Business proposition at the appropriate level of detail and accuracy for implementation funding.
Is there a thorough understanding of the value and risks associated with the opportunity prior to moving into Implementation?
Is there an acceptable risk profile?
Is there a workable plan for taking the Project through the implementation & Operational readiness stages?
Is the opportunity recommended for approval?
Ca
pita
l C
ost
+ 1
5%
to
– 5
%

Typical Project Organogram
Project Manager
Mining
Geologist Geotechnical
Engineer Mining
Engineer
Ventilation Engineer
Mine Planner
Engineering
Discipline Engineers
Drawing Office
Capital Estimator
Project Services
Project Secretary
Project Planner

Key Success Factors for Mine Planning and Design
• Quality/quantity of inputs
• Understanding of value chain and link between inputs and outputs
• Experience and skill – Mining operations and projects
– Planning tools
• Team integration
• Consistency and applicability of design criteria
• Benchmarking/callibration

Mine Planning and Design Inputs
Mine Design
and Planning
Geology
-Block Model
-Geometric and structure model
-Stratigraphic model
Geotech
-Rock Mass ratings
-Empirical design “rules-of-thumb”
Ventilation
- Empirical design “rules-of-thumb”
-Regulatory design criteria
-Mining equipment specifications
Mining Engineering
-Mining method
-Development and stoping rates
-Preferred equipment specs
-Targeted production schedule and volumes
Infrastructure
- Preferred access methodology
-Requirements for services/transport
-Capacities and constrants
Strategic Goals
-Life-of-mine
-Payback Period
-Financial goals

Mining Method Selection
Common Methods
• Block Cave
• Sub-level cave
• Open-stoping
• Sub-level open-stoping
• Cut and fill
• Drift and fill
• Shrinkage
• Bord-and-pillar
• Step bord-and-pillar
• Narrow flat tabular
Design Considerations
• Ore body geometry
• Rock Mass properties
• Required production volumes
• Opex/Capex cost
• Safety/Productivity
• Skills available
• Equipment available
• Grade control

Access Methodologies
• Declines
– Drill and blast
– TBM
• Ramps
• Shafts
– Blind-sink
– Raise-bored
– Bored
• Combinations
• Criteria:
– Depth/Geometry
– Timing
– Bottom Access
– Production Volume
– Cost and capital availablity

Project Construction Time
12
24
36
48
60
72
84
600 800 1000 1200 1400 1600 1800 2000
De
velo
pm
en
t ti
me
in m
on
ths
Depth in metres
Drill and Blast TBM Conventional Shaft Bored Shaft

Advantages of TBM Access Development
Seems obvious Quicker One pass Safer Continuous and reliable
But slow to catch on in mining Hard rock applications and non-isotropic/non-homogenous material High rock stress and fracturing Geometry and size of equipment Lack of hands-on experience Seen as expensive and elegant

Mine Planning Software Tools
• Gemcom –Surpac/Mineshed/Minex
• CAE – 5D Planner / Enhanced Production Scheduler(EPS)
• MINERP – CADSmine / No scheduler (Reporting done in spreadsheets)
• MINERP – MINE2-4D / Enhanced Production Scheduler(EPS)

• 29.486 Moz
• LoM – 43 years (2052)
• Building up to 330 Kt/m
• To produce up to 800,000
ounces/ year (25 tonnes)
DESIGN CRITERIA OVERVIEW

MINERAL RESERVES AND LOM
Main and Vent shaft
Current Mine

MINERAL RESERVES AND LOM
Main and Vent shaft
Current Mine

MINERAL RESERVES AND LOM
Current Mine
Main and Vent shaft

MINERAL RESERVES AND LOM
Main and Vent shaft

MINERAL RESERVES AND LOM
Main and Vent shaft

MINERAL RESERVES AND LOM
Main and Vent shaft
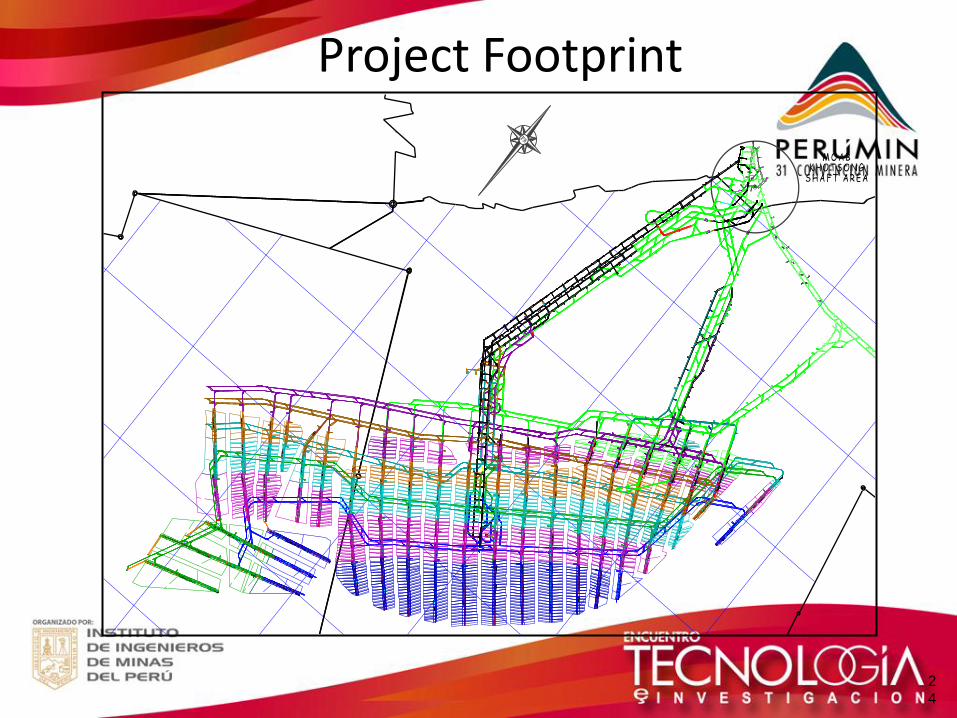
Project Footprint
2
4

-
100,000
200,000
300,000
400,000
500,000
600,000
Go
ld O
un
ces
BP12 Level 1 Phase 2 Phase 3
Production Profile
25

Mine design
Criteria Remarks
Stoping Design Sequential Grid Mining
Method
Mining Levels 113,116,120
ORD development rate 45m/month
Reef development rate 30 m/month
Mining Crews per raise line(
between levels) 5 maximum
Ledging Face Advance 10 m/month (average)
Stope Face Advance 7.2 m/month (average)
Ledging crews(between levels)
Dependant on available raise
lines – with not more than3
crews per raise line
Stope Width 120 cm
Panel Length 25 m to 35 m
MCF(as per BP2013) 60%
Plant recovery factor 97,4%

0
5000
10000
15000
20000
25000
30000
2013 2014 2015 2016 2017 2018 2019 2020 2021 2022
Project Carbon Leader reef monthly tonnes milled
Average – 4500 m2/month Average – 120kg/month
Average – 23000 tonnes month Average – 253m/ month

28
Thickness and Grade Distribution
> 8
6 - 8
4 - 6
2 - 4
< 2
COLOURTHICKNESS
> 8
6 - 8
4 - 6
2 - 4
< 2
COLOURTHICKNESS
20 - 100
15 - 20
10 - 15
8 - 10
6 - 8
4 - 6
2.2 - 4
0 - 2.2
COLOURGRADE
20 - 100
15 - 20
10 - 15
8 - 10
6 - 8
4 - 6
2.2 - 4
0 - 2.2
COLOURGRADE

29
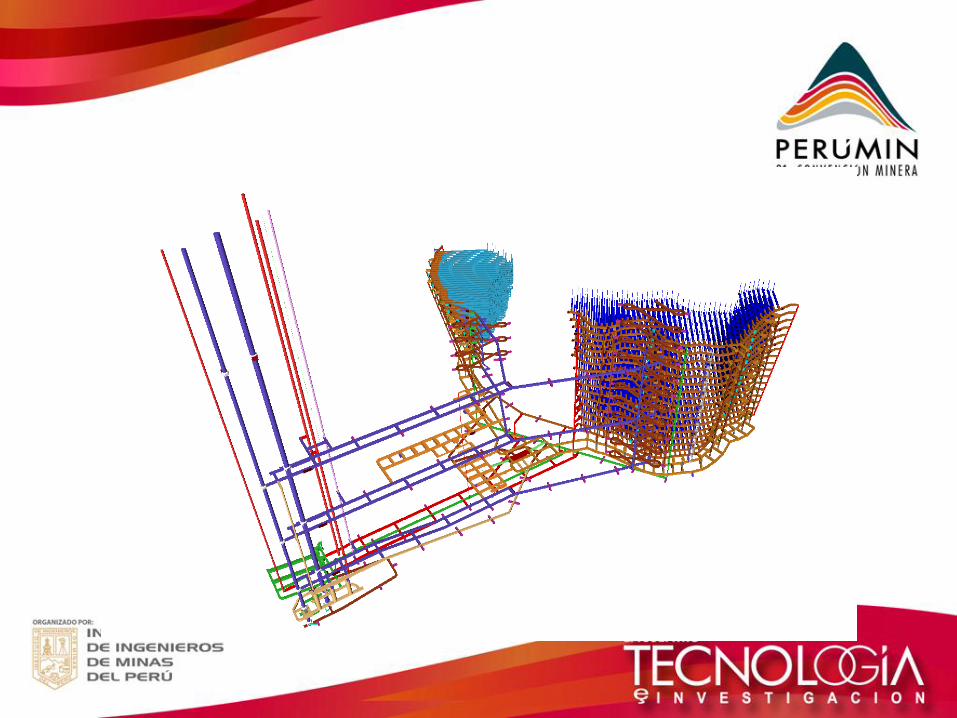
Isometric View of Design Options
Longitudinal Sub Level Open Stoping
Longitudinal Retreat

Existing mining
Existing infrastructure
Different colours represent different months schedule
Animation output

Production Report
Production Report fed from outputs of Enhanced Production Scheduler

Vertical shaft access


Planta en caverna
Chancadoras
Longitudinal Sub Level Stoping / Bench and Fill Stoping

Expected Developments in Underground Mining
• Increased mechanization and automation
• Tunnel and shaft boring
• Environmental/safety pressures
• Margin pressures
• Better quality design and planning
• More standardization in design and planning

Conclusion
• Mine design and planning has become more critical in projects and operations in recent years
• Quality of tools have improved with better computer graphics and processing speeds
• Projects now require full designs and plans using software tools for auditability
• These designs and plans are only as good as the inputs provided and the skills of the engineers and planners. Actual hands-on mining experience is critical in applying the tools correctly

Av. La Encalada N° 1257 Centro Empresarial La Encalada Oficina N° 801 Santiago de Surco Lima 33, Perú Hector Paredes Tarazona Managing Director - Peru [email protected]

Top Related