


Languages
Pages
Legal


Performance Management Systems based on the Balanced Scorecard Framework: The Case of Indonesian
Customs and Excise Organizations
A thesis submitted to the University of Manchester for the degree of
Doctor of Philosophy
in the Faculty of Humanities
2018
Saut Mulia Simbolon
Global Development Institute
School of Environment, Education and Development
2
Table of Contents
Table of Contents ……..……………………………………………………………………………………. 2
List of Appendices …………………………………………………………………………….……………. 8
List of Figures …………………………………………………………………………………………………. 9
List of Tables ……………………………..…………………………………………………………………… 10
Abstract ……………………………………………………….……………………………………………….. 12
Declaration …………………………………………………………………………….……………………… 13
Copyright ……………………………………………………………………………………….……………… 13
Paper presented………………………………………………………………………………….…………. 14
Acknowledgement ………………………………………………………………………………….……… 15
List of Abbreviation ……………………………………………………………………………..………… 16
Chapter 1: Introduction …………………………………………………………………………………. 17
1.1 Introduction……………………………………………………………………………………………… 17
1.2 Background of the research …………………………………………………………………….. 18
1.3 Statement of the problem …………………………………………………………………….…. 22
1.4 Aims of the research ………………………………………………………………………………… 24
1.5 Objectives of the research ……………………………………………………………………….. 24
1.6 Research setting ………………………………………………………………………………………. 24
1.7 Research design ……………………………………………………………………………………….. 25
1.8 Research strategy …………………………………………………………………………………….. 25
1.9 Data analysis …………………………………………………………………………………………….. 26
1.10 Significance of the study …………………………………………………………………………… 26
1.11 Structure of the thesis.…………………………………………………………………………… 28
Chapter 2: Context of the Study ……………………………………………………………………… 31
2.1 Introduction ……………………………………………………………………………………………… 31
2.2 An overview of Indonesia context …………………………………………………………….
2.2.1 Geographical context …………………………………………………………………..
2.2.2 Population ………………….……………………………………………………………….
2.2.3 Economic context…. ……………………………………………………………………..
2.2.4 Governmental system ………………….…………………………………………….
31
31
32
33
34
2.3 The implementation of the BSC in the MoF ………………………………………………. 36
2.4 Context of the study ………………………………………………………………………………….
2.4.1 MSO, Tanjung Priok …………………………………...…………………………………
2.4.2 MSO, Batam …………………………………………………………………….....……….
37
38
39

3
2.4.3 MSO, Soetta ……………………………………………….….……………….……………
2.4.4 CEO, Marunda …………………………………………………………….…………….….
2.4.5 CEO, Jakarta ……………………………………………………………….…………………
2.4.6 CEO, Merak ……….……………………………………………………………….…………
2.4.7 CEO, Tangerang ……………………………………………………………………….…..
2.4.8 CEO, Bekasi ……………………………………………………………….….….………….
2.4.9 CEO, Bogor …………………………………………………………….……….……………
2.4.10 CEO, Cikarang …………………………………………………………….………………..
2.4.11 CEO, Surakarta……………………………………………………………….…………….
2.4.12 CEO, Bandung …………………………………………………………….…………….…
39
40
40
41
41
41
41
42
43
43
43
2.5 Chapter summary …………………………………………………………………………………….. 43
Chapter 3: Exploring the Concept and Practices of the Balanced Scorecard: A
Literature Review …………………………………………….…………………….…….
45
3.1 Introduction ………………………………………………………………….…………………………. 45
3.2 Public sector reform …………………………………………………………………………………. 45
3.3 BSC concept…….………………………………………………………………………………………... 47
3.4 BSC practices ……………………………………………………………………………………………. 61
3.5 BSC in public sector organization ………………………………….………………………….. 68
3.6 The associated effects of using the BSC system ……………………………….……....
3.6.1 Effects on organisational performance …………………………………………
3.6.2 Effects on strategy clarity ……………………………………………………………..
3.6.3 Managerial effects………………………………………………………………………..
3.6.4 Effects on efficiency and effectiveness …………………………………………
76
76
77
78
79
3.7 Research gaps …………………………………………………………………………………………..
3.7.1 Previous research settings ……………………………………………………………
3.7.2 Respondent representativeness …………………………………………………..
3.7.3 Clarity of the BSC implementation level …………………………….………..
3.7.4 Lack of interest in the properties of BSC ………………………………….…..
3.7.5 The effect of organizational attributes on BSC implementation …..
3.7.6 The influence of the BSC as new management model on
employees’ professional behaviors.…………………………………………….
3.7.7 Associated effect of the BSC implementation on OP ……………………
79
80
81
81
82
82
83
84
3.8 Chapter summary …………………………………………………….………………………………. 85
Chapter 4: Research Framework …………………………………………………………………….. 86
4.1 Introduction ……………………………………………………………………………………………… 86
4.2 Research objectives and research questions …………………………………………….. 86
4.3 The research gap and hypotheses construct ……………………………………………. 88

4
4.3.1 BSC implementation: using the principles of the SFO model …………
4.3.2 Organization size and employees’ employees’ role …….……………….
4.3.3 Organisational commitment and public service motivation………….
4.3.4 The relationship between organizational commitment and public
service motivation……………….….……………………………………………………
4.3.5 Demographic correlation with OC and PSM.…………………………………
4.3.6 OP and its relevance with the BSC …………………………………………….…
89
90
92
96
97
98
4.4 Chapter summary ……………………………………………………………………………………. 101
Chapter 5: Research Methodology …………………………………………………………………. 102
5.1 Introduction ……………………………………………………………………………………………… 102
5.2 Philosophical research orientation ……………………………………………………........ 102
5.3 Selection of the research strategy ……………………………………………………………. 107
5.4 Research design of the study …………………………………………………………………….
5.4.1 Reasons for cross sectional research design ………………………………….
5.4.2 Reasons for longitudinal design …………………………………………………….
109
110
110
5.5 Justification of the selection of the unit of analysis….…………….………………… 111
5.6 Sampling technique ……………………….…………………………………………………………. 112
5.7 Sample size ………………….…………..………………………………………………………………. 113
5.8 Research methods for data collection ……………………………………………………….
5.8.1 Questionnaire development ………………………………………………………….
5.8.2 Questionnaire rating scale ……………………………………………………………..
5.8.3 Questionnaire refinement ……………………………………………………………..
5.8.4 Questionnaire distribution and collection ……………………………………..
114
114
115
115
116
5.9 Data analysis techniques ………………………………………………………………………….. 117
5.10 Ethical consideration ………………………………………………………………………………… 119
5.11 Pilot study ………………………………………………………………………………………………… 121
5.12 Chapter summary ……………………………………………………………………………………. 123
Chapter 6: Findings on the Association of Organization Size and Employee
Roles with the Balanced Scorecard .……………………………………………….
129
6.1 Introduction ……………………………………………………………………………………………… 129
6.2 Distribution, collection and response rate of the survey questionnaire ……. 130
6.3 Research question, hypothesis and rationale construction ………………………. 132
6.4 Individual constructs ………………………………………………………………………………… 134

5
6.5 Descriptive statistics ………………………………………………………………………………….
6.5.1 Descriptive statistics of respondents characteristics ………………………
6.5.2 Descriptive statistics of a 7-point Likert scale response …………………
6.5.3 Descriptive statistics of construct variables ……………………………………
6.5.3.1 Strategy translation ………………………………………………………….
6.5.3.2 Strategy alignment …………………………………………………………..
6.5.3.3 Strategy everyone’s everybody job ………………………………….
6.5.3.4 Strategy as a continuous process ……………………………………..
6.5.3.5 Leadership involvement …………………………………………………..
6.5.3.6 Mean ranking score of latent variables ……………………………
135
136
137
139
139
139
140
141
142
143
6.6 Data processing analysis techniques ………………………………………………………… 143
6.7 Data analysis preparation ………………………………………………………………………….
6.7.1 Analysis of sample size …………………………………………………………………..
6.7.2 Analysis of missing data …………………………………………………………………
6.7.3 Analysis of Outliers …………………………………………………………………………
6.7.4 Analysis of normality data distribution …………………………………………..
145
145
146
148
150
6.8 Data analysis ……………………………………………………………………………………………..
6.8.1 Assessment of measurement model validity ………………………………….
6.8.2 Assessment of model reliability ……………………………………………………..
6.8.3 Assessment of the construct validity ……………………………………………..
6.8.4 Assessment of the convergent validity …………………………………………..
6.8.5 Assessment of discriminant validity ……………………………………………….
6.8.6 Assessment of nomological validity ……………………………………………….
6.8.7 Assessment of model fit Indices …………………………………………………….
6.8.7.1 Confirmatory Factor Analysis results …………………………….
6.8.7.2 Modification indices process ………………………………………….
6.8.7.3 Structural equation modelling…...…………………………………..
6.8.7.4 SEM results …………………………………………………………………….
151
154
155
156
157
159
160
161
161
161
166
169
6.9 Hypothesis testing ……………………………………………………………………………………. 170
6.10 Chapter summary ……………………………………………………………………………………. 174
Chapter 7: Findings on the Association of BSC with Organizational commitment
and Public Service Motivation ………….……………………………………………
176
7.1 Introduction ………………………………………………………………………………………………… 176
7.2 Research question, hypothesis and rationale construction …………………………. 177
7.3 Individual construct ……………………………………………………………………………………. 178
7.4 Descriptive statistics of OC and PSM…………………………………………………………….
7.4.1 Descriptive statistics of 7-point Likert scale response …………………….
7.4.2 Mean and standard deviation of OC and PSM across offices ………..
7.4.2.1 Mean and standard deviation of OC and PSM across
employees’ role ………………………………………………………………
179
179
180
181

6
7.4.2.2 Mean and standard deviation of OC and PSM
working ranks ………………………………………………………………….
7.4.2.3 Mean and standard deviation of OC and PSM across
employees ages……………………………………………………………….
7.4.2.4 Mean and standard deviation of OC and PSM across
education levels ……………………………………………………………….
7.4.2.5 Mean and standard deviation of OC and PSM across
working tenures ……………………………………………………………….
7.4.2.6 Mean and standard deviation of OC and PSM across
Gender …………………………………………………………………………….
7.4.3 Descriptive statistics of construct variables …………………………………….
182
183
183
184
185
185
7.4.3.1 Descriptive statistics of OC ………………………………………….…..
7.4.3.2 Descriptive statistics PSM ………………………………………………..
185
186
7.5 Data processing analysis technique ………………………………………………………….. 187
7.6 Data analysis preparation …………………………………………………………………………..
7.6.1 Analysis of missing data …………………………………………………………………
7.6.2 Analysis of outliers …………………………………………………………………………
7.6.3 Analysis of normality of data distribution ……………………………………..
187
188
189
190
7.7 Data analysis ……………………………………………………………………………………………….
7.7.1 Assessment of reliability ………………………………………………………………..
7.7.2 Assessment of factor loading …………………………………………………………
7.7.2.1 OC Factor loadings……. ……………………………………………………….
7.7.2.2 PSM Factor loadings ……...…………………………………………….……..
7.7.3 SEM analysis.……………………………………………………………………….………….
7.7.3.1 Model tested ……………………………………………………………………
7.7.3.2 SEM results ……………………………………………………………...………
191
191
191
191
192
193
193
194
7.8 Hypothesis testing ………………………………………………………………………………………. 196
7.9 Chapter summary ……………………………………………………………………………………….. 199
Chapter 8: Findings on the Relationship between the BSC and Organizational
Performance………………………...…………………………………………………….
201
8.1 Introduction ……………………………………………………………………………………………… 201
8.2 Hypothesis and research questions ………………………………………………………….. 202
8.3 Variables of the research ………………………………………………………………………….
8.3.1 Independent variable ……………………………………………………………………
8.3.2 Dependent variables …………………………………………………………………….
8.3.2.1 The rationale for selecting the dependent variables ………
8.3.2.2 State revenue collection …………………………………………………
8.3.2.3 Customer satisfaction index ……………………………………………
202
203
204
204
206
206
8.4 The BSC cut off years……….................. ……………………………………………………… 207

7
8.5 Data collection …………………………………………………………………………………………. 207
8.6 Descriptive statistic …………………………………………………………………………………..
8.6.1 Descriptive statistic on state revenue collection …………..…………….
8.6.2 Descriptive statistic on customer service index ……….………………….
208
208
213
8.7 Main data analysis …………………………………………………………………………………….
8.7.1 Panel data regression model as analytical tools ……………………………
8.7.1.1 Panel data regression model analysis …………………………….
8.7.1.2 Panel data regression results ………………………………………….
8.7.2 Growth Curve Analysis ……………………….…………………………………………
215
215
216
217
218
8.8 Hypothesis testing ……………………………………………………………………………………. 220
8.9 Chapter summary …………………………………………………………………………………….. 221
Chapter 9: Discussion of Empirical Findings …………….…………………………………….. 223
9.1 Introduction ……………………………………………………………………………………………… 223
9.2 Overview of the research questions, hypotheses and main
findings of the study ………………………………………………………………………………….
224
9.3 Discussion of the Findings ………………………………………………………………………… 229
9.4 Chapter summary ……………………………………………………………………………………. 247
Chapter 10: Conclusion …………………………………………………………………………………. 249
10.1 Introduction ……………………………………………………………………………………………. 249
10.2 General overview of the thesis ………………………………………………………………. 250
10.3 Summary of Main Findings ……………………………………………………………………… 251
10.4 Research contribution …………………………………………………………………………….
10.4.1 Theoretical contribution………………………………………………………………
10.4.2 Contribution to policy and practice ……………………………………………..
258
258
262
10.5 Limitation of the study ……………………………………………………………………………. 265
10.6 Direction for future research …………………………………………………………………. 266
10.7 Personal perspective of my PhD journey ………………………………………………… 268
References …………………………………………………………………………………………………... 270
Appendices ………………………………………………………………………………………………….. 293
Total word count: 74,484 (excluding References and Appendices).

8
List of Appendices
Appendix 1 Compilation of the BSC implementation studies………… 289
Appendix 2 Research setting comparison……………………………………. 330
Appendix 3a Survey questionnaire (Indonesian version) ………………. 336
Appendix 3b Survey questionnaire (English version) ……………………. 346
Appendix 4 Consent form……………………………………………………………. 349
Appendix 5 Participant information sheet……………………………………. 351
Appendix 6 The normality assessment test results………………………. 355
Appendix 7 The kurtosis and skewness test results………………………. 356
Appendix 8 CFA results of BSC implementation in DGCE offices……. 357
Appendix 9 Measurement model estimates and structural model of organisation size, employee’s role and BSC…………….
358
Appendix 10a Initial data distribution of state revenue collection……. 359
Appendix 10b Normalized data distribution state revenue collection 360

9
List of Figures
2.1 Map of Indonesia ………………………………………………………………………… 32
3.1 The BSC links performance measures …………………………………………. 48
3.2 Sample of strategy map ………………………………………………………………. 58
4.1 Proposed model of the study ……………………………………………………… 100
5.1 Questionnaire development flow ……………………………………………….. 114
5.2 Overall research framework and analysis technique ………………….. 119
6.1 Research framework and analysis technique of organization size,
employees’ role and BSC ……………………………………………………………
144
6.2 Initial model of BSC implementation …………………………………………. 153
6.3 BSC implementation, organization size and strategic employees’
role …………………………………………………………………………………………….
168
7.1 The bsc association with PSM and OC ………………………………………… 194
8.1 State revenue collection of the 12 CEOs ………………………………….…. 208
8.2 Customer service index results of the 12 CEOs …….………….………… 213
8.3 Growth curve modelling of customer service index ……………………. 220
10.1 Final relationship of BSC, organisation size, employees’ role, OC,
PSM and OP………………………………………………………………………………….
252

10
List of Tables
3.1 Summary of BSC development ……………………………………………….……………. 55
3.2 Typologies in BSC …………………………………………………………………………………. 66
5.1 The differences in research paradigms …………………………………………………. 104
5.2 The assumptions of positivism and interpretivism ……………………………….. 106
5.3 Fundamental differences between quantitative and qualitative
strategies ………………………………………………………………………………………………
109
5.4 The research questionnaire distribution ………………………………………………. 113
5.5 Distribution of survey questionnaires for piloting study ………………………. 122
5.6 Linkage of research aim, research objective, research questions,
hypotheses, with research methodology, research methods and
respondents …………………………………………………………………………………………
125
6.1 Distribution, collection and response rate of the survey questionnaire... 131
6.2 The link between research question and hypothesis ……………………………. 133
6.3 Descriptive statistics of respondents’ characteristics …………………………… 137
6.4 Summary of 7-point Likert-type scale questionnaires distribution ……….. 138
6.5 Descriptive statistics of strategy translation variable ……………………………. 139
6.6 Descriptive statistics of strategy alignment variable …………………………….. 140
6.7 Descriptive statistics of strategy as a day to day job variable ……………….. 141
6.8 Descriptive statistics of strategy as a continuous process …………………….. 141
6.9 Descriptive statistics of leadership involvement variable …………………….. 142
6.10 Mean rankings score of latent variables ………………………………………………. 143
6.11 Distribution of missing values ………………………………………………………………. 147
6.12 Frequency of variable li4………………………………………………………………………. 149
6.13 Extremes values of variable li4 …………………………………………………………….. 149
6.14 Reliability test for five latent variables …………………………………………………. 156
6.15 Factor analysis of the variables (rotated factor loading) ………………………. 158
6.16 Factor loadings, average variance extracted and reliability estimates ….. 159
6.17 Construct correlation matrix (Standardized) ………………………………………… 160
6.18 Comparison of proposed and modified model …………………………………….. 164
6.19 CFA Measurement model and fit statistics of BSC implementation ….….. 165
6.20 Hypothesis testing ……………………………………………………………………………….. 172
7.1 Research questions and hypothesis …………………………………………………….. 178

11
7.2 Scales answers for all observed variables …………………………………………….. 179
7.3 Mean and standard deviation of OC and PSM across organizations …….. 181
7.4 Mean and standard deviation of OC and PSM across employees’ roles .. 182
7.5 Mean and standard deviation of OC and PSM across working ranks ……. 182
7.6 Mean and standard deviation of OC and PSM across age of employees. 183
7.7 Mean and standard deviation of OC and PSM across education levels ... 184
7.8 Mean and standard deviation of OC and PSM across working tenure …. 184
7.9 Mean and standard deviation of OC and PSM across gender.……………… 185
7.10 Descriptive statistics of OC variables ………………………………………….……….. 186
7.11 Descriptive statistics of PSM variables …………………………………………………. 187
7.12 Distribution of missing values ………………………………………………………………. 188
7.13 Frequency of variable oc9 ……………………………………………………………………. 189
7.14 Outlier identification ……………………………………………………………………………. 190
7.15 Factor analysis of OC (rotated factor loading) ……………………………………... 192
7.16 The factor loadings of PSM (rotated factor loading) …………………………….. 192
7.17 The final of factor analysis of PSM (rotated factor loading) ………………….. 193
7.18 Measurement model estimates and structural model of BSC, OC and
PSM ……………………………………………………………………………………………………..
195
7.19 Hypothesis testing results ……………………………………………………………………. 198
8.1 Research questions and hypothesis ……………………………………………………… 202
8.2 Fixed effect and random effects …………………………………………………………… 218
8.3 Growth curve modelling results ………………………………………………………….. 219
8.4 Hypothesis testing results ……………………………………………………………………. 221
9.1 Hypothesis testing ……………………………………………………………………………….. 224
10.1 Linkages of research aim, research objective, and summary of main
findings ………………………………………………………………………………………………..
252

12
The University of Manchester
Saut Mulia Simbolon
Doctor of Philosophy
Performance Management Systems based on the Balanced Scorecard
Framework: The Case of Indonesian Customs and Excise Organisations
19 May 2018
Abstract
One of the areas that has experienced great changes due to public-sector reform
processes is performance management. Focus on performance management in the
public-sector has experienced changes over time, from the process of monitoring
activities to outcome-based performance management. Many emerging economies have
adopted management systems developed for advanced economies in order to enhance
accountability, transparency, and service quality delivery. However, the practice of
adopting a new management system that has worked well in advanced economies is
largely untested. For instance, though the public-sectors of many countries with emerging
economies are reported to have implemented the balanced scorecard (BSC) concept, very
limited literature has reported its implementation. This study explores the
implementation of the BSC framework as a performance management system (PMS) in
the public-sector in Indonesia. Broadly, this study was designed to cover three major
themes: reviewing the quality of BSC implementation by using the principles of the
strategy-focused organisation (SFO) model, determining the extent to which
organisational factors affect BSC implementation, and lastly, investigating how the BSC
contributes to employee behaviour and relates to organisational performance.
This study adopts quantitative methods by using data from self-administered
questionnaires (n=1,675) and documents related to BSC implementation and
organisational performance (OP). The data were analysed using confirmatory factor
analysis (CFA), structural equation modelling (SEM), panel data regression modelling and
growth curve analysis. We highlight three main findings generated from this study. First,
this study confirms that all five latent variables correlate positively with one other under
the BSC framework. Second, with regard to the organisation factor, we find that the BSC
is likely to be implemented in small public-sector organisations and that employees
holding strategic positions are likely to implement the BSC. Lastly, the study finds that the
BSC has mixed results with public service motivation (PSM) and organisational
commitment (OC) at the employee levels and positive results with OP. The implications of
the study are discussed in relation to the relevance of the BSC approach to public-sector
organisations in Indonesia.

13
DECLARATION No portion of the work referred to in the thesis has been submitted in support of
an application for another degree or qualification of this or any other university of
other institute of learning.
COPYRIGHT
i. The author of this thesis (including any appendices and/or schedules to this
thesis) owns certain copyright or related rights in it (the “Copyright”) and he
has given The University of Manchester certain rights to use such copyright
including for administrative purposes.
ii. Copies of this thesis, either in full or in extracts and whether in hard or
electronic copy, may be made only in accordance with the Copyright,
Designs and Patents Act 1988 (as amended) and regulations issued under it
or, where appropriate, in accordance with licensing agreements which the
University has from time to time. This page must form part of any such
copies made.
iii. The ownership of certain Copyright, patents, designs, trademarks and any
other intellectual property (the “Intellectual Property”) and any
reproductions of copyright works in the thesis, for example graphs and
tables (“Reproductions”) which may be described in this thesis, may not be
owned by the author and may be owned by third parties. Such Intellectual
Property and Reproductions cannot and must not be made available for use
without the prior written permission of the owner (s) of the relevant
Intellectual Property Rights and/or Reproductions.
iv. Further information on the conditions under which disclosure, publication
and commercialisation of this thesis, the Copyright and any Intellectual
Property and/or Reproductions described in it may take place is available in
the University IP Policy (see http://documents.manchester.ac.uk/-
DocuInfo.aspx?DocID=24420), in any relevant Thesis restriction declarations
deposited in the University Library, The University Library’s regulations (see
http://www.library.manchester.ac.uk/about/regulations/) and in The
University’s policy on Presentation of Theses.

14
Papers Presented
1. Simbolon, S.M and Rees, C. (2017). The balanced scorecard approach to
performance management in public sector organizations in emerging
economies: evidence from CEOs in Indonesia. 21st International Research
Society on Public Management Conference, International Research Society
on Public Management (IRSPM). Corvinus University of Budapest, Hungary
on 19th – 22th April 2017;
2. Simbolon, S.M and Rees, C. (2017). Measuring the effect of BSC as
performance management implementation upon OC and PSM: empirical
evidence from Indonesian customs and excise organizations. Management
Accounting Research Group Conference in Association with the Management
Control Association. Aston Business School, Birmingham, United Kingdom on
23th – 24th November 2017.

15
Acknowledgements
First, I would like to praise God Almighty for His grace and blessings, which have given me
the strength to step toward completion of my thesis. His unconditional love has enabled
to accomplish something that seemed impossible.
I would like to take this good opportunity to express my deepest appreciation to my first
supervisor, Dr Chris Rees, whose guidance, patience and feedback have significantly
contributed to the completion of my PhD journey. It has been a wonderful experience to
work under his supervision, for he always finds stimulating ways to help me develop my
ideas and finish this thesis. I feel so fortunate to have him as my supervisor. I also thank
my second supervisor, Dr Aminu Mamman, whose advice and encouragement has helped
me to complete this long journey. I am greatly thankful to the Indonesia Endowment Fund
Body (LPDP) for sponsoring my PhD study. I would like to thank Prof Takashi Fukushima,
Oentarto Wibowo and Elly Safrida for giving me references to pursue this PhD journey.
Special appreciation also goes to Asri Maharani and Devi Femina for their endless support
and encouragement from the very first stage of this PhD journey. I also express my thanks
to my PhD colleagues Sunny, Asma, Antony, Osama and Ola for their friendship. My very
special gratitude and appreciation go to Amari Barash for her passionate help with my
thesis.
To the Executive Secretary of Indonesian Customs and Excise, the heads of all twelve
responding organisations (Tanjung Priok, Batam, Soetta, Merak, Tangerang, Marunda,
Jakarta, Bogor, Bekasi, Cikarang, Purwakarta and Bandung) and to all of the research
participants for giving me the access that allowed me to conduct my research, especially
during the fieldwork period: thank you very much. I also express my gratitude to the
performance managers of each of the twelve respondent organisations, as well as to my
colleagues Amri Hidayat and Wachid, who helped me collect the data needed for this
research.
Finally, my greatest appreciation goes to my beloved family: to my wife, who has
supported me with her prayers, love, understanding, and sacrifice, I can simply say that
this PhD journey could not have been undertaken without you. To my children: your
smiles and laughter have always cheered me as I faced hard times during this PhD journey.
I dedicate this thesis to my wife, Thre, and to my three children, Jo, Jeth and Joanna.

16
List of Abbreviations
AVE Average Variance Extracted
BSC Balanced Scorecard
CEO Customs and Excise Office
CFA Confirmatory Factor Analysis
CFI Comparative Fit Index
DGCE Directorate General of Customs and Excise
ICEA Indonesian Customs and Excise Administration
MoF Ministry of Finance
MSO Main Service Office
OC Organization Commitment
OP Organizational Performance
PMS Performance Management System
PSM Public Service Motivation
RMSEA Root Mean Square of Error of Approximation
SEM Structural Equation Modelling
SFO Strategy Focused Organization
SRMR Standardized Root Mean Residual
TLI Tucker Lewis Index
UNDP United Nations Development Program
WB World Bank

17
Chapter 1: Introduction
1.1 Introduction
This first chapter aims at giving an overall picture of what this thesis is about. It
begins with the explanation of the research background, which briefly discusses
performance management as one aspect of public-sector reform. This chapter also
identifies the research problem, which takes place in the context of the Ministry
of Finance (MoF) of Indonesia. This chapter states the research aim and research
objectives, as well as the research setting. In terms of the research design, this
research employs a cross-sectional design and a longitudinal design. The cross-
sectional design was conducted using survey questionnaires, which were
distributed to the participants from twelve customs and excise organisations
across four provinces in Indonesia. Meanwhile, the longitudinal design relates to
the organisational performance (OP) data, which cover eight years of state
revenue collection and four years of customer satisfaction index results.
This chapter starts with the introduction, which is followed by the background of
the research, briefly describing the public-sector reform, performance
management and the BSC concept. Subsequently, the statement of the problem
is underpinned with an explanation of the conditions before the commencement
of this study. The next sections present the aim and objective of the research. This
chapter then introduces the research setting, followed by the research design and
research strategy. The following section discusses data analysis and provides
information regarding the types of analytical tools that are used in this thesis. The
significance of the study is then explained, offering ideas as to the significant
contributions that this study may make. The final section of this chapter reveals
the structure of the thesis and provides the highlights of each of its ten chapters
as a guide to the contents of this thesis.

18
1.2 Background of the research
Public expectation of the services provided by the government increases over
time. This situation occurs in almost every country in the world. Therefore,
government institutions around the world continuously improve their
performance. With the dynamic challenges of globalization and increasing
demand for and expectations of services, each government must continuously
improve its ability to reach better effectivity and efficiency so that fulfilment of
national targets to better society can be achieved. Tanzi (2000) stated that “an
efficient public-sector should be able to achieve the state's objectives with a
minimum degree of distortion of the market, the lowest possible burden of
taxation on the taxpayers, the fewest possible public employees and the lowest
possible absorption of economic resources by the public-sector. The public-sector
must be transparent in its processes and transparent in its outcomes”. According
to the World Bank (WB) (2008), “effectiveness and efficiency of a country's public-
sector is vital to the success of development activities, sound financial
management, an efficient civil service and administrative policy, efficient and fair
collection of taxes, and transparent operations. When these are relatively free of
corruption, they all contribute to good delivery of public services”. Two previous
elaborations by the WB (2008) and Tanzi (2000) indicate relatively similar aspects:
that the public-sector should apply the principles of transparency and
accountability in its efforts to serve the public’s needs. It is, therefore, inevitable
that the public demands improvement by means of reform of the public-sector.
Regarding a reform agenda, Pollit and Bouckaert (2004, p. 18) have stated that
over the last two decades, in many countries, almost every public-sector
organisation has been influenced to some extent by reforms. Similarly, Pal and
Ireland (2009) have pointed out that public-sector reform has become a routine
agenda of public policy in both developed and developing countries. However, in
terms of reform focus, the challenges faced by developed and developing
countries may differ in some respects such as the social, economic, political, legal
and cultural contexts (Chittoo et al. 2009). Existing conditions, however, do not

19
impede the enthusiasm of countries with emerging economies for the adoption of
good governance characteristics. According to the United Nations Development
Program (UNDP 1997), these characteristics include participation, rule of law,
transparency, responsiveness, consensus orientation, equity, effectiveness and
efficiency, accountability and strategic vision.
One of the areas that has experienced great changes due to the process of public
management reform is performance management. Public-sector organisations’
focuses regarding reform strategies have experienced changes over time, from the
controlling of process activities to a much broader perspective known as outcome-
based performance management. With regards to this issue, van Thiel and Leeuw
(2002) note that results-based management is popular at all levels of public
institutions: local, regional, national and supranational. Public-sector
organisations are now making greater efforts to determine and assess their
performance (van Thiel and Leeuw 2002; Pollitt and Bouckaert 2004). According
to Weibel et al. (2009), public-sector reforms are marked by the adoption of
management practices that were initially developed for the private sector, for
instance, budgeting techniques, market analysis and performance management.
However, it must be considered that implementing such business-like
management principles is not an easy task due to the attributive differences
between private sector and public-sector; inevitably, then, some adjustments are
required (Greatbanks and Tapp 2007).
Verbeeten (2008) points out that most Western countries have endorsed several
initiatives to encourage adoption of performance management practices in public-
sector administrations including central government, local governments and other
public-sector organisations such as hospitals, educational institutions, and police
forces. Furthermore, Verbeeten summarizes the four purposes of adopting
performance management as follows: firstly, the definition of clear missions,
objectives and targets helps each employee understand what the organisation

20
wants and provides focus in operations. Secondly, by measuring performance
regarding the objectives and targets, politicians and public managers should be
able to tell the public for what purposes their money is being used
(transparency/accountability purpose). Thirdly, public-sector organisations may
use performance measurement to learn and to improve performance (learning
purpose). The transparency created by measuring performance may indicate
where the organisation excels and where improvements are necessary. Fourthly,
performance measurement systems may provide the basis for compensation of
public government officials (appraising purpose). A careful specification and
monitoring of performance, along with a set of incentives and sanctions, can be
used to ensure that public-sector managers continue to act in society’s interest.
This elaboration of performance management succeeds in combining benefits
both inside and outside an organisation; however, it would be more
comprehensive if it were also to support a clear explanation of the link between
performance management and other fields of management such as talent pool
management, remuneration, and other potentially related issues.
Likewise, Heinrich (2002) posited that a requirement for outcomes-based
performance management is the increasing of performance evaluation activities
at all government levels. Heinrich states that the use of performance management
techniques and tools has been growing in sophistication. As explained by Kaplan
(2009), the measurement of OP has also experienced developments; many
systems have been introduced, such as General Electric Metric, Management by
Objectives, Just in Time, Malcolm Baldrige and BSC. Among other concepts, BSC is
undeniably one of the most influential innovations contributing to the
transformation of contemporary management accounting discourse and practice
since its emergence in the early 1990s (Modell 2012). Since its introduction by
Kaplan and Norton (1992), the adoption of BSC has spread widely throughout
developed and developing countries and in both the private and public-sectors.
Initially known as a performance measurement system, the BSC concept has

21
experienced massive evolution to become an integrated PMS that manages to link
the strategies and objectives of the organisation and individuals.
Since its introduction by Kaplan and Norton (1992) and following its evolution to
a new comprehensive management system, as explained in a series of subsequent
studies by the authors (Kaplan and Norton 1993, 1996a, 1996b, 1996c, 2000,
2001a, 2001b, 2001c, 2004a, 2004b, 2006a, 2006b), there has been extensive
research into the implementation of the BSC in the private and public-sectors of
developed countries. Despite the fact that implementation of the BSC in public-
sector organisations has faced many challenges, many public-sector organisations
adopt the BSC as their PMS (Griffiths 2003; Chan 2004; Greatbanks and Tapp 2007;
Greiling 2010; Nilsson 2010; Northcott and Taulapapa 2012; Dreveton 2013).
The present study focuses on the implementation of BSC in the public-sector of a
developing country, specifically the MoF of Indonesia, which has implemented the
BSC approach as its PMS. The implementation of the BSC as the PMS in the MoF is
part of a public-sector reform strategy to enhance performance, service quality
delivery and public trust (three pillars of bureaucratic reform 2007). Moreover, the
MoF has become a model of public-sector reform for other ministries and
government agencies. Many ministries and government agencies are duplicating
the MoF’s implementation of the BSC system in their own organisations. One of
the bureaucratic reform programs that has been transferred to other ministries
and other government agencies is the implementation of BSC.
The BSC was introduced to replace the performance appraisal system with a PMS.
Before implementing the BSC in 2009, the Indonesian Directorate General of
Customs and Excise (DGCE) had already applied a performance appraisal system,
the so-called “DP3” (list of job implementation assessments), based on
Government of Indonesia Rule PP 10 (1979). In the DP3 system, employee
performance was measured by the direct supervisor, focusing on eight elements

22
to be assessed: loyalty, work performance, responsibility, obedience, honesty,
cooperation, initiative, and leadership. Meanwhile, organisation performance was
measured using the Laporan Kinerja Instansi Pemerintah (Performance
Accountability Report of Government Agencies) (LAKIP) form. Performance
appraisals for both employees and the organisation as a whole were conducted
once annually, at the beginning of January of the new fiscal year. Several strategic
changes from the employee perspective have taken place; for instance,
performance indicators are aligned with the organisational objectives, a
performance dialogue system has become available, a three-month review system
has been instituted, and incentive-based performance has been introduced.
Meanwhile, from the organisational perspective, the changes include: the use of
a strategy map as a template to place all strategic objectives together with the key
performance indicators (KPIs) and organisational targets within one fiscal year, the
cascading of strategy and KPIs to employees, and the initiation of monthly
performance review meetings led by the organisational head. Thus, the BSC
concept has brought massive changes in the way organisational and individual
performance is measured. The study of the BSC implementation in the DGCE
offices may generate findings that could serve as lessons learned for the DGCE and
other relevant public-sector organisational settings.
1.3 Statement of the problem
Performance management based on the BSC system has been widely
implemented in Indonesia’s MoF. Application of the BSC system began in 2008 at
the ministerial level as part of the bureaucratic reform program and was then
extended to lower levels, reaching the staff level at 2011. Since 2011, then, the
traditional individual performance system has been replaced by the BSC system.
This new PMS has had an effect on both the organisation and the employees; there
have been critical changes for the employees and the organisation alike. For
instance, employee performance is now measured based on strategic objectives,
which are directly or indirectly related to the organisational strategic objectives;
in addition, the organisation and employees are being assessed in real time.

23
Despite the massive implementation of the BSC within the MoF, it is still unknown
exactly how the implementation of the BSC framework affects the employees and
the organisation. The assessment of performance management based on the BSC
in public-sector organisations can be viewed from at least four aspects. The first
of these is whether the public-sector organisation is applying the BSC effectively.
This is to check whether the practice of the BSC within the organisation has
followed the strategy focused organisation (SFO) principles as stated by its authors
(Kaplan and Norton 2001c). The second point to examine is the extent to which
organisational factors such as organisation size and employee’s roles are
associated with the BSC. The Indonesian Directorate General of Customs and
Excise encompasses organisations of various sizes (large and small), a factor that
might influence the BSC. Third, it is important to know how the BSC might affect
employees’ professional behaviour, an element on which this study focuses in
terms of two subjects, organisational commitment (OC) and public service
motivation (PSM). Fourth, apart from exploring its effect on employees, the
conducting of a holistic research on BSC implementation requires an examination
of how the BSC may affect the OP; this is because the nature of the BSC helps the
organisation to stay focused on its strategic objectives. Thus, the current study
provides an opportunity to seek investigate the four abovementioned aspects.
24
1.4 Aim of the research
The main aim of this research is to explore the implementation of balanced
scorecard as a performance management system within public-sector
organisations in Indonesia with a view to clarifying the nature of balanced
scorecard practices and their relationship to organisational factors, organisational
performance and employee behaviour.
1.5 Objectives of the research
Given its main aim as stated above, the present study intends to achieve the
following objectives:
i. Explore the theoretical perspectives of balanced scorecard in order to identify
the key success factors of balanced scorecard implementation;
ii. Review balanced scorecard practices in order to clarify organisational factors
that affect the balanced scorecard as well as the ways in which the balanced
scorecard implementation affect employee behaviour and organisational
performance;
iii. Develop a conceptual framework of balanced scorecard implementation in
the public-sector organisation to describe the relationship between
organisational factors and the balanced scorecard and define the ways in
which its implementation contributes to employee behaviour and
organisational performance; and
iv. Test and examine the conceptual framework in order to discover the extent
to which organisational factors influence the implementation of the balanced
scorecard and the extent to which balanced scorecard implementation relates
to employee behaviour and organisational performance within the public-
sector organisational context.

25
1.6 Research setting
This study took samples from the Directorate General of Customs and Excise
(DGCSE) under the MoF of Indonesia. The sample includes twelve offices (three
large and nine small organisations) from four provinces in Indonesia: Kepulauan
Riau, Banten, DKI Jakarta and Jawa Barat (West Java). These were selected to
represent 120 customs and excise service offices across the nation. The
justification for the selection is presented in Chapter 5 (Research and
Methodology).
1.7 Research design
According to Bryman’s (2015) classification of research design, this study applies a
cross-sectional and longitudinal design. The design is cross-sectional in that the
study examines the correlation between BSC implementation and organisational
commitment and public service motivation within the twelve public-sector
organisations using research questionnaires. The research questionnaires were
circulated once, during the fieldwork period, to 1,969 employees at the twelve
respondent organisations. In addition, the current study investigates the
association of the BSC with organisational performance through the use of
longitudinal data. The organisational performance data used are state revenue
contribution documents (2009 to 2016) and customer satisfaction indices (2013 to
2016).
1.8 Research strategy
This study was carried out using a quantitative strategy. There are two reasons for
choosing a quantitative strategy for this research. First, the current study
implements a quantitative study because it uses a deductive approach to test the
theory or concept of the BSC, SFO principles, OC and PSM (Bryman 2015). Second,
the paradigm orientation of this study (positivism) corresponds to a quantitative
strategy (see Collis and Hussey 2014, p. 46).
26
1.9 Data analysis
Based on the characteristics of the analysis, the present study employs four
analytical techniques and tools:
- Confirmatory factor analysis (CFA): to evaluate the implementation of the BSC
based on the SFO principles;
- Structural equation modelling (SEM): to examine the influence of organisation
size and strategic employees’ roles on the BSC, as well as the association of the
BSC with OC and PSM.
- Panel data regression analysis: to examine the associated effect of BSC
implementation on OP using eight years’ worth of data on state revenue
collection;
- Growth curve analysis: to examine the trend of stakeholders’ perspectives
after the implementation of the BSC using four years’ worth of customer
satisfaction survey results.
1.10 Significance of the study
An enormous number of private and public-sectors have been adopting the BSC
as their PMS (Model 2012). However, as confirmed by Hoque (2014), the existing
literature provides limited insights regarding implementation of the BSC as a
performance management tool within the context of emerging economies’ public-
sectors. This study is probably the first attempt to examine the practice of using
the BSC holistically as a performance management tool in public-sector
organisations in country with an emerging economy. The fact that performance
management based on the BSC had been implemented for eight years for large
organisations (since 2009) and seven years for small organisations (since 2010) by
the time the fieldwork was conducted in the responding organisations enables this
research to offer more insights into BSC practice in this context. Thus, this study
might also prove relevant as a response to Hoque (2014), who posited the need
for research on the BSC in public-sector organisations in an emerging economy.
27
Furthermore, the findings will be useful not only for the MoF but also for other
ministries and other government agencies in Indonesia, as the practice of the BSC
system has also become the model for the PMSs used by other ministries and
other government agencies.
With regard to organisation size, most previous studies focusing on the BSC in
public-sector organisations were conducted in small organisations (see for
instance Griffiths 2003; Greatbanks and Tapp 2007). Another group of studies was
conducted in local governments within one or even two countries (see for instance
Kloot and Martin 2000; Chan 2004; Wisniewski and Olaffson 2004) but took place
within a single organisation. The current study, however, took samples from
twelve DGCE offices, of which three are classified as large and nine as small
organisations, because this study also investigates the ways in which organisation
size affects the implementation of the BSC. Hence, this study contributes to the
existing body of knowledge as the first study to examine the influence of
organisation size on BSC implementation within the context of a public-sector
organisation.
To the best of our knowledge, to this point, the study of BSC implementation has
involved solely high-level positions, performance managers or middle
management levels within the organisations studied (see for instance Hoque and
James 2000; Kloot and Martin 2000; Chan 2004; de Geuser et al. 2009). In our
opinion, however, research into BSC implementation should also involve lower-
level management and staff given that it is they who in fact employ the BSC in their
daily professional activities. As posited by Kaplan (1996c), the BSC concept applies
top-down approaches during the planning phase, but the system becomes a
bottom-up process during the execution of the strategy. The present research
applied purposive sampling in which the samples were drawn from all levels of the
organisations considered in order to get a more comprehensive picture of BSC
implementation. This research involved research participants from the lowest

28
echelons of organisational staff because the twelve DGCE offices have applied the
BSC as a performance management system to the individual level in all twelve
respondent organisations. This is thus the first BSC implementation study to
incorporate participants from all organisational levels.
This study uses a new approach to simultaneously examining the effect of the BSC
on employees’ and on organisations’ perspectives. With regard to the former, this
study examines how implementation of the BSC affects employees’ professional
behaviour in terms of OC and PSM. With respect to the latter, this study employs
two variables as OP indicators: state revenue collection and customer satisfaction
index. These two variables represent two elements of performance: state revenue
collection represents internal effort; meanwhile, the customer satisfaction index
denotes external views regarding organisational performance. In addition, both
datasets are available over a period of several years (longitudinal data). Thus, this
study is able to analyse the trend of OP in a more complete way as it provides the
trend of OP (from the customer satisfaction index) and a before-and-after
perspective of the implementation of the BSC (from state revenue collection),
which offers more information about the degree to which the BSC affects OP.
1.11 Structure of the thesis
The thesis is divided into ten chapters. Chapter 1 sets the foundation of the thesis,
starting with the background of the study and followed by the identification of the
research problems, the aim and objectives of the research, the research setting,
research design, research strategy, data analysis, and the contribution and
significance of the research that the thesis seeks to provide. Chapter 2 presents
the setting of this study, which was conducted in Indonesia, a country with an
emerging economy. This chapter also describes the characteristics of the twelve
case study organisations as well as BSC practices.

29
Chapter 3 reviews the BSC literature. It starts with the process of public-sector
reform, together with public management and the choice of the BSC as a PMS to
help public organisations fulfil their strategic objectives. This chapter includes BSC
evolution, BSC implementation, BSC practices in public-sector organisations, and
consequences of BSC implementation. Chapter 3 also identifies the research gap
that engendered the idea of how this study could contribute to the research and
supplement the existing literature.
Chapter 4 presents the main elements that contributed to the construction of the
conceptual framework used in this study. The principal aspects discussed are the
SFO model, organisation size, employee roles, OC, PSM and OP. This conceptual
framework guided the present study by generating the research questions that
link to the objectives of the study. Chapter 5 explains the research methodology
that provided the philosophical orientation of the study and its justification of the
quantitative methods used. The responding organisations involved in the present
research are introduced in detail in this chapter. This chapter also reports on the
pilot study process and its results. In addition, Chapter 5 explains the primary data
collection from twelve customs and excise organisations from nine cities in four
regions in Indonesia.
Chapter 6 is the first chapter on this study’s findings. It focuses on providing
answers to the first three research questions. The chapter presents empirical
evidence regarding the extent to which BSC approaches have been effective in
isolating SFO principles within the civil service in Indonesia; these findings aid in
determining the association of organisational size and employee roles with BSC
implementation. Chapter 7 is the second chapter discussing our findings. It
examines three relationships: first, the relationship between BSC implementation
and organisational commitment (OC); second, the relationship between BSC
implementation and public service motivation (PSM); and third, the relationship
between OC and PSM. Chapter 8 is the third and last of the chapters discussing
30
this study’s findings. This chapter explores the relationship between BSC
implementation and OP using two performance indicators as organisational
performance variables: state revenue collection and customer satisfaction index.
Chapter 9 provides a discussion of the results of the quantitative findings from
Chapters 6, 7 and 8. The discussion of all findings is constructed in such a way that
the process included revisiting the research instrument, linking with previous
studies, and looking at the context of the responding organisations. Chapter 10 is
the final chapter of the thesis. This chapter concludes the study by presenting a
summary of its main findings; postulating its research contribution in terms of
theoretical and managerial contribution; providing directions for future research;
and specifying the limitations of the study. Chapter 10 ends with personal
reflection on the PhD journey.

31
Chapter 2: Context of the Study
2.1 Introduction
This chapter aims at providing contextual information that is relevant to the
present study. The description of the implementation of performance
management based on BSC within the context of this study is important given that
the practice of BSC itself is likely to differ between one setting and another (Lueg
and Carvalho e Silva 2013, cited in Madsen and Stenheim 2015). A portrayal of the
research setting is thus essential for achieving an understanding of the finding
generated by the current study.
This chapter starts with an overview of the country research setting, Indonesia,
from the perspective of its geography, population, economy and governmental
system. Subsequently, this chapter provides a brief description of the Indonesian
MoF and its bureaucratic reform program as well as of PMSs based on the BSC.
The succeeding section explains the implementation of the BSC within the DGCE.
Next, the profile of each unit of analysis is presented, which also elucidates the
cascading stages of the BSC process from the head of organisation to the staff
level. This chapter ends with a chapter conclusion which reviews its key points.
2.2 An overview of the Indonesian context
Following is a brief description of Indonesia’s geography, population, economy
and governmental system.
2.2.1 Geographical context
The Republic of Indonesia, commonly known as Indonesia, is a country in
Southeast Asia that lies on the equator; it is situated between the Asian and
Australian continents and between the Pacific and Indian Oceans. Figure 2.1 below
is a map of Indonesia; it clearly shows Indonesia’s position between two
continents and two oceans as well as Indonesia’s neighbouring countries.

32
Consisting of 17,508 islands, with an area of 1,904,569 square kilometres,
Indonesia is the largest archipelagic country in the world. Of its 17,508 islands, five
are large islands: Sumatra, Java, Kalimantan, Sulawesi and Papua. Indonesia had
34 provinces with 505 districts as of December 2013 (Ministry of Home Affairs,
2013); its capital city is Jakarta (located on Java Island).
Figure 2.1 Map of Indonesia
Source:
http://www.worldatlas.com/webimage/countrys/asia/lgcolor/idcolor.htm
2.2.2 Population
Indonesia is the most populous country in Southeast Asia and the fourth most
populous in the world. According to the results of the Statistics Indonesia (2010)
conducted by the Indonesia Statistics Board, the total population in 2010 was
237,641,326. The United Nations projects that by 2050, two thirds of Indonesia’s
population will live in urban areas. Over the last forty years, the country has
experienced a process of rapid urbanization, resulting in the current situation in
which over half of Indonesia’s total population resides in urban areas, especially
on Java Island. From an economic perspective, this constitutes a positive
33
development as urbanization and industrialization are necessary in order for
Indonesia to join the ranks of the world’s middle-income countries.
Indonesia’s ethnic composition is characterized by wide variety as the country
contains hundreds of different ethnic groups and cultures. However, more than
half of the population can be classified as belonging to the two main ethnic groups:
Javanese (41 percent of the total population) and Sundanese (15 percent of the
total population). Both of these groups originate from the island of Java,
Indonesia’s most populous island, which encompasses roughly 57.48% of the
country’s total population (Census Report 2010). When the island of Sumatra is
included, this figure rises to approximately 78.79% of Indonesia’s total population,
indicating a significant population concentration in the western part of the country
(Statistics Indonesia 2010). Overall, the most populous province is West Java (with
more than 43 million people); the least populous province is West Papua, in the
far eastern region of Indonesia, with approximately 760,000 people (Statistics
Indonesia 2010).
2.2.3 Economic context
Indonesia is well recognized for its natural resources, including crude oil, natural
gas, tin, copper and gold. In addition, Indonesia is known for its agriculture
products, which include rice, coffee, rubber, tea and palm. According to a World
Bank (2014), Indonesia is the tenth largest economy in terms of purchasing power
parity, Indonesia is also a member of the prestigious Group of Twenty major
economies (G-20), which consists of the 19 countries with the most important
economies and the European Union. Regarding global competitiveness, Indonesia
is in 38th position, having progressed 19 places since the issuing of the previous
report (Global Competitiveness Index 2013-2014).

34
2.2.4 Governmental system
Indonesia is the third largest democratic country in the world after the USA and
India. As in other democratic countries, the Indonesian political system recognizes
the separation of the legislative, executive and judicial powers. The legislative
power is vested in the People's Consultative Assembly, which consists of two
houses: the House of Representatives composed of representatives of political
parties, and the Regional Representatives Council, composed of representatives
from each province in Indonesia. Each province is represented by four delegates
who are elected by the people in their respective regions. The People's
Consultative Assembly was previously the highest state institution. However, in
the Fourth Amendment of the 1945 Constitution, the Consultative Assembly was
relieved of that position. The membership of the Consultative Assembly was then
modified after the 1999-2004 period to include not only the members of the
House of Representatives but also the members of the Regional Representatives
Council. The members of the House of Representative members and the Regional
Representatives Council are elected every five years. Since 2004, the Consultative
Assembly has become a dual parliament with the Regional Representatives
Council as its second chamber. Previously, members of the Consultative Assembly
were all members of the House of Representatives in addition to representatives
of groups. The Consultative Assembly is composed of 550 members of the House
of Representatives and 128 members of the Regional Representatives Council.
The executive office is centralized to the president, vice president, and the cabinet
of ministers. (Globalsecurity.org 2018).
With regard to the number of ministries in the cabinet, there have been some
changes over time, and these are dependent upon the president in office. The
current cabinet ministries total 34 departments (Presidential Regulation
121/2014). Similar to other emerging countries, Indonesia also faces great
challenges to improve public-sector performance. The Government of Indonesia

35
has taken strategic steps to improve the public-sector quality in a series of public-
sector reform programs. In order to unite and coordinate all public-sector
programs, the Government of Indonesia introduced the Grand Design of
Bureaucratic Reform for 2010–2025. This gives the Ministry of Administrative and
Bureaucratic Reform (Kemenpan-RB) a mandate to lead the public-sector reform
process in Indonesia (Presidential Regulation 81/2010). However, the MoF has
been carrying out the reform over a longer period since 2002. This reform has
focused on three major strategies. The first is the enactment of three packages of
three laws regarding State Finance (17/2003), the State Treasury (1/2004) and the
Audit of State Financial Management and Accountability (15/2004). The second is
the separation of functions of budget preparation and budget execution. The third
strategy is the establishment of the Large Tax Office as part of the modernization
of tax administration. After the first period of the reform process (2002–2006), the
MoF launched a massive bureaucratic reform program with the so-called Tiga pilar
reformasi birokrasi (three pillars of bureaucratic reform), which cover
organisation, business process and human resource from 2007 to the present.
Along with these three bureaucratic pillars, the MoF also introduced a PMS based
on the implementation of the BSC, replacing the ‘traditional’ performance
measurement system in order to assure the successful enactment of the programs
based on the three pillars of bureaucratic reform. As the MoF is the pioneer in
Indonesian bureaucratic reform, its reform programs have been widely adopted
by other public-sector organisations. The implementation of the BSC as a PMS is
one of the themes that has provided a benchmark for other ministries, institutions,
local governments, and state-owned enterprises.

36
2.3 The implementation of the BSC in the Ministry of Finance
The MoF is the largest ministry in Indonesia’s Cabinet Ministry, with more than
70,000 employees. It consists of 11 units at the highest level, Echelon 1: the
Secretary General, Inspectorate General, Directorate General of Tax, Directorate
General of Customs and Excise, Directorate General of Budget, Directorate
General of Treasury, Directorate General of State Asset, Directorate General of
Fiscal Balance, Directorate General of Budget Financing Risk and Management,
Fiscal Policy Agency and Financial Education and Training Agency. Among the units
in this first echelon, four have vertical (regional) units in 34 provinces. They are
the Directorate General of Tax, Directorate General of Customs and Excise,
Directorate General of Treasury and Financial Education and Training Agency.
The BSC as PMS was applied gradually in the MoF. It was first applied at the
ministerial level (Kemenkeu wide) in 2009 and then cascaded to the Echelon 1 level
(Kemenkeu-one) (Finance Minister Decree 87/2009). In the following year, BSC
implementation cascaded to the Echelon 2 (Kemenkeu-two) and Echelon 3
(Kemenkeu-three) levels (Finance Minister Decree 12/2010). In the following year,
2011, BSC implementation cascaded from Echelon 3 to the staff level (Minister of
Finance Regulation 454/KMK.01/2011). To ensure that the implementation
between all units of Echelon 1 reach the same standard, the Minister of Finance
mandated the Strategy Management Office (PUSHAKA) to coordinate the
implementation process across all units in the MoF. Considering the year of
implementation, the cascading process of BSC implementation was very fast. It
took only three years of (from 2009 to 2011) to implement the BSC from the
organisational level to the individual level.
Although the cascading process was followed by massive internalization and
socialization within the organisation and was also guided intensively by the
Strategy Management Office (PUSHAKA) during the cascading process, there was

37
no review to determine whether the implementation of the BSC had been
performed according to its creators’ (Kaplan and Norton) suggestions. An
assessment of the contribution of the BSC implementation to the accomplishment
of the organisation’s strategic objectives was likewise omitted. Meeting
organisational goals, however, was the main consideration leading to the adoption
of the BSC. With regard to the evaluation of the public-sector agenda, in 2012, the
National Reform Body (a task force under the supervision of the Vice-President’s
Office) conducted a review of the MoF as it had been the pioneer of public-sector
reform. The samples were chosen from the Directorate General of Customs and
Excise. The results of the review concluded that the bureaucratic reform process
was on the right track. Thus, in order to evaluate the implementation of the BSC,
this research likewise took samples from Directorate General of Customs and
Excise.
2.4 Context of the study
The Directorate General of Customs and Excise (hereafter referred to as DGCE)
consists of 120 vertical offices spread across 34 provinces (MoF Regulation
Number 206.3/PMK.01/2014). Alongside the other Echelon 1 units in the MoF,
the DGCE began, at the organisational level, implementing performance
management based on the BSC in 2009. Then, over the following two years, the
implementation of the BSC was cascaded to lower levels, gradually, reaching the
staff levels in 2011.
Before implementing the BSC system, performance measurement within the
DGCE used the aforementioned DP3 system (list of job implementation
assessments). As described in Chapter 1, this assessment system was subjective in
that there were no specific performance indicators attached to the DP3 system;
the assessment system was therefore based merely on the subjective views of an
employee’s direct supervisor. The introduction of the BSC system at the individual
level has brought drastic changes in the assessment system, because in contrast

38
to the DP3 system, every employee is now evaluated based on key performance
indicators along with the targets that are directly or indirectly related to the
organisation’s strategic objectives.
At the beginning of the fiscal year, all DGCE employees sign a performance
contract together with their direct supervisors (for instance, in MSOs in the DGCE,
Echelon 3 employees sign with the head of the MSO). The performance contract
comprises organisational strategic objectives, key performance indicators (KPIs)
and the target of the KPIs for the period of one fiscal year. The performance
contract is reviewed every six months, and during the review, a performance
dialogue system is also provided to support the employees in reaching the
performance targets.
For the purposes of this study, the researcher selected twelve CEOs as respondent
organisations: the Main Service Offices (MSOs) of Tanjung Priok, Batam, and
Soetta and the Customs and Excise Offices (CEOs) of Jakarta, Marunda, Merak,
Tangerang, Bekasi, Bogor, Purwakarta, Cikarang, and Bandung. In the following
subsections, brief descriptions of the characteristics of each of the twelve offices
are provided.
2.4.1 MSO, Tanjung Priok
The MSO of Tanjung Priok is the largest office in the Directorate General of
Customs and Excise. This main office is situated at the Port of Tanjung Priok in the
northern part of Jakarta, the capital city of Indonesia. The port of Tanjung Priok is
the largest seaport in Indonesia and is responsible for roughly 70% of Indonesia’s
import and export activities (Ginting et al. 2015; Pang and Gebka 2016). The main
task of this office is to serve, control and conduct audits within the context of
customs and excise matters covering the port area of Tanjung Priok (MoF
Regulation 68/PMK.01/2007).

39
The MSO of Tanjung Priok is headed by an Echelon 2 (director-level) employee,
who is responsible for ten Echelon 3 (middle manager-level), 145 Echelon 4 (first-
line manager-level), and 1,016 staff-level employees. With regards to BSC
implementation, at the time the fieldwork for this thesis was conducted, the BSC
had been in place for eight years at the organisational level (since 2009). In 2010,
the implementation of the BSC cascaded to lower levels (Echelon 3). The year after
that, BSC implementation cascaded to Echelon 4 and all staff levels. Thus, in 2011,
the MSO of Tanjung Priok implemented the BSC within all levels of the
organisation (to the individual level).
2.4.2 MSO, Batam
The MSO of Batam is situated in the city of Batam within the province of Kepulauan
Riau. The main task of this office is to serve, control and conduct audits within the
context of customs and excise matters in the area of the Batam Free Trade Zone
(MoF Regulation 168/PMK.01/2012). The MSO of Batam is headed by an Echelon
2 employee, with seven Echelon 3, 24 Echelon 4 and 257 staff-level employees. As
with the MSO of Tanjung Priok, BSC implementation in Batam began in 2009, or
eight years prior to the conducting of the fieldwork for this thesis and cascaded
gradually to the lower and individual levels in 2010 and 2011.
2.4.3 MSO, Soetta
The MSO of Soetta is situated in the airport area of Soekarno-Hatta International
Airport in the province of Banten. The main task of this office is to serve, control
and conduct audits within the context of customs and excise matters covering the
area of Soekarno-Hatta International Airport (the busiest international airport in
Indonesia). The MSO of Soetta is headed by an Echelon 2 employee together with
six Echelon 3, 59 Echelon 4 and 622 staff-level employees. The BSC was
implemented organisationally in 2010, or seven years prior to the conducting of
the fieldwork for this thesis. Later in 2010, the implementation of the BSC was
cascaded to Echelon 3. In the following year, BSC implementation cascaded to

40
Echelon 4 and all staff levels. As of 2011, then, the MSO of Soetta had
implemented the BSC within all levels of the organisation (to the individual level).
2.4.4 CEO, Marunda
The CEO of Marunda is situated in the northern part of Jakarta, within the province
of Banten. The main task of this office is to serve, control and conduct audits
within the context of customs and excise matters covering the Sunda Kelapa
seaport and bonded zones around Marunda (MoF Regulation
206.3/PMK.01/2014). The CEO of Marunda is headed by an Echelon 3 employee
and also employs 16 Echelon 4, 40 Echelon 5, and 116 staff-level employees. The
BSC was implemented organisationally in 2010, or seven years prior to the
conducting of the fieldwork. In 2011, BSC implementation cascaded to echelon 4
and all staff levels. As of 2011, the CEO of Marunda was thus implementing the
BSC at all levels of the organisation (to the individual level).
2.4.5 CEO, Jakarta
The CEO of Jakarta is situated in the eastern part of Jakarta, within the province of
DKI Jakarta. The main task of this office is to serve, control and conduct audits
within the context of customs and excise matters covering the Halim Perdana
Kusumah and bonded zones around Jakarta (MoF Regulation
206.3/PMK.01/2014). The CEO of Jakarta is headed by an Echelon 3 employee,
with 16 Echelon 4, 57 Echelon 5 and 101 staff-level employees. As for BSC
implementation, it took place organisationally in 2010, or seven years prior to the
conducting of the fieldwork. The year after that, BSC implementation cascaded to
Echelon 4 and all staff levels. Thus, in 2011, the CEO of Jakarta was implementing
the BSC at all levels of the organisation (to the individual level).

41
2.4.6 CEO, Merak
The CEO of Merak is situated in the city of Cilegon in the province of Banten. The
main task of this office is to serve, control and conduct audits within the context
of customs and excise matters covering the area of the Merak international
seaport (MoF Regulation 206.3/PMK.01/2014). The CEO of Merak is headed by an
Echelon 3 employee who is responsible for 13 Echelon 4, 37 Echelon 5 and 48 staff-
level employees. The BSC was implemented organisationally in 2010, or seven
years prior to the conducting of the fieldwork. In the year after that, BSC
implementation was cascaded to Echelon 4 and all staff levels. Thus, in 2011, the
CEO of Merak implemented the BSC within all levels of the organisation (to the
individual level).
2.4.7 CEO, Tangerang
The CEO of Tangerang is situated in southern part of the city of Tangerang, within
the province of Banten. The main task of this office is to serve, control and conduct
audits within the context of customs and excise matters covering the area of
customs bonded zones under the jurisdiction as stipulated in MoF Regulation
206.3/PMK.01/2014. The CEO of Tangerang is headed by an Echelon 3 employee
responsible for 13 Echelon 4, 37 Echelon 5 and 48 staff-level employees. The BSC
was implemented organisationally in 2010, or seven years prior to the conducting
of the fieldwork. The year after that, the BSC implementation cascaded to Echelon
4 and all staff levels. Thus, in 2011 the CEO of Tangerang implemented the BSC
within all levels of the organisation (to the individual level).
2.4.8 CEO, Bekasi
The CEO of Bekasi is situated in the Bekasi Regency in the province of West Java.
The main task of this office is to serve, control and conduct audits within the
context of customs bonded zones under the jurisdiction as stipulated in Minister
of Finance Regulation 206.3/PMK.01/2014. The CEO of Bekasi is headed by an
Echelon 3 employee along with 16 Echelon 4, 75 Echelon 5 and 159 staff-level

42
employees. The BSC was implemented organisationally in 2010, or seven years
prior to the conducting of the fieldwork. In 2011, BSC implementation cascaded to
Echelon 4 and all staff levels. Thus, in 2011, the CEO of Bekasi implemented the
BSC within all levels of the organisation (to the individual level).
2.4.9 CEO, Bogor
The CEO of Bogor is situated in the Bogor district in the province of West Java. The
main task of this office is to serve, control and conduct audits within the context
of customs bonded zones under the jurisdiction as stipulated in Minister of
Finance Regulation 206.3/PMK.01/2014. The CEO of Bogor is headed by an
Echelon 3 employee working with 15 Echelon 4, 52 Echelon 5 and 125 staff-level
employees. The BSC was implemented organisationally in 2010, or seven years
prior to the conducting of the fieldwork. In the following year, BSC implementation
cascaded to Echelon 4 and all staff levels. In 2011, then, the CEO of Bogor
implemented the BSC at all levels of the organisation (to the individual level).
2.4.10 CEO, Purwakarta
The CEO of Purwakarta is situated in the Purwakarta district, which is in the
province of West Java. The main task of this office is to serve, control and conduct
audits within the context of customs bonded zones under the jurisdiction as
stipulated in Minister of Finance Regulation 206.3/PMK.01/2014. The CEO of
Purwakarta is headed by an Echelon 3 employee and is additionally staffed by 16
Echelon 4, 50 Echelon 5 and 76 staff-level employees. The BSC was implemented
organisationally in 2010, or seven years prior to the conducting of the fieldwork.
The year after that, BSC implementation cascaded to Echelon 4 and all staff levels.
Thus, in 2011 the CEO of Purwakarta implemented the BSC within all levels of the
organisation (to the individual level).

43
2.4.11 CEO, Cikarang
The CEO of Cikarang is situated in Bekasi Regency in West Java. The main task of
this office is to serve, control and conduct audits within the context of customs
bonded zones under the jurisdiction as stipulated in Minister of Finance
Regulation 206.3/PMK.01/2014. The CEO of Cikarang is headed by an Echelon 3
employee supervising 16 Echelon 4, 49 Echelon 5 and 114 staff-level employees.
Performance management based on the BSC was directly applied at all levels,
including the individual level, when the office was first established in 2015.
2.4.12 CEO, Bandung
The CEO of Bandung is situated in Bandung Regency in West Java. The main task
of this office is to serve, control and conduct audits within the context of customs
bonded zones and Husein Sastranegera International Airport, under the
jurisdiction as stipulated in Minister of Finance Regulation 206.3/PMK.01/2014.
The CEO of Bandung is headed by an Echelon 3 employee working with 15 Echelon
4, 48 Echelon 5 and 79 staff-level employees. The BSC was implemented
organisationally in 2010, or seven years prior to the conducting of the fieldwork.
The year after that, BSC implementation cascaded to Echelon 4 and all staff levels.
Thus, in 2011 the CEO of Bandung implemented the BSC within all levels of the
organisation (to the individual level).
2.5 Chapter summary
The aim of this chapter was to present the research context for this thesis. This
chapter highlights that the present study was conducted in an emerging economy,
that of Indonesia. Using Indonesian customs and excise organisations as its case
study, this research took samples from three MSOs and nine CEOs situated in nine
cities in four provinces as representative of the 120 service offices. This chapter
reveals that performance management based on the BSC is one of the

44
bureaucratic reform programs introduced in Indonesia’s MoF. This chapter also
provides information about the stages of BSC implementation in each of the
respondent organisations, which is valuable information that contributed to the
design of this research.

45
Chapter 3: Exploring the Concept and Practices of the BSC: A
Literature Review
3.1 Introduction
The purpose of this chapter is to explore and review the theoretical perspectives
and practices of BSC implementation. This chapter discusses BSC implementation
mainly by exploring its practices as a PMS as described in the existing literature.
This chapter is organised as follows. In the next section, the researcher briefly
explores public-sector reform and in doing so establishes its relationship with
performance management. This section is followed by a discussion of BSC
practices, focusing on the development of the BSC concept, conceptual
foundations, practices in public-sector organisations, and benefits of
implementing the BSC, as well as critiques of the BSC. This chapter concludes by
surveying the potential research gaps in the existing literature.
3.2 Public-sector reform
The need for public-sector reform has been an enormous topic of discussion in
many countries. Osborne and Gaebler (1992) argued that the basic problem is not
merely to decide whether more government or less government is needed, but
that in fact government must become better. The authors also highlighted that
better governance is the process by which we collectively solve our problems and
meet our society’s needs. The need to improve public administration and public-
sector performance has been increasing over time. The challenge is not only to
generate or deliver better service but, much more importantly, to bring vitality to
national development. Evan and Rausch (1999) found that the role of bureaucratic
authority structures should be included as a factor in general models of economic
growth. They also echoed the need for policy makers to construct better
bureaucracies and for social scientists to conduct more research on the
organisation of state bureaucracies. Public-sector reform, then, has clearly been a
persistent item on the agenda for many countries around the world. According to

46
Pollitt and Bouckaert (2004), public-sector reform can be defined as a series of
deliberate changes to the structures and processes of public-sector organisations
with the purpose of causing them to perform better. Public-sector organisations
need to demonstrate that there have been improvements in performance and that
goal and objectives are being achieved (McAdam et al 2005). Another, similar view
was also expressed by de Bruijn (2007, p.4) who proposed the importance of
performance measurement in public sector by stating that “performance
measurement is a very powerful measurement tools that reduces the complex
performance of a professional public sector organization to its essence, hence
enable to detect poor performance allowing the organisation to be corrected if it
performs poorly. If the public organization performs well, performance
measurement might play an important role in making this transparent and in
acquiring legitimacy”.
With the demand for greater transparency and accountability regarding the use of
public funds, public-sector organisations have turned to private sector
performance management practices as a potential means of improving and
demonstrating their own performance and accountability (Hood 1995; Jackson
and Lapsley 2003; Perera et al. 2003; Lapsley and Wright 2004 cited in Northcott
and Taulapapa 2012). Northcott and Taulapapa (p.167) have referred to a move
towards specifying strategic goals that then form the basis for setting published
performance targets against which actual public-sector organisation performance
must be compared.
With respect to performance measurement, a study of municipal governments of
the USA and Canada by Chan (2004) showed that the government administrators
whose organisations have implemented BSC strongly believe that its benefits
outweigh its costs. Marr and Schiuma (2003) concluded that the BSC appears to
be one of the most powerful concepts in the field of performance management
and measurement (PMM). The BSC has also gained its popularity in public-sector

47
organisations (see Brignall and Modell 2000; Lapsley and Wright 2004; Niven 2008;
Northcott and Taulapapa 2012). Moreover, the BSC is designed to provide a PMS
that links overall strategy to plans and performance measures, thereby providing
a timely and cost-effective means of reviewing whether an organisation is on track
to achieve its goals (Wisniewski and Dickson 2001).
3.3 BSC concept
According to Kaplan and Norton’s (1992) definition, the BSC is “a set of measures
that gives top managers a fast but comprehensive view of business performance
which include financial measures, and its complement with operational measures
on customer satisfaction, internal process and the organisation innovation and
improvement activities-operational measures that are the drivers of the future of
the financial performance, later these factors are known as perspectives”.
The BSC concept has evolved greatly since its first introduction (Braam and Nijssen
2004; Madsen and Stenheim 2015). With regard to its development process,
Kaplan (2009) explained that the development of the BSC can be divided into three
stages. In stage one, the BSC was used merely as a measurement tool; what
distinguishes it from other measurement methods is that the BSC introduces a
comprehensive view of organisational performance based on a broader set of
values than financial indicators. Meanwhile, in stage two, the BSC concept
emphasizes the importance of strategic objectives and how to construct those
strategic objectives in a framework called ‘strategy maps’. With the strategic
objectives constructed coherently (a causal-effect relationship) on a strategy map,
people in the organisation can easily understand the link between one strategic
objective and another. The last stage is the strategy management system, in which
the BSC reaches a broader scope of management. In this stage, every strategy
cascades to managers or staffs proportionately so that everyone knows directly or
indirectly how he or she is to contribute to the organisation’s strategic objectives.

48
The BSC concept was first developed by Kaplan and Norton (1992) as a
performance measurement framework that added strategic non-financial
performance measures to traditional financial metrics to provide managers with a
balanced view of OP. Numerous other authors have contributed to the BSC
concept, leading to its evolution from a performance measurement tool to a PMS
(Perkin et al. 2013). Kaplan and Norton (1992) formulated a BSC that comprises
four perspectives, namely: the financial perspective, the customer perspective,
the internal business perspective and the innovation and learning perspective.
These four perspectives are common and inter-related. Figure 3.1 below describes
the relationships of the four factors.
Figure 3.1 BSC linking of performance measures
Source: Kaplan and Norton (1992, p. 72)
Kaplan and Norton (1992) explained that the BSC puts strategy and vision at the
centre of an organisation. Hence, members of the organisation are encouraged to
work accordingly, leading to the achievement of the organisation’s goals. The
authors further claimed that the introduction of the BSC concept provided a
breakthrough in terms of how a company look at their achievements, given that
the BSC concept provides more insight and effectiveness for OP, linking
performance directly to organisational strategy.
49
With regards to the operationalisation of perspectives in the BSC, Aidemark (2001,
p. 25) explained the idea that three different perspectives—customer, internal
business processes and learning and growth—are of vital importance to a fourth:
the financial perspective. Aidemark further described the BSC as linking
customers, internal processes, employees and system performance to long-term
financial success. If the first three perspectives are developed in the right
direction, then the fourth overarching financial perspective follows suit. The
innovation and learning perspective is intended to strengthen competence among
staff members. This supports the development of internal business processes,
which in turn leads to better customer relations. Growth in customer loyalty
translates to financial prosperity. The BSC is, in other words, more of a strategic
management system than an informational structure, and it has its greatest
impact when it is used to implement strategy and to drive organisational change
(Kaplan and Norton 1996b). At this point, however, the concept does not support
clear methods as to how strategy and vision can successfully link to organisational
measures: the authors did not provide a logical explanation of how each
perspective can relate to the others or an account of the relationships among
organisational vision, perspectives and strategic objectives.
The latest development of BSC is the idea of making BSC into a strategy
management system. Kaplan (2009), using Simons’ (1995) definition to explain the
development of the strategy management system, transformed the BSC from an
extended diagnostic system to an interactive system with three distinct
characteristics: first, information generated by the system is an important and
recurring agenda addressed by the highest levels of management. Second, the
interactive control system demands frequent and regular attention from
operating managers at all levels of the organisation. Third, data generated by the
system are interpreted and discussed in face-to-face meetings of superiors,
subordinates, and peers.

50
The idea of a causal relationship between the four perspectives is not without
criticism. For instance, Nørreklit (2000) concluded in her research that a causal
relationship along the lines suggested by Kaplan and Norton (1996a) is clearly not
valid. She further emphasized that an evaluation system that does not integrate
all relevant variables cannot be expected to show valid results. In a later article,
Nørreklit (2003) used stylistic text analysis and argumentation theory to conclude
that the popularity of the BSC is based on persuasive rhetoric rather than solid
academic argumentation. A similar critique stems from a study by Nørreklit et al.
(2012), in which the authors applied discourse analysis and concluded that the BSC
concept not only lacks realistic scholarly characteristics but also shows some
characteristics of a myth speech genre. Responding to criticisms of BSC concept,
Kaplan (2012) argued that most criticism of the BSC focused too much on these
aspects of the BSC and largely overlooked the role that the BSC can play as a tool
for the execution of strategy. With regard to Nørreklit’s (2000, 2003 and 2012)
criticism in particular, Madsen and Stenheim (2015) stated that Bukh & Malmi
(2005) and Kaplan (2012) have moderated Nørreklit’s criticisms and argued that
they focus largely on the older version of the BSC set out in Kaplan and Norton’s
1996 book. Madsen and Stenheim (2015) underscored that the BSC concept has
developed considerably since its introduction in 1992 and that the criticism was
leveled at an outdated version of the BSC version.
Another example of BSC criticism comes from Kasurinen (2002), who applied
action research in the strategic business unit of a multinational Finnish-based
metals group. Kasurinen claimed that the BSC concept does not pay enough
explicit attention to the context of change implementation. He argued that the
BSC’s lack of this contextual analysis at the early stages of a project may lead to
understatement of structural barriers and to only limited implementation.
Kasurinen added that some of the advancing forces may ‘push’ the project in the
wrong direction given that the BSC system involves many levels of organisational

51
hierarchy and that the issues under consideration range from strategic
transformation to operational improvements. He further suggested that before
implementing the BSC within an organisation, it should be decided whether the
primary purpose of using the BSC is as a measurement system or a management
system (strategic focus). However, the BSC concept has developed from a
performance measurement system into a management system, and it has a
positive effect on the organisation when it is related to organisational strategy
(Braam and Nijssen 2004; Paplexandris et al. 2004). According to Braam and
Nijssen (2004) and Paplexandris et al. (2004), implementing BSC within the
organisation is a question of the management system.
Another strong criticism of the BSC came from a study by Voelpel et al. (2006, p.
49-54). The authors claimed that five major categories of problems arise when
applying BSC in the innovation economy and that these have the potential to
jeopardize the organisation. First, the BSC is a relatively rigid measurement tool.
The authors thus argue that given the BSC’s four perspectives as the main
categories according to which key success factors are defined, the BSC tends to
force indicators into one of the four perspectives. They claim that doing so limits
perspectives on the company, leaving little room for cross-perspectives that might
have simultaneous impact. Second, the BSC creates a static-ism that tends to
struggle with the challenges of a highly competitive and changing business world.
Within the BSC approach, a centrally defined strategy is translated into certain
measures that align all company activities with the achievement of the company’s
BSC goals. As a consequence, the optimal implementation of the BSC leads to a
high level of uniformity and goal orientation. Voelpel et al. further argue that this
condition increases and possibly maximizes the focus on the given goal, but it also
limits any further activities and initiatives that might go beyond the originally set
targets. Third, the external innovative connectivity of an organisation is hampered
by the BSC, which is mostly an internal document; this is a critical limitation in its
ability to account for the external environment and systemic linkages. The authors

52
argue that the BSC widely ignores the needs of an interlinked and highly
networked innovation economy in which companies co-evolve and where
competition is partly giving way to co-opetition. Fourth, the BSC follows the
traditional logic of innovation through internal R&D, which works on an innovation
from its beginning to its end, keeping it secret from the external environment and
especially from competitors. The authors provide reasoning for this opinion in
referring to the nature of innovation today as similarly changing from incremental
to disruptive, from closed to open, and by positing that innovation is likewise
becoming increasingly networked.
Fifth, the BSC is grounded in a mechanistic mindset. Voelpel et al. stated that
companies with a bureaucratic and hierarchical structure, in which job
responsibilities are still clearly defined and in which deviations from the standard
and routine processes are treated as problems of a temporary nature before going
back to the norm, might very well benefit from the BSC given that it provides a
rationalistic, systematic approach to measurement. However, as business
processes become more complex, an understanding of most of the key success
factors within a firm needs to take cross-perspectives into account. In a
knowledge-driven company, simple cause-and-effect relationships are no longer
sufficient for an understanding of the complex relationships that the BSC tries to
reduce to a linear, one-way relationship. In their explanation, the authors took
customer satisfaction as an example of an element that might be linked to various
factors such as employee satisfaction, quality, and delivery time. However, as an
example, customer satisfaction might also enhance employee satisfaction, which
in turn might positively influence product quality. The authors proceeded to
highlight that the predominant mindset connected to the application of the BSC is
that of mechanistic and linear thinking, making it difficult to deal with an
interconnected and networked world. Voelpel et al. (2006) appear to have been
lacking some fundamental information when they compiled the five limitations set
out above. For instance, in their first claim, that BSC is relatively rigid, the authors
53
refer to the number of perspectives; however, the BSC concept is actually flexible
as proposed by Kaplan and Norton (1996), who clearly stated that the four
perspectives should be considered a template, not a straitjacket. The second note
is that they strangely use Encyclopaedia Britannica as a case company, but
Encyclopaedia Britannica never applied the BSC concept (Kaplan and Norton
2006c). Similarly, the next four limitations of the BSC concept as outlined by
Voelpel et al. (2006) strongly indicated that they had not performed a broad
review of other researchers’ literature on BSC. For instance, an ambiguous
statement appears in the admission that the BSC maximizes the focus on a given
goal but that it at the same time limits any further activities and initiatives that
might go beyond the originally set targets (Voelpel et al. 2006). In contrast, the
BSC concept opens up an opportunity to learn, to adapt organisational strategies
to dynamic conditions and to become more responsive to new ideas emerging
from within the organisation (Kaplan 2001c).
Kaplan and Norton (2001c) noted that, despite their different ways of achieving
strategic alignment and focus, all organisations are believed to apply relatively
similar principles to which the authors refer to as the ‘SFO model’. These are
divided into five classifications. The first of these is translation of the strategy into
operational terms, a process during which the organisation builds a strategy map
interpreting their strategy for units and the employees within those units. This
encourages employees to share the same understanding of the strategy. Second
is the alignment of the organisation with the strategy, which emphasizes the
importance of linking and integrating individual strategies so that the OP exceeds
the sum of the individual parts. Third is the principle of making strategy everyone’s
daily responsibility. This principle reveals the importance of employees’
understanding of the organisation’s strategy, which allows them to carry out their
daily tasks in such a way that they are contributing to the accomplishment of the
strategy. This is referred to as a top-down communication. The fourth principle is
the making of strategy into a continuous process. Kaplan and Norton stated that
54
companies using BSC illustrate three important processes in managing strategy,
namely linking strategy to the budgeting process, engaging management in
meetings to review strategy, and learning and adapting as the strategy evolves.
The fifth principle is the mobilization of leadership for change. Unlike the other
four other principles, which focus on tools, processes and frameworks, Kaplan and
Norton believed that ownership and active involvement of the executive team is
the single most important condition for success. In 2008, Kaplan and Norton
proposed a management system tool kit that uses BSC concepts in its cycle. The
management system toolkit cycle is a five-stage system that begins with
developing the strategy, followed by translating the strategy, planning operations,
monitoring and learning and lastly testing and adapting the strategy. Kaplan and
Norton posited that this management system toolkit cycle would enable an
organisation’s executives to link strategy and execution.
According to a review of the BSC literature conducted by Perkins et al. (2014) BSC
development is categorized into three generations which are in turn divided into
eight versions. The first generation is divided into four different versions: the first
lays the groundwork for the scorecard framework, the second begins to focus on
strategy, the third introduces specific targets, develops the strategy and
introduces causality, and the fourth highlights the role that the scorecard plays as
part of a PMS. The second generation of the BSC has two versions. The first of
these is the introduction of strategy maps and the second involves furthering the
development of this framework alongside the change to a bottom-up, ongoing
approach to the scorecard framework. The third generation has two versions, with
the first characterized by the addition of the ‘destination statement’ to the BSC
and a greater focus on the strategic linkage model and the second simplifying the
scorecard by removing many of the perspectives that are considered in earlier
versions. Overall, the development stages of the BSC proposed by Perkins et al.
(2014) are much more detailed than the elucidations offered by Kaplan (2009).

55
In sum, the BSC framework has developed significantly since its original
introduction. The milestone of each development was recorded in a series of
publications by Kaplan and Norton since 1992. Table 3.1 below identifies the key
aspects that the BSC introduced based on the literature written by Kaplan and
Norton.
Table 3.1 Summary of BSC development
Publication
Year Publication Title Key Areas Covered
1992 The BSC measures
that drive
performance
• Introduction of BSC as a foundation for development
• BSC is a superior performance measurement that uses both financial and non-financial measures
• Identification of the four perspectives: financial; customer; internal business; innovation and learning
• BSC is forward-looking (long-term performance)
1993 Putting the BSC to
work
• BSC is not only a measurement exercise, it is also a management system to motivate breakthrough improvement
• BSC has greatest impact when used to drive a change
process
• Identification that transparency is critical to a successful BSC
• Measures on BSC must be specifically designed to fit firm’s mission, strategy, technology, and culture
1996 The BSC: Translating
strategy into action
• BSC has evolved from a measurement system to a strategic management system
• Identification of four major steps in successful BSC implementation
• Reclassification of “internal business process” and “learning and growth”,
• Shifting innovation to internal business processes and adding growth element to employee learning
• Measures are linked to each other in a causal relationship, unlike before, linked to strategy and vision
2001 The strategy-
focused
organization:
How BSC companies
thrive in the new
competitive
environment
• Translating the strategy to operational terms: building
strategy maps • Aligning the organization to create synergies: creating
business unit synergy
• Making strategy everyone’s everyday job: creating strategic awareness, defining personal and team objectives, the balanced paycheck
• Making strategy a continuous process
• Mobilizing change through executive leadership
2004 Strategy maps:
Converting
intangible assets
• Visually map strategy
• A visual cause-and-effect explanation of what’s working and what’s not, in a way that everyone in the company can understand

56
into tangible
outcomes
2005 The office of
strategy
management
Establishing a new unit to orchestrate strategy and
execution within an organization
2006 Alignment: Using
the BSC to create
corporate synergies
• Helps get the entire organization involved in strategy scorecard to create corporate synergies
• Alignment: a source of economic value
• Corporate strategy and structure
• Aligning financial and customer strategies
• Aligning internal process and learning and growth strategies: integrated
• Strategic themes
• Cascading: the process
• Aligning boards and investors • Aligning external partners
• Managing the alignment process • Total strategic alignment
2008 The execution
premium • Develop the strategy • Plan the strategy
• Align the organization
• Plan operations • Monitor and learn
• Test and adapt
2010 Managing Alliances
with the Balanced
Scorecard
The balanced scorecard management system can help
companies switch their alliance management focus from
contributions and operations to strategy and commitment
2015 Formal Measures in
Informal
Management: Can a
Balanced Scorecard
Change a Culture?
The collaboration to create a "balanced scorecard" of
performance measures can help change an organization's
culture
Sources: Kaplan et al. (2005), Kaplan et al. (2010), Dechow (2012), Hoque (2014)
and Gibbons and Kaplan (2015).
Organisations using the BSC are not limited to merely focusing on financial
measures; in fact, the BSC enables organisations to measure their progress in four
new management processes that link the organisation’s long-term strategic
objectives with short-term actions (Kaplan and Norton 1996a). Kaplan and Norton
highlighted that there are four processes of managing strategies, namely
translating the vision, communicating and linking, business planning and feedback
and learning. Furthermore, Kaplan and Norton (1996b) suggested that translating

57
the vision, communicating and linking, and business planning are vital for
implementing strategy but that they are not sufficient in an unpredictable world.
Together, they form an important single-loop learning process in the sense that
the objective remains constant, and any departure from the planned trajectory is
seen as a defect to be remedied. This single-loop process does not require or even
facilitate re-evaluation of either the strategy or the techniques used to implement
it in light of current conditions.
Kaplan and Norton (1996b) stated that the BSC has three components that are
substantial to strategic learning. The first component is articulation of the vision,
according to which the BSC articulates the vision clearly as well as, in operational
terms, the goals that the organisation as a team is trying to achieve. In other
words, it links individual performance to business unit objectives. The second
component is the BSC concept’s introduction of a strategic feedback system that
tests, validates and modifies the hypotheses embedded in a business’ unit
strategy. The third component is the enabling through the BSC of strategy review,
which mainly occurs in the form of review meetings conducted monthly or
quarterly. The review meetings are also used as periodic review sessions of
strategy and its execution. Kaplan and Norton (2004) introduced the strategy map
as a strategic instrument to operationalize the linkage between perspectives in the
BSC framework. The authors posited that the benefits of strategy mapping can be
seen in terms of a smaller perspective and a larger perspective. From the smaller
perspective, a strategy map offers a clear picture for employees in which they can
visualise their contribution to organizational performance. In terms of the larger
perspective, a strategy map functions as a tool to demonstrate how an
organisation plans to convert its initiatives and resources, including elusive assets
such as organisational culture and employee knowledge, into real outcomes. The
BSC strategy map contains four specific layers: financial, customer, internal
process, and learning and growth. These resemble the four perspectives of the BSC

58
framework. Figure 3.2 below is an example of the strategy maps developed by
Kaplan and Norton.
Source: Kaplan and Norton (2009)
Figure 3.2 Sample of strategy map

59
Figure 3.2 offers a vibrant illustration of how the BSC concept functions. Learning
and growth provide the fundamental basis of an organisation and come from three
critical main sources: human capital, information capital and organisational
capital. Learning and growth then drive the internal business process perspective.
The four main processes involved in the internal business process are operation
management, customer management, innovation, and regulatory and social
processes. This process generates products or services to be delivered to
customers. The next perspective is the customer perspective, which reacts to the
output from the internal business process. According to the financial perspective,
the more satisfaction customers obtain from the products or services received,
the more likely it is that their satisfaction will benefit the organisation.
Regarding designing a strategy map, Kaplan and Norton (2004) suggested that the
best approach is the top-down approach, starting with the destination and then
charting the routes that will lead to it. The first step is for corporate executives to
formulate the mission statement and the core values that underpin the existence
of their company. After this first step is taken, managers can formulate a strategic
vision of what their organisation wants to become in the future. The vision created
ought to give a clear picture of the ultimate goal. The last step is to formulate
logically explainable strategies of how to achieve the ultimate goal. Kaplan and
Norton proposed that a strategy map can help an organisation locate the main
gaps in the strategies being implemented at the lower levels of the organisation.
They also posited that a strategy map enables executives to take corrective actions
as early as possible when there are gaps in strategies that could endanger the
accomplishment of the organisation’s strategic objectives. A strategy map is
intended to help an organisation carry out its initiatives effectively and rapidly; its
construction based on cause-and-effect relationships makes it obvious and
testable. For members of the organisation, the strategy map is an effective way of
communicating organisational objectives and strategies as well as their underlying
hypotheses.

60
Several researchers have stated that the use of strategy maps with the BSC has
contributed positively to organisations in various ways. For instance, a study by
Irwin (2002) explored the use of strategy mapping as a tool to develop strategy in
the UK small business service. Irwin claimed that strategy mapping is a very
effective tool to ensure an understanding of the role of strategy as covering all of
an organisation’s activities; in addition, he argued that strategy mapping can
function as a reminder to the organisation of various strategic perspectives,
ensuring that all strategies are taken into account. Similar assertions were made
by Lowe et al. (2011), who highlighted strategy maps and scorecards as methods
of communicating and aligning an organisation’s objectives. The research of
Banker et al. (2011) found that strategy mapping helps decision makers focus on
the achievement of strategic objectives during the performance evaluation
process. Yi-Wu (2012) stated that strategy maps in conjunction with high-quality
key performance indicators (KPIs) can support management as a reference for
defining activities aimed at strategic improvement. Another positive view of
strategy mapping was offered by Cheng and Humphrey (2012), who concluded
that strategy mapping helps decision makers to create a more useful cognitive
representation of strategies through which external informational items can be
interpreted and incorporated in strategic judgments. In a similar vein, Gonzales et
al. (2012) conducted a study using the cognitive mapping technique in a large
printing company and found that implementing the BSC strategy map helped to
reduce managers’ causal ambiguity with regard to the objectives they needed to
pursue in order to improve their firm's competitive position.
However, not all researchers have viewed the strategy map positively. For
instance, Rompho (2012), who examined the relationship between strategy
mapping and decision making, found that strategy maps do not affect the quality
of participants’ decision making. However, the study was conducted in a
laboratory setting, which may raise questions about its validity as it was not

61
performed in a natural setting; the decision-making process within a laboratory
situation may vary significantly from that of a real organisational situation.
3.4 BSC practices
For over 25 years, the BSC has garnered interest in practice amongst private
organisations as well as public-sector organisations. A considerable amount of
literature has been published on BSC practice and theory. The literature reports
that BSC concepts have been widely used in the United States, many countries in
Europe, Australia, New Zealand and several Asian and African countries. According
to Paranjape et al. (p.5, 2006), various journal articles and surveys confirm that of
all performance measurement systems, the BSC is the most popular, least
criticised and most widely implemented. A similar report was also supplied by
Neely (2003 cited in Paranjape 2006), who quoted the Connecticut-based research
organisation Gartner as estimating that over 70 per cent of large US firms had
adopted the BSC by the end of 2001. The scope of adoption in each country is
varied; in some countries, BSC is adopted in both private and public-sector
organisations, while some others have reported implementation of the BSC among
municipal/local governments and healthcare providers. As noted by Burkert et al.
(2010), surveys provide evidence for impressively high rates of adoption of the BSC
worldwide: among US firms, the rate of adoption had already been estimated at
approximately 50% by earlier studies and more recent evidence indicated that this
percentage had increased to 66%, supporting the findings of Gartner cited above.
This high rate of implementation has generated a considerable number of studies
regarding BSC. According to de Geuser et al. (2009), research on the BSC can be
structured around three main issues: (1) the characteristics of widespread
diffusion, (2) the assessment of the contribution of the BSC to firms’ performance
and (3) the ways in which the BSC generates that contribution.
The reasons for which the BSC has been so broadly accepted are reflected in a
study by Akkermans and Van Oorschot (2005). Their research in an insurance

62
company in the Netherlands suggested that there are two primary reasons for
which the BSC concept has been widely accepted: firstly, with only a few well-
balanced numbers, it allows the monitoring of the performance of an entire
organisation. Secondly, the BSC concept is able to serve as a bridge between
various fields, both financial and non-financial. Similar suggestions have been
reported by other scholars. Malmi (2001), who conducted a study using semi-
structured interviews of 17 organisations in Finland known to have adopted BSC,
concluded that there are five reasons reinforcing an organisation’s decision to
adopt the BSC: 1) the concept translates strategy into action; 2) quality programs
and especially various types of quality awards are being sought by the organisation
in question; 3) BSC can be used to support change agendas; 4) BSC adoption can
serve as a response to managerial fads and fashions; and 5) BSC adoption can serve
as a response to abandonment of traditional budgeting.
With regard to the effects of BSC implementation, the usefulness of BSC in
organisations has been positively reported by several researchers. For instance,
Greatbanks and Tapp (2007) concluded that adoption of the BSC enables the
employees to clearly appreciate their roles, which in the end contributes to the
achievement of the organisation’s business plan and excellence goals. In a similar
vein, Crabtree and Debusk (2008), who conducted their research on public-sector
organisations, reported that after three years post-BSC adoption, organisations
outperformed their industry counterparts who chose not to adopt the BSC.
Crabtree and Debusk also concluded that companies yield greater surpluses after
implementation of the BSC. A similar conclusion was reached by de Geuser et al.
(2009), who also posited that the BSC concept’s positive contribution to an
organisation is derived from three sources: the improved translation of
organisational strategy into operational terms, the development of strategizing
into a continuous process and the closer alignment of various processes, services,
competencies and units of an organisation.

63
In a study using survey questionnaires in a retail sector company in Spain intended
to study the employees’ affective reactions to BSC adoption, Molina et al. (2014)
concluded that BSC implementation is significantly related to positive affective
reactions among employees. To the best of the researcher’s knowledge, at the
time of this writing, Molina and colleagues’ (2014) study is the only empirical
evidence that relates BSC usage with employees’ work-related attitudes. It
appears, therefore, that there remains much to learn about the effect of the BSC
on employees’ work-related approaches and outlooks.
Turning to the research settings in which previous research of the BSC has been
carried out, most studies have reported BSC adoption in developed countries
(Hoque 2014). Furthermore, Hoque’s review of accounting and management
journals found that only five of 114 published articles in accounting journals and
three of 67 published articles in management journals reported BSC practices in
countries with emerging economies. This evidence leads to the conclusion that
few researchers have been interested in the BSC’s implementation in emerging
economies. However, despite this lack of attention, BSC practices in countries with
emerging economies may reveal characteristics of the BSC that differ from those
found developed countries; this could perhaps contribute to a richer overall
understanding of BSC implementation. In addition to the scarcity of research on
the BSC in countries with emerging economies compared to that in countries with
advanced economies, the existing literature also indicates little interest in BSC
implementation in public-sector organisations. In his literature review, Hoque
(2014) found that of 114 articles on BSC adoption in accounting journals, only 23
were related to public-sector organisations. He also found that in business and
management journals, the results showed even smaller figures: only three of 67
published articles were set in a public-sector organisation. However, Greatbanks
and Tapp (2007, p. 847) suggested that there appeared to be a general consensus
amongst researchers that transposed private sector performance models do not
readily fit into a public-sector environment and that some adjustments of such
64
models is therefore needed. Clearly, then, the need for more research within the
public-sector has been confirmed. Expanding on previous work in this realm is
necessary in order to explore the practices and possibilities related to adoption of
the BSC.
As explained above, the BSC has been widely used by organisations across the
world. However, the literature has revealed that the import of the BSC may be
understood differently by managers both within and across organisations,
implying that the performance measurement systems being implemented in
organisations may not closely resemble the construct envisioned by Kaplan and
Norton (Soderberg et al. 2011). Madsen and Stenheim (2015, p. 68) suggested that
its wide berth for interpretation makes the BSC appealing to a large number of
potential users in different contexts. Furthermore, they posited that this
characteristic makes the concept plastic and flexible, and thereby less likely to
clash with a variety of local cultural values and cognitive frameworks.
From the existing literature, it is clear that the effect of external variables on BSC
implementation has not attracted the attention of many researchers. In fact, the
only study found in this realm was that of Hoque and James (2000), which was
conducted using survey questionnaires and involved 188 Australian
manufacturing companies. The authors examined organisation sizes, product life
cycle stages and strength of market positions as variables that may affect the
implementation of BSC. They suggested four interesting findings: first, larger
companies make more use of the BSC. Second, firms with higher proportions of
new products have a greater tendency to make use of measures that relate to
those new products. Third, company market position has not been found to be
associated with level of BSC usage. Fourth, BSC usage is associated with improved
performance, but the authors emphasised that this was not significantly
dependent on size, product life cycle or market position.

65
It is evident that there have been ambiguous definitions of the BSC concept in the
theoretical literature (Speckbacher 2003). Many previous studies have offered no
clarity as to the extent of BSC implementation in their responding organisations.
For instance, Ittner et al. (2003), who used data from US financial services firms,
assessed the relative ability of BSC approaches to explain firm performance. They
found little evidence that BSC is associated with OP (ROA and sales growth).
However, according to their explanation, many firms claimed that they had not
implemented BSC fully as Kaplan and Norton prescribed. However, they did not
explain what they meant by ‘fully’. Another example is a study by Papalexandris et
al. (2004), which was conducted in a large software development company in
Greece. The researchers concluded that the BSC is a necessary ‘good’ for
companies when it is used as a framework and guideline for successful strategy
communication and implementation and as a system for understanding what truly
creates value in a company, rather than as a pure performance measurement
system. However, in their study, Papalexandris et al. did not elaborate on the
depth of BSC implementation that had taken place in the organisations under
consideration. These two examples in the literature illustrate that there may be
confusion as to what BSC actually is. In light of such potential misperception,
several researchers have developed various series of typologies or classifications
of BSC use. The purpose of developing such typologies is to provide clearer
information regarding the extent of BSC use within an organisation.
There are four main groups of researchers who have posited various typologies in
explaining BSC levels of practice; they are: Speckbacher et al. (2003); Lawrie and
Cobbold (2004); Soderberg et al. (2011) and Perkins et al. (2014).

66
Table 3.2 Typologies in BSC
Speckbacher et al. (2003) Lawrie and Cobbold (2004) Soderberg et al. (2011) Perkins et al. (2014)
Type I BSC: a specific multidimensional
framework for strategic performance
measurement that combines financial
and non-financial strategic measures.
Type I BSC: primarily a performance
measurement system.
Level 1 BSC: performance measures
are derived from the organisation’s
strategy.
BSC 1.0 (Kaplan and Norton 1992):
Mixture of financial and non-financial
measures, interactions between four
different perspectives of OP and
number of measures balanced.
BSC 1.0.1 (Kaplan and Norton 1993):
beginning to focus on strategy,
provides an early ‘how to’ guide for
building a BSC and introduction of
strategic objectives.
BSC 1.1 (Kaplan and Norton 1996a):
more weight given to specific targets
and time to reach them, focus on
strategy: the four processes of
managing strategy, introduction of
causality and strategic linkages
between measures.
BSC 1.2 (Kaplan and Norton 1996b):
strategic linkages between strategic
objectives and BSC as part of a core
performance management system.
Type II BSC: a Type I BSC that
additionally describes strategy by using
cause-and-effect relationships.
Type II BSC: Type I BSC plus:
1. Measures are chosen to relate to specific strategic objectives, the design aim being to identify
Level 2a BSC: Level 1 plus the attribute
of balance.
Level 2b BSC: Level 1 plus the attribute
of causal linkages.
BSC 2.0 (Kaplan and Norton 2000):
introduction of strategy maps, how
organisational assets can be converted
into performance outcomes,

67
approximately 20-25 strategic objectives, each associated with one or more measures and assigned to one of four perspectives;
2. An attempt is made to visually document the major causal relationships between strategic objectives, laying out the results in a ‘strategic linkage model’ or strategy map.
introduction of intangible assets and
the cascading top-down approach.
BSC 2.1 (Kaplan and Norton 2004a, b):
further development of strategy maps,
how intangible assets can determine
the performance of critical internal
processes, and the bottom-up
approach.
Type III BSC: a Type II BSC that also
implements strategy by defining
objectives, action plans and results and
by connecting incentives with BSC.
Type III BSC: Type II BSC plus:
1. Destination statement 2. Strategic linkage model with activity
and outcome perspectives.
Level 3 BSC: Level 1 plus the attributes
of both balance and causal linkages.
BSC 3.0 (Lawrie and Cobbold 2004):
addition of destination statements and
more focus on strategic linkage model,
less on specific measures.
BSC 3.1 (Cobbold and Lawrie 2002):
reduction in number of perspectives
used
Level 4a BSC: Level 3 plus the attribute
of double-loop learning.
Level 4b BSC: Level 3 plus the attribute
of linkage to compensation.
Level 5 BSC: Level 3 plus the attributes
of both double-loop learning and
linkage to compensation
Source: Researcher’s compilation

68
3.5 The BSC in public-sector organisations
Kaplan and Norton (2001a) posited three benefits of the BSC concept for the
management of not-for-profit organisations: first, bridging the gap between vague
mission or strategy statements and day-to-day operational measures; second,
facilitating a process by which an organisation can achieve strategic focus; and
third, shifting the organisation's focus from programs and initiatives to the
outcomes that the programs and initiatives are intended to accomplish. However,
the authors realized that it is very difficult to adopt the BSC to public-sector
organisations due to the difficulty of determining strategies. The same concern
was voiced by Wisniewski and Olaffson (2004) and Hoque (2014), who argued that
developing and using the BSC within the public-sector, with its varied social and
political contexts, is a much more complex undertaking than it is in the private
sector.
Moreover, Kaplan and Norton (2001a) highlighted that most initial scorecards in
public-sector feature an operational excellence strategy that treats their mission
as a given and aims to help employees do their work more efficiently. Therefore,
the BSC as conceived in public-sector organisations tends to be closer to KPI
scorecards than strategy scorecards. According to Kaplan and Norton (2001a),
apart from the difficulty of determining strategies, one major problem in
implementing the original BSC concept is the placement of the financial
perspective at the top. For that reason, many public-sector organisations
rearrange the construction of the BSC by changing the hierarchy, with the
customer or constituent perspective being considered the most important.
Dobrovic et al. (2008) proposed several preconditions that should be in place in
public-sector organisations for successful implementation and effective
application by means of the BSC: 1) the guidelines and strategic goals sent by the
government to state and public organisations need to be clear and unambiguous;
2) a public organisation’s management needs to have insight into the application

69
of the BSC method and partly change their managerial habits; 3) the operative
procedures for the application of the BSC method need to be clearly defined; and
4) the organisation needs to have a central information system (IS) with which the
BSC implementation application or software can be connected.
Kaplan and Norton (2001a) suggested that, as an adjustment from the original BSC,
the organisation’s mission should be placed at the highest level of its scorecards.
Moreover, they proposed three layers with a modified framework consisting of
costs incurred, value created and legitimising support as a substitute for the
financial perspective in the original BSC construction. The costs incurred
perspective highlights the importance of cost efficiency where the measure of cost
should include both the expenses of the agency and the social cost that it imposes
on citizens and other organisations through its operations. The value created
perspective identifies the value created by the agency to citizens; it is problematic
and difficult to measure, but the BSC does enable organisations to identify
outputs, if not outcomes, from its activities and to measure these outputs. As for
legitimizing support, important ‘customers’ for any government agency are its
donors, the organisations that will provide funding for the agency. In order to
ensure the continuation of its funding sources, public-sector organisations must
strive to achieve the objectives of those sources and, ultimately, of citizens and
taxpayers. Having determined the objectives for the upper level, public-sector
organisations can then continue identifying internal business processes and
learning and growth objectives to ensure the accomplishment of strategies in the
areas of costs incurred, value created and legitimizing support.
According to Wisniewski and Olaffson (2004) there have always been efforts in the
public-sector organisation context to confirm that performance indicators are not
simply focused on costs but also attend to the issues of efficiency and
effectiveness. There is also an implied logical hierarchy in the perspectives for a
private sector company where the ultimate goal is still financial. Learning and

70
growth is important because it allows a company to improve its processes.
Improved processes, in turn, are important because they allow the company to do
better for its customers, which in turn leads to improved financial performance.
Clearly, this implied hierarchy is not relevant for a public-sector organisation.
Niven (2002) explains that the word ‘balance’ in the balanced scorecard relates to
three areas: first is the balance between financial and nonfinancial indicators of
success. Second is the balance between internal and external constituents of the
organisation: shareholders and customers represent the external constituents
expressed in the BSC, while employees and internal processes represent internal
constituents. The BSC recognizes the importance of balancing the occasionally
contradictory needs of all these groups in effectively implementing strategy.
Niven’s third area for balance is that between lag and lead indicators of
performance. Lag indicators generally represent past performance, where typical
examples might include customer satisfaction or revenue. Niven also emphasised
that financial measures give information as to whether the chosen strategy
implementation and execution are leading to improved bottom-line results.
Leading indicators of customer performance are conveniently developed through
the translation of the organisation’s customer value proposition. Determining the
effect of these leading indicators on customer performance is measured by
developing core outcome measures of customer success. The internal process
perspective of the BSC describes the key processes and activities that ultimately
drive customer and financial performance. Using the BSC as a management tool
provides organisations with the opportunity to uncover entirely new processes in
their pursuit of customer and financial outcomes. The value proposition outlined
in the customer perspective will drive the choice of internal process measures.
Customer-intimate organisations focus on customer knowledge and information
technology capabilities. Efficient supply-chain operations are the critical enabler
of the operationally excellent company. Product leaders will rely on the innovation
process to drive customer outcomes.

71
The measures in the employee learning and growth perspective are in fact the
enablers of the other three perspectives. These indicators ensure that employees
possess the right skills, can access the appropriate information, and are motivated
and aligned with organisational goals. Effective employee learning and growth
measures help sustain an organisation’s ability to grow and improve as its
environment inevitably changes.
However, Speckbacher (2003) argued that simply moving the financial perspective
to the bottom and putting customers on top is not the answer to the problem of
adjusting the BSC for non-profit organisations. He urged that it is particularly
important for non-profit performance management to clearly define 1) what key
stakeholders must offer the organisation in order to fulfil the mission and 2) how
to satisfy these stakeholders in return. Speckbacher posited that the BSC model
acknowledges the existence of different stakeholders, especially customers and
shareholders, but presupposes that shareholders are a primary part of the
stakeholders and that this perspective should therefore be placed at the top of the
BSC. Speckbacher stated that, in BSC implementation for non-profit organisations,
the stakeholder and customer perspectives should come first and second,
respectively.
Niven (2002) noted that the BSC helps organisations to manage two essential
issues: effective OP measurement and the implementation of strategy. Niven
(2002 and 2008) revealed that there are many criticisms of overabundant financial
measurements: they are inconsistent with today’s business reality, they drive by
looking in the ‘rear-view mirror’, they tend to reinforce functional silos, they
sacrifice long-term thinking, and they are irrelevant to many levels of the
organisation. Niven (2002) stated that financial measures are lag indicators since
they are outcomes of activities previously taken, but that the BSC supports lag
indicators with lead indicators, which are the drivers of future economic

72
performance. Niven also suggested that lead indicators and lag indicators serve as
translations of the organisation’s strategy.
Meanwhile, Holmes et al. (2006) stated that the financial perspective of the BSC
for government organisations is perceived as a measure of financial accountability
given that government does not make a profit. The authors formulated four
perspectives of the BSC for government: 1) the financial perspective: whether
spending its budget allocation is consistent with organisational mission and public
law; 2) citizen service: whether the public government institution meets the
mandated needs of the people defined by its mission; 3) internal work processes:
whether work processes are continuously improving efficiency and quality service
to public; and 4. learning and growth of employees: whether employees’ human
capital and supportive infrastructure have satisfied employee needs. As can be
seen from these points, Holmes and colleagues’ (2006) idea of applying BSC
concepts in public organisations is substantially different from Niven’s scheme,
especially in terms of the role of the financial perspective. Both ideas are plausible,
particularly in view of Kaplan’s (2001b) emphasis that the BSC is not a ‘straitjacket’;
it rather offers opportunities to learn and adapt strategies to dynamic conditions
as well as to become more responsive to new ideas emerging from within the
organisation.
Using survey data from municipal governments in the USA and Canada, Chan
(2004) revealed the factors most frequently cited as necessary for successful
implementation of the BSC: top management commitment and leadership buy-in;
departmental, middle-manager and employee participation and buy-in; a culture
of performance excellence; training and education; keeping it relatively simple,
easy to use and understand; clarity of vision, strategy and outcome; linking the
BSC to incentives; and resources to implement the system. Support from senior
management and buy-in from employees, then, are among the factors critical to
implementing the BSC successfully.

73
According to Niven (2002, p.177), cause-and-effect linkages of measures combine
to describe the organisation strategy, which outlines the specific path to the
success of the strategy and describes the ‘how’ of value creation derived from a
combination of measures. Cause-and-effect linkages also serve as a diagnostic tool
to ensure that the measures combine in such a way as to fully and coherently
describe the strategy. Cause-and-effect linkages are best developed by working
top-down from the financial perspective through the customer, internal process,
and ultimately, employee learning and growth perspectives. Within each
perspective the lagging indicators of success are identified, along with the
corresponding drivers of performance (leading indicators), which lead to
successful outcomes. Niven (2002, p.221) mentioned that to maximize the
effectiveness of the BSC, every group within the organisation should have the
opportunity to develop links to the BSC that demonstrate how they are
contributing to the company’s goals. Moreover, he (p.221) elaborated that “to
successfully cascade the BSC, everyone in the organisation must understand the
operational and strategic significance of the objectives and measures appearing
on the scorecard. Organisations may use a combination of communication and
education efforts to ensure that this understanding is present before attempting
to cascade the scorecard. The essence of cascading the scorecard to lower levels
of the organisation is captured in the word ‘influence’, that is, the ability to
produce an effect. Strategic business units should examine the highest-level
organisational scorecard and ask: “What can we do at our level to help the
organisation achieve its goals? Which objectives and measures are we in the best
position to influence?” Departments and groups within business units must ask a
similar question: “What can we do at our level to help the business unit achieve
its goals? Which of their objectives and measures can we influence?”
Furthermore, Niven (2008, p.258) proposed that cascading in the public-sector
organisation should be considered more of a necessity than a luxury or an option

74
presented by the BSC, because achieving results in the public-sector organisation
requires teamwork from a vast web of groups that span levels and service
functions. Niven (p.269) also emphasised that, apart from aligning employee
activities with organisational strategy, cascading has been consistently cited as a
key factor in the success of BSC programs. Niven noted that cascading the BSC to
the individual employee level can mitigate, if not eliminate, many of the issues
encountered in the normal performance appraisal process. He also asserted that
“there are at least five benefits to be attained when employees have personal
scorecards: First is building awareness of the BSC. Developing scorecards at the
individual level provides yet another opportunity to share the principles and
techniques inherent in the BSC system with all employees. Second is generating
commitment to the scorecard. Increased involvement in virtually any activity
tends to increase commitment to that cause; this is also the case with the BSC.
Having employees learn about the scorecard and develop their own series of
linked objectives and measures boosts support from this critical audience. The
third benefit is increasing comprehension of aligned scorecards. In order to
develop their individual BSCs, employees must first understand the objectives and
measures appearing in all cascaded scorecards, from the high-level organisational
scorecard and the business unit scorecard to the team or department’s. Thus,
cascading supplies an outstanding training opportunity. Fourth is the benefit of
offering a clear line of sight from employee goals to organisational strategy.
Developing personal BSCs that align to team or department scorecards allows
every employee to demonstrate how his or her specific actions are making a
difference and leading to improved overall results. Fifth is building support for the
goal-setting process. Using the BSC can breathe new life into often tired and
irrelevant employee goal-setting processes”.
The study of BSC usage in public-sector organisations has attracted many
researchers. Overall, the study of BSC practice in public-sector organisations may
be divided into groups based on similar settings:
75
- Healthcare organisations: for instance, Aidemark (2001); Radnor and Lovell
(2003); and Chang et al. (2008);
- Higher education institutions: for instance, Schobel and Scholey (2012); Beard
and Humprey (2014); Hladchenko (2015); and
- Government institutions: for instance, Chan (2004), Wisniewski and Olaffson
(2004); Greatbanks and Tapp (2007); Sharma and Gadenne (2011).
Apart from improving effectiveness and efficiency, the implementation of the BSC
in a public-sector organisation can lead to benefits at many different levels
(Dreveton 2013, p. 131). Dreveton concluded that many public-sector
organisations have introduced the BSC to improve performance. However,
according to the present literature review, at the time of this writing, no empirical
evidence has supported the statement that improvement of performance is a
direct result of implementing the BSC. For instance, a study by Inamdar and Kaplan
(2002) was conducted using the qualitative method (interviews) in nine healthcare
provider organisations. The authors stated that the BSC enabled organisation
executives to address strategic management challenges in a highly complex and
uncertain environment. Likewise, Niven (2008) claims that several benefits can be
expected from adopting the BSC concept: demonstrating accountability and
generating results, improving performance as related to organisational mission,
attracting scarce resources (funding and employees), creating a focus on strategy,
producing information rather than data, engaging in self-preservation, driving
change and inspiring trust. However, apart from the examples provided, Niven did
not justify the basis of these positive effects. Research regarding the benefits
conferred by the application of the BSC concept may substantiate Niven’s (2008)
claims.
3.6 The associated effects of using the BSC system
With regards to benefits that can arise upon implementation of the BSC, Johnsen
(2001) enumerated three: first, the BSC is a versatile tool for developing,

76
discussing and selecting the most relevant decision-taking and performance
indicators in complex organisations such as political bodies. Second, the BSC
provides a practical approach to judge the basic premise in information
economics: the benefit of information should exceed its cost. Third, it educates
busy stakeholders, managers and employees in management control in complex
organisations. In terms of the associated effects of the BSC, the present study
categorises the effects into several areas: organisational performance, strategy
clarity, managerial, efficiency and effectiveness.
3.6.1 Effects on organisational performance
The existing literature reveals that there are several researchers who studied the
effects conferred by the application of the BSC, especially in organisational
performance (OP). For instance, the Hoque and James (2000) took samples from
66 Australian companies. They concluded that BSC implementation is positively
correlated with company performance, but that the connection does not depend
significantly on organisation size, product life cycle, or market position. Davis and
Albright (2004), who examined BSC implementation using a quasi-experimental
study in a banking organisation in the USA, reported that bank branches in the BSC
group outperformed the non-BSC branches on a common composite financial
measure. Another example is a study by de Geuser et al. (2009), which was based
on survey data collected from 76 business units in Switzerland, the UK, Germany,
Austria, France and the Netherlands. The authors concluded that the BSC’s
contribution depends to a large extent on three principles of Kaplan and Norton’s
SFO model: a better translation of the strategy into operational terms; the fact
that strategizing becomes a continuous process; and the alignment of various
processes, services, competencies and units of an organisation. Considering the
three abovementioned examples of BSC research, there is reason to believe that
there is a close relationship between the way in which the BSC is implemented and
its associated performance effects (Madsen and Stenheim 2015).

77
Not all research reported positive effects of the BSC on OP. For instance, a study
by Ittner et al. (2003), which involved 140 financial services companies in USA
using survey method, concluded that the BSC process, economic value
measurement, and causal business modelling are associated with higher
measurement system satisfaction but exhibit almost no association with economic
performance. In their article, they did not provide information about the level of
BSC implementation in the responding companies. This information is, however,
important as it may be that the measures the companies used were not accurate
(Malina and Selto 2001); in addition, it is possible that the responding companies
did not use the BSC as strategy for communication and implementation
(Papalexandris et al. 2004). This should be clear, because the effectiveness and
benefit of BSC implementation is highly dependent on the content of the
implementation process that is used (Kaplan and Norton 1996b; Braam and Nijsen
2004; Papalexandris et al. 2005).
As has been illustrated in the analyses of the studies mentioned here, the
empirical evidence regarding the relationship between BSC implementation and
associated organisational effects has been dominated by studies on BSC practice
in private sector organisations. To the best of the researcher’s knowledge, similar
studies in public-sector organisational settings have not yet been made available.
3.6.2 Effects on strategy clarity
With regards to benefit of the BSC concept for an organisation’s strategy clarity,
Kaplan and Norton (1996a,b; 2001a,b,c) claimed that the BSC clearly
communicates the organisation’s strategy to its employees and, when correctly
understood and properly implemented, allows employees to see how they
contribute to the organisation’s strategic goals by translating these goals into
specific, measurable activities. In a similar vein, Greatbanks and Tapp (2007)
reported that implementation of the BSC system within their case organisation
enabled employees to clearly appreciate their role and focus on delivering

78
performance-related measures that supported organisational strategy. As such,
clarity of role appears to have a positive influence on the achievement of the
organisation’s business plan and excellence goals regarding the delivery of
customer service.
Another supporting result emerged from the work of Hladchenko (2015), who
used a comparative analysis of the BSC in four institutions of higher education in
Germany and Austria to argue that the BSC provides a systemic view of
institutional strategy in those institutions. Hladchenko concluded that the BSC
makes it easier for the staff in each faculty to understand the strategic goals of the
university and that it helps the staff to understand their role in process of the
implementation of the university’s overall strategy. Furthermore, the author
explained that the formation of the BSC framework at different levels of the
university allowed the employees to clearly understand the strategic goals and the
objectives that they should be pursuing in their everyday professional activities.
Cheng and Humpreys (2012), who conducted a study in an experimental
laboratory, likewise asserted that the BSC framework has broader implications for
organisational decision making. By clearly articulating an organisation’s strategy
to managers, the strategy map allows managers to form a more useful cognitive
representation through which external informational items can be interpreted and
incorporated in strategic judgments.
3.6.3 Managerial effects
Kaplan and Norton (1996b) claimed that, when the BSC is correctly implemented,
its adoption enables managers to monitor and update their organisations’
strategies as their environments change. The usage of BSC has also shown varied
results in terms of managerial perspective. For instance, an explorative study by
Werner and Xu (2012) found that the BSC helps enterprise leaders manage their
operations and execute their strategies. Similar results stemmed from a study by
Hoque and Adams (2011). The authors suggested the presence of a positive
association between BSC implementation and managers’ perceptions of the
79
benefits of the BSC system. Another similar study, that of Burney and Swanson
(2010), reported that the inclusion of non-financial measures in some BSC
categories is positively related to managers' job satisfaction and may therefore
encourage a long-term focus on decision making.
3.6.4 Effects on efficiency and effectiveness
Several studies on BSC practice in the public-sector have reported an associated
effect between the BSC and efficiency and effectiveness. For example, Hoque and
Adams (2011), after analysing data from 51 government departments in Australia,
found indications that government departments perceived the BSC performance
measures as enhancing their programs’ efficiency and effectiveness. Similarly,
Woods and Grubnic (2008), at the conclusion of their study of the BSC in
Hertfordshire, affirmed that the BSC system had helped turn the focus to
outcomes rather than outputs as indicators of operational effectiveness.
3.7 Research gaps
The literature reveals that there have been many studies of the BSC; they cover
both the theoretical and practical aspects (Madsen and Stenheim, 2015). Hoque
(2014, p. 33) claimed that the BSC has generated enormous interest in the
academic and industrial communities (Barnabe and Busco 2012; Kraus and Lind,
2010; Malina, Nørreklit, and Selto 2007; Nørreklit, Nørreklit, Mitchell, and
Bjomenak 2012; Salterio, 2012).
However, there remain some areas and topics that have received little attention
from researchers. The present literature study has identified several gaps in the
literature. First, most studies reported on the practice of BSC within the private
sectors of countries with advanced economies. Second, the respondents surveyed
in the literature were predominantly executives. Third, the properties of the BSC
have not been considered in the studies. Fourth, clarity regarding the level of BSC

80
implementation has been lacking. Fifth, the effect of organisational attributes on
BSC implementation has rarely been discussed. Sixth, the influence of BSC as a new
management model on employees’ attitudes has not been studied. Seventh, the
effect of the BSC implementation on OP remains unexplored. A further description
of each of these research gaps is provided in the following subsections.
3.7.1 Previous research settings
The adoption and use of balanced approaches to performance management have
been widespread around the world (see Rigby and Bilodeau 2009, 2011, 2013),
and the research literature on the BSC has evolved considerably over the last 20
years (Madsen and Stenheim 2015); however, empirical evidence from the private
sector appears to greatly exceed that stemming from public service environments
(Ittner and Larcker 1998; Johnsen 2001; Radnor and Lovell, 2003). Similar findings
have arisen from the present literature review, which reports that most studies
thus far have been conducted in the context of the advanced economies of
developed countries (see Appendix 1).
Furthermore, in a comparison of the private and public-sectors, it appears that the
private sector has dominated the research settings in studies on the BSC (see
Appendix 2). This is unfortunate for public-sector organisations wishing to adopt
the BSC framework; there seems to be a common understanding that the direct
adoption of private sector performance models does not work well in public-
sector organisations and that some adjustment of such models is generally
necessary (Kaplan 2001a; Radnor and McGuire 2004; Wisniewski and Stewart
2004). As an extension, organisations in developing countries adopting the BSC
based on the experiences and practices of organisations in advanced economies
may find the conditions irrelevant to the conditions specific to settings in an
emerging economy. It is for this reason that the study of BSC in developing
countries with emerging economies, and in particular in government-type
organisations, is an important addition to existing knowledge.

81
3.7.2 Respondent representativeness
Previous studies have mainly sought organisations’ executives as respondents;
executives are, because of their jobs, in positions of relatively high authority (see:
Hoque 2000; Kloot and Martin 2000; Inamdar and Kaplan 2002; Burney 2010).
However, it is essential to involve lower-level management and staff in a research
study, because the BSC also involves them as actors in the implementation
process. The BSC concept apply top-down approaches during the planning phase
(Kaplan and Norton 1996), however, the system shifts to a bottom-up process
during execution of the strategy. Therefore, it is important to investigate whether
the planning process and execution of the organisation’s strategies have actively
involved all of the elements of human resources in the organisation; this can be
done by proportionately involving lower-level management and staff as
respondents in the research. In addition, involving non-executive-level individuals
as respondents enables the researcher(s) to examine how the PMS using the BSC
operates from a broader range of perspectives and experiences.
3.7.3 Clarity of the BSC implementation level
Unfortunately, when evaluating the practical consequences of BSC
implementation, most existing studies do not provide information as to how well
the BSC has been implemented within the organisations under consideration.
Regarding clarity in terms of the BSC implementation level within the responding
organisation, Perkins et al. (2014) claimed that it was evident from recent studies
of the BSC that the distinctions between different versions of the scorecard were
still not being made explicit. Burkert et al. (2010) asserted that the accurate
determination of whether companies make use of the BSC is necessary to assess
its performance implications and that any failure in this regard undermines the
validity of the study as a whole. Hence, there is great need for a study of BSC
practices that explicitly explains the level of responding organisations’ BSC

82
implementation in order to justify the associations demonstrated, if any, between
BSC implementation and organisation performance.
3.7.4 Lack of interest in the properties of the BSC
Despite being foundations of the BSC system, the properties of the BSC—strategy
maps, strategy execution and strategy cascading—have attracted little attention
in research studies (Hoque 2014). With these three factors, the BSC enables the
assessment of organisations and the evaluation of organisational objectives, both
of which lead proponents to see the BSC as a comprehensive management system.
The findings of this literature review reveal that there is a need for future studies
to investigate the use of strategy maps within organisations and the relevance of
strategy execution to strategy maps, with particular attention to whether the
strategies within organisations’ strategy maps are carried out by employees at the
lower levels. Given this gap in the research, there is also a need for further studies
to explore strategy cascading in order to provide an objective view of the
alignment process and to identify determinant factors in particular.
3.7.5 The effect of organisational attributes on BSC implementation
To the researcher’s knowledge, only very few studies (for instance, Malina and
Selto 2001; Sharma and Gadenne 2011) have studied BSC implementation in a
large organisation. Another area that has received scant attention in the extant
research is the use of the BSC in different types of organisations, particularly those
of different sizes (Madsen and Stenheim 2015). To the best of the researcher’s
knowledge, at the present time, only a few studies have reported on the
association between organisation size and BSC usage (Hoque and James 2000;
Speckbacher 2003). Both studies, however, took place in private sector
organisations. Hence, it is relevant to examine the effect of organisation size on
BSC implementation in public-sector organisations.

83
Kaplan and Norton (1996b, p. 76) explained that managers ensure that individuals
at all levels of their organisations understand the long-term strategy and that both
departmental and individual objectives are aligned with it. Regarding the role of
strategizing within the organisation, a study by Mantere (2005) defined strategists
as top, middle and operational managers and project managers, as cited in
Jarzabkowski et al. (2007). Despite claims about the role of managerial positions,
to date, no study has examined the ways in which differences in employees’ roles
might affect BSC implementation.
3.7.6 The influence of the BSC as a new management model on employees’ professional behaviours
The introduction of the BSC as a relatively new management model may have
influenced employees’ reactions and perceptions. These may have positive or
negative effects on the organisation. The available empirical evidence as to how
the BSC affects employee behaviour, however, is limited.
The researcher is aware of only one study (Molina et al. 2014) that investigates
the influence that BSC implementation has on organisational climate, employee
commitment levels, job satisfaction and job dedication. The literature reveals that
there are many ways of defining employees’ perceptions of their public-sector
organisations, including OC and PSM. Following Kim’s (2015) assertion that OC and
PSM are two individual-level factors that may drive OP in a public-sector
organisation, it appears that research regarding the BSC’s potential to influence
OC and PSM is certainly needed.
3.7.7 Associated effect of BSC implementation on organisational performance
Perkins et al. (2014) expressed surprise that, considering the large body of
literature regarding the BSC, there is relatively little evidence as to whether
implementation of the BSC leads to an increase in OP. Furthermore, with the
exception of a study by Davis and Albright (2004), the researcher is aware of no

84
studies that have investigated the associated effects of the BSC or considered the
manifestation of differences in performance before and after BSC
implementation. Further research in this area is recommended in order to reach a
fuller understanding of the effects of BSC implementation on performance (de
Geuser et al. 2009; Burkert et al. 2010). However, the undertaking such an exercise
is dependent on a specific description of the BSC being implemented. In the
absence of details, it would be difficult to assess whether a failure to show
improvements in performance was due to the implementation strategy or
whether it perhaps stemmed from the choice of an inappropriate BSC.
Many studies regarding the adoption of the BSC in the public-sector have been
conducted in developed countries with advanced economies (see Appendix 2).
Developing countries adopting the BSC based on experiences and practices in
advanced economies may find these to be irrelevant to their specific conditions. It
is thus important to add to the existing body of knowledge by studying the BSC in
developing countries and emerging economies, particularly in government-type
organisations.

85
3.8 Chapter summary
The purpose of this chapter was to explore and review the theoretical perspectives
and practices of BSC implementation. The need to provide the public with
accountable and effective results has increased pressure for the governmental
sector to refine their PMS. Brunnson and Sahlin-Anderson (2000) mentioned that,
in many cases, public-sector reforms have focused on changing ways of managing,
controlling, and accounting for the delivering of services. Management
intervention has become a potential option to accelerate public-sector reform
process.
In their efforts to accommodate the reform process, many public institutions have
been attracted to the BSC system. Although the BSC was initially introduced for
private institutions, government agencies and non-profit agencies are keen to
implement the system as it promises to assist in achieving improvements in
accountability, collaboration, alignment and resource allocation as well as
enhanced financial results and strategy execution. Scholars have conducted
research on a variety of topics around the BSC, and some have been critical of the
concept and its implementation. This chapter therefore also discusses some
fundamental criticisms of the BSC’s foundational concepts and theoretical
assumptions. Some of these included Neely et al. (1995), who criticised the BSC’s
lack of a competitive dimension, Nørreklit (2000, 2003 and 2012), who
disapproved of the causality linkage process claimed by BSC proponents,
Kasurinen (2000), who stated that BSC does not pay enough attention to the
context of change implementation and Voelpel et al. (2006) who claimed that BSC
could potentially put the organization at risk.
The penultimate section of this chapter identified several gaps in the existing
literature. These discoveries guided the design of the research framework, as
discussed in the following chapter.

86
Chapter 4: Research Framework
4.1 Introduction
The aim of this chapter is to develop a conceptual framework of BSC
implementation in the public-sector organisation as a response to the research
gaps identified in the previous chapter. Moreover, based on the research gaps,
this chapter presents several variables that are assumed to influence or be
influenced by BSC implementation. This chapter explores each variable in order to
construct a hypothesis in connection with the implementation of the BSC.
The remainder of this chapter is organised as follows. In the following section, the
research objectives and questions are presented. This chapter then briefly
elaborates on the research gaps which led to the choice of the variables to be
examined in this research. In the next section, BSC implementation is explored in
order to formulate a framework that will be applied to evaluate BSC
implementation. Subsequently, organisation size and employee roles are explored
for the purpose of discovering how these factors might affect BSC implementation.
The next two sections discuss OC and PSM, respectively, with the aim of stating
the likelihood of BSC influence on those two related elements. The subsequent
section discusses OP, which is influenced by BSC implementation. The conceptual
framework that forms the focus for this study is then presented. In the final
section, a summary of this chapter is presented.
4.2 Research objectives and research questions
This study addresses four research objectives:
i. Explore the theoretical perspectives of balanced scorecard in order to identify
the key success factors of balanced scorecard implementation;
ii. Review balanced scorecard practices in order to clarify organisational factors
that affect the balanced scorecard as well as the ways in which the balanced

87
scorecard implementation affect employee behaviour and organisational
performance;
iii. Develop a conceptual framework of balanced scorecard implementation in
the public-sector organisation to describe the relationship between
organisational factors and the balanced scorecard and define the ways in
which its implementation contributes to employee behaviour and
organisational performance; and
iv. Test and examine the conceptual framework in order to discover the extent
to which organisational factors influence the implementation of the balanced
scorecard and the extent to which balanced scorecard implementation is
related to employee behaviour and organisational performance within the
public-sector organisational context.
Furthermore, based on the research objectives, this study addresses the following
six research questions which were specifically designed in relation to data
collection from public-sector organisations in Indonesia:
RQ1. How do strategy-focused organisations’ (SFO) principles relate to each other
within implementation of the BSC?
RQ2. To what extent are organisational factors associated with the
implementation of the BSC?
RQ3. Do the SFO principles within the implementation of the BSC have a
relationship with organisational commitment?
RQ4. Do the SFO principles within the implementation of the BSC have a
relationship with public service motivation?
RQ5. How does public service motivation relate to organisational commitment
within an organisation implementing the BSC?
RQ6. How is BSC implementation associated with organisational performance?

88
4.3 Research gaps and hypothesis construction
As outlined in the penultimate section of Chapter 3, seven research gaps have
been identified:
1. Reports on the practice of BSC outside the private sectors of countries with advanced economies;
2. Reports involving respondents who are not at the executive level;
3. Research that provides indications of BSC implementation levels;
4. Studies concerning the properties of BSC;
5. Reports on the effects of organisational attributes on BSC implementation;
6. Explorations of the influence of BSC as a new management model on employees’ behaviours;
7. Studies on the associated effect of the BSC implementation on OP.
This research attempts to fill the seven research gaps indicated above. With regard
to the first three research gaps (1-3), this research selected responding
organisations (CEOs) that have implemented the BSC to the individual level.
Details regarding the choices of responding organisations as well as the process of
the survey sampling will be further discussed in Chapter 5. With respect to the
fourth research gap, this research applies SFO principles, enabling the researcher
to explore the BSC properties of strategy mapping, strategy cascading, and
strategy alignment.
Turning to the fifth research gap, only a few studies (Hoque and James 2000;
Speckbacher 2003) have examined the influence of organisational size on BSC
implementation. In addition to organisational size, the present study examines
how employees’ roles affect the implementation of the BSC. With regard to the
sixth research gap, this research focuses on two employee behaviours: OC and
PSM. According to Camilleri and Heijden (2007, p. 242), OC and PSM have
important implications for both employees as individuals and the organisations

89
that employ them. The selection of OC as one of the observed variables follows
studies by Vroom (1964) and Steers and Porter (1983) as cited in Crewson (1997,
p. 508), who suggested that OC is regarded as a better predictor of employee
behaviour than other attitudinal measures. Meanwhile, the selection of PSM is
based on the understanding that PSM is an important element in public
organisations that induces employees to perform meaningful public service
(Brewer and Selden 1998). Despite the important role of PSM, however, the
research on how management practices may influence the level of PSM has not
been of interest to researchers. Therefore, the current research investigates the
potential effects of management practices, in this case the implementation of the
BSC, on the level of PSM. Turning to the seventh and final research gap, this study
examines BSC implementation’s potential effects on performance in public-sector
organisations.
The subsequent sections provide more detailed discussions of SFO principles,
organisation size, employee roles, OC, PSM, and OP.
4.3.1 BSC implementation: using the principles of the SFO model
The principles of the strategy-focused organisation (SFO) model were introduced
by Kaplan and Norton in 2001. Based on their study on private companies
implementing BSC, Kaplan and Norton (2001c) posited that the successful
implementation of the BSC entailed the adoption of five principles: strategy
translation, strategy alignment, strategy as ‘everyone’s everyday job’, strategy as
a continuous process, and leadership involvement. The authors further elaborated
the meaning of each principle as follows: first, strategy translation means that the
organisation translates the strategy into a strategy map to create a clear point of
reference for all employees. Second, strategy alignment is based on the
understanding that organisational strategies should be linked to and integrated
into the lower units of the organisation and all individuals. Third, strategy as
everyone’s everyday job highlights the importance of employees’ understanding

90
of the organisational strategy and the need for employees to carry out daily
professional activities that contribute to the organisational strategy. Fourth,
strategy as a continuous process describes three actions that an organisation
should take: link strategy and the budgeting process, hold routine management
meetings to review strategy, develop a process for learning and strategy
adjustment. Fifth, leadership involvement stresses the point that the most
important component of organisational success is ownership and active
involvement on the part of the executive team.
At the time of this writing, de Geuser et al. (2009) were the only scholars to have
used the SFO model as a way to evaluate BSC implementation. They found that
three of the SFO principles—strategy translation, strategy alignment and strategy
process—have a significant influence on OP. This research, however, assumes that
all five of the SFO principles represent BSC implementation in public-sector
organisations. This assumption leads to the following hypothesis:
H1. SFO principles correlate positively with each other within the implementation
of the BSC.
4.3.2 Organisation size and employees’ roles
As quoted in Hoque and James (2000, p. 3), the contingency theory of
organisations developed by Burn and Stalker (1961), Woodward (1965), and
Lawrence and Lorsch (1967) suggested that organisation size may affect the way
organisations design and use management systems. With regard to the use of the
BSC as a management system, the researcher is aware of only two studies (Hoque
and James 2000 and Speckbacher 2003) that have examined the effect of
organisation size on BSC implementation. Both studies reached the same result,
finding that large organisations are more likely to use the BSC concept. Based on
these two previous findings, the researcher assumes that large organisations have
more influence over the implementation of BSC than do small organisations. As

91
this thesis applies SFO principles to represent BSC implementation, the researcher
formulated the hypotheses as follows:
H2. The large organisation has more influence on the implementation of BSC than the small organisation. H2a. The level of BSC strategy translation is higher for employees working in large
organisations than for employees working in small organisations;
H2b. The level of BSC strategy alignment is higher for employees working in large organisations than for employees working in small organisations;
H2c. The extent to which BSC strategy becomes everyone’s everyday job is greater for employees working in large organisations than for employees working in small organisations;
H2d. The extent to which BSC strategy becomes a continuous process is greater among employees working in large organisations than among employees working in small organisations;
H2e. The level of leadership involvement in BSC is higher in large organisations than in small organisations.
Turning to employee roles, to this point, no study has revealed how employee
roles affect BSC implementation. In the present study, the researcher divides
employee roles into two types: roles in which employees have opportunities to
discuss their organisation’s strategic objectives and roles in which they do not. The
differentiation is between positions that are structurally one level below the head
of the organisation and those that are two or more levels below the head of the
organisation. This differentiation is based on the fact that employees who hold
strategic positions are well informed about organisational strategies due to their
opportunity to discuss them with the organisational head. Thus, it is reasonable to
assume that employees with strategic roles have more influence on BSC
implementation than do others. This line of reasoning leads to the following
hypotheses:

92
H3. Employees holding strategic roles have more influence on BSC implementation
than other employees.
H3a. The level of BSC strategy translation is higher among employees holding strategic roles than among other employees;
H3b. The level of BSC strategy alignment is higher among employees holding strategic roles than among other employees;
H3c. The level of implementation of the BSC strategy as everyone’s everyday job is higher among employees holding strategic roles than among other employees;
H3d. The level of BSC strategy as a continuous process is higher among employees holding strategic roles than among other employees;
H3e. The level of BSC leadership involvement is higher among employees holding strategic roles than among other employees.
4.3.3 Organisational commitment and public service motivation
OC has many definitions; one of the most frequently cited is that of Porter et al.
(1974, p. 604), who defined OC as the relative strength of an individual’s
identification with and involvement in a particular organisation. The authors
suggested that OC can be characterized by three traits: first, a strong belief in and
acceptance of the organisation’s goals and values; second, a willingness to exert
considerable effort on behalf of the organisation; and third, a strong desire to
maintain membership in the organisation. Buchanan (1974, p. 533) viewed OC as
a ‘partisan, affective attachment to the goals and values of an organisation, to
one's role in relation to goals and values, and to the organisation for its own sake,
apart from its purely instrumental worth’. Buchanan also considered
organisational commitment to consist of three components, each of which is
measured with an independent series of questionnaire items. The first component
is identification, or adoption of the goals and values of the organisation as one's
own; the second is involvement, which he defined as psychological immersion or
absorption in the activities of one's work role; and the third component is loyalty,

93
a feeling of affection for and attachment to the organisation. According to Meyer
and Allen (1991, p. 67), OC is a psychological state that 1) characterises the
employee’s relationship with the organisation and 2) has implications for the
decision to continue or discontinue membership in the organisation. Based on this
concept, Meyer and Allen then introduced three types of commitment: affective,
continuance, and normative commitment. This typology can be seen in part as an
extension of Buchanan’s (1974) concept in that the two classifications share the
component of ‘affective commitment’; however, Meyer and Allen (1991) also
introduced the two additional components of continuance and normative
commitment. Meyer and Allen explained affective commitment as referring to the
employee’s emotional attachment to, identification with, and involvement in the
organisation. Meanwhile, continuance commitment refers to an awareness of the
costs associated with leaving the organisation, and normative commitment
reflects a feeling of obligation to continue employment. A study by O’Reilly and
Chatman (1986) suggested that commitment is the psychological attachment felt
by the person for the organisation. Based on their definition, O’Reilly and Chatman
(1986) identified three fundamental components of OC: internalization,
identification and compliance. Although existing studies have described OC in
somewhat different ways, they all centre around one common attribute: an
employee’s emotional attachment to the organisation.
OC in public organisations was extensively studied by Balfour and Wechsler (1990,
1996) using the three sub-types of commitment to the organisation proposed by
O’Reilly and Chatman (1986). Balfour and Wechsler (1990) indicated that public
employees develop OC through experience in a positive work environment. Their
second study (1996) yielded similar results, finding that public employees’ OC is
influenced by experiences at work, the impact of organisational arrangements,
and characteristics of the job itself. In terms of how management models or tools
applied within the organisation may influence OC, the literature is still very limited.
One study (Molina et al. 2014) studied how a management model, specifically the

94
BSC, affects employees’ satisfaction, commitment, satisfaction with supervision,
competitive climate among the employees and job dedication. The authors found
the implementation of the BSC within the organisation to have a positive
relationship with employees’ commitment. Following this finding, the researcher
expects the implementation of the BSC to demonstrate a positive association with
OC. Thus, based on previous related findings, the following hypotheses were
developed:
H4. The SFO principles within the implementation of the BSC are positively
associated with OC.
H4a. The better the strategy translation through BSC implementation, the more employees’ organisational commitment will increase;
H4b. The better the strategy alignment through BSC implementation, the more employees’ organisational commitment will increase;
H4c. The better the realisation of strategy as everyone’s everyday job through BSC implementation, the more employees’ organisational commitment will increase;
H4d. The better the realisation of strategy as a continuous process through BSC implementation, the more employees’ organisational commitment will increase;
H4e. The better the leadership involvement through BSC implementation, the more employees’ organisational commitment will increase.
Turning to public service motivation (PSM), the term was originally introduced by
Perry and Wise (1990). PSM, according to Perry and Wise, refers to ‘an individual's
predisposition to respond to motives grounded primarily or uniquely in public
institutions and organisations’ (p. 368). Based on their research, the authors
identified three public service motives: rational, norm-based and affective. Brewer
and Selden (1998a, p. 417) defined PSM as ‘the motivational force that induces
individuals to perform public service’. Similarly, Rainey and Steinbauer (1999)
defined PSM as ‘a general, altruistic motivation to serve the interests of a
community of people, a state, a nation or humankind’ (p. 24). Another definition
of PSM was contributed by Vandenabeele (2007), who defined it as ‘the belief,

95
values and attitudes that go beyond self-interest and organisational interest, that
concern the interest of a larger political entity and that motivate individuals to act
accordingly whenever appropriate’ (p. 547).
According to Vandenabeele (2011), despite the growing attention to PSM
research, the antecedents of PSM have remained under-researched, as most of
the studies performed have addressed its outcomes rather than its origins. Only a
few researchers have focused on examining the antecedents of PSM empirically
(Perry 1997; Bright 2005; Camilleri 2007; Moynihan and Pandey 2007). Perry
(1997) suggested that PSM develops from exposure to a variety of experiences,
some associated with childhood, some associated with religion, and some
associated with professional life (p. 190). Additionally, a study by Bright (2005)
using research surveys on a large county government in the USA concluded that
public employees with high levels of PSM desired monetary incentives significantly
less than those with lower levels of PSM (p. 150).
Camilleri and Heijden (2007), who examined the antecedents of PSM among 3,400
Maltese public officers, found that the level of an employee’s PSM is mainly the
result of the organisational environment surrounding him or her. The author
suggested that in order to maximise employees’ PSM levels, the employees must
be provided with both unequivocal goals and a prioritization of goals, irrespective
of whether employees receive their instructions from one or more sources.
Similarly, a study by Moynihan and Pandey (2007) highlighted organisational
environment as a factor that may increase the desire of employees to contribute
to the public good. In their conclusion, Moynihan and Pandey also suggested that
public organisations must adapt the effect that management systems and other
organisational institutions have on the PSM. However, they did not consider
management systems as one of the predictors of PSM. The present study aims to
investigate how the adoption of a management system, in this case the BSC
concept, affects PSM. Following the suggestion by Camilleri and Heijden (2007)

96
that the articulation of clear and unequivocal goals is one of the conditions needed
to maximise the level of PSM, one of the benefits of implementing the BSC is that
it renders the organisational objectives more easily understandable. The
researcher thus expects that BSC implementation to be positively associated with
PSM and proposes the following hypotheses:
H5. The SFO principles within the implementation of the BSC are positively
associated with PSM.
H5a. The better the strategy translation through BSC implementation, the more employees’ public service motivation will increase;
H5b. The better the strategy alignment through BSC implementation, the more employees’ public service motivation will increase;
H5c. The better the realisation of strategy as everyone’s everyday job through BSC implementation, the more employees’ public service motivation will increase;
H5d. The better the realisation of strategy as a continuous process through BSC implementation, the more employees’ public service motivation will increase;
H5e. The better the leadership involvement through BSC implementation, the more employees’ public service motivation will increase.
4.3.4 The relationship between public service motivation and organisational commitment
This study also examines the relationship between PSM and OC. Several previous
studies have reported a correlation between PSM and OC. Perry and Wise (1990,
p. 371) highlighted that PSM is likely to have a positive relationship with an
individual's OC level. Similarly, using data from the USA’s General Social Survey,
Crewson (1997) concluded that public service motivation in the federal sector is
positively related to OC. A study by Taylor (2008) using data from the Australian
Survey of Social Attitudes affirmed that PSM showed a significant and positive
relationship with OC. A parallel result was also reported by Kim (2011), who
conducted a study using data from a survey among firefighters at Gyonggi
Provincial Firefighting and Disaster Headquarters in South Korea. Similarly, Caillier

97
(2015) used data from local, state, and federal government employees in the
United States and confirmed that PSM strengthens OC. Inversely, a study by
Camilleri and Heijden (2007) found that OC intensifies PSM. In light of these
studies, the researcher developed the following hypothesis:
H6. PSM is positively associated with organisational commitment within
organisations that apply the BSC as their PMS.
4.3.5 Demographic correlation between OC and PSM
In addition to testing the relationship between BSC implementation and OC and
PSM, the researcher included four demographic variables in this study, primarily
to serve as control variables. The four demographic variables are educational
background, age, gender and organisation tenure. Motaz (1986) found that
education has an indirect positive effect on OC. Similarly, Perry (1997) found that
education has a positive relationship with OC and PSM. However, Camilleri and
Heijden (2007) reported that stronger educational backgrounds have a negative
relationship with both OC and PSM. For the purposes of this study, it is expected
that education will prove to be positively correlated with both OC and PSM. With
respect to age, the previous research offers mixed results. Perry (1997) reported
that being older has a positive relationship with PSM and OC. Moynihan and
Pandey (2007), however found age to be insignificantly correlated with PSM and
commitment to the public interest. Camilleri and Heijden (2007) found that being
older has negative associations with PSM and OC. Following Moynihan and Pandey
(2007), the researcher expects age to show an insignificant relationship with PSM
and OC.
Concerning the association between gender and PSM and OC, Perry (1997) found
women to score higher than men in OC, while gender had no significant
relationship to PSM. Vandenabeele (2011) reported that males show higher level
of PSM than females. As males are generally expected and permitted to be

98
competitive, aggressive, and dominant, whereas females are expected to assume
supportive caretaking roles (Bright 2005, p. 146), the researcher accordingly
expects maleness to be positively associated with OC and femaleness to be
positively associated with PSM.
With regard to the relationship of organisation tenure with OC and PSM, Balfour
and Wechsler (1996) found that the length of employees’ tenure within the
organisation has an insignificant relationship with OC. Similarly, Naff and Crum
(1999) and Camilleri (2007) reported no significant difference in PSM based on
organisation tenure. Following these studies, organisational tenure is predicted to
have an insignificant relationship with OC and PSM.
4.3.6 Organisational performance and its relevance for the BSC
Referring to Anspach (1991) and Au (1996), Brewer and Selden (2000) defined
organisational performance (OP) as a socially constructed phenomenon that is
subjective, complex, and particularly hard to measure in the public-sector.
Measuring OP is challenging, especially when it comes to measuring the impact of
a management system like the BSC (de Geuser et al. 2009). They also expressed
the same concern by stating that consideration of the ways in which BSC can be
linked to OP is often blurred by the question of measuring the contribution of OP
(p. 99). Similarly, Madsen and Stenheim (2015) opined that there are many
variables mediating and moderating the relationship between BSC
implementation and OP. One way to minimize the vagueness of the actual
contribution is to relate the BSC to the organisation’s strategies. Doing so is in line
with Braam and Nijssen (2004), who used data from a sample of 41 business-to-
business companies in the Netherlands. They highlighted the importance of
aligning BSC usage with organisational strategies, concluding that use of the BSC
that complements corporate strategy positively influences company performance
positively, while use of the BSC that is not related to company strategy may
weaken company performance.
99
Hoque and James (2000), employing data from a survey of 66 manufacturing
companies in Australia, found that greater usage of the BSC is correlated with
improved OP. Another study that confirmed a positive effect of BSC
implementation within an organisation is that of de Geuser et al. (2009), whose
work yielded results similar to Hoque and James’ (2000) and Braam and Nijssen’s
(2004): De Geuser et al. found that the BSC has a positive impact on OP. However,
not all researchers reported a positive relationship between BSC implementation
and OP; for instance, Ittner et al. (2003) found the use of the BSC to exhibit almost
no association with economic performance.
Theoretically, the BSC helps organisations to objectively measure their
organisational strategies; considering the findings from previous studies, then, the
researcher proposes the following hypothesis:
H7. The implementation of the BSC is positively associated with organisational
performance.
Based on the research questions and hypotheses constructed, the researcher
developed the following proposed model for the present study:

100
Organizational
performance
Organisation size
Employees’ roles
Public service
motivation
Organizational
commitment
Figure 4.1 Proposed model of the study
The conceptual framework above describes the researcher’s entire approach to
analysing BSC implementation; it incorporates three stages of analysis. Firstly, this
study examines how the organisation has implemented the BSC by using the SFO
principles as the indicators. Secondly, this study explores how organisational
factors, specifically, organisation size and employees’ roles, influence the
implementation of the BSC. Lastly, this study examines the extent to which the
BSC relates to the employee perspective, in terms of PSM and OC, and to the
organisational perspective, in terms of organisational performance (OP). Hence, in
Strategy Translation
Source: Researcher’s own construction
Balanced scorecard implementation
Strategy Alignment
Strategy as ‘everyone’s
everyday job’
Strategy as a continuous
process
Leadership involvement

101
order to facilitate these three stages of analysis, the framework conceptualises the
relationships between BSC implementation and organisation size, employees’
roles, OC, PSM and OP. The interrelationships amongst the five SFO principles are
illustrated to highlight the fact that, to make the BSC work successfully, all five SFO
principles of the BSC system must work together and support one other.
4.4 Chapter summary
This chapter has presented a conceptual framework which was developed based
on the research questions and hypotheses constructed in this study. The
conceptual framework consists of the BSC as represented by the SFO principles:
strategy translation, strategy alignment, strategy as everyone’s everyday job,
strategy as a continuous process, and leadership involvement. These act both as
dependent constructs to organisation size and employees’ roles and as
independent constructs to OC, PSM and OP. The proposed model for the study is
tested and analysed in Chapters 6, 7 and 8 of this thesis.

102
Chapter 5: Research Methodology
5.1 Introduction
This chapter discusses the methodology of this research. The first section begins
with the philosophical research orientation. The selection of the quantitative
method as research strategy is then discussed. Subsequently, this chapter explains
the research design of this study, which is both cross-sectional and longitudinal.
This chapter also provides a justification of the selection of the unit of analysis,
which is followed by descriptions of the sampling technique, the sample size and
the use of a self-administered questionnaire as well as an explanation of how this
study analyses the data collected to yield the findings. The next section covers the
process or steps of ethical consideration that this study underwent. The
penultimate section of this chapter describes the pilot study conducted with 14
respondent employees and three experts. Finally, this chapter concludes with a
summary of its contents.
5.2 Philosophical research orientation
There are many definitions of research offered in the literature. Hussey and
Hussey (1997) defined research as a process of enquiry and investigation to
increase knowledge by adapting a systematic and methodical process. To Sekaran
(2003), research is a process to find solutions to a problem after a thorough study
and analysis of situational factors. It is believed that research is conducted based
on underlying philosophical considerations; according to Blumberg et al. (2014),
examining such consideration is beneficial for a researcher to help clarify and
facilitate the choice of the research design. Robson and McCartan (2016)
emphasized that philosophical stance provides one way of thinking about which
kinds of research questions are important and what constitutes the answers to the
questions. The underlying philosophical considerations of research constitute
what is called the research paradigm. Kuhn (1962, p. viii, cited in Collis and Hussey
2014) defined paradigms as universally recognized scientific achievements that,
103
for a time, provide model problems and solutions to a community of practitioners.
However, the term ‘paradigm’ can have different meanings for different
researchers (Guba 1990; Hussey and Hussey 1997). Guba (1990) suggested that it
is intellectually useful for the term not to be fixed with a certain definition because
flexibility opens the possibility for researchers to modify the term based on their
own understanding. Furthermore, Guba (1990, p.17) defines the paradigm as a
basic set of beliefs that guide actions, whether those actions are of the everyday
variety or are performed in connection with a disciplined inquiry. Saunders et al.
(2009), however, defined a paradigm more specifically as a method determining
social phenomena from which particular understandings and explanations of
these phenomena can be achieved. According to Bryman (2015), the paradigm
originates from the history of science; in that context, it was used to picture a
cluster of beliefs and dictates intended for scientists in a particular discipline to
influence what should be studied, how research should be done, and how results
should be interpreted. Cresswell (2014) has introduced a term related to the
paradigm, the ‘worldview’, which he defines as a general philosophical orientation
regarding the world and the nature of the research that the researcher brings to a
study. Collis and Hussey (2014, p. 10) defined a research paradigm as a
philosophical framework that guides how scientific research should be conducted,
based on people’s philosophies and their assumptions about the world and the
nature of knowledge.
Guba (1990) suggested that three questions—the ontological, epistemological and
methodological—may help a researcher to determine which paradigm to adopt in
a study. The author defined those three basic considerations as follows: first,
ontology questions the nature of the knowable and the nature of reality. Hussey
and Hussey (1997) produced a similar definition of ontology. Creswell (2009)
defined it as making claims about what knowledge is; Collis and Hussey (2014)
suggested a broader understanding, positing that a researcher must decide
whether consider the world as objective and external to the researcher or socially
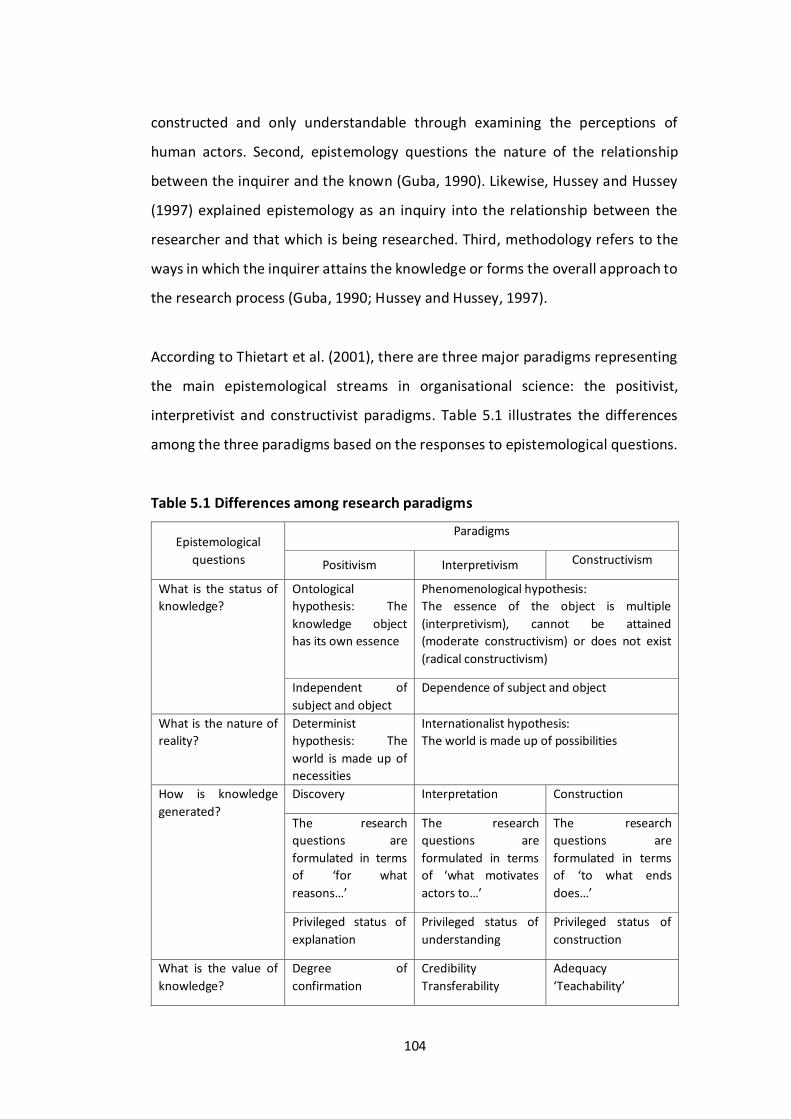
104
constructed and only understandable through examining the perceptions of
human actors. Second, epistemology questions the nature of the relationship
between the inquirer and the known (Guba, 1990). Likewise, Hussey and Hussey
(1997) explained epistemology as an inquiry into the relationship between the
researcher and that which is being researched. Third, methodology refers to the
ways in which the inquirer attains the knowledge or forms the overall approach to
the research process (Guba, 1990; Hussey and Hussey, 1997).
According to Thietart et al. (2001), there are three major paradigms representing
the main epistemological streams in organisational science: the positivist,
interpretivist and constructivist paradigms. Table 5.1 illustrates the differences
among the three paradigms based on the responses to epistemological questions.
Table 5.1 Differences among research paradigms
Epistemological
questions
Paradigms
Positivism Interpretivism Constructivism
What is the status of
knowledge?
Ontological
hypothesis: The
knowledge object
has its own essence
Phenomenological hypothesis:
The essence of the object is multiple
(interpretivism), cannot be attained
(moderate constructivism) or does not exist
(radical constructivism)
Independent of
subject and object
Dependence of subject and object
What is the nature of
reality?
Determinist
hypothesis: The
world is made up of
necessities
Internationalist hypothesis:
The world is made up of possibilities
How is knowledge
generated?
Discovery Interpretation Construction
The research
questions are
formulated in terms
of ‘for what
reasons…’
The research
questions are
formulated in terms
of ‘what motivates
actors to…’
The research
questions are
formulated in terms
of ‘to what ends
does…’
Privileged status of
explanation
Privileged status of
understanding
Privileged status of
construction
What is the value of
knowledge?
Degree of
confirmation
Credibility
Transferability
Adequacy
‘Teachability’
105
Refutability
Logical consistency
Dependability
Confirmability
Source: Adapted from Thietart et al. (2001, p. 15) Saunders et al. (2003, p. 83) suggested that research philosophies can be
differentiated based on the ways in which researchers think about the
development of knowledge. Saunders and colleagues classified the research
philosophy into positivism, interpretivism and realism. To these authors, positivist
philosophy embodies the following characteristics: objectivism in the role of the
analyst, interpretation of the data collected in a value-free manner, quantifiable
observation using statistical analysis and independence of the researcher from the
research’s subject. Interpretivism seeks to understand the subjective reality of the
actors under study in order to be able to make sense of and understand their
motives, actions and intentions in a way that is meaningful for research
participants (Saunders et al. 2003, p. 84). Lastly, realism is based on the belief that
a reality exists that is independent of human thoughts and beliefs. Realism shares
some philosophical qualities with positivism, for instance as relates to the
external, objective nature of some macro aspects of society. Realism also
recognises that people themselves are not objects to be studied in the style of
natural science. Employing realism entails ‘an awareness of the importance of
understanding people’s socially constructed interpretations and meanings, or
subjective reality, within the context of seeking to understand broader social
forces, structures or processes that influence, and perhaps constrain, the nature
of people’s views and behaviours’ (Saunders et al. 2003, p. 85).
Blumberg et al. (2014), however, suggested that the two most prominent research
philosophies are positivism and interpretivism. They advised that positivism starts
from the idea that the world can be described by objective facts, followed by an
investigation of those facts. Interpretivism, by contrast, refers to a primary interest
in subjective meanings and interpretations of phenomena to detect what is
happening in a specific situation (Blumberg et al. 2014, p. 18). Collis and Hussey
(2014) also suggested that positivism and interpretivism are the two main
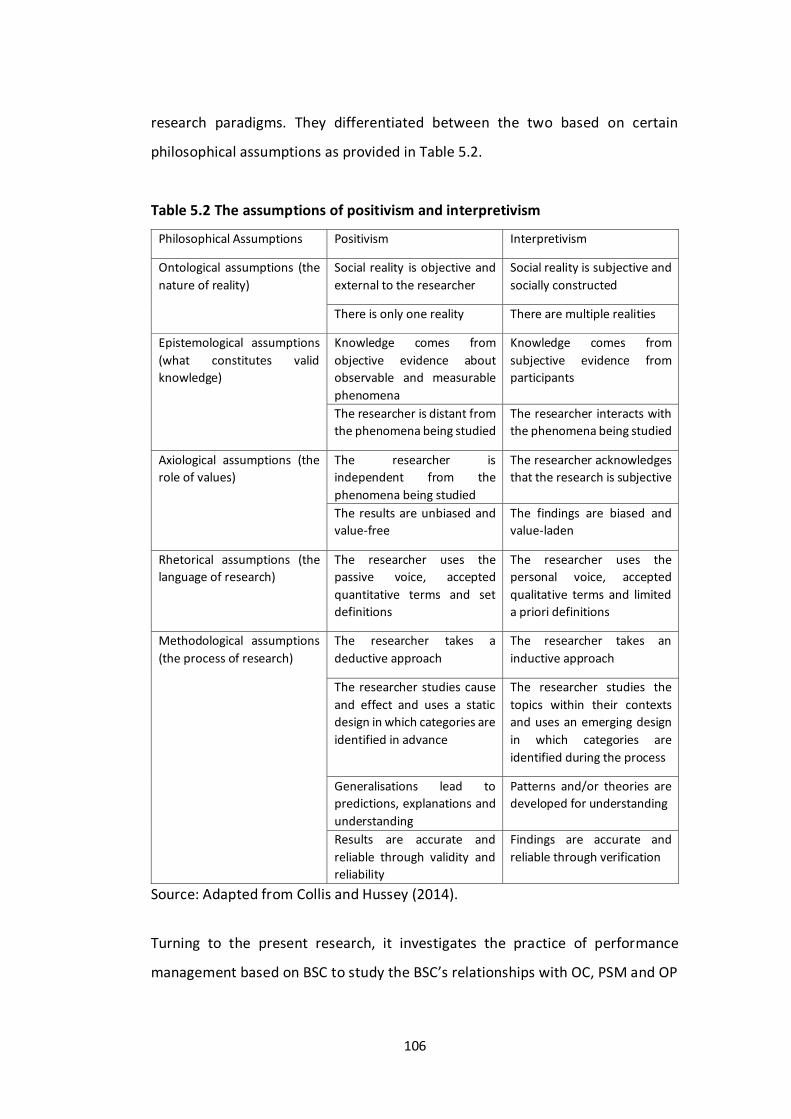
106
research paradigms. They differentiated between the two based on certain
philosophical assumptions as provided in Table 5.2.
Table 5.2 The assumptions of positivism and interpretivism
Philosophical Assumptions Positivism Interpretivism
Ontological assumptions (the
nature of reality)
Social reality is objective and
external to the researcher
Social reality is subjective and
socially constructed
There is only one reality There are multiple realities
Epistemological assumptions
(what constitutes valid
knowledge)
Knowledge comes from
objective evidence about
observable and measurable
phenomena
Knowledge comes from
subjective evidence from
participants
The researcher is distant from
the phenomena being studied
The researcher interacts with
the phenomena being studied
Axiological assumptions (the
role of values)
The researcher is
independent from the
phenomena being studied
The researcher acknowledges
that the research is subjective
The results are unbiased and
value-free
The findings are biased and
value-laden
Rhetorical assumptions (the
language of research)
The researcher uses the
passive voice, accepted
quantitative terms and set
definitions
The researcher uses the
personal voice, accepted
qualitative terms and limited
a priori definitions
Methodological assumptions
(the process of research)
The researcher takes a
deductive approach
The researcher takes an
inductive approach
The researcher studies cause
and effect and uses a static
design in which categories are
identified in advance
The researcher studies the
topics within their contexts
and uses an emerging design
in which categories are
identified during the process
Generalisations lead to
predictions, explanations and
understanding
Patterns and/or theories are
developed for understanding
Results are accurate and
reliable through validity and
reliability
Findings are accurate and
reliable through verification
Source: Adapted from Collis and Hussey (2014).
Turning to the present research, it investigates the practice of performance
management based on BSC to study the BSC’s relationships with OC, PSM and OP

107
within twelve public-sector organisations. To determine the paradigm most
appropriate for this research, it is necessary to consider its attributes. Among
these are the use of large survey questionnaires, which serve as ‘objective
knowledge or facts’ (Saunders et al. 2003; Blumberg et al. 2014; Robson and
McCartan 2016); the researcher himself as independent from the responding
public-sector organisations; and the extensive use of quantitative analysis
(Thietart et al. 2001; Blumberg et al 2014; Collis and Hussey 2014). Thus, the
positivist paradigm is the philosophical orientation that most closely approximates
that of the present study.
5.3 Selection of the research strategy
Bryman (2015) classified research strategies into quantitative and qualitative
strategies. With regard to the acceptance of these two concepts, there has been a
great deal of debate among researchers as to which is the more reliable of the
two. In fact, as noted by Thietart et al. (2001), the dissimilarity is both unclear and
ambiguous. Similarly, Bryman (2015, p. 31) mentioned that for many researchers,
quantitative and qualitative research differ with respect to their epistemological
foundations as well as in other points. Saunders et al. (2003) posited that
quantitative research is associated with a deductive approach whose focus is on
testing the theory, but they also suggested that quantitative research may
incorporate an inductive approach, in which data is used to develop a theory, as
well. Creswell (2014) suggested that there are two major quantitative designs:
survey research and experimental research, each of which applies different
process. Survey research provides a quantitative or numeric description of the
trends, attitudes, or opinions of a population by studying a sample of that
population. Meanwhile, experimental research seeks to determine whether a
specific treatment influences an outcome. Bryman (2015), however, offered a
more practical definition, stating that quantitative research is a research strategy
that emphasises quantification in the collection of data and analysis of data.
Moreover, Bryman (2015) explained quantitative strategies as entailing a

108
deductive approach to the relationship between theory and research in which the
accent is placed on the testing of theories.
Like its counterpart, the qualitative method has many definitions. According to
Thietart et al. (2001), qualitative research methods allow for both the researcher’s
subjectivity and that of the subjects. Bryman (2015) identified qualitative research
as a research strategy that usually utilises more words than quantification in the
collection and analysis of data. Bryman elaborated on this by stating that
qualitative research values three fundamental characteristics: an inductive
approach to the relationship between theory and research, in which emphasis is
placed on the generation of theories; a rejection of the practices and norms of the
natural scientific model, and of positivism in particular, preferring an emphasis on
how individuals interpret their social world; and a view of social reality as a
constantly shifting, emergent property of individuals’ creations. To clarify the
differences between the two research strategies, Bryman (2015) summarized the
fundamental differences between quantitative and qualitative strategies as shown
in Table 5.3.

109
Table 5.3: Fundamental differences between quantitative and qualitative
strategies
Quantitative Qualitative
Principal orientation to the role of
theory in relation to the research
Deductive, testing of
theory
Inductive, generation of
theory
Epistemological orientation Natural science model, in
particular positivism
Interpretivism
Ontological orientation Objectivism Constructionism
Source: Adapted from Bryman (2015, p. 32)
The present study examines the implementation of BSC as a performance
management method in twelve Indonesian customs and excise organisations. The
research itself is conducted based on the conceptual framework that was
developed from the theory of SFO representing BSC implementation, OC, PSM and
OP. Adhering to the definitions of quantitative and qualitative strategy suggested
above, particularly Bryman’s (2015), the emphasis of this study is on applying a
deductive approach in order to test the theory; in terms of the paradigm, studies
utilising a positivistic approach apply a quantitative strategy, while interpretivist
studies use qualitative methods (see Collis and Hussey 2014, p. 46). The research
strategy of the present study is thus quantitative.
5.4 Research design of the study
Research design provides a practical overview of the central issues involved in the
design of social and economic research (Hakim, 2000). Bryman (2015, p. 39)
defined research design as a framework for the generation of evidence that is
chosen to answer the research questions in which the investigator is interested.
Bryman (2015, p. 39) identified the five most frequently used research designs as
experimental and related designs; cross-sectional design (survey research);
longitudinal design in its various forms, such as the panel study and the cohort
study; case study design; and comparative design. With regard to research design,

110
this study applies a cross-sectional and longitudinal design. The following sections
explain the reasons for the choice of research design.
5.4.1 Reasons for cross-sectional research design
Hussey and Hussey (1997) explained that cross-sectional studies are associated
with positivistic methodologies, which are designed to attain information on
variables in different contexts at the same time. Bryman (2015) offered a similar
definition and added that the purpose of the cross-sectional study is to detect
patterns of association. Bryman also identified four key elements present in
studies using a cross-sectional design: a sample of cases; at a single point;
quantitative or quantifiable data; and patterns of associations. The present study
meets all of the criteria; it examines the implementation of the BSC as well as the
correlation between the implementation of the BSC and OC and PSM within
twelve public-sector organisations. The data were gathered from the twelve
respondent organisations once during the fieldwork period by means of research
questionnaires.
5.4.2 Reasons for longitudinal design
Hussey and Hussey (1997) defined longitudinal design as a study, over time, of a
variable or group of subjects that is intended to examine the dynamics of the
problem by investigating the same situation or people several times, over the
period in which the problem runs its course. Bryman (2015) noted that
longitudinal design can allow some insight into the time order of variables and that
it may therefore better allow causal inferences to be made than would otherwise
be the case. In addition to examining the correlation between the BSC and OC and
PSM, this study investigates the relationship between the BSC and OP. In order to
provide information on the trend or possible changes between the periods before
and after the implementation of the BSC, the OP variables are required over a
period of time.
111
5.5 Justification of the selection of the units of analysis
The decision to conduct this study at the DGCE was based on two main
considerations: firstly, the DGCE has implemented performance management
based on BSC since 2009. This organisation is one of the pioneers of BSC
implementation in the Indonesian government sector; by the time this study
began, the PMS had been in place for eight years. It is thus probable that the DGCE
is the most appropriate organisation on which to conduct a study on BSC
implementation in Indonesia. Secondly, in 2012, the DGCE was honoured with the
award for the best reformed government organisation by the National Reform
Body (a task force under the Vice President’s Office). It is likely that, given the
bestowal of this award on the DGCE, its performance management system based
on the BSC has been effectively applied. These two considerations justify the
selection of this respondent organisation.
With regards to the units of analysis, the DGCE consists of 120 service offices, three
of which are large offices and 117 of which are smaller offices, in 34 provinces. To
collect data, test and examine every relevant element in all 120 service offices
across 34 provinces in Indonesia would be practically impossible to due to time
constraints, costs incurred and other human resource issues (Sekaran, 2003).
Hence, this study selected twelve offices located in nine cities in four provinces as
representatives of the 120 service offices. The twelve offices selected are:
1. MSO of Tanjung Priok
2. MSO of Batam
3. MSO of Soetta
4. CEO of Jakarta
5. CEO of Marunda
6. CEO of Merak
7. CEO of Tangerang
8. CEO of Bekasi
9. CEO of Bogor
10. CEO of Purwakarta

112
11. CEO of Cikarang
12. CEO of Bandung
To make these selections, the researcher carefully considered several factors that
enable the twelve offices chosen to represent the DGCE as a whole. The first
consideration was the business process. The Port of Tanjung Priok is the largest
seaport in Indonesia, and approximately 70% of all Indonesia’s traded goods pass
through this port (Ginting et al. 2015; Pang and Gebka 2016); it is under the
jurisdiction of MSO of Tanjung Priok. The second consideration was to include all
of the DGCE’s large offices in the study. Based on Ministerial Decree
234/PMK.01/2015, the large offices in DGCE are the MSOs of Tanjung Priok, Batam
and Soetta. Hence, all three offices were included in the study. The third
consideration was the homogeneity of the business process. The researcher chose
the twelve selected offices due to their similar approaches to the business process.
The selected offices, moreover, share the same key performance indicators to
measure OP. On the basis of the three aforementioned considerations, the
implementation of the BSC in the twelve chosen customs and excise organisations
may represent that of the DGCE as a whole.
5.6 Sampling technique
The fact that, at the time of data collection for the present study, all twelve
respondent organisations had implemented the BSC framework to the individual
level encouraged the researcher to include all levels of employees within the
respondent organisations. This was intended to generate a more comprehensive
picture of BSC implementation and its consequences for OC and PSM, something
that appears not to have been attempted in previous studies. For the purpose of
this research, which is to attain a comprehensive picture within the organisation,
the research participants were drawn from top management levels, excluding
organisation heads, to staff levels. Therefore, this study applies purposive or
judgmental sampling. Purposive sampling enables researchers to select the cases

113
that best satisfy their specific needs, in the end fulfilling the research objectives
(Saunders et al. 2003; Robson and McCartan 2016).
5.7 Sample size
Bryman (2015) suggested that decisions about sample size invariably represent a
compromise between the constraints of time and cost, the need for precision,
considerations regarding the homogeneity and heterogeneity of the population
from which the sample is to be taken, and the type of analysis that the study
intends to carry out. One of the research questions of the present study is: To what
extent are organisational factors associated with the implementation of the BSC?
The organisational factors referred to in the research question are organisation
size and employee roles. To answer this question, the researcher needed to
include employee roles at all levels, excluding organisational heads, at each of the
twelve offices. Realising that increasing the sample size is likely to increase the
precision of the sample (Bryman 2015), the researcher followed Krejcie and
Morgan (1970) in determining the sample size. This determination was then used
as the reference when distributing the research questionnaires to the twelve
respondent organisations. The distribution of research questionnaires in each unit
of analysis is provided in Table 5.4.
Table 5.4 Research questionnaire distribution
Office Organisational Size Questionnaires
Distributed
1 MSO, Tanjung Priok Large organisation 325
2 MSO, Batam Large organisation 180
3 MSO, Soetta Large organisation 320
4 CEO, Marunda Small organisation 120
5 CEO, Jakarta Small organisation 130
6 CEO, Tangerang Small organisation 144
7 CEO, Merak Small organisation 80
8 CEO, Bogor Small organisation 145
9 CEO, Bekasi Small organisation 165

114
10 CEO, Cikarang Small organisation 140
11 CEO, Purwakarta Small organisation 110
12 CEO, Bandung Small organisation 110
Total 1969
Note: Information regarding the response rate can be found on p. 132.
5.8 Research methods for data collection
This study involved twelve organisations (CEOs) located in nine cities across four
provinces. In each CEO, the researcher took samples from employees at all levels,
potentially resulting in a large number of participants. In order to meet the
objective of this study, which required a large number of samples, the researcher
chose the survey as the main data collection method. Apart from the survey as
primary data, this study also utilises secondary data from the respondent
organisations. Saunders et al. (2003) distinguished between three types of
secondary data: documentary, multiple source and survey. Following this
classification, the present study collected documentary data such as the
organisations’ demographics, websites and strategy maps. In terms of multiple
source data, this study collected OP reports (compiled from 2009 to 2016). Lastly,
with respect to survey data, this study collected organisational customer
satisfaction reports (compiled from 2013 to 2016).
For the main data, the researcher used a self-administered questionnaire that
originated from the adoption and adaptation of questions used in previous
questionnaires as well as the development of new questions (Bourke and Clark
1994, cited in Saunders et al. 2003). The process of designing the questionnaire
for this study is illustrated in Figure 5.1.
Figure 5.1 Questionnaire development flow
Source: Researcher’s work
Literature review
Designing the questions
Determining the
measurement scale
Piloting the drafted
questionnaire
Refining the questionnaire
Research questionnaire ready to use

115
5.8.1 Questionnaire development
Collis and Hussey (2014) identify a questionnaire as a list of carefully structured
questions chosen after considerable testing with a view to eliciting reliable
responses from a particular group of people. The survey questionnaire used in this
study covers the subjects of BSC implementation, OC and PSM. BSC
implementation is represented in the questionnaire by the five SFO principles as
proposed by Kaplan and Norton (2001c): strategy translation, strategy alignment,
strategy as everyone’s everyday job, strategy as a continuous process, and
leadership involvement.
The BSC implementation statements in the questionnaire were developed by the
researcher based on the elements of each SFO principle (see Kaplan and Norton
2001) and the 2012 SFO survey of the MoF of Indonesia. In terms of the OC items,
this research uses the nine-item questionnaire developed by Balfour and Wecshler
(1996) and Srithongrung (2011). PSM is represented by the five-item
questionnaire developed by Brewer and Shelden (2000) and Kim (2005).
5.8.2 Questionnaire rating scale
Hussey and Hussey (1997) noted that one of the more frequently used scales in
questionnaires is the Likert scale. The authors explained that in the Likert scale,
the questions are turned into statements and research participants are asked to
determine their level of agreement with each statement by choosing from the
numbers in the scale. The questionnaire in this study used a 7-point Likert scale,
with 1 representing ‘strongly disagree’ and 7 representing ‘strongly agree’.
5.8.3 Questionnaire refinement
As highlighted by Saunders et al. (2003) and Collis and Hussey (2014), piloting a
drafted questionnaire is an essential phase with benefits for both respondents and
researchers. For respondents, piloting ensures that completing the questionnaires

116
will be unproblematic. Meanwhile, the benefit to researchers is in the ease of
recording the data (Saunders et al. 2003). This study piloted the drafted
questionnaire with groups of respondents composed of both employees at the
DGCE and experts. Following Bryman (2015), the piloting was not carried out with
employees who work at the offices that would be engaged in the main study. The
drafted questionnaires were sent to fourteen employees from several offices in
the DGCE excluding the targeted organisations. The drafted questionnaires were
also sent to three experts: two from the University of Manchester (one statistician
and one research fellow) and one manager from a management consulting agency
in Jakarta, Indonesia. The feedback received from the participants in the piloting
was used to refine the drafted survey questionnaire. Thus, the output of this phase
was the final, ready-to-use research questionnaire for the main study. Details
regarding the pilot study are discussed in Section 5.9 of this chapter.
5.8.4 Questionnaire distribution and collection
Due to time constraints and the ability to reach targeted respondents from the
respondent organisations, this study utilised the group distribution method, a low-
cost method yielding a high probability of response from research participants
(Collis and Hussey 2014). For the present study, the researcher contacted the
responsible party in each office to ask about the possibility of taking the time in
their routine meetings to distribute the survey questionnaires. During the
meetings, the researcher explained the purpose of the research, the research
process, the rights of the research candidates, how to complete the
questionnaires, and how to submit the completed questionnaires (by either
submitting directly to the researcher in the meeting or later to the performance
manager).

117
With regard to questionnaire collection, all participants submitted their
completed questionnaires to the General Affairs Section of the office. This section
is administered by the person in charge or the researcher’s contact person in each
of the offices. At the agreed time, the researcher visited each of the respondent
organisations to collect the completed questionnaires individually from the
General Affairs Section.
5.9 Data analysis techniques
The analysis performed in this research falls under the classification of multivariate
analysis due to its simultaneous analysis of more than two variables (Hair et al.
2010). With regard to the selection of the analysis technique for this research, it
was determined on the basis of how the unique research question needed to be
answered. In terms of data analysis, this study applied several analysis techniques:
CFA, SEM, panel data regression modelling and growth curve modelling. Figure 5.2
provides explanations of the techniques used in correlation with each research
question.
CFA was applied to the first research question, How do strategy-focused
organisations’ (SFO) principles relate to each other within implementation of the
BSC?. CFA was chosen because the intention of this question is to check current
knowledge, in this case regarding the framework of the BSC (Kaplan and Norton
2001). In a study by Widaman (2003), ‘differences in parameters deriving from
principal component analysis and common factor analysis were explored in
relation to several additional aspects of population data, such as variation in the
level of communality of variables on a given factor and the moving of a variable
from one battery of measures to another. The results suggested that principal
component analysis should not be used if a researcher wishes to obtain
parameters reflecting latent constructs or factors’. Regarding factor analysis, Hair
et al. (2010) stated that the critical assumptions underlying factor analysis are
more conceptual than statistical. Furthermore, Hair et al. (2010) emphasised that
the conceptual assumptions underlying factor analysis relate to the set of variables

118
selected and the sample chosen. In relation to these criteria, the present research
constructed the variables based on previous research (Kaplan and Norton 2001);
in addition, the sample chosen for this research considered representativeness in
terms of the variables and the respondents within each organisation.
The researcher used SEM to analyse the data related to the second research
question, To what extent are organisational factors associated with the
implementation of the BSC?. SEM was chosen because it allows the researcher to
examine the structure of interrelationships among latent factors (latent variables).
SEM was also used to analyse the data for the third, fourth, and fifth research
questions (Do the SFO principles within the implementation of the BSC have a
relationship with organisation commitment? Do the SFO principles within the
implementation of the BSC have a relationship with public service motivation? How
does organisation commitment relate to public service motivation within an
organisation implementing the BSC?).
Meanwhile, for the last research question, How is BSC implementation related to
organisation performance?, two analytical tools were used: panel data regression
analysis and growth curve modelling. Unlike the first five research questions,
which used a cross-sectional design, the final research question utilised a
longitudinal design. The availability of OP data generated over a period of time
made it possible for researcher to examine the influence of BSC implementation
on OP over a number of years. Figure 5.2 summarizes the use of data analysis
techniques.

119
Organizational
performance
Public service
motivation
Organizational
commitment
Organization size
Employees’ roles
Figure 5.2 Overall research framework and analysis techniques
5.10 Ethical considerations
Ethical considerations are an important issue for researchers carrying out research
involving people (Hussey and Hussey 1997; Robson and McCartan 2016). Saunders et al.
(2003) advised that ethical concerns begin during the planning process, when seeking
access to organisations and to individuals, as well as during data collection, analysis, and
data reporting. Thus, every stage of the research process must meet ethical standards.
Source: Researcher’s own construction
Balanced scorecard implementation
SEM SEM
1. Panel data regression
2. Growth curve analysis
Strategy Translation
Strategy Alignment
Strategy as ‘everyone’s
everyday job’
Strategy as a continuous
process
Leadership involvement

120
Following the research standards and protocols of the University of Manchester, this
study has received ethical approval from the School Ethics Advisory Group (SEAG), which
means that the study meets the University of Manchester’s ethical standards. During the
SEAG review process, the risks involved in the research and the protocol of the research
were assessed and approved. Following the checklist for ethical research suggested by
Collis and Hussey (2014, p. 35), the researcher took the following steps in order to ensure
the meeting of ethical standards:
• Has the researcher obtained explicit and implicit consent from participants?
During the fieldwork, researcher sent consent forms (Appendix 4) to potential
participants in the twelve respondent organisations. The were questionnaires
then distributed to the potential participants who were willing to participate.
• Has the researcher used coercion to participate?
In addition to sending consent forms, the researcher also sent a Participation
Information Sheet (Appendix 5), one of whose purposes was to inform potential
participants that participation was on a voluntary basis. Hence, potential
participants decided whether or not to take part in the research.
• Will the research process or the findings harm participants, those about whom
information is gathered or others not involved in the research?
Every respondent received a Participant Information Sheet which assured that
respondents would not be named (that is, that they would remain anonymous).
• Has the researcher stored personal/confidential data regarding research
participants (people and organisations)?
To input and analyse the data gathered from fieldwork, the researcher used a PC
provided by the University of Manchester requiring a unique university ID and
password, as well as a personal laptop secured with a password.
• Has the researcher ensured that participants are anonymous?
All survey questionnaires distributed to research participants were anonymous.
121
• Is the researcher following accepted research practice to conduct the research,
analysis and draw conclusions and adhering to community standards of
conduct?
Before proceeding to fieldwork activities, the researcher obtained the required
ethical clearance from the School Ethics Advisory Group (SEAG) of the University
of Manchester, which confirmed that the research met the University’s ethical
standards and that the SEAG approved of the research protocols developed.
• Has the researcher obtained permission before sending mass email?
The researcher received prior permission from the gatekeeper (Executive
Secretary of Indonesian Customs and Excise) to conduct the study on the twelve
CEOs selected. This permission gave the researcher authorization to contact each
of the respondent organisations directly by means of emails, phone calls and field
visits.
5.11 Pilot study
This research began with a pilot study to test the questionnaire draft. All
participants in the piloting study were employees of other Indonesian CEOs. In
order to ensure an objective result, the pilot study did not include organisations
participating in the main study. To obtain a representative picture, the researcher
also considered the variance of the respondents in terms of different employees’
roles, job duties and office geography to evaluate their understanding of the
contents of the questionnaire. Table 5.5 provides detailed information about the
participating pilot project respondents; this information confirms the involvement
of employees with various roles as well as different CEOs.
The researcher obtained the email addresses and contact phone numbers of the
targeted respondents from the Human Resource Division and then contacted
them to offer an explanation of the purpose of the activity, which was to ask their
perspectives on the drafted questionnaire. Specifically, the researcher
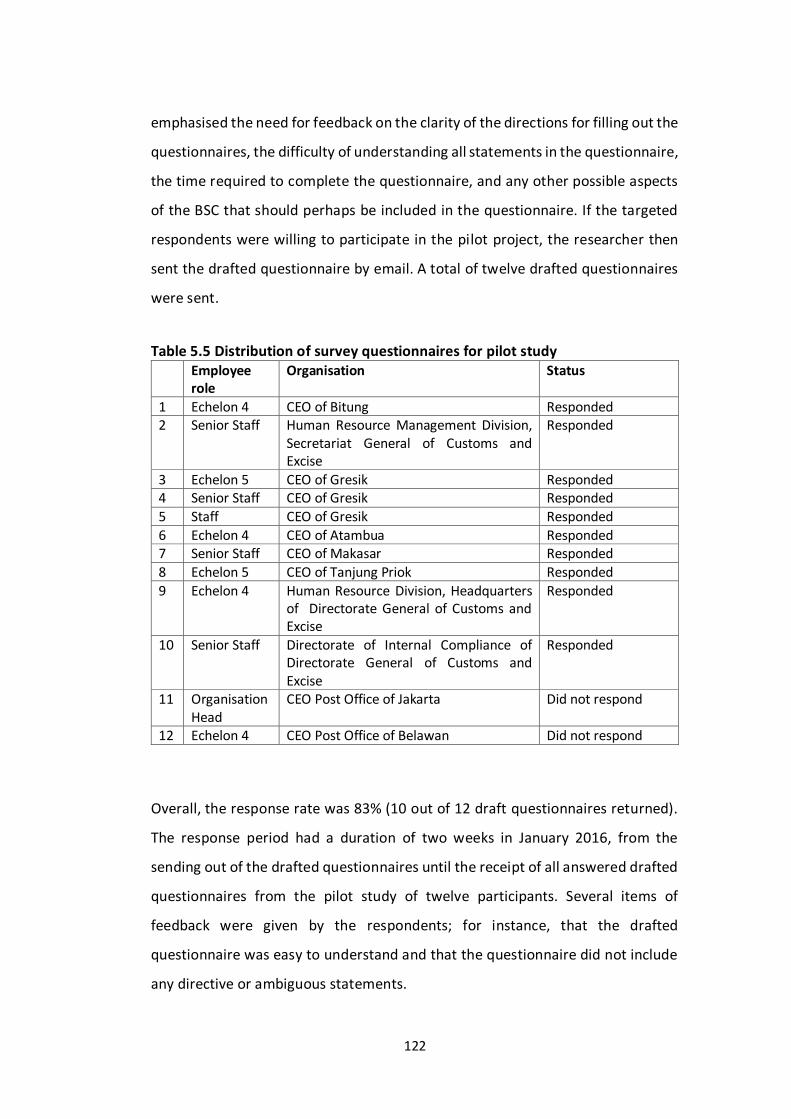
122
emphasised the need for feedback on the clarity of the directions for filling out the
questionnaires, the difficulty of understanding all statements in the questionnaire,
the time required to complete the questionnaire, and any other possible aspects
of the BSC that should perhaps be included in the questionnaire. If the targeted
respondents were willing to participate in the pilot project, the researcher then
sent the drafted questionnaire by email. A total of twelve drafted questionnaires
were sent.
Table 5.5 Distribution of survey questionnaires for pilot study Employee
role Organisation Status
1 Echelon 4 CEO of Bitung Responded 2 Senior Staff Human Resource Management Division,
Secretariat General of Customs and Excise
Responded
3 Echelon 5 CEO of Gresik Responded 4 Senior Staff CEO of Gresik Responded
5 Staff CEO of Gresik Responded
6 Echelon 4 CEO of Atambua Responded 7 Senior Staff CEO of Makasar Responded
8 Echelon 5 CEO of Tanjung Priok Responded
9 Echelon 4 Human Resource Division, Headquarters of Directorate General of Customs and Excise
Responded
10 Senior Staff Directorate of Internal Compliance of Directorate General of Customs and Excise
Responded
11 Organisation Head
CEO Post Office of Jakarta Did not respond
12 Echelon 4 CEO Post Office of Belawan Did not respond
Overall, the response rate was 83% (10 out of 12 draft questionnaires returned).
The response period had a duration of two weeks in January 2016, from the
sending out of the drafted questionnaires until the receipt of all answered drafted
questionnaires from the pilot study of twelve participants. Several items of
feedback were given by the respondents; for instance, that the drafted
questionnaire was easy to understand and that the questionnaire did not include
any directive or ambiguous statements.
123
In order to get feedback from experts, the drafted questionnaire was also sent to
one statistician and one research fellow at the University of Manchester, both of
whom possess in-depth knowledge of survey research, and one practitioner in a
private management consultancy in Indonesia. The researcher received fruitful
comments from the experts regarding the drafted questionnaires and was offered
suggestions to increase the response rate, particularly with regard to cultural
values that might affect potential respondents’ willingness to complete or return
the questionnaires. Some of the helpful suggestions were, for example: to
personally distribute the research questionnaires to each organisation; to avoid
spreading a single question over two pages due to lack of space, which could
mislead the respondents; and to change the Indonesian language wording in
several places to make certain statements easier to understand. In the final step,
the researcher finalised the drafted questionnaires incorporating the comments
and input received from the pilot project respondents as well as from two
academic experts and one practitioner. The researcher then used the completed
survey questionnaire (Appendix 3) for the fieldwork activities.
5.12 Chapter summary
This chapter has explained the research methodology applied in this study. This
study takes a positivist philosophical position in that it exhibits positivist
characteristics; for instance, the researcher was distant from the phenomena
under study (the research utilised a survey questionnaire that was independently
completed by the respondents), the knowledge gained originated from objective
evidence, and the results were interpreted in a value-free manner. In terms of the
research design, this chapter also justifies the choice of a cross-sectional design,
which made it possible to gain an overview of how the BSC, in association with OC
and PSM, was adopted in the organisations under consideration. In addition, the
chapter discusses the selection of a longitudinal design for examining the
association between the BSC and OP and the effect of BSC implementation on OP.

124
This study collected primary data (survey questionnaires) from twelve CEOs in
Indonesia. The survey questionnaire consists of seven latent variables: strategy
translation, strategy alignment, strategy as everyone’s everyday job, strategy as a
continuous process, leadership involvement, OC and PSM. In addition to primary
data, this study collected secondary data in the form of performance reports,
survey reports, and data on organisational characteristics, all of which were used
to support the data analysis. A justification for the choice of the twelve customs
and excise organisations as the units of analysis is also provided. The ethical
process of this study was discussed, as were the piloting activities used to test the
drafted questionnaire. The next chapter provides an analysis of the first two
research questions: How do SFO principles relate to each other within the
implementation of the BSC? and To what extent are organisational factors
associated with the implementation of the BSC?.
This chapter closes with a presentation of the linkages among the aim of the
research, the objectives of the research, the research questions, the hypotheses,
the research methodology, and the respondents (Table 5.6).

125
Table 5.6 Linkages of research aim, research objectives, research questions, hypotheses, research methodology and methods, and
respondents
Research aim Research objective Research question Hypothesis Research methodology and methods
Respondents
To explore the
implementation of BSC as a performance management system within public-sector organisations in
Indonesia with a view to clarifying the nature of BSC practices and their relationship to organisational
factors, organisational performance and employee behaviour
i. Explore the theoretical
perspectives of balanced scorecard in order to identify the key success factors of balanced scorecard implementation;
RQ1. How do strategy-focused
organisations’ (SFO) principles relate to each other within implementation of the BSC?
H1: SFO principles correlate positively with
each other within the implementation of the BSC.
• Philosophical research orientation:
Positivist paradigm
• Research strategy: quantitative
• Research design: cross-sectional
and longitudinal
• Methods for data collection:
• primary data: survey
questionnaires
• secondary data: performance reports, customer satisfaction survey results
• Data analysis techniques:
• CFA
• SEM
• Panel data regression model
• Growth curve analysis
• Units of analysis: - MSO Tg. Priok - MSO Batam - MSO Soetta - CEO Marunda - CEO Jakarta
- CEO Tangerang - CEO Merak - CEO Bogor - CEO Bekasi - CEO Cikarang - CEO Purwakarta - CEO Bandung
• Distributed to 1,969 employees at 12 CEOs, with the following compositions in each of the organisations:
- All middle
management-level employees;
- Representatives of first-line managers
- Representatives of staff-level
employees under each of the line managers
ii. Review balanced scorecard practices in order to clarify organisational factors that affect the balanced scorecard as well as the ways in which the
balanced scorecard implementation affect employee behaviour
RQ2. To what extent are organisational factors associated with the implementation of the BSC?
H2. The large organisation has more influence on the implementation of BSC than the small organisation. H2a.The level of BSC strategy translation is
higher for employees working in large organisations than for employees working in small organisations;
H2b.The level of BSC strategy alignment is higher for employees working in large organisations than for employees working in small organisations;
• Primary data: survey questionnaires
• Data analysis technique: SEM

126
and organisational performance;
iii. Develop a conceptual framework of balanced scorecard implementation in the public-sector
organisation to describe the relationship between organisational factors and the balanced scorecard and define the ways in which its implementation
contributes to employee behaviour and organisational performance; and
iv. Test and examine the conceptual framework in order to discover the extent to which
organisational factors influence the implementation of the balanced scorecard and the extent to which balanced scorecard implementation relates to employee behaviour
and organisational performance within the public-sector organisational context.
H2c.The level of the strategy everyone’s everyday job through in large organisation is higher than that of small organisation;
H2d.The level of the strategy as a continuous process through BSC in large organisation is higher than that of small organisation;
H2e.The level of the leadership involvement through a BSC in the large organisation is higher than that of the small organisation.
H3. Employees holding strategic roles have more influence on BSC implementation than other employees. H3a. The level of strategy translation through
BSC of employees holding strategic roles is higher than the rest of employees;
H3b. The level of strategy alignment through BSC of employees holding strategic roles is higher than the rest of employees;
H3c. The level of the strategy everyone’s everyday job through BSC of employees holding strategic roles is higher than the
rest of employees; H3d. The level of the strategy as a continuous
process through BSC of employees holding strategic roles is higher than the rest of employees;
H3e. The level of the leadership involvement through a BSC of employees holding strategic roles is higher than the rest of
employees.
RQ3. Do the SFO principles within the implementation of the BSC have a relationship with organisational commitment?
H4. The SFO principles within the implementation of the BSC are positively associated with organisational commitment.
H4a. The better the strategy translation through BSC implementation, the more employees’ organisational commitment will increase;
H4b. The better the strategy alignment through BSC implementation, the
• Primary data: survey questionnaires
• Data analysis technique: SEM

127
more employees’ organisational commitment will increase;
H4c. The better the realisation of strategy as everyone’s everyday job through BSC implementation, the more employees’ organisational commitment will increase;
H4d. The better the realisation of strategy as a continuous process through BSC implementation, the more employees’ organisational commitment will increase;
H4e. The better the leadership involvement through BSC implementation, the more employees’ organisational
commitment will increase.
RQ4. Do the SFO principles within the implementation of the BSC have a relationship with public service motivation?
H5. The SFO principles within the implementation of the BSC are positively associated with PSM.
H5a. The better the strategy translation through BSC implementation, the more employees’ public service motivation will increase;
H5b. The better the strategy alignment through BSC implementation, the more employees’ public service motivation will increase;
H5c. The better the realisation of strategy as everyone’s everyday job through BSC implementation, the more employees’ public service motivation will increase;
H5d. The better the realisation of strategy as a continuous process through BSC implementation, the more employees’ public service motivation will increase;
H5e. The better the leadership involvement through BSC implementation, the more employees’ public service motivation will increase.
• Primary data: survey questionnaires
• Data analysis techniques: SEM

128
RQ5. How does public service motivation relate to organisational commitment within an organisation implementing the BSC?
H6. Public service motivation is positively associated with organisational commitment within organisations that apply the BSC as their performance management system.
• Primary data: survey questionnaires
• Data analysis technique: SEM
RQ6. How is BSC implementation associated with organisational performance?
H7. The implementation of the BSC is positively associated with organisational performance.
• Secondary data: performance reports, customer satisfaction
survey results, ministerial decrees regarding organisational structure
• Data analysis techniques: - Panel data regression model - Growth curve analysis
Twelve organisations as the respondents

129
Chapter 6: Findings on the Associations of Organisation Size and
Employee Roles with the BSC
6.1 Introduction
The main aim of this chapter is to present the first set of empirical evidence based
on the first two research questions of the study: first, How do strategy-focused
organisations’ (SFO) principles relate to each other within implementation of the
BSC? and second, To what extent are organisational factors associated with the
implementation of the BSC? The first research question involves analysing BSC
implementation using the framework of the SFO principles. Meanwhile, the
second research question entails the analysis of external factors, which in this
study are represented by organisation size and employee roles, to examine how
these factors may influence the implementation of the BSC. In terms of
organisation size, this research divides organisations into two groups, large and
small organisations, based on organisational structure and number of employees
as stipulated in Minister of Finance Decree of the Republic of Indonesia Number
206.3/PMK.01/2014. Meanwhile, with respect to employees’ roles, this research
divides groups of employees according to their job levels.
This chapter begins with a discussion of the distribution, collection and response
rate of the survey questionnaire. This is followed by an introduction to the
descriptive statistics, which provide information about the nature of the
respondents from the perspective of employees’ ages, education levels, gender,
professional roles, working ranks, and organisation tenure. The next part of the
chapter offers an analysis of confirmatory factor analysis (CFA) to validate the BSC
implementation model, which was built based on the SFO principles introduced by
Kaplan and Norton (2001c). In this process, the SFO principles were applied as five
latent variables: strategy translation (st), strategy alignment (sa), strategy as
everyone’s everybody job (sj), strategy as a continuous process (sp) and leadership
involvement (li). After validating the model using CFA, the next section applies the

130
model to examine the relationships of organisation size and employees’ roles with
BSC implementation. Subsequently, hypothesis testing is presented, consisting of
a comparison of the hypotheses constructed with the findings from this study.
Finally, this chapter concludes with a summary of the empirical findings regarding
the BSC, organisation size and employee roles.
6.2 Distribution, collection and response rate of the survey questionnaire
The survey questionnaires were distributed by the researcher personally at each
respondent organisation during the fieldwork period. For purposes of
effectiveness, all respondent offices had been contacted months before the visits
to ask their willingness to participate in the research. The researcher coordinated
with the performance manager of each office to make sure that the visit would
give the researcher an opportunity to meet directly with potential respondents
and with the head of the organisation. The survey questionnaire distributions
were conducted principally during routine gatherings or meetings in each office.
Generally, the meetings started with the researcher’s explanation of the purpose
of the research and the purpose of the researcher’s visit to the office. All of this
information was also available in the research consent forms attached to and
distributed with the survey questionnaire. During the meeting, the researcher
explained that the potential respondents had been selected by their office based
on the criteria that the researcher had provided and that they were entirely free
to decide whether to participate in the research. The employees who agreed to
participate were then given the survey questionnaires, participant information
sheets, and consent forms from the University of Manchester. In the meeting, the
research respondents were also requested to return the completed
questionnaires to their office’s Human Resources Section within two weeks’ time.
After two weeks, the researcher returned to each customs and excise organisation
to collect the completed survey questionnaires from their respective Human
Resource Sections.

131
Due to the Indonesian language’s status as Indonesia’s official language and to the
importance of avoiding any misinterpretation of the questionnaire, the researcher
provided the survey questionnaires in the Indonesian language. During the
fieldwork process, the researcher was able to collect 1,675 completed survey
questionnaires, reflecting a response rate of 85%. As can be seen in Table 6.1, the
MSO of Tg. Priok contributed the greatest number of respondents, with 301
participants, or 18% of the total survey questionnaires returned. The office
returning the second largest number of contributing respondents was MSO
Soetta, with 233 participants (14% of the total survey questionnaires returned).
MSO Batam was the third largest contributor with 168 participating employees
(10% of the total survey questionnaires returned). Table 6.1 below recapitulates
the distribution and collection of the survey questionnaires in each of the customs
and excise organisations.
Table 6.1 Distribution, collection and response rate of the survey questionnaire
Office Organisation
Size
Questionnaires
Distributed
Questionnaires
Collected
Response
rate
1 MSO Tg. Priok Large 325 301 92%
2 MSO Batam Large 180 168 93%
3 MSO Soetta Large 320 233 73%
4 CEO Marunda Small 120 118 98%
5 CEO Jakarta Small 130 81 62%
6 CEO Tangerang Small 144 143 99%
7 CEO Merak Small 80 77 96%
8 CEO Bogor Small 145 115 79%
9 CEO Bekasi Small 165 159 96%
10 CEO Cikarang Small 140 92 66%
11 CEO Purwakarta Small 110 93 84%
12 CEO Bandung Small 110 95 86%
Total 1969 1675 85%
For the purpose of the extended study, the researcher classified the participating
organisations into large and small organisations following the office typology as
stipulated in Minister of Finance Decree of the Republic of Indonesia Number
206.3/PMK.01/2014. Based on this typology, the MSOs of Tanjung Priok, Batam
and Soetta qualify as large organisations, while the CEOs of Marunda, Jakarta,

132
Tangerang, Merak, Bogor, Bekasi, Cikarang, Purwakarta and Bandung are classified
as small organisations. With this organisational size classification, the researcher
then examined the association of both the large and small organisations with
implementation.
6.3 Research questions, hypotheses and rationale construction
This chapter provides results on the use of the BSC as represented by the SFO
principles initially stated by Kaplan and Norton (2001c). The five SFO principles are
strategy translation (st), strategy alignment (sa), strategy as everyone’s everyday
job (sj), strategy as a continuous process (sp) and leadership involvement (li).
Furthermore, this chapter contains two major analyses: the confirmation of the
BSC implementation model according to the framework of the five SFO principles
and the examination of BSC usage. In the latter part of the chapter, the researcher
also provides the findings regarding the association of BSC implementation with
organisation size and strategic roles/other employee roles within the twelve
customs and excise organisations. Table 6.2 displays a summary of the hypotheses
as they correspond to the research questions addressed in this chapter.

133
Table 6.2 Links between research questions and hypotheses
Research question Hypothesis
RQ1. How do SFO principles relate to each other within the implementation of the BSC?
H1. SFO principles correlate positively with each other within the implementation of the BSC.
RQ2. To what extent are organisational factors associated with the implementation of the BSC?
H2. The large organisation has more influence on the implementation of BSC than the small organisation. H2a.The level of BSC strategy translation is higher for
employees in large organisations than for employees in small organisations;
H2b.The level of BSC strategy alignment is higher for employees in large organisations than for employees in small organisations;
H2c.The level of the strategy everyone’s everyday job through in large organisation is higher than that of small organisation;
H2d.The level of the strategy as a continuous process through BSC in large organisation is higher than that of small organisation;
H2e. The level of leadership involvement in BSC is higher in large organisations than in small organisations.
H3. Employees holding strategic roles have more influence on BSC implementation than other employees. H3a. The level of BSC strategy translation is higher among
employees holding strategic roles is higher than among other employees;
H3b. The level of BSC strategy alignment is higher among employees holding strategic roles than among other employees;
H3c. The level of implementation of the BSC strategy as everyone’s everyday job is higher among employees holding strategic roles than among other employees;
H3d. The level of BSC strategy as a continuous process is higher among employees holding strategic roles than among other employees;
H3e. The level of BSC leadership involvement is higher among employees holding strategic roles than among other employees.
In this study, large organisation size is hypothesised to have a positive relationship
with the implementation of the BSC because a broader set of information and
measurements arises in larger organisations, requiring more advanced and more
sophisticated management accounting systems (Speckbacher et al. 2003). This
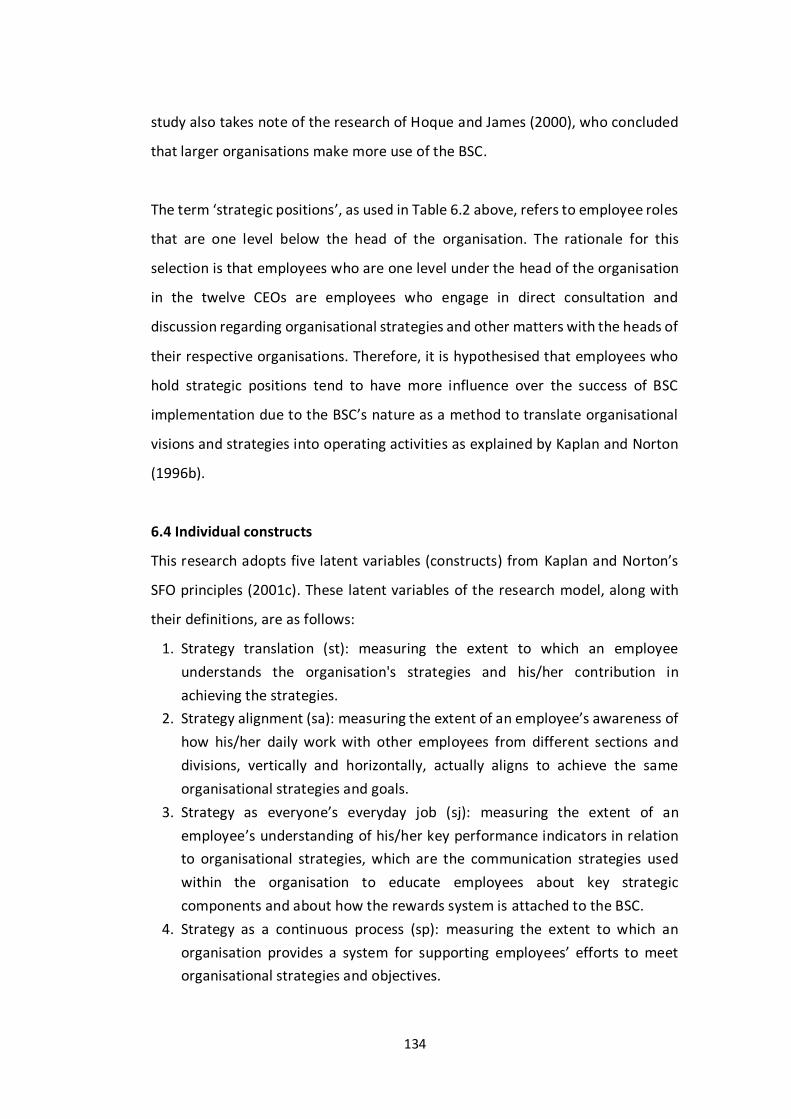
134
study also takes note of the research of Hoque and James (2000), who concluded
that larger organisations make more use of the BSC.
The term ‘strategic positions’, as used in Table 6.2 above, refers to employee roles
that are one level below the head of the organisation. The rationale for this
selection is that employees who are one level under the head of the organisation
in the twelve CEOs are employees who engage in direct consultation and
discussion regarding organisational strategies and other matters with the heads of
their respective organisations. Therefore, it is hypothesised that employees who
hold strategic positions tend to have more influence over the success of BSC
implementation due to the BSC’s nature as a method to translate organisational
visions and strategies into operating activities as explained by Kaplan and Norton
(1996b).
6.4 Individual constructs
This research adopts five latent variables (constructs) from Kaplan and Norton’s
SFO principles (2001c). These latent variables of the research model, along with
their definitions, are as follows:
1. Strategy translation (st): measuring the extent to which an employee
understands the organisation's strategies and his/her contribution in
achieving the strategies.
2. Strategy alignment (sa): measuring the extent of an employee’s awareness of
how his/her daily work with other employees from different sections and
divisions, vertically and horizontally, actually aligns to achieve the same
organisational strategies and goals.
3. Strategy as everyone’s everyday job (sj): measuring the extent of an
employee’s understanding of his/her key performance indicators in relation
to organisational strategies, which are the communication strategies used
within the organisation to educate employees about key strategic
components and about how the rewards system is attached to the BSC.
4. Strategy as a continuous process (sp): measuring the extent to which an
organisation provides a system for supporting employees’ efforts to meet
organisational strategies and objectives.

135
5. Leadership involvement (li): getting to know how leaders in the organisation
play a role in encouraging other employees to enhance performance to meet
targeted outcomes.
As regards latent variables, Bartholomew et al. (2011) posited the reduction of
dimensionality as one of the reasons for which latent variables should be
introduced into a model. The authors explained that the information contained in
the interrelationships of many variables can be better approximated if the
variables are placed in a much smaller set of variables, thus enabling an overview
of the structure of the data. The rationality of such a course is often evident from
the fact that many questions overlap in the sense that they are measuring the
same object. In such a situation, the latent variable is introduced to condense the
many variables into a much smaller number of indices with as little loss of
information as possible. In that sense, the five latent variables enumerated above
represent 24 observed variables measured in the survey questionnaire to obtain a
better sense of the structure of the data with fewer dimensionalities.
6.5 Descriptive statistics
The descriptive statistics in this study are divided into three parts: the individual
characteristics of the respondents, the distribution of the completed
questionnaires, and the descriptive statistics of the construct variables. The
descriptive statistics on individual characteristics contain information regarding
the distribution of responding employees in terms of age, gender, education level,
employee role, working rank and working tenure. Meanwhile, the distribution of
the completed questionnaires comprises a summary of the responses to the
questionnaire items about the BSC on 7-point Likert scales. The descriptive
statistics of the construct variables provide information regarding means,
standard deviations and the Spearman’s rank correlation coefficients.
6.5.1 Descriptive statistics of respondents’ characteristics

136
The survey respondents were dominated by employees aged 18 to 45. This age
group represented more than 78% of the respondents who completed
questionnaires (1,298 of 1,675), followed by respondents aged 51 to 55 with
9.45% (157), those aged 46 to 50 with 6.92% (115) and those 55 and older with
5.48% of the total number of respondents (91 of 1,675). From the gender
perspective, 85.4% (1430) were men and 13.7% (230) were women. In terms of
educational level, 35.6% (596) employees had obtained a Diploma I, Bachelor’s
graduates were in second place with 25.4% (425) employees, and the remainder
of the respondents varied, having obtained a Diploma III, master’s degree, high
school diploma or a doctoral degree.
With regard to job level classification, staff-level employees contributed the most
questionnaires with 63.3% (1,061), followed by Echelon 5 with 19.4% (325),
Echelon 4 with 10% (167), functional officers with 5.7% (96) and Echelon 3 with
1.4% (23). In terms of working rank, 51.2% (858 employees) were at Rank II, 43.2%
(730 employees) were at Rank III and 5.1% (85 employees) were at Rank IV. From
the perspective of working years, the majority (74.6%) of respondents had been
at their respective organisations for fewer than 5 years (1,251 employees),
followed by employees who had been at their respective organisations for more
than 10 years at 16.5% (276 employees) and employees with 6-10 years tenure at
7.9% of respondents (133 employees). Table 6.3 provides detailed information
regarding respondent age, gender, educational level, employee role, working rank
and organisation tenure.

137
Table 6.3 Descriptive statistics of respondents’ characteristics
Individual characteristics Frequency Percentage
(%)
Missing (%)
Age
18-30 years old 782 47.08 0.8
>30-45 years old 516 31.07
>45-50 years old 115 6.92
>50-55 years old 157 9.45
>55 years old 91 5.48
Gender
Male 1430 85.4 0.9
Female 230 13.7
Education
High school 185 11.0 1.1
Diploma I 596 35.6
Diploma III 235 14.0
Bachelor’s degree 425 25.4
Master’s degree 214 12.8
Doctoral degree 1 0.1
Employees’ role
Staff 1061 63.3 0.2
Functional officer 96 5.7
Echelon 5 325 19.4
Echelon 4 167 10
Echelon 3 23 1.4
Working rank
Rank II 858 51.2 0.1
Rank III 730 43.6
Rank IV 85 5.1
Working tenure
< 1 year 384 22.9 0.9
1-2 years 406 24.2
> 2-5 years 461 27.5
>5-10 years 133 7.9
>10 years 276 16.5
6.5.2 Descriptive statistics of 7-point Likert scale responses
Table 6.4 displays the mean, standard deviation and percentage of answers on
each point of the Likert scale for each item within the five latent variables. The
table shows that the mean of the items in the survey questionnaire ranges from
4.98 (Item st2, ‘I know all about our organisation’s KPIs’) to 6.10 (Item sa1, ‘The
organisational KPIs are cascaded proportionately’). The range of means shows that
most respondents tended to answer within the range of ‘neither agree nor
disagree’ to ‘agree’ across all items in the questionnaire.

138
Table 6.4 Summary of 7-point Likert scale questionnaire distribution
Item Item
Question Mean
Standard Deviation
Percentage
(1) (2) (3) (4) (5) (6) (7)
st1 Our organisation’s strategy map helps me to better understand our organisation’s strategic objectives
5.84 0.82 0.1 .2 .8 5.7 17.3 59.8 16.1
st2 I know all about our organisation’s KPIs 4.98 1.42 1.0 9.1 4.4 17.4 22.2 36.4 9.5
st3 I know all about our organisation’s KPI targets
5.00 1.41 0.8 8.6 4.6 16.6 23.9 36.1 9.5
st4 My KPIs relate to the organisation’s strategic objectives
5.80 0.97 0.1 1.3 1.0 8.0 14.8 55.4 19.4
sa1 The organisational KPIs are cascaded
proportionately 6.10 0.71 0 0.1 0.4 2.8 8.5 62.6 25.5
sa2 The organisational KPI targets are cascaded proportionately
5.99 0.76 0.1 0.1 0.7 4.3 8.4 62.2 25.4
sa3 My KPIs are aligned with those of other colleagues at the same level
5.87 0.86 0.1 0.9 1.0 5.4 12.0 64.0 16.5
sj1 My KPIs are in line with the organisational
KPIs 5.91 0.79 0.1 0.3 0.8 5.1 12.4 64.1 17.3
sj2 I have good quality KPIs 6.02 0.67 0 0.2 0.4 2.5 10.2 67.9 18.8
sj3 My KPI targets are realistic 6.04 0.68 0.1 0.2 0.5 1.9 9.2 68.7 19.5
sj4 My KPI targets support the accomplishment of organisational targets
6.05 0.73 0 0.4 0.5 2.6 10.2 63.3 23.0
sj5 There is active dialogue with my direct supervisor when determining my KPIs
5.99 0.88 0.1 0.9 1.1 3.8 10.6 58.3 25.1
sj6 There is active dialogue with my direct supervisor when determining my KPI
targets
5.79 0.96 0.1 1.4 1.9 4.8 16.5 57.8 17.4
sj7 The rewards system is linked to KPI target achievement
5.41 1.19 0.9 3.1 3.3 10.7 21.5 50.2 10.4
sp1 My competence development is aligned with organisational strategy
5.55 1.014 0.6 1.3 1.7 10.0 20.7 55.8 9.8
sp2 BSC management is supported with sound
information technology 5.52 1.09 0.6 1.9 3.7 7.3 23.2 51.3 12.0
sp3 I find the performance reporting procedure easily understandable
5.66 0.99 0.4 1.3 3.1 5.4 19.3 58.2 12.4
sp4 Performance reporting requires solid proof 5.89 0.81 0.1 0.8 0.8 4.3 13.0 64.8 16.3
li1 The head of the organisation educates me about performance management based on the BSC
5.62 1.03 0.2 1.8 1.7 9.2 19.6 53.6 13.8
li2 The head of the organisation provides sufficient information regarding the organisation’s strategies and goals
5.86 .906 0.2 1.8 1.7 9.2 19.6 53.6 13.8
li3 I know all about our organisation’s objectives
5.55 1.03 0.2 1.4 2.4 9.5 24.5 49.2 12.6
li4 The head of the organisation motivates me
to accomplish my targets 5.88 0.96 0.2 0.8 1.7 5.8 14.3 54.2 23.1
li5 My direct supervisor actively guides me to reach my performance goals
5.98 0.89 0.1 0.8 1.4 4.0 10.5 58.5 24.6
li6 My direct supervisor monitors my performance through my KPIs
6.04 0.80 0.2 0.3 0.9 3.4 9.4 61.4 24.5
Notes: (1) = strongly disagree; (2) = moderately disagree; (3) = slightly disagree; (4) = neither disagree nor agree; (5) = slightly agree; (6) = moderately agree; (7) = strongly agree.

139
6.5.3 Descriptive statistics of construct variables
This section provides information about all observed variables in each latent
construct regarding means, standard deviations and Spearman’s rank correlation
coefficients.
6.5.3.1 Strategy translation
This latent variable consists of four observed variables (st1, st2, st3 and st4). On
the 7-point Likert scales, research respondents answered the items representing
the four observed variables between 4.98 (± 1.43) and 5.83 (± 0.82), which
reflected respondents’ strong opinions about strategy translation. Item st1 (Our
organisation’s strategy map helps me to better understand our organisation’s
strategic objectives) scored highest score, followed by Item st4 (My key
performance indicators relate to the organisation’s strategic objectives), and Item
st3 (I know all about our organisation’s KPI targets), with Item st2 (I know all about
our organisation’s KPIs) receiving the lowest rating.
Table 6.5 Descriptive statistics of strategy translation variable
Item Variable Mean St.D. st1 st2 st3 st4
st1 Our organisation’s strategy map helps me to better understand our organisation’s strategic objectives
5.83 0.82 1
st2 I know all about our organisation’s KPIs
4.98 1.43 0.53* 1
st3 I know all about our organisation’s KPI targets
5.01 1.41 0.54* 0.88* 1
st4 My KPIs relate to the organisation’s strategic objectives
5.80 0.97 0.50* 0.47* 0.51* 1
Note: St.D. = standard deviation.
N=1643; * indicates that correlations are statistically significant at ρ < 0.01.
6.5.3.2 Strategy alignment
This latent variable consists of three observed variables (sa1, sa2, and sa3). On the
7-point Likert scale, research respondents answered items corresponding to the

140
three observed variables between 5.86 (± 0.86) and 6.09 (± 0.70), which reflected
respondents’ strong opinions about strategy alignment. Item sa1 (The
organisational KPIs are cascaded proportionately) scored highest, followed by
Item sa2 (The organisational KPI targets are cascaded proportionately). Item sa3
(My key performance indicators are aligned with those of other colleagues at the
same level) received the lowest score.
Table 6.6 Descriptive statistics of strategy alignment variable
Item Variable Mean St.D sa1 sa2 sa3
sa1 The organisational KPIs are cascaded proportionately
6.09 0.70 1
sa2 The organisational KPI targets are cascaded proportionately
5.99 0.76 0.70* 1
sa3 My KPIs are aligned with those of other colleagues at the same level
5.86 0.86 0.51* 0.61* 1
Note: St.D = standard deviation.
N=1661; * indicates that correlations are statistically significant at ρ < 0.01.
6.5.3.3 Strategy as everyone’s everyday job
This latent variable consists of seven observed variables (sj1, sj2, sj3, sj4, sj5, sj6
and sj7). On the 7-point Likert scale, research respondents answered the seven
items representing the observed variables between 5.41 (± 1.19) and 6.05 (± 0.73),
reflecting respondents’ strong opinions on strategy as everyone’s everyday job.
Item sj4 (My KPI targets support the accomplishment of organisational targets)
had the highest score, followed by Item sj3 (My KPI targets are realistic), Item sj2
(I have good quality of key performance indicators) and Item sj5 (There is active
dialogue with my direct supervisor when determining my KPIs). Item sj1 (My KPIs
are in line with organisational KPIs) placed fifth, followed by Item sj6 (There is
active dialogue with my direct supervisor when determining my KPI targets), and
the lowest rated item, Item sj7 (The rewards system is linked to KPI target
achievement). Overall, the average mean score of the seven observed variables,
at 5.88, was far above the neutral point.

141
Table 6.7 Descriptive statistics of the strategy as everyone’s everyday job
variable
Item Variable Mean St.D sj1 sj2 sj3 sj4 sj5 sj6 sj7
sj1 My KPIs are in line with the organisational KPIs 5.9 0.791 1
sj2 I have good quality KPIs 6.01 0.677 0.63* 1
sj3 My KPI targets are realistic 6.04 0.681 0.51* 0.63* 1
sj4 My KPI targets support the accomplishment of organisational targets 6.05 0.732 0.62* 0.60* 0.57* 1
sj5 There is active dialogue with my direct supervisor when
determining my KPIs 5.99 0.887 0.44* 0.48* 0.52* 0.50* 1 sj6 There is active dialogue with my
direct supervisor when determining my KPI targets 5.79 0.958 0.44* 0.44* 0.44* 0.39* 0.66* 1
sj7 The rewards system is linked to KPI target achievement 5.41 1.189 0.39* 0.38* 0.34* 0.34* 0.36* 0.45* 1
Note: St.D = standard deviation.
N=1645; * indicates that correlations are statistically significant at ρ < 0.01.
6.5.3.4 Strategy as a continuous process
This latent variable consists of four observed variables (sp1, sp2, sp3 and sp4). On
the 7-point Likert scale, research respondents answered the items corresponding
to the four observed variables between 5.52 (± 1.09) and 5.88 (± 0.81), reflecting
respondents’ strong opinions on strategy as a continuous process. Item sp4
(Performance reporting requires solid proof) reached the highest score, followed
by Item sp3 (I find the performance reporting procedure easily understandable),
Item sp1 (My competence development is aligned with organisational strategy)
and lastly Item sp2 (BSC management is supported by sound information
technology) with the lowest score. Overall, the average mean score of the four
observed variables was 5.40, which was far above the neutral point.
Table 6.8 Descriptive statistics of strategy as a continuous process variable
Item Variable Mean Std. D sp1 sp2 sp3 sp4
sp1 My competence development is aligned with organisational strategy 5.55 1.01 1
sp2 BSC management is supported with sound information technology 5.52 1.09 0.58* 1
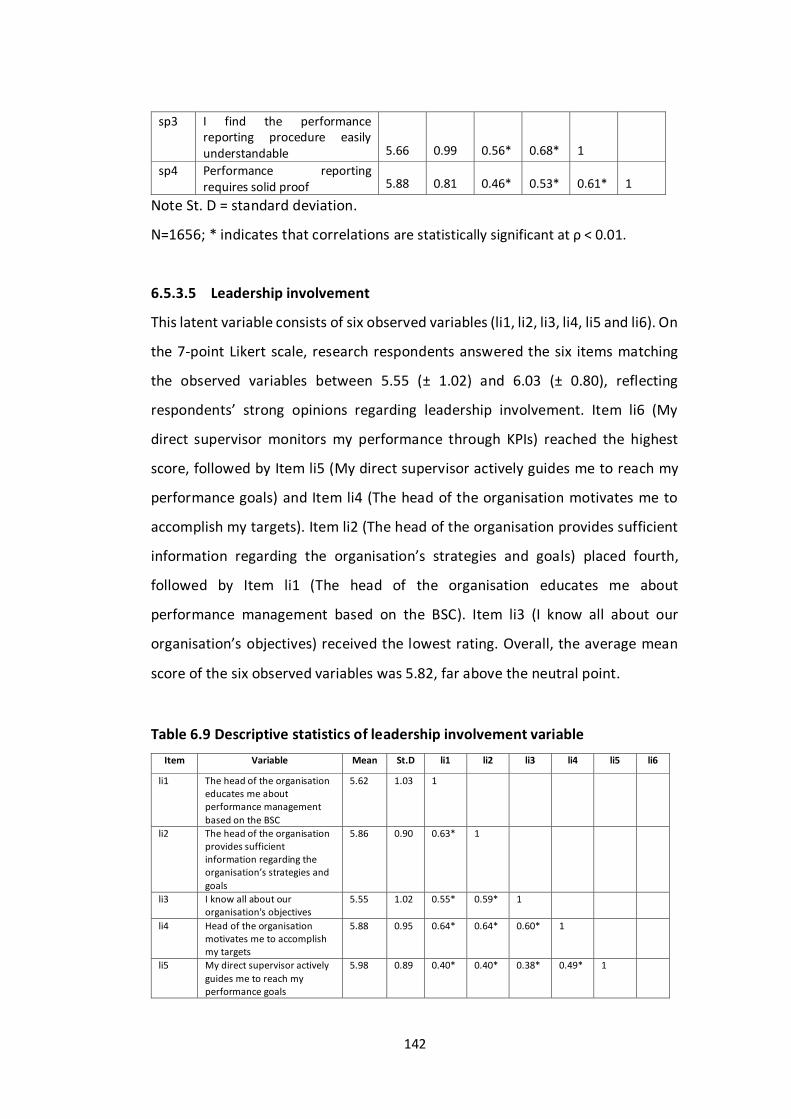
142
sp3 I find the performance reporting procedure easily understandable 5.66 0.99 0.56* 0.68* 1
sp4 Performance reporting requires solid proof 5.88 0.81 0.46* 0.53* 0.61* 1
Note St. D = standard deviation.
N=1656; * indicates that correlations are statistically significant at ρ < 0.01.
6.5.3.5 Leadership involvement
This latent variable consists of six observed variables (li1, li2, li3, li4, li5 and li6). On
the 7-point Likert scale, research respondents answered the six items matching
the observed variables between 5.55 (± 1.02) and 6.03 (± 0.80), reflecting
respondents’ strong opinions regarding leadership involvement. Item li6 (My
direct supervisor monitors my performance through KPIs) reached the highest
score, followed by Item li5 (My direct supervisor actively guides me to reach my
performance goals) and Item li4 (The head of the organisation motivates me to
accomplish my targets). Item li2 (The head of the organisation provides sufficient
information regarding the organisation’s strategies and goals) placed fourth,
followed by Item li1 (The head of the organisation educates me about
performance management based on the BSC). Item li3 (I know all about our
organisation’s objectives) received the lowest rating. Overall, the average mean
score of the six observed variables was 5.82, far above the neutral point.
Table 6.9 Descriptive statistics of leadership involvement variable
Item Variable Mean St.D li1 li2 li3 li4 li5 li6
li1 The head of the organisation educates me about performance management
based on the BSC
5.62 1.03 1
li2 The head of the organisation provides sufficient information regarding the organisation’s strategies and
goals
5.86 0.90 0.63* 1
li3 I know all about our organisation's objectives
5.55 1.02 0.55* 0.59* 1
li4 Head of the organisation motivates me to accomplish my targets
5.88 0.95 0.64* 0.64* 0.60* 1
li5 My direct supervisor actively
guides me to reach my performance goals
5.98 0.89 0.40* 0.40* 0.38* 0.49* 1

143
li6 My direct supervisor monitors my performance through key performance indicator
6.03 0.80 0.41* 0.41* 0.43* 0.48* 0.70* 1
Note: St.D mean standard deviation.
N=1650, * means correlations are statistically significant at ρ < 0.01
6.5.3.6 Mean ranking score of latent variables
Table 6.10 provides information on all five latent variables with respect to their
number of observed variables, means, standard deviations and mean rankings.
Based on the mean rankings, the latent variable of strategy alignment received the
highest score (mean= 5.98), followed by strategy as everyone’s everyday job
(mean= 5.88), leadership involvement (mean= 5.82), strategy as a continuous
process (mean= 5.62), and lastly strategy translation (mean= 5.40). From these
rankings, it appears that, among the five principles of SFO, strategy alignment has
the strongest influence on BSC implementation while strategy translation has the
least influence.
Table 6.10 Mean rankings of latent variables
Latent Variable Number of
Observed
Variables
Mean Standard
Deviation
Mean
Ranking
Strategy translation 4 5.40 1.16 5
Strategy alignment 3 5.98 0.77 1
Strategy as everyone’s everyday job 7 5.88 0.845 2
Strategy as a continuous process 4 5.62 0.97 4
Leadership involvement 6 5.82 0.93 3
6.6 Data processing analysis techniques
The analysis of this research is classified as multivariate analysis due to its
simultaneous analysis of more than two variables (Hair et al. 2010). With respect
to the selection of the analysis techniques, this research applies techniques on the
basis of how the unique research questions need to be answered. The first
144
research question, How do SFO principles relate to each other within
implementation of the BSC?, was analysed using CFA. As discussed in Chapter 5,
following Widaman (2003), Hair et al. (2010) and Kaplan and Norton (2001c), this
choice was made because the intention of the question is to check current
knowledge, in this case, regarding the framework of the BSC (Kaplan and Norton
2001). Meanwhile, to address the second research question, To what extent are
organisational factors associated with the implementation of BSC?, the
multivariate technique used is SEM. SEM was chosen because of its ability to
examine the structure of interrelationships among the latent factors (latent
variables). In this case, the latent factors being analysed are the five that were
generated from the BSC framework and constructed and confirmed in the first
research question. Figure 6.1 summarises the research framework constructed for
this chapter.
Figure 6.1 Research framework and techniques for analysis of organisation size,
employee roles and the BSC
Strategy translation
Strategy alignment
Strategy as everyone’s everyday
job
Strategy as a continuous process
Leadership involvement
Organisation size
Employee roles
Analysis technique: SEM
Analysis technique: CFA
BSC implementation

145
6.7 Data analysis preparation
Prior to the main data analysis process, data screening was conducted to reveal
easily overlooked hidden effects and thus enable a clearer view of the data (Hair
et al. 2010). Thus, for the purposes of data analysis preparation, this section
discusses sample size analysis, missing data, outliers, and normality of data
distribution.
6.7.1 Analysis of sample size
In this part of the research, the analytical techniques applied are CFA and SEM.
According to Tabachnick and Fidel (2007, p. 682), SEM and factor analysis are
techniques intended for large samples. Regarding minimum sample size, Hair et
al. (2010) suggested that five considerations should be taken into account when
determining the sample size in SEM. These are multivariate normality of the data,
estimation technique, model complexity, amount of missing data and average
error variance among the reflective indicators. Furthermore, Hair et al. (2010, p.
667) suggested that samples of more than 500 are considered large.
However, Kline (2011) posited that it is difficult to know when a sample is large
enough to be analysed using SEM. Kline (2011, p. 12) also explained that more
parameters require more estimates and that large samples are therefore needed
for reasonably stable results. He then cited Jackson (2003) to explain the N:q rule,
which concerns the connection between sample size and model complexity. In this
formula, N represents sample size, while q represents a number of model
parameters that require statistical estimates. Kline stated that an ideal sample size
to parameters ratio would be 20:1. Comrey and Lee (1992, p. 217) suggested that
the adequacy of sample size for factor analysis might be evaluated very roughly on
the following scale: 50 to 100 samples (very poor), 101 to 200 samples (poor), 201
to 300 samples (fair), 301 to 500 samples (good), 501 to 1000 (very good) and
more than 1000 (excellent). Therefore, according to Comrey and Lee, the sample
size of 1,675 in this research would be classified as ‘excellent’.

146
6.7.2 Analysis of missing data
Missing data is in general very difficult to avoid when performing research. Missing
data may occur for a number of reasons. Allison (2002) named several causes of
missing data: research participants might overlook or forget to answer some of
the questions, some respondents might refuse to answer some items in the survey
questionnaire, or certain questions may not be applicable to some research
respondents such that they do not know how to respond. Missing data can be
crucial when their numbers are significant to the total sample taken due to the
resultant bias created in the analysis results. Despite the researcher’s efforts, the
possibility of missing values remains, especially with the involvement of a large
number of participants (1,675 in the present study). The missing data analysed in
this section originated from completed survey questionnaires, excluding items
representing observed variables of OC and PSM as these variables are discussed in
the next chapter.
Tabachnick and Fidel (2007, p. 63) stated that there is as yet no reliable way to
calculate the amount of missing data that can be tolerated for a sample of a given
size. In this regard, Hair et al. (2010, p. 47) suggested reaching a determination
based on two conditions: first, in individual cases or observations, missing data
totalling less than 10 percent can generally be ignored except when the missing
data occurs in a specific non-random fashion (for example, when it is concentrated
in a specific set of questions). Second, the complete cases must be sufficient for
the selected analysis technique if no data imputation process has been conducted.
For the present study, the researcher calculated the proportions of missing data
in each variable by using codebook command in STATA 14. Table 6.11 provides a
summary of missing values distribution in all 24 observed variables. The
proportions of missing values for all 24 variables range from 0.36% to 1.13%, and
the overall missing values total 69 cases (4.11%). The remaining complete cases
available for the subsequent analysis total 1609. Hence, both of Hair and

147
colleagues’ (2010, p. 47) conditions are met: the missing data for individual cases
was calculated at 0.36% to 1.13%, and the total observations (4.11%) and the total
complete cases (1609) are at an acceptable level.
Table 6.11 Distribution of missing values
Items M
%
C Codes Variables
st1 Our organisation’s strategy map helps me to better understand our organisation’s strategic objectives 12 0.72% 1663
st2 I know all about our organisation’s KPIs 14 0.84% 1661
st3 I know all about our organisation’s KPI targets 19 1.13% 1656
st4 My KPIs relate to the organisation’s strategic objectives 18 1.07% 1657
sa1 The organisational KPIs are cascaded proportionately 11 0.66% 1664
sa2 The organisational KPI targets are cascaded proportionately 12 0.72% 1663
sa3 My KPIs are aligned with those of other colleagues at the same level 12 0.72% 1663
sj1 My KPIs are in line with the organisational KPIs 13 0.78% 1662
sj2 I have good quality KPIs 14 0.84% 1661
sj3 My KPI targets are realistic 15 0.90% 1660
sj4 My KPI targets support the accomplishment of organisational targets 15 0.90% 1660
sj5 There is active dialogue with my direct supervisor when determining my KPIs 12 0.72% 1663
sj6 There is active dialogue with my direct supervisor when determining my KPI targets 12 0.72% 1663
sj7 The rewards system is linked to KPI target achievement 14 0.84% 1661
sp1 My competence development is aligned with organisational strategy 13 0.78% 1662
sp2 BSC management is supported with sound information technology 15 0.90% 1660
sp3 I find the performance reporting procedure easily understandable 14 0.84% 1661
sp4 performance reporting requires solid proof 14 0.84% 1661
li1 The head of the organisation educates me about performance management based on the BSC 12 0.72% 1663
li2 The head of the organisation provides sufficient information regarding organisation’s strategies and goals 7 0.42% 1668
li3 I know all about our organisation’s objectives 12 0.72% 1663
li4 The head of the organisation motivates me to accomplish my targets 10 0.60% 1665
li5 My direct supervisor actively guides me to reach my performance goals 9 0.54% 1666
li6 My direct supervisor monitors my performance through my KPIs 6 0.36% 1669
Note: M = missing values; % = percentage of missing questionnaires of total
observations (N = 1,675); C = complete observations.
6.7.3 Analysis of outliers
Kline (2011) defined outliers as the scores that are different from the rest. Hair et
al. (2010, p. 64) gave a more detailed definition by referring to outliers as

148
observations with a unique combination of characteristics identifiable as distinctly
different from the other observations. Hair et al. (2010) further explained that a
unique characteristic refers to an unusually high or low value on a variable or a
unique combination of values of several variables that make an observation stand
out from the others. Hair et al. (2010) classified outliers into four possible groups:
1) outliers that occur due to a procedural error such as a data entry error or a
mistake in coding; 2) outliers that result from an extraordinary event which
considers the uniqueness of the observation. In such a case, the researcher must
determine whether the extraordinary event fits the objective of the research; if
yes, the outliers should be retained, and not, they should not; 3) outliers that
result from extraordinary observations that cannot be explained by the
researcher; 4) outliers that consist of observations that fall within the ordinary
range of values on each of the variables. In such a case, unless specific evidence is
available, the researcher should retain the outliers.
In this research, a frequency test was first conducted to determine the distribution
of participants answering the survey questionnaires. The data assessed were all
24 variables under the classification of five latent variables: leadership
involvement (li), strategy translation (st), strategy alignment (sa), strategy as
everyone’s everyday job (sj) and strategy as a continuous process (sp). In
examining the results, it was determined that any ‘unidentified number’ (a
number not conforming to a 7-point Likert scale) appearing in the survey
questionnaire would be treated as an outlier). From all 24 variables, one outlier
appeared in Item li4. Table 6.11 provides information about the distribution of
complete answers to Item li4. Referring to Hair and colleagues’ (2010)
classifications, this outlier might have appeared due to a procedural error such as
data entry error or a mistake in coding.
Table 6.12 Frequency of Item li4
li4 Frequency Percentage Cumulative
1 3 0.18 0.18

149
As can be seen in Table 6.12, there is one answer (number 8) that is not part of a
7-point Likert scale. Having found the outlier, the next step to be performed was
to locate the position of the outlier (case number). Nick Cox’s extremes command
using the STATA program was conducted to identify which case contained the
score 8.
Table 6.13 Extreme values of Item li4
Case Scale
438 1
750 1
1425 1
414 2
532 2
1671 7
1673 7
1674 7
1675 7
54 8
Table 6.13 shows that the value 8 appears in observation data number 54. Case
number 54 was thus deleted to avoid any bias in the subsequent analysis process.
The final total number of samples for the subsequent analysis is therefore 1,674.
2 13 0.78 0.96
3 28 1.68 2.64
4 96 5.77 8.41
5 238 14.29 22.7
6 902 54.17 76.88
7 384 23.06 99.94
8 1 100

150
6.7.4 Analysis of data distribution normality
After completing the analysis of outliers, the researcher proceeded by conducting
a normality test of data distribution. As in the test of outliers, the data tested were
all 24 variables under the classification of five latent variables: leadership
involvement (li), strategy translation (st), strategy alignment (sa), strategy as
everyone’s everyday job (sj) and strategy as a continuous process (sp).
The normality of observed variables is analysed with either a statistical or a
graphical approach (Tabachnik and Fidel 2007). Hair et al. (2010) mentioned that
the shape of any data distribution can be examined by means of two statistical
parameters: kurtosis and skewness. Furthermore, Hair et al. (2010) explained that
kurtosis refers to the ‘peakedness or flatness of the distribution compared with
the normal distribution’; skewness describes the balance of data distribution. If
the data distribution is unbalanced, then it is called skewed. A positive skew means
that data distribution shifts to the left and, a negative skew means that data
distribution shifts to the right. Furthermore, Hair et al. (2010) explained that values
above or below zero denote departures from normality, with negative kurtosis
values indicating flatter distribution and positive values representing peaked
distribution. Similarly, positive skewness values indicate that the data distribution
shifts to the left, while negative skewness values denote a rightward shift.
In order to observe the normality of the variables, this research applied Doornik-
Hansen omnibus, Shapiro-Wilk and kurtosis and skewness methods using STATA
14 statistic software. If the test is non-significant (ρ >0.05), it means that the data
distribution does not significantly differ from a normal distribution, or that the
data distribution is normal. However, if the test is significant where ρ <0.05, it
indicates that the data distribution significantly differs from a normal distribution,
or that the data does not meet the condition of normal distribution.

151
The Doornik-Hansen test showed p-values of less than 0.05, indicating
significance. As for the Shapiro-Wilk method, the normality assessment test
results as shown in Appendix 6 showed p-values of less than 0.05 for all observed
variables. The last test performed, using the kurtosis and skewness methods,
showed p-values in all observed variables excluding st2 and st4 to be less than 0.05
(Appendix 7).
In sum, the three normality measurements used (Doornik-Hansen omnibus,
Shapiro-Wilk and kurtosis and skewness) showed p-values of less than 0.05 in all
observed variables excluding st2 and st4 (according to the kurtosis and skewness
test). This means that the data deviate from normality and thus indicates that the
data distributions are not normal. Non-normality occurs frequently in large
samples; Hair et al. (2010, p. 72) noted that in most instances with large sample
sizes, the researcher can be less concerned about non-normal variables. A similar
view was espoused by Tabachnik and Fidel (2007, p. 80): ‘In a large sample, a
variable with statistically significant skewness often does not deviate enough from
normality to make a substantive difference in analysis and the impact of departure
from zero kurtosis also diminishes’.
6.8 Data analysis
Hair et al. (2010) define confirmatory factor analysis (CFA) as a way of testing how
well measured variables represent a small number of constructs. The authors
explained that CFA is used to provide a confirmatory test of measurement theory
which specifies a series of relationships. These relationships suggest how
measured variables represent a latent construct that is not measured directly.
Brown (2015) stated that CFA is an essential technique for construct validation in
the social and behavioural sciences because CFA can produce ‘compelling
evidence of the convergent and discriminant validity of theoretical constructs’.
Furthermore, Brown (2015, p. 2) emphasised that the fundamental strength of
CFA in construct validation is that the resulting estimates of convergent and

152
discriminant validity are adjusted for measurement error and an error theory. As
such, CFA provides a stronger diagnostic framework than traditional techniques.
This research follows the steps of CFA as prescribed by Hair et al. (2010). The steps
are as follows: defining an individual construct, developing the overall
measurement model, designing a study to generate empirical results, and
assessing measurement model validity.
The variables of the first section adopt the five SFO principles: strategy translation,
strategy alignment, strategy as everyone’s everyday job, strategy as a continuous
process and leadership involvement (Kaplan and Norton 2001c). In this section of
the chapter, the focus is twofold. The first aim was to validate the construct of SFO
principles to determine whether the model as proposed by Kaplan and Norton
(2001c) holds in this research. The researcher applied the SFO principles as latent
variables. Each of the latent variables is a composite of several of the total of 24
items. The distribution of the variables within each of the latent variables is as
follows: leadership involvement with 6 items, strategy translation with 4 items,
strategy alignment with 3 items, strategy as everyone’s everyday job with 7 items,
and strategy as a continuous process with 4 items. Figure 6.2 presents the BSC
implementation model used as a base model in a later stage of the analysis.
The CFA assessment of the measurement model was applied by using STATA 14
and performing maximum likelihood (ML) estimation following Bartholomew et al.
(2011, p. 29). The model resulting from this test was then used for the further
examination of the associations between the BSC and organisational factors and
between the BSC and strategic employees’ roles (in Section 6.8.7.3); in addition, it
was used to examine the impact of adopting the BSC on organisational
commitment and PSM (Chapter 7).

153
Figure 6.2 Initial model of BSC implementation
ST
1
ST
4
S
T
3
S
T
2
SJ
1
SA
2
S
A
1
SA
3
SJ
5
SJ
2
SJ
4 SJ
6
SJ
7
SJ
3 S
P1
SP
2
SP
3
SP
4
LI
1
LI
2
LI
3
LI
4 LI
5
LI
6
Strategy translation
Strategy alignment
Strategy as everyone’s everyday
job
Strategy as a
continuous process
Leadership involvement

154
6.8.1 Assessment of measurement model validity
The subsequent stage examined the measurement theory by comparing the
theoretical measurement model against the data provided by the sample (Hair et
al., 2010). Hair et al. (2010, p. 664) suggested that measurement validity depends
on two things: firstly, the achievement of acceptable levels of goodness of fit for
the measurement model, and secondly, the adequacy of the evidence of construct
validity. In order to examine the validity of the measurement model, assessments
of both reliability and construct validity were conducted.
With regard to the goodness of fit, Hair et al. (2010) offered three classifications—
absolute fit indices, incremental fit indices and parsimony fit indices—to assist in
evaluating measurement models. Absolute fit indices provide the most basic
assessment of how well the model tested fits the sample data. Two widely used
measures of absolute fit indices are the root mean square of error of
approximation (RMSEA) and standardized root mean residual (SRMR). According
to Hooper et al. (2008), the cut-off point for RMSEA has been significantly
minimised; until the early 1990s, a range of 0.5 to 0.10 was considered a fair fit
and values above 0.10 indicated that a model was a poor fit. It was then assumed
that values between 0.8 and 0.10 indicated a mediocre fit, with a value below 0.8
denoting a good fit. However, Hu and Bentler (1999, cited in Hooper et al. 2008)
stated that the RMSEA cut-off value should be close to 0.6, while Steiger (2007)
posited that a value of up to 0.7 could render a model a good fit. SRMR, on the
other hand, is useful for comparing fit across models (Hair et al. 2010, p. 667).
According to Hu and Bentler (1999), the cut-off value for SRMR should be close to
0.08.
Incremental fit indices aim at examining the extent to which the estimated model
fits relative to an alternative baseline. The two most widely reported measures are
the Tucker-Lewis index (TLI) and the comparative fit index (CFI) (Hair et al. 2010,
p. 670). A model is considered a good fit when the TLI value approaches 1; a model

155
with a higher value represents a better fit than a model with a lower value.
Meanwhile, the CFI value represents a good fit when it is above 0.90 (Hair et al.
2010, p. 669). According to Hooper et al. (2008), CFI is one of the most popularly
reported fit indices because it is among the measurements least affected by
sample size (Fan et al. 1999).
The last of the three classifications according to Hair et al. (2010, p. 669) contains
parsimony fit indices, among which the parsimony normed fit index (PNFI) is the
most widely applied measure. Concerning the selection of fit indices, Hooper et al.
(2008), stated that it is not necessary to include all fit indices. At the same time, it
is not wise to choose the fit indices that best fit the model without reasonable
grounds. Hooper et al. (2008) also emphasised that choosing fit indices based on
their frequency of use is not necessarily a sound method as some of the statistics
are often relied on purely for historical reasons rather than for their sophistication.
Therefore, based on the suggestions of Hu and Bentler (1999), this research
reports RMSEA, CLI, TLI and SRMR values.
The following section presents an analysis of reliability using Cronbach’s alpha
followed by an analysis of the construct validity covering convergent, discriminant
and nomological validity assessments. Subsequently, an analysis of goodness of fit
for measurement models presents an assessment of the BSC implementation
model using confirmatory analysis. Lastly, an assessment of BSC implementation
in relation to organisational size and strategic employees’ roles using SEM is
presented.
6.8.2 Assessment of model reliability
According to Sekaran and Bougie (2016, p. 223), the reliability of a measure
represents the stability and consistency with which an instrument measures the
concept and helps to assess the goodness of a measure. Cronbach’s alpha is widely
considered as an ‘internal consistency’ coefficient. It is the most frequently used

156
reliability coefficient in organisational research (Cho and Kim 2015). Thus, for
assessing the reliability of the variables, this research applied Cronbach’s alpha.
Table 6.14 provides information regarding Cronbach’s α in each latent variable.
Table 6.14 Reliability test for five latent variables
Latent Variable Survey
Questionnaire Items Cronbach’s Alpha
Strategy translation 21-24 0.83
Strategy alignment 25-27 0.81
Strategy as everyone’s everyday job 28-34 0.86
Strategy as a continuous process 35-38 0.83
Leadership involvement 15-20 0.87
The computation of Cronbach’s alpha for all latent variables resulted in a
coefficient range of 0.81 to 0.87, which is a range considered reliable for reliability
and internal consistency (Hair et al. 2006, p. 127).
6.8.3 Assessment of construct validity
Definitions of validity vary amongst researchers; three definitions are presented
here. Hair et al. (2010) defined validity as how well a scale or a set of measures
accurately represents the concept. Sekaran and Bougie (2016, p. 220) explained
validity as the ability of an instrument scale to measure a concept (asking the
question ‘Are we measuring the right thing?’). Zikmund et al. (2009) referred to
validity as the accuracy of measurement to generate an actual score to represent
a concept. In addition to differences in the definition of validity, there exists a wide
variety of validity typology. Nunnally and Bernstein (1994, p. 83) stated that
validity can be grouped into three components: construct validity, predictive
validity and content validity. According to Sekaran and Bougie (2016, pp. 220-221),
validity may be clustered into content validity, criterion-related validity and
construct validity. Content validity is a function of how well the concepts and
components of a concept have been explained. Criterion-related validity is divided

157
into concurrent validity (established when the scale discriminates individuals who
are known to be different) and predictive validity (the ability to determine a
component to differentiate among individuals with reference to a future
criterion). Construct validity refers to how well the results obtained from the use
of the measure fit the theories around which the theory is tested. Moreover,
Sekaran and Bougie (2016, p. 220) suggested assessing construct validity by using
convergent validity (the scores are highly correlated when measuring two
different instruments). Discriminant validity occurs when, based on theory, two
variables are predicted to be uncorrelated and the scores obtained by measuring
them are empirically found to be so. However, Hair et al. (2010, p. 126) suggested
that the three most accepted forms of validity are convergent, discriminant and
nomological validity. This research follows the classification of validity suggested
by Hair et al. (2010), measuring validity in the forms of convergent, discriminant
and nomological validity. Thus, the following sections provide the analytical results
of those three validity measurements.
6.8.4 Assessment of convergent validity
According to Bartholomew et al. (2002), factor loading is the correlation between
the observed variables and a latent variable. If high convergent validity occurs,
high loadings in a factor would indicate that they converge on a common point,
the latent construct (Hair et al. 2010). Table 6.15 provides complete information
regarding factor loading of all observed variables.

158
Table 6.15 Factor analysis of the variables (rotated factor loading)
Latent Construct Code Observed Variable Factor
Strategy
translation
st1 Our organisation’s strategy map helps me to better understand our
organisation’s strategic objectives
0.61
st2 I know all about our organisation’s key performance indicators 0.90
st3 I know all about our organisation’s key performance indicator
targets
0.92
st4 My KPIs relate to the organisation’s strategic objectives 0.54
Strategy
alignment
sa1 The organisational KPIs are cascaded proportionately 0.75
sa2 The organisational KPI targets are cascaded proportionately 0.82
sa3 My KPIs are aligned with those of other colleagues at the same level 0.64
sj1 My KPIs are in line with organisational KPIs 0.68
sj2 I have good quality KPIs 0.76
sj3 My KPI targets are realistic 0.71
sj4 My KPI targets support the accomplishment of organisational
targets
0.69
sj5 There is active dialogue with my direct supervisor when
determining my KPIs
0.73
sj6 There is active dialogue with my direct supervisor when
determining my KPI targets
0.69
sj7 The rewards system is linked to KPI target achievement 0.52
sp1 My competence development is aligned with organisational
strategy
0.68
sp2 BSC management is supported with sound information technology 0.79
sp3 I find the performance reporting procedure easily understandable 0.78
sp4 Performance reporting requires solid proof 0.65
Leadership
involvement
li1 The head of the organisation educates me about performance
management based on the BSC
0.71
li2 The head of the organisation provides sufficient information
regarding the organisation’s strategies and goals
0.76
li3 I know all about our organisation’s objectives 0.71
li4 The head of the organisation motivates me to accomplish my
targets
0.80
li5 My direct supervisor actively guides me to reach my performance
goals
0.69
li6 My direct supervisor monitors my performance through my KPIs 0.68
Table 6.16 shows that all loading factors are above 0.4, indicating that they are
good factors for the purposes of CFA (Hair et al. 2014, p. 136). Given these results,
all items were retained at this stage and adequate evidence of validity
convergence for the BSC CFA model was considered to have been provided.

159
6.8.5 Assessment of discriminant validity
According to Hair et al. (2010), discriminant validity is the extent to which a latent
variable differs from other latent variables. In this research, discriminant validity
was examined by comparing the average variance extracted (AVE) estimates for
each factor with the squared inter-construct correlations associated with that
factor. The rule is that there are no problems with discriminant validity when AVE
estimates are greater than the corresponding inter-construct squared correlation
estimates (Hair et al. 2010, p. 723). The first step was to calculate the AVE using
the following formula:
AVE =∑𝐿𝑖2𝑛
𝑖=1
Where Li represents the standardised factor loading and i is the number of items.
An AVE should be calculated for all latent variables (Hair et al. 2006, p. 709).
Table 6.16 BSC standardised factor loadings, average variance extracted and AVE
estimates Variable ST SA SJ SP LI
My key performance indicators are aligned with those of other
colleagues at the same level
0.61
My key performance indicators are in line with the organisational
key performance indicators
0.90
I have good quality key performance indicators 0.92
My key performance indicator targets are realistic 0.54
My key performance indicator targets support the
accomplishment of organisational targets
0.75
There is active dialogue with my direct supervisor when
determining my KPIs
0.82
There is active dialogue with my direct supervisor when
determining my KPI targets
0.64
The rewards system is linked to KPI target achievement 0.68
My competence development is aligned with organisational
strategy
0.76
BSC management is supported with sound information technology 0.71
I find the performance reporting procedure easily understandable 0.69
Performance reporting requires solid proof 0.73
The head of the organisation educates me about performance
management based on BSC
0.69
The head of the organisation provides sufficient information
regarding the organisation’s strategies and goals
0.52
I know all about our organisation’s objectives 0.68
The head of the organisation motivates me to accomplish my
targets
0.79
My direct supervisor actively guides me to reach my performance
goals
0.78

160
My direct supervisor monitors my performance through my key
performance indicators
0.65
Our organisation’s strategy map helps me to better understand
our organisation’s strategic objectives
0.71
I know all about our organisation’s KPIs 0.76
I know all about our organisation’s KPI targets 0.71
My key performance indicators relate to the organisation’s
strategic objectives
0.80
The organisational KPIs are cascaded proportionately 0.69
The organisational KPI targets are cascaded proportionately 0.68
Average variance extracted (AVE) 58% 54.8% 47.13% 52.9% 52.7%
The (AVE) estimates illustrated in Table 6.16 are greater than the corresponding
inter-construct squared correlation estimates as shown in Table 6.17. Hence, there
is no problem with discriminant validity for the BSC implementation model for this
research.
Table 6.17 Construct correlation matrix (standardised) st sa sj sp li Strategy translation 1 0.08 0.09 0.14 0.18
Strategy alignment 0.28‡ 1 0.07 0.07 0.08
Strategy as everyone’s everyday
job
0.30‡ 0.26‡ 1 0.10 0.1
Strategy as a continuous process 0.38‡ 0.27‡ 0.32‡ 1 0.18
Leadership involvement 0.43‡ 0.29‡ 0.31‡ 0.42‡ 1
Significance levels: * = 10% or less; † = 5% or less; ‡ = 1% or less.
Note: item values below the diagonal are correlation estimates among constructs,
diagonal elements are constructed variances, and values above the diagonal are
squared correlations.
6.8.6 Assessment of nomological validity
According to Hair et al. (2010, p. 710), normal validity is assessed by investigating
whether the associations among latent variables in a measurement theory make
sense. The associations among the factor scores of each latent variable in this
study are as shown in Table 6.17. The results show that all five latent variables are
positively and significantly related to one another. Thus, this result supports the
nomological validity of the BSC implementation model used in this research.

161
6.8.7 Assessment of model fit indices
With regard to the assessment of model fit indices, the analysis presented in this
section in divided into two parts. The first part assesses BSC implementation,
which confirms the structure of the SFO model as its latent construct. In this first
part, CFA was applied. The second part of the analysis undertaken here is the
assessment process, which utilised the BSC model resulting from the CFA in the
first part to correlate with organisational size and strategic employees’ roles.
6.8.7.1 Confirmatory factor analysis results
The initial results revealed a total number of observations of 1,605 (with 69
missing data excluded from the analysis during the process). The RMSEA value was
reported to be at 0.107, which was above the cut-off of 0.07 (Steiger 2007). The
CFI value was determined to be 0.820, the TLI value was 0.794 and the SRMR value
was 0.094. Overall, the goodness of fit statistics value results were above the
standard thresholds. This indicates that the model could benefit from modification
(Hooper et al. 2008). The researcher thus proceeded with modification indices to
improve the best-fit model values.
6.8.7.2 Modification indices process
Following Hooper et al. (2008), the researcher performed several error term
correlations; these were chosen by considering the highest modification index
values together with the logical reasoning of the correlation. Having considered
these factors, twelve error term correlations were created. The first step in doing
so was to create error correlation pairs between observed variables within a single
latent variable. This part of the process involved five correlated pairs. The first
error term correlation items were knowledge about organisational KPIs (st2) and
knowledge about organisational KPI targets (st3). Both of these variables are
within the same latent variable of strategy translation. The two variables correlate
with each other in the sense that they express different dimensions of the same
object, where st2 concerns the name of the measurement indicator and st3

162
concerns the target of the measurement indicator. The second error term
correlation items were direct supervisor guidance in achieving my performance
goals (li5) and direct supervisor monitoring of my performance (li6). These
observed variables are within the same latent factor of leadership involvement.
They measure the subordinate’s perspective of the direct supervisor’s role to
encourage and support the performance of subordinates under their supervision.
Hence, the relationship lies in the fact that the direct supervisor not only monitors
but also guides the employees’ performance. The third error term correlation
items were active dialogue with a direct supervisor when setting up personal KPIs
(sj5) and active dialogue with a direct supervisor when setting up personal KPI
targets (sj6). These two observed variables are within the same latent factor,
strategy as everyone’s everyday job. The two variables are correlated with one
other in that they both refer to dialogue regarding performance with the direct
supervisor; Item sj5 concerns the setting up of KPIs, while Item sj6 concerns the
determining of KPI targets. Hence, the combining of these two variables to
characterise not only supervisors’ interest in good performance measures but also
their level of concern regarding the target for the performance measures. The
fourth pair of error term correlation items includes KPI quality (sj2) and realistic
KPI targets (sj3). These observed variables are both within the same latent factor
of strategy as everyone’s everyday job. The two variables are correlated in the
sense that they both express characteristics of performance measures, where sj2
concerns the quality of individual KPIs and sj3 concerns individual KPI targets. The
fifth error term correlation is between alignment of individual and organisational
KPIs (sj1) and individual KPI targets as supporting the accomplishment of
organisational targets (sj4). These two observed variables are both within the
same latent factor, strategy as everyone’s everyday job. They were both intended
to measure whether personal KPIs support the organisation, both in terms of the
use of performance measurements and KPIs’ relationship with organisational
targets. The combining of these two observed variables indicate the extent to

163
which individual KPIs and their targets are in line with organisational KPIs and their
targets.
The second part of error term correlation in this research consisted of seven
correlations involving observed variables represented by different latent variables.
The occurrence of such error term correlations is likely in the presence of
covariance amongst all five latent variables (SFO variables) under the framework
of the BSC. The sixth error correlation term concerned active dialogue with a direct
supervisor when setting up individual KPIs (sj5) direct supervisor guidance for
achieving individual performance goals (li5). The correlation of these two observed
variables was based on the fact that they both have the same object (individual
KPIs) with different emphases on the role of the direct supervisor: at the beginning
(when setting up KPIs) and during the process of accomplishing KPI targets. The
seventh error correlation term paired personal KPIs as supporting organisational
strategic objectives (st4) with personal KPIs as supporting organisational targets
(sj4). These two observed variables were paired based on the consideration that
both are concerned with the same dimension, namely, individual KPIs as
supportive of organisational KPIs. The eighth error term correlation was between
active dialogue with a direct supervisor when setting up individual KPI targets (sj6)
and direct supervisor guidance in achieving individual performance goals (li5).
Though the two items are represented by different latent variables, they portray
similar dimensions of the direct supervisor role in terms of employee
performance. The ninth error term correlation concerned the linkage of the
reward system to KPI target achievement (sj7) and the alignment of employee
competence development with organisational strategy (sp1). Both observed
variables express the dimension of BSC usage as related to the organisational
rewards system and personal competence development, respectively. The tenth
error term correlation combined the items regarding the link between individual
KPIs and organisational strategic objectives (st4) and the alignment of individual
KPIs with organisational KPIs (sj1). Both observed variables mention the same

164
dimension of measurement (individual KPIs) to organisational goals, thus
demonstrating the extent of individual KPI support of organisational KPIs. The
eleventh error correlation term pair, the alignment of individual KPIs with those of
colleagues at the same level (sa3) and the alignment of individual KPIs with
organisational key performance indicators (sj1), were linked because all
employees’ individual KPIs are presumed both to align with other colleagues’ at
the same level and to support organisational KPIs. The twelfth correlation error
term linked active dialogue with a direct supervisor when setting up personal KPIs
(sj5) and direct supervisor monitoring of performance (li6). The justification for
correlating these two observed variables was that both variables express the same
issue: the direct supervisor’s role in setting up individual KPIs and monitoring
subordinate performance using those KPIs.
Finally, the results from the CFA showed a good fit, particularly given the RMSEA
of 0.069, CFI of 0.930, TLI of 0.915 and SRMR of 0.055, all of which are under the
standard threshold (Hu and Bentler 1999; Steiger 2007; Hair et al. 2010, p. 667).
The SFO principles model was then used in further analysis examining the
associations with organisational factors, organisational commitment and PSM.
Table 6.18 Comparison of initial and modified models
Fit
indices Initial
model Modified
model Cut-off
value Reference
RMSEA 0.107 0.069 0.07 Hair et al. 2010, p. 667; Steiger 2007
CFI 0.820 0.930 ≥ 0.90 Hu and Bentler 1999
TLI 0.794 0.915 ≥ 0.90 Hu and Bentler 1999
SRMR 0.094 0.055 ≤0.08 Iacobucci 2010; Hooper et al. 2008; Hu and
Bentler 1999
Note: Coefficients are statistically significant at ρ <0.01
As can be seen in Tables 6.18 and 6.19, the root mean squared error of
approximation (RMSEA) is reported at 0.069; hence it represents a good fit (Steiger
2007; Hair et al. 2010, p. 667). For the standardised root mean squared residual

165
(SRMR), the results show the figure 0.055, which is under the maximum (0.08)
suggested by Hu and Bentler (1999), Hooper et al. (2008) and Iacobucci (2010).
The CFI value index was 0.930 and the TLI value was 0.915. According to Hair et al.
(2010, p. 669), a cut-off criterion of ≥ 0.90 in both CFI and TLI indicates that the
model is a good fit. Thus, according to the fit index results, the modified model of
BSC implementation shows a good fit. Table 6.19 provides comprehensive results
of the measurement model estimates and the fit statistics of the BSC
implementation model. The final results of CFA model are provided in Appendix 8.
Table 6.19 CFA measurement model and fit statistics of BSC implementation
Measurement model estimates
Strategy translation -> st1 0.77(0.12) ‡
Strategy translation -> st2 0.68(0.02) ‡
Strategy translation -> st3 0.70(0.02) ‡
Strategy translation -> st4 0.62(0.02) ‡
Strategy alignment -> sa1 0.79(0.01) ‡
Strategy alignment -> sa2 0.86(0.01) ‡
Strategy alignment -> sa3 0.69(0.01) ‡
Strategy as job -> sj1 0.67(0.01) ‡
Strategy as job -> sj2 0.73(0.01) ‡
Strategy as job -> sj3 0.65(0.02) ‡
Strategy as job -> sj4 0.67(0.02) ‡
Strategy as job -> sj5 0.64(0.02) ‡
Strategy as job -> sj6 0.62(0.02) ‡
Strategy as job -> sj7 0.58(0.02) ‡
Strategy process -> sp1 0.73(0.01) ‡
Strategy process -> sp2 0.78(0.01) ‡
Strategy process -> sp3 0.78(0.01) ‡
Strategy process -> sp4 0.68(0.01) ‡
Leadership involvement -> li1 0.75(0.01) ‡
Leadership involvement -> li2 0.78(0.01) ‡
Leadership involvement -> li3 0.77(0.12) ‡
Leadership involvement -> li4 0.81(0.01) ‡
Leadership involvement -> li5 0.58(0.02) ‡
Leadership involvement -> li6 0.58(0.02) ‡
Fit statistics
Root mean squared error of approximation (RMSEA) 0.069
CFI (CFI) 0.930
Tucker – Lewis Index (TLI) 0.915
Standardised root mean squared residual (SRMR) 0.055
Note: Reported are standardised coefficients (standard errors). Sig.: * = 10% or less; † = 5% or less; ‡ = 1% or less.
The findings provided in Table 6.19 are further discussed in Chapter 9. The final
BSC model resulting from the CFA was used in the subsequent analysis, which

166
examined the association of BSC implementation with organisational size and
strategic employee roles by means of SEM.
6.8.7.3 Structural equation modelling
Having finished examining the BSC implementation of SFO principles with
confirmatory factor analysis, the researcher then applied the final model to
examine the association of BSC implementation in organisations of different sizes
and with regard to strategic employees’ roles. In this analysis, the researcher
applied SEM using STATA 14 statistical software. Ullman (2001, cited in Schreiber
et al. 2006) stated that SEM has been defined as a combination of exploratory
factor analysis and multiple regression. SEM is often used in behavioural science
analysis when latent variables or theoretical constructs are the focus (Hox and
Bechger 1998). Hair et al. (2010, p. 635) explained that SEM is distinguished by
three characteristics: Firstly, estimating multiple and interrelated relationships;
secondly, an ability to represent unobserved concepts in these relationships and
account for measurement error in the estimation process; and thirdly, defining a
model to explain the entire set of relationships. Hair et al. (2010) also mentioned
that latent constructs (representing a group of observed variables) can be
introduced into SEM analysis. According to McDonald and Ho (2002), SEM consists
of two main parts: the measurement model represents a set of observable
variables p as multiple indicators of a small set of latent variables m, which are
usually common factors. The path model describes relations of dependency
usually accepted to be in some sense causal between the latent variables.
In this research, there are twelve respondent organisations involved; three
organisations are classified as large organisations and the remainder as small. As
presented in Table 6.2 above, the large organisations involved in this research are
the Main Service Offices (MSOs) of Tg. Priok, Batam and Soetta. The small
organisations comprise the Indonesian CEOs of Marunda, Jakarta, Merak,
Tangerang, Bogor, Bekasi, Cikarang, Purwakarta, and Bandung. In the analysis
process, two binary variables were introduced: organisation size and employees’

167
roles. The first relationship investigated was the way in which BSC implementation
differs between employees in large and small organisations. Moreover, this
research is intended to examine whether an organisation’s size has any influence
over the implementation of the BSC. For organisation size, employees working in
large organisations are represented by ‘1’, while employees working in small
organisations are represented by ‘0’. The second relationship that this research
examined was the association between the implementation of BSC by employees
with different roles. For the purpose of the research, employees were grouped
into two clusters: employees who hold strategic roles and all remaining employees
who do not hold strategic roles.
Employees in strategic roles are those who work one level under the head of the
organisation. The researcher identified employees in strategic roles with the
number 1, and all remaining employees, excluding organisation heads, with the
number 0. The term ‘BSC implementation’ refers to five latent variables: st
(strategy translation) and sa (strategy alignment), st (strategy translation) and sj
(strategy as everyone’s everyday job), st (strategy translation) and strategy as a
continuous process (sp), st (strategy translation) and leadership involvement (li).
Figure 6.3 illustrates the initial model of BSC implementation in association with
organisational size and employee roles.

168
Figure 6.3 BSC implementation, organisation size and employee roles
BSC Implementation
Strategy translation
ST1 ST4 ST3 ST2 SJ1 SA2 SA1 SA3 SJ5 SJ2 SJ4 SJ6 SJ7 SJ3
Strategy alignment
Strategy as everyone’s
everyday job
SP1 SP2 SP3 SP4 LI1 LI2 LI3 LI4 LI5 LI6
Strategy as a continuous
Leadership involvement
ε ε ε ε ε ε ε ε ε ε ε ε ε ε ε ε ε ε ε ε ε ε ε ε
Organisation size Employee roles

169
6.8.7.4 SEM results
The SEM analysis process resulted in fit indices as follows: RMSEA of 0.119, CFI
value index of 0.747, TLI value of 0.705, and SRMR of 0.312. All of these indicated
poor model fit. With regards to organisation size, it is reported that organisation
size had a significant and negative association with all five latent variables of the
BSC implementation. Below is a summary association of the two latent variables
with organisation size:
- Employees working in large organisations were likely to report lower levels of
strategy translation (β =-0.25 at ρ <0.01);
- Employees working in large organisations were likely to report lower levels of
strategy alignment (β =-0.19 at ρ <0.01);
- Employees working in large organisations were likely to report lower levels of
strategy as everyone’s everyday job (β =-0.21 at ρ <0.01);
- Employees working in large organisations were likely to report lower levels of
strategy as a continuous process (β =-0.24 at ρ <0.01);
- Employees working in large organisations were likely to report lower levels of
leadership involvement (β =-0.16 at ρ <0.01).
The results from the employees with strategic roles showed a statistically
significant association of almost all latent variables with BSC implementation. The
one variable with no statically significant association with BSC implementation was
strategy as a continuous process (β =-0.02 at ρ >0.1). Below is a summary of the
results of the other four latent variables:
- Employees working in strategic positions were likely to report higher levels of
strategy translation (β= 0.19 at ρ <0.01);
- Employees working in strategic positions were likely to report higher levels of
strategy alignment (β= 0.10 at ρ <0.01);
- Employees working in strategic positions were likely to report higher levels of
strategy as everyone’s everyday job (β= 0.11 at ρ <0.01);

170
- Employees working in strategic positions were likely to report higher levels of
leadership involvement (β= 0.10 at ρ <0.01).
These results regarding BSC implementation and its associations with
organisation size and strategic employees’ roles are further discussed in
Chapter 9. Appendix 9 contains more information on the associations of BSC
with organisation size and strategic employees’ roles.
6.9 Hypothesis testing
This section provides the associations between this chapter’s findings, the
hypotheses proposed, and the analysis techniques used. There are two main
analyses in this chapter. The first analysis examined the proposed model of SFO
principles that must exist in an organisation in order to successfully implement
BSC. In this analysis phase, five latent variables of SFO principles (Kaplan and
Norton 2001) were used. The five latent constructs together with the number of
observed variables in each are: strategy translation (made up of four observed
variables), strategy alignment (made up of three observed variables), strategy as
everyone’s everyday job (made up of seven observed variables), strategy as a
continuous process (made up of four observed variables) and leadership
involvement (made up of six observed variables). In CFA testing, these latent
variables were the exogenous variables while the observed variables served as
endogenous variables.
Hypothesis H1 predicted that SFO principles would correlate positively with each
other within implementation of the BSC. The results showed the covariance
among all latent variables to be positive and significant with the following results:
strategy translation and strategy alignment (β= 0.80), strategy translation and
strategy as everyone’s everyday job (β= 0.87), strategy translation and strategy as
a continuous process (β= 0.84), strategy translation and leadership involvement

171
(β= 0.89), strategy alignment and strategy as everyone’s everyday job (β= 0.86),
strategy alignment and strategy as a continuous process (β= 0.68), strategy
alignment and leadership involvement (β= 0.67), strategy as everyone’s everyday
job and strategy as a continuous process (β= 0.82), strategy as everyone’s
everyday job and leadership involvement (β= 0.76) and strategy as a continuous
process and leadership involvement (β= 0.77), with all significant at ρ <0.01. Thus,
Hypothesis H1 (SFO principles correlate positively with each other within the
implementation of the BSC) is supported.
Hypothesis H2 estimated that a large organisation has more influence on the
implementation of BSC than a small organisation. The results showed the large
organisations to have a negative association with all five SFO principles. Thus,
Hypothesis H2 is not supported. Hypothesis 3 predicted that employees with
strategic roles would have a significant and positive relationship with BSC
implementation as represented by SFO principles. The results showed employees
with strategic roles to have a significant association with four of the five latent
variables representing BSC implementation. Strategy as a continuous process was
the only variable that did not show a significant association with employees
holding strategic roles. Therefore, Hypothesis H3 is partly supported. Table 6.20
summarises the findings of this chapter regarding the hypotheses under
consideration.

172
Table 6.20 Hypothesis testing results
Research questions Hypothesis Results
RQ1. How do SFO
principles relate to
each other within
implementation of the
BSC?
H1. SFO principles correlate positively with each other within the
implementation of the BSC.
Supported. All latent variables showed significant relationships at ρ
<0.01 as follows:
- β= 0.80 for strategy translation and strategy alignment, - β= 0.87 for strategy translation and strategy as everyday job, - β= 0.84 for strategy translation and strategy as a continuous
process, - β= 0.88 for strategy translation and leadership involvement, - β= 0.86 for strategy alignment and strategy as everyday job, - β= 0.68 for strategy alignment and strategy as a continuous
process, - β= 0.67 for strategy alignment and leadership involvement, - β= 0.82 for strategy as everyday job and strategy as a continuous
process, - β= 0.76 for strategy as everyday job and leadership involvement,
and - β= 0.77 strategy as a continuous process and leadership
involvement.
RQ2. To what extent
are organisational
factors associated with
the implementation of
the BSC?
H2. The large organisation has more influence on the
implementation of the BSC than the small organisation.
H2a.The level of BSC strategy translation is higher for employees
working in large organisations than for employees working in
small organisations;
H2b.The level of BSC strategy alignment is higher for employees
working in large organisations than for employees working in
small organisations;
H2c.The level of the strategy everyone’s everyday job through in
large organisation is higher than that of small organisation;
- Not supported. Large organisation size has a significant and negative relationship with strategy translation (β= -0.25 at ρ <0.01).
- Not supported. Large organisation size has a significant and negative relationship with the strategy alignment (β= -0.19 at ρ <0.01).

173
H2d.The level of the strategy as a continuous process through BSC
in large organisation is higher than that of small organisation;
H2e.The level of the leadership involvement through a BSC in the
large organisation is higher than that of the small
organisation..
- Not supported. Large organisation size has a significant and negative relationship with the strategy everyone’s everybody job (β= -0.21 at ρ <0.01).
- Not supported. Large organisation size has a significant and negative relationship with strategy as a continuous process (β= -0.24 at ρ <0.01).
- Not supported. Large organisation size has a significant and negative relationship with leadership involvement (β= -0.16 at ρ <0.01).
H3. Employees holding strategic roles have more influence on BSC
implementation than other employees.
H3a. The level of strategy translation through BSC of employees
holding strategic roles is higher than the rest of employees;
H3b. The level of strategy alignment through BSC of employees
holding strategic roles is higher than the rest of employees;
H3c. The level of the strategy everyone’s everyday job through BSC
of employees holding strategic roles is higher than the rest of
employees;
H3d. The level of the strategy as a continuous process through BSC
of employees holding strategic roles is higher than the rest of
employees;
H3e. The level of the leadership involvement through a BSC of
employees holding strategic roles is higher than the rest of
employees.
- Supported. Strategy translation has a positive and significant relationship with strategic employees’ roles (β= 0.19 at ρ <0.01).
- Supported. Strategy alignment has a negative and significant relationship with strategic employees’ roles (β= 0.10 at ρ <0.01).
- Not supported. Strategy as everyone’s everyday job is not significantly different among employees in strategic positions than among other employees (β= 0.11 at ρ >1).
- Supported. Strategy as a continuous process has a significant and negative relationship with strategic employees’ roles (β= 0.02 at ρ <0.01).
- Supported. Leadership involvement has a significant and negative relationship with strategic employees’ roles (β= 0.10 at ρ <0.01).

174
6.10 Chapter summary
This chapter has provided the empirical evidence of this study of the associations
of organisation size and strategic employee roles with the BSC model. Before
proceeding to data analysis, the data underwent a screening process including:
sample adequacy analysis, missing data and treatment analysis, analysis of
outliers, and testing for the normality of data distribution. Prior to CFA, the validity
of the measurement model was tested for reliability and construct validity. The
reliability test was conducted using Cronbach’s alpha; the coefficient range from
0.81 to 0.86 indicated that the model was reliable for reliability and internal
consistency (Netemeyer et al. 2003). Following Hair and colleagues’ (2010)
construct validity classification, this research applied convergent, discriminant and
nomological validity testing. All three tests showed evidence of validity
convergence, discriminant validity and nomological validity for the BSC CFA
model, indicating the construct validity of the model.
The first goal of this study was to examine how SFO principles relate to each other
within implementation of the BSC. In this examination, CFA using STATA statistics
package version 14 was adopted. The second goal was to investigate BSC
implementation’s association with organisation size, and the third goal was to
capture any difference in BSC implementation between employees with strategic
roles and other employees. To reach the second and third goals, SEM was applied
using maximum likelihood, as suggested by Iacobucci (2010). The total number of
respondents processed in the analysis stage was 1,604, with 69 respondents
missing and excluded from the calculation. During the analysis process, the fit
index properties of the CFA results did not reach the minimum thresholds as
suggested by Hu and Bentler (1999), Hooper et al. (2008) and Iacobucci (2010).
After re-running the CFA model conducting error term correlations (see Hooper et
al. 2008), the fit indices were improved. The RMSEA of 0.069 would be considered
by Hooper et al. (2010) to be the maximum score indicating a good model fit
(Steiger 2007). In terms of SRMR, the result of 0.055 was under the maximum

175
point (0.06) suggested by Hu and Bentler (1999), Hooper et al. (2008) and
Iacobucci (2010). The CFI value index was 0.930 and the TLI value was 0.915.
Hooper et al. (2008) initially advanced a cutoff criterion of ≥ 0.90 for CFI and TLI;
however, recent studies have shown that a value greater than 0.90 for CFI and TLI
is needed in order to ensure that mis-specified models are not accepted (Hu and
Bentler 1999). Thus, according to the fit index results, the modified model appears
to be good fit. Table 6.18 provides information on the modified model fit indices,
showing the modified model to be an improved fit. Unlike the CFA results, the SEM
results examining the effects of organisational size and employee roles indicated
that the model was poor, with fit indices above the standard maximum. However,
it is worth noting that organisation size showed a negative and significant
relationship with the BSC, while strategic roles showed a positive relationship with
BSC implementation in four of the five SFO principles. The next chapter discusses
the findings as summarised in Table 6.20.

176
Chapter 7: Findings on the Association of BSC with Organisational
Commitment and Public Service Motivation
7.1 Introduction
This chapter aims to explain the relationships between the implementation of BSC
with organisational commitment (OC) and public service motivation (PSM). This
chapter is a continuation of the previous chapter and utilises the BSC
implementation construct that resulted from Chapter 6. The researcher adopted
the final BSC implementation design (as confirmed using CFA) for determining its
relationship with OC and PSM. This chapter also examines the influence of PSM on
OC within organisations adopting BSC as their PMS.
The structure of this chapter is as follows: the chapter begins by providing
descriptive statistics on OC and PSM from the perspective of organisation,
employee role, working rank, employee age, education level, working tenure and
gender, followed by data analysis. In the latter part of the chapter, the researcher
presents the results of the study, responding specifically to three of the study’s
research questions:
RQ3. Do the SFO principles within the implementation of the BSC have a
relationship with organisational commitment?
RQ4. Do the SFO principles within the implementation of the BSC have a
relationship with public service motivation?
RQ5. How does public service motivation relate to organisational commitment
within an organisation implementing the BSC?
The level of BSC implementation was measured using five SFO principles, namely
strategy translation (st), strategy alignment (sa), strategy as everyone’s everyday
job (sj), strategy as a continuous process (sp) and leadership involvement (li). The

177
five SFO latent variables used in the proposed model for this chapter were
analysed in Chapter 6.
7.2 Research questions, hypotheses and rationale construction
Table 7.1 provides the correlation between the research questions and
hypotheses examined in this chapter. In this study, it is hypothesised that BSC
implementation has a positive influence on OC and PSM. BSC implementation
itself refers to the five latent variables (SFO principles) tested in Chapter 6. This
study additionally hypothesises that PSM has a positive correlation with OC within
public-sector organisations implementing the BSC.
Table 7.1 Research questions and hypotheses
Research questions Hypothesis
RQ3. Do the SFO principles within the implementation of the BSC have a relationship with organisational commitment?
H4. The SFO principles within the implementation of the BSC are positively associated with organizational commitment.
H4a. The better the strategy translation through BSC
implementation, the more employees’ organisational commitment will increase;
H4b. The better the strategy alignment through BSC implementation, the more employees’ organisational commitment will increase;
H4c. The better the realisation of strategy as everyone’s everyday job through BSC implementation, the more employees’ organisational commitment will increase;
H4d. The better the realisation of strategy as a continuous process through BSC implementation, the more employees’ organisational commitment will increase;
H4e. The better the leadership involvement through BSC implementation, the more employees’ organisational commitment will increase.
RQ4. Do the SFO principles within the implementation of the BSC have a relationship with public service motivation?
H5. The SFO principles within the implementation of the BSC are positively associated with public service motivation. H5a. The better the strategy translation through BSC
implementation, the more employees’ public service motivation will increase;
H5b. The better the strategy alignment through BSC implementation, the more employees’ public service motivation will increase;

178
H5c. The better the realisation of strategy as everyone’s everyday job through BSC implementation, the more employees’ public service motivation will increase;
H5d. The better the realisation of strategy as a continuous process through BSC implementation, the more employees’ public service motivation will increase;
H5e. The better the leadership involvement through BSC implementation, the more employees’ public service motivation will increase.
RQ5. How does public service motivation relate to organisational commitment within an organisation implementing the BSC?
H6. OC is positively associated with PSM within organisations that apply the BSC as their performance management systems.
7.3 Individual constructs
Three associations are analysed in this chapter. The first is the connection between
BSC implementation and OC. In this analysis, strategy translation (st), strategy
alignment (sa), strategy as everyone’s everyday job (sj), strategy as a continuous
process (sp) and leadership involvement (li) function as independent variables,
whereas OC functions as the dependent variable. The second association
examined is that between BSC implementation and PSM. In this analysis, strategy
translation (st), strategy alignment (sa), strategy as everyone’s everyday job (sj),
strategy as a continuous process (sp) and leadership involvement (li) function as
independent variables, whereas PSM functions as the dependent variable. The
third association is that between PSM and OC, where PSM functions as the
independent variable and OC functions as the dependent variable. In the proposed
model, the BSC implementation variables of st, sa, sj, sp and li act as predictors;
both OC and PSM act as outcome variables. This chapter is a continuation of the
previous chapter; the researcher thus applied the correlations of the BSC
implementation variables according to the results in Chapter 6.

179
7.4 Descriptive statistics of PSM and OC
The descriptive statistics in this chapter are divided into three parts. The first part
provides information regarding OC and PSM in terms of organisation, job level,
working rank, employee age, educational level, working tenure and gender. The
second section delivers information about the distribution of the completed
questionnaires with summary responses on 7-point Likert scales of the observed
variables of OC and PSM. The last section on descriptive statistics provides
information regarding means, standard deviations and Pearson’s correlation
coefficients.
7.4.1 Descriptive statistics of 7-point Likert scale responses
Table 7.2 presents means, standard deviations and percentages of answers on the
Likert scale for each item within each latent variable. The table shows that the
means of the items in the survey questionnaire range from 5.57 (Item psm3,
‘Making a difference in society means more to me than personal achievements’)
to 6.25 (Item oc5: ‘I feel like part of the family at this organisation’). The range of
means indicates that most respondents tend to respond to all questionnaire items
between ‘neither agree nor disagree’ and ‘agree’.
Table 7.2 Scaled answers for all observed variables
Item Item
Question Latent
Variable Mean
Std. Dev.
Percentage
StD (1)
D (2)
SlD (3)
N (4)
SlA (5)
A (6)
StA (7)
oc1 I am quite proud to be able to tell people what organisation I work for
OC 6.11 0.85 0.4 0.4 1.3 1.7 8.3 57.3 30.6
oc2 What this organisation stands for is important to me
OC 6.19 0.65 0.1 0.1 0.1 1.4 7.1 61.7 29.5
oc3 My organisation and I are the same; therefore, the destiny of my organisation is also my own destiny
OC 6.06 0.71 0 0.2 0.3 2.3 11.6 61.8 23.8
oc4 I feel a strong sense of belonging to this organisation
OC 6.11 0.79 0 0.5 0.3 2.39 12.43 52.7 31.0
oc5 I feel like part of the family at this organisation
OC 6.25 0.73 0.1 0.2 0.3 1.7 7.1 53.2 37.4
oc6 The people I work with care what happens to me
OC 5.88 0.86 0.3 0.4 0.6 5.3 15.8 58.4 19.3

180
Item Item
Question Latent
Variable Mean
Std. Dev.
Percentage
StD (1)
D (2)
SlD (3)
N (4)
SlA (5)
A (6)
StA (7)
oc7 This organisation appreciates my accomplishments on the job
OC 5.76 0.93 0.4 0.6 1.3 6.5 18.7 56.4 16.1
oc8 This organisation does all it can to recognise employees for their good performance
OC 5.66 0.99 .05 0.6 2.3 7.9 21.5 52.8 14.6
oc9 My effort on the job is largely appreciated by this organisation
OC 5.74 0.93 0.3 0.5 1.2 7.1 20.8 53.6 16.4
psm1 The work I do at my job as a civil servant is very important to me
PSM 6.21 0.69 0.2 0.1 0.3 1.1 7.5 57.9 33.0
psm2 I am not afraid to defend the rights of others even if it means I will be ridiculed
PSM 5.92 0.80 0.1 0.4 0.7 3.8 15.0 61.3 18.7
psm3 Making a difference in society means more to me than personal achievements
PSM 5.57 1.20 0.8 3.4 2.5 7.7 18.5 50.8 16.3
psm4 I am prepared to make enormous sacrifices for the good of society
PSM 6.01 0.76 0 0.6 0.4 2.3 12.3 61.9 21.9
psm5 Daily events often remind me how dependent we are on one another
PSM 6.11 0.79 0.1 0.4 0.8 2.2 10.0 56.8 29.7
Notes: Std. Dev. = standard deviation, StD = strongly disagree, D = disagree, SlD = slightly disagree, N = neither agree or disagree, SlA = slightly agree, A = agree and StA = strongly agree.
7.4.2 Means and standard deviations of OC and PSM across offices
Table 7.3 shows that employees in the offices of Tanjung Priok, Batam, Soetta and
Cikarang demonstrated lower OC relative to employees in other offices. As
discussed in the previous chapter, Tanjung Priok, Batam and Soetta are classified
as large organisations, and the remaining nine organisations are considered small.
The mean comparison illustrates that large organisations (Tanjung Priok, Batam
and Soetta) are more likely to have lower OC than small organisations. Overall, OC
in Purwakarta was the highest with 6.19, while Tanjung Priok and Cikarang show
the lowest mean value of 5.84. However, the results regarding employees’ PSM
are more varied; Marunda’s was the highest (6.17), followed by Bekasi (6.08) and
Purwakarta (6.06). Bandung and Cikarang both display the lowest mean value of
5.85. Table 7.3 provides information about OC and PSM across the twelve customs
and excise organisations.
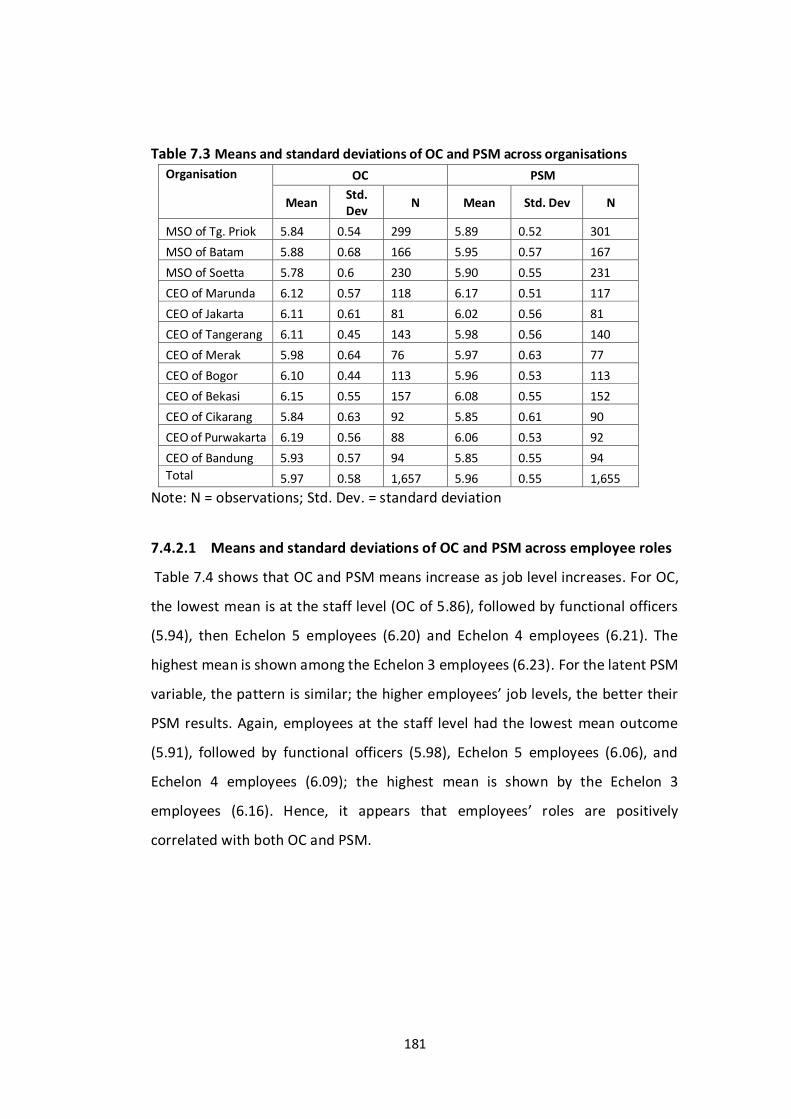
181
Table 7.3 Means and standard deviations of OC and PSM across organisations
Organisation OC PSM
Mean Std. Dev
N Mean Std. Dev N
MSO of Tg. Priok 5.84 0.54 299 5.89 0.52 301
MSO of Batam 5.88 0.68 166 5.95 0.57 167
MSO of Soetta 5.78 0.6 230 5.90 0.55 231
CEO of Marunda 6.12 0.57 118 6.17 0.51 117
CEO of Jakarta 6.11 0.61 81 6.02 0.56 81
CEO of Tangerang 6.11 0.45 143 5.98 0.56 140
CEO of Merak 5.98 0.64 76 5.97 0.63 77
CEO of Bogor 6.10 0.44 113 5.96 0.53 113
CEO of Bekasi 6.15 0.55 157 6.08 0.55 152
CEO of Cikarang 5.84 0.63 92 5.85 0.61 90
CEO of Purwakarta 6.19 0.56 88 6.06 0.53 92
CEO of Bandung 5.93 0.57 94 5.85 0.55 94
Total 5.97 0.58 1,657 5.96 0.55 1,655
Note: N = observations; Std. Dev. = standard deviation
7.4.2.1 Means and standard deviations of OC and PSM across employee roles
Table 7.4 shows that OC and PSM means increase as job level increases. For OC,
the lowest mean is at the staff level (OC of 5.86), followed by functional officers
(5.94), then Echelon 5 employees (6.20) and Echelon 4 employees (6.21). The
highest mean is shown among the Echelon 3 employees (6.23). For the latent PSM
variable, the pattern is similar; the higher employees’ job levels, the better their
PSM results. Again, employees at the staff level had the lowest mean outcome
(5.91), followed by functional officers (5.98), Echelon 5 employees (6.06), and
Echelon 4 employees (6.09); the highest mean is shown by the Echelon 3
employees (6.16). Hence, it appears that employees’ roles are positively
correlated with both OC and PSM.

182
Table 7.4 Means and standard deviations of OC and PSM across employees’ roles
Job level OC PSM
Mean Std. Dev. N Mean Std. Dev. N
Staff level 5.86 0.59 1051 5.91 0.56 1051
Functional officer 5.94 0.52 95 5.98 0.58 96
Echelon 5 6.20 0.50 321 6.06 0.54 318
Echelon 4 6.21 0.51 165 6.09 0.50 164
Echelon 3 6.23 0.46 23 6.16 0.53 23
Total 5.97 0.58 1655 5.96 0.55 1652
Note: N = observations; Std. Dev. = standard deviation
7.4.2.2 Means and standard deviations of OC and PSM working ranks
Considered in terms of working rank, the mean OC fluctuates. There is an increase
(5.83 to 6.12) in OC from Rank II to Rank III officers, but this figure then decreases
to 6.09 among employees at Rank IV. However, PSM increases as working rank
increases. The lowest PSM level was observed among Rank II employees, with a
mean of 5.93; the means increased to 5.99 among Rank III employees and 6.09
among Rank IV employees. The details of OC and PSM distribution across working
ranks are provided in Table 7.5.
Table 7.5 Means and standard deviations of OC and PSM across working ranks
Working Rank OC PSM
Mean Std. Dev. N Mean Std. Dev. N
Rank II 5.83 0.61 849 5.93 0.53 852
Rank III 6.12 0.51 723 5.99 0.57 718
Rank IV 6.09 0.67 84 6.02 0.63 83
Total 5.97 0.58 1656 5.96 0.56 1653
Note: N = observations; Std. Dev. = standard deviation

183
7.4.2.3 Means and standard deviations of OC and PSM across employee ages
OC increases gradually with employee age, with the exception of employees aged
55 or older. Meanwhile, for PSM, the distribution fluctuates somewhat,
particularly among employees over age 50. The detailed distribution of OC and
PSM results, along with standard deviations, are provided in Table 7.6.
Table 7.6 Means and standard deviations of OC and PSM across employee ages
Employee Age OC PSM
Mean Std. Dev. N Mean Std. Dev. N
18 - 30 5.80 0.60 774 5.93 0.53 778
>30 - 45 6.01 0.54 512 6.00 0.51 507
>45 - 50 6.28 0.50 115 6.15 0.45 114
>50 - 55 6.31 0.42 154 5.88 0.74 151
>55 6.24 0.46 91 6.01 0.61 91
Total 5.97 0.58 1646 5.97 0.55 1641
Note: N =observations; Std. Dev. = standard deviation
7.4.2.4 Means and standard deviations of OC and PSM across educational
levels
Table 7.7 provides information on OC and PSM results classified according to
educational level. As can be seen, the contribution of employee educational level
differed between OC and PSM. High school graduates show the highest mean of
OC (6.25), and Diploma III graduates show the lowest mean of OC. For PSM,
however, high school, Diploma I, Diploma III and bachelor’s graduates yielded
relatively similar numbers (5.9); the highest level of PSM (6.06) was among
employees with master’s degrees.

184
Table 7.7 Means and standard deviations of OC and PSM across educational levels
Educational Level OC PSM
Mean Std. Dev. N Mean Std. Dev N
High school 6.25 0.41 184 5.94 0.41 179
Diploma I 5.85 0.57 589 5.96 0.57 593
Diploma III 5.81 0.68 235 5.91 0.68 234
Bachelor’s degree 6.05 0.57 420 5.97 0.57 418
Master’s degree 6.06 0.55 212 6.05 0.55 211
Doctoral Degree 6.07 0 1 5.8 0 1
Total 5.97 1641 5.97 0.59
Note: N = observations; Std. Dev. = standard deviation
7.4.2.5 Means and standard deviations of OC and PSM across working tenures
Table 7.8 shows that employees with more than 10 years at their organisations
had the highest levels of OC. Those in the first two years of their tenure had a
relatively high mean which then decreased among employees who had been at
their organisations for three to five years. A similar trend appeared in PSM, with
employees having worked for less than two years showing greater motivation.
Table 7.8 Means and standard deviations of OC and PSM across working tenures
Working
Tenure
OC PSM
Mean Std. Dev. N Mean Std. Dev. N
<1 5.95 0.57 379 5.99 0.55 379
1 - <2 5.95 0.62 401 6.02 0.53 404
>2 - 5 5.89 0.59 458 5.94 0.51 457
>5 - 10 5.92 0.57 132 5.91 0.57 131
>10 6.20 0.50 275 5.93 0.65 269
Total 5.97 0.49 1645 5.97 0.55 1640
Note: N = observations; Std. Dev. = standard deviation

185
7.4.2.6 Means and standard deviations of OC and PSM according to gender
Table 7.9 shows the mean OC for a male (5.97) to be lower than for a female (6.00).
However, in terms of PSM, the results show a higher mean among males (5.98)
than among their female counterparts (5.88). It therefore appears that women are
more committed to their organisations than men, while men show higher levels of
PSM.
Table 7.9 Means and standard deviations of OC and PSM according to gender
Gender OC PSM
Mean Std. Dev. N Mean F Std. Dev.
Male 5.97 0.59 1415 5.98 1424 0.53
Female 6.00 0.55 230 5.88 230 0.65
Total 5.97 0.59 1645 5.97 1654 0.55
Note: N = observations; Std. Dev. = standard deviation
7.4.3 Descriptive statistics of construct variables
This section provides information about OC and PSM means, standard deviations
and Pearson’s correlation coefficients.
7.4.3.1 Descriptive statistics of OC
The means, standard deviations, and Spearman’s rank correlation coefficients for
OC are provided in Table 7.10. The average mean is 5.97, with the highest score
achieved by the variable ‘I feel like part of the family at this organisation’ (6.24).
The lowest mean score was received by the variable ‘This organisation does all it
can to recognise employees for their good performance’ (5.66). The standard
deviation ranged from 0.65 to 0.99. This range of means indicates that employees
agree or strongly agree with statements denoting commitment to their
organisations. Meanwhile, the Spearman’s rank correlation coefficients range
from 0.33 to 0.74, and all correlation coefficients are significantly correlated.

186
Table 7.10 Descriptive statistics of OC variables
Item Variable Mean St.D oc1 oc2 oc3 oc4 oc5 oc6 oc7 oc8 oc9
oc1 I am quite proud to
be able to tell people
what organisation I
work for
6.11 0.85 1
oc2 What this
organisation stands
for is important to
me
6.18 0.65 0.47* 1
oc3 My organisation and
I are the same;
therefore, the
destiny of my
organisation is also
my own destiny
6.06 0.71 0.44* 0.57* 1
oc4 I feel a strong sense
of belonging to this
organisation
6.10 0.79 0.41* 0.51* 0.55* 1
oc5 I feel like part of the
family at this
organisation
6.24 0.73 0.40* 0.45* 0.46* 0.56* 1
oc6 The people I work
with care what
happens to me
5.88 0.85 0.33* 0.36* 0.35* 0.35*
0.44* 1
oc7 This organisation
appreciates my
accomplishments on
the job
5.76 0.93 0.34* 0.39* 0.45* 0.32* 0.41* 0.53* 1
oc8 This organisation
does all it can to
recognise employees
for their good
performance
5.66 0.99 0.34* 0.38* 0.43* 0.35* 0.40* 0.48* 0.68* 1
oc9 My effort on the job
is largely appreciated
by this organisation
5.74 0.93 0.36* 0.39* 0.43* 4 0.40* 0.49* 0.73* 0.74* 1
Note: St.D. = standard deviation Total population = N=1656; * indicates statistically significant correlation at ρ < 0.01.
7.4.3.2 Descriptive statistics of PSM
The means, standard deviations, and Spearman’s rank correlation coefficients for
OC are provided in Table 7.11. The average mean is 5.96, with the highest score
achieved by the statement ‘Daily events often remind me how dependent we are
on one another’ (6.11) and the lowest mean shown for the variable ‘Making a
difference in society means more to me than personal achievements’ (5.57). The
standard deviations range from 0.65 to 0.99. The range of means indicates that
employees agree or strongly agree with statements denoting public service
motivation. The Spearman’s rank correlation coefficients range from 0.21 to 0.48
and all correlation coefficients are significantly correlated at ρ < 0.01.
Table 7.11 Descriptive statistics of PSM variables

187
Item Variable Mean St.D. psm2 psm3 psm4 psm5
psm2 I am not afraid to defend the rights of others even if it means I will be ridiculed
5.92 0.79 1
psm3 Making a difference in society means more to me than personal achievements
5.57 1.2 0.39* 1
psm4 I am prepared to make enormous sacrifices for the good of society
6.02 0.75 0.48* 0.40* 1
psm5 Daily events often remind me how dependent we are on one another
6.11 0.79 0.32* 0.21* 0.38* 1
Note: St.D. = standard deviation Total population = N=1654; * indicates statistically significant correlation at ρ <
0.01
7.5 Data processing analysis technique
With regards to the selection of analysis technique, this research gave strong
consideration to the unique way in which the research question needed to be
answered as well as to the characteristics and the correlations of the variables
involved. Based on the considerations explained in Chapter 6, the multivariate
technique applied in this chapter is SEM.
7.6 Data analysis preparation
This section provides information regarding the data screening processes
undertaken before performing the main data analysis. Following Hair et al. (2010),
prior to the main data analysis, a data screening process was conducted to reveal
less perceptible characteristics and to thus obtain a truer picture of the real data
without missing any easily overlooked hidden effects. Due to the fact that this
chapter uses the same population as Chapter 6, sample analysis is not discussed
here. Thus, this section considers missing data, outliers, and normality of data
distribution of the construct variables, OC and PSM, before proceeding further
with the data analysis process.
7.6.1 Analysis of missing data

188
The missing data discussed in this section (see Table 7.12) cover all 24 variables
from the BSC implementation model as well as the nine OC variables and the five
PSM variables. Thus, the total variables examined are 38 variables from seven
latent constructs. Missing data were checked using the STATA 14 statistics
software package. In general, the proportion of missing data was very low (ranging
from 0.36 % to 1.14 %) in the individual variables; the total of missing values across
the 24 variables was also low at 90 cases (5.37%). These values fall within
acceptable levels according to the rule stating that missing data levels under 10%
for an individual case or observation can generally be ignored (Hair et al. 2010, p.
47). Thus, the researcher simply used the remaining complete questionnaires
(1,584 observations) for the subsequent process analysis.
Table 7.12 Distribution of missing values Item
M C % Code Variable
st1 Our organisation’s strategy map helps me to better understand our organisation’s strategic objectives
12 1,662 0.72%
st2 I know all about our organisation’s KPIs 14 1,660 0.84%
st3 I know all about our organisation’s KPI targets 19 1,655 1.14%
st4 My KPIs relate to the organisation’s strategic objectives 18 1,656 1.08%
sa1 The organisational key performance indicators are cascaded proportionately 11 1,663 0.66%
sa2 The organisational KPI targets are cascaded proportionately 12 1,662 0.72%
sa3 My KPIs are aligned with those of other colleagues at the same level 12 1,662 0.72%
sj1 My KPIs are in line with organisational KPIs 13 1,661 0.78%
sj2 I have good quality KPIs 14 1,660 0.84%
sj3 My KPI targets are realistic 15 1,659 0.90%
sj4 My KPI targets support the accomplishment of organisational targets 15 1,659 0.90%
sj5 There is active dialogue with my direct supervisor when determining my KPIs 12 1,662 0.72%
sj6 There is active dialogue with my direct supervisor when determining my KPI targets 12 1,662 0.72%
sj7 The rewards system is linked to KPI target achievement 14 1,660 0.84%
sp1 My competence development is aligned with organisational strategy 13 1,661 0.78%
sp2 BSC management is supported with sound information technology 15 1,659 0.90%
sp3 I find the performance reporting procedure easily understandable 14 1,660 0.84%
sp4 Performance reporting requires solid proof 14 1,660 0.84%
li1 The head of the organisation educates me about performance management based on the BSC
12 1,662 0.72%
li2 The head of the organisation provides sufficient information regarding organisation's strategies/goals
7 1,667 0.42%
li3 I know all about our organisation's objectives 12 1,662 0.72%
li4 The head of the organisation motivates me to accomplish my targets 10 1,664 0.60%
li5 My direct supervisor actively guides me to reach my performance goals 9 1,665 0.54%
li6 My direct supervisor monitors my performance through key performance indicator 6 1,668 0.36%
oc1 I am quite proud to be able to tell people what organisation I work for 7 1,667 0.42%
oc2 What this organisation stands for is important to me 6 1,668 0.36%
oc3 My organisation and I are the same; therefore, the destiny of my organisation is also my own destiny
8 1,666 0.48%
oc4 I feel a strong sense of belonging to this organisation 11 1,663 0.66%
oc5 I feel like part of the family at this organisation 10 1,664 0.60%
oc6 The people I work with care what happens to me 6 1,668 0.36%
oc7 This organisation appreciates my accomplishments on the job 6 1,668 0.36%
oc8 This organisation does all it can to recognise employees for their good performance 7 1,667 0.42%

189
oc9 My effort on the job is largely appreciated by this organisation 6 1,668 0.36%
psm1 The work I do at my job as a civil servant is very important to me 6 1,668 0.36%
psm2 I am not afraid to defend the rights of others even if it means I will be ridiculed 9 1,665 0.54%
psm3 Making a difference in society means more to me than personal achievements 14 1,660 0.84%
psm4 I am prepared to make enormous sacrifices for the good of society 9 1,665 0.54%
psm5 Daily events often remind me how dependent we are on one another 7 1,667 0.42%
Note: M = missing values; C = complete observations; % = percentage of missing
questionnaire; total observations (N = 1,674)
7.6.2 Analysis of outliers
First, a frequency test was conducted to reveal the distribution of participants
answering the survey questionnaire. Any number apart from a 7-point Likert scale
value that appeared in the survey questionnaire was considered as an outlier (see
Kline 2011; Hair et al. 2010). The data examined were all fourteen variables, with
nine items representing OC and five variables representing PSM. As shown in Table
7.13, in the item ‘My effort on the job is largely appreciated by this organisation’
(oc9), a number (9) appeared. This number is not within the range of the Likert
scale (1 to 7).
Table 7.13 Frequency of variable oc9
Score Frequency Percentage Cumulative
1 5 0.3 0.3
2 9 0.54 0.84
3 20 1.2 2.04
4 119 7.13 9.17
5 346 20.74 29.92
6 895 53.66 83.57
7 273 16.37 99.94
9 1 0.06 100
Total 1,668 100
After finding the variable (oc9) that contained an outlier (score: 9), the next step
was to locate the case number containing the outlier. Subsequently, Nick Cox’s
extremes command using the STATA program was used to identify which case
included a score of 9. Table 7.14 shows that the case number was 481. Therefore,
to avoid the possibility of bias, the researcher deleted case 481 for subsequent

190
analysis. The final number of samples for the next phase of analysis was 1,673
observations.
Table 7.14 Outlier identification
Case Scale
437 1
444 1
580 1
749 1
819 1
1611 7
1614 7
1647 7
1662 7
481 9
7.6.3 Analysis of normality of data distribution
After completing the analysis of the outliers, a test of the normality of data
distribution was conducted. As in the outliers test, the data tested included the
fourteen variables under the classifications of OC (nine observed variables) and
PSM (five observed variables). The researcher ran statistical tests (using the STATA
14 package) for univariate, bivariate and multivariate normality. The results
showed the univariate normality for both OC and PSM to be significant at ρ < 0.01
for all 14 observed variables. This indicates that data distribution significantly
differs from a normal distribution, or that the data do not meet the normal
distribution. Similar to the univariate results, a multivariate test of data
distribution (using skewness, kurtosis and Doornik-Hansen omnibus) showed
significance at ρ < 0.01. This means that the data deviate from normality, and that
the data distributions are thus not normal. However, as explained in Fidel (2007)
and Hair et al. (2010), the issue of non-normality is not of concern in a study with
large data samples.

191
7.7 Data analysis
As noted in Section 7.5, the analysis technique used at this stage was SEM. Before
running the SEM program, the reliability tests and factor loadings of the latent
constructs OC and PSM were assessed. Thus, the next section discusses the
assessment of reliability, assessment of factor loadings, and SEM results.
7.7.1 Assessment of reliability
Nunnally (1967, cited in Streiner 2003, p.163) suggested that the Cronbach’s alpha
coefficient must be in the range of 0.50 to 0.60 in the early stages of research,
reaching 0.80 for basic research tools. Nunnally selected 0.90 as the ‘minimally
tolerable estimate’ for clinical purposes, with an ideal of 0.95. In this research, the
Cronbach’s alpha coefficient for the latent OC variable was 0.87, with 0.67 for the
latent PSM variable. These values are considered to be good for reliability and
internal consistency (Hair et al. 2006, p. 127).
7.7.2 Assessment of factor loading
High convergent validity occurs when high loadings in a factor would indicate that
they converge on a common point, the latent construct (Hair et al. 2010).
Therefore, the researcher first conducted factor analysis (rotated factor loading)
to assess the factor loadings within each of the latent variables.
7.7.2.1 OC factor loadings
As can be seen from Table 7.15, the loading factors of all OC variables (ranging
from 0.49 to 0.80) are above the acceptable level of 0.4 according to Hair et al.
(2010, p. 118). Thus, all observed variables were retained at this stage as adequate
evidence of validity convergent existed.

192
Table 7.15 OC factor analysis (rotated factor loading)
Code Variable Factor
oc1 I am quite proud to be able to tell people what organisation I work for 0.49
oc2 What this organisation stands for is important to me 0.61
oc3 My organisation and I are the same; therefore, the destiny of my organisation is
also my own destiny
0.65
oc4 I feel a strong sense of belonging to this organisation 0.58
oc5 I feel like part of the family at this organisation 0.65
oc6 The people I work with care what happens to me 0.63
oc7 This organisation appreciates my accomplishments on the job 0.79
oc8 This organisation does all it can to recognize employees for their good
performance
0.77
oc9 My effort on the job is largely appreciated by this organisation 0.80
7.7.2.2 PSM factor loadings
Table 7.16 shows that the results with all loading factors are at above 0.4 (see Hair
et al 2010, p.118) excluding variable “the work I do as a civil servant on my job is
very important to me” (psm1) with only 0.35-factor loading.
Table 7.16 PSM factor loadings (rotated factor loading)
Given these results, the researcher conducted another factor analysis excluding
Item psm1 to check the composition of the factor loadings. Table 7.17 illustrates
the second factor analysis of the latent PSM variable.
Code Variable Factor psm1 The work I do at my job as a civil servant is very important to me 0.354 psm2 I am not afraid to defend the rights of others even if it means I
will be ridiculed 0.6245
psm3 Making a difference in society means more to me than personal
achievements 0.4802
psm4 I am prepared to make enormous sacrifices for the good of
society
0.6447
psm5 Daily events often remind me how dependent we are on one
another 0.4641
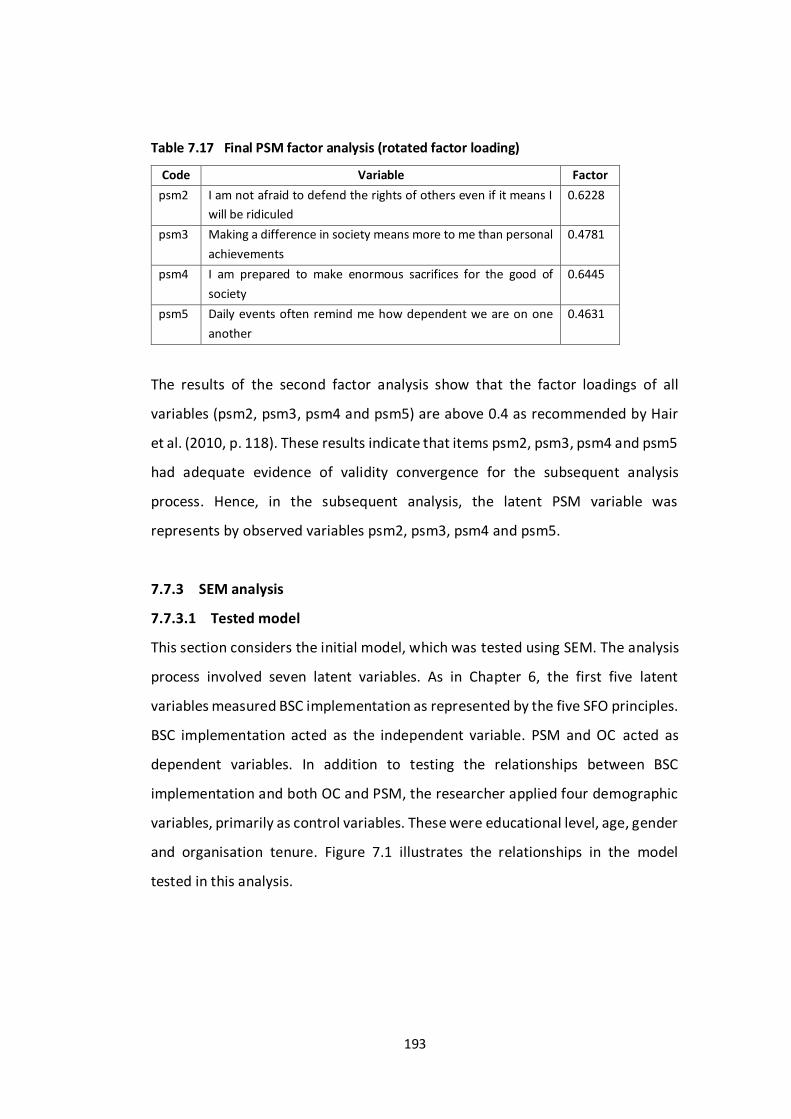
193
Table 7.17 Final PSM factor analysis (rotated factor loading)
Code Variable Factor
psm2 I am not afraid to defend the rights of others even if it means I
will be ridiculed
0.6228
psm3 Making a difference in society means more to me than personal
achievements
0.4781
psm4 I am prepared to make enormous sacrifices for the good of
society
0.6445
psm5 Daily events often remind me how dependent we are on one
another
0.4631
The results of the second factor analysis show that the factor loadings of all
variables (psm2, psm3, psm4 and psm5) are above 0.4 as recommended by Hair
et al. (2010, p. 118). These results indicate that items psm2, psm3, psm4 and psm5
had adequate evidence of validity convergence for the subsequent analysis
process. Hence, in the subsequent analysis, the latent PSM variable was
represents by observed variables psm2, psm3, psm4 and psm5.
7.7.3 SEM analysis
7.7.3.1 Tested model
This section considers the initial model, which was tested using SEM. The analysis
process involved seven latent variables. As in Chapter 6, the first five latent
variables measured BSC implementation as represented by the five SFO principles.
BSC implementation acted as the independent variable. PSM and OC acted as
dependent variables. In addition to testing the relationships between BSC
implementation and both OC and PSM, the researcher applied four demographic
variables, primarily as control variables. These were educational level, age, gender
and organisation tenure. Figure 7.1 illustrates the relationships in the model
tested in this analysis.

194
Figure 7.1 BSC association with OC and PSM
7.7.3.2 SEM results
The SEM process resulted in fit indices as follows: the RMSEA was 0.053,
repesenting a good fit (Steiger 2007; Hair et al. 2010, p. 667). The CFI value was
0.909 and the TLI value was 0.896; these are acceptable. According to Hair et al.
(2010, p. 669) a cut-off criterion of ≥ 0.90 for CFI and TLI indicates goodness of fit.
Meanwhile, the SRMR result was 0.053, which indicates a good fit as it is under
the maximum level (0.08) suggested by Hu and Bentler (1999), Hooper et al. (2008)
and Iacobucci (2010). Hence, based on the fit index results, the model of the
associations between BSC implementation and OC and PSM can be considered to
be a good fit.
The complete results of the examination of BSC implementation and its
association with OC and PSM are as described in Table 7.18.
Strategy
translationStrategy
alignmentStrategy as
everyday job
Strategy as
continuous
process
Leadership
involvement
PSM OC
Education Age Gender Tenure
BSC implementation

195
Table 7.18 Measurement model estimates and structural model of BSC, OC and PSM
Measurement model estimates
Strategy translation -> st1 0.77(0.12) ‡
Strategy translation -> st2 0.68(0.02) ‡
Strategy translation -> st3 0.70(0.02) ‡
Strategy translation -> st4 0.62(0.02) ‡
Strategy alignment -> sa1 0.79(0.01) ‡
Strategy alignment -> sa2 0.86(0.01) ‡
Strategy alignment -> sa3 0.69(0.01) ‡
Strategy as job -> sj1 0.67(0.01) ‡
Strategy as job -> sj2 0.73(0.01) ‡
Strategy as job -> sj3 0.65(0.02) ‡
Strategy as job -> sj4 0.67(0.02) ‡
Strategy as job -> sj5 0.64(0.02) ‡
Strategy as job -> sj6 0.62(0.02) ‡
Strategy as job -> sj7 0.58(0.02) ‡
Strategy process -> sp1 0.74(0.01) ‡
Strategy process -> sp2 0.78(0.01) ‡
Strategy process -> sp3 0.78(0.01) ‡
Strategy process -> sp4 0.68(0.01) ‡
Leadership involvement -> li1 0.76(0.01) ‡
Leadership involvement -> li2 0.79(0.01) ‡
Leadership involvement -> li3 0.77(0.12) ‡
Leadership involvement -> li4 0.81(0.01) ‡
Leadership involvement -> li5 0.59(0.02) ‡
Leadership involvement -> li6 0.59(0.02) ‡
OC -> oc1 0.40(0.02) ‡
OC -> oc2 0.48(0.02) ‡
OC -> oc3 0.54(0.02) ‡
OC -> oc4 0.46(0.02) ‡
OC -> oc5 0.55(0.02) ‡
OC -> oc6 0.61(0.02) ‡
OC -> oc7 0.84(0.01) ‡
OC -> oc8 0.85(0.01) ‡
OC -> oc9 0.86(0.01) ‡
PSM -> psm2 0.67(0.02) ‡
PSM -> sj3 0.47(0.02) ‡
PSM -> sj4 0.69(0.02) ‡
PSM -> sj5 0.49(0.02) ‡
Structural model
PSM -> OC 0.13(0.03) ‡
Educational level -> OC -0.00(0.01)
Age -> OC -0.07(0.02) ‡
Gender -> OC -0.05(0.02) ‡
Organisation tenure -> OC -0.00(0.02)
Strategy translation -> OC -0.36(0.14) †
Strategy alignment -> OC 0.09(0.06)
Strategy as job -> OC 0.08(0.09)
Strategy process -> OC 0.33(0.06) ‡
Leadership involvement -> OC 0.63(0.08) ‡
Educational level -> PSM -0.18(0.03)
Age -> PSM 0.12(0.03) ‡
Gender -> PSM 0.05(0.03) *
Organisation tenure -> PSM -0.08(0.03) ‡
Strategy translation -> PSM 0.49(0.19) †
Strategy alignment -> PSM -0.04(0.09)
Strategy as job -> PSM 0.35(0.13) ‡
Strategy process -> PSM -0.26(0.08) ‡
Leadership involvement -> PSM -0.01(0.11)
Note: Reported are standardised coefficients (standard errors). Sig.: *: 10% or less; †: 5% or less;
‡: 1% or less.

196
7.8 Hypothesis testing
This section discusses the associations between the findings and the hypotheses
proposed. Before presenting the findings with regard to the hypotheses, we
provide the findings as related to the control variables. Educational level was
found to have an insignificant relationship with both OC and PSM. This finding thus
contrasts with those of previous studies (Motaz 1986; Perry 1997; Camilleri and
Heijden 2007). Concerning age, the results were mixed; older age showed a
negative relationship with OC (β=- 0.07 at ρ <0.01) and a positive relationship with
PSM (β= 0.12 at ρ <0.01). Therefore, as regards the connection of age with OC, the
findings supported the previous study by Camilleri and Heijden (2007).
Meanwhile, regarding the connection between age and PSM, the findings
supported Perry (1997). With respect to gender, maleness had a negative
association with OC (β=- 0.05 at ρ <0.01), supporting Perry’s (1997) results.
However, maleness showed a positive association with PSM (β= 0.05 at ρ <0.1),
confirming Vandenabeele’s (2011) work. In terms of organisation tenure, only the
relationship with PSM was significant (β=- 0.08 at ρ <0.05); no significant
relationship with OC was shown. This result thus supports Balfour and Wechsler’s
(1996) conclusion that organisation tenure has an insignificant relationship with
OC.
Turning to the main variables, three main hypotheses were to be tested in this
part of the research: the association of BSC implementation with OC, the
association of BSC implementation with PSM, and the relationship of OC with PSM
in organisations implementing BSC. The following is an explanation of the
hypothesis testing based on the findings from the SEM process. Firstly, with regard
to OC, we found that of the five latent variables of BSC implementation, three had
a significant effect. These were strategy translation, strategy as a continuous
process and leadership involvement. The relationship between BSC
implementation and OC can be summarised thus:

197
- Strategy translation has a negative and significant relationship with OC (β=-
0.36 at ρ <0.05);
- Strategy as a continuous process has a positive and significant relationship
with OC (β= 0.33 at ρ <0.01);
- Leadership involvement has a positive and significant relationship with OC (β=
0.63 at ρ <0.01).
Secondly, in a similar vein, not all variables of BSC implementation showed a
statistically significant relationship with PSM. The three latent variables found to
have a significant association with PSM were strategy translation, strategy as
everyone’s everyday job, and strategy as a continuous process. Meanwhile, the
other two variables, strategy alignment and leadership involvement, were not
found to be significantly associated with PSM. The significant associations can be
summarised thus:
- Strategy translation has a positive and significant relationship with PSM
(β= 0.49 at ρ <0.05);
- Strategy as everyone’s everyday job has a positive and significant
relationship with PSM (β= 0.35 at ρ <0.01);
- Strategy as a continuous process has a negative and significant
relationship with PSM (β= -0.26 at ρ <0.01).
Thirdly, regarding the association between OC and PSM, we found PSM to have a
positive correlation with OC (β= 0.13 at ρ <0.01). Table 7.19 summarises the
findings in correlation with the hypotheses.

198
Table 7.19 Hypothesis testing results
Research
question
Hypothesis Results
RQ3. Do the SFO
principles within
the
implementation
of the BSC
framework have
a relationship
with
organisational
commitment?
H4. The SFO principles within the implementation of the BSC are positively associated with organisational commitment.
H4a. The better the strategy translation through BSC implementation, the more employees’ organisational commitment will increase;
H4b. The better the strategy alignment
through BSC implementation, the more employees’ organisational commitment will increase;
H4c. The better the realisation of strategy as everyone’s everyday job through BSC implementation, the more employees’ organisational commitment will increase;
H4d. The better the realisation of strategy as a continuous process through BSC implementation, the more employees’ organisational commitment will increase;
H4e. The better the leadership involvement
through BSC implementation, the more employees’ organisational commitment will increase.
Not supported. Strategy
translation has a negative and
significant relationship with OC
(β=- 0.36 at ρ <0.05);
Not significant. Strategy
alignment has a positive and
insignificant relationship with
OC (β= 0.09 at ρ >0.1);
Not significant. Strategy as
everyone’s everyday job has
positive and insignificant
relationship with OC (β= 0.08 at
ρ >0.1);
Supported. Strategy as a
continuous process has a
positive and significant
relationship with OC (β= 0.33 at
ρ <0.01);
Supported. Leadership
involvement has a positive and
significant relationship with OC
(β= 0.63 at ρ <0.01).
RQ4. Do the
SFO principles
within the
implementation
of BSC have a
relationship
with public
service
motivation?
H5. The SFO principles within the
implementation of the BSC are positively
associated with public service motivation.
H5a. The better the strategy translation
through BSC implementation, the more
employees’ public service motivation will
increase;
H5b. The better the strategy alignment
through BSC implementation, the more
employees’ public service motivation will
increase;
H5c. The better the realisation of strategy as
everyone’s everyday job through BSC
implementation, the more employees’
public service motivation will increase;
H5d. The better the realisation of strategy as a
continuous process through BSC
implementation, the more employees’
public service motivation will increase;
Supported. Strategy translation
has a positive and significant
relationship with PSM (β= 0.49
at ρ <0.05);
Not significant. Strategy
alignment has a negative and
insignificant relationship with
PSM (β= -0.04 at ρ >0.1);
Supported. Strategy as
everyone’s everyday job has a
positive and significant
relationship with PSM (β= 0.35
at ρ <0.01);
Supported. Strategy as a
continuous process has a
negative and significant
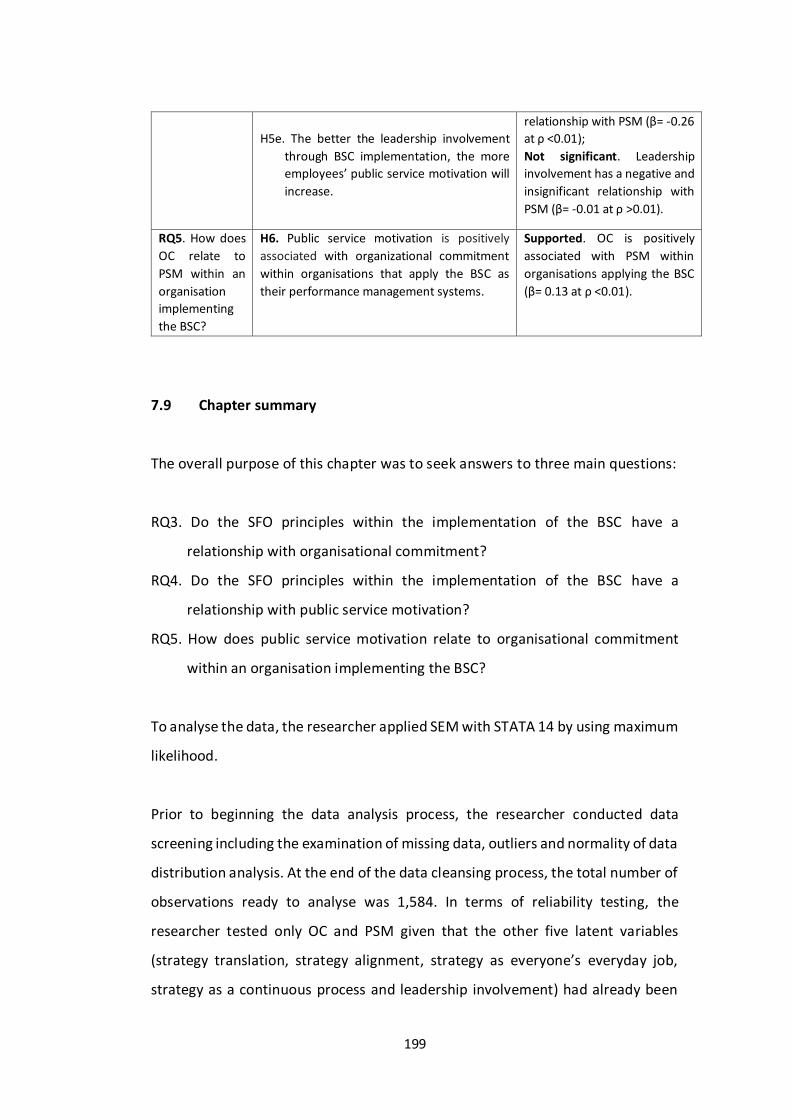
199
H5e. The better the leadership involvement
through BSC implementation, the more
employees’ public service motivation will
increase.
relationship with PSM (β= -0.26
at ρ <0.01);
Not significant. Leadership
involvement has a negative and
insignificant relationship with
PSM (β= -0.01 at ρ >0.01).
RQ5. How does
OC relate to
PSM within an
organisation
implementing
the BSC?
H6. Public service motivation is positively
associated with organizational commitment
within organisations that apply the BSC as
their performance management systems.
Supported. OC is positively
associated with PSM within
organisations applying the BSC
(β= 0.13 at ρ <0.01).
7.9 Chapter summary
The overall purpose of this chapter was to seek answers to three main questions:
RQ3. Do the SFO principles within the implementation of the BSC have a
relationship with organisational commitment?
RQ4. Do the SFO principles within the implementation of the BSC have a
relationship with public service motivation?
RQ5. How does public service motivation relate to organisational commitment
within an organisation implementing the BSC?
To analyse the data, the researcher applied SEM with STATA 14 by using maximum
likelihood.
Prior to beginning the data analysis process, the researcher conducted data
screening including the examination of missing data, outliers and normality of data
distribution analysis. At the end of the data cleansing process, the total number of
observations ready to analyse was 1,584. In terms of reliability testing, the
researcher tested only OC and PSM given that the other five latent variables
(strategy translation, strategy alignment, strategy as everyone’s everyday job,
strategy as a continuous process and leadership involvement) had already been

200
tested. The reliability tests using Cronbach’s alpha resulted in coefficients of 0.87
for OC and 0.67 for PSM. After conducting the reliability tests, the researcher
assessed the loading factors and found that all variables representing OC (oc1, oc2,
oc3, oc4, oc5, oc6, oc7, oc8, oc9) were above the threshold (0.4), while one
variable representing PSM (psm1) loaded at <0.4 (Hair et al. 2010, p. 167). Thus,
the SEM analysis proceeded with all observed variables within the latent OC
variable, while for PSM, the analysis proceeded with items psm2, psm3, psm4 and
psm5.
The SEM parameters used to evaluate the model were RMSEA, SRMR, CFI value
index, and TLI. The SEM analysis resulted in RMSEA of 0.053, SRMR of 0.053, CFI
value index of 0.909 and TLI value of 0.896; these results all qualified the model as
a good fit. Thus, according to the fit index results, the modified model proved to
be a good fit. All findings as summarised in Table 7.19 are further discussed in
Chapter 9.

201
Chapter 8: Findings on the Relationship between the BSC and
Organisational Performance
8.1 Introduction
This chapter uses a different approach from the previous findings chapters
(Chapters 6 and 7) in the way in which BSC implementation acts as an independent
variable. This is due to the purpose of this chapter, which aims at investigating the
relationship between BSC implementation and OP. In this study, OP is measured
using performance data collected during the fieldwork activities. The data
collected describes OP at the organisational level (that is, not as the average of all
individual employees’ performance levels). The data should therefore also be
drawn at the organisational level. This study used two variables as representatives
of OP: state revenue collection and customer satisfaction index. Based on the data
available, the researcher applied two different tools to analyse each of the
organisational measurements. The first analysis, that of the relationship between
the BSC and state revenue collection, was performed using panel data regression.
The second analysis, which measured the correlation between the BSC and
customer satisfaction index, was examined using growth curve modelling. The
results of these two analytical techniques provided empirical evidence of the
association between BSC implementation and OP in public-sector organisations.
The structure of this chapter is as follows: the next section concerns the research
question and hypothesis, focusing on the analysis process undertaken in this
chapter. The subsequent section provides information about the research
variables, which are divided into dependent and independent variables. This is
followed by an explanation of the BSC implementation cut-off year, a discussion
of the data collection, and descriptive results of the variables of state revenue
collection and customer satisfaction index. The main data analysis, using panel

202
data regression and growth curve model, is then provided. In the penultimate
section, we present the results of the hypothesis testing; these serve to compare
the hypothesis initially constructed with the results of the analysis. In the final part
of this chapter, the results of the study are presented, responding to the research
question: How is BSC implementation associated with organisational
performance?
8.2 Research question and hypothesis
In this chapter, the researcher introduces Hypothesis H7: Implementation of BSC
has a positive association with organisational performance. Table 8.1 shows the
hypothesis constructed as a response to the research question to be tested in this
chapter.
Table 8.1 Research question and hypothesis
Research question Hypothesis
RQ6. How is BSC
implementation
associated with
organisational
performance?
H7. The implementation of the BSC is positively
associated with organisational performance.
8.3 Variables of the research
Finding the connection between the BSC implementation and OP is difficult
because of a general lack of valid measures of service, especially service outcomes
(Stein 1986, cited in Crewson 1997, p.507). Similarly, de Geuser et al. (2009, p. 99)
pointed out that consideration of the ways in which BSC can be linked to OP is
often blurred by the question of how to measure the contribution. Madsen and
Stenheim (2015) stated that there are many variables mediating and moderating
the relationship between BSC implementation and OP. With an awareness of the
difficulty of finding representative parameters of OP in public-sector
organisations, the researcher created four essential steps to support the logic of

203
measuring the relationship between the BSC and OP. First, following Braam and
Nijssen’s (2004, p. 345) assertion that BSC implementation is worthwhile only if it
is aligned with organisational strategy, the present study employed two OP
indicators. These two performance indicators are directly connected with the
customs and excise organisations’ strategic objectives as provided in the strategy
maps of the twelve responding organisations. Second, the data for the two
variables are available at different points in time (longitudinal data). The data for
state revenue collection was available from 2009 to 2016, thus covering the period
before and after the BSC was implemented in the organisations. The data from the
customer satisfaction was available from 2014 to 2016, covering the period after
BSC implementation. Third, performance as measured by the two variables of
state revenue collection variable and customer satisfaction index was reported in
figures. Fourth, the research used an additional variable, organisation size, for the
purposes of introducing a control variable.
8.3.1 Independent variable
The main goal of this chapter is to investigate whether the implementation of the
BSC as PMS has any relationship with OP. Kaplan and Norton (1996) posited that
the BSC provides a framework for managing the execution of strategy while also
enabling the strategy itself to evolve in response to challenges in the
organisations’ competitive, market, and technological environments. To follow up
on the implementation of BSC principles, all twelve of the customs and excise
organisations under consideration in this study created strategy maps. One of the
main considerations leading to the selection of these specific twelve customs and
excise organisations in this research was that they had one common strategic
objective (optimal state revenue collection) from the stakeholder perspective and
one strategic objective (high customer satisfaction) from the customer
perspective. This research was developed based on primary data collected during
fieldwork activity in the first quarter of 2016, with the exception of the 2016 data,
which became available in approximately February of 2017. Twelve organisations

204
participated in the research: the MSOs of Tanjung Priok, Batam, and Soetta and
the CEOs of Jakarta, Marunda, Merak, Tangerang, Bekasi, Bogor, Purwakarta,
Cikarang and Bandung.
For the purpose of analysis, BSC implementation was treated as a binary variable
represented by ‘1’ if the BSC had been fully implemented across all levels of the
organisation and ‘0’ otherwise. The BSC had been implemented in the large
customs and excise organisations in 2009. In 2010, the BSC began to be
implemented in the smaller CEOs. In the initial phases, the organisations
implemented the BSC at the organisational level, gradually cascading the system
to the lower levels of each organisation. In 2011, they extended the
implementation to the staff/employee level in accordance with Ministerial Decree
Number 454/KMK.01/2011). In addition to BSC implementation, the researcher
also included the variable of organisation size, primarily as a control variable.
According to the binary system adopted, large organisations were represented by
‘1’ and small organisations by ‘0’.
8.3.2 Dependent variables
8.3.2.1 Rationale for selection of the dependent variables
As stated at the outset of this chapter, two performance indicators were used in
this study: state revenue collection and customer satisfaction index. There are
three considerations according to which these two parameters were chosen to
represent OP. The first is that both are actual performance indicators used by all
twelve organisations that participated in this study. On the BSC strategy maps of
the twelve CEOs, state revenue collection is a key performance indicator (KPI)
describing the strategic objective of optimal state revenue collection. This
objective is located at the stakeholder perspective layer. On the same strategy
maps, the customer satisfaction index functions as a KPI of the strategic objective
of high customer satisfaction, located at the customer perspective layer.

205
The second reason for the choice of these two parameters is the high quality of
the measurements that can be made from the dimensions of those two
parameters. Optimal state revenue collection is one of the ultimate goals of the
twelve organisations being studied, and the achievement of this goal is supported
by all of the organisations’ other strategic objectives. The achievement of optimal
state revenue collection, in fact, represents the primary purpose of the
organisations’ efforts. With regard to the customer satisfaction index, assessing
this factor is very important for each of the customs and excise organisations
because it represents the degree of satisfaction of all customers (importers,
exporters, manufacturers, traders and other related government agencies). The
indices are generated by a customer survey and is conducted annually. The survey
itself describes four aspects of performance, namely system and procedure of
service, employee behaviour, office facilities, and information service. Thus, the
survey provides an opportunity for service users to evaluate the service quality
delivered by the customs and excise organisation. In addition, the organisation
being surveyed has no influence over the survey results; it can only attempt to
deliver excellent service to customers. In consideration of the fact that the
customer survey results represent the views of service users, this consumer survey
can be regarded as an objective indicator of OP.
The third reason for the choice of the two measures used in this chapter is data
availability. In terms of state revenue collection, all twelve customs and service
organisations were able to provide annually collected datasets (from 2009
onwards) as needed for this research. The availability of this performance
indicator is essential, because the main purpose of this study is to examine the
impact of BSC implementation. Therefore, due to the relatively complete
longitudinal data, the researcher was enabled to examine any differences in state
revenue collection before and after the BSC implementation period in each
organisation. Meanwhile, in terms of the customer satisfaction indices, all twelve
organisations were able to supply data only from 2013, 2014, 2015 and 2016. Thus,

206
the customer satisfaction index data could only be used for analysing BSC
influence after the implementation period.
8.3.2.2 State revenue collection
State revenue collection is a composite of three sources of revenue: customs duty,
excise duty and export duty. Every year, the customs and excise organisations
receive the target distributed by the upper level of their coordinating
organisations. The twelve organisations participating in this study have optimal
state revenue collection as their strategic objective, where the achievement of this
goal has become the key performance indicator (KPI) for assessing the
achievement of the strategic outcome. State revenue collection is the most
important measurement for the twelve participating organisations.
8.3.2.3 Customer satisfaction index
The customer satisfaction index portrays the aspects of an organisation’s system
and procedures for customer service delivery, employee behaviour, office
facilities, and information service. In addition to functioning as a key performance
indicator, the twelve organisations being studied utilise the results of the
customer satisfaction surveys to improve their level of customer service delivery.
The customs and excise headquarters standardise the questionnaire used in the
survey of customer satisfaction and instructs the customs and excise organisations
to carry out the survey annually using the standardised questionnaires. With
regard to the survey respondents, each organisation conducts an external survey,
sending it to customers who have direct experience of using customs and excise
services via either the web or direct visits to MSOs or CEOs.

207
8.4 BSC cut-off years
The BSC was implemented differently amongst the twelve organisations
participating in the present research. The MSO of Tanjung Priok and the MSO of
Batam, both of which are large organisations, began their BSC implementation
gradually in 2009. In 2009, they first adopted the BSC as their PMS and then
cascaded the implementation within their organisations. Meanwhile, the nine
remaining organisations (the CEO of Cikarang had not yet been opened) began the
implementation of the BSC as their PMS in 2010 and gradually cascaded the
system within their organisations. As decreed in Ministerial of Finance Decree 454
(2011), starting in 2011, the twelve CEOs began to implement the BSC as the
individual-level performance management system. Since 2012, the BSC has been
the PMS not only at the organisational level but also at the individual level. Hence,
the performance of all employees within the organisations has since that time
been measured using KPIs which are directly or indirectly related to their
organisational strategic objectives. Given the fact that all Indonesian customs and
excise organisations have applied the BSC at the individual level since 2012, this
research considers the cut-off year for all organisations to be 2012, with the
exception of the CEO of Cikarang. The CEO of Cikarang was first established in
2015, and in this case, the BSC was introduced at organisational and individual
levels simultaneously.
8.5 Data collection
Most of the data on state revenue collection (2009 to 2016) and customer
satisfaction indices (2013 to 2016) were collected during the researcher’s
fieldwork activities, excluding the 2016 performance data, which became available
in February 2017. The data on state revenue collection formed part of the
questionnaire for this study and were therefore to be provided by the
performance managers in each organisation. Meanwhile, the 2016 data for both
variables became available in the first quarter of 2017. The researcher therefore

208
contacted the person in charge in each of the twelve organisations to obtain the
2016 data on state revenue collection and customer satisfaction indices. To ensure
accuracy, the data were double checked by the contact person responsible for
keeping the records of those twelve organisations in a unit of the Headquarters of
Customs and Excise. With their accuracy confirmed, the data on state revenue
collection for the period from 2009 to 2016 and customer satisfaction indices for
the period from 2013 to 2016 were ready for the subsequent process of analysis.
8.6 Descriptive statistics
8.6.1 Descriptive statistics on state revenue collection
This section describes the achievements of the twelve participating organisations
in terms of state revenue collection and customer satisfaction. The levels of state
revenue collection from 2009 to 2016 are illustrated in Figure 8.1.
Figure 8.1 State revenue collection of the 12 customs and excise organisations
01.0002.0003.0004.0005.0006.0007.0008.0009.000
10.00011.00012.00013.00014.00015.00016.00017.00018.00019.00020.00021.00022.00023.00024.000
2009 2010 2011 2012 2013 2014 2015 2016
State revenue collection
Tg Priok Batam Soetta Marunda
Jakarta Tangerang Merak Bogor
Bekasi Cikarang Purwakarta Bandung

209
As seen in Figure 8.1, state revenue increased beginning in 2009 and reached its
peak level in 2013. In the subsequent two years, state revenue showed a
decreasing trend; however, it began to increase again in 2016. In general, for the
period from 2009 to 2016, state revenue collection at the MSO of Tanjung Priok
increased relatively steadily, with only a slight decrease in the 2014 and 2015 fiscal
years. Considering BSC implementation, from 2009 to 2011 (before the
implementation of the BSC), state revenue collection at the MSO of Tanjung Priok
experienced an upward trend. In the period from 2012 to 2016 (after the
implementation of the BSC), the trend fluctuated, with an increasing trend lasting
until 2013, followed by decreasing trends in 2014 and 2015 and regaining positive
momentum in 2016. At the MSO of Batam, state revenue collection increased
dramatically in 2010 and 2011. It then decreased substantially in 2012 and 2013,
and the downward trend continued until 2015. In 2016, the level of state revenue
collection began to increase again. In general, for the period from 2009 to 2016,
the performance of state revenue collection at the MSO of Batam was quite
variable, with the year 2011 marking the office’s highest achievement. With
respect to BSC implementation, from 2009 to 2011 (before implementation of
BSC), the MSO of Batan’s state revenue collection increased. From 2012 to 2016
(after implementation of the BSC), the MSO of Batam state revenue collection
experienced mostly a negative trend (2012, 2013, 2014 and 2015), with a slight
increase in 2016. As seen in Figure 8.1, state revenue collection at the MSO of
Soetta showed positive growth in the period from 2009 to 2016 with the highest
levels of revenue collection attained in 2016, when state revenue collection was
nearly triple that of 2009. In terms of BSC implementation, from 2009 to 2011
(before BSC implementation), state revenue collection levels display a constantly
increasing trend. The trend remained positive during the 2012 to 2016 period
(after BSC implementation).
Turning to the smaller offices, we found a variety of trends among the nine CEOs.
For the CEO of Marunda, Figure 8.1 shows both upward and downward movement

210
in state revenue collection from 2009 to 2016. There was a minor decrease in
collection from 2009 to 2010; however, in 2011, state revenue collection increased
to more than three times that of the previous year. In 2014, there was a slight
decrease, and in 2015 collection decreased by almost half from the previous year.
In 2016, the CEO of Marunda’s state revenue collection increased substantially,
more than doubling the previous year’s contribution. In general, for the period of
2009 to 2016, the state revenue collections at the CEO of Marunda fluctuated; the
office’s highest achievement occurred in 2016 with more than seven times its 2009
contribution. With regard to BSC implementation, from 2009 to 2011 (before
implementation of BSC), state revenue collection displays a fluctuating trend.
Likewise, in the period from 2012 to 2016 (after implementation of BSC), the trend
continued to fluctuate, including a slight decrease in 2012 followed by a major
increase (approximately triple the previous year’s figure) in 2013. In 2014 and
2015, the trend was negative; however, state revenue collection in the year 2016
doubled that of 2015 and thus set a new high point at the CEO of Marunda.
At the CEO of Jakarta, state revenue collection shows a positive trend during the
period from 2009 to 2016. There was a slight decrease in state revenue collection
in 2013 and 2014, but the office displayed positive growth in the 2015 and 2016
fiscal years. With respect to BSC implementation, from 2009 to 2011 (before BSC
implementation), state revenue collection at the CEO of Jakarta shows a
somewhat increasing trend, with only a slight decrease in 2010. Meanwhile, for
the 2012 to 2016 period (after BSC implementation), the trend fluctuated slightly
with a major increase in 2012 followed by a decreasing trend in 2013 and 2014.
State revenue collections at the CEO of Jakarta then increased substantially in both
2015 and 2016. Turning to the CEO of Merak, the movement of state revenue
collection can be divided into two trends, fluctuating and increasing over the
period of 2009 to 2016. The period from 2009 to 2012 was marked by variation in
performance. Subsequently, state revenue collection increased steadily from 2013
to 2016, with the greatest growth occurring in 2016. Considering BSC

211
implementation, from 2009 to 2011 (before BSC implementation), state revenue
collection fluctuated, with peak collection taking place in 2011. Meanwhile, after
BSC implementation, there was a major decrease in 2012 followed by a slight
decrease in 2013. From 2014 to 2016, Merak’s state revenue collection displayed
positive movement. The movement of state revenue collection in Tangerang CEO
can likewise be classified into two trends. From 2009 to 2014, state revenue
collection increased consistently. From 2015 to 2016, however, the pattern moved
in another direction. With regard to BSC implementation, from 2009 to 2011
(before BSC implementation), state revenue collection experienced positive
movement. After BSC implementation, the trend remained positive from 2012 to
2014. However, in the following two years (2015 and 2016), state revenue
collection decreased.
Meanwhile, a fluctuating trend is also seen in state revenue collection at the CEO
of Bogor. As seen in Figure 8.1, Bogor’s state revenue collection reached its highest
level in 2011 before falling in 2012. There was a tiny improvement in 2013 state
revenue collection, but levels decreased again in 2014. Subsequently, in 2015 and
2016, Bogor customs and excise managed to increase its state revenue collection.
Overall, the state revenue collection trend during 2009 to 2016 period was
somewhat inconsistent, with the organisation’s highest achievement in the year
of 2011. With consideration of BSC implementation, from 2009 to 2011 (before
BSC implementation), state revenue collection exhibited fluctuating movement.
Meanwhile, for the period from 2012 to 2016 (after BSC implementation), the
trend decreased somewhat from 2012 to 2014; state revenue collection then
recovered in 2015 and 2016.
State revenue collection at the CEO of Bekasi experienced two major trends, the
first from 2009 to 2013 and the second from 2014 to 2016. State revenue
collection increased from 2009 to 2013 and reached its peak in 2013. In 2014, state
revenue collection decreased to just over half that of the previous year’s

212
collection, and the levels continued to decrease in 2015 and 2016. Considered
together with BSC implementation, from 2009 to 2011 (before BSC
implementation), the state revenue collection trend increased, while the period
following BSC implementation displays two different patterns. The first one, in the
period from 2012 to 2013, continued the positive trend of state revenue
collection. The period from 2014 to 2016, however, yielded a considerable
decrease of state revenue collection. In 2015, the state revenue collected was
merely one-third of its 2014 total. In 2016, performance remained poor as shown
by a slight decrease in movement compared to 2015.
For the Cikarang CEO, data are available only for 2015 and 2016 since the Cikarang
customs and excise office was first established in 2015. From 2015 to 2016, the
CEO of Cikarang increased its state revenue collection nearly fivefold. Turning to
the Purwakarta customs and excise office, during the 2009 to 2016 period, the
office succeeded in increasing its state revenue collection annually. The highest
level of state revenue collection was in 2016, at nearly six times Purwakarta’s 2009
contribution. In relation to BSC implementation, from 2009 to 2011 (before BSC
implementation) the state revenue collection shows a gently increasing trend. This
trend continued from 2012 to 2016 (after BSC implementation).
Overall, the Bandung customs and excise office’s state revenue collection
fluctuated from 2009 to 2016. Collection increased from 2009 to 2010 but
decreased in 2011. A positive trend began during 2012 and 2013, but levels sank
in 2014 and 2015. In 2016, collection levels increased, nearly reaching those of
2013. As regards BSC implementation, from 2009 to 2011 (before BSC
implementation), state revenue collection in Bandung fluctuated. Likewise, for the
period from 2012 to 2016 (after BSC implementation), state revenue collection
levels were inconsistent. The trend was positive from 2012 to 2013, decreased in
2014 and 2015, and displayed positive movement in 2016.

213
8.6.2 Descriptive statistics of customer satisfaction indices
This section describes the customer satisfaction index achievements of the twelve
participating organisations. The customer satisfaction index data cover the period
from 2013 to 2016 as seen in Figure 8.2 below.
Figure 8.2 Customer satisfaction index results of the twelve customs and excise
organisations
Figure 8.2 shows that, in general, the customer satisfaction index in the Customs
and Excise MSO of Tanjung Prion fluctuated from 2013 to 2016. In 2015, the
organisation’s score was slightly lower (3.85) than in the previous year (3.89), with
the greatest increase occurring in 2016 (4.13). Turning to the Batam MSO, the level
of customer satisfaction from 2013 to 2016 grew steadily. Only in 2014 did the
organisation score the same as in the previous year (3.44); after 2014, the trend
continued to increase, reaching its highest point in 2016 (4.15). Similarly, the
Soetta Main Service Office showed continuously improving customer satisfaction
indices from 2013 to 2016 (3.53 to 3.90).
Turning to the smaller customs and excise offices, the results of the customer
survey are varied; some offices improved consistently (such as the Tangerang and
3,30
3,50
3,70
3,90
4,10
4,30
4,50
4,70
4,90
2013 2014 2015 2016
Customer survey index
Tg Priok Batam Soetta
Marunda Jakarta Tangerang
Merak Bogor Bekasi
Cikarang Purwakarta Bandung

214
Bandung CEOs), while some trends fluctuated (for example, those of the Merak
and Bekasi CEOs). After experiencing a sizeable decrease in 2014 (3.99 to 3.82),
the customer satisfaction index in the Marunda CEO improved significantly in 2015
and 2016, with the office’s highest achievement in 2016 (3.99 to 4.04). Turning to
the Jakarta CEO, the level of customer satisfaction fluctuated from 2013 to 2016;
2014 was the year in which the office achieved its highest customer satisfaction
index (4.79). The level of satisfaction plummeted in 2015 (to 4.00). Then, in 2016,
the level of customer satisfaction increased considerably (4.32). With regard to
the Merak CEO, it showed a positive customer satisfaction index trend from 2013
to 2015 (3.77 to 4.38). However, in 2016, the customer satisfaction index
decreased to its lowest level in the four-year period under consideration (3.50).
Meanwhile, the Tangerang CEO experienced a continuous positive trend in
customer satisfaction index from 2013 to 2016, with scores growing from 3.69 to
4.58. Turning to the Bogor CEO, it experienced an overall negative trend during
the 2013-2016 period. The CEO of Bogor started with a very high score in 2013
(4.74), slipping to 4.64 and 4.40 in the two subsequent years. However, in 2016,
the Bogor CEO’s customer satisfaction index increased to 4.44. With regard to the
Bekasi CEO, Figure 8.2 shows an increasing trend from 2013 to 2015 (4.17 to 4.24).
However, in the following year, the customer satisfaction index results decreased
(to 4.18). In the period from 2013 to 2016, the Purwakarta CEO experienced ups
and downs in its customer satisfaction index; at the beginning of the measurement
period, there was a huge increase in the customer satisfaction index (from 3.84 in
2013 to 4.65 in 2014). However, drastic negative movement in the trend occurred
during the 2015 to 2016 period (4.63 to 4.25). Lastly, like the Tangerang CEO, the
Bandung CEO’s customer satisfaction indices increased consistently from 2013 to
2016 (4.22 to 4.40).
8.7 Main data analysis

215
This study aims to investigate the impact of BSC implementation on CEOs’ OP. Two
tools were applied to analyse the data in this research: panel data regression
models and growth curve models. The first approach used panel data regression
analysis to evaluate the state revenue collection data, which was available from
2009 to 2016, thus covering both the period before (2009 to 2011) and after BSC
implementation (2012 to 2016). The use of panel data regression analysis enabled
the researcher to identify the presence of any differences in state revenue
collection levels after the implementation of BSC across the twelve customs and
excise organisations, thus determining how much the BSC contributed to the
changes. The second approach used in the analysis was growth curve modelling,
which was applied in the analysis of customer satisfaction index data. None of the
twelve participating organisations could provide customer satisfaction indices
from the period before the implementation of the BSC. Thus, the analysis focuses
on customer satisfaction trends after implementation of the BSC.
8.7.1 Panel data regression model as analytical tools
Gujarati (2011, p. 293) explained that a panel data regression model is based on
panel data, which are observations of individuals or units on the same cross-
section (time) or over a particular length of time (periods). Baltagi (2013, pp. 6-8)
suggested that a panel data regression model has at least seven advantages: first,
panel data propose that individuals, organisations, states or countries are
heterogeneous. Thus, panel data enable the researchers to control individual
heterogeneity. Second, panel data regression provides more information with less
collinearity amongst variables and greater freedom and data efficiency. Third,
panel data handles the dynamics of data adjustment well. Fourth, panel data can
better detect and measure effects that cannot be observed in pure cross-sectional
or time series data. Fifth, panel data enables the user to develop and examine
more complicated behavioural models than pure cross-sectional data and time
series data can do. Sixth, micro panel data may reduce or omit bias resulting from
aggregation over organisations or individuals. Seventh, macro panel data are
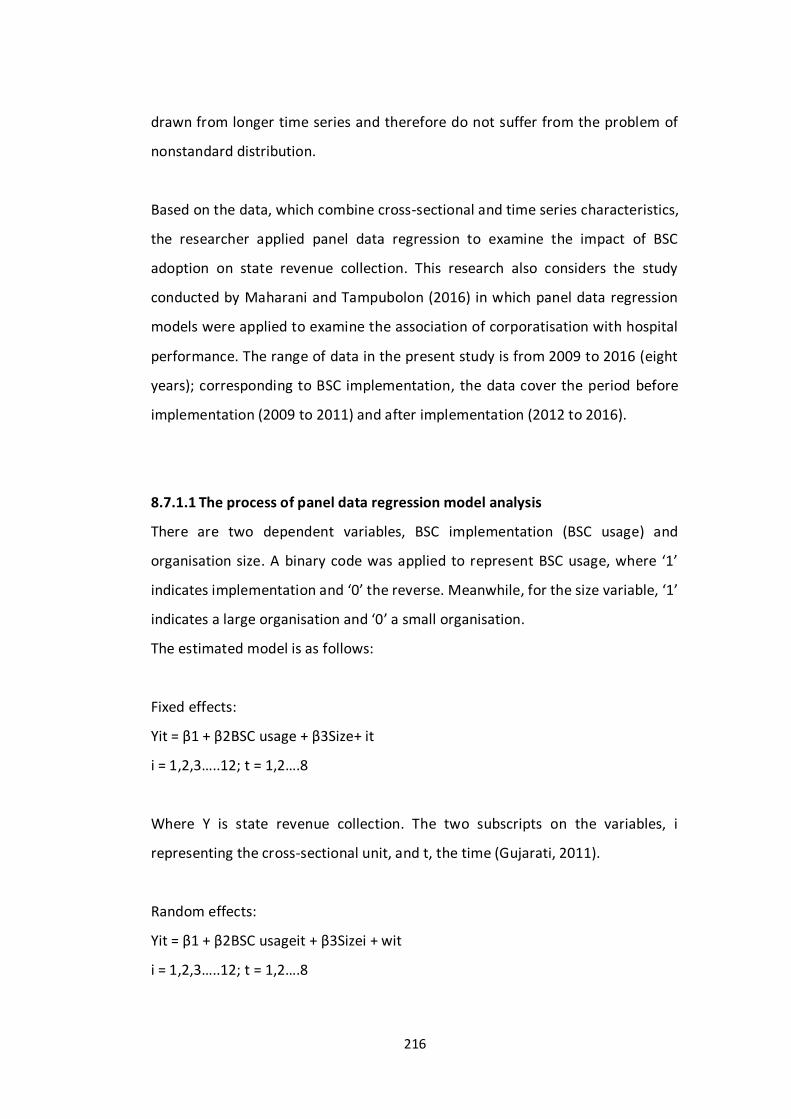
216
drawn from longer time series and therefore do not suffer from the problem of
nonstandard distribution.
Based on the data, which combine cross-sectional and time series characteristics,
the researcher applied panel data regression to examine the impact of BSC
adoption on state revenue collection. This research also considers the study
conducted by Maharani and Tampubolon (2016) in which panel data regression
models were applied to examine the association of corporatisation with hospital
performance. The range of data in the present study is from 2009 to 2016 (eight
years); corresponding to BSC implementation, the data cover the period before
implementation (2009 to 2011) and after implementation (2012 to 2016).
8.7.1.1 The process of panel data regression model analysis
There are two dependent variables, BSC implementation (BSC usage) and
organisation size. A binary code was applied to represent BSC usage, where ‘1’
indicates implementation and ‘0’ the reverse. Meanwhile, for the size variable, ‘1’
indicates a large organisation and ‘0’ a small organisation.
The estimated model is as follows:
Fixed effects:
Yit = β1 + β2BSC usage + β3Size+ it
i = 1,2,3…..12; t = 1,2….8
Where Y is state revenue collection. The two subscripts on the variables, i
representing the cross-sectional unit, and t, the time (Gujarati, 2011).
Random effects:
Yit = β1 + β2BSC usageit + β3Sizei + wit
i = 1,2,3…..12; t = 1,2….8

217
Where Wit = εi + uit
The composite error term Wit has two components: εi representing the cross-
sectional or individual specific error component and uit representing the
combination of time series and cross-sectional error components (Gujarati, 2011).
Before running the model, the normality of the state revenue collection data was
checked by comparing a histogram of the sample data to a normal probability
curve. The histogram results, as shown in Appendix 10a, showed that the data on
state revenue collection was not normally distributed. The researcher therefore
used log command to normalise the data distribution, and the resulting histogram
(see Appendix 10b) showed that the state revenue collection data had reached
normal distribution. After normalising the data, the next step was to run panel
data regression with fixed effects methods or random effects methods.
8.7.1.2 Panel data regression results
The results of the panel data regression are provided in Table 8.2. The table
presents the results of both random effects and fixed effects models. From the
table, we can also see the differences generated by fixed effects methods and
random effects methods, where the time-invariant variable (size) was estimated
in the random effects method but was omitted in the fixed effects method. From
this perspective, the random effects model is more appropriate for estimating the
proposed model (Gujarati, 2011).
Table 8.2 Fixed effects and random effects
Exogenous variable Fixed effects Random effects
BSC usage 0.41 (0.12) ‡ 0.41 (0.12) ‡
Size 0 (omitted) 1.30 (1.47)
Note: Reported are coefficients (standard error). Significance: *10% or less; †5% or less;
‡1% or less.

218
In addition to comparing the fixed and random effects models, the researcher
applied the Hausman test to help choose the better method. Based on the
Hausman test statistics, the null hypothesis could not be rejected since the
Prob>chi2 (0.8792) > 0.05. Hence, based on the results of both methods (fixed and
random) and the Hausman test, it was determined that the random effects model
was the most appropriate model for performing panel data regression analysis.
Therefore, the results from the random methods were used. The dependent
variables represent the measure of OP (state revenue collection), while the
exogenous variables are BSC implementation (BSC usage) and organisation size
(size). The results indicated that BSC implementation across the twelve CEOs had
a significant and positive (0.41) effect on state revenue collection. With regard to
the organisation size variable, despite the insignificance of the correlation, size
indeed revealed a positive (1.3) correlation with state revenue collection.
8.7.2 Growth curve analysis
Panel data regression analysis could not be applied to analyse the customer
satisfaction index data because the data did not cover the pre-implementation
period. The data was available only from 2013 to 2016, while the starting year of
BSC implementation at the individual level was 2012. Therefore, growth curve
modelling using maximum likelihood estimation was applied to examine the
trends in customer satisfaction levels over time (2013 to 2016) and to determine
how BSC usage correlated with those trends.
The results of the growth curve modelling show that BSC implementation in all
twelve organisations had a positive association with the customer satisfaction
index (0.07 at ρ < 0.05) and a negative association with organisation size (-0.33 at
ρ < 0.1). Table 8.3 provides detailed information on the growth curve modelling
results.

219
Table 8.3 Growth Curve Modelling Results
CSIndex Coefficient Standard Error
Year 0.07 0.03**
Size -0.33 0.17*
Prob > chi2 = 0.0142, Significance: *10% or less; **5% or less; ***1% or less
Figure 8.3 provides a visualisation of the shape of the year-by-year customer
satisfaction index of the twelve customs and excise organisations. The growth
curve shows increasing customer satisfaction indices during the period after BSC
implementation.

220
Figure 8.3 Growth curve modelling of customer satisfaction index
8.8 Hypothesis testing
This section explains the associations between the findings and the hypothesis
proposed. Regarding OP, this study employed two measures as dependent
variables of OP: state revenue collection and customer satisfaction index. With
regard to panel data regression analysis, we report that BSC implementation
across the twelve CEOs had a positive (0.41) and significant effect on state revenue
collection. In terms of the organisation size variable, despite its insignificant
correlation, larger size showed a positive association (1.30) with state revenue
collection. Turning to growth curve modelling analysis, we report that BSC
implementation across the twelve CEOs showed a positive and significant
association (0.07) effect with customer satisfaction index. Larger size showed an
insignificant and negative (-0.33) association with customer satisfaction index.
Table 8.4 summarises the findings in correlation with the hypothesis.
3.9
44.
14.
2
Fitte
d va
lues
2013 2014 2015 2016Year

221
Table 8.4 Hypothesis testing results
Research question Hypothesis Result
RQ6. How is BSC
implementation
associated with
organisational
performance?
H7. The implementation of the
BSC is positively associated with
organisational performance.
Implementation
of the BSC has
positive
association with
OP, as shown by
means of both
state revenue
collection and
customer
satisfaction
index.
8.9 Chapter summary
This is the final findings chapter in this thesis. It focused on analysing the
association of BSC with organisational performance. The analysis in this chapter
was based on the research question: How is BSC implementation associated with
organisational performance? In the analysis process, the researcher used the
STATA 14 statistical software package. Two analytical tools were applied: panel
data regression modelling and growth curve modelling.
Panel data regression was used in order to evaluate the impact of implementing
BSC during two different time periods: before and after BSC implementation. The
dependent variable included in this method was state revenue collection. With
regard to the analytical results, BSC implementation displayed a positive
correlation with state revenue collection (0.41), which indicates that positive
changes in state revenue collection resulted from the implementation of the BSC.
Meanwhile, growth curve modelling has the ability to analyse longitudinal data,
although the period of data availability did not include the period before BSC
implementation. The growth curve analysis used data from customer satisfaction
indices. Similar to the panel data regression results, the growth model analysis also

222
found that there is a positive association (0.07) between BSC implementation and
customer satisfaction index. Thus, from these two analytical results, it can be
concluded that the implementation of the BSC is positively related to OP. Further
explanations of the findings in this chapter are offered in Chapter 9.

223
Chapter 9: Discussion of Empirical Findings
9.1 Introduction
This chapter discusses the findings from Chapters 6, 7 and 8 and relates them to
both the theories and findings presented in previous studies as examined in the
literature review (Chapter 3) and applied in the conceptual framework (Chapter
4).
In all, this chapter has four sections. It begins with the introduction section,
followed by an overview of the research questions, hypotheses and results of the
study as presented in Chapters 6, 7 and 8. The main discussion of the empirical
findings follows, in accordance with the sequence of the research questions. The
first discussion section covers BSC implementation as represented by the SFO
principles. It also discusses the results of the investigation of the relationships of
organisation size and employee roles with BSC implementation. The second
discussion section analyses the correlations of the BSC with PSM and OC. This
section also provides a discussion of the relationship between PSM and OC. The
last part of the discussion offers an explanation of the findings from the
investigation of the relationship between the BSC and OP. Finally, the chapter
closes with a summary.

224
9.2 Overview of the research questions, hypotheses and main findings of the study
This study aimed to explore the implementation of balanced scorecard as a performance management system within public-sector
organisations in Indonesia with a view to clarifying the nature of balanced scorecard practices and their relationship to organisational
factors, organisational performance and employee behaviour. The need to explore the implementation of the BSC was noted by
Hoque (2014, p. 49): ‘Future studies can explore whether and how public-sector organisations in emerging economies have adopted
the BSC framework to improve organisational effectiveness’.
Overall, this study examined the consequences of BSC implementation on organisation size, employee roles, OC, PSM and OP using
data from twelve customs and excise organisations and 1,675 individual respondents in Indonesia. More detailed discussions of the
findings of the present study are provided in the following sections. Table 9.1 compiles the research questions, hypotheses, results
and interpretations of the results originating from Chapters 6, 7 and 8. The results shown in Table 9.1 are discussed further in the
following sections.
Table 9.1 Hypothesis testing
Research questions Hypothesis Results Interpretation of the results
RQ1. How do SFO
principles relate to each
other within
implementation of the
BSC?
H1. SFO principles correlate positively with each
other within the framework of the BSC.
Supported. All latent variables showed a significant
relationship at ρ <0.01 as follows:
- β= 0.80 for strategy translation and strategy alignment,
- β= 0.87 for strategy translation and strategy as everyone’s everyday job,
- β= 0.84 for strategy translation and strategy as a continuous process,
All five principles of SFO relate positively to
one another in the context of BSC
implementation.

225
- β= 0.88 for strategy translation and leadership involvement,
- β= 0.86 for strategy alignment and strategy as everyone’s everyday job,
- β= 0.68 for strategy alignment and strategy as a continuous process,
- β= 0.67 for strategy alignment and leadership involvement,
- β= 0.82 for strategy as everyone’s everyday job and strategy as a continuous process,
- β= 0.76 for strategy as everyone’s everyday job and leadership involvement, and
- β= 0.77 strategy as a continuous process and leadership involvement.
RQ2. To what extent are
organisational factors
associated with the
implementation of the
BSC?
H2. The large organisation has more influence on the implementation of the BSC than the small organisation. H2a. The level of BSC strategy translation is higher
for employees working in large organisations than for employees working in small organisations;
H2b. The level of BSC strategy alignment is higher for employees working in large organisations than for employees working in small organisations;
H2c. The level of BSC strategy becomes everyone’s everyday job is greater for employees working in large organisations than for employees working in small organisations;
H2d. The level of BSC strategy becomes a continuous process is greater among employees working in large organisations than among employees working in small organisations;
- Not supported. BSC strategy translation has a negative and significant relationship with employees working in large organisations (β= -0.25 at ρ <0.01);
- Not supported. BSC strategy alignment has a negative and significant relationship with employees working in large organisations (β= -0.19 at ρ <0.01);
- Not supported. BSC strategy as everyone’s everyday job has a negative and significant relationship with employees working in large organisations (β= -0.21 at ρ <0.01);
- Not supported. BSC strategy as a continuous process has a negative and significant relationship with employees working in large organisations (β= -0.24 at ρ <0.01);
- Not supported. BSC leadership involvement has a
negative and significant relationship with
- Employees working in large organisations are likely to experience a lower level of BSC strategy translation.
- Employees working in large organisations are likely to experience a lower level of BSC strategy alignment.
- Employees working in large organisations are likely to experience a lower level of BSC strategy as everyone’s everyday job.
- Employees working in large organisations are likely to experience a lower level of BSC strategy as a continuous process.
- Employees working in large organisations
are likely to experience a lower level of BSC leadership involvement.
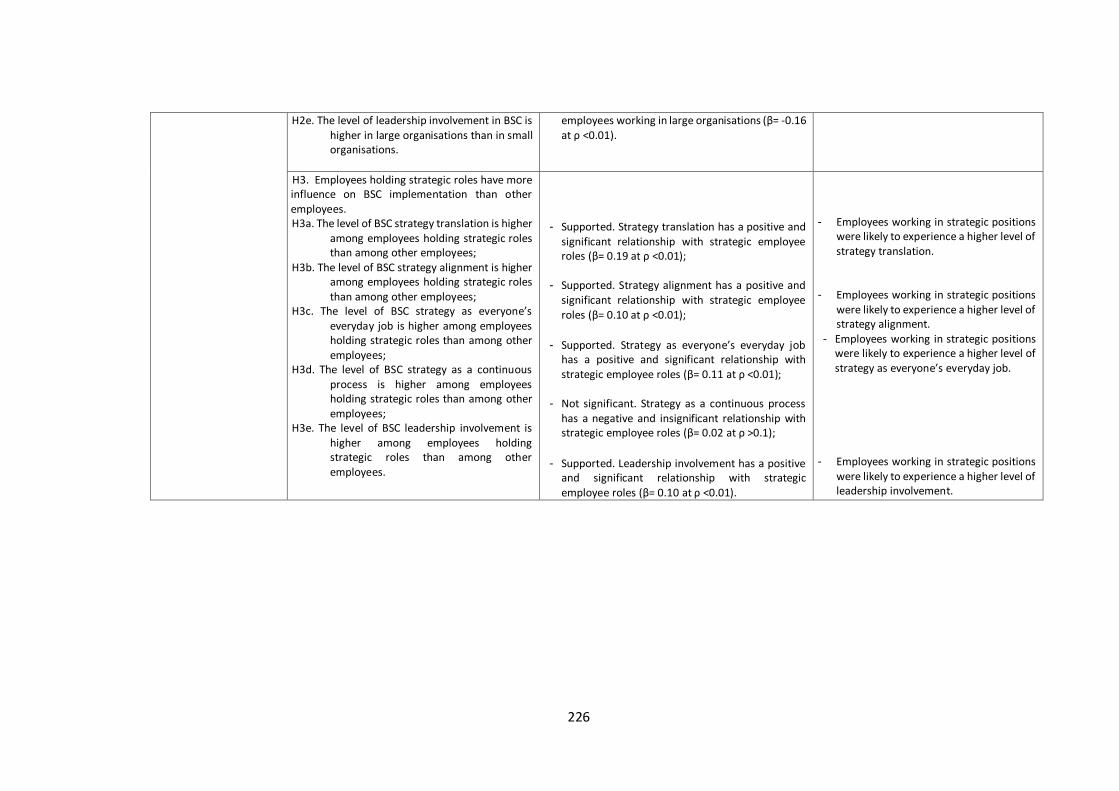
226
H2e. The level of leadership involvement in BSC is higher in large organisations than in small organisations.
employees working in large organisations (β= -0.16 at ρ <0.01).
H3. Employees holding strategic roles have more influence on BSC implementation than other employees. H3a. The level of BSC strategy translation is higher
among employees holding strategic roles than among other employees;
H3b. The level of BSC strategy alignment is higher among employees holding strategic roles than among other employees;
H3c. The level of BSC strategy as everyone’s everyday job is higher among employees holding strategic roles than among other employees;
H3d. The level of BSC strategy as a continuous process is higher among employees holding strategic roles than among other employees;
H3e. The level of BSC leadership involvement is higher among employees holding strategic roles than among other employees.
- Supported. Strategy translation has a positive and significant relationship with strategic employee roles (β= 0.19 at ρ <0.01);
- Supported. Strategy alignment has a positive and significant relationship with strategic employee roles (β= 0.10 at ρ <0.01);
- Supported. Strategy as everyone’s everyday job has a positive and significant relationship with strategic employee roles (β= 0.11 at ρ <0.01);
- Not significant. Strategy as a continuous process has a negative and insignificant relationship with strategic employee roles (β= 0.02 at ρ >0.1);
- Supported. Leadership involvement has a positive and significant relationship with strategic employee roles (β= 0.10 at ρ <0.01).
- Employees working in strategic positions were likely to experience a higher level of strategy translation.
- Employees working in strategic positions were likely to experience a higher level of strategy alignment.
- Employees working in strategic positions were likely to experience a higher level of strategy as everyone’s everyday job.
- Employees working in strategic positions were likely to experience a higher level of leadership involvement.

227
RQ3. Do the SFO
principles within the
implementation of the
BSC have a relationship
with OC?
H4. The SFO principles within the implementation of the BSC are positively associated with organizational commitment.
H4a. The better the strategy translation through BSC implementation, the more employees’ organisational commitment will increase;
H4b. The better the strategy alignment through BSC implementation, the more employees’ organisational commitment will increase;
H4c. The better the realisation of strategy as everyone’s everyday job through BSC implementation, the more employees’ organisational commitment will increase;
H4d. The better the realisation of strategy as a continuous process through BSC implementation, the more employees’ organisational commitment will increase;
H4e. The better the leadership involvement through BSC implementation, the more employees’ organisational commitment will increase.
- Supported. Strategy translation has a negative and
significant relationship with OC (β=- 0.36 at ρ <0.05);
- Not significant. Strategy alignment has a positive and insignificant relationship with OC (β= 0.09 at ρ >0.1);
- Not significant. Strategy as everyone’s everyday job has a positive and insignificant relationship with OC (β= 0.08 at ρ >0.1);
- Supported. Strategy as a continuous process has a positive and significant relationship with OC (β= 0.33 at ρ <0.01);
- Supported. Leadership involvement has a positive and significant relationship with OC (β= 0.63 at ρ <0.01).
- Strategy translation within the BSC framework had a negative association with the OC of the customs and excise employees.
- Strategy as a continuous process within the BSC framework had a positive association with the OC of the customs and excise employees.
- Leadership involvement within the BSC framework had a positive association with the OC of the customs and excise employees.
RQ4. Do the SFO
principles within the
implementation of the
BSC have a relationship
with PSM?
H5. The SFO principles within the implementation of the BSC are positively associated with public service motivation. H5a. The better the strategy translation through
BSC implementation, the more employees’ public service motivation will increase;
H5b. The better the strategy alignment through BSC implementation, the more employees’ public service motivation will increase;
H5c. The better the realisation of strategy as everyone’s everyday job through BSC implementation, the more employees’ public service motivation will increase;
- Supported. Strategy translation has a positive and
significant relationship with PSM (β= 0.49 at ρ <0.05);
- Not significant. Strategy alignment has a negative and insignificant relationship with PSM (β= -0.04 at ρ >0.1);
- Supported. Strategy as everyone’s everyday job has a positive and significant relationship with PSM (β= 0.35 at ρ <0.01);
- Strategy translation within the BSC
framework was positively associated with the PSM of the customs and excise employees.
- Strategy as everyone’s everyday job within the BSC framework was positively
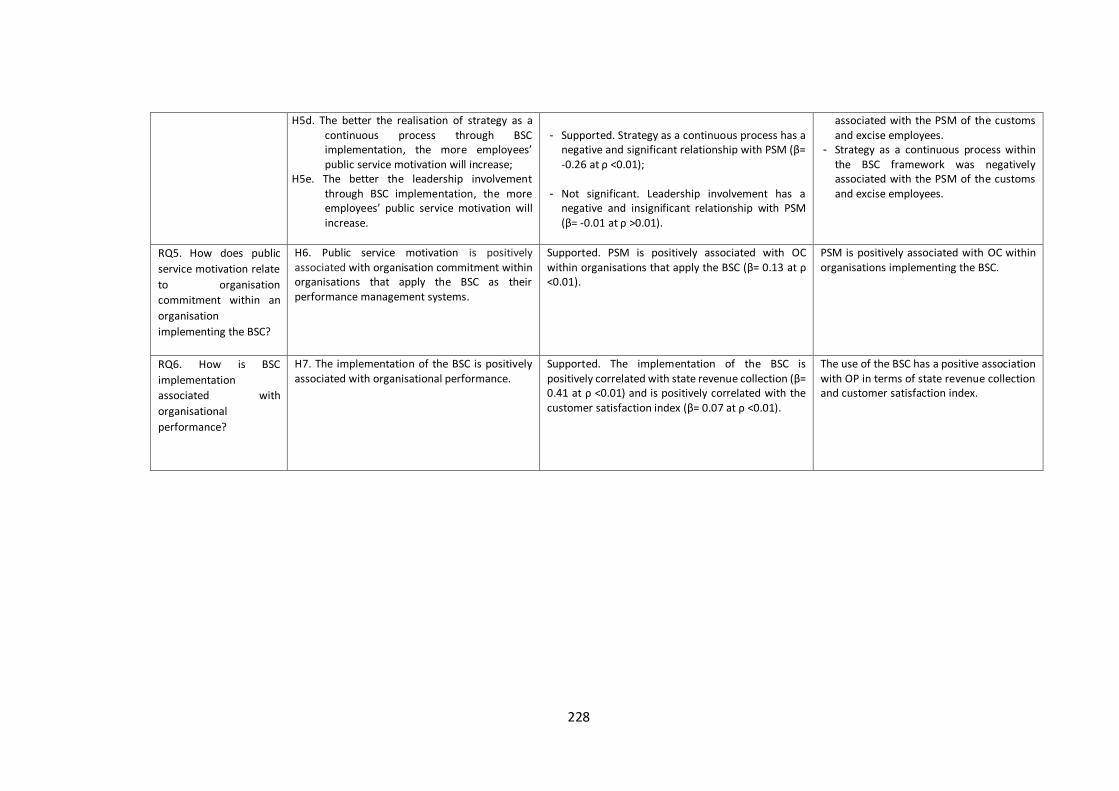
228
H5d. The better the realisation of strategy as a continuous process through BSC implementation, the more employees’ public service motivation will increase;
H5e. The better the leadership involvement through BSC implementation, the more employees’ public service motivation will increase.
- Supported. Strategy as a continuous process has a
negative and significant relationship with PSM (β= -0.26 at ρ <0.01);
- Not significant. Leadership involvement has a negative and insignificant relationship with PSM (β= -0.01 at ρ >0.01).
associated with the PSM of the customs and excise employees.
- Strategy as a continuous process within the BSC framework was negatively associated with the PSM of the customs and excise employees.
RQ5. How does public
service motivation relate
to organisation
commitment within an
organisation
implementing the BSC?
H6. Public service motivation is positively associated with organisation commitment within organisations that apply the BSC as their performance management systems.
Supported. PSM is positively associated with OC within organisations that apply the BSC (β= 0.13 at ρ <0.01).
PSM is positively associated with OC within organisations implementing the BSC.
RQ6. How is BSC
implementation
associated with
organisational
performance?
H7. The implementation of the BSC is positively associated with organisational performance.
Supported. The implementation of the BSC is positively correlated with state revenue collection (β= 0.41 at ρ <0.01) and is positively correlated with the customer satisfaction index (β= 0.07 at ρ <0.01).
The use of the BSC has a positive association with OP in terms of state revenue collection and customer satisfaction index.

229
9.3 Discussion of the findings
RQ1. How do SFO principles relate to each other within implementation of the BSC?
Previous studies have revealed that the BSC concept may be applied in different
ways (see Speckbacher et al. 2003; Braam et al. 2007; Modell 2009; Madsen 2011).
One potential explanation is that the BSC allows for interpretation in practice,
which makes it appealing to many potential users in diverse settings (Madsen and
Stenheim 2015). However, Kaplan and Norton (2001c) articulated that successful
implementation of the BSC should employ the SFO principles. Following Kaplan
and Norton (2001c), the SFO principles were used in this study to evaluate BSC
implementation. However, before applying them to the model, the SFO principles
were tested to ensure their relevance to the samples collected by the researcher.
The analysis results confirmed that the twelve responding organisations had
adopted the BSC in conformance with the SFO principles. Thus, the results
supported Hypothesis H1, which stated that SFO principles correlate positively
with each other within the implementation of the BSC. From this finding, it can be
asserted that SFO principles apply to the customs and excise organisations.
The results of the present study support Kaplan and Norton’s (2001c) articulation
of the importance of the SFO principles for successful implementation of the BSC.
The present study also echoes the conclusions reached by de Geuser et al. (2009,
p. 117) in their study on the effect of the BSC on company performance. In their
conclusion, de Geuser et al. stated that the BSC’s contribution to performance
depends on three of the SFO principles: strategy translation, strategy as a
continuous process and strategy alignment. However, in addition to these, the
present study augments the current body of knowledge with at least three new
components in the following areas: the specification of organisational setting, the
inclusion of research participants at all organisational levels, and the clarity of the
stage or level of BSC implementation.
230
In terms of the organisational settings of the research, this study was conducted
in twelve customs and excise organisations that vary in size. Those twelve
organisations are public-sector organisations (three large and nine small) in
Indonesia, a country with a developing economy. In this sense, the present study
responds to Madsen and Stenheim’s (2015) call for attention to the use of BSC in
different types of organisations, particularly those of different sizes. In terms of
research participants, unlike the study by de Geuser et al. (2009), which involved
only managers, the present study involved employees from all levels of the
organisations studied. It is anticipated that the results drawn from the present
study are therefore more comprehensive in evaluating diffusion of the BSC within
the responding organisations. In terms of the clarity of the stage or level of BSC
implementation, de Geuser et al. (2009) stated that they did not have information
regarding the stage of development of the BSC in the organisations studied.
Following Malmi (2001), who suggested that the benefits and success of the BSC
implementation can be expected to differ depending on how the BSC is applied,
this study selected organisations based on their stage of BSC developments.
Although the participating organisations varied in terms of the starting points of
implementation (with large organisations beginning in 2009 and small
organisations beginning in 2010), they had all implemented the BSC at the
individual employee level since 2012; in fact, they had adopted the BSC fully since
that time. In that sense, the results of the present study may offer a fuller
representation of BSC implementation. In other words, all twelve responding
organisations have fully implemented the BSC as their performance management
system. The stage or level of implementation is an important aspect to consider,
because it is believed that there is a relationship between how the BSC is used and
the subsequent performance effects (Braam and Nijssen 2004; Papalexandris et
al. 2004). To reach a detailed understanding of the BSC’s implementation, the
findings and discussions of the five principles of strategy-focused organisations
follow.

231
With regards to strategy translation, further analysis showed a positive and
significant covariance of strategy translation with strategy alignment, strategy as
everyone’s everyday job, strategy as a continuous process, and leadership
involvement. This result may have two important implications. First is the
theoretical perspective, according to which the value of coefficient correlation
indicates that strategy translation had strong associations with each of the other
SFO principles. Second, with regard to the practical perspective, the present study
revealed that the employees in responding organisations were likely to agree that
the BSC had contributed effectively to the dissemination of strategy within the
organisation. As this study was populated by employees from all levels of their
organisations, excluding organisation heads, it may be reasonable to conclude that
the BSC is an effective means of strategy communication as acknowledged not
only by upper-echelon employees but also by staff. Regarding strategy
communication, then, the present study coincides with the study by Papalexandris
et al. (2004), who concluded that the BSC is supportive when applied as a
framework and a guideline for successful strategy communication.
Turning to strategy alignment, the further analysis using CFA showed positive and
significant covariance of strategy alignment with strategy translation, strategy as
everyone’s everyday job, strategy as a continuous process, and leadership
involvement. This result may have two essential implications. From the theoretical
point of view, the coefficient correlations showed that strategy alignment has a
strong association with each of other SFO principles. Meanwhile, from the
practical standpoint, employees in customs and excise organisations were likely to
agree that the BSC had effectively facilitated the alignment of strategy within the
organisation. This finding is in line with de Geuser et al. (2009) and Ayoup et al.
(2016). However, unlike de Geuser et al. (2009) and Ayoup et al. (2016), whose
studies involved only employees in managerial positions, the present study
included participants ranging from staff levels to those one level under the heads

232
of their organisations. Therefore, the present study may provide a more
comprehensive picture of how effectively the BSC assists in strategy alignment,
create synergies within organisations. From that perspective, the role of the the
BSC in helping align organisational strategy with lower-level units may be
acknowledged by all employees within the organisation.
With regards to strategy as everyone’s everyday job, the further analysis using
CFA revealed positive and significant covariance of strategy as everyone’s
everyday job with strategy translation, strategy alignment, strategy as a
continuous process and leadership involvement. This result may contribute two
essential implications. From the theoretical perspective, the coefficient
correlations showed that strategy as everyone’s everyday job has a strong
association with each of other SFO principles. Meanwhile, from the practical
perspective, responding employees of customs and excise organisations were
likely to agree that the BSC had contributed effectively to increasing their
awareness of strategy, whose success requires all employees’ active involvement.
In other words, it can be said that employees from all organisational levels are
involved in activities to help implement organisational strategies. This finding
supports Park and Huber’s (2007) position that participation from employees of
all organisational levels is an essential factor in the successful measurement and
management of performance using the BSC.
Concerning strategy as a continuous process, the further analysis using CFA
showed positive and significant covariance with strategy translation, strategy
alignment, strategy as everyone’s everyday job, and leadership involvement.
This result may contributed two significant implications. From the theoretical
perspective, the coefficient correlations indicate that strategy as a continuous
process has a strong association with each of the other SFO principles. Meanwhile,
from a practical standpoint, responding employees of customs and excise
organisations agreed that the BSC had contributed effectively to influence
233
strategic practices on a continuous basis. This finding is consistent with de Geuser
et al. (2009). However, the current study differs from that of de Geuser et al.
(2009), which involved only managers. The present study involved employees at
all levels of the organisation. In that sense, the results of this study lead to the
conclusion that the role of the BSC in supporting continuous strategic practices is
acknowledged not only by upper-echelon employees but also by individuals at the
lower echelons and staff levels.
With respect to leadership involvement, the further analysis using CFA showed a
positive and significant covariance with strategy translation, strategy alignment,
strategy as everyone’s everyday job, and strategy as a continuous process. From
the theoretical point of view, the coefficient correlations indicate that leadership
involvement has a strong association with each of the other SFO principles.
Meanwhile, from the practical perspective, responding employees of customs and
excise organisations agreed that management-level employees had shown great
support in implementing the BSC within their organisations. Several previous
studies have expressed the same findings regarding the importance of leadership
roles; Chan (2004), researching municipal governments in the USA and Canada,
highlighted top management commitment and leadership as a necessary factor
for implementing the BSC. In a similar vein, Fernandes et al. (2006), who studied
the implementation of the the BSC in a small-to-medium enterprise in the UK,
concluded that BSC implementation requires strong support from top
management. Wisniewski and Olaffson (2004) also reached similar results and
proposed the importance of managerial commitment in BSC implementation in
public-sector organisations. Likewise, Park and Huber (2007, p. 16) mentioned that
successful implementation of the BSC relies heavily on the leadership and support
of senior management levels.
RQ2. To what extent are organisational factors associated with the implementation of BSC?

234
After confirming the SFO principles as the framework for BSC implementation, the
next step was to discuss to what extent organisation size and employees’ roles
relate to BSC implementation. Following the confirmation of the SFO model in the
responding organisations, the researcher evaluated the relationships between the
BSC as represented by SFO principles and organisation size and employee roles.
1. The relationship between BSC implementation and organisation size
Compared to other previous studies examining the relationship between
organisation size and the implementation of the BSC (Hoque and James 2002;
Speckbacher et al. 2003), the present study utilises an expanded definition of BSC
implementation in that it follows SFO principles (Kaplan and Norton, 2001). As
such, this study can identify more specifics in each area of BSC implementation.
The results showed that the size of the organisation had a significant and negative
association with all five SFO principles. This indicated that large organisations are
less likely to have fully implemented the BSC. This finding is not in line with Hoque
and James’s work (2000), which suggested that larger organisations make more
complete use of the BSC. This finding also disagrees with the results of the study
by Speckbacher et al. (2003, p. 381), which showed that larger companies are
more likely to have fully implemented the BSC. This finding is close to that of Ford
(2000), who posited that small size is often viewed as advantageous in BSC
adaptation. Furthermore, Ford explained that the relative lack of structure in small
organisations is thought to reduce disinterest and therefore facilitate mobility.
An ineffective internalization process leads to a low-level understanding of BSC
implementation, which might explain why the BSC is less likely to be adopted in
large organisations. The Customs and Excise Headquarters, which acts as the
coordinator of the customs and excise organisations, should be aware of this
finding so that effective strategies can be applied in large organisations. One
possible solution to the problem of BSC implementation in large organisations
would be to maximise the strategy map’s role in communicating strategy. The

235
strategy map facilitates better top-down communication, which tends to increase
customs and excise employees’ understanding and awareness of strategy and
allows for better execution and measurement of strategy (Scholey 2005, p. 18).
Another possible solution is for decision-makers to differentiate the
internalisation strategy in the two types of organisations; there exists a possibility
that the method works effectively in small organisations but not in large
organisations.
To determine how organisation size relates to BSC implementation, the findings
and discussions regarding strategy translation, strategy alignment, strategy as
everyone’s everyday job, strategy as a continuous process and leadership
involvement are presented next. With regard to strategy translation, the finding
indicates that employees working in large public-sector organisations were likely
to experience a lower level of strategy translation through the BSC. This result
thus contrasts with Hypothesis H2a, which stated that the level of BSC strategy
translation is higher for employees working in large organisations than for
employees working in small organisations. One possible explanation for this
finding is the fact that a large organisation has more layers of organisational
structures than a small organisation, making it harder for strategy translation to
take place.
With respect to strategy alignment, this study found that employees working in
large organisations are likely to experience a lower level of strategy alignment
than employees working in small organisations. Therefore, this result did not
support Hypothesis H2b, which predicted that the level of BSC strategy alignment
would be higher for employees working in large organisations than for employees
working in small organisations. Small organisations tend to be more flexible with
less bureaucracy, less rigidity in decision-making and quicker responses to new
opportunities and threats; consequently, they may offer more supportive work
environments than large organisations (Kuratko et al. 2001).

236
Turning to strategy as everyone’s everyday job, this study revealed that
employees working in large organisations were likely to experience a lower level
of participation in strategy execution than employees working in small
organisations. Therefore, the result did not match the expectation stated in
Hypothesis H2c, which was that the extent to which BSC strategy becomes
everyone’s everyday job would be greater for employees working in large
organisations than for employees working in small organisations. Following Kaplan
and Norton (2001, p. 13) who stated that strategy became everyone’s everyday
job when everyone understood strategy and was encouraged to execute it, the
results of this study may indicate that the BSC implementation in a small
organisation can be more easily implemented by all employees because they have
a deeper understanding of their organisation’s strategies.
With respect to strategy as a continuous process, this study discovered that
employees working in large organisations were likely to experience a lower level
of strategy as a continuous process than employees working in small
organisations. Thus, the results did not support Hypothesis H2d, which predicted
that the extent to which BSC strategy becomes a continuous process would be
greater among employees working in large organisations than among employees
working in small organisations. Thus, this result may indicate that strategizing as a
continuous process is more readily accomplished in small organisations than in
large organisations.
With respect to leadership involvement, we found that employees working in
large organisations were likely to experience a lower level of BSC leadership
involvement. Hence, the results did not support Hypothesis H2e, which predicted
that the level of leadership involvement in BSC would be higher in large
organisations than in small organisations. Thus, the finding indicates that upper-
echelon employees in large organisations were not more effective in leading and

237
mobilising the use of BSC within their units than were their peers in small
organisations.
2. The relationship between BSC implementation and employee roles
The results showed holding a strategic role had a positive and significant
relationship with four of the five SFO principles: strategy translation, strategy
alignment, strategy as everyone’s everyday job and leadership involvement.
Although the extent to which strategy as a continuous process related to holding
a strategic role was not significant, the relationship was positive. Therefore, it can
be said that employees holding strategic roles within the organisations studied
were likely to implement the BSC.
This result resonates with Kaplan and Norton’s (1996b, p. 76) explanation that
managers ensure that employees at all levels of an organisation understand long-
term strategy and that both departmental and individual objectives are aligned
with it. Regarding the role of strategizing within the organisation, this finding is
consistent with a study by Mantere (2005, cited in Jarzabkowski et al. 2007), who
defined strategists as top, middle and operational managers and project
managers.
The next part of this section discusses the results and further explores the
association between employee roles and BSC implementation using SFO
principles.
In terms of strategy translation, this study discovered that it had a positive and
significant relationship with holding a strategic role. This result indicated that
employees holding strategic roles in customs and excise organisations were likely
to experience a higher level of strategy translation. Thus, the result supported
Hypothesis H3a, which stated that the level of BSC strategy translation is higher
among employees holding strategic roles than among other employees. One
possible cause for this finding is that employees who hold strategic positions may
238
be more aware of organisational strategies and objectives given that, together
with the head of the organisation, they may contribute to formulating strategy. In
that sense, this result may show that, at this stage, customs and excise employees
with more knowledge about organisational objectives and strategies are more
encouraged to adopt organisational strategy in their individual scorecards.
With respect to strategy alignment, the study revealed that holding a strategic role
has a positive and significant relationship with strategy alignment, that is, to
experience a higher level of strategy alignment. Therefore, the result supported
Hypothesis H3b, which stated that the level of BSC strategy alignment is higher
among employees holding strategic roles than among other employees. Following
the definition of horizontal and vertical alignment proposed by Kathuria et al.
(2007), this result may indicate that employees holding strategic roles tend to align
their strategies with both organisational strategies and their peers’ strategies. In
other words, it is the managers (employees working in strategic positions) in
customs and excise organisations who play an important role in aligning
organisational objectives.
Turning to strategy as everyone’s everyday job, this study found that holding a
strategic role had a positive and significant relationship with strategy as
everyone’s everyday job. Thus, the result supported Hypothesis H3c, which stated
that the level of implementation of the BSC strategy as everyone’s everyday job is
higher among employees holding strategic roles than among other employees.
Following Kaplan and Norton’s (2001c, p. 13) explanation of how strategy
becomes everyone’s everyday job, this finding may indicate that employees
holding strategic positions have a better understanding of organisational strategy.
This may also explain the finding that employees working in strategic positions
concern themselves more with strategic objectives.

239
With regard to strategy as a continuous process, we discovered that holding
strategic role had a positive and insignificant relationship with strategy as a
continuous process. Hence, the result did not support Hypothesis H3d, which
stated that the level of BSC strategy as a continuous process is higher among
employees holding strategic roles than among other employees. Despite its
insignificance, holding a strategic role did show a positive relationship with
experiencing strategy as a continuous process. This finding may reflect that
holding a strategic role is not an essential factor determining whether employees
in the customs and excise organisations continuously monitor and improve
organisational and unit strategies.
Turning to leadership involvement, the finding was that holding a strategic role
has a positive and significant relationship with leadership involvement. Thus, the
result supported Hypothesis H3e, which stated that the level of BSC leadership
involvement is higher among employees holding strategic roles than among other
employees. This result indicated that employees holding strategic positions were
likely to become involved in BSC implementation. In relation to the literature, the
finding is in line with previous studies which suggest that top-level management
commitment is one of the most influential factors in the successful
implementation of BSC (see for instance Chan 2004; Park and Huber 2007).
RQ3. Do the SFO principles within the implementation of the BSC have a relationship with organisational commitment? Overall, examining the relationship between the SFO principles and OC showed
three out of five BSC determinants—strategy translation, strategy as a
continuous process and leadership involvement—to have a significant
relationship with OC. The strategy alignment and strategy as everyone’s everyday
job variables did not demonstrate a significant relationship with OC.
With respect to strategy translation, the study revealed a negative and significant
relationship with OC. Thus, Hypothesis H4a, which stated that the better the

240
strategy translation through BSC implementation, the more employees’
organisational commitment will increase, was not supported. In other words, the
present study revealed that a better understanding of organisational strategic
objectives is associated with lower OC. This contrasts with Kaplan and Norton’s
(1996b, p. 80) suggestion that better understanding of the organisation’s long-
term strategic goals encourages a stronger commitment to achieving those goals.
One possible reason for this is that employees understood organisational
strategies but found that the strategies were not relevant to their jobs. In this case,
the solution to this issue may be raising employees’ awareness of the need to
prioritise the organisation itself. Another possible cause is that employees were
not happy with the process of the translation of the organisation’s strategic
objectives. This could occur for several reasons: the strategy map internalisation
process may not have been effective, the organisational KPIs may not have been
relevant to employees’ KPIs, or the KPI targets for subordinates may have been
higher than the coordinators’ targets. In this regard, it is worth noting Camilleri
and van der Heijden’s (2007, p. 245) suggestion that appropriate levels of OC
among employees facilitates the change management process and ensures its
successful implementation.
Turning to strategy alignment, the results revealed a positive and insignificant
relationship with OC. Thus, the finding did not support Hypothesis H4b, which
predicted that the better the strategy alignment through BSC implementation, the
more employees’ organisational commitment would increase. Despite their
insignificance, strategy alignment and strategy as everyone’s everyday job did
both show a positive association with OC. Several factors may have contributed to
this; it may be that key performance indicators were not cascaded proportionately
or that key performance indicators between employees at the same level were
not well aligned. During the early process of setting up employees’ key
performance indicators, performance managers in each organisation may wish to
hold forums or focus group discussion sessions during which individual divisions

241
or sections meet to help ensure that vertical alignment and horizontal alignment
function well.
Regarding strategy as everyone’s everyday job, the study found a positive and
insignificant relationship with OC. Thus, the finding did not support Hypothesis
H4c, which predicted that the better the realisation of strategy as everyone’s
everyday job, the more employees’ organisational commitment would increase.
Though the association was insignificant, strategy as everyone’s everyday job did
show a positive association with OC. It appears that, in terms of creating strategy
awareness, the BSC process needs to be more effectively delivered in order to help
enhance the level of employees’ understanding and participation in advancing
organisational strategies. As knowledge about organisational strategies increases,
employees’ active participation increases commitment (Molina et al. 2014).
The present study discovered that strategy as a continuous process has a positive
and significant relationship with OC. Thus, Hypothesis H4d, which stated that the
better the realisation of strategy as a continuous process, the more employees’
organisational commitment will increase, was supported. This finding can be
interpreted as indicating that strategy as a continuous process within the
organisation is associated with higher OC among employees. This may be because
BSC implementation facilitates employees’ understanding of the organisational
strategic objectives and even gives them the opportunity to involve themselves in
continuous strategizing. The finding is consistent with Kaplan and Norton (1996b
, p. 80), who highlighted that including a large number of participants in the BSC
process takes longer but offers several advantages: ‘Information from a larger
number of managers is incorporated into the internal objectives; the managers
gain a better understanding of the company’s long-term strategic goals, and such
broad participation shapes a stronger commitment to achieving those goals.’
However, unlike Kaplan and Norton (1996), who refer explicitly to managers,
participation in BSC implementation within the organisations involved in the

242
present study was extended to all employees. In that sense, following Kaplan’s
(1996) logic, the continuous process of strategizing may succeed in building
stronger commitment among all employees in customs and excise organisations.
Turning to leadership involvement, the results revealed that leadership
involvement has a positive and significant relationship with OC. Thus, the results
supported Hypothesis H4e, which stated that the better the leadership
involvement in BSC implementation, the more employees’ organisational
commitment will increase. This finding illustrated that greater top management
support of the development of BSC is related to higher levels of OC among
employees. Several potential explanations might account for this finding. The first
possibility is that the involvement of higher-level employees in the BSC
implementation process has been positive and that they led the process well;
another is that the employees recognised their superiors’ efforts, which in the end
created stronger OC among the employees. This possibility would support Kaplan
and Norton’s (2001) emphasis that leadership roles in the BSC process start with
translating the strategy into linked strategic objectives on a strategy map and then
using the map and the accompanying scorecard interactively.
RQ4. Do the SFO principles within the implementation of the BSC have a relationship with public service motivation?
The relationship between PSM and the BSC as represented by the SFO principles
was found to be mixed. Overall, the results of examining the SFO principles with
PSM showed that three of the five BSC determinants—strategy translation,
strategy as everyone’s everyday job and strategy as a continuous process—
showed a significant relationship with PSM, whereas strategy alignment and
leadership involvement did not. The findings of these associations are discussed
here with respect to the individual SFO principles.

243
With regards to strategy translation, the results revealed that strategy translation
has a positive and significant relationship with PSM. This finding therefore
supported Hypothesis H5a, which stated that the better the strategy translation
through BSC implementation, the more employees’ PSM will increase. The finding
indicated that employees are more motivated when strategy is translated and
communicated effectively to all employees, confirming Malina and Selto’s (2001,
p. 49) assertion that when elements of BSC are well designed and effectively
communicated, the BSC appears to motivate and influence lower-level managers
to work towards company strategy. However, since the samples for the present
study were derived from employees across all levels within the organisation, this
research is able to conclude more generally that the BSC motivated customs and
excise employees across all levels of the organisation.
Turning to strategy alignment, the study found that strategy alignment has a
negative and insignificant relationship with PSM. Thus, the result did not support
Hypothesis H5b, which stated that the better the strategy alignment through BSC
implementation, the more PSM will increase. This finding showed that aligning
strategy did not enhance employees’ PSM; in fact, it decreased it. This finding
contrasts with Kaplan and Norton’s (2004, p. 62) statement that alignment may
create intrinsic and extrinsic motivation.
With respect to strategy as everyone’s everyday job, the study revealed that
strategy as everyone’s everyday job has a negative and significant relationship
with PSM. Thus, the result did not support Hypothesis H5c, which predicted that
the better the implementation of strategy as everyone’s everyday job through
BSC implementation, the more PSM would increase. The finding revealed that
strategy as everyone’s everyday job decreased the level of PSM. A possible
solution for this issue might be improving performance dialogue between direct
supervisors and employees. The researcher anticipates that doing so would reach
employees, increasing their strategy awareness in ways that would contribute to
the success of the strategy, as suggested by Kaplan and Norton (2001, p. 151).

244
Turning to strategy as a continuous process, this study discovered that strategy
as a continuous process has a negative and significant relationship with PSM.
Thus, the result did not support Hypothesis H5d, which predicted that the better
the implementation of strategy as a continuous process through BSC
implementation, the more PSM would increase. Rather, the finding revealed that
the more strategy becomes a continuous process within the organisation, the
lower PSM becomes among employees. One possible explanation for this finding
is that employees found the performance report system procedure difficult to
understand. Another plausible reason is that employees’ competence
development expectations were not clearly aligned with organisational strategy.
This finding should be noted by decision makers in the organisations given that
PSM is proven to be a moderately important predictor of OP (Brewer and Shelden
2000).
Turning to leadership involvement, the study discovered that leadership
involvement has a negative and insignificant relationship with PSM. Thus, the
result did not support Hypothesis H5e, which predicted that the better the
leadership involvement in BSC implementation, the more employees’ PSM would
increase. Our finding in this regard may reflect an inability on the part of leaders
(managers) to enable employees to clearly identify the results of their efforts and
to provide them with adequate information as to how well they were doing in their
jobs (Camilleri 2004, p. 274). This finding is somewhat unexpected; as highlighted
by Kaplan and Norton (2001c, p. 155), leadership involvement is the most
important element in the successful implementation of the BSC. Furthermore,
Kaplan and Norton (2001c, p. 155) articulated that the ownership and active
involvement of the executive team are needed to lead change and strategy
implementation.
RQ5. How does public service motivation relate to organisation commitment
within an organisation applying the BSC?
245
The findings from the SEM analysis shows that PSM has a positive and significant
relationship with OC. Thus, Hypothesis H6, which stated that PSM is positively
associated with OC within an organisation applying the BSC was supported. This
finding is consistent with the results of research conducted by Perry and Wise
(1990, p. 371); Crewson (1997); Taylor (2008); Kim (2011); and Caillier (2015). This
finding indicates that within the DGCE organisations, which have adopted the BSC
as their PMS, PSM reinforces the level of OC. In the context of BSC
implementation, the cascading of organisational goals into individual goals helps
employees to clearly understand their goals. Following Camilleri (2007), clear
employee goals enhance the level of PSM, which in turn increases levels of
organisation commitment. The decision makers who are responsible for
developing the BSC within the customs and excise organisations should be aware
of this relationship, because both PSM and OC are important factors that may
affect OP in public-sector organisations (Crewson 1997, p. 508; Kim 2004).
RQ6. How is BSC implementation associated with organisational performance?
In contrast to the previous discussion sections, in which BSC implementation data
was derived from the individual employee level through research questionnaires,
this research question was examined at the organisational level using longitudinal
data attained from the responding organisations. Two analytical tools were
applied to the analysis: panel data regression model analysis for the state revenue
collection variable and growth curve modelling for the customer satisfaction index
variable. The present study found BSC implementation to have a positive and
significant relationship with both parameters. Thus, Hypothesis H7, which stated
that the implementation of the BSC as a PMS associates positively with OP, was
supported.
When comparing these results with those of previous studies, we note that our
finding is consistent with the study in Australian manufacturing firms conducted
by Hoque and James (2000), who concluded that BSC usage is associated with

246
higher OP. Another similar finding resulted from a study by Davis and Albright
(2004) in a banking organisation located in the south-eastern United States. The
authors concluded that the BSC can be used to improve financial performance. In
a similar vein, Braam and Nijssen (2004), who studied BSC usage in Dutch
companies, pointed out that BSC implementation that is aligned with company
strategy positively influences overall company performance. Likewise, de Geuser
et al. (2009), who studied whether the BSC adds value to companies based on
survey data from 24 European companies, also found that the BSC has a positive
impact on OP. However, a study of the BSC in United States financial services firms
by Ittner et al. (2003) yielded different results. Ittner et al. (2003, p. 735) found
that extensive use of the BSC is negatively associated with companies’ return on
assets (ROA).
Although the present study shared a similar aim with previous studies, namely to
examine the association between BSC implementation and OP, it differs from
previous research (Hoque and James 2000; Braam and Nijssen 2004; Davis and
Albright 2004; de Geuser et al. 2009) in several respects. It is noteworthy that this
study differs in at least four aspects, perhaps thus contributing to the existing
literature. First, the present study was conducted in public-sector organisations of
an emerging economy while previous studies were conducted in private
companies in countries with advanced economies. Second, the present study
employed survey methods that included the representative participation of
employees from all levels of management. Previous studies have involved solely
employees at the executive or managerial levels. Third, the stage or level of BSC
implementation is acknowledged in this study; in fact, it was one of the criteria for
the selection of the responding organisations. Fourth, OP was represented by two
variables using longitudinal data. The use of the longitudinal data enabled the
researcher to analyse the BSC’s potential contribution to changes in OP because it
reflected OP both before and after the period of BSC implementation, where
247
previous researchers have employed only cross-sectional data or perceived
performance measures.
Based on the above, it seems reasonable to suggest that the present study serves
as the first attempt to provide empirical evidence of a BSC-OP association within
public-sector organisations involving participation from all organisational levels
and employing two variables that directly represent the organisations’ strategic
objectives.
9.4 Chapter summary
This chapter provides a discussion of the results of the quantitative findings
revealed in Chapters 6, 7 and 8. This study presents the first empirical evidence
regarding the association between BSC and organisation size, employee roles, OC,
PSM and OP within the context of public-sector organisations in a country with an
emerging economy.
The study, in which 1675 employees from 12 customs and excise organisations
participated, generated findings that were further discussed in this chapter. Of the
23 hypotheses tested in total, the results show that 13 hypotheses were supported
and 10 hypotheses were not supported. Overall, the responding organisations
showed that they had adopted the SFO principles in their implementation of the
BSC. However, the findings emerging from this study indicate that the quality of
BSC implementation needs to be improved to maximise its contribution to the
responding organisations. One example supporting this conclusion is the finding
that small organisations were more likely to properly implement BSC. This finding
contradicted our initial expectation that large organisations would be more likely
to implement the BSC due to the BSC’s renown for facilitating the communication
of strategies within an organisation. Another such example concerns the
relationship between translation of the organisational strategy using the BSC
framework and both OC and PSM. The results of this study were mixed; strategy

248
translation displayed a negative association with OC and a positive association
with PSM.
Finally, the discussion of all findings in the present study was constructed in such
a way that the process included revisiting the research instrument, linking with
previous studies, and looking at the context of each responding organisation. The
next and final chapter consists of the conclusion of all of the study’s findings, its
contribution to the literature, its contribution to policy and practice, its limitations
and its implications for future research.

249
Chapter Ten: Conclusion
10.1 Introduction
This study focused on investigating the BSC as a PMS within public-sector
organisations in Indonesia. The study was aimed at understanding how the BSC is
implemented as a PMS and the extent to which organisational factors, in particular
organisation size and employees’ roles, affect its implementation within public-
sector organisations. The study further sought to understand how public-sector
organisations implement the BSC to improve PSM, OC and OP. This study took
samples from twelve Indonesian customs and excise organisations (n= 1,675).
With regard to the research strategy choice, this study employed a quantitative
approach to answer the research questions and achieve the objectives of the
study.
The data originated from self-administered questionnaires, performance data on
state revenue collection, customer satisfaction index data and other supporting
documents related to PMS from the twelve responding organisations. In terms of
data analysis, this thesis employed several techniques: CFA, SEM, panel data
regression analysis and growth curve modelling. CFA was carried out to examine
how the responding organisations had implemented the BSC using the framework
of the SFO principles. The SFO encompasses five principles: strategy translation,
strategy alignment, strategy as everyone’s everyday job, strategy as a continuous
process and leadership involvement. With respect to SEM, the technique was
utilised to examine the relationship of the BSC with organisation size, employee
roles, OC and PSM. Meanwhile, panel data regression modelling was used to
evaluate the relationship of BSC implementation with state revenue collection as
a variable representing organisational performance. This technique was chosen
for its ability to analyse longitudinal data, enabling a view of OP both before and
after the implementation of the BSC. Lastly, growth curve modelling was

250
employed to evaluate customer satisfaction index trends after the
implementation of the BSC.
The remainder chapter is structured as follows. The subsequent section is a
general overview of the thesis which reviews the core contents of this study. A
summary of the main findings is then presented with regard to each research
question. The next section covers this study’s research contribution, including its
offerings in terms of both theory and policy and practice, followed by a discussion
of the study’s limitations. Subsequently, directions for future research are
proposed. The last section of this chapter presents a personal perspective of the
researcher’s PhD journey.
10.2 General overview of the thesis
Overall, the conceptual framework of this study incorporates three main themes
which correspond to the research objectives and research questions of the study.
The first is the quality of BSC implementation within the DGCE. In the early stages
of the analysis, the researcher evaluated how well the PMS based on the BSC
approach had already been established within the respondent organisations. In
this study, the SFO principles (strategy translation, strategy alignment, strategy as
everyone’s everyday job, strategy as a continuous process, and leadership
involvement) were used as parameters to evaluate BSC implementation (see
Kaplan and Norton 2001c), together with the analysis of relevant documents. The
second main theme is the extent to which organisation size and employees’ roles
factor in BSC implementation. The third is the effect of BSC implementation on
three main constructs: PSM, OC and OP. Thus, the three main themes of this study
cover how the BSC is being implemented, how organisational factors
(organisational size and employees’ roles) affect BSC implementation and, finally,
how the implementation of the BSC affects both the employees (in terms of PSM
and OC) and the organisation (in terms of OP). Therefore, this study’s results offer
knowledge that could fill the gaps in the literature by presenting findings on the

251
practice of the BSC in Indonesian customs and excise organisations. For instance,
despite the increasing interest in adopting the BSC in public-sector organisations,
to date, little is known about the extent to which implementation of the BSC
affects OP (Hoque 2014). This study generated findings showing that there is a
positive and significant association between implementation of the BSC as a
performance management system and OP. Further details of the main findings
that emerged from this study are presented in the subsequent section.
10.3 Summary of main findings
This study aimed at examining the implementation of the BSC as PMS within
public-sector organisations in Indonesia in order to understand the nature of BSC
practice and its consequences as related to organisation size, employee roles, OC,
PSM and OP. Based on the findings that emerged, the framework of BSC
implementation used for the analysis was then refined, as shown in Figure 10.1.

252
Figure 10.1 Final relationship of BSC, organisation size, employees’ role, OC, PSM and OP
Based on the research aim, this study addressed four research objectives: to
explore theoretical perspectives of the balanced scorecard with the purpose of
identifying the key success factors of BSC implementation; to review BSC practices
in order to clarify organisational factors that affect the BSC and discover how its
implementation affects professional behaviours and organisational performance;
to develop a conceptual framework of BSC implementation in public-sector
Strategy Translation
Strategy Alignment
Strategy as ‘everyone’s everyday job’
Strategy as a continuous process
Leadership involvement
BSC implementation
Organisation commitment
Public service motivation
Organization size
Employee’s role
State revenue collection
Customer satisfaction
index
Organisational performance
- 0.25
- 0. 19
- 0. 21
- 0. 24 - 0. 16
0. 19
0. 1 0
0. 1 1
0. 1 0
- 0. 36
0. 3 3
0. 6 3
0. 49 0. 35
-0.26
0. 13
0. 4 1 0. .07

253
organisations in order to describe the relationship between organisational factors
and the BSC and how its implementation contributes to professional behaviours
and OP; and to test and examine the conceptual framework in order to discover
the extent to which organisational factors influence the implementation of the
BSC as well as the extent to which BSC implementation relates to professional
behaviours and OP in the context of public-sector organisations.
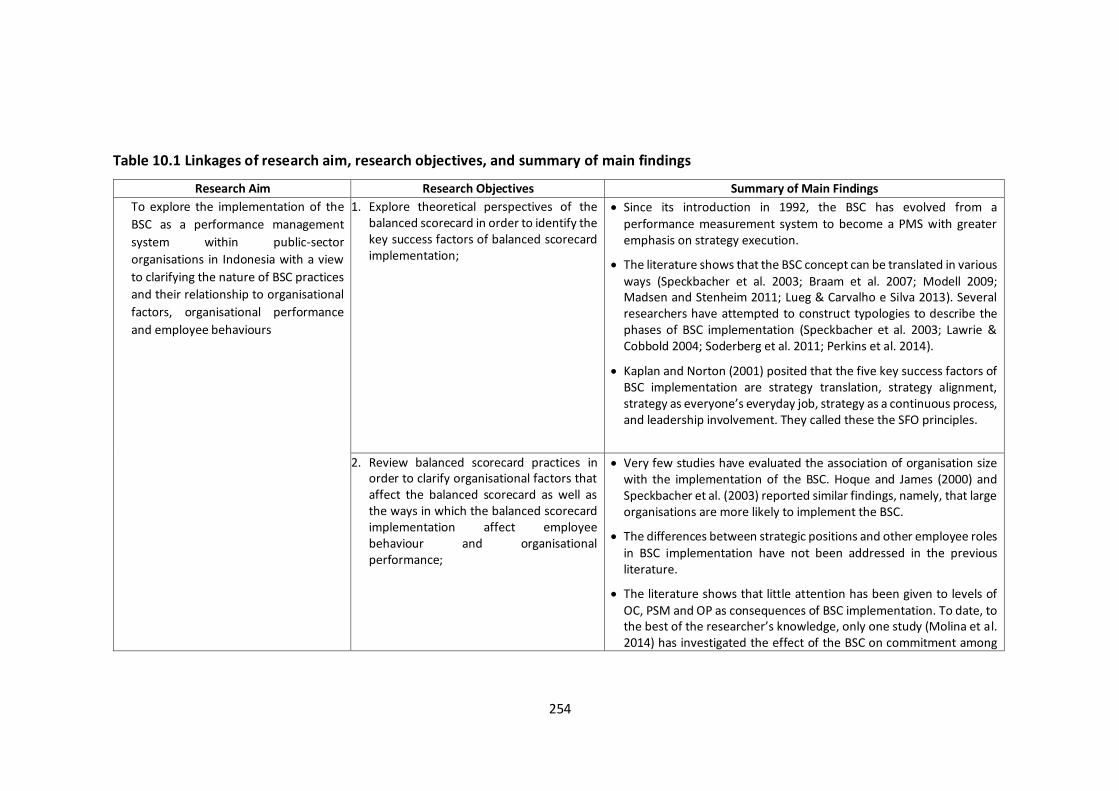
254
Table 10.1 Linkages of research aim, research objectives, and summary of main findings
Research Aim Research Objectives Summary of Main Findings
To explore the implementation of the
BSC as a performance management
system within public-sector
organisations in Indonesia with a view
to clarifying the nature of BSC practices
and their relationship to organisational
factors, organisational performance
and employee behaviours
1. Explore theoretical perspectives of the balanced scorecard in order to identify the key success factors of balanced scorecard implementation;
• Since its introduction in 1992, the BSC has evolved from a performance measurement system to become a PMS with greater emphasis on strategy execution.
• The literature shows that the BSC concept can be translated in various
ways (Speckbacher et al. 2003; Braam et al. 2007; Modell 2009; Madsen and Stenheim 2011; Lueg & Carvalho e Silva 2013). Several researchers have attempted to construct typologies to describe the phases of BSC implementation (Speckbacher et al. 2003; Lawrie & Cobbold 2004; Soderberg et al. 2011; Perkins et al. 2014).
• Kaplan and Norton (2001) posited that the five key success factors of BSC implementation are strategy translation, strategy alignment, strategy as everyone’s everyday job, strategy as a continuous process, and leadership involvement. They called these the SFO principles.
2. Review balanced scorecard practices in order to clarify organisational factors that affect the balanced scorecard as well as the ways in which the balanced scorecard implementation affect employee behaviour and organisational performance;
• Very few studies have evaluated the association of organisation size with the implementation of the BSC. Hoque and James (2000) and Speckbacher et al. (2003) reported similar findings, namely, that large organisations are more likely to implement the BSC.
• The differences between strategic positions and other employee roles
in BSC implementation have not been addressed in the previous literature.
• The literature shows that little attention has been given to levels of
OC, PSM and OP as consequences of BSC implementation. To date, to the best of the researcher’s knowledge, only one study (Molina et al. 2014) has investigated the effect of the BSC on commitment among

255
employees. The authors found a positive relationship between BSC implementation and employee commitment.
• With regard to PSM, to the best of the researcher’s knowledge, no study has yet examined the influence of BSC implementation on the level of PSM.
• Turning to OP, some studies (Hoque and James 2000; Ittner et al. 2003; Braam and Nijssen 2004; Davis and Albright 2004; de Geuser et al. 2009) have reported a correlation between BSC implementation and OP. However, none of them was set in a public-sector organisation. The present study thus serves as the first to provide empirical evidence of the BSC’s association with OC, PSM and OP in public-sector organisations.
3. Develop a conceptual framework of balanced scorecard implementation in the public-sector organisation to describe the relationship between organisational factors and the balanced scorecard and define the ways in which its implementation contributes to employee behaviour and organisational performance;
• The conceptual framework serves as the proposed logical construct
describing the dependent and independent variables that might influence BSC implementation.
• Research hypotheses were developed and associated with organisational size, employee roles, OC, PSM and OP.
• Hypotheses regarding the directions of the relationships among the
variables were developed based on previous studies which directly or indirectly related to the variables.
• For some variables (employee roles and PSM) with no direct previous findings, the researcher used indirect studies as the rationale for building the hypotheses. For the PSM variable, this study follows Camilleri’s (2007) assertion that the establishment of clear goals is one of the conditions under which PSM levels increase.

256
4. Test and examine the conceptual framework in order to discover the extent to which organisational factors influence the implementation of the balanced scorecard and the extent to which balanced scorecard implementation relates to employee behaviour and organisational performance within the public-sector organisational context.
• This study utilised four analytical tools (CFA, SEM, panel data
regression modelling and growth curve modelling) to discover the relationships among the variables of the conceptual framework.
• CFA was used to determine whether the correlations between the SFO
principles representing BSC implementation create value within the BSC framework. The results showed that all principles have significant and positive correlations with one other, indicating that customs and excise organisations have applied the SFO principles in their BSC implementation. Therefore, the results justified the use of the SFO principles to examine the implementation of the BSC. Using these SFO principles, enabled a more comprehensive analysis of how the BSC was implemented in the responding organisations.
• This study used SEM to explore the influence of organisation size and employee roles on BSC implementation. In terms of organisation size, the results showed that large organisations are less likely to have implemented the BSC. Turning to employee roles, the results demonstrated that employees holding strategic positions within their organisations were more likely to implement the BSC.
• The relationships between the BSC and OC and PSM were analysed using SEM. With respect to OC, this study yielded mixed results: strategy translation showed a negative correlation with OC, while strategy as a continuous process and leadership involvement showed a positive relationship with OC.
• Turning to PSM, the findings were also mixed. Strategy translation, strategy as everyone’s everyday job and strategy as a continuous process showed a significant relationship with PSM, whereas strategy alignment and leadership involvement did not.

257
• This study also considered how OC and PSM relate to each other. We
found that PSM reinforced OC in the customs and excise organisations studied.
• The final test was the investigation of the relationship between BSC
implementation and OP. Unlike the other portions of the study, this analysis used organisation-level longitudinal data obtained from the responding organisations. Two different analytical tools were applied to analyse both relationships representing OP: panel data regression model analysis for the state revenue collection variable and growth curve modelling for the customer satisfaction index variable. Using the panel data regression analysis enabled the researcher to analyse the effect of BSC implementation using before-and-after performance data. Meanwhile, the use of growth curve modelling assisted in the analysis of customer satisfaction index performance in the period after BSC implementation.
• The two analytical tools yielded similar findings, namely, that BSC
implementation has a positive association with OP. Thus, this study suggested that implementation of the BSC is likely to increase the OP of Indonesian customs and excise organisations.

258
10.4 Research contribution
10.4.1 Theoretical contribution
The BSC concept has been of interest to a large number of researchers. Despite
the impressive number of relevant studies in the literature, none has yet
conducted the research using a complete approach. Based on a review of the
extant literature, previous studies can generally be grouped into two categories:
those using a theory-based approach and those using an implementation-based
approach. The theory-based studies examined the BSC concept using literature
reviews (see for instance Salterio 2012; Behrouzi and Ma’ aram 2014) and
analytical approaches (see for instance Nørreklit 2000, 2003; Nørreklit et al. 2012;
Schobel and Scholey 2012). The authors of the existing implementation-based
literature applied such techniques as laboratory experiment (see for instance Dilla
and Steinbart 2005; Wing and Yang 2007; Beard 2009; Humpreys and Trothman
2011), interviews (see for instance Decoenne and Bruggeman 2006; Nilsson 2010),
survey (see for instance Burney and Swanson 2010; Hoque and Adams 2011) and
action research (see for instance Irwin 2002; Farneti 2009).
The present study developed a conceptual framework which offers more aspects
from which to analyse BSC implementation. This conceptual framework comprises
three layers of analysis. They describe how the BSC is being implemented, how
organisational factors affect BSC implementation and how BSC implementation
contributes to individual professional behaviours and organisational performance.
The first step was to evaluate the quality of BSC implementation using the SFO
principles. The second analysis examined the extent to which the organisational
factors of organisation size and employee roles may affect BSC implementation,
while the third analysis considered how BSC implementation might contribute to
employees’ professional behaviours (as represented by PSM and OC) as well as
overall OP. Thus, this study contributes by providing a more holistic analytical
framework for evaluating the BSC concept. In addition, this research attempts to

259
fill research gaps that directly relate to BSC implementation. The ways in which it
does so are elaborated here.
The present study is, firstly, the first to attempt to investigate the relationship
between the implementation of the BSC and OP using data from public-sector
organisations. Only a few studies have examined the effect of the BSC on OP (for
instance: Hoque and James 2000; Ittner et al. 2003; Davis and Albright 2004;
Braam and Nijssen 2004; de Geuser et al. 2009). However, those studies all used
data from private sector organisations. Amongst previous studies, the present
study is closest to the research by de Geuser et al. (2009) as both used the same
approach to obtain a picture of BSC implementation, namely, using the SFO
principles to represent the BSC principles. However, this present study extends the
body of knowledge in three ways: first, unlike most studies, which utilised
perceived data for OP, this study used actual OP data from its twelve responding
organisations. Second, the variables used in this study originated from key
performance indicators (state revenue collection and customer satisfaction index),
which directly measure the achievement of the organisations’ strategic objectives.
Third, these two key performance indicators are available longitudinally, thus
enabling the researcher to evaluate OP before and after implementation of the
BSC as well as OP trends following BSC implementation.
The second way in which this research contributes to the body of knowledge is
that it is the first study on BSC implementation in public-sector organisations in
Indonesia with respect to the aspects studied. This study provides insight into the
Indonesian context and answers the call for more research examining the
implementation of the BSC in public-sector organisations in emerging economies
(Hoque 2014). This study is also the first to use data from public-sector
organisations which have implemented the BSC to the individual level. The
responding public-sector organisations were twelve customs and excise
organisations located in four provinces in Indonesia, a country with an emerging

260
economy. The present study therefore enhances the literature by examining and
providing empirical evidence about the implementation of the BSC in public-sector
organisations having adopted the BSC to the individual level in an emerging
economy. Prior studies regarding the BSC framework have mainly taken place in
the USA, Europe, Australia and New Zealand. Rhodes et al. (2008) pointed out that
empirical evidence relating to the effectiveness of BSC implementation is limited,
as is the impact of Asian BSC contextual variables. Thus, this study provides
empirical evidence as to how the BSC is being implemented as a PMS in a new
cultural context, that is, public-sector organisations in Indonesia.
Thirdly, the present study differs from previous studies in that earlier work has
included only executives as respondents. In contrast, this study involved
employees from all organisational levels and did so proportionately. From a
practical perspective, the fact that the twelve responding organisations have
implemented the BSC concept to the individual level supports the idea to involve
proportionate numbers of employees from each level of the organisations. From
a theoretical perspective, the decision to involve employees from each level of the
organisations was taken based on the concept that the BSC applies a top-down
approach during the planning phase but shifts to a bottom-up process during
execution (Kaplan and Norton 1996b). In consideration of these two factors, it is
clearly appropriate to include employees from each level of organisation as
respondents in such a study. Therefore, this study provides empirical evidence of
BSC implementation by using samples from all levels of the responding
organisations and may thus offer a more comprehensive view of how the BSC has
been implemented within those organisations.
Fourthly, unlike most studies, which did not provide clear information regarding
the stage or level of BSC implementation in the responding organisations, this
research provides information regarding how well the BSC was being integrated
into the twelve customs and excise organisations. In fact, the selection of those

261
twelve organisations was based principally on the fact that they had achieved
similar levels of BSC implementation. This is an important aspect: an accurate
determination of whether companies make use of the BSC is a necessary condition
for assessing its performance implications, and any failure to make this
determination would undermine the validity of the study as a whole (Burkert et
al. 2010, p. 351).
Fifthly, this study is one of the first to directly examine the effect of organisational
attributes on BSC implementation. This study responds to the call for more
research examining the use of the BSC in different types of organisations,
particularly those of different sizes (Madsen and Stenheim 2015). The
organisational attributes used in this study are organisation size and employee
roles. Only two studies have reported on the association of organisation size with
BSC usage (Hoque and James 2000; Speckbacher 2003), and both took place in
private sector settings. The present study, therefore, provides the first empirical
evidence of how the size of a public-sector organisation affects BSC
implementation. It shows that small offices were more likely to implement the
BSC. Turning to employee roles, this study provides the first empirical evidence
regarding the relationship between holding a strategic professional role and the
likelihood of implementing the BSC. In practice, employees in managerial positions
have more opportunity to discuss organisational strategic objectives (see Kaplan
and Norton 1996a, b; 2009). This condition was expected to positively affect
employees in managerial positions with respect to the implementation of the BSC.
The results of this study demonstrated that, indeed, employees who held strategic
positions were more likely to implement the BSC.
Sixthly, this study is one of the first to directly investigates the effect of the BSC as
new management model towards employees’ attitudes. To my knowledge, the
study by Molina et al (2014) is the only literature which studies the influence that
BSC implementation has on organisational climate, employees’ commitment, job

262
satisfaction and job dedication. However, this present study differs from the
research by Molina et al (2014) in several areas: research objects, research
settings, and research participants coverage. Thus, this present study delivers the
first empirical evidence about the relationship between the implementation of
BSC with OC and PSM in public-sector organisation. With regard to OC, this
research found that BSC has a significant association, especially in strategy
translation, strategy as a continuous process and leadership involvement.
Meanwhile, regarding PSM, this research showed that the BSC has significant
association particularly in strategy translation, strategy everyone’s everybody job
and strategy as a continuous process.
Seventhly, this study is among the few that cover strategy maps, strategy
execution and cascading in the BSC. Hoque (2014) asserted that these three
important BSC properties have received only limited attention from researchers.
This study analysed strategy mapping and cascading from the standpoint of the
SFO principles in order to examine the BSC’s relationship with OC, PSM and OP.
The use of three of the five SFO principles (strategy translation, strategy alignment
and strategy as everyone’s everyday job) enabled the researcher to explore how
the strategy map and cascading process functioned in the responding
organisations. The aspect of strategy mapping is included in strategy translation,
while strategy cascading is included in the principles of strategy alignment and
strategy as everyone’s everyday job.
10.4.2 Contribution to policy and practice
This study concluded that all twelve organisations had followed the five SFO
principles. However, policy makers should see the SFO principles as a mere guide
to BSC implementation. Using the SFO principles, policy makers may evaluate how
the BSC helps increase the quality of organisational service delivery, for instance,
how it can contribute to PSM and OC. With regard to OC, this study found that the
BSC has significant relationships with translating strategy, strategizing

263
continuously and actively involving the leaders of the organisation. Policy makers
should ensure that the cascading and aligning of organisational KPIs from lower-
level management to the individual level is well executed. With regard to PSM,
policy makers should be aware that better translating the strategy into operational
activities and making organisational strategy more understandable for employees
are both significant for the level of public service motivation.
This research has shown that the BSC practices in the DGCE follow the SFO
principles, which according to Kaplan and Norton (2001c) are the success factors
of BSC implementation. Thus, this empirical evidence confirms that BSC
implementation in a public-sector setting could also use the SFO principles as
evaluative indicators. Policy makers and performance managers may therefore
wish to employ the SFO principles as a medium for analysing the effects of BSC
implementation.
Furthermore, our finding regarding organisation size showed, surprisingly, that
large offices are less likely to implement the BSC. This contradicted initial
expectations that large organisations would take more advantage of the BSC’s
capability to communicate strategy (Kaplan and Norton 1996b). It may be that the
length of time needed to cascade the BSC from the organisational level to the
individual level differs between large and small organisations. In the initial stages
of development, policy makers should differentiate between large and small
organisations, due to their inherent differences in the organisational learning
process (Murray and Donnegan 2003). Obviously, policy makers in the DGCE did
not use this strategy, given that both its large and small organisations expanded
BSC implementation to the individual level at the same time (2012). Moreover,
this study showed that employees holding strategic roles (managers) are more
likely to implement the BSC concept. This finding could be used to help underpin
BSC implementation in large organisations by empowering managers to help
increase their subordinates’ awareness of the BSC concept. Managers should be

264
given responsibility to equip their subordinates with BSC knowledge so that all
employees clearly understand their roles and can focus on delivery of
performance-related measures that support organisational strategy (Greatbanks
and Tapp 2007).
Another important lesson that can be learned from this study is how the BSC as a
PMS is associated with OC and PSM among customs and excise employees.
Surprisingly, strategy translation using the BSC framework showed two different
directions of association, with a negative relationship with OC and a positive
relationship with PSM. As the aim of strategy translation is to allow for a better
understanding of organisational strategic objectives (Kaplan and Norton 2001c),
this may indicate that employees of the customs and excise organisations were
not eager to achieve organisational strategic objectives. The fact that translating
the organisational strategies decreased the level of employees’ commitment
could be triggered by several circumstances. For instance, employees may not
know the meaning of organisational strategy, employee KPIs may not be relevant
to organisational strategy, or KPI targets may be too difficult to meet. An effective
way to handle this issue would be for the head of each customs and excise
organisation to show a high level of commitment by providing quality KPIs and
reasonable targets. Furthermore, heads of organisation should, together with the
performance managers, directly lead the BSC internalisation process in order to
communicate the BSC concept. In particular, organisational strategic objectives
and KPIs should be explicitly linked to opportunities for employees’ personal
development. This is necessary because employees at the customs and excise
organisations may feel a stronger attachment to an organisation if they discover
that their values are in accordance with the organisation’s values (Meyer and Allen
1997).
With regard to OP, this study supports the idea that BSC usage has a positive
association with OP (Hoque and James 2000; Braam and Nijssen 2004; Davis and
265
Albright 2004; de Geuser et al. 2009). This empirical evidence can be used as a
justification for policy makers to use the BSC as PMS. Thus, policy makers and
managers should work together to improve the quality of BSC practice. To ensure
successful implementation of the BSC as PMS, policy makers should focus on
refining the PMS. Specifically called for are: more flexibility in the BSC for different
organisational sizes, standardised quality of strategic objectives and KPIs, and
training for managers to improve their skills in guiding the performance
management process. Additionally, managers in each office should facilitate the
implementation of BSC to the individual level, ensure the quality of BSC usage as
described in the strategic objectives, and implement KPIs and KPI targets that
meet the standardised criteria stipulated by policy makers.
10.5 Limitations of the study
This study yields some interesting findings and implications; however, it is not
without limitations which could be addressed in future research. The first
limitation is that the present study, as a cross-sectional study, relies mainly on
survey data collected in 2016 from twelve Indonesian customs and excise
organisations. As such, the possibility of interpreting those data may be limited;
as a result, no causality can be inferred in the relationships between the BSC and
PSM and the BSC and OC. The second limitation is that there is a connection
between the BSC and OC, PSM and OP in the conceptual framework. There is no
direct link from PSM or from OC to OP. However, there should be a link between
OC and PSM to OP, because OC and PSM are both good predictors of OP (Brewer
and Selden 2000; Kim 2005). The results of this study are due to the absence of
data on employee performance, which makes it impractical to analyse these
relationships.
The third limitation is the small number of responding organisations. The SEM
results for the models examining the associations with organisation size and
employee roles did not show the models to be good fits. This is most likely due to

266
the small number of organisations (twelve) involved in the study. In addition to
the total number of organisations, the total number of each category of
organisation (large and small) should also be taken into consideration. This
research included three large organisations and nine small organisations.
The fourth limitation concerns the characteristics of the respondents. All
respondents were employees of Indonesian customs and excise organisations,
from senior managers to staff. As such, the respondents, wishing to sustain their
good relationship with their superiors, may have considered their superiors’
feelings when completing the questionnaires. This may be especially true in a
government organisation. In order to cope with this issue, the following steps
were taken as safeguards: distributing the questionnaires personally to
respondents, collecting the completed questionnaires from the respondents’
organisations, guaranteeing respondents that all questionnaires would be treated
anonymously, and assuring respondents that their superiors would not be given
access to the completed questionnaires.
10.6 Directions for future research
Future research on this topic should increase the ability to understand the
associated effects of the implementation of the BSC on both the individual
employee level and the organisational level. It should also generate more
understanding of how the BSC is being implemented within public-sector
organisations in countries with emerging economies. With this in mind, the
researcher’s first suggestion is that future studies should gather more longitudinal
data on OC and PSM, as this study did for OP. Such a longitudinal study may be
better suited to search for causality in the relationships between the BSC and PSM
and OC.

267
The second suggestion concerns the measurement of the influence of OC and PSM
on OP. This study used the conceptual framework as the basis for analysing the
relationships between BSC implementation and PSM, OC and OP. Future study
could refine the research framework by adding links between OC and OP and
between PSM and OP. In order to do that, the study should collect data on
performance results at the employee level. In this way, a future study could
measure the moderating effect of both variables on OP, thus helping to more
accurately measure the relationship between BSC and OP.
The third suggestion regards the scope of the research setting. The findings of this
research are based on the study of BSC implementation in the DGCE. There is a
need for further research to expand the setting to public-sector organisations
across Indonesia or to perform a comparative study of public-sector organisations
in Southeast Asia. Such research would increase the generalisability of the results.
The results of a comparative study would make an immense contribution to our
knowledge about BSC implementation within public-sector organisations in
Southeast Asian countries.
The fourth suggestion is related to the role of organisational factors in fostering
BSC implementation. This study made the surprising discovery that large
organisations are less likely to implement the BSC than small organisations, though
large organisations can take advantage of the BSC framework to mobilise
employees to work towards organisational objectives (Kaplan and Norton 1996b).
Therefore, this finding could inspire future study to further explore the reasons for
which large organisations are less likely to implement the BSC.

268
10.7 A personal perspective on the PhD journey
For me, this PhD journey has been a continuous learning process requiring
discipline, commitment, perseverance, self-motivation, passion and honesty. I
describe my PhD journey as driving along a long and challenging path with one
destination: to successfully fulfil my research aim and objectives in the form of this
thesis. The biggest challenge I faced was balancing my personal life with my
academic activity during the writing process. The life of a PhD student is very
different from the professional life I knew previously as a public servant. In fact,
my most recent academic activity before continuing my PhD study was in 2007.
Changing my routine was the most difficult aspect of the early stages of my PhD
journey. To surmount issue, I engaged in several research activities—academic
workshops, courses, seminars—and participated in conferences that I thought
might be useful in enhancing my research skills. As my understanding of the
research process increased and my knowledge and skills improved, I started to
enjoy the PhD journey.
I am deeply grateful to my supervisors, Dr Chris Rees and Dr Aminu Mamman, for
their guidance, patience, support and constructive comments, which made it
possible for me to complete this PhD journey. I thank God that I have been
surrounded by my loved ones, my wife and my children, during this time. I always
receive great support from my family: my wife, Thre, always prays for me, supports
me in her intuitive way and has unswervingly believed that I would successfully
finish my PhD journey; my son, Jo, who always mentions my PhD completion in his
prayers; and my baby boy, Jeth, and baby girl, Joana, who always share their love,
smiles and cheerfulness, easing the stressful times that I have experienced during
this long journey.
Having accomplished my PhD journey, I shall return to the institution for which I
worked previously, the Indonesian Ministry of Finance. In addition to the

269
knowledge attained from writing my thesis, I wish to contribute to my institution
by sharing my experience of the PhD journey itself, which has given me the
opportunity to learn a myriad of positive things both academically and personally.

270
Reference
Agostino, D., and Arnalboldi, M. (2012)). Design issues in Balanced Scorecards: The “what” and “how” of control, European Management Journal 30, 327– 339.
Ahn, H. (2001). Applying the Balanced Scorecard Concept: An Experience Report, Long Range Planning 34, 441-461.
Aidemark, L-G. (2010). Cooperation and competition: Balanced scorecard and hospital privatization. International Journal of Healthcare and International Quality Assurance 23(8), 730-748.
Akkermans, H.A and Van Oorschoot, K.E. (2005). Relevance assumed: a case study of balanced scorecard development using system dynamics, Journal of the Operational Research Society 56, 931-941.
Al-Aama, A.Y. (2013). Using Balanced Scorecards to Manage IT Strategies in Public Organizations: The Case of Jeddah Municipality, Engineering Management Research 2(1), 111-121.
Allison, P. (2002). Missing data (Quantitative applications in the social sciences; no. 07-136). Thousand Oaks, Calif.: Sage Publications.
Anderson, J.C. and Gerbing, D.W. (1988), Structural equation modelling in practice: a review and recommended two step approach, Psychological Bulletin, Vol. 103 No. 3, pp. 411-23.
Anspach, R. (1991). Everyday methods for assessing organizational effectiveness. Social Problems, 38(Feb 91), 1-19.
Atkinson, H. (2006). Strategy Implementation: a role for the Balanced Scorecard? Management Decision 44 (10), 1441-1460.
Au, C. (1996). Rethinking Organizational Effectiveness: Theoretical and Methodological Issues in the Study of Organizational Effectiveness for Social Welfare Organizations. Administration in Social Work, 20, 1-21.
Ayoup, H. K., Omar, N., & Rahman, I. (2016). Balanced scorecard and strategic alignment: A Malaysian case. International Journal of Economics and Financial Issues, 6(4), 85-95.
Balfour, D., & Wechsler, B. (1990). Organizational Commitment: A Reconceptualization And Empirical Test Of Public-Private Differences. Review of Public Personnel Administration, 10(3), 23-40.
Balfour, D., & Wechsler, B. (1996). Organizational Commitment: Antecedents and Outcomes in Public Organizations. Public Productivity & Management Review, 19(3), 256-277.

271
Banker, R.D., Chang, H., and Pizzini, M. (2004).The Balanced Scorecard: Judgmental Effects of Performance Measures Linked to Strategy, The Accounting Review, 79(1), 1-23
Banker, R.D., Chang, H., and Pizzini, M. (2011). The Judgmental Effects of Strategy Maps in Balanced Scorecard Performance Evaluations, International Journal of Accounting Information Systems 12, 259–279.
Bartholomew, D., Knott, M., & Moustaki, Irini. (2011). Latent variable models and factor analysis : A unified approach (3rd ed., Wiley series in probability and statistics). Chichester: Wiley.
Beard, D.F, Humprey, R.L. (201). Alignment of University Information Technology Resources With the Malcolm Baldrige Results Criteria for Performance Excellence in Education: A Balanced Scorecard Approach. Journal of Education for Business. 89, 7, 382-388.
Beard, D.F. (2009). Successful Applications of the Balanced Scorecard in Higher Education, Journal of Education for Busines, 275-282.
Behrouzi, F., Shaharoun, A.M., Ma’aram, A. (2014). Applications of balanced scorecards for strategic management and performance measurement in the health sector. Australian Health Review, 38, 208-217
Bianchia, C., and Montemaggiore, G.B. (2008). Enhancing strategy design and planning in public utilities through “dynamic” balanced scorecards: insights from a project in a city water company. System Dynamics Review 24(2), 175-213
Blumberg, B., Cooper, Donald R. & Schindler, Pamela S. (2014). Business research methods (Fourth ed.) London: Mcgraw – Hill Education.
Braam, N., and Sahlin – Anderson, K. (2004). Performance effects of using the Balanced Scorecard: a note non the Dutch experience, Long Range Planning, 37, 335–349.
Brewer, G.A. and Seldon, S.C. (1998), “Whistle blowers in the federal civil service: new evidence of the public service ethic”, Journal of Public Administration Research and Theory, 8(3), pp. 413-39.
Brewer, G.A. and Seldon, S.C. (2000), “Why elephants gallop? Assessing and predicting organisational performance in federal agencies”, Journal of Public Administration Research and Theory, 10(4), 685-711.
Bright, L. (2005). Public Employees With High Levels of Public Service Motivation. Review of Public Personnel Administration, 25(2), 138-154.
Brignall, & Modell. (2000). An institutional perspective on performance measurement and management in the ‘new public sector’. Management Accounting Research, 11(3), 281-306.
Brown, T. (2015). Confirmatory factor analysis for applied research (Second ed., Methodology in the social sciences). New York : The Guilford Press.

272
Bruijn, H. (2006). Managing performance in the public sector (2nd ed.). London: Routledge.
Brunnson, C.D., Larcker, D.F., and Randall, T. (2000). Constructing Organizations: The Example of Public Sector Reform. Organization Studies, 715–741.
Bryman, A. (2015). Social Research Methods, 5th Edition. Oxford: Oxford University Press.
Buchanan, B. (1974). Building Organizational Commitment: The Socialization of Managers in Work Organizations. Administrative Science Quarterly, 19(4), 533-546.
Budde, J. (2007). Performance Measure Congruity and the Balanced Scorecard. Journal of Accounting Research, 45 (3), 515-539
Burkert, M., Davila, A. and Oyon, D. (2010), “Performance consequences of Balanced Scorecard adoptions: claim for large-scale evidence and propositions for future research”, Studies in Managerial and Financial Accounting, 20, pp. 345-361
Burney, L.L., and Swanson, N.J. (2010).The Relationship Between Balanced Scorecard Characteristics and Managers' Job Satisfaction, Journal of managerial Issues 22 (2), 166-181
Burns, T., & Stalker, George Macpherson. (1961). The management of innovation. London: Tavistock Publications.
Caillier, J. (2015). Transformational Leadership and Whistle-Blowing Attitudes. The American Review of Public Administration, 45(4), 458-475.
Camilleri, E., & Van der Heijden, B. I. J. M. (2007). Organizational commitment, public service motivation, and performance within the public sector. Public Performance & Management Review, 31 (2), 241–274.
Cardinaels, A., and Van Veen-Dirks, P.M.G. (2010). Financial versus non-financial information: The impact of information organization and presentation in a Balanced Scorecard, Accounting, Organizations and Society , 35, 565–578.
Carmona, S., Iyer, G., and Reckers, P.M.J. (2011). The impact of strategy communications, incentives and national culture on balanced scorecard implementation , Advances in Accounting, incorporating Advances in International Accounting , 27 , 62–74.
Chan, Y.-C. L. (2004). Performance Measurement And Adoption of Balanced Scorecard: a Survey of Municipal Governments in the USA and Canada. The International Journal of Public Sector Management , 17, 204–221.
Chan, Y.-C. L. (2006). An Analytic Hierarchy Framework for Evaluating Balanced Scorecards Of Healthcare Organizations. Canadian Journal of Administrative Sciences, 23(2), 85-104.

273
Chang, C. L. (2007). The NHS Performance Assessment Framework as a Balanced Scorecards Approach. The International Journal of Public Sector Management 20(2), 101–117.
Chang, W-C., Tung, Y-C, Huang, C-H., and Yang, M.C. (2008). Performance improvement after Implementing the Balanced Scorecard: A large hospital's experience in Taiwan, Total Quality Management, 19 (11), 1143–1154.
Chavan, M. (2007). The balanced scorecard: a new challenge, Journal of Management Development , 28 (5), 393 – 406.
Chen, X.Y., Yamaouchi,K., Kato,K., Nishimura, A., & Ito, K. (2006). Using Balanced Scorecards to Measure Chinese And Japanese Hospital Performance. International Journal of Healthcare and International Quality Assurance, 19(4), 339-350.
Chiang, C-Y., and Lin. B., (2009). An Integration of Balanced Scorecards and Data Envelopment Analysis for Firm’s Benchmarking Management, Total Quality Management, 20(11), 1153–1172.
Chittoo, H. B., Ramphul, N., & Nowbutsing, B. (2009). Globalization and public-sector reforms in a developing country. Culture Mandala: Bulletin of the Centre for East-West Cultural & Economic Studies, 8(2), 30–51.
Cho, E., & Kim, S. (2015). Cronbach’s Coefficient Alpha. Organizational Research Methods, 18(2), 207-230.
Collin, R. and Mccartan, K. (2016). Doing management research. London: SAGE.
Collis, J., Hussey, Roger, author, & Dawsonera. (2014). Business research a practical guide for undergraduate & postgraduate students.
Comrey, A., & Lee, Howard B. (1992). A first course in factor analysis (2nd ed.). Hillsdale, N.J. ; Hove: L. Erlbaum Associates.
Crabtree, A.D, and Debusk, G.K. (2008). The Effects of Adopting the Balanced Scorecard on Shareholder Returns, Advances in Accounting, incorporating Advances in International Accounting, 24, 8–15.
Creswell, J. (2014). Research design : Qualitative, quantitative, and mixed methods approaches (4th ed.). Thousand Oaks: SAGE Publications.
Crewson, P. (1997). Public-Service Motivation: Building Empirical Evidence of Incidence and Effect. Journal of Public Administration Research and Theory: J-PART, 7(4), 499-518.
Davis, S., and Albright, T. (2004). An investigation of the effect of Balanced Scorecard Implementation on Financial Performance, Management Accounting Research, 15 135–153.
De Geuser, F., Mooraj, S., & Oyon, D. (2009). Does the Balanced Scorecard Add Value? Empirical Evidence on its Effect on Performance, European Accounting Review, 18(1), 93–122.

274
Dechow, N. (2012). The balanced scorecard: subjects, concept and objects - a commentary, Journal of Accounting & Organizational Change, 8(4), 511-527.
Decoene, V., and Bruggeman, W. (2006). Strategic alignment and middle‐level managers' motivation in a balanced scorecard setting, International Journal of Operations & Production Management, 26(4), 429-448.
Dilla, W.N., and Steinbart, P.J. (2005). Relative Weighting of Common and Unique Balanced Scorecard Measures by Knowledgeable Decision Makers, Behavioral Research in Accounting, 17, 43-53.
Ding, S., and Beaulieu, P. (2011). The Role of Financial Incentives in Balanced Scorecard-Based Performance Evaluations: Correcting Mood Congruency Biases, Journal of Accounting Research, 49(5), 1223-1247.
Dobrovic, Z., Tomicic, M., and Vrecek, N. (2008). Towards An Effective e-Government: Implementation of a Balanced Scorecard in the Public Sector, Intelektine Ekonomika, 1(3), 7-17.
Dreveton, B. (2013). The advantages of balanced scorecards in public sector: Beyond performance measurement. Public Money and Management, 33(2)131-136.
Easterby-Smith, M., Cooper, D. R., and Schindler, P.S. (2014), Business research methods, 4th Edition. London: Sage.
Eipstein, M.J.V., and Wisner, P.S. (2001). Using a balanced scorecard to implement sustainability, Environmental Quality Management, 11 (2), 1-10.
Evan, P., and Rausch, E.J. (1999). Bureaucracy and Growth: A Cross-National Analysis of the Effects of "Weberian" State Structures on Economic Growth. American Sociological Review, 64 (5), 748-765.
Farneti, F. (2009). Balanced scorecard implementation in an Italian Local Government Organization, Public Money & Management, 29(5), 313-320.
Fernandes, K. J., Raja, V., & Whalley, A. (2006). Lessons from implementing the balanced scorecard in a small and medium size manufacturing organization. Technovation, 26(5), 623-634.
Gavin Lawrie, Ian Cobbold, (2004) Third‐generation balanced scorecard: evolution of an effective strategic control tool, International Journal of Productivity and Performance Management, 53(7), pp.611-623.
Gibbons, Robert, and Robert S. Kaplan. 2015. Formal Measures in Informal Management: Can a Balanced Scorecard Change a Culture? American Economic Review, 105 (5): 447-51.
Ginting, E., Yusuf, A.A., Aji, P, and Horridge, M. (2015). Economy-wide impact of a more efficient Tanjung priok port, Asian Development Bank Papers on Indonesia, 03.

275
Globalsecurity.org. Government in Indonesia [online]. Available from: https://www.globalsecurity.org/military/world/indonesia/government.htm [last accessed 11 May 2018].
Gonzales, J., Calderon, M.A., and Gonzales, J.L.G. (2012). The alignment of managers’ mental models with the balanced scorecard strategy map, Total Quality Management, 23(5), 613-628.
Government of Republic of Indonesia (2003). State Finance. Law number 17 Year 2003, Republic of Indonesia.
Government of Republic of Indonesia (2004a). State Treasury. Law number 1 Year 2004, Republic of Indonesia.
Government of Republic of Indonesia (2004b). State Financial Management and Accountability. Law number 15 Year 2004, Republic of Indonesia.
Greatbanks, R., & Tapp, D. (2007). The impact of BSC in a public-sector environment: empirical evidence from Dunedin City Council New Zealand. International Journal of Operations and Production Management, 27(8), 846-873
Greiling, D. (2010). Balanced scorecards implementation in German non-profit organizations. International Journal of Productivity and Performance Management, 59(6), 534–554.
Griffiths, John. (2013). Balanced scorecards use in New Zealand government departments and crown entities. Australian Journal of Public Administration 62(4), 70-79.
Guba, E. G. (1990) The paradigm dialogue. Newbury Park, California: Sage.
Guba, E.G and Lincoln, Y.S (1994), ‘Competing paradigm in quantitative research’, in Denzin, N.K. and Lincoln, Y.S (eds) Handbook of Qualitative Research. London: Sage Publication.
Guimarães, B., Simoes, Pedro., and Marques, R.C. (2010). Does performance evaluation help public managers? A Balanced Scorecard Approach in Urban Waste Services, Journal of Environmental Management, 91, 2632-2638.
Gurd, B & Gao, T (2008). Lives in the Balance: an Analysis of the Balanced Scorecard (bsc) in Healthcare Organizations. International Journal of Productivity and Performance Management, 57 (1), 6-21.
Hair, J. (2010). Multivariate data analysis : A global perspective. (7th ed., Global ed. / Joseph F. Hair, Jr., .. [et al.]. ed.). Upper Saddle River, N.J. ; London: Pearson.
Hair, J., Black, W.C., Babin, B.J., & Anderson, Rolph, E. (2014). Multivariate data analysis. (Pearson new international seventh edition / Joseph F. Hair, Jr., William C. Black, Barry J. Babin, Rolph E. Anderson. ed., Pearson custom library).

276
Hakim, C. (2000). Research Design (2th ed.). London: Routledge.
Heinrich, C.J. (2002). Outcome-based performance management in the public sector: Im plications for government accountability and effectiveness. Public Administration Review, 62(6), 112-125. Jacobsson, B. (2001).
Holmes, J.S., de Pineres, S.A.G., and Kiel, L.D. (2006). Reforming Government Agencies Internationally: Is There a Role for the Balanced Scorecard?, International Journal of Public Administration, 29, 1125–1145
Hood, C. (1995), The ‘New public management’ in the 1980s: variations on a theme, Accounting, Organizations and Society, 1995, Vol.20(2), pp.93-109.
Hooper, D., Coughlan, J., and Mullen, M. R. (2008). Structural Equation Modelling: Guidelines for Determining Model Fit. Electronic Journal of Business Research Methods, 6(1):53–60.
Hoque, Z., and James, W. (2000). Linking balanced scorecards Measures to Size and Market Factors: Impact on Organizational Performance, Journal of Management Accounting Research, 12, 1-17.
Hoque, Z., and Adams, C. (2011).The Rise and Use of Balanced Scorecard Measures in Australian Government Departments, Financial Accountability & Management, 27(3), 490-510.
Hoque, Z. (2014). 20 Years of Studies on the Balanced Scorecard: Trends, Accomplishments, Gaps and Opportunities for Future Research. The British Accounting Review, 46(1), 33-59.
Hu, L.T. and Bentler, P.M. (1999), Cutoff criteria for fit indexes in covariance structure analysis: conventional criteria versus new alternatives, Structural Equation Modeling: A Multidisciplinary Journal, 6, 1-55.
Humphreys, K.A., and Trotman, K.T (2011). The Balanced Scorecard: The Effect of Strategy Information on Performance Evaluation Judgments, Journal of Management and Accounting Research, 23, 81–98.
Hussey, J., & Hussey, Roger. (1997). Business research: A practical guide for undergraduate and postgraduate students. Basingstoke: Macmillan.
Iacobucci, D. (2010), Structural equations modelling: Fit indices, sample size, and advanced topics, Journal of Consumer Psychology, 20, 90-98.
Inamdar, N & Kaplan, R. S. (2002). Applying the balanced scorecards in healthcare organizations. Journal of Healthcare and Management, 47(3), 179-195.
Irwin.D. (2002). Strategy mapping in the public sector, Long Range Planning, 35, 637–647.
Ittner, C.D., Larcker, D.F., and Randall, T. (2003). Performance Implications of Strategic Performance Measurement in Financial Services Firms. Accounting, Organizations and Society, 28, 715–741.

277
Ittner, C.D., Larcker, D.F., Meyer, M.W. (2003). Subjectivity and the Weighting of Performance Measures: Evidence from a Balanced Scorecard, The Accounting Review, 78(3),725-758.
Jackson, A. and Lapsley, I. (2003), The diffusion of accounting practices in the new ‘managerial’, The International Journal of Public Sector Management, 16(4/5), 359-372.
Jarzabkowski, P., Balogun, J., & Seidl, D. (2007). Strategizing: The challenges of a practice perspective. Human Relations, 60(1), 5-27.
Jo Rhodes , Paul Walsh & Peter Lok (2008) Convergence and divergence issues in strategic management Indonesia's experience with the Balanced Scorecard in HR management, The International Journal of Human Resource Management, 19(6), 1170-1185.
Johanson, U., Skoog, M., Backlund, A., and Almqvist, R. (2006). Balancing dilemmas of the balanced scorecard. Accounting, Auditing & Accountability Journal, 19 (6), 842-857.
Johnsen, A. (2001). Balanced Scorecards: theoretical perspectives and public management implications, Managerial Auditing Journal, 16/6, 319-330.
Johnson, P. and Duberley , J. (2000). Understanding management research. New York: Palgrave.
Kaplan, R. S. (2009). Conceptual foundations of the balanced scorecard. Handbook of management accounting research ,(3), 1253–1269). Oxford: Elsevier.
Kaplan, R. S., and Norton, D. P. (1992). The balanced scorecard – measures that drive performance. Harvard Business Review, 70(1), 71–79.
Kaplan, R. S., & Norton, D. P. (1993). Putting the balanced scorecard to work. Harvard Business Review, 134–147 (September–October).
Kaplan, R. S., & Norton, D. P. (1996a). Linking the balanced scorecard to strategy. California Management Review, 39(1), 53–79.
Kaplan, R. S., & Norton, D. P. (1996b). Using the balanced scorecard as a strategic management system. Harvard Business Review ,74(1), 75–85.
Kaplan, R. S., & Norton, D. P. (1996c). The balanced scorecard: Translating strategy into action. Boston, MA: Harvard Business School Press.
Kaplan, R. S., & Norton, D. P. (2000). Having trouble with your strategy? Then map it. Harvard Business Review, 78(5), 167–176.
Kaplan, R. S., & Norton, D. P. (2001a). Transforming the balanced scorecard from performance measurement to strategic management: Part I. Accounting Horizon, 15(1), 87–104.
Kaplan, R. S., & Norton, D. P. (2001b). Transforming the balanced scorecard from performance measurement to strategic management: Part II. Accounting Horizon, 15(2), 147–160.

278
Kaplan, R. S., & Norton, D. P. (2001c). The strategic focused organization: How balanced scorecard companies thrive in the new business environment. Boston, MA: Harvard Business School Press.
Kaplan, R. S., & Norton, D. P. (2004a). Measuring the strategic readiness of intangible assets. Harvard Business Review, 82(2), 52–63.
Kaplan, R. S., & Norton, D. P. (2004b). Strategy maps: Converting intangible assets into tangible outcomes. Boston, MA: Harvard Business School Press.
Kaplan, R. S., & Norton, D. P. (2006a). How to implement a new strategy without disrupting your organization. Harvard Business Review, 84(3), 100–109.
Kaplan, R. S., & Norton, D. P. (2006b). Alignment: Using the balanced scorecard to create corporate synergies. Boston, MA: Harvard Business School Press.
Kaplan, R., & Norton, D. (2006c). Response to S. Voelpel et al., "The tyranny of the Balanced Scorecard in the innovation economy," Journal of Intellectual Capital, Vol. 7 No. 1, 2006, pp. 43-60. Journal of Intellectual Capital, 7(3), 421-428.
Kaplan, R. S., & Norton, D. P. (2008a). Mastering the management system. Harvard Business Review, 63–77.
Kaplan, R. S., & Norton, D. P. (2008b). The execution premium: Linking strategy to operations for competitive advantage. Boston, MA: Harvard Business School Press.
Kaplan, R. S., Norton, D. P. & Rugelsjoen, B. (2010). Managing alliances with balanced scorecards. Harvard Business Review, 114–120.
Kaplan R, Norton D, Sher G. The Office of Strategy Management. Harvard Business Review [serial online]. October 2005;83(10):72-80.
Kasperkaya, Y. (2008). Implementing the Balanced Scorecard: a Comparative Study Of Two Spanish City Councils – an Institutional Perspective, Financial Accountability & Management, 24(4).
Kasurinen, T. (2002). Exploring management accounting change: the case of balanced scorecard implementation, Management Accounting Research, 13, 323–343.
Kim, S. (2005). Individual-Level Factors and Organizational Performance in Government Organizations. Journal of Public Administration Research and Theory, 15(2), 245-261.
Kim, S. (2011). Testing a Revised Measure of Public Service Motivation: Reflective versus Formative Specification. Journal of Public Administration Research and Theory, 21(3), 521-546.
Kline, R. (2011). Principles and practice of structural equation modeling (3rd ed., Methodology in the social sciences). New York: Guilford Press.

279
Kloot, L., & Martin, J. (2000). Strategic performance management: a balanced approach to performance management issues in local government. Management Accounting Research, 11, 231–251.
Kolberg, B., & Elg,M. (2011). The practice of balanced scorecards in healthcare services. International Journal of Productivity and Performance Management, 60(5), 427–455.
Kraus, K., and Lind, J. (2010). The Impact of the Corporate Balanced Scorecard on Corporate Control—A Research Note, Management Accounting Research, 21, 265–277.
Krejcie, R., & Morgan, D. (1970). Determining Sample Size for Research Activities. Educational and Psychological Measurement, 30(3), 607-610.
Kuhn, T. (1962). Historical structure of scientific discovery. Science (New York, N.Y.), 136(3518), 760-4.
Kuhn, T. S. (1970). The Structure of Scientific Revolutions. Chicago, IL.: University of Chicago Press.
Kuratko, D. F., Goodale, J. C., Hornsby, J. S. (2001), ‘Quality practices for a
competitive advantage in smaller firms. Journal of Small Business Management, 39, 293-311.
Lapsley, I. and Wright, E. (2004), “The diffusion of management accounting innovations in the public sector: a research agenda”, Management Accounting Research, Vol. 15 No. 3, pp. 355‐74.
Lawrence, P., Lorsch, J.W., and Harvard University. Graduate School of Business Administration. (1967). Organization and environment: Managing differentiation and integration. Boston, Mass.: Division of Research, Graduate School of Business Administration, Harvard University.
Lawrie, G., & Cobbold, I. (2004). Third-generation balanced scorecard: evolution of an effective strategic control tool. International Journal of Productivity and Performance Management, 53(7), 611-623.
Lee, C-L., and Yang, H-J. (2011). Organization Structure, Competition and Performance Measurement Systems and their Joint Effects on Performance, Management Accounting Research, 22, 84–104.
Lee, S., Park, S.B., and Lim, G.G. (2013). Using Balanced Scorecards for the Evaluation of ‘‘Software-as-a-service’’, Information & Management,50, 553–561.
Libby, T., Salterio, S.E., and Webb, A. (2004) The Balanced Scorecard: The Effects of Assurance and Process Accountability on Managerial Judgment Theresa, The Accounting Review, 79(4) 1075-1094.
Lipe, M.G., and Salterio, S. (2000). The Balanced Scorecard: Judgmental Effects of Common and Unique Performance Measures, The Accounting Review ,75(3) 283-298.

280
Lowe, D.J., Salvador, C-M., Reckers, P.M.J. (2011). The Influence of Strategy Map Communications and Individual Differences on Multidimensional Performance Evaluations, Accounting and Business Research, 41(4), 375–391.
Lucianetti, L. (2010) ‘The impact of the strategy maps on balanced scorecard performance’, Int. J.Business Performance Management, 12(1), 21–36.
Lueg, R., & e Silva, A. L. C. (2013). When one size does not fit all: a literature review on the modifications of the balanced scorecard. Problems and Perspectives in Management, 11(3), 86-94.
Madsen, D.O., and Stenheim, T. (2014). Perceived benefits of balanced scorecard implementation: some preliminary evidence, Problems and Perspectives in Management 12, 81-90.
Madsen, D., & Stenheim, T. (2015). The Balanced Scorecard: A Review of Five Research Areas. American Journal of Management, 15(2), 24-41.
Malina, M.A., and Selto, F.H., (2001). Communicating and controlling strategy: an empirical study of the effectiveness of the Balanced Scorecards, Journal of Management Accounting Research13, 47-90.
Malmi, T. (2001). Balanced scorecards in Finnish companies: a research note. Management Accounting Research, 12(2), 207–220.
Mandy M. Cheng and Kerry A. Humphreys (2012) The Differential Improvement Effects of the Strategy Map and Scorecard Perspectives on Managers' Strategic Judgments. The Accounting Review, 87(3), 899-924.
Mantere, S. (2005). Strategic practices as enablers and disablers of championing activity. Strategic Organization, 3(2), 157–284.
Marr, B., and Shiuma, G., (2003). Business Performance Measurement - Past, Present and Future, Management Decision, 41(8), 680-687.
McAdam, R., & Walker, T. (2003). An inquiry into balanced scorecards within best value implementation in UK local government. Public Administration, 81(4), 873–892.
McAdam. R., Shirley-Ann, H., and Casey. C. (2005),Performance management in the UK public-sector, International Journal of Public Sector Management, 18 (3) pp. 256 - 273.
Mcdonald, R., & Ho, M. (2002). Principles and practice in reporting structural equation analyses. Psychological Methods, 7(1), 64-82.
Me, L. and Jiang, Wu. (2013). The Reconstruction of the Balanced Scorecard in Chinese Local Governments: Correction Model Based on Service-Oriented Government Strategic Goals. Canadian Social Science, 9(5), 156-161.
Meyer, & Allen. (1991). A three-component conceptualization of organizational commitment. Human Resource Management Review, 1(1), 61-89.

281
Michalska, J. (2005). The usage of The Balanced Scorecard for the estimation of the enterprise's effectiveness, Journal of Materials Processing Technology, 162–163, 751–758.
Ministry of Finance Republic of Indonesia (2009). Pengelolaan Indikator Kinerja Utama di lingkungan Departemen Keuangan. Minister’s Regulation Number 87/KMK.01/2009, Ministry of Finance Republic of Indonesia.
Ministry of Finance Republic of Indonesia (2010). Pengelolaan Kinerja di lingkungan Departemen Keuangan. Minister’s Regulation Number Number 12/KMK.01/2010, Ministry of Finance Republic of Indonesia.
Ministry of Finance Republic of Indonesia (2011). Pengelolaan Kinerja di lingkungan Kemeneterian Keuangan. Minister’s Regulation Number Number 454/KMK.01/2011, Ministry of Finance Republic of Indonesia.
Ministry of Finance Republic of Indonesia (2012). Tentang Organisasi Dan Tata Kerja Instansi Vertikal Direktorat Jenderal Bea Dan Cukai. Minister’s Regulation Number 168/PMK.01/2012, Ministry of Finance Republic of Indonesia.
Ministry of Finance Republic of Indonesia (2014). Tentang Perubahan Organisasi Dan Tata Kerja Instansi Vertikal Direktorat Jenderal Bea Dan Cukai. Minister’s Regulation 206.3/PMK.01/2014, Ministry of Finance Republic of Indonesia.
Modell, S. (2012). The politics of balanced scorecards. Journal of Accounting & Organizational Change, 8 (4), 475–489.
Molina, M.A.C., González, J.M.H, Florencio, B.P., and González, J.L.G (2014) "Does the balanced scorecard adoption enhance the levels of organizational climate, employees’ commitment, job satisfaction and job dedication?", Management Decision, 52 (5), 983-1010.
Mottaz, Clifford J. (1986). An Analysis of the Relationship between Education and Organizational Commitment in a Variety of Occupational Groups. Journal of Vocational Behavior, 28(3), 214-28.
Moynihan, D., & Pandey, S. (2007). The Role of Organizations in Fostering Public Service Motivation. Public Administration Review, 67(1), 40-53.
Murray, P., Donegan (2003) "Empirical linkages between firm competencies and organizational learning", The Learning Organization, Vol. 10 Issue: 1, pp.51-62.
Naff, K., & Crum, J. (1999). Working for America: Does public service motivation make a difference? Review of Public Personnel Administration, 19(4), 5-16.
Neely, A. (2003), “Gazing into the crystal ball: the future of performance measurement”, Perspectives on Performance, Vol. 2 No. 2, pp. 12‐13.

282
Neely, A. Gregory, M. and Platts, K. (1995) "Performance measurement system design: A literature review and research agenda", International Journal of Operations & Production Management, Vol. 15 Issue: 4, pp.80-116.
Nilsson, K. (2010). Expectation from administrative reform: An attempt to implement balanced scorecards in a public-sector organization. International Journal of Public Administration, 33, 822-831.
Niven, P. R. (2002). Balanced scorecards step by step: maximizing performance and maintaining results. New York: John Wiley & Sons.
Niven, P. R. (2008). Balanced scorecards step by step for government and nonprofit agencies. New Jersey: John Wiley & Sons.
Norreklit, H. (2000). The balance on the balanced scorecard - a critical analysis of some of its assumptions, Management Accounting Research, 11, 65-88.
Norreklit, H. (2003). The Balanced Scorecard: what is the score? A rhetorical analysis of the Balanced Scorecard. Accounting, Organizations and Society, 28, 591–619.
Norreklit, H., Norreklit, Lennert, Mitchel F., and Bjornenak, T. (2012). The rise of the balanced scorecard! Relevance regained? Journal of Accounting & Organizational Change, 8(4), 490-510.
Northcott, D., & Taulapappa, T.M. (2012). Using the balanced scorecards to manage performance in public sector organizations. The International Journal of Public Sector Management, 25, 166–191.
Northcott, D., and Talapapa, T.M. (2012). Using the Balanced Scorecard to Manage Performance in Public Sector Organizations Issues and Challenges, International Journal of Public Sector Management, 25 (3), 166-191.
Nunnally, J. C., & Bernstein, I. H. (1994). Psychometric theory. (3rd ed.). New York, NY: McGraw-Hill, Inc.
Nuti, S., Seghieri, C., & Vainieri, M. (2013). Assessing the effectiveness of a performance evaluation system in a public health care system: some novel evidence from Tuscany region experience. Journal of Management and Governance, 17, 59–69.
O'Reilly, C., & Chatman, J. (1986). Organizational Commitment and Psychological Attachment: The Effects of Compliance, Identification, and Internalization on Prosocial Behavior. Journal of Applied Psychology, 71(3), 492.
Osbome, D. and T. Gaebler. 1992. Reinventing government: how the entrepreneurial spirit is transforming the public sector. Reading, Mass.: Addison-Wesley.

283
Pal, L.A., & I. Derek, Pal. 2009. The public-sector reform movement: mapping the global policy network. International Journal of Public Administration, 32(8), 621-657.
Pang, G. and Gebka, B. (2016). Forecasting container throughput using aggregate or terminal-specific data? The case of Tanjung Priok Port, Indonesia, International Journal of Production Research, 55(9), 2454-2469.
Paplexandris, A., Ioannou, G., & Prastacos, G. P, Soderquist, K.E. (2005). An Integrated Methodology Putting the Balanced Scorecards into action. European Management Journal, 23(2), 214–227.
Paplexandris, A., Ioannou, G., & Prastacos, G. P. (2004). Implementing the BSC in Greece: a software firm’s experience. Long Range Planning, 37(4), 351–366.
Paranjape, Bhagyashree ; Rossiter, Margaret ; Pantano, Victor. (2006). Performance measurement systems: successes, failures and future – a review. Measuring Business Excellence, 10(3), pp.4-14.
Park, J.H., Lee, J.K., and Yoo, J.S. (2005). A framework for designing the balanced supply chain scorecard, European Journal of Information Systems, 14, 335–346.
Park.E.J., and Huber D. L. (2007). Balanced Scorecards for Performance Management, The Journal of Nursing Administration, 37 (1), pp 14-20.
Perera, S., McKinnon, J.L. and Harrison, G.L. (2003), “Diffusion of transfer pricing innovation in the context of commercialization: a longitudinal case study of a government trading enterprise”, Management Accounting Research, 14(2), 140-64.
Perkins, M., Grey, A., and Remmers, H. (2014). What do we really mean by “Balanced Scorecard”?, International Journal of Productivity and Performance Management,63(2), 148-169
Perry, J.L. (1996), Measuring public service motivation: an assessment of construct reliability and validity, Journal of Public Administration Research and Theory, 6 (1), 5-22.
Perry, J.L. (1997), Antecedents of public service motivation, Journal of Public Administration Research and Theory, 7 (2), 181-97.
Perry, J.L. (2000), Bringing society in: toward a theory of public service motivation, Journal of Public Administration Research and Theory, 10 (2), 471-88.
Perry, J.L. and Porter, L.W. (1982), Factors affecting the context for motivation in public organizations, Academy of Management Journal, 7 (1), 89-98.
Perry, J.L. and Wise, L.R. (1990), “The motivational bases of public service”, Public Administration Review, 50 (3), 367-73.
Pollitt, C., & G. Bouckaert. (2000). Public management reform. A Comparative Analysis. New York: Oxford University Press.

284
Porter, L., & Steers, R. (1974). Organizational Commitment, Job-Satisfaction, And Turnover Among Psychiatric Technicians. Journal of Applied Psychology, 59(5), 603-609.
Prasad, Anshuman, & Prasad, Pushkala. (2002). The coming of age of interpretive organizational research. Organizational Research Methods, 5(1), 4-11.
President of Republic Indonesia (2010). Grand Design Reformasi Birokrasi Tahun 2010-2025. Presidential Regulation Number 81 Year 2010.
President of Republic Indonesia (2014). Pembentukan Kementerian dan Pengangkatan Menteri Kabinet Kerja Periode Tahun 2014-2019. Presidential Regulation Number 121 Year 2014.
Radnor, Z., & Lovel, B. (2003). Defining, justifying and implementing the Balanced Scorecard in the National Health Service, International Journal of Medical Marketing, 3(3), 174–188, 2003.
Radnor, Z., and McGuire. M. (2004), Performance management in the public sector: fact or fiction?, International Journal of Productivity and Performance Management, 53(3), 245 – 260.
Rainey, H. G., & Steinbauer, P. J. (1999). Galloping elephants: Developing elements of a theory of effective government organizations. Journal of Public Administration Research and Theory, 9(1), 1-32.
Rees, C.J. (2013) Human Resource Management in the Public Sector in Developing Countries, 37-60. Cheltenham: Edward Elgar.
Reisinger, H., Cravens, K.S and Tell, N. (2003). Prioritizing Performance Measures Within the Balanced Scorecard Framework, Management International Review, 43 (4) 429-437.
Rhodes, J., Walsh, P., and Lok, P. (2008). Convergence and divergence issues in strategic management Indonesia’s experience with the Balanced Scorecard in HR management; The International Journal of Human Resource Management, 19(6), 1170–1185.
Robson, C., & McCartan, Kieran. (2016). Real world research : A resource for users of social research methods in applied settings, (4th ed.). Chichester: Wiley.
Rompho,N. (2012). An experiment in the usefulness of a strategy map. Measuring business excellence, 16(2), 55-69.
Salterio, S. (2012). Balancing the scorecard through academic accounting research: opportunity lost? Journal of Accounting & Organizational Change, 8(4), 458–476.
Saunders, M., Lewis, Philip, & Thornhill, Adrian. (2003). Research methods for business students (3rd ed.). Harlow: Financial Times Prentice Hall.
Schobel, K., and Scholey, C. (2012). Balanced Scorecards in education: Focusing on Financial Strategies, Measuring Business Excellence, 16, 17-28

285
Schreiber, J., Nora, A., Stage, F., Barlow, E., & King, J. (2006). Reporting Structural Equation Modeling and Confirmatory Factor Analysis Results: A Review. The Journal of Educational Research, 99(6), 323-338.
Schwab, K. 2013. The Global Competitiveness Report 2013-2014. World Economic Forum, Geneva.
Sekaran, U. (2003) Research methods for business: A skill-building approach. 3th edition, USA: John Wiley and Sons, Inc.
Sekaran, U., & Bougie, Roger, author. (2016). Research methods for business : A skill-building approach (Seventh ed.).
Sharma, B., and Gadenne, David. (2011). Balanced Scorecard Implementation in a Local Government Authority: Issues and Challenges, The Australian Journal of Public Administration, 70 (2), 167–184.
Soderberg, M., Kalagnanam, S., & Vaidyanathan, G. (2011). When is balanced scorecards balanced scorecards? International Journal of Productivity and Performance Management, 60(7), 688-708.
Speckbacher, G., Bischof, J., & Pfeiffer, T. (2003). A Descriptive Analysis on the Implementation of Balanced scorecard in German-Speaking Countries. Management Accounting Research, 361–387.
Srithongrung, A. (2011). The Causal Relationships among Transformational Leadership, Organizational Commitment, and Employee Effectiveness. International Journal of Public Administration, 34(6), 376-388.
Statistics Indonesia (2010). Results of 2010 Population Cencus. [online]. Available
from: http://sp2010.bps.go.id/. [last accessed 11 May 2018].
Steers, Richard M., and Porter, Lyman W. 1983. Motivation and Work Behavior, 3d ed. New York: McGraw.
Steiger, J.H. (2007), Understanding the limitations of global fit assessment in structural equation modeling, Personality and Individual Differences, 42 (5), 893-98.
Stein, Jay M. 1986 Public Employee Productivity: Can Outcomes Be Validly Measured at the Jurisdictional Level? Public Personnel Management, 15 (2), 111-17.
Tabachnick, B., & Fidell, Linda S. (2007). Using multivariate statistics (5th ed.). Boston ; London: Allyn and Bacon.
Tanzi, V. (2000). The role of the State and the quality of the public sector. Cepal Review 71, 7-22.
Tapinos, E., Dyson, R.G., and Meadows.M. (2011). Does the Balanced Scorecard Make a Difference to the Strategy Development Process? Journal of the Operational Research Society, 62, 888-899 .

286
Tayler, W.B. (2010). The Balanced Scorecard as a Strategy-Evaluation Tool: The Effects of Implementation Involvement and a Causal-Chain Focus, The Accounting Review American Accounting Association, 85(3), 1095–1117.
Taylor, J. (2008). Organizational influence, public service motivation, and work outcomes: An Australian study. International Public Management Journal, 11, 67-88
Thietart, A.R. (2001). Real world research. Sussex: John Wiley and Sons Ltd.
Ullman, J. B. (2001). Structural equation modeling. In B. G. Tabachnick & L. S. Fidell (Eds.), Using multivariate statistics (4th ed.). Needham Heights, MA: Allyn & Bacon.
UNDP (1997). Governance for Sustainable Human Development. UNDP Policy Paper. New York: UNDP.
Vaara, E., Kleyman, B. & Seristo, H. Strategies as discursive constructions: The case of airline alliances. Journal of Management Studies, 2004, 41(1), 1–35.
Valerie, D., and Werner, B. (2006). Strategic alignment and middle-level managers' motivation in a balanced scorecard setting, International Journal of Operations & Production Management, 26, (3/4), 429-448.
Van Der Zee, J.T.M., and De Jong, B. (1999). Integrating Business and Information Technology Management with the Balanced Business Scorecard, Journal of Management Information System, 16(2), 137-156.
Van Thiel,S., & Leeuw,F.L, Pal. 2002. The performance paradox in the public sector. Public Performance and Management Review, 25(3), 267-28.
Vandenabeele, W. (2007). Toward a public administration theory of public service motivation. Public Management Review, 9(4), 545-556.
Vandenabeele, W. (2011). Who Wants to Deliver Public Service? Do Institutional Antecedents of Public Service Motivation Provide an Answer? Review of Public Personnel Administration, 31(1), 87-107.
Verbeeten., F.H.M., (2008),"Performance management practices in public sector organizations", Accounting, Auditing & Accountability Journal, 21 (3) pp. 427 – 454.
Voelpel, S. C., Leibold, M., and Eckhoff, R. A. (2006). The tyranny of the Balanced Scorecard in the innovation economy. Journal of Intellectual Capital, 7(1), 43-60.
Vroom, Victor. 1964. Work and Motivation. New York: Wiley.
Walker, K.B., and Dunn, L.M. (2006). Improving Hospital Performance and Productivity with the Balanced Scorecards. Academy of Health Care Management Journal, 2: 85-110.
Walters, M. (1995). The performance management handbook. London: Institute of Personnel and Development.

287
Weibel, A., Rost, K., & Osterloh, M. (2010). Pay for Performance in the Public Sector—Benefits and (Hidden) Costs. Journal of Public Administration Research and Theory, 20(2), 387-412.
Werner, L. and Xu, F. (2012). Executing Strategy with the Balanced Scorecard, International Journal of Financial Research, (3) (1), 88-94.
Widaman, K. (2003). New Methods for the Analysis of Change. Applied Psychological Measurement, 27(3), 236-239.
Wiersma, E. (2009). For which purposes do managers use Balanced Scorecards? An empirical study, Management Accounting Research, 20, 239–251.
Wing, B., Guo, L., Li, W., and Yang D. (2007). Reducing conflict in balanced scorecard evaluations, Accounting, Organizations and Society, 32, 363–377.
Wisniewski, M., and O´lafsson, S. (2004). Developing balanced scorecards in local authorities: a comparison of experience, International Journal of Productivity and Performance Management, 53(7), 602-610.
Witcher, B.J and Chau, V.S. (2008). Contrasting uses of balanced scorecards: case studies at two UK companies, Strategy Change, 17, 101–114.
Woods, M., and Grubnic, S. (2008). Linking Comprehensive Performance Assessment to The Balanced Scorecard: Evidence from Hertfordshire county council, Financial Accountability & Management, 24(3), 343-361.
Woodward, J. (1965). Industrial organization, theory and practice. Oxford.U.P.
World Bank – IEG (2008). Public Sector Reform: What Works and Why? World Bank, Washington, DC.
World Bank (2014). Indonesia review. [online]. Available from:
http://www.worldbank.org/en/country/indonesia/overview [last accessed 11 May 2018].
World Atlas (2018). Indonesia – Large Map [online]. Available from: http://www.worldatlas.com/webimage/countrys/asia/lgcolor/idcolor.htm [last accessed 11 May 2018].
Yang, C-C., Cheng, L-Y., and Yang, C-W. (2005). A Study of Implementing Balanced Scorecard (BSC) in non - profit Organizations: A Case Study of Private Hospital, Human Systems Management, 24, 285–300.
Yates, S.J (2004), Doing social science research. London: SAGE.
Yetano, A. (2009). Managing Performance at Local Government Level: The Cases of the City of Brisbane and the City of Melbourne, The Australian Journal of Public Administration,68 (2), 167–181.
Yi Wu, H. (2012). Constructing a Strategy Map for Banking Institutions with Key Performance Indicators of the Balanced Scorecard, Evaluation and Program Planning, 35, 303–320.

288
Yin, R. (2009). Case Study Research: Design and Methods (4th ed.). London: Sage Publications.
Yuan, F.C., and Chiu, C. (2009). Hierarchical Design of Case-based Reasoning in the Balanced Scorecard Application, Expert Systems with Applications, 36, 333–342.
Zikmund, W.G (2003), Business research method, 7th edition. Cincinnati, Ohio: Thomson/South-Western.

289
Appendix 1
Compilation of the Balanced Scorecard Implementation Studies
Number Year Authors Main Features of the
Study Settings Methodology Findings/Conclusion
1 1997 Alan Butler, Steve R. Letza and Bill Neale
examines the appropriateness of balanced scorecard adoption
Rexam Bowater, PLC London
explorative study Kaplan and Norton have devised an approach which seems to have overlooked the importance of the corporate mission. What important is that scorecard operationalizes the corporate mission.
2 1999 J.T.M. Van Der Zee and Berend De Jong
Aligns the BSC with the capabilities of IT
2 companies descriptive case studies
the integrated Balanced Business Scorecard approach, if applied intelligently and with awareness of its limitations, can successfully integrate business and IT planning processes
3 2000 Louise Kloot and John Martin
to understand how performance measurement systems are linked
local government organizations in the State of Victoria, Australia
qualitative, executive directors and managers were interviewed
Managers and employees are actively seeking better accounting and financial information systems to better manage performance. The challenge for policy makers is to recognize the importance of process measures and innovation and learning strategies for genuine, long-term quality improvement in the delivery of value for money services

290
Number Year Authors Main Features of the
Study Settings Methodology Findings/Conclusion
4 2000 Marlys Gascho Lipe and Steven Salterio
effect on performance judgments of the BSC's inclusion of diverse measures.
58 MBA students experiment laboratory
If unique measures are underweighted in ex post evaluations of the business unit and its manager, these measures are likely to receive little ex ante weight in the unit's decisions (Holmstrom and Milgrom 1991). This focus on common measures undermines one of the major benefits of the balanced scorecards, namely that each business will have and use a score card that uniquely captures its business strategy.
5 2000 Zahirul Hoque and Wendy James
examining the relationship between organization size, product life cycle stage, market position, balanced scorecards usage and organizational performances
66 Australian manufacturing companies
Survey Significant association between size and balanced scorecards usage, as size increases, organization find it more practical and useful to place greater emphasis on the balanced scorecards that supports their strategic decision making greater balanced scorecards usage is associated with increased organizational performance but this relationship does not significantly depend on organizational size, product life cycle, or market position.
6 2001 Epstein, Marc JV and Wisner, Priscilla S
sustainability strategy companies explorative study The process of developing social and environmental BSC helps managers identify a key performance measure that links their departments’ works with strategic objectives.

291
Number Year Authors Main Features of the
Study Settings Methodology Findings/Conclusion
7 2001 Heinz Ahn elaborating the Balanced Scorecard for a strategic business unit
Worldwide supplier of automation products
Projects based There are a number of reasons why the introduction of the Balanced Scorecard may fail. Managers considering implementing the concept should therefore consider the limitations as well as the possible benefits of this approach, and further research is necessary in order to help them make the right decision.
8 2001 Lars-G˛ran Aidemark balance scorecards and the process of governance in health care
Jonkoping County Council, Sweden
interviews and analysis of internal documents
Balanced scorecards replaced the one-sided financial measurement with control mechanisms that not only focused on the balancing judgements of the organization but also on the optimizing judgements. They reduced goal uncertainty, communicated the complex work of professionals to management and politicians and stimulated a new dialogue about vision and strategy. The four perspectives of balanced scorecards formed the frames for discussion and co-operation both within the clinic and in the organization as a whole.

292
Number Year Authors Main Features of the
Study Settings Methodology Findings/Conclusion
9 2001 M. Wisniewski and A. Dickson
to assess the applicability of balanced scorecards in the public sector
Dumfries and Galloway Constabular Police
what and how analysis, discussion, project
The majority of the performance measures were already been collected for other purposes, a number of the measures would need to be established before the initiative was launched rather than afterwards to enable a before-and-after comparison to be made. They accepted that in too many cases the traditional approach was to do it first and worry about measuring it afterwards. The last major area which caused the Unit some difficulty was the judgmental aspects of the Scorecard both in its development and in its later use.
10 2001 Mary A. Malina and Frank H. Selto
to analyze empirical interview and archival data to model the use and assess the communication and control effectiveness of the BSC.
a U.S. Fortune 500 company with more than 25,000 employees
Qualitative semi-structured telephone interviews with individuals directly involved with BSC along with archival data
Managers respond positively to BSC measures by reorganizing their resources and activities, in some cases dramatically, to improve their performance on those measures. More significantly, they believe that improving their BSC performance is improving their business efficiency and profitability. The following factors were found to negatively affect perceptions of the BSC and cause significant conflict and tension between the company and its distributors: 1. Measures are inaccurate or subjective; 2. Communication about the BSC is one-way (i.e., top-down and not participative); and

293
Number Year Authors Main Features of the
Study Settings Methodology Findings/Conclusion
3. Benchmarks are inappropriate but used for evaluation.
11 2001 Teemu Malmi aims to find out how BSCs are applied whether BSCs are used as an improved performance measurement system or as a strategic management system
17 organisations known to have adopted balanced scorecards
Qualitative semi-structured interviews
The idea of linking measures together based on assumed cause-and-effect relationships was not well understood by the early adopters of BSCs It appears that the resulting measures and perspectives are fair independent, lacking the currently suggested cause-and-effect logic (see also Laitinen, 1996)
12 2002 D. Irwin strategy mapping as a tool to develop strategy in a public sector agency and suggests a simplified version which can communicate that strategy effectively, both inside and outside the organisation
UK small business service
Action research Strategy mapping is just a tool. But it is a very effective tool in ensuring an understanding of the role of strategy and how an effective strategy encompasses all of an organization’s activities. Strategy mapping reminds organizations about the different strategic perspectives, and ensures that they are all taken into account. Strategy mapping can be applied at directorate level as well as at organizational level. Whilst a final strategy may well be quite complex, strategy mapping allows (indeed, encourages) organizations to start with a simple view which aids understanding of each of the perspectives and how they relate to each other.

294
Number Year Authors Main Features of the
Study Settings Methodology Findings/Conclusion
13 2002 Norein Inamdar and Robert S. Kaplan
describing motivation, experience and results from the perspective of healthcare executives
9 healthcare provoiders
Survey and interview
There five guidelines for implementing balanced scorecards: 1.Evaluate organization's ability and readiness to adopt balanced scorecards 2. Manage the balanced scorecards development and implementation process 3. Manage the learning before, during and in later stages of the implementation process 4. Expect and support role changes among different constituents 5. Take a system approach.
14 2002 Tommi Kasurinen the factors and implementation approaches which have made successful change possible
a multinational Finnish based metals group
Action research, Interview
At the early stages of the implementation process, it should also be decided whether the focus of the project should be on the measurement system characteristics or on the management system characteristics of the balanced scorecards (i.e. the cockpit approach versus strategic focus)
15 2003 Christopher D. Ittner David F. Larcker Marshall W. Meyer
the use of subjectivity in reward systems containing multiple performance measures.
North American retail banking operations of Global Financial Services
Quantitative method (Survey data)
Psychology-based explanations may be equally or more relevant than economics-based explanations in understanding measurement practices in some settings. Little evidence that the weights placed on nonfinancial measures had any association with their ability to predict financial performance (our proxy for in formativeness). Most of the weight was placed on quantitative, outcome-oriented

295
Number Year Authors Main Features of the
Study Settings Methodology Findings/Conclusion
financial measures that were used in earlier bonus plans, results that are consistent with psychology-based predictions.
16 2003 Christopher D. Ittner, David F. Larcker and Taylor Randall
relation between measurement system satisfaction, economic performance, and two general approaches to strategic performance measurement: greater measurement diversity and improved alignment with firm strategy and value drivers.
140 US financial services firms
Quantitative method (Survey data)
Firms making more extensive use of a broad set of financial and (particularly) non-financial measures than firms with similar strategies or value drivers have higher measurement system satisfaction and stock market returns. Greater measurement emphasis and diversity than predicted by our benchmark model is associated with higher satisfaction and stock market performance. Greater measurement diversity relative to firms with similar value drivers has a stronger relationship with stock market performance than greater measurement on an absolute scale. The balanced scorecard process, economic value measurement, and causal business modeling are associated with higher measurement system satisfaction, but exhibit almost no association with economic performance.
17 2003 Gerhard Speckbacher, Juergen Bischof, and Thomas Pfeiffer
analyze the spread, implementation and benefits of the different types of Balanced Scorecards
publicly traded firms in Germany, Austria and Switzerland
Survey method A significant association of size (measured as the number of employees) and BSC usage; larger companies are more likely to have implemented a BSC (of Types I, II or III). No significant support that size

296
Number Year Authors Main Features of the
Study Settings Methodology Findings/Conclusion
discriminates between the different BSC Types I–III. Firms belonging to the “consumer & retail” industry are associated with a significantly lower usage of BSC (Types I–III); but no significant association for other industries was found. The expected benefits of BSC use and it provide data about users’ satisfaction with respect to BSC types. The analysis of the relationship between the types and the companies’ perceived benefits and satisfaction shows that companies implementing a more developed BSC (particularly Type III) rely more on the BSC approach and are more satisfied with their BSC than those with a less developed BSC.
18 2003 Heribert Reisinger, Karen S. Cravens and Nicole Tell
to provide a rationale for the prioritization of measures in the BSC and to suggest a means to accomplish this prioritization
Consulting company
analytic hierarchy process
Changes in priorities over time may indicate a need to evaluate the choice of measures as well as the relation to strategy. It is important to realize that once the BSC is in place, it should continue to function in a dynamic manner to be truly effective. Periodic scheduled reviews are essential in maintaining the relevance of the BSC in relation to strategy. Without such reviews, there is a danger that the BSC will lose its relevance and deteriorate into a bureaucratic mechanism.

297
Number Year Authors Main Features of the
Study Settings Methodology Findings/Conclusion
19 2003 John Griffiths examines the use of the BSC
one government department and two Crown entities
A multiple-case-study methodology was used with data collected through in-depth structured interviews with the chief executive and other managers familiar with strategic management practices and the use of the balanced scorecards in each case organisation.
There were only limited linkages to goal-setting programs and reward systems, planning and budgeting processes, and learning and growth. The role of the scorecard in strategy development and implementation was closely related to the maturity of an organisation’s strategy.
20 2003 Rodney Mcadam And Timothy Walker
to conduct an exploratory study into the use of Balanced Scorecards as an approach to implementing Best Value in UK local government
13 local government authorities
explorative study The balanced scorecards formation process was effectively combined with the four result areas of the Business Excellence Model giving an effective linkage of initiatives. The ‘upwards’ and ‘downwards’ linking of objectives within the organization is crucial to the success of involving management and employees in Best Value.

298
Number Year Authors Main Features of the
Study Settings Methodology Findings/Conclusion
21 2003 Zoe Radnor and Bill Lovell
test the ideas of balanced scorecards in the public sector and specifically the Health Sector
Bradford health sector
research project The assessment of the BSC system should not be excessively dominated by concerns over the extra resources attributed with BSC implementation. The BSC should not be seen, or made to be, a mere duplication of existing PMSs. In fact, existing PMSs (such as Business Plan derived systems) can be usefully used to populate elements of some of the BSCs. It is key, however, that the BSC is adopted as the one strategic PMS for the organization, with the other systems specifically related to it and shaped by the strategic direction and vision of the organization. The BSC should be adopted in a context sensitive manner, with minimum, yet appropriate resource usage and full organizational support. If this is not done, it would arguably be better not to introduce the BSC system at all.
22 2004 Alexandros Papalexandris,George Ioannou and Gregory P. Prastacos
illustrates and evaluates the main obstacles and shortcomings
Software Development Company
Project The BSC is a necessary ‘‘good’’ for companies. This is especially so when used as a framework and a guideline for successful strategy communication and implementation, and as a system for understanding what really creates value in the company, rather than when it is used as a pure performance measurement system.

299
Number Year Authors Main Features of the
Study Settings Methodology Findings/Conclusion
23 2004 Geert J.M. Braam and Edwin J. Nijssen
how BSC use affects company performance
100 business-to-business companies
Mail survey to Dutch firms
BSC use that complements corporate strategy will positively impact performance. However, mechanistic use without a clear link to corporate strategy will hinder performance may even decrease it. A focus on performance measurement instead of performance management will impede the realization of organizational objectives and may even prove counterproductive by hurting company performance. Thus BSC investments will only pay off if they are in line with strategy, and it is therefore important (i) to map how the BSC is used, and (ii) to evaluate whether BSC application facilitates and complements corporate strategy. The translation of vision and strategy into operational measures is a complicated and dynamic process.
24 2004 Mik Wisniewski and Snjo´lfur O ´ lafsson
to examine the challenges and difficulties of adopting a scorecard approach
Public sector organizations
Experience of involvement in designing and implementing scorecards in a number of public sector organizations
Using a robust process to develop a strategy map and scorecard can have major tangible and intangible benefits. There has been a genuine acceptance of the scorecard process as one that adds value to what the organization and its constituent services are trying to achieve for their communities. The process requires considerable time and effort, it requires demonstrable

300
Number Year Authors Main Features of the
Study Settings Methodology Findings/Conclusion
commitment from managers at varying levels and to some extent it requires a change in mindset and thinking.
25 2004 Rajiv D. Banker, Hsihui Chang and Mina J. Pizzini
to assess how individuals' evaluations of the performance of business unit managers depend on strategically linked performance measures of a balanced scorecard
480 students enrolled in the M.B.A. using a clothing retailer
experiment laboratory
Performance evaluations are influenced by strategically linked measures more than non-linked measures only when evaluators are provided detailed information about business unit strategies. The results also confirm Lipe and Salterio's (2000) finding that evaluators rely more on common measures than on unique measures. Evaluators rely more on strategically linked measures than on common measures when they are provided information on strategic linkages, but the reverse relation holds when they are not.
26 2004 Stan Davis and Tom Albright
whether improved financial performance is observed after the implementation of the BSC in a banking institution, investigating whether bank branches implementing the Balanced Scorecard (BSC) outperform bank branches within the same banking
A banking organization in banking organization located in the southeastern United States
quasi-experimental study
BSC method can promote improved financial performance when compared to a traditional performance measurement system focusing solely on financial measures. By incorporating a group of NFMs into the performance measurement system in a logical and systematic manner, a group of branches outperformed another “control” group on a financial metric important to both sets of branches. One possible explanation may be the lack of a coherent linkage between the measures chosen for the performance
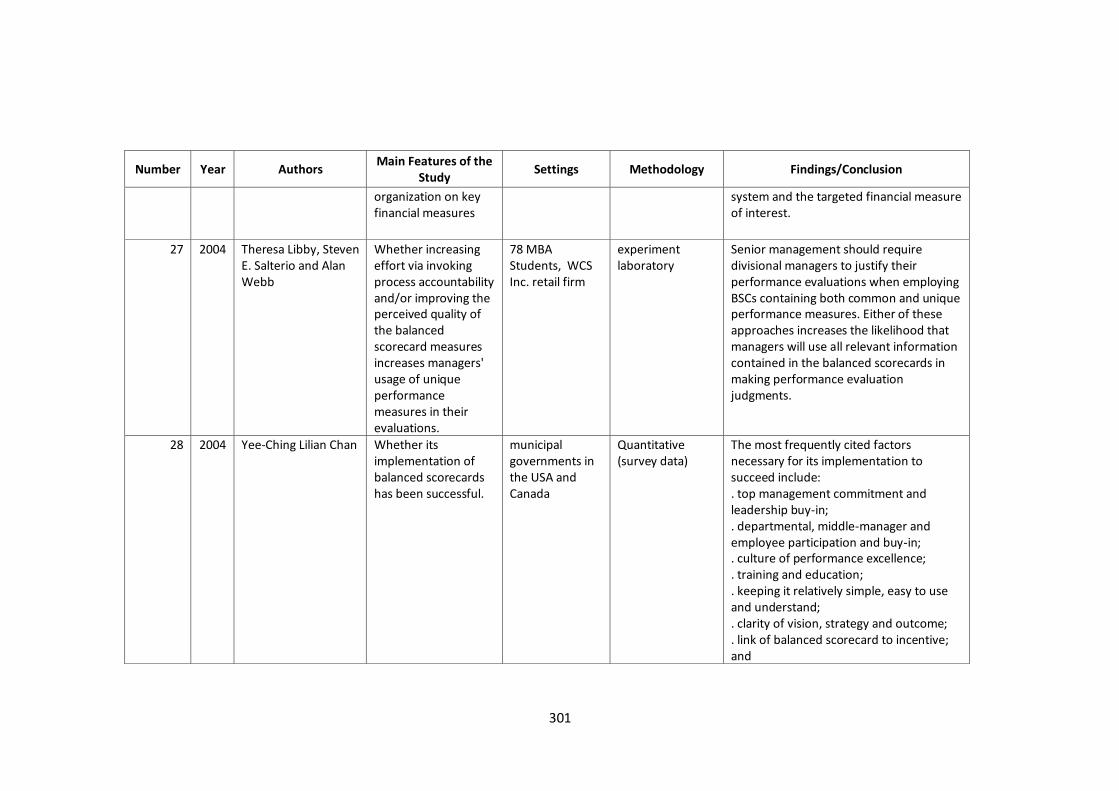
301
Number Year Authors Main Features of the
Study Settings Methodology Findings/Conclusion
organization on key financial measures
system and the targeted financial measure of interest.
27 2004 Theresa Libby, Steven E. Salterio and Alan Webb
Whether increasing effort via invoking process accountability and/or improving the perceived quality of the balanced scorecard measures increases managers' usage of unique performance measures in their evaluations.
78 MBA Students, WCS Inc. retail firm
experiment laboratory
Senior management should require divisional managers to justify their performance evaluations when employing BSCs containing both common and unique performance measures. Either of these approaches increases the likelihood that managers will use all relevant information contained in the balanced scorecards in making performance evaluation judgments.
28 2004 Yee-Ching Lilian Chan Whether its implementation of balanced scorecards has been successful.
municipal governments in the USA and Canada
Quantitative (survey data)
The most frequently cited factors necessary for its implementation to succeed include: . top management commitment and leadership buy-in; . departmental, middle-manager and employee participation and buy-in; . culture of performance excellence; . training and education; . keeping it relatively simple, easy to use and understand; . clarity of vision, strategy and outcome; . link of balanced scorecard to incentive; and
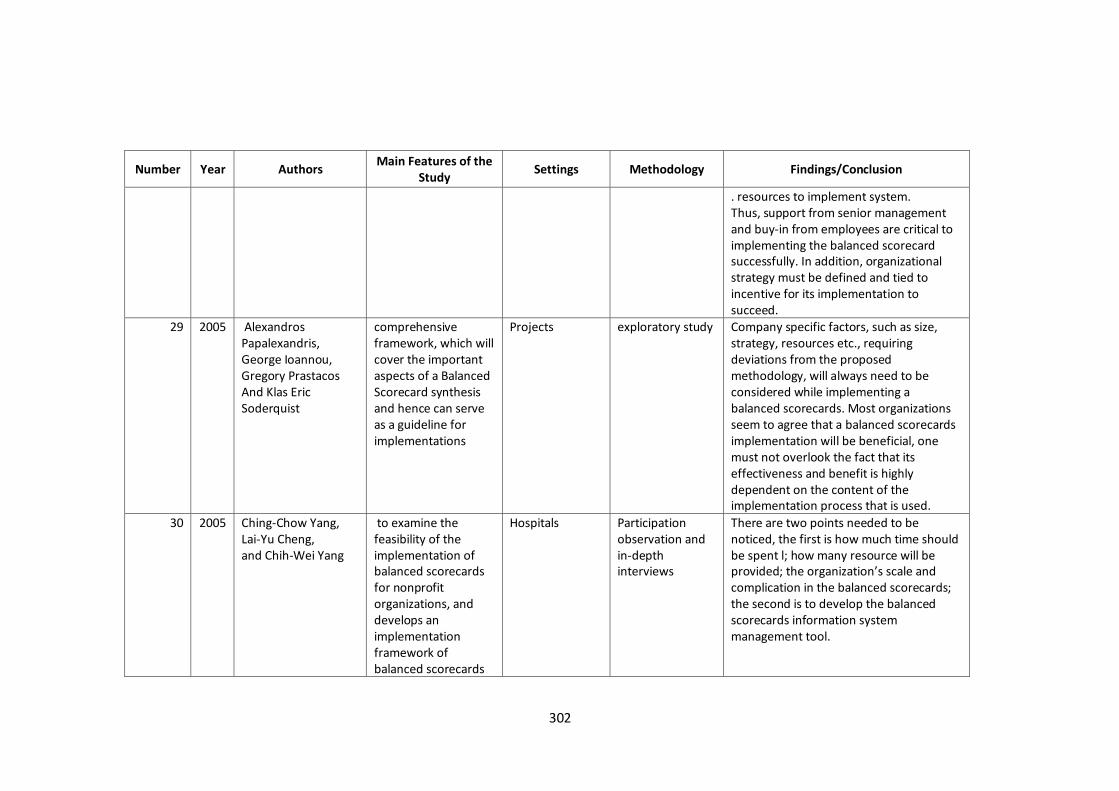
302
Number Year Authors Main Features of the
Study Settings Methodology Findings/Conclusion
. resources to implement system. Thus, support from senior management and buy-in from employees are critical to implementing the balanced scorecard successfully. In addition, organizational strategy must be defined and tied to incentive for its implementation to succeed.
29 2005 Alexandros Papalexandris, George Ioannou, Gregory Prastacos And Klas Eric Soderquist
comprehensive framework, which will cover the important aspects of a Balanced Scorecard synthesis and hence can serve as a guideline for implementations
Projects exploratory study Company specific factors, such as size, strategy, resources etc., requiring deviations from the proposed methodology, will always need to be considered while implementing a balanced scorecards. Most organizations seem to agree that a balanced scorecards implementation will be beneficial, one must not overlook the fact that its effectiveness and benefit is highly dependent on the content of the implementation process that is used.
30 2005 Ching-Chow Yang, Lai-Yu Cheng, and Chih-Wei Yang
to examine the feasibility of the implementation of balanced scorecards for nonprofit organizations, and develops an implementation framework of balanced scorecards
Hospitals Participation observation and in-depth interviews
There are two points needed to be noticed, the first is how much time should be spent l; how many resource will be provided; the organization’s scale and complication in the balanced scorecards; the second is to develop the balanced scorecards information system management tool.

303
Number Year Authors Main Features of the
Study Settings Methodology Findings/Conclusion
31 2005 HA Akkermans and KE van Oorschot
illustrates how, through their involvement in this development process, management came to understand that seemingly contradictory goals such as customer satisfaction, employee satisfaction and employee productivity were, in fact, better seen as mutually reinforcing
a business unit of the Dutch insurer Interpolis
system dynamics (SD) modelling and simulation
The BSC concept helpful to arrive at a list of financial and non-financial performance measures, which seen as the most important ones.
32 2005 J. Michalska Measurement of firm effectiveness
Polish steel works
exploratory study The Balanced Scorecard being the useful tool in supporting management processes, it permits the estimation of a firm through different perspectives (financial, customers, internal processes, knowledge and development) through which are equalized many aims and opinions. This method is unique, mostly due to two elements: it brings all workers closer to a strategy and permits the estimation of the degree of realization of this strategy and firm’s working not only through the financial results

304
Number Year Authors Main Features of the
Study Settings Methodology Findings/Conclusion
33 2005 Jong Han Park , Jae Kyu Lee and Jung Soo Yoo
proposes a framework for the Balanced Supply Chain Scorecard
Company Structured Interviews and exploratory
BSC is useful for supply change management process and the importance of BSC depends significantly on the product characteristics.
34 2005 William N. Dilla and Paul John Steinbart
investigate whether decision makers who have had training and experience in designing BSCs ignored measures that reflect the unique strategy of a business unit and based their performance evaluations solely on measures common across units
undergraduate accounting and information systems majors
experiment laboratory
Decision makers who are knowledgeable about the balanced scorecards attended to both common and unique measures, but placed greater emphasis on the former
35 2006 Jennifer S. Holmes, Sheila Amin Gutiérrez de Piñeres, and L. Douglas Kiel
explores the applicability of the model to government organizations in developing countries.
City of Charlotte, North Carolina, Washington State, UK, Sweden Australia and New Zealand
exploratory study An application of the balanced scorecards to public agencies is particularly appropriate for complex, transparent, and mature organizations with diverse stakeholders. To be effective, the strategic planning process should be adapted to the particular needs and goals of each organization to identify appropriate perspectives.

305
Number Year Authors Main Features of the
Study Settings Methodology Findings/Conclusion
36 2006 Kenton Walker B. and Laura M. Dunn
Usefulness of BSC improving hospital management and delivery of healthcare
Hospitals explorative study Implementation of balanced scorecards along with some creativity initiative and cooperation among hospital employees, customers and consumers can improve the management and delivery of healthcare at reduced cost and without loss of quality.
37 2006 Valerie Decoene and Werner Bruggeman
cascading process a Danish company producer of polyolefin plastic
Interviews Effective strategic alignment calls for the active involvement of manufacturing executives in the balanced scorecards design and implementation process. Effective strategic alignment empowers and motivates manufacturing executives. A combination of effective strategic alignment and a BSC‐based compensation plan has a positive effect on the extrinsic motivation of manufacturing executives

306
Number Year Authors Main Features of the
Study Settings Methodology Findings/Conclusion
38 2006 Yee-Ching Lilian Chan BSC judgment biases, information overload, and the synthesis of information.
12 hospital in Canada
Analytic Hierarchy Framework
With multiple goals and measures in the BSC, information overload may force the decision maker, either consciously or subconsciously, to apply an ad hoc weighting to the data to achieve some overall, comprehensive measure to use for comparative purposes. The analytic hierarchy process provides a structure as well as an algorithm to develop such a comprehensive measure.
39 2007 Bernard Wong-On-Wing , Lan Guo, Wei Li , Dan Yang
conflict between top management and divisional managers because of the failure of the former to evaluate and consider strategy effectiveness in performance evaluation
63 evening MBA students
experiment laboratory
Reducing top management’s bias may in addition increase the effectiveness of the balanced scorecards as a strategic management system. In evaluating divisional performance, emphasizing the effectiveness of the strategy may facilitate the identification of its limitations, and consequently, highlight the need for its revision.
40 2007 Eun-Jun Park and Diane L. Huber
Balanced scorecards benefits and practical concerns
Hospitals literature review To successfully measure and manage performance using the scorecard, 1) unique strengths and principles of the scorecard should be understood and established, 2) administrative leadership and participation from all levels in an

307
Number Year Authors Main Features of the
Study Settings Methodology Findings/Conclusion
organization is essential, 3) information systems need to be designed to incorporate the scorecard, and 4) participants ‘performance feedback should be provided and strategies for success refined.
41 2007 Meena Chavan exploring issues that organizations face in building and implementing scorecard systems, and sharing lessons learned from Australian organizations that have taken the balanced scorecard journey
Company Literature review The balanced scorecard approach may require some substantial changes in culture within the organization. The balanced scorecard requires understanding, commitment and support from the very top of the business down. As culture changes and develops to accept the new approach and members of the organization mature within the new culture, the organization will find new things to measure, new goals in different areas, to make the balanced scorecard even more balanced and effective in supporting a living, growing, viable organization. Different organizations have quite different needs, market areas, people, products and services, and will end up with significantly different balanced scorecards.

308
Number Year Authors Main Features of the
Study Settings Methodology Findings/Conclusion
42 2007 Richard Greatbanks and David Tapp
The impact of scorecards over this time at three levels: internal planning processes and the development of measures; the effect of scorecards on internal team management processes and the impact upon the individual staff, and their actual achievement of performance objectives and goals.
A public service city council
A case study The use of scorecards within the case organization enables employees to clearly appreciate their role, and focus on delivery of performance-related measures which support organizational strategy. Clarity of role appears to have a positive influence on the achievement of the organization’s business plan and excellence goals regarding the delivery of customer service
43 2007 Yee-Ching Lilian Chan strategy maps and balanced scorecards
Ontario Health Quality Council
exploratory study Buy-in and collaboration from different institutions within the health system are key to fully recognizing the value of implementing strategy maps and balanced scorecards in the healthcare sector.
44 2008 Aaron D. Crabtree and, Gerald K. DeBusk
the relationship between balanced scorecards adoption and shareholder returns
Member of Institute Management Accountants
Survey data Over the three-year post-adoption period, balanced scorecards adopters outperformed their industry counterparts who chose not to adopt the balanced scorecards by 27–30 percentage points. The results are robust to various matching criteria. There is also evidence that firms earn greater excess returns after adoption
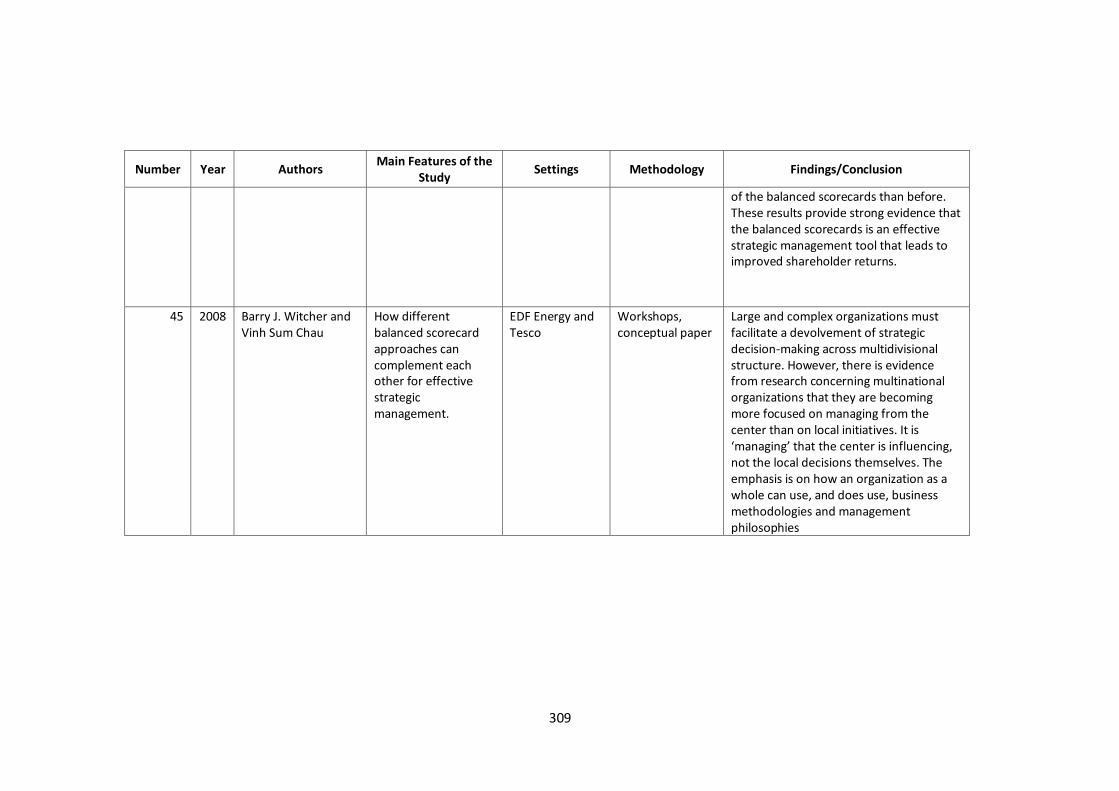
309
Number Year Authors Main Features of the
Study Settings Methodology Findings/Conclusion
of the balanced scorecards than before. These results provide strong evidence that the balanced scorecards is an effective strategic management tool that leads to improved shareholder returns.
45 2008 Barry J. Witcher and Vinh Sum Chau
How different balanced scorecard approaches can complement each other for effective strategic management.
EDF Energy and Tesco
Workshops, conceptual paper
Large and complex organizations must facilitate a devolvement of strategic decision-making across multidivisional structure. However, there is evidence from research concerning multinational organizations that they are becoming more focused on managing from the center than on local initiatives. It is ‘managing’ that the center is influencing, not the local decisions themselves. The emphasis is on how an organization as a whole can use, and does use, business methodologies and management philosophies

310
Number Year Authors Main Features of the
Study Settings Methodology Findings/Conclusion
46 2008 Bruce Gurd and Tian Gao
to show how the balanced scorecard has been a prominent innovation in strategic performance measurement systems
health sector Literature review balanced scorecard in healthcare organizations presents a different picture to other industries in relation to the range of perspectives, with people and community as their different perspectives. An improvement in efficiency is a limited perspective in the healthcare industry because in practice they have to balance efficiency and fairness, and balance between cost, quality, access, and consumer choice (Inamdar and Kaplan, 2002). This is a significant difference between healthcare and other industries.
47 2008 Carmine Bianchia and Giovan Battista Montemaggiore
how the use of “dynamic” balanced scorecards can significantly improve the planning process in a strategic learning perspective
city water company
Case study Strategic mapping and simulation through the system dynamics methodology has proved to successfully enhance managers learning and capability to identify causal relationships between policy levers and company performance, and better communicate strategy with stakeholders.
48 2008 Dobrovic, Zeljko ; Tomicic, Martina ; and Vrcek, Neven
The precondition for successful implementation of the balanced scorecards method in the public sector
none exploratory study Preconditions to be successfully implemented and effectively applied in public sector organizations are: (1) guidelines and strategic goals sent by the government to state and public organizations need to be clear and unambiguous; (2) a public organization’s management needs to have an insight into the application of the balanced scorecards method and partly

311
Number Year Authors Main Features of the
Study Settings Methodology Findings/Conclusion
change their managerial habits; (3) operative procedures of the application of the balanced scorecards method in an organization need to be clearly defined; (4) an organization needs to have a central information system (is) to which the application/software that the balanced scorecards model is to be implemented in will be connected.
49 2008 Jo Rhodes, Paul Walsh and Peter Lok
how divergent factors such as national culture, leadership styles, organizational culture and human resource management practices can influence Asian context Balanced Scorecard implementations
Central Bank explorative study Four areas need close attention when Asian firms implement strategic management systems: 1. conflict avoidance in relation to performance appraisal and rewards; 2. the depth of feedback given to staff around performance issues; 3. organizational fear of metrics; and 4. high power distance and conformity.
50 2008 Margaret Woods and Suzana Grubnic
potential benefits (and problems) of using the balanced scorecards in a public sector context
Hertfordshire County
Interviews Balanced scorecards system has helped to focus on outcomes rather than outputs as indicators of operational effectiveness. The cascading down of the balanced scorecards approach through the organizational hierarchy can potentially help overcome the resistance to change that marks out many public sector organizations (Chan, 2004) by negating
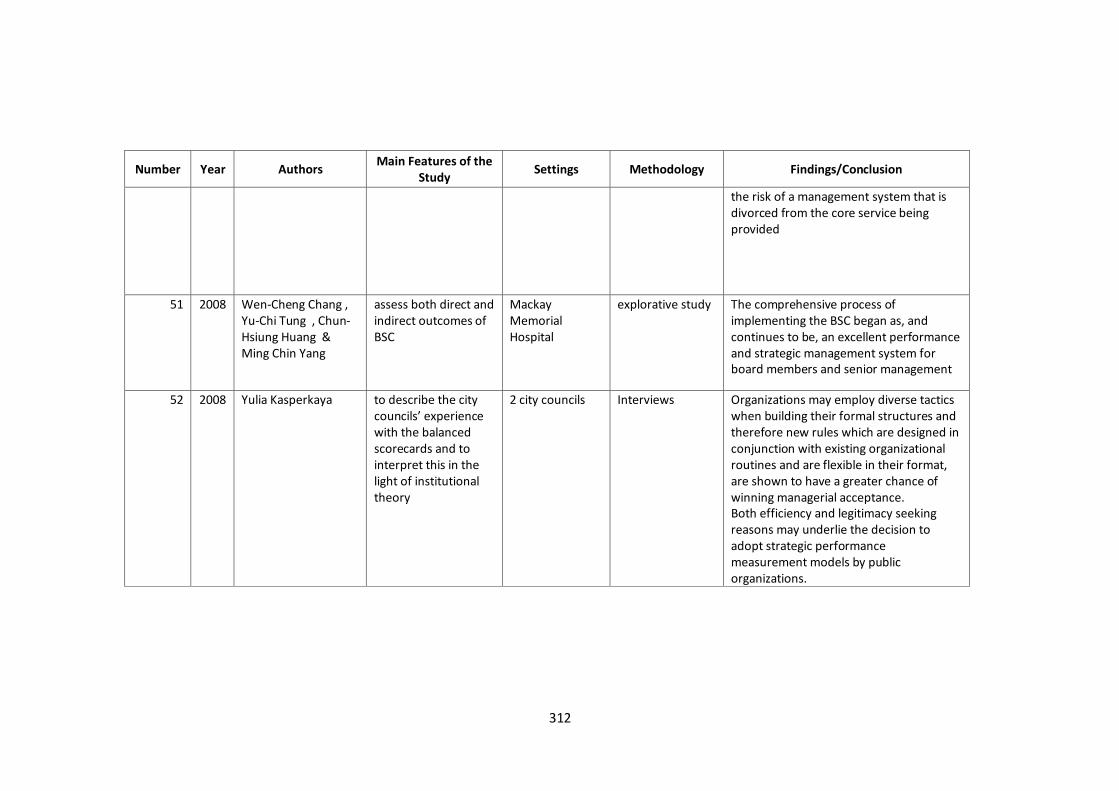
312
Number Year Authors Main Features of the
Study Settings Methodology Findings/Conclusion
the risk of a management system that is divorced from the core service being provided
51 2008 Wen-Cheng Chang , Yu-Chi Tung , Chun-Hsiung Huang & Ming Chin Yang
assess both direct and indirect outcomes of BSC
Mackay Memorial Hospital
explorative study The comprehensive process of implementing the BSC began as, and continues to be, an excellent performance and strategic management system for board members and senior management
52 2008 Yulia Kasperkaya to describe the city councils’ experience with the balanced scorecards and to interpret this in the light of institutional theory
2 city councils Interviews Organizations may employ diverse tactics when building their formal structures and therefore new rules which are designed in conjunction with existing organizational routines and are flexible in their format, are shown to have a greater chance of winning managerial acceptance. Both efficiency and legitimacy seeking reasons may underlie the decision to adopt strategic performance measurement models by public organizations.

313
Number Year Authors Main Features of the
Study Settings Methodology Findings/Conclusion
53 2009 Ana Yetano to understand the implementation and structure of performance management systems at local government level
Brisbane and Melbourne
The case studies use multiple sources for collecting the data, including interviews, documentation, direct observation and participant observation
The successful adoption of performance management techniques is highly influenced by the momentum for change, administrative culture and the search for prominence.
54 2009 Chwan-Yi Chiang and Binshan Lin
Attempted to develop an integrated framework to encompass the basic concepts of balance scorecards and data envelope analysis (DEA) for measuring management performance.
The auto and national commercial bank industries
data envelope analysis
The interrelationships between the four perspectives of balanced scorecards proposed by Kaplan and Norton (1996) were further empirically shown to be valid in the auto and commercial bank industries. Specifically, the learning and growth perspective was significantly related to the internal business process perspective, which in turn was positively related to the customer perspective. And the customer perspective was positively related to the financial perspective. In addition, the relationship between customer perspective and financial perspective was the most significant among the interrelationships of balanced scorecards.

314
Number Year Authors Main Features of the
Study Settings Methodology Findings/Conclusion
55 2009 Deborah F. Beard successfulness of balanced scorecards implementation
the Kenneth W. Monfort College of Business at Northern Colorado and at the University of Wisconsin
experiment laboratory
balanced scorecards, as a strategy-based management system, enables not only business organizations but also educational institutions to clarify their visions and translate strategies into operational objectives, measures, and actions in alignment with their missions and core values. The process of establishing the balanced scorecards provides the opportunity for identifying what really matters to customers and stakeholders: why the institution exists, what is important to the institution, and what the institution wants to be.
56 2009 Eelke Wiersma purposes of the balanced scorecards at the individual manager level
19 Dutch firms Survey Method
Purposes of balanced scorecards usage: for decision-making and decision-rationalizing, for coordination of activities within the organizational unit, and for self-monitoring purposes.
57 2009 Fabien De Geuser, Stella Mooraj and Daniel Oyon
how the balanced scorecards enhances organizational performance
24 organizations Quantitative (survey)
Balanced Scorecard has a positive impact on organizational performance. More specifically, the BSC improves the integration of the management processes and empowers people. The sources of performance derived from the balanced scorecards are: (1) a better translation of the strategy into operational terms, (2) the fact that strategizing becomes a continuous process, and (3) the greater
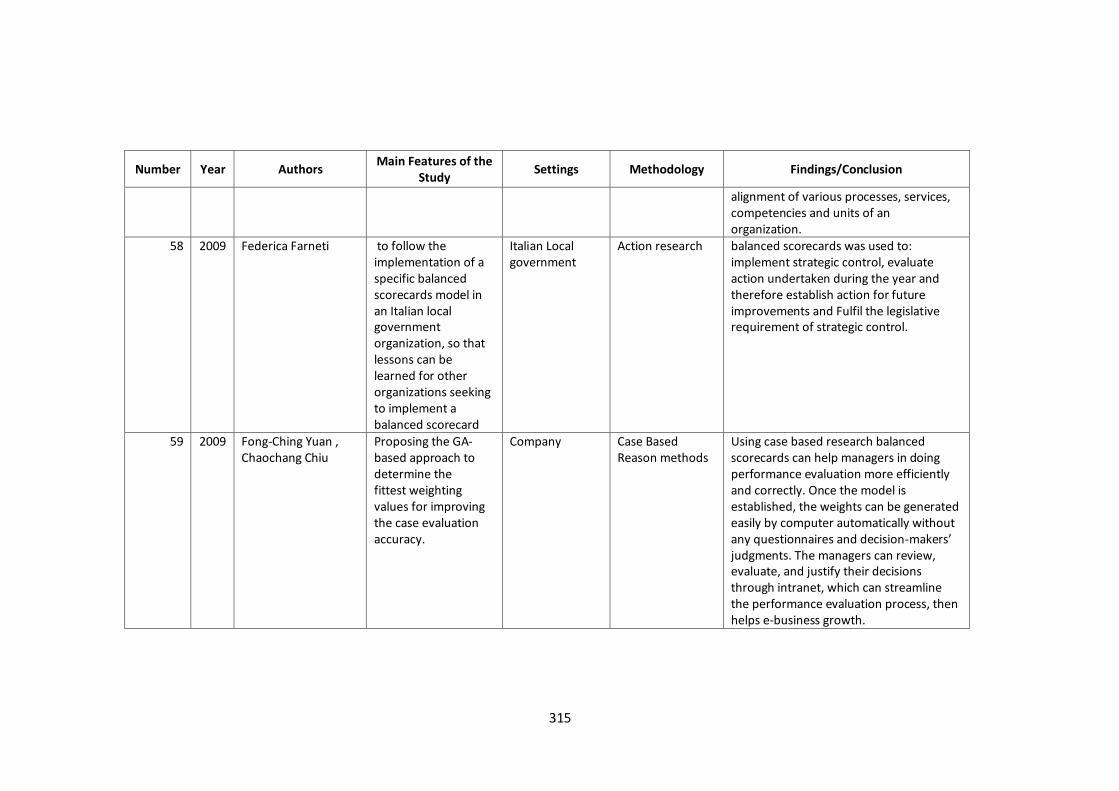
315
Number Year Authors Main Features of the
Study Settings Methodology Findings/Conclusion
alignment of various processes, services, competencies and units of an organization.
58 2009 Federica Farneti to follow the implementation of a specific balanced scorecards model in an Italian local government organization, so that lessons can be learned for other organizations seeking to implement a balanced scorecard
Italian Local government
Action research balanced scorecards was used to: implement strategic control, evaluate action undertaken during the year and therefore establish action for future improvements and Fulfil the legislative requirement of strategic control.
59 2009 Fong-Ching Yuan , Chaochang Chiu
Proposing the GA-based approach to determine the fittest weighting values for improving the case evaluation accuracy.
Company Case Based Reason methods
Using case based research balanced scorecards can help managers in doing performance evaluation more efficiently and correctly. Once the model is established, the weights can be generated easily by computer automatically without any questionnaires and decision-makers’ judgments. The managers can review, evaluate, and justify their decisions through intranet, which can streamline the performance evaluation process, then helps e-business growth.

316
Number Year Authors Main Features of the
Study Settings Methodology Findings/Conclusion
60 2010 Bernardo Guimarães, Pedro Simões and Rui Cunha Marques
The potential for the application of the balanced scorecards methodology into the waste utilities
urban waste sector in Portugal
explorative study The balanced scorecards appears as a tool easy to use and simple to read that can be implemented either by the management board alone or with the help of a dedicated team able to go across all the four perspectives within the waste utility. However, the balanced scorecards success relies on good data quality and on how straightforward data is collected, as it maintains the information updated.
61 2010 Dorothea Greiling gain additional, exploratory insight into the experience non-profit organizations have had with the balanced scorecard.
20 organizations in German
(Qualitative) Interviews
Most of the non-profit organizations which have been analyzed in this paper are in an early phase of balanced scorecard implementation. The balanced scorecard is often used as a measurement tool and not as a management system. In most cases, participating organizations have an unexpected viewpoint with regard to their attitude towards the balanced scorecard, as they did not sufficiently adapt it to the distinct requirements of non-profit operations
62 2010 Eddy Cardinaels a, Paula M.G. van Veen-Dirks
how the organization and presentation of performance measures affect how evaluators weight financial and non-financial measures
144 students experiment laboratory
Firms should carefully consider how to present and organize measures to get the intended effect on performance evaluations.

317
Number Year Authors Main Features of the
Study Settings Methodology Findings/Conclusion
when evaluating performance.
63 2010 Kalle Kraus, Johnny Lind
adoption of the corporate balanced scorecard and its impact on corporate control of business units.
15 Multinational companies in Sweden
Interviews Corporate balanced scorecards had little impact on control at the corporate level. Corporate control was financially focused in all the companies: mainly financial measures were important, standards were only set for financial measures and rewards were largely based on financial performance measures
64 2010 Kent Nilsson to explore what actors in a Swedish municipality expect from a new administrative reform (i.e., an attempt to implement the balanced scorecards)
Municipality (13 Actors)
In depth Interview
The expectations on changes are highest among the politicians, moderate among the administrators, and lowest among the operative employees.
65 2010 Laurie L. Burney and Nancy J. Swanson
Whether the perspective framework and the strategy link influence managers' behavior.
accounting managers in balanced scorecards firms
survey data collected
A strong, positive relation between job satisfaction and managers' perceptions of the strength of the linkage between performance measures and organizational strategy. The inclusion of non-financial measures in some balanced scorecards categories is positively related to

318
Number Year Authors Main Features of the
Study Settings Methodology Findings/Conclusion
managers' job satisfaction and, therefore, may encourage a long-term decision-making focus. The development of a decision rule to be used when applying survey methodology that allows the researcher to identify organizations that use a balanced scorecards.
66 2010 Michael Burkert, Antonio Davila, Daniel Oyon
to substantiate the claim for more empirical studies on performance implications of balanced scorecards use and to derive recommendations how to conduct such research effectively
not mention Literature review Found both, important evidence for positive effects of some of the elements constituting the BSC and results that shed a more critical light on the expected benefits stemming from its constituting practices. Such evidence only exists in smaller settings of large companies with different branches; thus, it can hardly be generalized
67 2010 William B. Tayler investigates whether involvement in scorecard implementation can mitigate the effects of motivated reasoning that occur when the scorecard is framed as a causal chain rather than merely as a balanced set of measures
M.B.A. students experiment laboratory
A causal view of the scorecard, in conjunction with involvement in scorecard measure selection, helps overcome psychological forces that are likely to limit scorecard effectiveness. Increased managerial involvement in the selection of scorecard measures can counter motivated reasoning, thereby reducing the likelihood that managers will view unsuccessful strategies as successful.

319
Number Year Authors Main Features of the
Study Settings Methodology Findings/Conclusion
68 2011 Bishnu Sharma and David Gadenne
investigates whether the implementation of a balanced scorecards has been of value
local government authority
Qualitative (Interviews)
Problems in relation to each of the seven major themes encompassing the planning phase; deployment, assessment and review; leadership and motivation; communication mechanisms; measurement techniques; reward and incentive schemes; and transferability to other internal public sector divisions.
69 2011 Chia-Ling Lee, Huan-Jung Yang
the organization structure and competition on the design of performance measurement systems (PMSs) and their joint effects on performance.
667 firms listed on the Taiwan Stock Exchange
Survey data Organization structure is significantly associated with the design of PMSs. Compared to mechanistic organizations, organic organizations make greater use of integrated measures and the higher developmental stages of PMSs. The findings also partly support the presence of joint effects on performance involving organization structure, competition, and the use of PMSs. When there is greater competition among firms, a positive relationship between the stages of PMS development and performance is of higher significance. The use of integrated measures is more relevant with respect to organizational performance in mechanistic organizations than in organic ones.
70 2011 D. Jordan Lowe, Salvador Carmona-Moreno and Philip M.J. Reckers
examine the role of strategy maps in communicating goals and strategy
165 MBA experiment laboratory
An integrated strategy map able to counter a documented short-term financial outcomes fixation/bias and thereby apply a levelling process such that equivalent ratings were forthcoming to

320
Number Year Authors Main Features of the
Study Settings Methodology Findings/Conclusion
managers with equivalent overall scores. It may not always be intuitive as to which individuals may be more or less receptive to the influence of strategy maps.
71 2011 E.Tapinos, RG Dyson and M Meadows
to examine the impact of balanced scorecards upon the strategy development process.
4000 members of the alumni database of Warwick Business School
Survey Even though the balanced scorecards users tend to place more emphasis in all elements of the strategy development process, the difference is not always significant. As balanced scorecards users also typically use several other tools, the study does not support the view that the balanced scorecards is a comprehensive management tool.
72 2011 Kerry A. Humphreys and Ken T. Trotman
to test the generalizability of the findings on the common measures bias and the impact on the common measures bias of communicating strategy information
103 Executive M.B.A. students from a major Australian university
experiment laboratory
If all measures are strategically linked, does not eliminate the common measures bias if strategy information is not provided. The common measures bias is consistently eliminated when strategy information is provided and all measures are strategically linked.
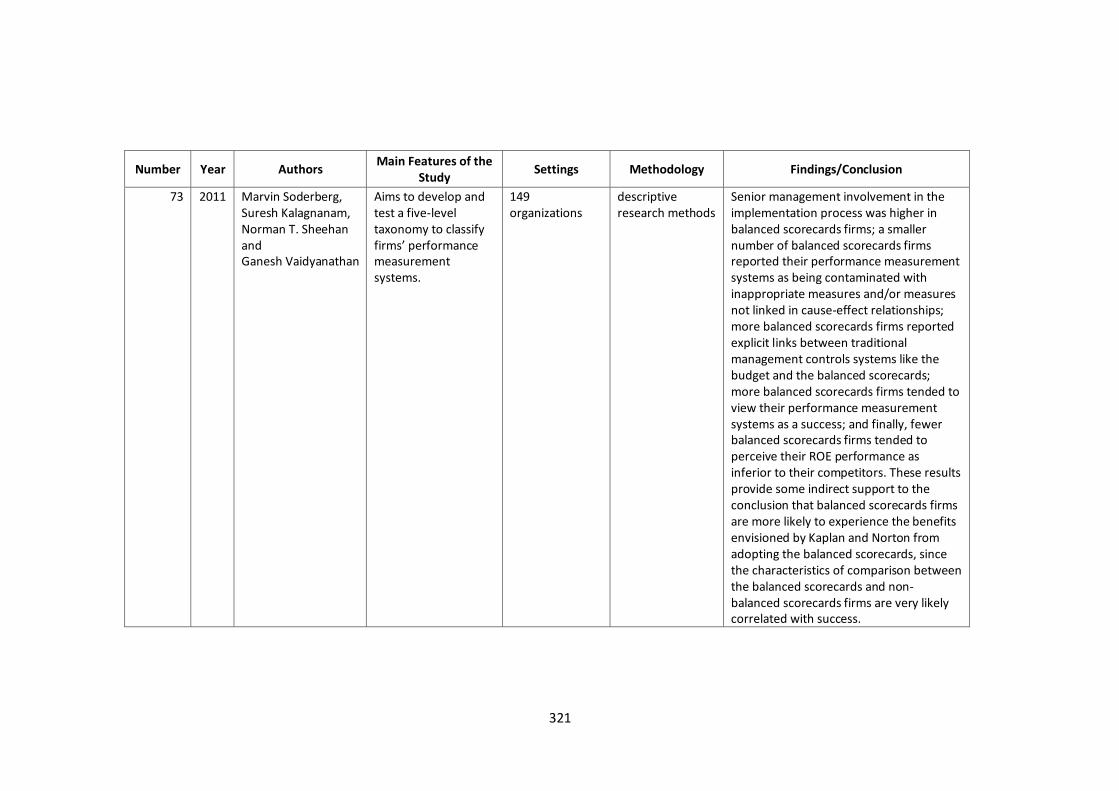
321
Number Year Authors Main Features of the
Study Settings Methodology Findings/Conclusion
73 2011 Marvin Soderberg, Suresh Kalagnanam, Norman T. Sheehan and Ganesh Vaidyanathan
Aims to develop and test a five-level taxonomy to classify firms’ performance measurement systems.
149 organizations
descriptive research methods
Senior management involvement in the implementation process was higher in balanced scorecards firms; a smaller number of balanced scorecards firms reported their performance measurement systems as being contaminated with inappropriate measures and/or measures not linked in cause-effect relationships; more balanced scorecards firms reported explicit links between traditional management controls systems like the budget and the balanced scorecards; more balanced scorecards firms tended to view their performance measurement systems as a success; and finally, fewer balanced scorecards firms tended to perceive their ROE performance as inferior to their competitors. These results provide some indirect support to the conclusion that balanced scorecards firms are more likely to experience the benefits envisioned by Kaplan and Norton from adopting the balanced scorecards, since the characteristics of comparison between the balanced scorecards and non- balanced scorecards firms are very likely correlated with success.

322
Number Year Authors Main Features of the
Study Settings Methodology Findings/Conclusion
74 2011 Rajiv D. Banker, Hsihui Chang and Mina Pizzini
investigate whether a supplemental information display, in the form of a strategy map, results in performance evaluation judgments consistent with the recognition of relations between performance metrics and strategy
180 MBA students
experiment laboratory
Performance evaluation decisions are more consistent with the achievement of strategic objectives when participants are provided with strategy maps.
75 2011 Salvador Carmona , Govind Iyer and Philip M.J. Reckers
biases related to self-interests and national culture persist in the presence of two common strategy maps
140 MBA students from Spain and the U.S.
experiment laboratory
Subjects from individualistic cultures tend to respond differently from subjects from collectivist cultures to a balanced scorecards initiative; importance of well-designed strategy maps if a firm is to truly reap the benefits of the high implementation costs of a balance scorecard initiative. A representationally faithful rendering of a common strategy map (Pyramid map) prompted greater preference for a project proposal that exhibited greater short term financial outcomes than did a second strategy map which included the same goals and metrics.

323
Number Year Authors Main Features of the
Study Settings Methodology Findings/Conclusion
76 2011 Shujun Ding and Philip Beaulieu
links balanced scorecards -related biases, affect, and MCS literature.
One hundred and four MBA students
experiment laboratory
Mood congruent judgments are a reliable phenomenon in an application of the BSC. Financial incentives successfully eliminate mood congruency bias when simplified balanced scorecards with only eight measures, but retaining four perspectives, is employed. mood congruency bias occurs even when only two financial measures are used for evaluation purposes also provides supporting evidence that information load is an important issue to consider in the context of performance evaluations, as the evaluation task itself is complex and cognitively difficult.
77 2011 Zahirul Hoque and Carol Adams
addresses the paucity of prior research in the area of performance measurement in government institutions providing insights into the differences between the public and private sector
Australian Governments
survey data
Government departments make use of balanced scorecard measures for both external compliance (required by government mandates) and internal management purposes). The balanced scorecard performance measures were perceived by government departments to enhance their programme efficiency and programme effectiveness. A positive association between balanced scorecards implementation and managers’ perceived benefits of the balanced scorecards system.
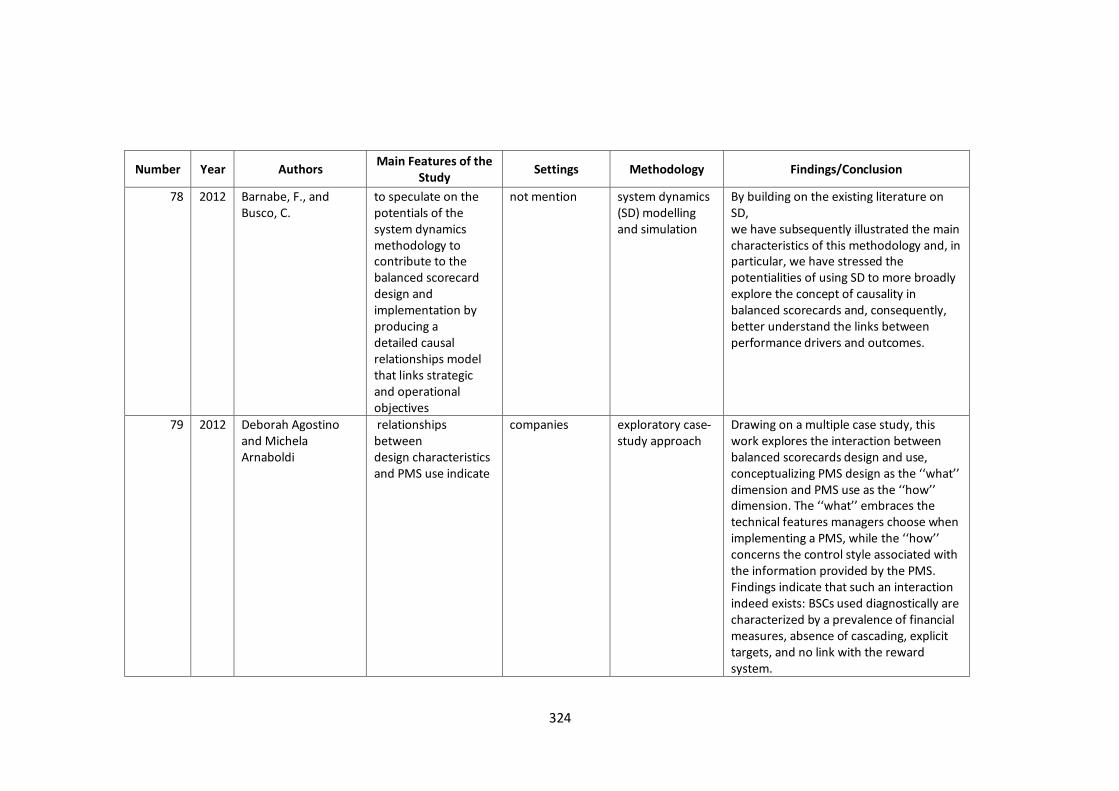
324
Number Year Authors Main Features of the
Study Settings Methodology Findings/Conclusion
78 2012 Barnabe, F., and Busco, C.
to speculate on the potentials of the system dynamics methodology to contribute to the balanced scorecard design and implementation by producing a detailed causal relationships model that links strategic and operational objectives
not mention system dynamics (SD) modelling and simulation
By building on the existing literature on SD, we have subsequently illustrated the main characteristics of this methodology and, in particular, we have stressed the potentialities of using SD to more broadly explore the concept of causality in balanced scorecards and, consequently, better understand the links between performance drivers and outcomes.
79 2012 Deborah Agostino and Michela Arnaboldi
relationships between design characteristics and PMS use indicate
companies exploratory case-study approach
Drawing on a multiple case study, this work explores the interaction between balanced scorecards design and use, conceptualizing PMS design as the ‘‘what’’ dimension and PMS use as the ‘‘how’’ dimension. The ‘‘what’’ embraces the technical features managers choose when implementing a PMS, while the ‘‘how’’ concerns the control style associated with the information provided by the PMS. Findings indicate that such an interaction indeed exists: BSCs used diagnostically are characterized by a prevalence of financial measures, absence of cascading, explicit targets, and no link with the reward system.

325
Number Year Authors Main Features of the
Study Settings Methodology Findings/Conclusion
80 2012 Deryl Northcott and Tuivaiti Ma’amora Taulapapa;
aims to examine the use of the balanced scorecard as a performance management tool in the public sector. Drawing on a New Zealand study of local government organizations (LGOs), it seeks to identify issues and challenges in implementing the balanced scorecards in public sector contexts
73 Local Governments Organizations in New Zealand
A postal questionnaire and follow-up interviews with selected respondents allowed for more in-depth exploration of managers’ experiences of balanced scorecards use and outcomes
Perceived balanced scorecards utility is dominated by performance measurement and reporting, while the performance management role of the balanced scorecards remains relatively underexploited. Identified users’ perceptions of the key challenges impeding balanced scorecards implementation in the public sector, and highlights their significance for both practice and theory.
81 2012 Hanne Nørreklit, Lennart Nørreklit, Falconer Mitchell and Trond Bjørnenak
to explore whether the BSC methodology promotes increased scholarly methodological basis for practice or, in fact, continues to represent a mythical approach to the management discipline
None discourse analysis Reveals that the balanced scorecards is defined in a way that can provide management with a type of general overarching model. However, the model lacks realistic scholarly characteristics and instead it exhibits characteristics of a myth speech genre. This is especially so in the presentation of the central concern with cause-effect statements in the balanced scorecards.

326
Number Year Authors Main Features of the
Study Settings Methodology Findings/Conclusion
82 2012 Hung-Yi Wu structural evaluation methodology to link key performance indicators (KPIs) into a strategy map
Banking institution
Decision Making Trial and Evaluation Laboratory method
The proposed strategy map with the relative influential strengths of KPIs can provide a reference of priority for management in determining strategic improvement paths. Moreover, in addition to weighing the influence among KPIs, management is advised to link up the organization’s strategies with its competencies and to further transform the strategies into significant tasks and results-oriented program services and supports (Hamel & Prahalad, 1996a; Schalock & Bonham, 2003).
83 2012 Kurt Schobel and Cam Scholey
the use of the Balanced Scorecard in a higher education distance learning environment, and to highlight the importance of financial strategies
Royal Military College of Canada
experiment laboratory
Higher education organizations with well-defined financial strategies that are linked to educational outcomes will be well positioned for success even as their funding models change
84 2012 Mandy M. Cheng and Kerry A. Humphreys
causal linkages between strategic objectives in the strategy map and performance measures
89 graduate students enrolled in an advanced managerial accounting course
experiment laboratory
The balanced scorecards framework has broader implications for organizational decision-making. By clearly articulating an organization’s strategy to managers, the strategy map allows managers to form a more useful cognitive representation through which external information items can be interpreted and incorporated in strategic judgments

327
Number Year Authors Main Features of the
Study Settings Methodology Findings/Conclusion
85 2012 Michael L. Werner and Fuyuan Xu
strategy execution not mention explorative study The balanced scorecard helps enterprise leaders manage their operations and helps them execute their strategy. Strategy maps help inform employees of the company’s strategy and objectives. However, even if employees are aware of the company’s strategy and its objectives, they will generally do little to achieve strategy execution.
86 2012 Niels Dechow how further empirical research may be advanced, which differentiates more clearly what we study when exploring balanced scorecards work
training program a discussion of observations
The ways in which managers disconnect the balanced scorecards objects and concept are everything but benign.
87 2012 Nopadol Rompho the effect of a strategy map on the quality of decision making
24 MBA students
experiment laboratory
The results show that strategy maps do not affect the performance of participants’ decision making.
88 2013 Arwa Yousuf Al-Aama strategic objectives as a nonprofit function of a public service organization
Jeddah Municipality (JM) IT Department
explorative study The adaptation of the JM balanced scorecards variation can be used as a model for other public service organizations in strategy management and performance evaluation. Furthermore, the JM IT Strategy is managed using the JM IT balanced scorecards. It has been used for the past three years and has been a very valuable tool.

328
Number Year Authors Main Features of the
Study Settings Methodology Findings/Conclusion
89 2013 Benjamin Dreveton the scorecard creation process itself
a French public sector
case study method
The balanced scorecards provided a reason to clarify organizational strategy; to improve how this organization works and to develop a new role for the controller. The balanced scorecards project provided an opportunity to innovate.
90 2013 LI Me and WU Jiang particularity and difficulties of government departments applying balanced scorecards
local governments
comparative analysis
The balanced scorecards is of great significance for the government performance management innovation mode. Local governments should regard service-oriented government as the strategic target to practice the balanced scorecards, and construct performance management index system of mutual promotion and development, including four dimensions of the public service ability, financial, and learning and growth around the basic principle of public satisfied.
91 2013 Sangjae Lee, Sung Bum Park and Gyoo Gun Lim
causal relationships among the four balanced scorecards measurements
Small & Medium Business Administration in Korea
Quantitative (survey data)
The balanced scorecards effectively assess four causally interrelated measures, namely learning and growth, internal business processes, customer performance, and financial performance, supporting the core premise of the balanced scorecards.
92 2014 Behrouzi, Farshad ; Shaharoun, Awaluddin and
Four critical attributes of each article were analyzed, including
health sector Literature review The results showed that 'internal business process' was the most notable balanced scorecards perspective as it was included

329
Number Year Authors Main Features of the
Study Settings Methodology Findings/Conclusion
Ma'Aram, Azanizawati
balanced scorecards generation, performance perspectives, performance indicators and auxiliary tools
in all reviewed articles. The cascaded balanced scorecards is a useful form of the balanced scorecards to facilitate performance measurement and strategic management processes within such large organizations. Strategic alignment and implementing organizational strategies using the balanced scorecards has been taken into consideration by healthcare executives in recent years.
93 2014 Dag Øivind Madsen and Tonny Stenheim
The perceived benefits of balanced scorecards implementation and usage.
consultants and users in Scandinavian countries
a largely qualitative and interpretive approach
Both consultants and users mostly highlighted benefits related to social and organizational processes, and not the ‘technical’ aspects of the concept. Many of the benefits are related to more indirect organizational and behavioral effects.

330
Appendix 2
Research Setting Comparison
Number Year Authors Sectors Organization
Level Observed Country
Classification of Countries (based on
April 2011 World Economic Outlook 2011)*
1 2000 Hoque and James
Sixty six manufacturing companies
One level Australia Advanced Economy
2 2000 Kloot and Martin
local government organizations in the State of Victoria
One level Australia Advanced Economy
3 2001 Ahn Worldwide supplier of automation products
One level Germany Advanced Economy
4 2001 Aidemark Jonkoping County Council One level Sweden Advanced Economy
5 2001 Epstein and Wisner
companies One level Norway, USA and UK
Advanced Economy
6 2001 Malina and Selto
a U.S. Fortune 500 company with more than 25,000 employees
One level USA Advanced Economy
7 2001 Malmi Seventeen organisations known to have adopted balanced scorecards
One level Finland Advanced Economy
8 2001 Wisniewski and Dickson
Dumfries and Galloway Constabular Police
One level Scotland Advanced Economy
9 2002 Inamdar and Kaplan
Nine healthcare provoiders One level USA Advanced Economy
10 2002 Irwin Small business service One level UK Advanced Economy
11 2002 Kasurinen A multinational Finnish based metals group
One level Finland Advanced Economy

331
Number Year Authors Sectors Organization
Level Observed Country
Classification of Countries (based on
April 2011 World Economic Outlook 2011)*
12 2003 Speckbacher, et al
publicly traded firms One level Germany, Austria and Switzerland Advanced Economies
13 2003 Griffiths One government department and two Crown entities
One level New Zealand
Advanced Economy
14 2003 Ittner, et al 140 US financial services firms One level USA Advanced Economy
16 2003 Mcadam and Walker
Thirteen local government authorities One level UK
Advanced Economy
17 2003 Radnor and Lovell
Bradford health sector One level UK Advanced Economy
18 2003 Reisinger, et al Consulting company One level European country Advanced Economy
19 2004 Braam and Nijssen
100 business-to-business companies One level Netherlands Advanced Economy
20 2004 Chan municipal governments One level USA and Canada Advanced Economy
21 2004 Davis and Albright
A banking organization in banking organization located in the southeastern United States
One level USA
Advanced Economy
22 2004 Papalexandris, et al
Software Development Company One level Greece Advanced Economy
23 2004 Wisniewski and O ´ lafsson
Public sector organizations One level Scotland and Iceland Advanced Economy

332
Number Year Authors Sectors Organization
Level Observed Country
Classification of Countries (based on
April 2011 World Economic Outlook 2011)*
24 2005 Akkermans and van Oorschot
A business unit of the Dutch insurer Interpolis
One level Netherlands Advanced Economy
25 2005 Chow Yang, et al
Hospitals One level Taiwan Emerging Economy
26 2005 Michalska A company of steel works One level Poland Emerging Economy
27 2005 Park ,et al Company One level Korea Emerging Economy
28 2006 Chan Twelve hospitals One level Canada Advanced Economy
29 2006 Decoene and Bruggeman
A company producer of polyolefin plastic
One level Denmark Advanced Economy
30 2006 Holmes,et al City of Charlotte, Washington State, thirteen Local government of UK, Swedish National Police Board, New Zealand crown cities, and State of Victoria
One level USA, UK, Sweden Autralia and New Zealand Advanced Economy
31 2007 Chavan Company One level Australia Advanced Economy
32 2007 Greatbanks and Tapp
A public service city council One level New Zealand Advanced Economy
33 2007 Lilian Chan Ontario Health Quality Council One level Canada Advanced Economy
34 2007 Park and Huber Hospitals One level USA Advanced Economy
35 2008 Gurd and Gao Health sector One level USA, UK, Sweden, Australia, New Zealand, Canada and Taiwan
Advanced Economies except for Taiwan (Emerging
Economy)
36 2008 Bianchia and Montemaggiore
City water company One level Italy Advanced Economy

333
Number Year Authors Sectors Organization
Level Observed Country
Classification of Countries (based on
April 2011 World Economic Outlook 2011)*
37 2008 Crabtree and,DeBusk
Member of Institute Management Accountants
One level USA Advanced Economy
38 2008 Kasperkaya Two city councils One level Spain Advanced Economy
39 2008 Witcher and Chau
EDF Energy and Tesco One level UK Advanced Economy
40 2008 Woods and Grubnic
Hertfordshire County One level UK Advanced Economy
41 2008 Cheng Chang , et al
Mackay Memorial Hospital One level Taiwan Emerging Economy
42 2008 Rhodes, et al Central Bank One level Indonesia Emerging Economy
43 2009 De Geuser, et al
Twenty four organizations One level Switzerland, UK, Germany, Austria, France and Netherlands.
Advanced Economies
44 2009 Ana Yetano Brisbane and Melbourne One level Australia Advanced Economy
45 2009 Wiersma Nineteen Dutch firms One level Netherlands Advanced Economy
46 2009 Ching Yuan , Chaochang Chiu
Company One level Taiwan Emerging Economy
47 2009 Farneti Local government One level Italy Emerging Economy
48 2010 Burney and.Swanson
Accounting managers in BSC firms One level USA Advanced Economy
49 2010 Greiling Twenty organizations in German One level German Advanced Economy
50 2010 Kraus and Lind Fifteen Multi-national companies One level Sweden Advanced Economy
51 2010 Nilsson Municipality One level Sweden Advanced Economy

334
Number Year Authors Sectors Organization
Level Observed Country
Classification of Countries (based on
April 2011 World Economic Outlook 2011)*
52 2010 Guimarães, et al Urban waste sector One level Portugal Emerging Economy
53 2011 Hoque and Adams
Government organizations One level Australia Advanced Economy
54 2011 Sharma and Gadenne
Local government authority One level Australia Advanced Economy
55 2011 Soderberg, et al 149 organizations One level Canada Advanced Economy
56 2011 Ling Lee and Jung Yang
667 firms listed on the Taiwan Stock Exchange
One level Taiwan Emerging Economy
57 2012 Agostino and Arnaboldi
Companies One level Italy Advanced Economy
58 2012 Northcott and Taulapapa
73 Local Governments Organizations One level New Zealand Advanced Economy
59 2013 Dreveton A public sector One level France Advanced Economy
60 2013 Al-Aama Jeddah Municipality (JM) IT Department
One level Saudi Arabia Emerging Economy
61 2013 Lee, et al Small & Medium Business Administration
One level Korea Emerging Economy
62 2013 LI Me and WU Jiang
Local governments One level Canada Emerging Economy
63 2014 Madsen and Stenheim
Consultants and clients One level Sweden, Norway and Denmark Advanced Economies

335
Number Year Authors Sectors Organization
Level Observed Country
Classification of Countries (based on
April 2011 World Economic Outlook 2011)*
64 2014 Behrouzi, et al Health sector One level USA,UK, Sweden, Australia, New Zealand, Germany, Greece, Singapore, Spain, Taiwan, Italy, Pakistan, Lebanon
USA,UK, Sweden, Australia, New Zealand, Germany, Greece,
Sweden, Norway, Denmark and Spain are Advanced Economies, while Singapore and Taiwan are
Emerging Economies and Pakistan and Lebanon are Other
Emerging Economies
*Rees (2013)

336
Appendix 3a
Questionnaire
(in Indonesian Language)
Kuesioner Survei
Performance Management Systems based on the Balanced Scorecards Framework: The Case of Indonesian
Customs and Excise Organizations
The University of Manchester, United Kingdom
Kuisioner ini terdiri dari dua bagian, yaitu data responden dan pernyataan kuisioner, yang semuanya wajib
diisi. Dalam pengisian kusioner ini, dimohon agar Anda memperhatikan petunjuk yang diberikan dalam setiap
pertanyaan.
A. DATA RESPONDEN
Petunjuk pengisian Data Responden:
- Gunakan tinta hitam atau biru untuk menulis
- Setiap pertanyaan dalam Data Responden wajib untuk diisi
- Beri tanda (√) pada kotak yang relevan, sesuai dengan instruksi pertanyaan
- Isilah titik-titik dengan huruf cetak untuk menjawab pertanyaan
1. Nama Kantor (Isilah dengan nama kantor bea dan cukai tempat Anda bekerja saat ini) ………………………………………………………………………………………………………………………………………… 2. Jabatan Anda (Beri tanda (√) pada satu kotak saja)
Pelaksana
Pejabat Fungsional Pemeriksa Dokumen
Eselon V
Pejabat Eselon IV
Pejabat Eselon III
3. Golongan Anda (Beri tanda (√) pada satu kotak saja)
Golongan II

337
Golongan III
Golongan IV
4. Usia Anda (Beri tanda (√) pada satu kotak saja)
18 s.d 30 Tahun
Lebih dari 30 s.d 45 Tahun
Lebih dari 45 s.d 50 Tahun
Lebih dari 50 s.d 55 Tahun
Lebih dari 55 Tahun
5. Tingkat Pendidikan terakhir Anda (Beri tanda (√) pada satu kotak saja)
SMA/SMK
D1
D3
D4/S1
S2
S3
6. Sudah berapa lama Anda bekerja di Kantor ini (Beri tanda (√) pada satu kotak saja)
kurang dari 1 tahun
1 tahun s.d 2 tahun
lebih dari 2 tahun s.d 5 tahun
lebih dari 5 tahun s.d 10 tahun
lebih dari 10 tahun
7. Jenis Kelamin (Beri tanda (√) pada satu kotak saja)
Laki-laki
Wanita

338
B. PERNYATAAN KUESIONER
Petunjuk pengisian kuisioner:
- Skala yang digunakan adalah skala 1- 7.
- Beri tanda (√) pada skala yang menurut Anda paling sesuai.
- Setiap pernyataan kuesioner wajib untuk diisi.
- Pada setiap nomor pernyataan, agar hanya diisi dengan satu jawaban.
No Pernyataan Sangat Tidak
Setuju
Tidak Setuju
Agak Tidak
Setuju
Ragu-ragu
Agak Setuju
Setuju Sangat Setuju
1 2 3 4 5 6 7
1. Saya bangga dapat menceritakan kepada orang tentang kantor tempat saya bekerja.
2. Apa yang dilakukan oleh kantor ini penting bagi saya.
3. Saya dan Kantor memiliki tujuan yang sama.
4. Saya memiliki rasa kepemilikan yang kuat terhadap kantor ini.
5. Saya merasa bagian dari keluarga dalam Kantor ini.
6. Orang yang bekerja dengan saya di kantor ini peduli terhadap apa yang terjadi pada saya.
7. Kantor ini memberi apresiasi terhadap pencapaian kerja saya.
8. Kantor ini melakukan semua yang bisa dilakukan untuk mengenali karyawan atas kinerja mereka yang baik.
9. Upaya kerja saya sangat dihargai oleh Kantor ini.
10. Pekerjaan yang saya lakukan sebagai pegawai bea cukai di kantor ini sangat penting bagi saya.
11. Saya tidak takut membela untuk hak orang lain walaupun itu berarti saya akan dicemoohkan.
12. Membuat perbedaan dalam masyarakat bagi saya berarti lebih dari pencapaian pribadi.
13. Saya siap membuat pengorbanan besar untuk kebaikan masyarakat.

339
No Pernyataan Sangat Tidak
Setuju
Tidak Setuju
Agak Tidak
Setuju
Ragu-ragu
Agak Setuju
Setuju Sangat Setuju
1 2 3 4 5 6 7
14. Saya sering diingatkan oleh peristiwa sehari-hari tentang betapa tergantungnya kita satu sama lain.
15. Pimpinan Kantor mengedukasi saya tentang pengelolaan kinerja berdasarkanBalanced Scorecards
16. Pimpinan Kantor memberikan informasi yang memadai tentang sasaran strategi kantor
17. Saya mengetahui semua Sasaran Strategi Organisasi(Kantor)
18. Kepala Kantor memotivasi saya untuk mencapai target IKU saya
19. Atasan langsung saya membimbing saya secara aktif dalam pencapaian target kinerja
20. Atasan langsung saya memonitor kinerja saya melalui Indikator Kinerja Utama (IKU) yang saya miliki
21. Peta strategi Kantor (strategy map) membantu saya untuk memahami lebih baik Sasaran Strategis yang ingin dicapai oleh Kantor
22. Saya mengetahui semua IKU yang dimiliki oleh Kantor
23. Saya mengetahui semua target IKU yang dimiliki oleh Kantor
24. IKU saya berhubungan dengan sasaran strategis Kantor
25. IKU Kantor telah diturunkan ke unit-unit kerja di bawahnya dengan memperhatikan tugas dan fungsi unit kerja masing-masing

340
No Pernyataan Sangat Tidak
Setuju
Tidak Setuju
Agak Tidak
Setuju
Ragu-ragu
Agak Setuju
Setuju Sangat Setuju
1 2 3 4 5 6 7
26. Target IKU Kantor diturunkan ke unit-unit kerja di bawahnya dengan secara proporsional
27. IKU saya selaras dengan unit/pegawai lain pada level yang sama
28. IKU saya selaras dengan IKU Kantor
29. IKU saya memiliki kualitas yang baik
30. Target IKU saya realistis
31. Target IKU saya mendukung tercapainya target IKU Kantor
32. Terdapat komunikasi/dialog yang aktif antara Saya dengan Atasan Langsung dalam penentuan IKU saya
33. Terdapat komunikasi/dialog yang aktif antara Saya dengan Atasan Langsung dalam penentuan target untuk IKU saya
34. Terdapat sistem imbal jasa (reward system) yang objektif yang dikaitkan dengan pencapaian target IKU saya
35. Pengembangan kompetensi saya dihubungkan dengan sasaran strategi Kantor
36. Pelaporan capaian IKU didukung oleh aplikasi teknologi yang handal
37. Pelaporan capaian IKU didukung oleh tata cara yang mudah dipahami
38. Pelaporan capaian IKU mewajibkan penyampaian bukti data capaian
Pernyataan Nomor 39 s.d 62 di bawah ini: hanya diisi oleh Pejabat Eselon IV dan Pejabat Fumgsional Pemeriksa Dokumen
39. Kepala Kantor terlibat aktif dalam memformulasikan sasaran strategi kantor

341
No Pernyataan Sangat Tidak
Setuju
Tidak Setuju
Agak Tidak
Setuju
Ragu-ragu
Agak Setuju
Setuju Sangat Setuju
1 2 3 4 5 6 7
40. Kepala Kantor terlibat aktif dalam menentukan IKU Kantor
41. Kepala Kantor menentukan target IKU Kantor yang menantang
42. Kepala Kantor selalu memimpin pertemuan rapat pembahasan IKU
43. Kepala Kantor menyemangati pegawai untuk mengidentifikasi strategi di unit kerja yang mempunyai dampak paling tinggi terhadap tercapainya sasaran strategi Kantor.
Metode menyemangati pegawai dapat melalui: surat edaran, lisan dalam rapat kantor, dan/atau apada saat upacara/apel.
44. Kepala Kantor menerangkan semua Sasaran Strategis beserta IKU dan target IKU Kantor pada awal tahun fiskal kepada seluruh Pegawai.
Metode menyemangati pegawai dapat melalui: surat edaran, lisan dalam rapat kantor, dan/atau apada saat upacara/apel.
45. Kepala Kantor terlibat secara aktif untuk internalisasi/sosialisasi balanced scorecards kepada seluruh Pegawai
46. Peta strategi organisasi yang dimiliki Kantor (strategy map) merefleksikan sasaran strategi Kantor
47. Peta strategi mencakup seluruh isu aktual strategis yang dihadapi Kantor
48. Saya memahami dengan baik sasaran strategi Kantor
49. Setiap IKU Kantor telah memiliki penanggung jawab yang tepat
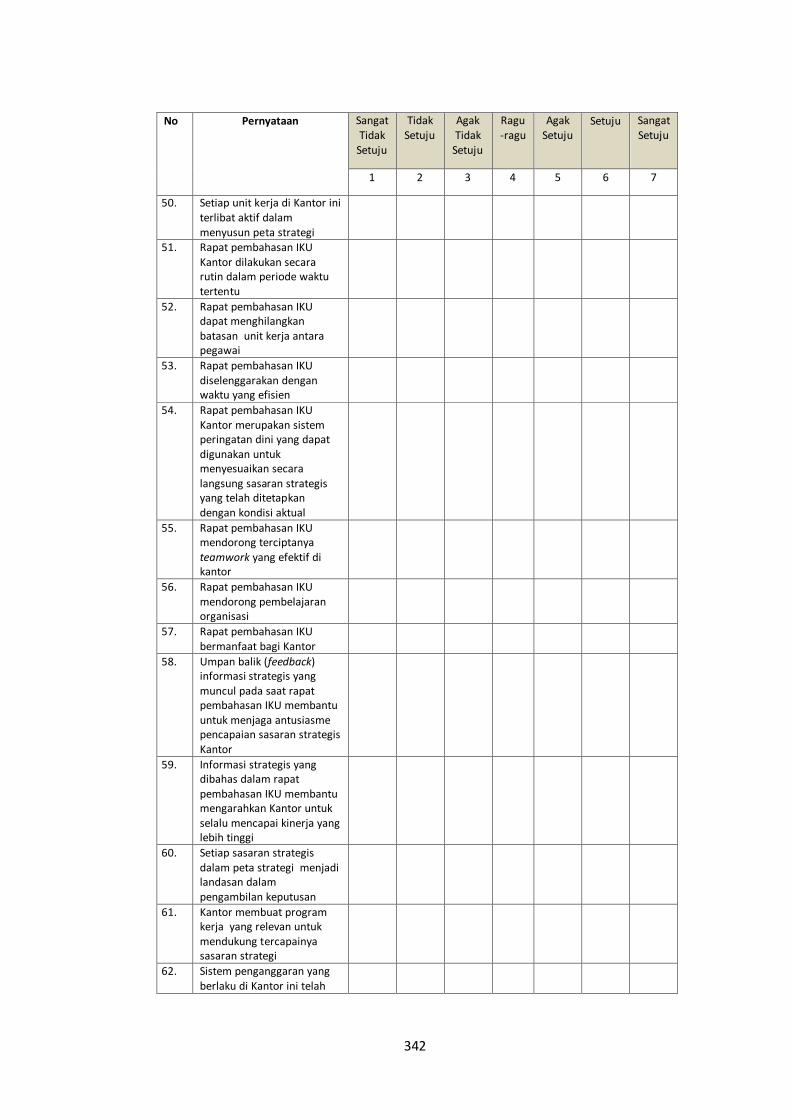
342
No Pernyataan Sangat Tidak
Setuju
Tidak Setuju
Agak Tidak
Setuju
Ragu-ragu
Agak Setuju
Setuju Sangat Setuju
1 2 3 4 5 6 7
50. Setiap unit kerja di Kantor ini terlibat aktif dalam menyusun peta strategi
51. Rapat pembahasan IKU Kantor dilakukan secara rutin dalam periode waktu tertentu
52. Rapat pembahasan IKU dapat menghilangkan batasan unit kerja antara pegawai
53. Rapat pembahasan IKU diselenggarakan dengan waktu yang efisien
54. Rapat pembahasan IKU Kantor merupakan sistem peringatan dini yang dapat digunakan untuk menyesuaikan secara langsung sasaran strategis yang telah ditetapkan dengan kondisi aktual
55. Rapat pembahasan IKU mendorong terciptanya teamwork yang efektif di kantor
56. Rapat pembahasan IKU mendorong pembelajaran organisasi
57. Rapat pembahasan IKU bermanfaat bagi Kantor
58. Umpan balik (feedback) informasi strategis yang muncul pada saat rapat pembahasan IKU membantu untuk menjaga antusiasme pencapaian sasaran strategis Kantor
59. Informasi strategis yang dibahas dalam rapat pembahasan IKU membantu mengarahkan Kantor untuk selalu mencapai kinerja yang lebih tinggi
60. Setiap sasaran strategis dalam peta strategi menjadi landasan dalam pengambilan keputusan
61. Kantor membuat program kerja yang relevan untuk mendukung tercapainya sasaran strategi
62. Sistem penganggaran yang berlaku di Kantor ini telah

343
No Pernyataan Sangat Tidak
Setuju
Tidak Setuju
Agak Tidak
Setuju
Ragu-ragu
Agak Setuju
Setuju Sangat Setuju
1 2 3 4 5 6 7
dikaitkan dengan balanced scorecards
Terima kasih atas Partisipasi Anda
untuk Mengisi Kuisioner ini

344
PROFIL UMUM KANTOR BEA CUKAI
Petunjuk pengisian:
- Pengisian dilakukan oleh Kepala Kantor
- Gunakan tinta hitam atau biru untuk menulis
- Setiap pertanyaan wajib diisi
- Isilah titik-titik dengan huruf cetak untuk menjawab pertanyaan
- Jika dianggap perlu, maka tiap jawaban dapat dilampiri oleh data hardcopy/softcopy
1. Nama Kantor: ……………………………………………………………..
2. Jumlah Pegawai di Kantor ini: …………………………………….. Pegawai
3. Usia Anda (Beri tanda (√) pada satu kotak saja)
30 s.d 35 Tahun
Lebih dari 35 s.d 40 Tahun
Lebih dari 40 s.d 45 Tahun
Lebih dari 45 s.d 50 Tahun
4. Lebih dari 50 s.d 55 Tahun
4. Tingkat Pendidikan terakhir Anda (Beri tanda (√) pada satu kotak saja)
SMA/SMK
D1
D3
D4/S1
S2
5. S3

345
1. Jenis Kelamin (Beri tanda (√) pada satu kotak saja)
Laki-laki
Wanita
6. Tuliskan kinerja (realisasi) dalam bentuk prosentase capaian atas total penerimaan (total bea
masuk/cukai dan/atau bea keluar) Kantor yang dimulai dari 1 tahun sebelum (t-1)
implementasi balanced scorecards s.d tahun 2015.
t-1 t t+1 t+2 t+3 t+4 t+5
Sebagai ilustrasi, jika balanced scorecards diimplementasikan pada tahun 2010 (t) di Kantor
Anda, maka data yang disampaikan adalah persentase realisasi penerimaan sejak tahun
2009(t-1) .
Contoh ilustrasi:
2009 2010 2011 2012 2013 2014 2015
102% 99% 110% 100.8% 103% 108% 106%
7. Tuliskan kinerja (realisasi) Indeks Kepuasaan Pengguna Jasa Kantor yang dimulai dari 1 tahun
sebelum (t-1) implementasi balanced scorecards s.d tahun 2015.
t-1 t t+1 t+2 t+3 t+4 t+5
Sebagai ilustrasi, jika balanced scorecards diimplementasikan pada tahun 2010 di Kantor
Anda, maka data yang disampaikan adalah sejak tahun 2009.
Contoh ilustrasi:
2009 2010 2011 2012 2013 2014 2015
55 57 60 61 65 70 74

346
Appendix 3b
Questionnaire
(Translated into English)
- The questionnaire uses the 7‐point Likert scale.
- The responses ranges from 1 (Strongly disagree) to 7 (strongly agree)
Organizational Commitment (OC)
1. I am quite proud to be able to tell people what organization I work for.
2. What this organization stands for is important to me.
3. My organization and I are the same; therefore the destiny of my organization is
also my own destiny
4. I feel a strong sense of belonging to this organization
5. I feel like part of family at this organization
6. The people I work with care about what happens to me
7. This organization appreciates my accomplishment on the job
8. This organization does all it can to recognize employees for their good
performance
9. My effort on the job is largely appreciated by this organization
Public Service Motivation (PSM)
1. The work I do as a civil servant on my job is very important to me
2. I am not afraid to defend for the rights of others even if it means I will be
ridiculed
3. Making a difference in society means more to me than personal achievements
4. I am prepared to make enormous sacrifices for the good of society
5. I am often reminded by daily events about how dependent we are on one
another

347
Strategy Translation to operational terms (ST)
1. Our organisation’s strategy map helps me to better understand our
organisation’s strategic objectives
2. I know all about our organisation’s KPIs
3. I know all about our organisation’s KPI targets
4. My KPIs relate to the organisation’s strategic objectives
5.
Organization Strategy Alignment (SA)
1. The organisational KPIs are cascaded proportionately
2. The organisational KPI targets are cascaded proportionately
3. My KPIs are aligned with those of other colleagues at the same level
Make strategy everyone’s everyday job (SJ)
1. My KPIs are in line with the organisational KPIs
2. I have good quality KPIs
3. My KPI targets are realistic
4. My KPI targets support the accomplishment of organisational targets
5. There is active dialogue with my direct supervisor when determining my
KPIs
6. There is active dialogue with my direct supervisor when determining my
KPI targets
7. The rewards system is linked to KPI target achievement
Strategy as a continous process (SP)
1. My competence development is aligned with organisational strategy
2. BSC management is supported with sound information technology
3. I find the performance reporting procedure easily understandable
4. Performance reporting requires solid proof

348
Change mobilization through executive leadership/ leadership involvement (LI)
1. The head of the organisation educates me about performance
management based on the BSC
2. The head of the organisation provides sufficient information regarding
the organisation’s strategies and goals
3. I know all about our organisation’s objectives
4. The head of the organisation motivates me to accomplish my targets
5. My direct supervisor actively guides me to reach my performance goals
6. My direct supervisor monitors my performance through my KPIs

349
Appendix 4
Consent Form
Balanced Scorecards as a Performance Management System in Government
Organization of an Emerging Economy Country: an Empirical Evidence of Balanced
Scorecards Implementation in Indonesia
CONSENT FORM
If you are happy to participate please complete and sign the consent form
below.
Please initial box
I agree to take part in the above project
Name of participant
Date Signature
1. I confirm that I have read the attached
information sheet on the above project and
have had the opportunity to consider the
information and ask questions and had these
answered satisfactorily.
2. I understand that my participation in the study is voluntary and
that I am free to withdraw at any time without giving a reason
and without detriment to my treatment/service/self.

350
Name of researcher
Date Signature
This Project Has Been Approved by the University of Manchester’s Research Ethics
Committee [UREC reference number].

351
Appendix 5
Performance Management Systems based on
the Balanced Scorecards Framework:
The Case of Indonesian Customs and Excise Organizations
Lembar Informasi Peserta
Saya mengundang Anda untuk mengambil bagian dalam studi yang merupakan bagian dari thesis PhD saya. Proyek riset ini bertujuan untuk menginvestigasi bagaimana penggunaan balances scorecards sebagai manajemen kinerja mempengaruhi aspek-aspek kinerja organisasi dan menemukan factor-faktor utama yang mendukung implementasi balanced scorecards dalam organisasi sector publik dari sebuah negara berkembang yaitu Indonesia.
Sebelum Anda memutuskan untuk berpartisipasi, penting bagi Anda untuk memahami mengapa penelitian ini dilakukan dan apa yang akan terlibat. Bacalah dengan seksama informasi di bawah ini dan diskusikan dengan orang lain bila Anda ingin. Silahkan bertanya bila ada hal-hal yang tidak jelas atau bila Anda memerlukan tambahan informasi. Jangan buru-buru untuk memutuskan apakah Anda ingin berpartisipasi. Terima kasih banyak atas waktu yang Anda luangkan untuk membaca lembar ini.
Siapa yang akan melakukan penelitian ini?
Penelitian ini akan dilakukan olrh Saut Mulia Simbolon, kandidat PhD; Institute for Development Policy and Management; School of Environment, Education and Development, The University of Manchester, United Kingdom.
Apa tujuan penelitian ini?
Tujuan penelitian ini adalah:
1. Mereview perpsektif teoritis, praktis dan keterbatasan implementasi balanced scorecards 2. Menginvestigsi faktor utama yang mempengaruhi implementasi balanced scorecards 3. Membuat kerangka konseptual dari korelasi antara implementasi balanced scorecards dan
kinerja organisasi 4. Melakukan tes empiris sebuah kerangka konseptual
Mengapa saya dipilih?
Anda adalah satu dari 1758 responden yang terpilih untuk proyek penelitian ini. Proyek riset ini menggunakan stratified random sampling, karena itu Anda terpilih untuk merepresentasikan pendapat dari karyawan lain dari tingkat yang sama.
Apa yang akan ditanyakan kepada saya bila saya ikut serta?

352
Anda akan diberi serangkaian pertanyaan yang berhubungan dengan prinsip balanced scorecard, aspek-aspek komitmen organisasi dan aspek-aspek motivasi jasa publik.
Apa yang terjadi dengan data yang dikumpulkan?
Data akan digunakan untu tujuan penelitian tesis, konferensi riset internasional dan pulbikasi jurnal akademis.
Bagaimana kerahasiaan terjaga?.
Semua peserta dijaga kerahasiaannya dengan menggunakan anonym. Data peserta akan disimpan dalam encrypted laptop peneliti yang tidak dapat diakses oleh siapapun.
Apa yang terjadi bila saya tidak ingin turut serta atau bila saya berubah pikiran?
Keputusan ada di tangan Anda apakah Anda akan ikut serta atau tidak. Bila Anda memutuskan untuk ikut serta Anda akan diberikan lembar informasi ini untuk Anda simpan dan Anda diminta untuk menandatangani formulir pernyataan.
Apakah Anda dibayar untuk ikut berpartisipasi dalam riset ini?
Partisipasi dalam riset ini adalah berbasis sukarela, karena itu tidak ada pembayaran yang diberikan.
Berapa lama penelitian ini?
Diperkirakan 45 menit.
Dimana penelitian akan dilakukan?
Penelitian akan dilakukan di Kantor Anda.
Apakah outcome riset akan dipublikasikan?
Hasil riset akan digunakan untuk tesis PhD, dan publikasi jurnal akademik.
Bagaimana bila terjadi kesalahan?
Hubungi:
Saut Mulia Simbolon
Institute for Development Policy and Management
School of Environment, Education and Development
The University of Manchester
Oxord Road, Manchester, M13 9PL

353
United Kingdom
Tel: +44 07741 367 345 (UK)
+62 021 780 1643 (INA)
Email: [email protected]
Bagaimana kalau saya ada keluhan?
Bila ada masalah yang berhubungan dengan riset ini, silahkan hubungi peneliti, dengan alamat
lengkap sebagai berikut:
Saut Mulia Simbolon
Institute for Development Policy and Management
School of Environment, Education and Development
The University of Manchester
Oxord Road, Manchester, M13 9PL
United Kingdom
Tel: +44 07741 367 345 (UK)
+62 021 780 1643 (INA)
Email: [email protected]
Namun, bila Anda lebih suka tidak mendiskusikannya dengan tim riset, silahkan hubungi:
Dr Chris Rees
Email : [email protected]
Bila Anda ingin membuat keluhan secara formal tentang penyelenggaraan riset ini Anda dapar
menghubungi Research Governance and Integrity Manager, Research Office, Christie Building,
University of Manchester, Oxford Road, Manchester, M13 9PL, dengan mengirim email ke:
[email protected] atau menelepon 0161 275 2674or 2758093.
Bagaimana saya mengontak Anda?

354
Saut Mulia Simbolon
Institute for Development Policy and Management
School of Environment, Education and Development
The University of Manchester
Oxord Road, Manchester, M13 9PL
United Kingdom
Tel: +44 07741 367 345 (UK)
+62 021 780 1643 (INA)
Email: [email protected]
Proyek ini telah disetujui oleh the University of Manchester’s Research Ethics Committee [UREC
reference number].

355
Appendix 6
Shapiro-Wilk W test for Normal Data
Variable Obs W V z Prob>z
li1 1663 0.940 59.942 10.341 0.000
li2 1668 0.938 62.550 10.450 0.000
li3 1663 0.955 44.677 9.599 0.000
li4 1665 0.945 55.458 10.145 0.000
li5 1666 0.912 79.079 11.042 0.000
li6 1669 0.926 74.458 10.891 0.000
st1 1663 0.954 45.831 9.663 0.000
st2 1661 0.960 40.711 9.364 0.000
st3 1656 0.960 40.072 9.323 0.000
st4 1657 0.939 61.668 10.412 0.000
sa1 1664 0.958 41.767 9.429 0.000
sa2 1663 0.953 46.606 9.706 0.000
sa3 1663 0.926 73.674 10.863 0.000
sj1 1662 0.946 53.634 10.060 0.000
sj2 1661 0.955 45.250 9.631 0.000
sj3 1660 0.925 75.161 10.912 0.000
sj4 1660 0.949 51.095 9.937 0.000
sj5 1663 0.918 82.079 11.135 0.000
sj6 1663 0.922 78.015 11.007 0.000
sj7 1661 0.932 68.378 10.674 0.000
sp1 1662 0.934 66.527 10.605 0.000
sp2 1660 0.933 66.545 10.605 0.000
sp3 1661 0.921 79.007 11.039 0.000
sp4 1661 0.928 72.386 10.818 0.000

356
Appendix 7
Skewness/Kurtosis tests for Normality
------ joint ------ Variable | Obs Pr(Skewness) Pr(Kurtosis) adj chi2(2) -------------+--------------------------------------------------------------- st1 | 1,662 0.0000 0.0000 . 0.0000 st2 | 1,660 0.0000 0.5012 . 0.0000 st3 | 1,655 0.0000 0.9337 . 0.0000 st4 | 1,656 0.0000 0.0000 . 0.0000 sa1 | 1,663 0.0000 0.0000 . 0.0000 sa2 | 1,662 0.0000 0.0000 . 0.0000 sa3 | 1,662 0.0000 0.0000 . 0.0000 sj1 | 1,661 0.0000 0.0000 . 0.0000 sj2 | 1,660 0.0000 0.0000 . 0.0000 sj3 | 1,659 0.0000 0.0000 . 0.0000 sj4 | 1,659 0.0000 0.0000 . 0.0000 sj5 | 1,662 0.0000 0.0000 . 0.0000 sj6 | 1,662 0.0000 0.0000 . 0.0000 sj7 | 1,660 0.0000 0.0000 . 0.0000 sp1 | 1,661 0.0000 0.0000 . 0.0000 sp2 | 1,659 0.0000 0.0000 . 0.0000 sp3 | 1,660 0.0000 0.0000 . 0.0000 sp4 | 1,660 0.0000 0.0000 . 0.0000 li1 | 1,662 0.0000 0.0000 . 0.0000 li2 | 1,667 0.0000 0.0000 . 0.0000 li3 | 1,662 0.0000 0.0000 . 0.0000 li4 | 1,664 0.0000 0.0000 . 0.0000 li5 | 1,665 0.0000 0.0000 . 0.0000 li6 | 1,668 0.0000 0.0000 . 0.0000
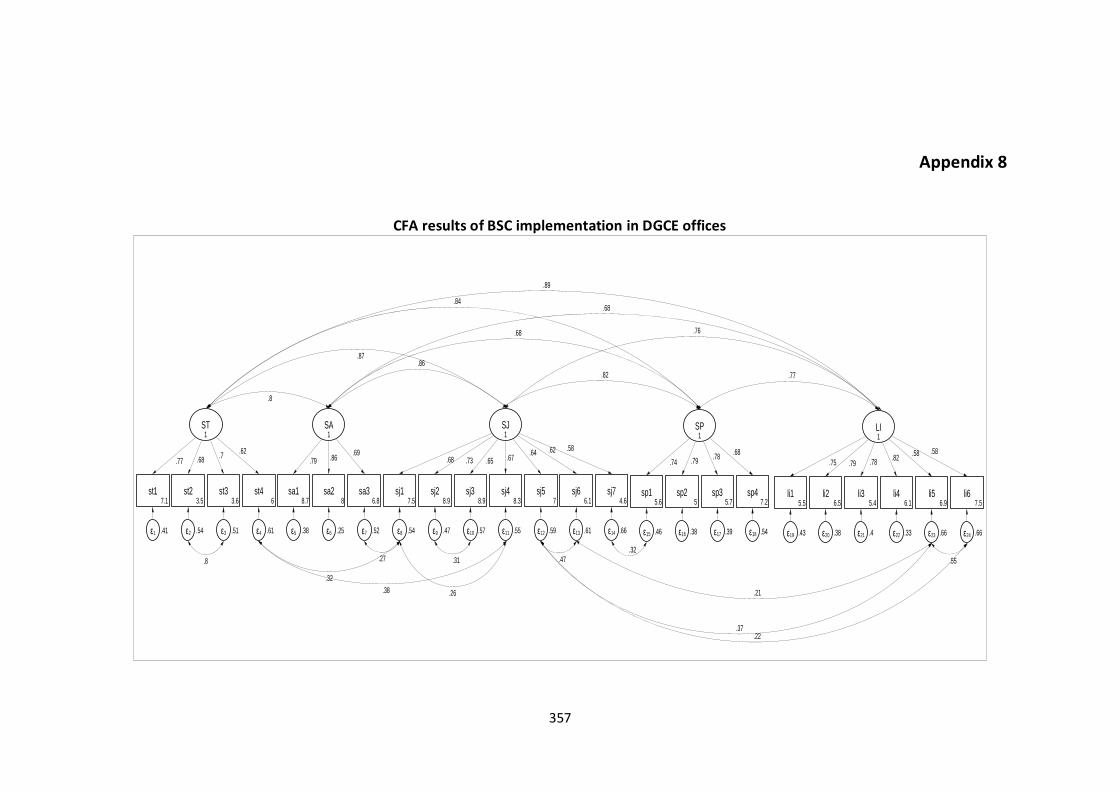
357
Appendix 8
CFA results of BSC implementation in DGCE offices
ST1
st17.1
ε1 .41
st23.5
ε2 .54
st33.6
ε3 .51
st46
ε4 .61
SA1
sa18.7
ε5 .38
sa28
ε6 .25
sa36.8
ε7 .52
SJ1
sj17.5
ε8 .54
sj28.9
ε9 .47
sj38.9
ε10 .57
sj48.3
ε11 .55
sj57
ε12 .59
sj66.1
ε13 .61
sj74.6
ε14 .66
SP1
sp15.6
ε15 .46
sp25
ε16 .38
sp35.7
ε17 .39
sp47.2
ε18 .54
LI1
li15.5
ε19 .43
li26.5
ε20 .38
li35.4
ε21 .4
li46.1
ε22 .33
li56.9
ε23 .66
li67.5
ε24 .66
.77 .68.7
.8
.62
.8
.79 .86.69
.87.86
.32
.27
.68 .73 .65
.31
.38
.67
.26
.64 .62
.47
.58
.84
.68
.82
.32
.74 .79.78
.68
.89
.68
.76
.77
.75 .79 .78.82
.37
.21
.58
.22
.58
.55

358
Appendix 9
Measurement model estimates and structural model of organisation size, employee’s role and BSC
Measurement model estimates
Strategy translation -> st1 0.68(0.02) ‡
Strategy translation -> st2 0.74(0.02) ‡
Strategy translation -> st3 0.78(0.02) ‡
Strategy translation -> st4 0.55(0.02) ‡
Strategy alignment -> sa1 0.77(0.01) ‡
Strategy alignment -> sa2 0.91(0.01) ‡
Strategy alignment -> sa3 0.62(0.02) ‡
Strategy as job -> sj1 0.62(0.02) ‡
Strategy as job -> sj2 0.77(0.01) ‡
Strategy as job -> sj3 0.72(0.01) ‡
Strategy as job -> sj4 0.67(0.02) ‡
Strategy as job -> sj5 0.59(0.02) ‡
Strategy as job -> sj6 0.55(0.02) ‡
Strategy as job -> sj7 0.42(0.02) ‡
Strategy process -> sp1 0.63(0.02) ‡
Strategy process -> sp2 0.82(0.01) ‡
Strategy process -> sp3 0.81(0.01) ‡
Strategy process -> sp4 0.67(0.02) ‡
Leadership involvement -> li1 0.82(0.01) ‡
Leadership involvement -> li2 0.75(0.01) ‡
Leadership involvement -> li3 0.75(0.01) ‡
Leadership involvement -> li4 0.83(0.02) ‡
Leadership involvement -> li5 0.51(0.02) ‡
Leadership involvement -> li6 0.54(0.02) ‡
Structural model
Size -> st -0.25(0.03) ‡
Size -> sa -0.19(0.02) ‡
Size -> sj -0.21(0.03) ‡
Size -> sp -0.24(0.02) ‡
Size -> li -0.16(0.03) ‡
Employees’ role -> st 0.20(0.03) †
Employees’ role -> sa 0.10(0.03) ‡
Employees’ role -> sj 0.11(0.03) ‡
Employees’ role -> sp 0.02(0.03)
Employees’ role -> li 0.09(0.03) ‡
Note: Reported are standardised coefficients (standard errors). Sig.: *: 10% or less; †: 5% or
less; ‡: 1% or less.

359
Appendix 10a
Initial data distribution of state revenue collection
0
1.0
e-0
72.0
e-0
73.0
e-0
7
De
nsity
0.00 5,000,000.00 10,000,000.0015,000,000.0020,000,000.0025,000,000.00Revenue

360
Appendix 10b
Normalised data distribution state revenue collection
0.1
.2.3
De
nsity
2 4 6 8 10lnRev
Top Related