


Languages
Pages
Legal


Pension reform and private pension funds in Poland: Goals and Facts.
IISP Seminar, Moscow25.11.2002Piotr Kurowski
Institute of Labour and Social Studies (IPiSS)

04/19/23 P. Kurowski - IPiSS 2
Plan of the presentation:
I. Selected macroeconomic indicators for Poland
II. Main features of the old pension systemIII. New pension system profile IV. Implementation and resultsV. Remaining Issues to be solved Conclusions

04/19/23 P. Kurowski - IPiSS 3
I. Selected macroeconomic indicators
-11,6
6,5
-7,0
12,2
2,6
14,3
3,8
16,4
5,2
16,0
7,0
14,9
6,1
13,2
6,9
10,3
4,8
10,4
4,1
13,1
4,0
15,1
2,0
17,4
-15
-10
-5
0
5
10
15
20
1990 1991 1992 1993 1994 1995 1996 1997 1998 1999 2000 2001
GDP real growth Unemployment rate

04/19/23 P. Kurowski - IPiSS 4
Selected economic indicators in Poland (ctd.)
1992 1993 1994 1995 1996 1997 1998 1999 2000 2001
Inflation (CPI Index) 43,0 35,3 32,2 27,8 19,9 14,9 11,8 7,3 10,1 5,6
GDP per capita (USD) 2 197 2 234 2 399 3 085 3 483 3 511 4 066 3 987 4 108 4 653
Average wage (USD) 215,3 220,2 234,4 289,8 323,8 323,7 354,8 430,2 442,6 503,6
Exchange rate (1 USD) 1,36 1,81 2,27 2,42 2,70 3,28 3,49 3,97 4,35 4,09
Capitalisation of Shares / GDP
0,3 3,7 3,5 3,9 6,6 9,6 13,1 20,0 19,0 14,3
Number of listed companies
16 22 44 65 83 143 198 221 123 89

04/19/23 P. Kurowski - IPiSS 5
II. Main features of the pension system before the reform
Public pay-as-you-go system Administered by Social Insurance Institution
(ZUS) Coverage: Workers, self-employed, other groups Type: Defined benefit Redistributive formulae of pension benefit Social contribution (45% of gross wage) paid by
employer Special systems: farmers (KRUS), military
service, judges and procecutors

04/19/23 P. Kurowski - IPiSS 6
Demographic and system dependency
38,843,9
47,651,1 51,9 51,3 52,3
54,456,4 54,5 55,3 55,7
0
10
20
30
40
50
60
1990 1991 1992 1993 1994 1995 1996 1997 1998 1999 2000 2001
System Dependency: Pensioners / ContributorsDemographic dependency: (65+ yrs old) / (18 - 64 yrs old)

04/19/23 P. Kurowski - IPiSS 7
Generous replacement rates of pension benefits
55%53%55%57%59%59%60%60%59%59%
61,8%59,9%62,3%
65,0%67,0%67,8%69,2%69,1%71,5%72,5%
0%
20%
40%
60%
80%
100%
1992 1993 1994 1995 1996 1997 1998 1999 2000 2001
Old-age, disability and family pensions Old-age pensions
Average pensionin USD
1994 1995 1996 1997 1998 1999 2000 2001
162 200 219 216 231 225 220 259

04/19/23 P. Kurowski - IPiSS 8
Expenditure of public pensions as a % of GDP
One of the most expensive pension systems in CCE Countries
8,6%
12,6%
14,6% 14,2%
15,8% 15,6% 15,2% 14,6%14,1% 14,1%
13,5%
0%
5%
10%
15%
1990 1991 1992 1993 1994 1995 1996 1997 1998 1999 2000

04/19/23 P. Kurowski - IPiSS 9
III. Formation of the programme of pension reform
Debates since the start of transition Different concepts of pension reform Engagement of international financial institutions Political consensus in area of pension reform The Governmental Plenipotentiary Office since
1997 Interest and co-operation of financial institutions Public support for changes in pension system Working out the legal framework

04/19/23 P. Kurowski - IPiSS 10
New pension system in Poland (i)
1. First pillar: Operating as public pay-as-you-go system Administered by Social Insurance Institution
(ZUS) Personal social insurance accounts in ZUS Type: Defined contribution with the new
pension formulae (P = Accrued capital of insured/ Life expectancy coefficient)
Non-contributory periods not accepted

04/19/23 P. Kurowski - IPiSS 11
New pension system in Poland (ii)
2. Second pillar: Open pension funds (OFE) operating on funded
method Managed by pension societies (PTE) Individual accounts for participants Recruitment of members through registered
agents3. Third pillar: Voluntary occupational pension programmes Organised by employers Social contribution incentives

04/19/23 P. Kurowski - IPiSS 12
New pension system in Poland (iii)
4. Participation in new pension system: Obligatory for people up to 30 years of age Voluntary for people from 31 to 50 years of age5. Division of social contribution (36,59% of salary): 12,22% - pension contribution to the first pillar (ZUS) 7,3% - contribution to pension funds in the second
pillar 13,0% - for disability pensions (ZUS) 2,45% - for sickness insurance (ZUS) 1,62% - accident insurance (ZUS)

04/19/23 P. Kurowski - IPiSS 13
IV. Implementation and results
Participants of pension funds Pension funds (OFE):
assets market structure investments Rates of return
Performance of pension societies (PTE) Institutional changes: pension supervision

04/19/23 P. Kurowski - IPiSS 14
Participants of pension funds
Predicted number of members of pension funds: 8 millions (60% of insured workers)
Real participation exceeded 10,6 million in 2001
10 888 10 805
10 490 10 637
10 752
10 509 10 416 10 369
10 281 10 123
9 973
9 666
9 000
10 000
11 000
XII 99 III 00 VI 00 IX 00 XII 00 III 01 VI 01 IX 01 XII 01 III 02 VI 02 IX 02

04/19/23 P. Kurowski - IPiSS 15
Age structure of participants
5,7
19,3
21,9
17,2
14,413,3
7,2
1,0
0
5
10
15
20
25
< 20 21-25 26-30 31-35 36-40 41-45 46-50 > 50

04/19/23 P. Kurowski - IPiSS 16
Pension funds: number and assets
1999 2000 2001 2002(Oct.)
Number of pension funds 21 21 17 16Pension assets (bln PLN) 2,2 9,9 19,4 29,2Pension assets / GDP 0,5% 1,8% 3,3% -
Share of members in three biggest funds
56,6% 56,1% 55,7% 55,5%

04/19/23 P. Kurowski - IPiSS 17
Pension funds: market structure (Sept. 2002)
CU22,7%
Pocztylion4,1%
Other 9 pf21,5%
PZU16,3%
NN16,5%
Skarbiec3,5%
AIG7,7%
Sampo4,1%
Bankowy3,5%

04/19/23 P. Kurowski - IPiSS 18
Pension funds: selected investment limits
No limits for government bonds Shares in companies listed in stock exchange
– 40% Shares in bank deposits and securities – 20% Open-end investment funds units – 15% Publicly traded municipal bonds – 15% Shares in National Investment Funds – 10% Other entities’ bonds – 5% Investments abroad – 5%

04/19/23 P. Kurowski - IPiSS 19
Pension funds: Structure of investment
Instruments VI.00 XII.00 VI.01 XII.01 III.02 VI.02 IX.02
Bonds 56,0 61,4 61,5 65,8 60,1 64,4 68,2Equities 30,9 33,6 27,4 28,0 30,3 28,9 25,5T-bills 9,3 1,5 7,5 2,6 5,0 2,3 1,8Bank deposits 2,5 2,3 3,0 2,8 3,4 2,9 2,9
Other 1,2 1,1 0,5 0,8 1,2 1,2 1,6

04/19/23 P. Kurowski - IPiSS 20
Rates of return for 24 months (29-09-2000 - 30-09-2002)
28,428,3
24,9
23,124,0
11,6
0 5 10 15 20 25 30
Minimal rate of returnKredyt Bank
SkarbiecPocztylionDOM
AIGErgo
{EGO}BankowyCSL&P
PolsatPekaoZurich
AllianzAverage rate of return
CUPZUNN
Sampo
04/19/23 P. Kurowski - IPiSS 21
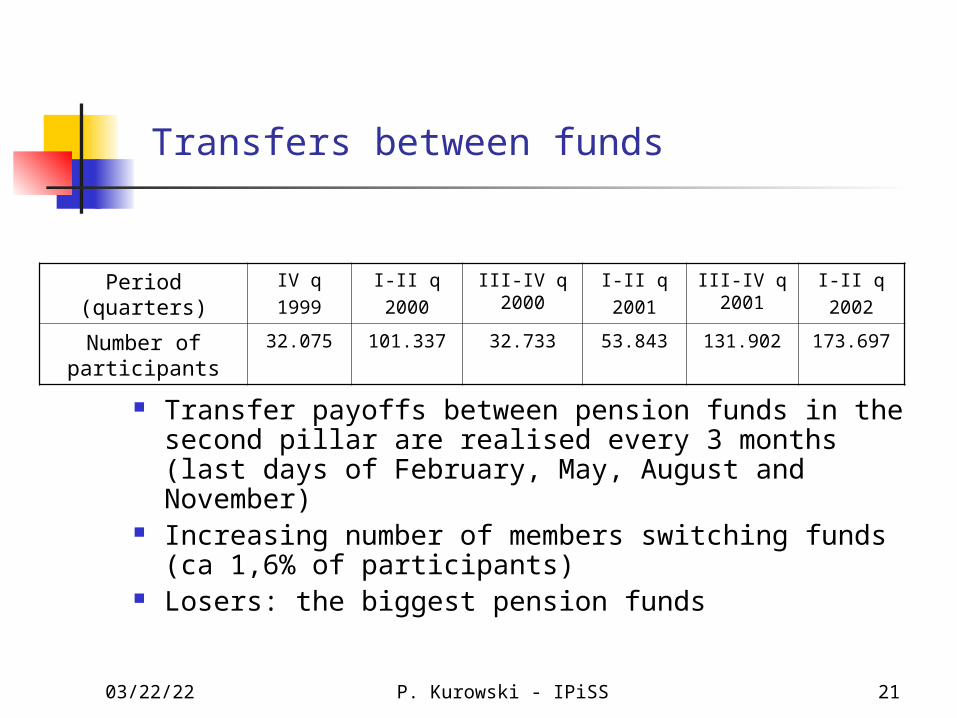
Transfers between funds
Transfer payoffs between pension funds in the second pillar are realised every 3 months (last days of February, May, August and November)
Increasing number of members switching funds (ca 1,6% of participants)
Losers: the biggest pension funds
Period (quarters) IV q1999
I-II q2000
III-IV q 2000
I-II q2001
III-IV q 2001
I-II q2002
Number of participants 32.075 101.337 32.733 53.843 131.902 173.697

04/19/23 P. Kurowski - IPiSS 22
Pension management societies: revenues
Entrance fee: Commission from the contributions Determined according to length of membership Min. rate: 6,5% Max. rate: 10% Average: 8,5%
Management fee (max. limit 0,05% of assets’ value per month)
Exit fee (in case of switching pension fund) Other revenues

04/19/23 P. Kurowski - IPiSS 23
Pension Societies: the scope of costs
0
25
50
75
100
1999 2000 2001 2002
Revenues of PTE/ Costs of PTE Costs of PTE / OFEs' contributions

04/19/23 P. Kurowski - IPiSS 24
Pension societies: structure of costs in 1999
Marketing30,3%
Systemic costs9,5%
Administration28,7%
Salespeople31,5%

04/19/23 P. Kurowski - IPiSS 25
Pension Societies: Profits and losses (in m PLN)
Profits / Losses 1999 2000 2001
Total - 1 771,2 - 683,21 - 281,5
CU -90,2 -54,9 + 43,5
NN -103,8 -32,1 +18,9
PZU - 143,9 - 85,5 - 46,0
PKO/Handlowy -90,1 31,0 -88,5
In 2001 5 pension societies revealed profits, 12 concluded with losses. In subsequent periods profits should appear in whole system

04/19/23 P. Kurowski - IPiSS 26
Institutional changes in Supervision In September 2001, new government announced
consolidation of the supervisory institutions. Supervisory Office over Pension Funds (UNFE) was to be consolidated with Supervisory Office over Insurance Companies (PUNU).
The proposed concept was determined mainly by political factors. Private pension funds accepted this step since they were generally critical to prior UNFE activities.
Among specialists dominant opinion was either to leave UNFE as a special supervisory institution or to consolidate it with Securities Commission (KPW).
In April 2002 UNFE was merged with PUNU.

04/19/23 P. Kurowski - IPiSS 27
VI. Remaining Issues to be solved
Individual records in first pillar (ZUS) Delays in timely transferring contributions from
ZUS to pension funds Different approaches in accounting system of
pension funds (lack of comparability) 18,3% of accounts in pension funds are dead ones
(2 069 881 in September 2002) Delay in legal regulations of bridging pensions and
annuity companies
Top Related