


Languages
Pages
Legal

Title and Subtitle
PEDESTRIAN AND BICYCLIST COUNTS AND DEMAND
ESTIMATION STUDY
Report Date
January 2013
Author(s)
Benz, Robert J., Shawn Turner; and Teresa Qu
Contract or Grant No.
Project 6000051
Performing Organization Name and Address
Texas A&M Transportation Institute
The Texas A&M University System
College Station, Texas 77843-3135
Type of Report and Period Covered
Summary Report:
November 2011 – January 2013
Sponsoring Agency Name and Address
Houston-Galveston Area Council
3555 Timmons, Suite 120
Houston, TX 77027
Supplementary Notes
Project performed in cooperation with the Texas Department of Transportation and the Federal Highway
Administration.
Project Title: Pedestrian and Bicyclist Counts and Demand Estimation Study
URL: http://tti.tamu.edu/documents/TTI-2013-3.pdf
Abstract
This report contains six chapters that document the activities related to counting bicycles and pedestrians,
modeling techniques for non-motorized demand, and developing a non-motorized counting plan for the
HGAC region. The chapter titles and brief summary include:
1. PEDESTRIAN AND BICYCLIST MONITORING -- EQUIPMENT AND METHODS – A literature
review of the state of the art and state of the practice on counting technologies, describing the strengths
weaknesses and challenges of counting bicycles and pedestrians.
2. COUNTING EQUIPMENT – GUIDANCE AND INSTALLATION – Two permanent counting stations
were installed and guidance on placement, settings and best practices for portable pedestrian and bicycle
(non-motorized) counters were provided. A bike classification scheme was developed to more accurately
count bikes using pneumatic tube counters. Draft interlocal agreements were developed addressing
deployment, operation, and maintenance responsibilities for both the permanent and short term use devices
and may be used for interagency loan and use of the temporary count equipment.
3. DEVELOP PEDESTRIAN AND BICYCLE COUNTING PLAN – Existing count locations and counts
were gathered and summarized to use as the basis of the non-motorized count plan. A concept of permanent
and short term counts, similar to what is done for motorized traffic was developed to sample and apply
factors to the short term counts.
4. DATA COLLECTION AND REPORTING STRUCTURE – A conceptual level data repository with a list
of elements was developed based on literature and desire to develop bike and pedestrian indices.
5. PEDESTRIAN AND BICYCLE DEMAND ESTIMATION – A model was developed from household
travel survey data to estimate current demand. Indices based on roadway, and traffic characteristics were
calculated and gaps between supply and demand were shown graphically with maps. Key Words
Bicycle Counting, Pedestrian Counting, Bicycle Classification, Pedestrian Classification, Non-Motorized
Counting, Non-Motorized Classification, Bicycle and Pedestrian Travel Demand Estimation, Non-Motorized
Travel Demand Estimation

HGAC PEDESTRIAN-BICYCLIST COUNTING AND DEMAND STUDY
by
Robert J. Benz
Research Engineer
Texas A&M Transportation Institute
Shawn Turner
Research Engineer
Texas A&M Transportation Institute
and
Teresa Qu
Associate Research Engineer
Texas A&M Transportation Institute
Project 6000051
Project Title: Pedestrian-Bicyclist Counting and Demand Study
Performed in cooperation with the
Houston-Galveston Area Council
January 2013
TEXAS A&M TRANSPORTATION INSTITUTE
The Texas A&M University System
College Station, Texas 77843-3135

v
DISCLAIMER
This research was performed in cooperation with the Houston-Galveston Area Council
(H-GAC). The contents of this report reflect the views of the authors, who are responsible for
the facts and the accuracy of the data presented herein. The contents do not necessarily reflect
the official view or policies of the H-GAC. This report does not constitute a standard,
specification, or regulation.
This report is not intended for construction, bidding, or permit purposes. The research
engineer in charge of the project was Robert J. Benz, P.E. # . 85382
The United States Government and the State of Texas do not endorse products or
manufacturers. Trade or manufacturers’ names appear herein solely because they are considered
essential to the object of this report.

vi
ACKNOWLEDGMENTS
This project was conducted in cooperation with the Houston-Galveston Area Council.
The authors thank Chelsea Young, Cheryl Mergo, of HGAC; Jian Shen, Paul Adamson, Omar
Mata, Chris Dykes and Henry Kellumen of TTI and the H-GAC Bicycle and Pedestrian
Subcommittee.
vii
TABLE OF CONTENTS
Page
DISCLAIMER............................................................................................................................... v ACKNOWLEDGMENTS ........................................................................................................... vi TABLE OF CONTENTS ........................................................................................................... vii
List of Figures ............................................................................................................................... ix List of Tables ................................................................................................................................. x Chapter 1: PEDESTRIAN AND BICYCLIST MONITORING EQUIPMENT AND
METHODS ........................................................................................................................ 1 INTRODUCTION .............................................................................................................. 1
MONITORING EQUIPMENT AND TECHNOLOGY ..................................................... 2
Overview and Challenges ................................................................................................... 2
Inductance Loop Detectors ................................................................................................. 3
Infrared Sensors .................................................................................................................. 6
Magnetometers .................................................................................................................. 11
Pneumatic Tubes ............................................................................................................... 11
Pressure and Acoustic Sensors.......................................................................................... 12
Video Image Processing ................................................................................................... 14
Chapter 2: Counting Equipment Guidance and Installation ................................................ 17
Chapter 3: Develop Pedestrian and BicycleCounting Plan..................................................... 21 Existing Non-Motorized Transportation System Counts .................................................. 21
Project Agency and Advocacy Input ................................................................................ 23
Methodology ..................................................................................................................... 23
Count Location Criteria .................................................................................................... 24
Permanent Count Location Considerations ...................................................................... 26
Development of a Draft Count Plan .................................................................................. 28
Chapter 4. Data Collection and Reporting Structure.............................................................. 31 Statement of the Problem .................................................................................................. 31
Existing Counts ................................................................................................................. 32
Database Needs ................................................................................................................. 33
Database Elements ............................................................................................................ 33
Adjustment Factors ........................................................................................................... 35
Chapter 5: Modeling Regional Non-Motorized Travelin H-GAC Area ............................... 37 Literature Review.............................................................................................................. 37
Nation-Wide Walking and Biking Modeling Effort Guidebook on Methods to Estimate
Non-Motorized Travel (1) ................................................................................................. 37
viii
Guidelines for Analysis of Investments in Bicycle Facilities (2) ..................................... 39
Estimating Bicycling and Walking for Planning and Project Development (3) ............... 40
H-GAC Area-wide Walking and Biking Modeling Effort ............................................... 40
Methodology ..................................................................................................................... 41
Non-Motorized Travel Current Demand .......................................................................... 42
Non-Motorized Travel Supply .......................................................................................... 46
Bicycle Travel Supply....................................................................................................... 46
Recommendation for Improving the Friendliness of Roadway to Bicycling Travel ........ 50
Pedestrian Travel Supply .................................................................................................. 52
Recommendation for Improving Walking Supply ............................................................ 56
Interaction between Demand and Supply ......................................................................... 56
Pedestrian Travel Demand and Supply ............................................................................. 63
Integration with Super Neighborhoods ............................................................................. 63
Case Study ........................................................................................................................ 67
Pedestrian Project.............................................................................................................. 67
Bicycle Project .................................................................................................................. 69
Case Study Recommendations .......................................................................................... 71
Conclusion ........................................................................................................................ 71
Limitations and Future Research ...................................................................................... 72
Chapter 6: Project Summary .................................................................................................... 71 Chapter 1. Pedestrian and Bicyclist Monitoring -- Equipment ......................................... 71
and Methods ...................................................................................................................... 71
Chapter 2. Counting Equipment – Guidance and Installation .......................................... 72
Chapter 3. Develop Pedestrian and Bicycle Counting Plan .............................................. 73
Chapter 4. Data Collection and Reporting Structure ........................................................ 74
Chapter 5. Pedestrian and Bicycle Demand Estimation ................................................... 75
Conclusions and Next Steps.............................................................................................. 75
References .................................................................................................................................... 77 Appendix A .................................................................................................................................. 78 Appendix B .................................................................................................................................... 3
Appendix C .................................................................................................................................... 3 Appendix D .................................................................................................................................... 4 Appendix E .................................................................................................................................... 3 Appendix F .................................................................................................................................... 3
ix
LIST OF FIGURES
Page
Figure 1-1. Examples of Inductance Loop Detector Shapes for Bicyclist Counting. .................. 7
Figure 1-2. Example of Passive Infrared Sensor Combined with Inductance Loop
Detectors .................................................................................................................... 9
Figure 1-3. Different Types of Infrared Counters for Non-Motorized Traffic. .......................... 10
Figure 1-4. Typical Configuration for Passive Infrared Sensor. ................................................. 10
Figure 1-5. Example of Pneumatic Tube Configuration for Counting Directional
Bicyclist Traffic. ...................................................................................................... 12
Figure 1-6. Examples of Pressure Sensors on Natural (a) and Paved (b) Surfaces .................... 13
Figure 1-7. Example of Video Image Processing for Tracking and Counting
Non-Motorized Traffic. ........................................................................................... 14
Figure 3-1. Existing Harris County ITE National Bicycle and Pedestrians
Documentation ......................................................................................................... 22
Figure 3-2. Existing and Proposed Bike and Pedestrian Count Locations. ................................ 29
Figure 5-1. Current Demand for Non-Motorized Travel in H-GAC Area. ................................ 43
Figure 5-2. Current Demand for Walking Travel in H-GAC Area............................................. 44
Figure 5-3. Current Demand for Biking Travel in H-GAC Area. .............................................. 45
Figure 5-4. Bicycle Compatibility Index for the H-GAC Area. ................................................. 51
Figure 5-5. Pedestrian Friendliness Index for the H-GAC Area. ............................................... 53
Figure 5-6. Pedestrian Friendliness Index for the Harris County. .............................................. 54
Figure 5-7. Supply and Demand for Bicycle Travel in H-GAC Area. ....................................... 58
Figure 5-8. Supply and Demand for Bicycle Travel in Harris County. ...................................... 59
Figure 5-9. Supply and Demand for Bicycle Travel in Houston Downtown Area. .................... 60
Figure 5-10. High, Medium and Low Level of Undersupplied Road Sections for Bicycle
Travel in H-GAC Region ......................................................................................... 62
Figure 5-11. High, Medium, and Low Level of Undersupplied TAZ for Pedestrian Travel ..........
in H-GAC Region. ................................................................................................... 64
Figure 5-12. Undersupplied Bike Travel Road Sections in the Super Neighborhoods. ............... 67
Figure 5-13. Undersupplied Pedestrian Travel TAZs in the Super Neighborhoods. .................... 68
Figure 5-14. Proposed Sidewalk Project Location. ...................................................................... 69
Figure 5-15. Proposed Bicycle Project Location. ......................................................................... 70
x
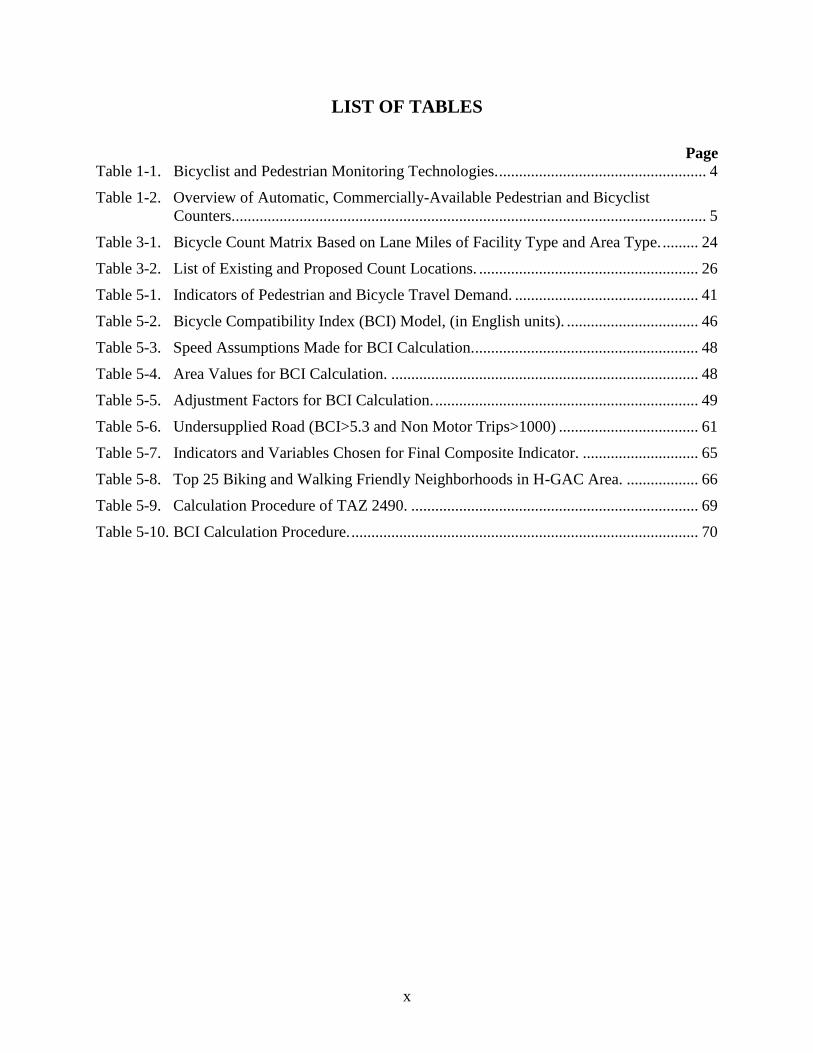
LIST OF TABLES
Page
Table 1-1. Bicyclist and Pedestrian Monitoring Technologies. .................................................... 4
Table 1-2. Overview of Automatic, Commercially-Available Pedestrian and Bicyclist
Counters. ...................................................................................................................... 5
Table 3-1. Bicycle Count Matrix Based on Lane Miles of Facility Type and Area Type. ......... 24
Table 3-2. List of Existing and Proposed Count Locations. ....................................................... 26
Table 5-1. Indicators of Pedestrian and Bicycle Travel Demand. .............................................. 41
Table 5-2. Bicycle Compatibility Index (BCI) Model, (in English units). ................................. 46
Table 5-3. Speed Assumptions Made for BCI Calculation. ........................................................ 48
Table 5-4. Area Values for BCI Calculation. ............................................................................. 48
Table 5-5. Adjustment Factors for BCI Calculation. .................................................................. 49
Table 5-6. Undersupplied Road (BCI>5.3 and Non Motor Trips>1000) ................................... 61
Table 5-7. Indicators and Variables Chosen for Final Composite Indicator. ............................. 65
Table 5-8. Top 25 Biking and Walking Friendly Neighborhoods in H-GAC Area. .................. 66
Table 5-9. Calculation Procedure of TAZ 2490. ........................................................................ 69
Table 5-10. BCI Calculation Procedure. ....................................................................................... 70

1
CHAPTER 1: PEDESTRIAN AND BICYCLIST MONITORING
EQUIPMENT AND METHODS
INTRODUCTION
This report summarizes the state-of-the-practice for pedestrian and bicyclist monitoring
equipment and methods. The information gathered in this chapter will inform subsequent
chapters in this project:
Chapter 2 – Counting Equipment Guidance and Installation
Chapter 3 – Develop Pedestrian and Bicyclist Counting Plan
Chapter 4 – Data Collection and Reporting Structure
A literature search and review was performed to establish the state of the practice. An
extensive list of resources is compiled in Appendix A. These resources were used to develop
this report.
In general, pedestrian and bicyclist monitoring is an emerging practice and definitive
guidance is not well established. Even though both of these modes preceded the automobile, the
monitoring of non-motorized traffic has not been systematic or widespread in the US and, even
today, is not nearly as comprehensive as motorized traffic monitoring.
One of the key differences in state-of-the-practice between non-motorized and motorized
traffic monitoring is the scale of data collection. Most non-motorized data collection programs
have a much smaller number of monitoring locations, and these limited location samples may not
accurately represent the entire geographic area of interest. In many cases, the non-motorized
monitoring locations have been chosen based on highest usage levels or strategic areas of facility
improvement. Given limited data collection resources and specific data uses, these site selection
criteria may be appropriate. However, one should recognize that location samples may be
accurate use indicators at each specific location, but may represent a biased estimate of use levels
and trends for a city or state. More research is needed to identify statistically-representative site
selection criteria.
Another key difference is that non-motorized traffic will typically have higher use levels
on lower functional class roads and streets, simply because of the more pleasant environment of
lower speeds and volumes of motorized traffic. Conversely, motorized traffic monitoring focuses
on the higher functional class roads as these roads provide the quickest and most direct route for
motorized traffic.
Finally, the last key difference in current practice is a tendency to use very short duration
counts (i.e., as short as 2 hours) for non-motorized traffic monitoring, primarily because of the
2
perceived difficulty of automatically counting pedestrians and bicyclists (as well as the desire to
collect gender and bicycle helmet use). Although this practice is not prohibited, data users must
recognize that these very short-duration counts can introduce significant overall error when non-
motorized traffic use is low and inherently variable.
MONITORING EQUIPMENT AND TECHNOLOGY
This section describes the various technologies that are commonly used to count non-
motorized (i.e., bicyclists and pedestrians) traffic volumes at fixed locations. The discussion
differentiates between those technologies best suited to count bicyclists versus those best suited
to count pedestrians. The discussion also identifies those technologies that are ideal for short-
duration (i.e., portable) count locations and those that are ideal for continuous (i.e., permanent)
count locations. This section does not address technologies that collect other attributes of non-
motorized travel, such as the use of GPS-enabled mobile devices for trip traces or the use of
Bluetooth-enabled devices for origin-destination or travel time.
Overview and Challenges
Many of the basic technologies used to count bicyclists and pedestrians are similar to that
used to count cars and trucks; however, the design/configuration of the sensors and the signal
processing algorithms are often quite different. Therefore, separate equipment typically is used
to monitor non-motorized traffic.
There are a few technological challenges to non-motorized traffic monitoring:
Pedestrians and bicyclists are less confined to fixed lanes or paths of travel than
motor vehicles, and they sometimes make unpredictable movements. Pedestrians take
shortcuts off the sidewalk or cross streets at unmarked crossing locations. Bicyclists
sometimes ride on sidewalks or travel outside designated bikeways. They may stop in
front of a sensor to talk, wait, or even to examine the sensor. These actions make it
difficult to place or aim sensors and may decrease the accuracy of the sensor
equipment.
Pedestrians and bicyclists sometimes travel in closely-spaced groups, and some
sensors have difficulty differentiating between individuals within the group. In these
cases, a group with multiple persons will be counted as one person, and the sensor
will underestimate the actual counts.
Despite these challenges, there are several technologies that can be used to accurately
count non-motorized traffic. The growing demand for automatic bicyclist and pedestrian
counters has brought about improvements in equipment accuracy and capabilities. Increased
3
competition in this marketplace and collective experience with existing products will continue to
drive improvements to automatic bicyclist and pedestrian counters.
Table 1-1 summarizes the technologies for counting bicyclists and pedestrians, various
attributes of each technology, and their strengths and weaknesses. Table 1-2 summarizes
specific commercially-available counters for bicyclists and pedestrians.
Inductance Loop Detectors
Inductance loop detectors operate by circulating a low alternating electrical current
through a formed wire coil embedded in the pavement. The alternating current creates an
electromagnetic field above the formed wire coil, and a conductive object (e.g., car, truck, bike)
passing through the electromagnetic field will disrupt the field by a measurable amount. If this
disruption meets predetermined criteria, then detection occurs and an object is counted by a data
logger or computer controller.
Inductance loop detectors do not require the presence of ferrous (i.e., iron, steel) bicycle
frames; however, large conductive objects (like a car or truck) are more likely to meet the
predetermined “disruption” criteria than smaller conductive or non-ferrous objects (like a
motorcycle or bicycle). The sensitivity of an inductance loop can be changed to better detect
motorcycles or bicycles, but the increased sensitivity often results in over counting for cars and
trucks. For this reason, most agencies typically use dedicated loop detectors for counting
bicycles rather than trying to use existing loop detectors to count cars, trucks, and bicycles.
Loop detectors are commonly used to detect the presence of motor vehicles at or near
intersections for the purposes of traffic signal control. In some cases, these loop detectors may
detect the presence of bicycles. However, the location and configuration of these intersection-
based loop detectors are often not ideal for counting purposes, both for motor vehicles and
bicycles.
The preferred counting location is at mid-block or other locations where bicycles are
free-flowing and/or not likely to stop. Ideally, loop detectors for bicycle counting are placed in
lane positions primarily used by bicycles. If the loop detectors are placed in lanes shared by
motorized traffic and bicycles, then special algorithms will be necessary to distinguish the
bicycles from the motorized traffic.
Inductance loop detectors are capable of measuring the direction of bicyclist travel using
at least two possible options:
1. Installing an inductance loop within each directional travel “lane” and assuming that
all (or a certain percentage) bicyclists in that “lane” are traveling in the specified
direction (e.g., shared-use path or directional bike lane).
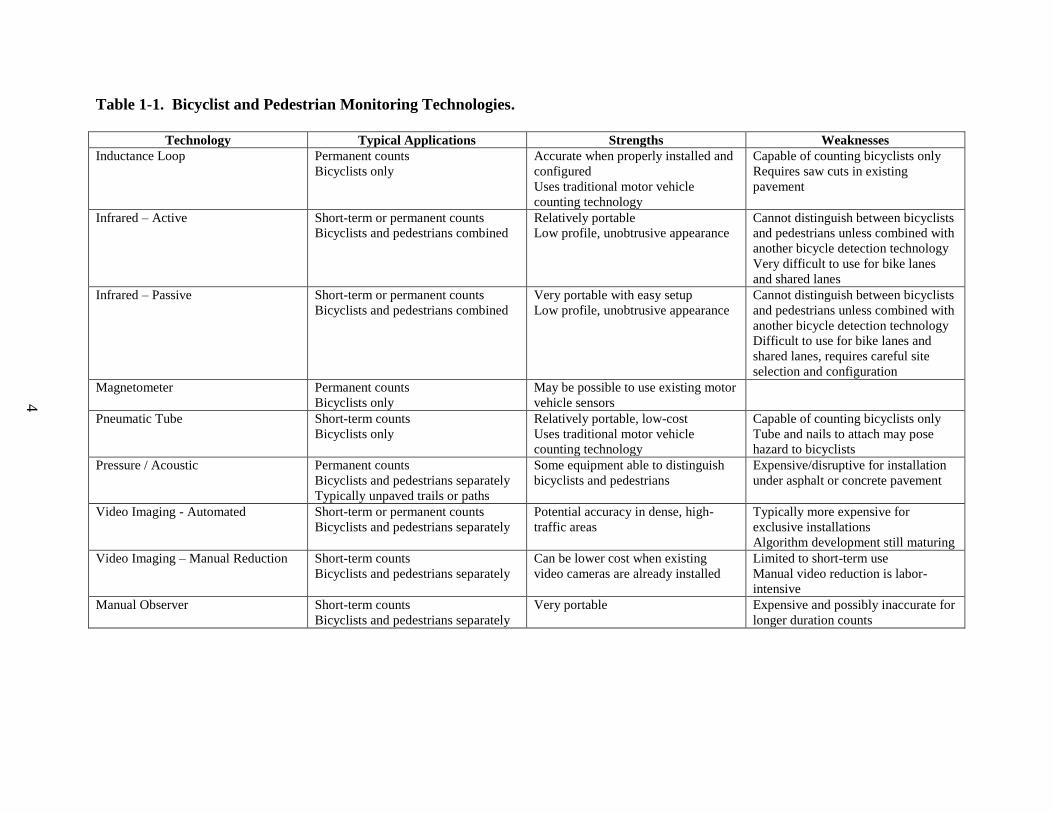
Table 1-1. Bicyclist and Pedestrian Monitoring Technologies.
Technology Typical Applications Strengths Weaknesses
Inductance Loop Permanent counts
Bicyclists only
Accurate when properly installed and
configured
Uses traditional motor vehicle
counting technology
Capable of counting bicyclists only
Requires saw cuts in existing
pavement
Infrared – Active Short-term or permanent counts
Bicyclists and pedestrians combined
Relatively portable
Low profile, unobtrusive appearance
Cannot distinguish between bicyclists
and pedestrians unless combined with
another bicycle detection technology
Very difficult to use for bike lanes
and shared lanes
Infrared – Passive Short-term or permanent counts
Bicyclists and pedestrians combined
Very portable with easy setup
Low profile, unobtrusive appearance
Cannot distinguish between bicyclists
and pedestrians unless combined with
another bicycle detection technology
Difficult to use for bike lanes and
shared lanes, requires careful site
selection and configuration
Magnetometer Permanent counts
Bicyclists only
May be possible to use existing motor
vehicle sensors
Pneumatic Tube Short-term counts
Bicyclists only
Relatively portable, low-cost
Uses traditional motor vehicle
counting technology
Capable of counting bicyclists only
Tube and nails to attach may pose
hazard to bicyclists
Pressure / Acoustic Permanent counts
Bicyclists and pedestrians separately
Typically unpaved trails or paths
Some equipment able to distinguish
bicyclists and pedestrians
Expensive/disruptive for installation
under asphalt or concrete pavement
Video Imaging - Automated Short-term or permanent counts
Bicyclists and pedestrians separately
Potential accuracy in dense, high-
traffic areas
Typically more expensive for
exclusive installations
Algorithm development still maturing
Video Imaging – Manual Reduction Short-term counts
Bicyclists and pedestrians separately
Can be lower cost when existing
video cameras are already installed
Limited to short-term use
Manual video reduction is labor-
intensive
Manual Observer Short-term counts
Bicyclists and pedestrians separately
Very portable Expensive and possibly inaccurate for
longer duration counts
4
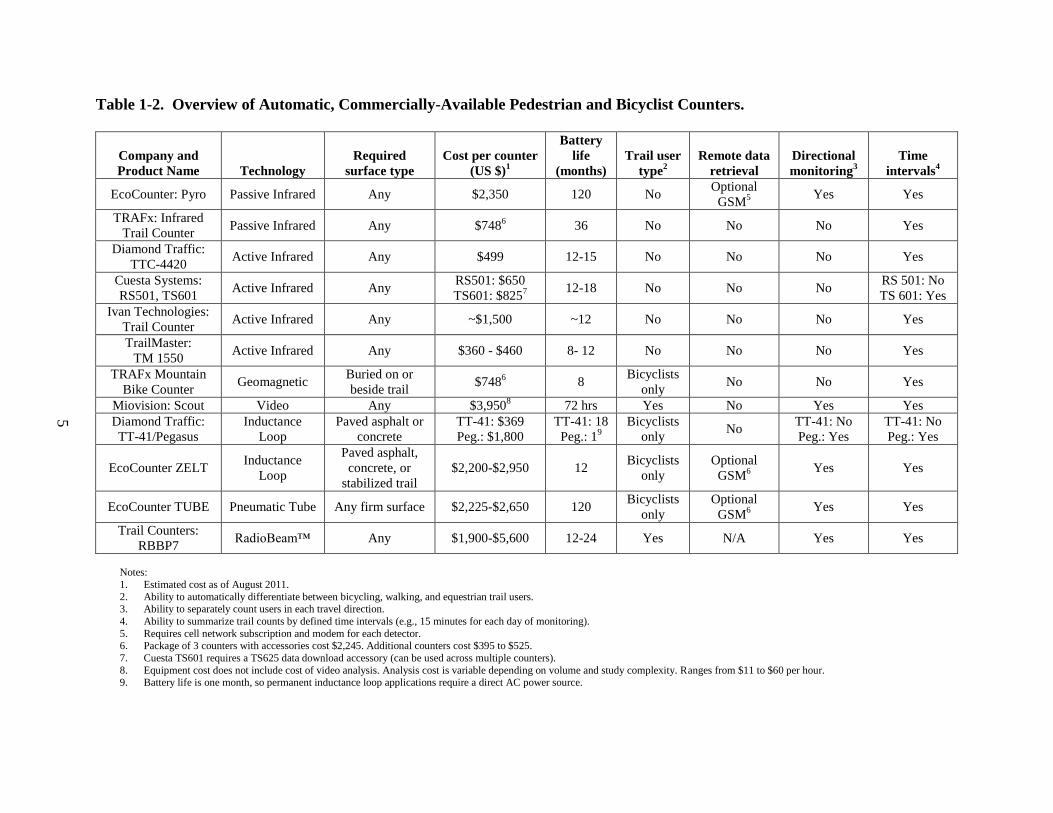
Table 1-2. Overview of Automatic, Commercially-Available Pedestrian and Bicyclist Counters.
Company and
Product Name Technology
Required
surface type
Cost per counter
(US $)1
Battery
life
(months)
Trail user
type2
Remote data
retrieval
Directional
monitoring3
Time
intervals4
EcoCounter: Pyro Passive Infrared Any $2,350 120 No Optional
GSM5 Yes Yes
TRAFx: Infrared
Trail Counter Passive Infrared Any $748
6 36 No No No Yes
Diamond Traffic:
TTC-4420 Active Infrared Any $499 12-15 No No No Yes
Cuesta Systems:
RS501, TS601 Active Infrared Any
RS501: $650
TS601: $8257
12-18 No No No RS 501: No
TS 601: Yes
Ivan Technologies:
Trail Counter Active Infrared Any ~$1,500 ~12 No No No Yes
TrailMaster:
TM 1550 Active Infrared Any $360 - $460 8- 12 No No No Yes
TRAFx Mountain
Bike Counter Geomagnetic
Buried on or
beside trail $748
6 8
Bicyclists
only No No Yes
Miovision: Scout Video Any $3,9508
72 hrs Yes No Yes Yes
Diamond Traffic:
TT-41/Pegasus
Inductance
Loop
Paved asphalt or
concrete
TT-41: $369
Peg.: $1,800
TT-41: 18
Peg.: 19
Bicyclists
only No
TT-41: No
Peg.: Yes
TT-41: No
Peg.: Yes
EcoCounter ZELT Inductance
Loop
Paved asphalt,
concrete, or
stabilized trail
$2,200-$2,950 12 Bicyclists
only
Optional
GSM6 Yes Yes
EcoCounter TUBE Pneumatic Tube Any firm surface $2,225-$2,650 120 Bicyclists
only
Optional
GSM6 Yes Yes
Trail Counters:
RBBP7 RadioBeam™ Any $1,900-$5,600 12-24 Yes N/A Yes Yes
Notes:
1. Estimated cost as of August 2011.
2. Ability to automatically differentiate between bicycling, walking, and equestrian trail users. 3. Ability to separately count users in each travel direction.
4. Ability to summarize trail counts by defined time intervals (e.g., 15 minutes for each day of monitoring).
5. Requires cell network subscription and modem for each detector. 6. Package of 3 counters with accessories cost $2,245. Additional counters cost $395 to $525.
7. Cuesta TS601 requires a TS625 data download accessory (can be used across multiple counters).
8. Equipment cost does not include cost of video analysis. Analysis cost is variable depending on volume and study complexity. Ranges from $11 to $60 per hour. 9. Battery life is one month, so permanent inductance loop applications require a direct AC power source.
5
6
2. Installing two inductance loops in series, such that direction can be inferred from the
timing of detection events for each loop.
The first option is the most commonly used practice to date. For the second option, some
data loggers or controller equipment may not be capable of interpreting signals from a paired
inductance loop sequence.
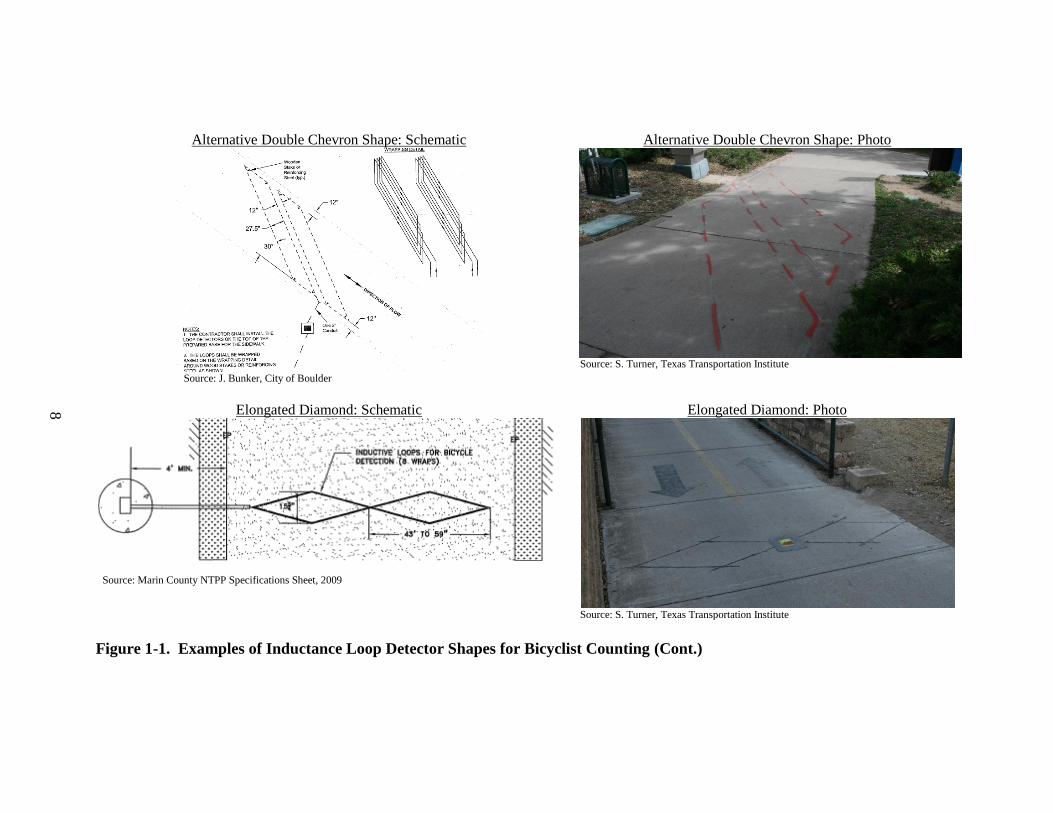
The most important variables in accurate bike detection via a loop detector are:
Loop configuration: Several different wire patterns have been used for counting
bicycles, including quadrupole, diagonal quadrupole (also called Type D), chevron,
and elongated diamond patterns (see Figure 1-1).
Detector circuit sensitivity: The sensitivity should be high enough to detect non-
ferrous bicycle frames but not so high as to detect motor vehicles in adjacent lanes.
Bicycle position over the loop: Pavement stencils may be used to indicate optimal
(i.e., most accurate) bicycle position over the loop detector, which is typically directly
over the saw cut for the wire coil.
Bicycle size and composition: A large steel frame is more likely to disrupt the loop
detector’s field than a smaller non-steel frame, but the threshold amount of ferrous
metal is not a known quantity and varies based on the above three and other variables.
Infrared Sensors
Infrared sensors operate by identifying a changing heat differential in the detection area.
If the heat differential and pattern meets pre-defined criteria, then a detection and/or count is
registered. There are two types of infrared sensors that can be easily distinguished:
Active infrared sensors use a signal transmitter on one side of the detection area and a
receiver or target on the other side.
Passive infrared sensors use a signal transmitter only on one side of the detection
area.
Active infrared sensors have a narrower cone/zone of detection than passive infrared
sensors. However, installation of active infrared sensors can be more challenging than passive
infrared sensors. The transmitter and receiver parts of an active infrared sensor must be aligned
properly, and requires a vertical mounting location on both sides of the detection area with a
clear line of sight between. A passive infrared sensor only requires a single vertical mounting
location on one side of the detection area. However, accuracy is improved when the passive
infrared sensor is pointed toward a wall, building face, dense vegetation, or similar background.
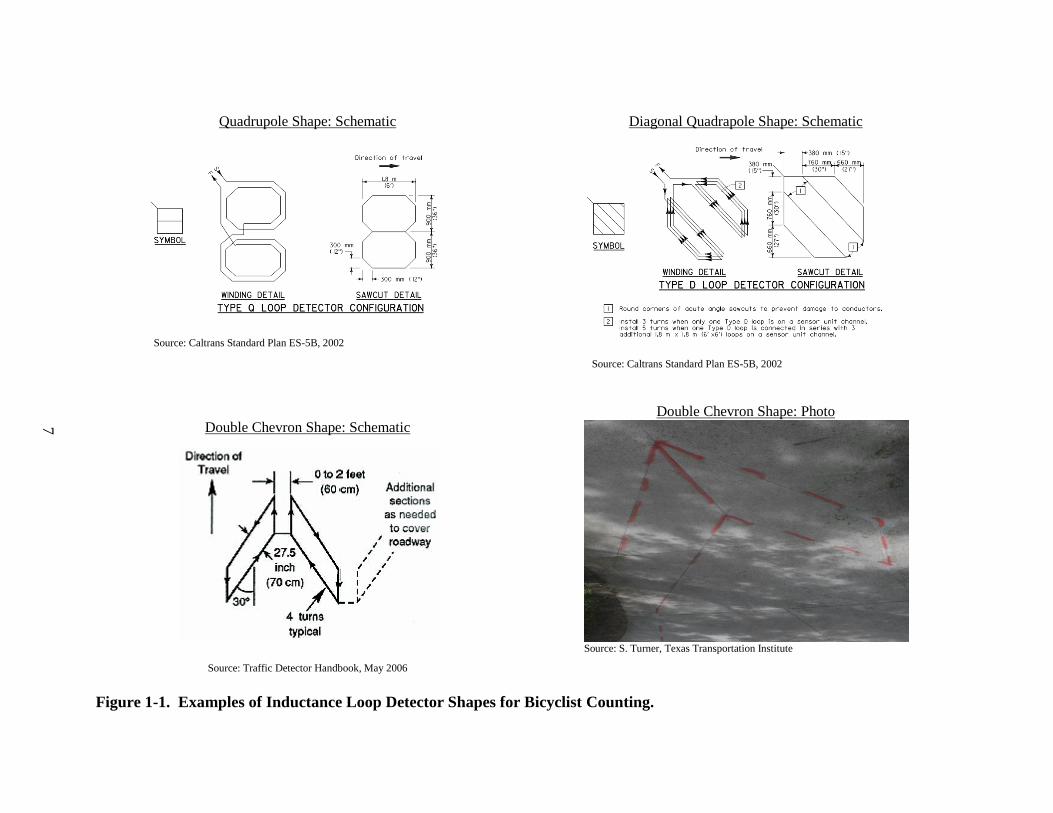
Quadrupole Shape: Schematic
Source: Caltrans Standard Plan ES-5B, 2002
Diagonal Quadrapole Shape: Schematic
Source: Caltrans Standard Plan ES-5B, 2002
Double Chevron Shape: Schematic
Source: Traffic Detector Handbook, May 2006
Double Chevron Shape: Photo
Source: S. Turner, Texas Transportation Institute
Figure 1-1. Examples of Inductance Loop Detector Shapes for Bicyclist Counting.
7
Alternative Double Chevron Shape: Schematic
Source: J. Bunker, City of Boulder
Alternative Double Chevron Shape: Photo
Source: S. Turner, Texas Transportation Institute
Elongated Diamond: Schematic
Source: Marin County NTPP Specifications Sheet, 2009
Elongated Diamond: Photo
Source: S. Turner, Texas Transportation Institute
Figure 1-1. Examples of Inductance Loop Detector Shapes for Bicyclist Counting (Cont.)
8
9
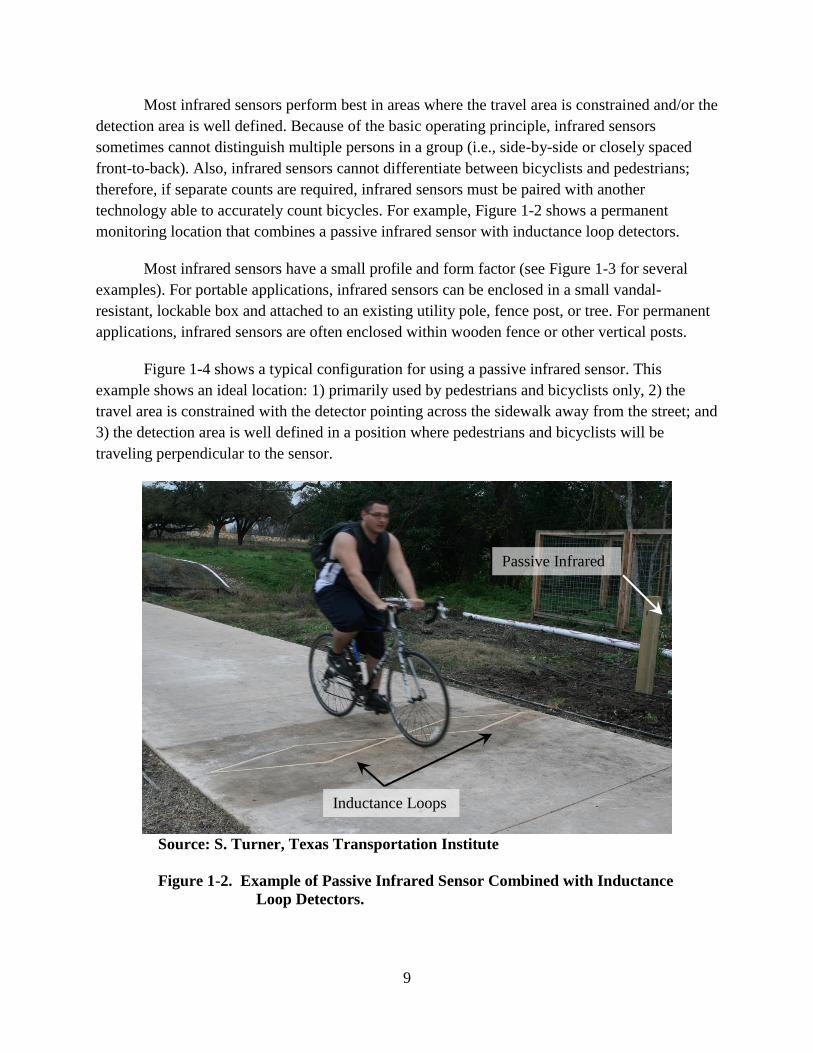
Most infrared sensors perform best in areas where the travel area is constrained and/or the
detection area is well defined. Because of the basic operating principle, infrared sensors
sometimes cannot distinguish multiple persons in a group (i.e., side-by-side or closely spaced
front-to-back). Also, infrared sensors cannot differentiate between bicyclists and pedestrians;
therefore, if separate counts are required, infrared sensors must be paired with another
technology able to accurately count bicycles. For example, Figure 1-2 shows a permanent
monitoring location that combines a passive infrared sensor with inductance loop detectors.
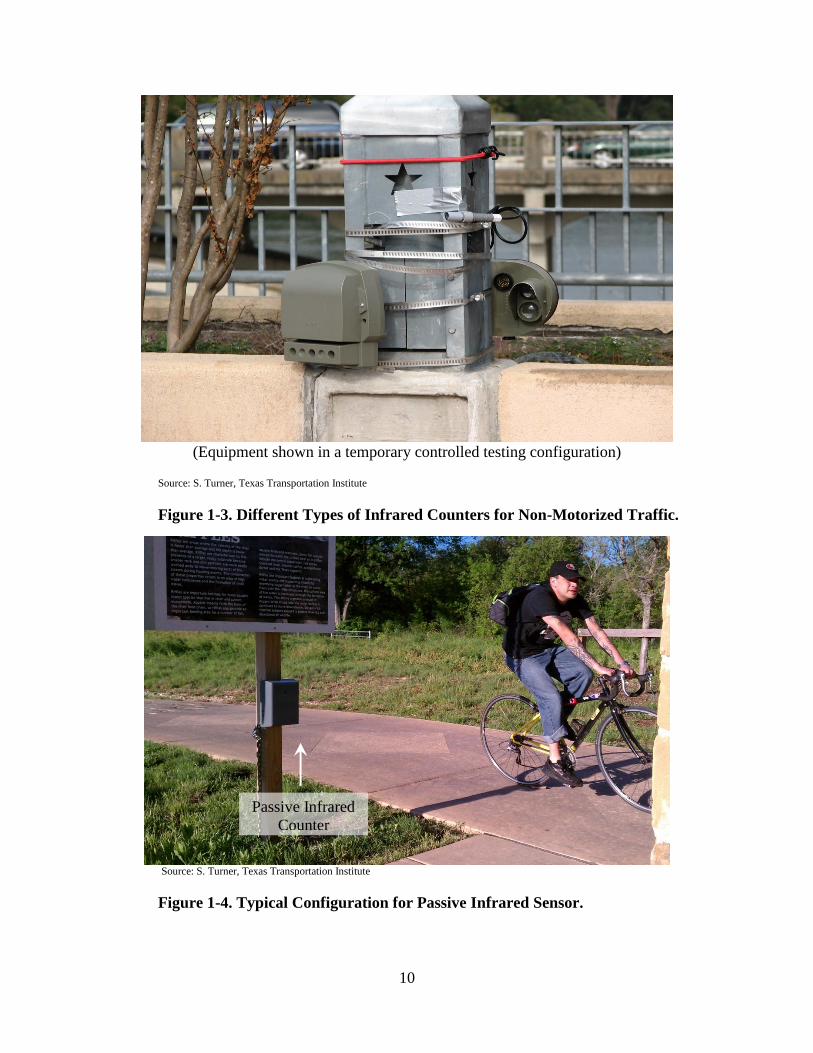
Most infrared sensors have a small profile and form factor (see Figure 1-3 for several
examples). For portable applications, infrared sensors can be enclosed in a small vandal-
resistant, lockable box and attached to an existing utility pole, fence post, or tree. For permanent
applications, infrared sensors are often enclosed within wooden fence or other vertical posts.
Figure 1-4 shows a typical configuration for using a passive infrared sensor. This
example shows an ideal location: 1) primarily used by pedestrians and bicyclists only, 2) the
travel area is constrained with the detector pointing across the sidewalk away from the street; and
3) the detection area is well defined in a position where pedestrians and bicyclists will be
traveling perpendicular to the sensor.
Source: S. Turner, Texas Transportation Institute
Figure 1-2. Example of Passive Infrared Sensor Combined with Inductance
Loop Detectors.
Passive Infrared
Inductance Loops
10
(Equipment shown in a temporary controlled testing configuration)
Source: S. Turner, Texas Transportation Institute
Figure 1-3. Different Types of Infrared Counters for Non-Motorized Traffic.
Source: S. Turner, Texas Transportation Institute
Figure 1-4. Typical Configuration for Passive Infrared Sensor.
Passive Infrared
Counter
11
Magnetometers
Magnetometers operate by detecting a change in the normal magnetic field of the Earth
caused by a ferrous metal object (e.g., bicycle frame or components). It may be possible to use
existing motorized traffic magnetometers for counting bicyclists; however, the installation and
configuration may not be optimal for accurate bicyclist counting. According to the Third Edition
(October 2006) of the Traffic Detector Handbook, “Magnetometers are sensitive enough to
detect bicycles passing across a four-foot span when the electronics unit is connected to two
sensor probes buried six inches deep and spaced three feet apart.” The shallow placement of
magnetometers will result in more accurate bicyclist counts but could over count motor vehicles,
as the detector might distinguish between changes in sections of the vehicle (e.g., engine block,
axles, transmission) as multiple vehicles.
Magnetometers designed for motorized traffic may be capable of detecting bicycle
frames made of non-ferrous materials (e.g., aluminum, carbon fiber, titanium), but are not
designed or optimized for this purpose. There are commercially-available magnetometers
specifically designed for bicycle detection and counting.
Another drawback to the use of existing magnetometers for the detection of bicycles is
increased equipment needs. For example, a thirty-foot detection area for automobiles would
require five magnetometers and one electronic data logger. The same thirty-foot detection area
would require ten magnetometers and four to five data loggers to detect bicycles.
Pneumatic Tubes
Pneumatic tubes are a low-cost, portable approach for counting bicyclists only.
Pneumatic tubes operate by using an air switch to detect short burst(s) of air from a passing
vehicle, motorized or non-motorized. The data logger then uses various pre-defined criteria (e.g.,
axle spacing, etc.) to determine whether a valid vehicle type has passed over the tubes. The
technology has been used to count cars and trucks for several decades, so most public agencies
either have the equipment or are familiar with the technology. Pneumatic tubes have been
combined with infrared sensors at locations where both bicyclist and pedestrian counts are
desired.
As with other traditional motorized traffic monitoring technology, the optimal placement
and configuration of pneumatic tubes for counting bicyclists will be different than that for cars
and trucks. Ideally, the placement of pneumatic tubes for bicycles should adequately cover the
bicycle travel path while not being exposed to excessive passage by motor vehicles. When
counting bikes in a bike or shared lane, passage and activation by motorized traffic may be
unavoidable. In these cases, the data logger criteria should be capable of ignoring typical motor
vehicle axle spacing. If direction of bicyclist travel is desired, a pair of pneumatic tubes can be
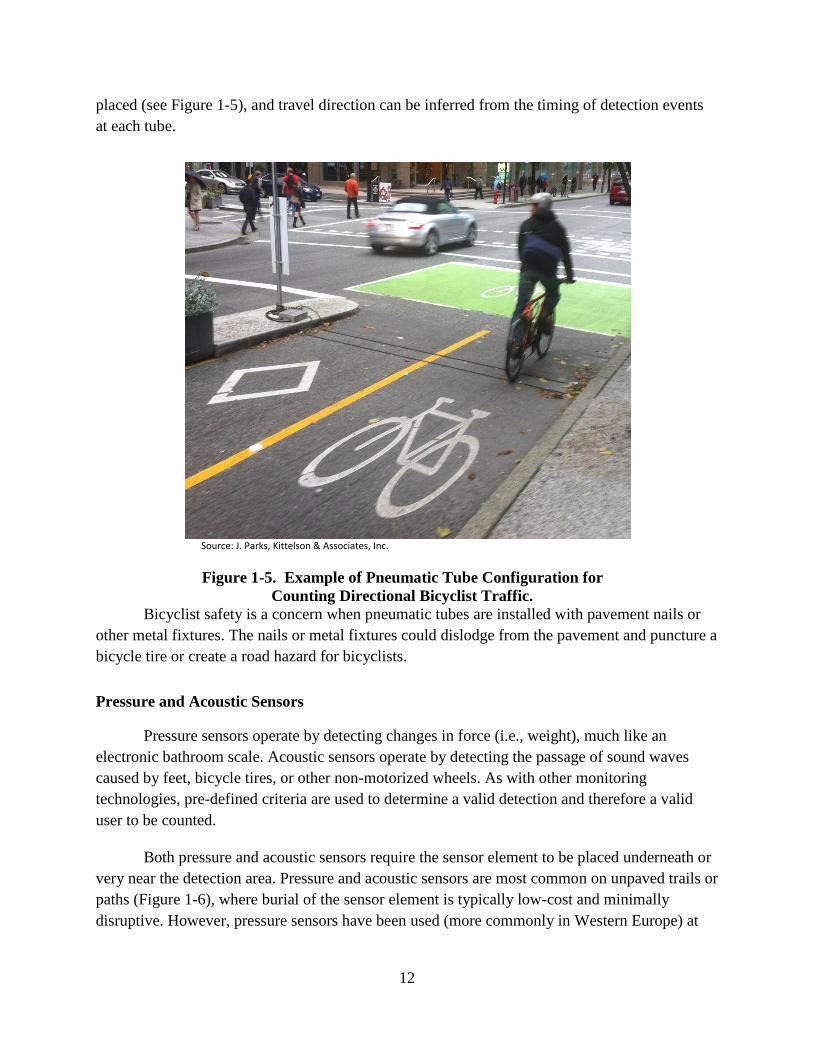
12
placed (see Figure 1-5), and travel direction can be inferred from the timing of detection events
at each tube.
Source: J. Parks, Kittelson & Associates, Inc.
Figure 1-5. Example of Pneumatic Tube Configuration for
Counting Directional Bicyclist Traffic.
Bicyclist safety is a concern when pneumatic tubes are installed with pavement nails or
other metal fixtures. The nails or metal fixtures could dislodge from the pavement and puncture a
bicycle tire or create a road hazard for bicyclists.
Pressure and Acoustic Sensors
Pressure sensors operate by detecting changes in force (i.e., weight), much like an
electronic bathroom scale. Acoustic sensors operate by detecting the passage of sound waves
caused by feet, bicycle tires, or other non-motorized wheels. As with other monitoring
technologies, pre-defined criteria are used to determine a valid detection and therefore a valid
user to be counted.
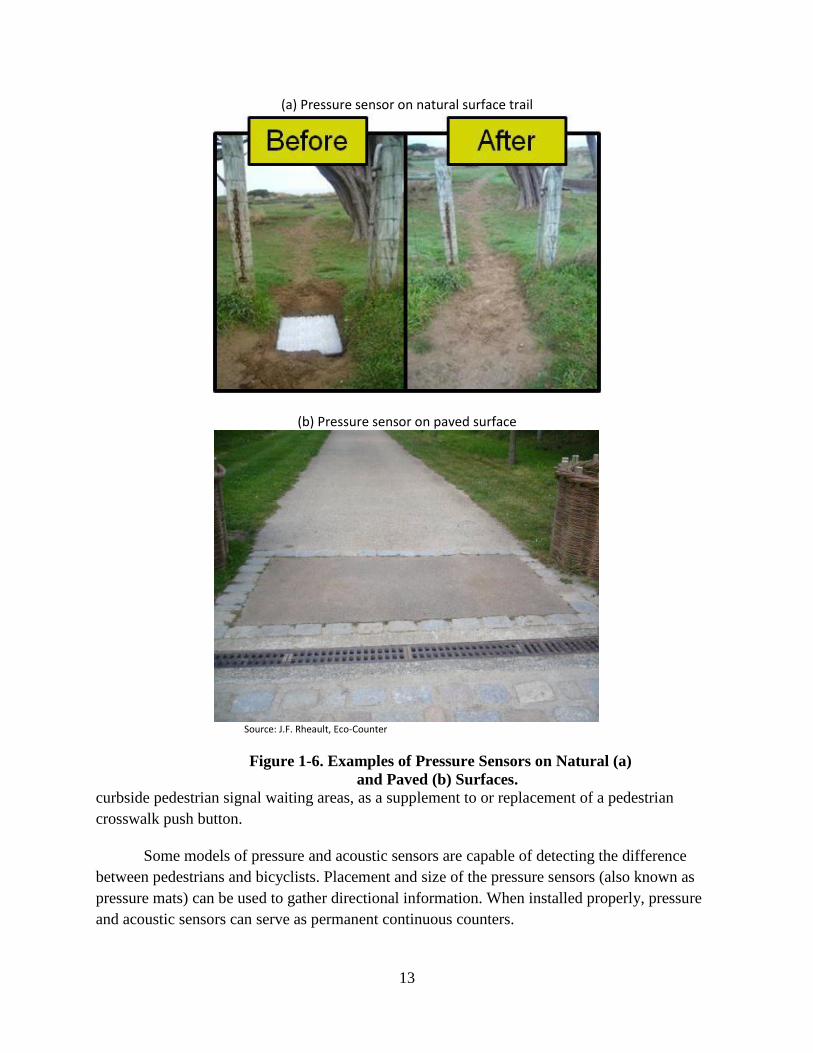
Both pressure and acoustic sensors require the sensor element to be placed underneath or
very near the detection area. Pressure and acoustic sensors are most common on unpaved trails or
paths (Figure 1-6), where burial of the sensor element is typically low-cost and minimally
disruptive. However, pressure sensors have been used (more commonly in Western Europe) at
13
(a) Pressure sensor on natural surface trail
(b) Pressure sensor on paved surface
Source: J.F. Rheault, Eco-Counter
Figure 1-6. Examples of Pressure Sensors on Natural (a)
and Paved (b) Surfaces.
curbside pedestrian signal waiting areas, as a supplement to or replacement of a pedestrian
crosswalk push button.
Some models of pressure and acoustic sensors are capable of detecting the difference
between pedestrians and bicyclists. Placement and size of the pressure sensors (also known as
pressure mats) can be used to gather directional information. When installed properly, pressure
and acoustic sensors can serve as permanent continuous counters.
14
Video Image Processing
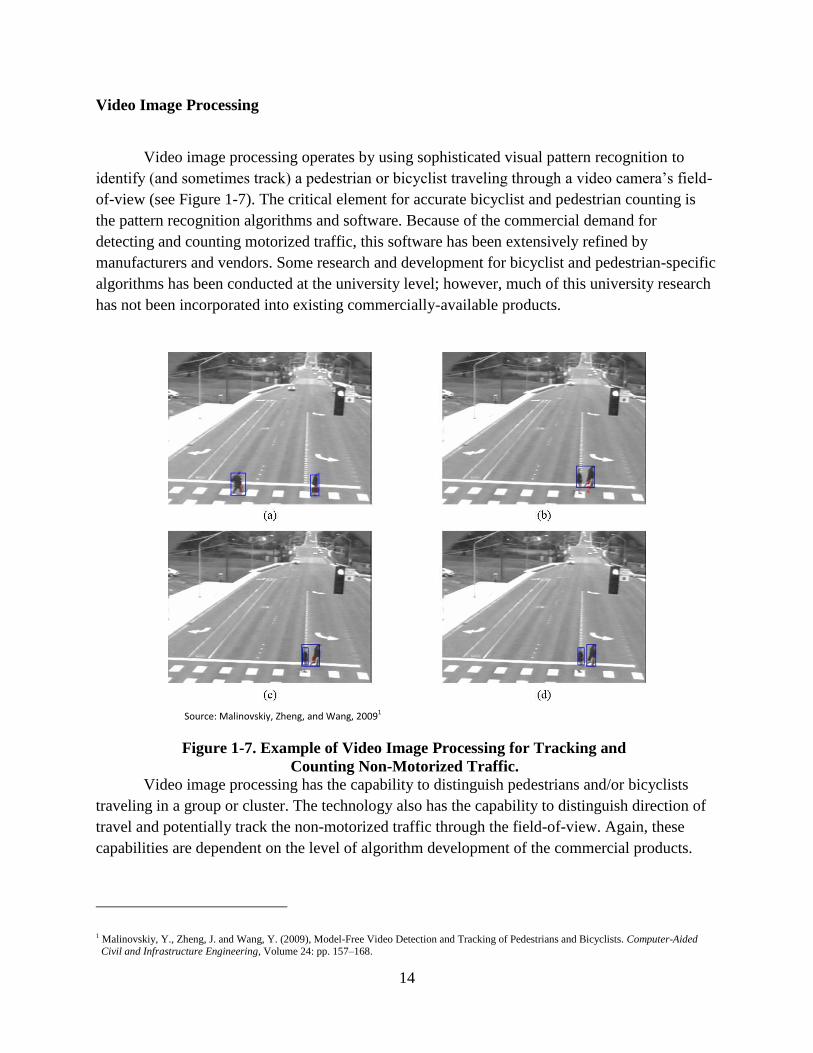
Video image processing operates by using sophisticated visual pattern recognition to
identify (and sometimes track) a pedestrian or bicyclist traveling through a video camera’s field-
of-view (see Figure 1-7). The critical element for accurate bicyclist and pedestrian counting is
the pattern recognition algorithms and software. Because of the commercial demand for
detecting and counting motorized traffic, this software has been extensively refined by
manufacturers and vendors. Some research and development for bicyclist and pedestrian-specific
algorithms has been conducted at the university level; however, much of this university research
has not been incorporated into existing commercially-available products.
Source: Malinovskiy, Zheng, and Wang, 20091
Figure 1-7. Example of Video Image Processing for Tracking and
Counting Non-Motorized Traffic.
Video image processing has the capability to distinguish pedestrians and/or bicyclists
traveling in a group or cluster. The technology also has the capability to distinguish direction of
travel and potentially track the non-motorized traffic through the field-of-view. Again, these
capabilities are dependent on the level of algorithm development of the commercial products.
1 Malinovskiy, Y., Zheng, J. and Wang, Y. (2009), Model-Free Video Detection and Tracking of Pedestrians and Bicyclists. Computer-Aided Civil and Infrastructure Engineering, Volume 24: pp. 157–168.
15
Weather and lighting may reduce the accuracy of this technology. Finally, video image
processing typically has the highest equipment costs.
In some cities, pedestrian and bicyclist counts are manually reduced by viewing recorded
video from intersection control or surveillance cameras. This manual approach is practical and
low-cost for periodic short-term counts, but is not sustainable for continuous monitoring
purposes. This approach eliminates equipment installation (and corresponding traffic control),
but also requires a low-cost labor force to manually review the video. Several companies offer a
portable video recording unit as well as data reduction services. Finally, the recorded video may
be useful to other agencies or departments that wish to study bicyclist and pedestrian behavior
(e.g., in response to safety issues or concerns).
Manual Observers
A low-technology approach for counting pedestrians and bicyclists is to position human
observers, who tally the non-motorized users passing through the monitoring location. Various
parameters and instructions for this technique are described in more detail at the National
Bicycle and Pedestrian Documentation Project website, http://bikepeddocumentation.org/.
Standardized data collection forms and survey questionnaires are also available at this website.
The use of manual observers is relatively low-cost and very portable. Manual observers
can also gather addition information about bicyclists and pedestrians, such as helmet use, gender,
relative age, and various behavior types. However, manual observers are limited to relatively
short periods of data collection (i.e., several hours) and can sometimes be error-prone.
Emerging Technologies
The commercial marketplace for non-motorized traffic monitoring is still maturing, and
several companies are still working to adapt their motorized traffic monitoring technology to
accurately count bicyclists and pedestrians. For example, several companies are working to adapt
their existing video image processing products to accurately count bicyclists and pedestrians.
However, there are several companies (some based in non-US countries) that have been
successfully selling their non-motorized traffic monitoring equipment for more than a decade.
An increased demand for non-motorized traffic monitoring data will provide incentives to
existing companies outside the US as well as other companies that want to develop non-
motorized traffic monitoring products.
Mobile devices with GPS and/or Bluetooth capabilities also provide a means to monitor
small samples of bicyclist and pedestrian traffic. Several cities are evaluating or using these
technologies to gather route choice, origin-destination, and travel time data (e.g., San Francisco,
Austin, and Monterey). However, these technologies do not yet have the capability to count the
total volumes of bicyclist and pedestrians.

17
CHAPTER 2: COUNTING EQUIPMENT GUIDANCE AND
INSTALLATION
The purpose of Chapter 2 was to assist H-GAC with evaluation and determination of best
practices when using bicycle and pedestrian count equipment. In addition, specifications and
procedures for equipment and use of equipment were documented. Specifically, the Texas A&M
Transportation Institute (TTI) served as an advisor to H-GAC staff by performing the following
activities:
Advise H-GAC staff regarding the ideal mix of permanent versus temporary (or
moveable) bicycle and pedestrian counters considering budget constraints and
research objectives.
o The initial recommendation is that H-GAC staff procure pedestrian and bicycle
counting equipment including: one to three permanent counters and two to four
temporary counters.
o The counter numbers may be adjusted depending on cost and availability of local
government partners that agree to install and maintain permanent counters.
Advise H-GAC staff regarding technical specifications and capabilities of counters
based on previous research and experience.
Oversee the installation of an initial set of permanent counters and set up of data
collection mechanisms including (modems, cell network, etc.).
Provide guidance for use of temporary (movable) counters.
Based on the methodology described in Chapter 3 and the available project budget, a mix
of permanent and short duration equipment may be desired. While the project budget allows for
a limited amount of count equipment to be purchased, the collection of non-motorized
transportation data has been identified as an important planning activity. The Federal Highway
Administration (FHWA) Traffic Monitoring Guide Update provides the following justification:
“The prevailing practice for collecting short-duration non-motorized traffic data
has been to focus on targeted locations where activity levels and professional
interest are the highest. Although this non-random site selection may not yield a
statistically-representative regional estimate, it provides a more efficient use of
limited data collection resources (e.g., random samples are likely to result in
many locations with little to no non-motorized use)”.
In previously documented work (see Chapter 1) and ongoing monitoring of the traffic
counting market, TTI reviewed the available products and advised HGAC to procure a mixture
of permanent and short duration counters. It is estimated that the most efficient use of funds is to
18
procure two permanent bike and pedestrian counters. In addition, TTI recommends developing
procedures and parameters to utilize existing pneumatic tube traffic counters for bicycles to
conduct short term counts.
The two permanent counters will be the start of a system to develop adjustment factors
based on area and facility type as outlined in Chapter 3. The short term counts would be
conducted using a combination of: 1) loaning out portable pedestrian counters and 2) providing
procedures, settings, and vehicle classification schemes that can be used with existing agency
and consultants’ vehicle tube count equipment. As part of this project, three pedestrian counters
were purchased with the intent to loan the units out to local agencies to conduct counts in their
jurisdictions. The bicycle counts would be conducted by agencies and consultants using H-
GACs recommended procedures, vehicle classification schemes, and settings.
The purchase of two permanent pedestrian/bicycle counters expended most of the funds
set aside for equipment procurement for this project. The Eco Counters Multi Urban Post count
bikes and pedestrians separately and have the ability to distinguish flow by direction. Aggregated
data is sent via cell modem to internet-based cloud storage where it can be downloaded for
analysis, archival, or analyzed online with vendor supplied analysis and graphing tools. The two
permanent counters could be considered the beginning of a starter counting system that will
mature in time as resources become available to add locations to the system.
In addition to the two Eco Counters, three TRAFx Infrared Trail counters were also
procured by H-GAC for temporary pedestrian counts. These counters were tested and
modifications were made to make them more suitable for installation in the urban environment.
The counters have a long battery life (over a year) and count bidirectional pedestrians at a
moderate cost. Testing and modification to the enclosure was made in order to secure the
equipment and allow for a variety of mounting capabilities such as on street lights, sign poles,
trees, or other fixtures.
The use of automatic pneumatic tube counts was selected for bicycle counts as they were
proven to be effective in counting bicycles and in the region there are several private and public
agencies that currently utilize this equipment for vehicle traffic counts. By utilizing the existing
fleet of equipment and modifying some features and functions, this same counting equipment can
be used to count activity on bicycle facilities. Tube counters were examined closely for the bike
counting application since several agencies and organizations already had equipment and their
technicians familiar with their use. The ultimate goal would be to institutionalize the process of
counting non-motorized facility use by various agencies in the region on a programmatic basis.
The concept is that when a vehicle traffic count is being scheduled or conducted on a facility
with a bike lane, an additional counter or a bike count can be set up so that both bikes and cars
are counted. This minimizes the cost of counting the non-motorized facility. A project-based
bike count program, while useful and serving a purpose could more easily be subject to a line
19
item budget cut. An institutionalization process may not require additional time and could easily
be absorbed within existing schedules and with the use of existing resources as there would be no
incremental cost to buy or maintain specialized equipment. Once personnel become accustomed
to counting non-motorized facilities it is envisioned that non-motorized counts could become
routine.
Draft language for an interlocal agreement for the deployment and use of permanent
and short term counters was provided and modified through H-GAC and local agency legal
departments, as shown in Appendix B. The agreements addressed deployment, operational, and
maintenance responsibilities for both the permanent and short term use devices. The permanent
count equipment agreement indicated that H-GAC would purchase the equipment and the City of
Houston would install and maintain. The agreement for the loan of the portable count equipment
provides roles and responsibilities for the use of the equipment. An example of these documents
is provided in the Appendix C of this memorandum. TTI researchers coordinated and assisted in
the installation of the initial deployment of permanent count equipment on January 22, 2013 at
the MKT/SP-Rails to Trails in the Heights at 5 ½ street and another at White Oak Bayou Trail at
34th
street and TC Jester.
Guidance on the deployment and use of the pedestrian counters is presented in Appendix
D of this document. The pedestrian tip sheet provides suggestions on count location siting,
equipment mounting, and collection of the pedestrian data. A companion tip sheet for the
settings, location and deployment for bicycle counters is shown in Appendix E of this technical
memorandum. These tip sheets provide the user with guidance on recommended settings to
optimize setups to obtain the most accurate counts. Location is critical in counter deployment
and factors such as facility, background, and area or lanes are included in these tip sheets.
Additionally, references to areas in the user manual provide interpretation on some of the most
common deployments. This memo does not include scheduling, inventory lists, and spare parts
to maintain. There have, however, been discussions on how to efficiently manage the counter
inventory using spreadsheets and outlook calendars to schedule and track the equipment.

21
CHAPTER 3: DEVELOP PEDESTRIAN AND BICYCLE
COUNTING PLAN
Bike and pedestrian counts are vital to the planning process. Counts reflect the usage of
existing facilities and can provide insight into the areas and types of bicycle and pedestrian
facilities that are most desired. These counts are also used to provide a feedback loop for
planning model calibration and validation. Bike and pedestrian counts can also be used for trend
analysis to determine seasonal, temporal, and types of facilities most utilized. All of these uses
for bicycle and pedestrian activity data provide guidance on where and how to invest in the
transportation infrastructure.
The purpose of Chapter 3 was to develop a pedestrian and bicycle count program plan.
This plan guides a logical framework of count locations sited based on various important criteria.
The Federal Highway Administration (FHWA) provides some guidance in the Traffic
Monitoring Guide [1]. In the Traffic Monitoring Guide, count locations should be distributed by
area type, facility type and trip purpose. Some of the count location criteria include:
Counts in key pedestrian and bicyclist activity areas or corridors (downtowns, near
schools, parks, and other non-motorized traffic generators.);
Representative count locations in urban, suburban, and rural locations;
Counts in key corridors that can be used to gauge the impacts of future
improvements;
Count locations where counts have been conducted historically; and
Count locations where bicyclist and pedestrian collision numbers are high.
The objectives of this chapter were to:
Identify the existing count locations,
Solicit input from agencies and bike groups on additional count locations,
Determine a framework and criteria to develop a count program, and
Develop a draft count plan for consideration.
EXISTING NON-MOTORIZED TRANSPORTATION SYSTEM COUNTS
Some, but very few, bicycle and pedestrian counts have been done in the Houston region,
but these counts were done infrequently and on a volunteer basis. The most significant efforts
have included:
22
2005 - Institute of Transportation Engineers’ (ITE) National Bicycle and Pedestrian
Documentation Project;
2009 - ITE’s National Bicycle and Pedestrian Documentation Project; and
2009-2012 - City of Houston (COH) short term bike counts.
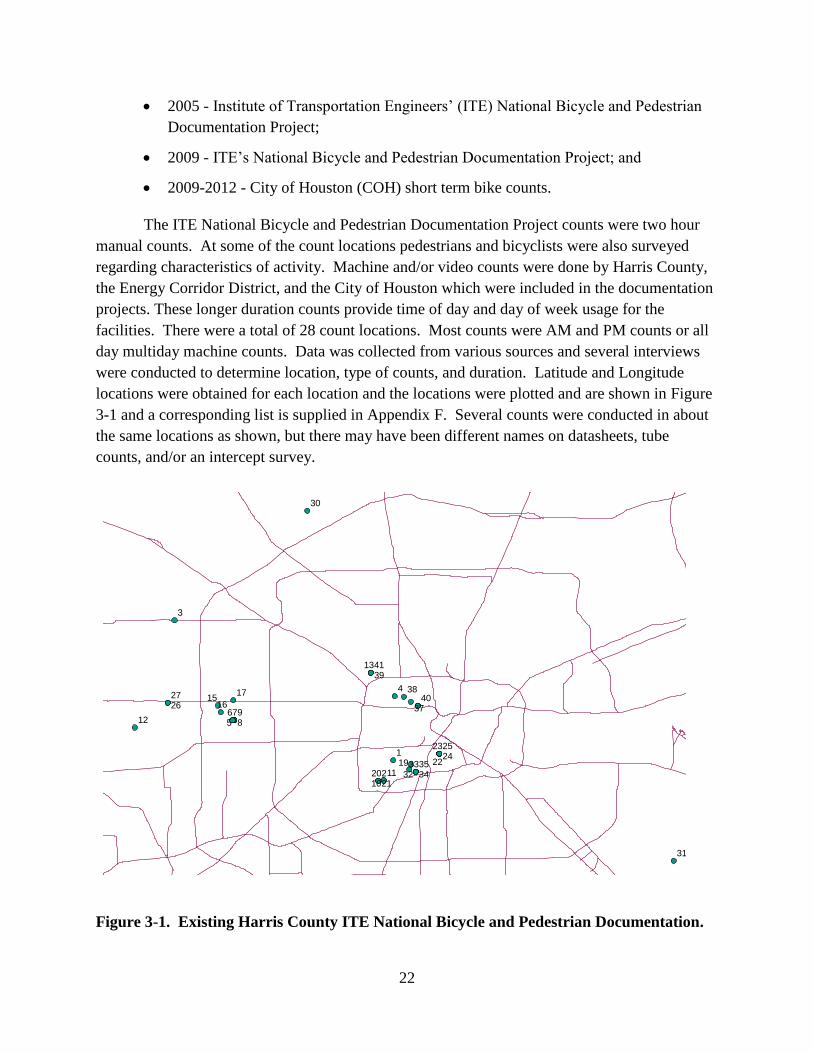
The ITE National Bicycle and Pedestrian Documentation Project counts were two hour
manual counts. At some of the count locations pedestrians and bicyclists were also surveyed
regarding characteristics of activity. Machine and/or video counts were done by Harris County,
the Energy Corridor District, and the City of Houston which were included in the documentation
projects. These longer duration counts provide time of day and day of week usage for the
facilities. There were a total of 28 count locations. Most counts were AM and PM counts or all
day multiday machine counts. Data was collected from various sources and several interviews
were conducted to determine location, type of counts, and duration. Latitude and Longitude
locations were obtained for each location and the locations were plotted and are shown in Figure
3-1 and a corresponding list is supplied in Appendix F. Several counts were conducted in about
the same locations as shown, but there may have been different names on datasheets, tube
counts, and/or an intercept survey.
Figure 3-1. Existing Harris County ITE National Bicycle and Pedestrian Documentation.
98
765
4
3
2
1
41
40
39
38
37
3534
3332
31
30
2726
2524
23
22
2120
19
17
1615
13
12
1110
23
PROJECT AGENCY AND ADVOCACY INPUT
The existing count map was presented to the H-GAC Bicycle and Pedestrian
Subcommittee for review and comment. In addition, the non-motorized demand estimates from
the Chapter 5 modeling effort were reviewed by that subcommittee as well. Input on locations
where there is perceived or actual bicycle and/or pedestrian demand was sought to test
equipment and to submit as potential locations for inclusion in an enhanced regional non-
motorized count program. Both agency representatives and citizen advocates provided potential
count locations for consideration.
Methodology
To plan and operate any transportation facility efficiently and effectively requires good
data. Basic information required for the facilities includes:
Location,
Function,
Capacity,
Condition, and
Facility use.
The first four items are inventory items that vary in degree of implementation in the
Houston region. The focus of this chapter is to determine system use or to determine how much
and how often the bicycle and pedestrian facilities are being used. Other questions can also be
answered such as: which facilities are used most (on street vs. trails); what function facilities
serve (recreation, commute, or utility); and when the facilities are being used (morning or
evening, weekday or weekend; summer or winter).
The bicycle and pedestrians count program was modeled after the vehicular count
program, which uses factors from permanent count locations to adjust a sampling of short
duration traffic counts by:
Time of day,
Day of week (and day to day use due to environmental or weather factors), and
Month and season.
This system of sampling and use of adjustment factors is a logical method to be used to
monitor bicycle and pedestrian infrastructure. A program of bicycle and pedestrian counts would
be conducted at a set of permanent and temporary count locations. The permanent count
24
locations would be used to factor the temporary locations. A matrix or set of groups would be
developed based on area and facility types as shown in Table 3-1. This table is based on the
existing mileage by facility type provided by HGAC. Similar tables could be developed on a
sub-regional or jurisdiction level. A similar table could be developed for pedestrian facilities;
however no pedestrian data was available for this chapter.
Table 3-1. Bicycle Count Matrix Based on Lane Miles of Facility Type and Area Type.
Area Type Bike Lane
Shared Path
or Trail
Share the
Road Sign
Signed
Shoulder
Signed
Share the
Roadway Total
CBD 0.0 5.2 0.0 0.0 7.4 12.6
Urban Intense 55.4 104.3 0.0 0.0 93.4 253.0
Urban Residential 120.5 754.7 1.3 2.1 64.8 943.5
Suburban Residential 42.7 922.4 11.0 25.4 6.2 1,007.7
Rural 18.0 118.4 153.7 54.8 0.0 344.9
Total 236.6 1,905.0 166.0 82.3 171.8 2,561.7
From the literature and the basic non-motorized travel demand model presented in
Chapter 5, a series of count criteria was developed with the underlying focus based on
transportation (or utility) trips as opposed to exercise trips. The transportation trips might
include destinations such as work, school, or social. Utility trips include destinations such as
stores, appointments, friends, and other activities such as going to sporting game or practice and
parks. The count location criteria proposed were as follows.
Count Location Criteria
The proposed bike and pedestrian count locations may be based on the following criteria:
Commuter or Utility Routes
Non recreational routes are preferred since transportation funds are used for these
facilities. Areas around employment centers, retail, etc. should be favored.
Geographically Disbursed Throughout Region
Some consideration was given to distributing the sites geographically to provide a cross
section of users.
Non-Motorized Demand and Supply
The maps developed in Chapter 5 were utilized to identify high demand locations which
would provide some feedback on the model’s relevance.
25
Existing Count Locations
An inventory of existing count locations were developed and plotted. Locations with
high utilization were considered based on meeting other criteria in this list.
Non-University or CBD
While there is higher demand for bike and pedestrian facilities, the facilities are not
typical due to the restrictions on parking and population characteristics.
Mix of Facility Types (bike lanes, trails, etc.)
Some attempt was made to get a cross section of facility types. It was initially envisioned
that the number of count locations per facility type would be based on a percentage of the lane
miles of each type of facility. However it was found that certain types of facilities were
underutilized potentially due to retrofit implementations or locations that do not have the
recommended lane width, poor pavement quality and other substandard design elements.
One Location Per Route
Some routes could be considered for multiple locations but due to limited resources only
one location was selected. Typically the location with the highest volume and with the most
relevance meeting multiple criteria was selected.
Minimum Distance and Connectivity
Very short facilities that are not connected with other facilities were given less
consideration since the likelihood of the facility being used as a commute or utility trip were
limited. A distance of four miles for bike routes and one mile for pedestrian routes was
used. The distance is based on the assumed distance a typical person would use a given type of
facility.
Detection Technology Criteria
Specific site location was based in criteria that produced the best results from a given
count technology. Infrared pedestrian detector needs to be aimed toward pedestrians with no
movement in the background (shoot away from roadway). In addition, a pedestrian detector
needs a location to mount the box (i.e. a light post works well). For bike and pedestrian
detection, areas of free flow are most desired. Areas at intersections where someone would stop
would not produce accurate counts.
26
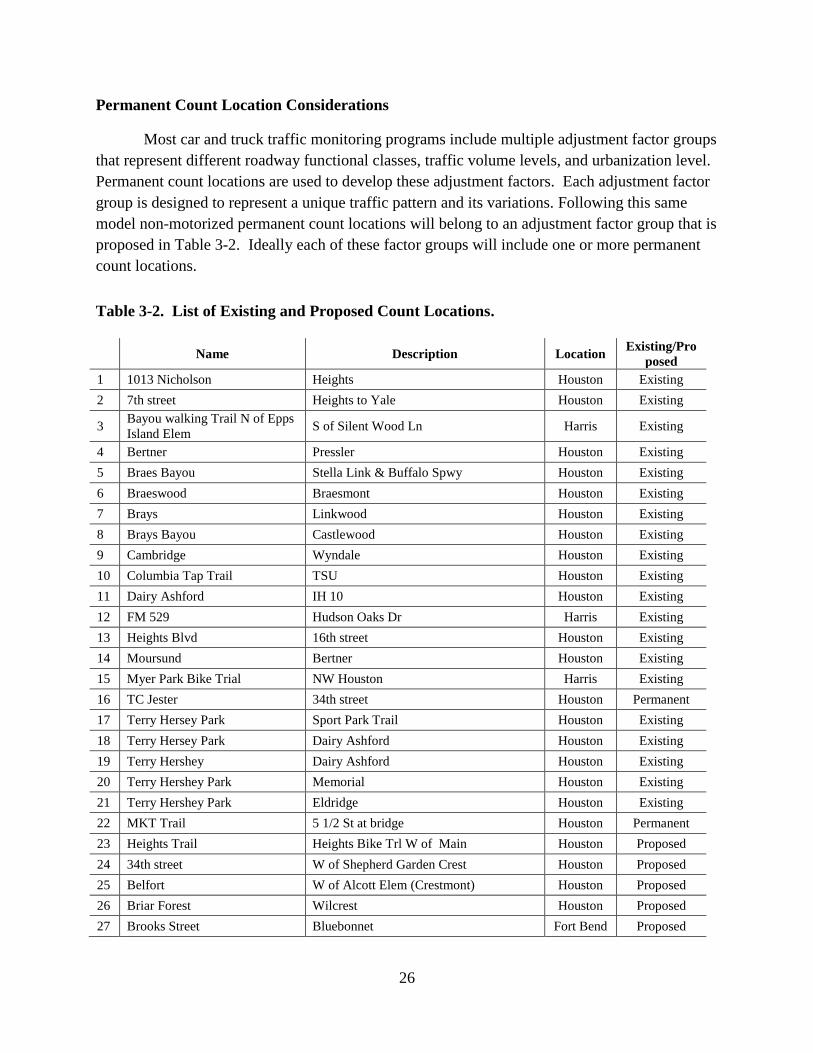
Permanent Count Location Considerations
Most car and truck traffic monitoring programs include multiple adjustment factor groups
that represent different roadway functional classes, traffic volume levels, and urbanization level.
Permanent count locations are used to develop these adjustment factors. Each adjustment factor
group is designed to represent a unique traffic pattern and its variations. Following this same
model non-motorized permanent count locations will belong to an adjustment factor group that is
proposed in Table 3-2. Ideally each of these factor groups will include one or more permanent
count locations.
Table 3-2. List of Existing and Proposed Count Locations.
Name Description Location
Existing/Pro
posed
1 1013 Nicholson Heights Houston Existing
2 7th street Heights to Yale Houston Existing
3 Bayou walking Trail N of Epps
Island Elem S of Silent Wood Ln Harris Existing
4 Bertner Pressler Houston Existing
5 Braes Bayou Stella Link & Buffalo Spwy Houston Existing
6 Braeswood Braesmont Houston Existing
7 Brays Linkwood Houston Existing
8 Brays Bayou Castlewood Houston Existing
9 Cambridge Wyndale Houston Existing
10 Columbia Tap Trail TSU Houston Existing
11 Dairy Ashford IH 10 Houston Existing
12 FM 529 Hudson Oaks Dr Harris Existing
13 Heights Blvd 16th street Houston Existing
14 Moursund Bertner Houston Existing
15 Myer Park Bike Trial NW Houston Harris Existing
16 TC Jester 34th street Houston Permanent
17 Terry Hersey Park Sport Park Trail Houston Existing
18 Terry Hersey Park Dairy Ashford Houston Existing
19 Terry Hershey Dairy Ashford Houston Existing
20 Terry Hershey Park Memorial Houston Existing
21 Terry Hershey Park Eldridge Houston Existing
22 MKT Trail 5 1/2 St at bridge Houston Permanent
23 Heights Trail Heights Bike Trl W of Main Houston Proposed
24 34th street W of Shepherd Garden Crest Houston Proposed
25 Belfort W of Alcott Elem (Crestmont) Houston Proposed
26 Briar Forest Wilcrest Houston Proposed
27 Brooks Street Bluebonnet Fort Bend Proposed
27
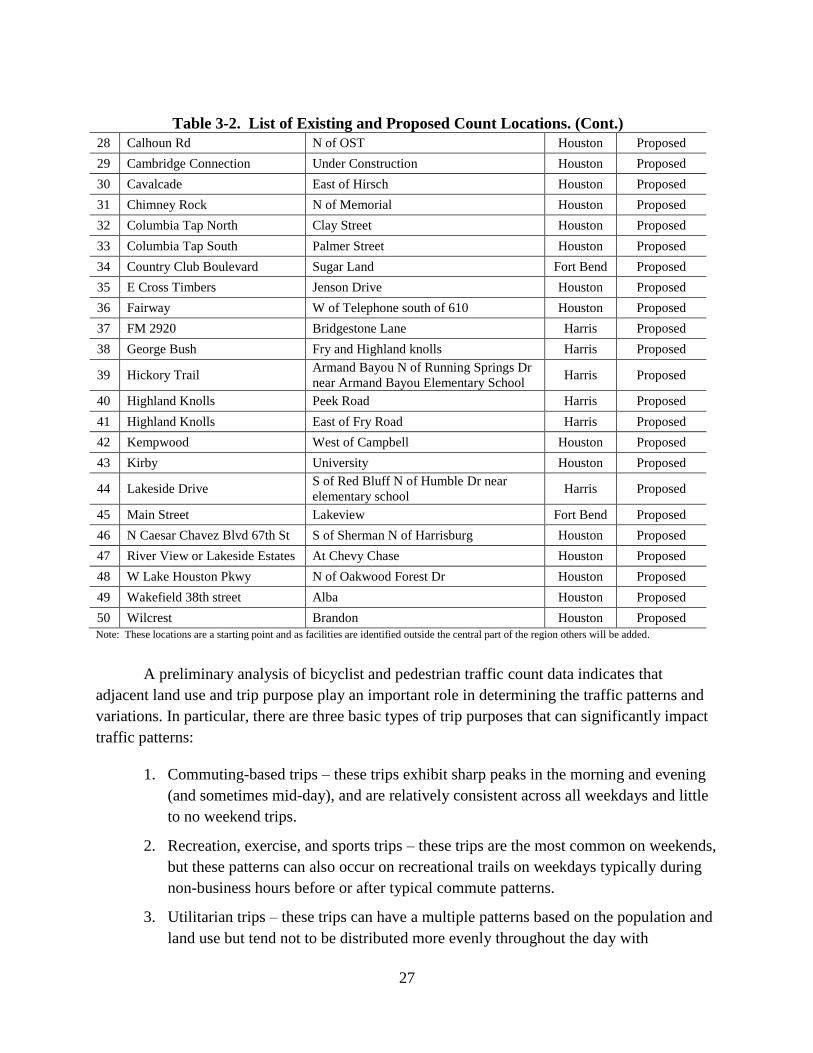
Table 3-2. List of Existing and Proposed Count Locations. (Cont.)
28 Calhoun Rd N of OST Houston Proposed
29 Cambridge Connection Under Construction Houston Proposed
30 Cavalcade East of Hirsch Houston Proposed
31 Chimney Rock N of Memorial Houston Proposed
32 Columbia Tap North Clay Street Houston Proposed
33 Columbia Tap South Palmer Street Houston Proposed
34 Country Club Boulevard Sugar Land Fort Bend Proposed
35 E Cross Timbers Jenson Drive Houston Proposed
36 Fairway W of Telephone south of 610 Houston Proposed
37 FM 2920 Bridgestone Lane Harris Proposed
38 George Bush Fry and Highland knolls Harris Proposed
39 Hickory Trail Armand Bayou N of Running Springs Dr
near Armand Bayou Elementary School Harris Proposed
40 Highland Knolls Peek Road Harris Proposed
41 Highland Knolls East of Fry Road Harris Proposed
42 Kempwood West of Campbell Houston Proposed
43 Kirby University Houston Proposed
44 Lakeside Drive S of Red Bluff N of Humble Dr near
elementary school Harris Proposed
45 Main Street Lakeview Fort Bend Proposed
46 N Caesar Chavez Blvd 67th St S of Sherman N of Harrisburg Houston Proposed
47 River View or Lakeside Estates At Chevy Chase Houston Proposed
48 W Lake Houston Pkwy N of Oakwood Forest Dr Houston Proposed
49 Wakefield 38th street Alba Houston Proposed
50 Wilcrest Brandon Houston Proposed
Note: These locations are a starting point and as facilities are identified outside the central part of the region others will be added.
A preliminary analysis of bicyclist and pedestrian traffic count data indicates that
adjacent land use and trip purpose play an important role in determining the traffic patterns and
variations. In particular, there are three basic types of trip purposes that can significantly impact
traffic patterns:
1. Commuting-based trips – these trips exhibit sharp peaks in the morning and evening
(and sometimes mid-day), and are relatively consistent across all weekdays and little
to no weekend trips.
2. Recreation, exercise, and sports trips – these trips are the most common on weekends,
but these patterns can also occur on recreational trails on weekdays typically during
non-business hours before or after typical commute patterns.
3. Utilitarian trips – these trips can have a multiple patterns based on the population and
land use but tend not to be distributed more evenly throughout the day with
28
wider/longer AM and PM peaks than the AM and PM commuting peaks. In addition,
weekends are as common as weekdays. Trips such as shopping, personal business,
school, church, doctor or visiting friends are examples of utilitarian trips.
In reality, most permanent monitoring locations will have a mix of commuting,
recreational, and utilitarian trips represented in the counts. For HGAC permanent monitoring
locations, we are recommending that sites be selected that are believed to be primarily either
commuting or recreational in characteristic. For example, if two permanent monitoring locations
will be installed in the first phase of deployment, we would recommend that one of the
permanent locations should be on a facility believed to be used primarily for commuting trips;
and the other is placed on a facility at a location where trips are believed to be recreational.
Subsequent permanent locations should “fill in the gaps” and could provide counts on facilities
considered to carry a mixture of commuting, recreational, and utilitarian trips.
When selecting these first two monitoring locations, the following criteria should be
used:
One location should be located on a facility in a location with trips perceived as
primarily commuting, and one location should be located with primarily recreational
trips.
There should be consistent and fairly high use. Selection should not necessarily be for
the absolute highest use location, but a location with a combination of consistent and
moderately high use.
The monitoring locations should be representative and typical of many other locations,
as the traffic patterns at these permanent locations will be used to annualize counts
from numerous other locations.
The locations could be chosen in an area that will receive infrastructure investments or
redevelopment to encourage bicycling and walking (i.e., strategically located to
support a future before-after study).
Development of a Draft Count Plan
The above criteria were used to develop a draft count plan that was presented to the
Bicycle and Pedestrian Subcommittee for review and comment. No comments were received
during or after the meeting. Figure 3-2 and Table 3-2 show the proposed short term count
locations for the H-GAC region. The majority of the count locations are within Harris County.
The locations were based on non-motorized network that was available and recommendations
from agencies. There are likely other facilities in other counties and those should be added as
locations are identified and as non-motorized networks are inventoried.
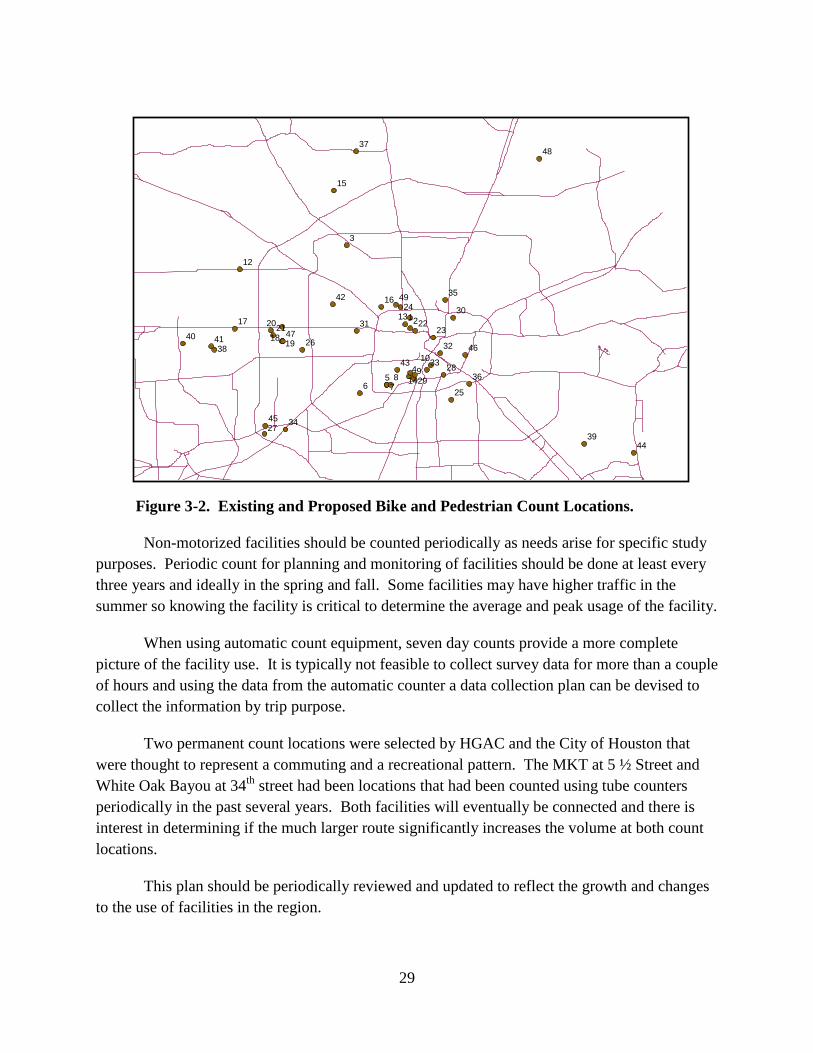
29
Figure 3-2. Existing and Proposed Bike and Pedestrian Count Locations.
Non-motorized facilities should be counted periodically as needs arise for specific study
purposes. Periodic count for planning and monitoring of facilities should be done at least every
three years and ideally in the spring and fall. Some facilities may have higher traffic in the
summer so knowing the facility is critical to determine the average and peak usage of the facility.
When using automatic count equipment, seven day counts provide a more complete
picture of the facility use. It is typically not feasible to collect survey data for more than a couple
of hours and using the data from the automatic counter a data collection plan can be devised to
collect the information by trip purpose.
Two permanent count locations were selected by HGAC and the City of Houston that
were thought to represent a commuting and a recreational pattern. The MKT at 5 ½ Street and
White Oak Bayou at 34th
street had been locations that had been counted using tube counters
periodically in the past several years. Both facilities will eventually be connected and there is
interest in determining if the much larger route significantly increases the volume at both count
locations.
This plan should be periodically reviewed and updated to reflect the growth and changes
to the use of facilities in the region.
98
765
4
3
21
49
48
47
46
45
44
43
42
4140
39
38
37
36
35
34
33
32
31
30
29
28
27
26
25
24
2322
2120
1918
17
16
15
14
13
12
10

30
31
CHAPTER 4. DATA COLLECTION AND REPORTING STRUCTURE
STATEMENT OF THE PROBLEM
Chapter 4, Data Collection and Reporting Structure of the Pedestrian-Bicycle Counting
and Demand Estimation Study documents a framework for collection and documentation of
pedestrian and bicycle count data based on national standards, including the National Bicycle
and Pedestrian Documentation Project.
Currently little pedestrian and bicycle count data has been collected. The information
that was collected was only available in paper form in a series of folders and binders held by a
retired county employee. The information was not kept in a central repository for agency
members to see or use. The goal of this project is to collect and use non-motorized traffic counts
for planning and monitoring of projects. To make the data collected more useful, it will need to
be stored in an accessible format and retained so that trends, model calibration and validation can
be conducted as well as other planning and engineering work. This chapter will document the
data elements that will need to be captured and stored.
The reporting structure will enable H-GAC staff to utilize pedestrian and bicycle count
data from outside data collection efforts (e. g., volunteer spot counts) and integrate it with
ongoing count data collected through both permanent and temporary counters deployed
throughout the region. This memorandum includes a summary of:
Previous non-motorized counting efforts in the region and to ensure that other counts
(i.e., those undertaken by the City of Houston and/or Houston Parks Board) are
incorporated into data collection and consolidation efforts.
Investigate data storage needs including data aggregation levels, data types, and data
descriptions;
Investigate existing data warehouse tools and off-the-shelf products; and
Develop methods to extrapolate spot count data into daily/annual use estimates based on
data collected through permanent count locations.
The information in this chapter memo is based largely on guidance provided by the
FHWA Traffic Monitoring Guide and the standard for the National Bicycle and Pedestrian
Documentation Project (NBPD). NBPD suggests that information gathered in the region should
be collected, reported and stored in the local, regional and national database to provide a better
understanding of the characteristics and use of local facilities.
A regional database should be established to backup and archive the online data from the
permanent counters and to provide a repository for temporary (spot- or limited-duration) bicycle
32
and pedestrian counts. This database should also provide storage for the raw data files from
various count sources. The database will assist in the analysis and modeling of non-motorized
facilities. A phased implementation of a system of regular bicycle and pedestrian counts and
monitoring sites in the eight county H-GAC Transportation Management Area will give HGAC
and local government adequate data to:
Understand usage of pedestrian and bicyclist facilities in a variety of regional
development contexts.
Adjust calculations on estimated air quality benefits of pedestrian and bicyclist facilities
based on data collected in the region on facility usage.
Estimate demand or usage of planned or proposed pedestrian and bicyclist facilities for
project evaluation and selection purposes.
Existing Counts
Only a few non-motorized transportation counts have been conducted in the Houston
region. The locations (and data) of the existing counts have been collected, assembled in a
spreadsheet, mapped and documented in Chapter 3 of this project. Those locations have been
submitted to the National Pedestrian and Bicycle Documentation Project. The City of Houston,
the Energy Corridor District, and Harris County Public Infrastructure Department all participated
in the National Pedestrian and Bicycle Documentation Project counts in 2005 and 2010. The
Houston Parks Department also completed manual counts on walking trails in Herman and
Memorial Park several years ago but no data was provided.
Local jurisdictions and agencies should be encouraged to collect and submit data to be
included in a regional database for a variety of reasons.
Regular counts on non-motorized facilities will more consistently provide documentation
of the demand, use, and benefits of the investment in these active modes of
transportation.
Non-motorized counts can provide information to validate and calibrate travel demand
and air quality models.
A regional database will provide a framework for the documentation process and help
move the state-of-the-practice forward.
Data can be shared to help better understand the characteristics of these non-motorized
modes.
The better the understanding of the characteristics that make a facility successful and well
utilized will provide planners and engineers the information to guide future transportation
investment.
More data will also provide better insight into regional adjustment factors which can be
developed over time with enough input from the agencies.

33
Database Needs
There is a need for a central repository or data warehouse for non-motorized traffic data.
Regional transportation models and a newly developed non-motorized travel demand model will
use this data for validation and calibration and other regional planning efforts. The database can
be used to quantify existing use characteristics, development of regional adjustment factors, and
usage trend analysis. This repository should be both a database and storage for traffic,
pedestrian, and bicycle count files. The database can be used for ease of access and the storage
will allow future data analysis and/or back up of the raw data files. The data warehouse should
have the flexibility to store data to be used locally and for submission to the Bicycle and
Pedestrian Documentation Project or what is proposed to be a federal data submission process.
An internet search for traffic count (vehicle, bike/pedestrian) databases indicated that
most agencies have a database that was developed in-house, by a consultant, or was vendor
specific. An off-the-shelf software or online software for traffic data storage was not identified.
The non-motorized count technology is still an emerging field, but as it matures a data
warehouse option may become commercially available. As a start, some agencies have vehicular
traffic volume databases that could be modified to incorporate non-motorized traffic.
A data warehouse including non-motorized traffic data should have the capability of
accommodating these types of data:
Pedestrian and bicycle volume data
Raw and summarized volume and travel survey data
Temporary station and permanent count station data
Data in minimum 5 minute intervals, with ability to aggregate to 15 minute, hourly,
daily, weekly, monthly and yearly count data
Raw data files with standard metadata convention to detail agency, date, location, and
other factors listed in the Traffic Monitoring Guide (TMG) and this tech memo
Storage and reporting of automatic, manual, and intercept travel survey data
Data description elements
Data warehouse elements are detailed in Chapter 7 of the Traffic Monitoring Guide. The
highlights are provided below.
Database Elements
Nationally, practitioners are gathering data from across the nation to understand what
characteristics influence the use of bicycle and pedestrian facilities. When pedestrian and
bicycle counts are collected, reduced and analyzed, several elements should be included in the
34
resulting data file. These elements can be used to help analysts track usage patterns over time
and allow other agencies to mine the data to develop adjustment factors (by time of day, day of
week, and season), as well as develop estimates of use based on facility type, land use, and other
demographic characteristics.
The Traffic Monitoring Guide (TMG) provided by FHWA is intended for state highway
agencies to provide good practice and to improve the quality, availability, and reduce the cost of
data collection. The TMG supplies temporal data to understand the differences between short
term and continuous count locations. One of the main sources of information is the Highway
Performance Monitoring System (HPMS) data. The TMG provides a framework for short term
and in the most recent update has included a chapter on non-motorized traffic data. Chapter 7 of
the TMG provides a specific format for data elements to be included in a national database.
There are many critical and optional data fields which should be included in the database if
available. In general, the data elements include:
Latitude
Longitude
Direction of Route
Direction of Travel
Facility Type
Type of Sensor
Weather Information
Date and Time
Count Interval
Other items that should be considered for local use are:
Agency that conducted count
Agency Reference File Number - if applicable
Location Description – local name of facility and nearest cross street
Street Address
Facility Type (side walk, off street trail, bike lane, etc.)
Adjacent Facility Type (major collector, arterial, frontage road, etc.)
Average Daily Traffic (ADT) or 24 hour count of the non-motorized facility
Count Description - (monitoring, special study, special event)
35
Traffic Generators – (pedestrian traffic counted on sidewalk 100 yards from the ABC
Youth Baseball complex)
Condition – typical, construction, holiday, special event, etc.
User Type - group of users that are reflected by the data (recreational, commuting,
utility, hybrid)
Local Facility Type (bike lane, shared lane, shared use path, other)
Land Use Characteristics (person density, intersection density, land use density, etc.)
Adjustment Factors
Adjustment factors are used to extrapolate estimates of daily, monthly, and/or annual user
counts based on counts done during any period of a day, a month, or a year. Over time local
permanent traffic counters will be used to develop local adjustment factors based on facility type,
area type, day, month, and year. The development and application of adjustment factors are best
achieved with local data; however, there is currently a lack of local data in the system. With the
installation of the permanent counters along the MKT and White Oak Bayou, these local factors
can be used within a year or so to adjust counts along other similar trails in areas with similar
demographics. Not all counts in the Houston area can be normalized with factors generated from
these two permanent count stations. Additional permanent count locations based on
demographics and facility type will be needed to accurately adjust those counts. Through
engineering judgment, week long counts may be able to be normalized using these local factors
but with a higher degree of error.
Existing methods for extrapolating spot counts using local factors were identified in the
ITE Manual of Transportation Engineering Studies and in the Bicycle and Pedestrian
Documentation project. The procedures are best described at the National Bicycle and
Pedestrian Documentation Project (NBPDP) that allows for an average of counts to be used to
provide an estimate of day, month, and year count. More information can be found here:
http://bikepeddocumentation.org/. These factors shown in the NBPDP are only available for
multi-use paths and higher density pedestrian and entertainment areas. These are only estimates
and there is no substitute for actual data. All facilities are highly variable due to local users,
seasonal factors, and the use of the facility. Once local factors are available, the same
methodology would be used to extrapolate temporary counts for planning purposes.

36
37
CHAPTER 5: MODELING REGIONAL NON-MOTORIZED TRAVEL
IN H-GAC AREA
Chapter 5 is divided into three general sections. The first section reviews the researches
and practices in the non-motorized demand estimation. The second section documents the
development of a framework for estimating the demand and the ranking procedure of an area or
road linked to non-motorized travel. The last section gives examples of how to use the
developed framework to evaluate the non-motorized improvement projects.
LITERATURE REVIEW
When it comes to the investment decision for walking and biking facilities, identification
of the most suitable location is of great interest to the planning organizations and decision
makers. However, despite the importance, to date there has not been an established set of
techniques or procedures to estimate the demand for walking and biking. The goal of this review
is to focus on the major efforts in non-motorized demand modeling. Instead of reviewing a
broad range of research, this review introduces a few national level efforts that have summarized
most of the works in the field. In addition, this study also looks at recent local efforts to estimate
the demand for walking and biking in the H-GAC area.
Nation-Wide Walking and Biking Modeling Effort Guidebook on Methods to Estimate
Non-Motorized Travel (1)
There have been numerous efforts to model walking and biking demand over the years.
The 1999 FHWA report gives a comprehensive review on the subject. The report categorized
the demand modeling effort into five major methods, namely 1) comparison studies, 2) aggregate
behavior studies, 3) sketch plan methods, 4) discrete choice models, and 5) regional travel
models. In the report, biking and walking demand were collectively referred in terms of
modeling effort, although the differences between the two non-motorized transportation modes
were briefly introduced. This research report evaluated these methods by five factors that
include ease of use, data requirements, accuracy, sensitivity to design factors, and widely used.
The five major demand methods and their evaluation by the chapter are summarized
below.
1. The comparison studies use the observed results on walking or bicycling rate change
to predict the change in another area assuming all other influencing factors are
roughly the same between the two situations.
2. The aggregate behavior studies apply the relationship of travel behavior
characteristics for an aggregate population to predict mode split for non-motorized
modes. Both of these two methods are relatively easy to use and have relatively low
38
data requirement, it is believed the methods had low explanatory power, hence
produce low accuracy results.
3. A sketch plan method is a step forward in terms of the estimation method. It applies
the easy-to-collect data (such as census and land use data) to estimate the non-
motorized travel (NMT) at the facility level. The report concludes that this method
tends to be relatively simple to understand and apply, and could have reasonable
results if the variables selected carefully. However, the disadvantages are that 1) the
limited local data and general assumptions about behavior may hinder the precision of
the results and 2) the transferability of model to another geographic area may be
questionable due to the local conditions. The discrete choice model and regional
travel model are comprehensive modeling efforts. Both methods require collection of
extensive data.
4. A discrete choice model predicts the likeliness of a choice (mode, route, and time) as
a function of variables including factors describing a facility improvement or policy
changes. Discrete choice models are widely used by the modelers to predict auto vs.
non-auto mode choice. The limitation of the model is the identification and applying
of influencing factors in the modeling effort. The transferability of the model can
also be limited.
5. Regional travel model, also known as the four-step travel demand model, uses the
land use conditions, transportation network characteristics, along with the human
behavior models to predict future travel patterns. The models have been traditionally
used to predict auto and transit trips. Many planning organizations have been
modifying the models to integrate biking and walking facility and to predict the
biking and walking trips. However, due to the large amount of data required,
including the inventory of existing biking and walking facilities and land use factors
not included in the auto trips modeling, it has not become a widely used method.
This chapter concludes that biking and walking demand modeling is an evolving field
and creative thought is needed in the real world. Three areas of future research were identified
by the report:
Development of a manual for bicycle and pedestrian sketch-planning. The report
concludes that such a manual would help the practitioners to easily yet effectively
estimate the demand even without the resources and expertise.
Further research on factors influencing non-motorized travel behavior. Research on
identification of influencing factors, how these factors interact, and how to
incorporate these factors into the models would be helpful to improve the modeling
techniques.
39
Integration of bicycle and pedestrian considerations into mainstream transportation
models and planning. The report suggested that the inclusion would put biking and
walking on more equal status with the motorized modes.
Guidelines for Analysis of Investments in Bicycle Facilities (2)
The National Cooperative Highway Research Program (NCHRP) project 07-14 also
reviewed the effort on estimating bicycling demand and characterized the work into two major
approaches which are 1) the models that establish a relationship between the amount of bicycling
and the influencing factors including demographic, policy, land use, facilities environment, and
etc. and 2) the approach use an established census commute-to-work share, combined with other
data, to provide an area specific baseline of bicycle usage. This chapter found that most of the
past work follows the first kind of approach.
The chapter reports that these two approaches are completely different ways of
approaching the problem: the first approach relies on the assumption that the relationships
between demand and identified influencing factors will be stable over time and transferable from
place to place, the second one relies more directly on what is known to be true about demand in a
given area. One limitation of the second approach is that it does not directly relate demand to
changes in the underlying environment. However, the chapter believes that “it is more accurate
to base predictions on known facts than on theoretical and possibly unproven relationships”,
especially within the short to medium forecasting time frames.
This chapter also reviewed the five methods evaluated in the 1999 FHWA report.
However, this report has different viewpoints about the evaluation. This chapter believes that the
sketch planning method could be rather accurate and yield comparative level of estimation as the
more comprehensive modeling efforts. It suggests the method is especially useful for the
planners to do a risk analysis since the degree of accuracy can be known. The chapter does not
suggest the discrete choice and regional travel models are appropriate for modeling bicycle travel
because of the “unobservable” factors playing a greater role in determining bicycle travel than in
auto or transit travel.
The chapter used the sketch planning method developed for the Twin Cities area as an
example to illustrate that 1) factors such as local attitudes and perhaps history play a substantial
role in choosing bicycle travel, and 2) although the range of estimation by different methods can
be large in relative terms, the difference is small in absolute terms. The conclusion was that the
decision based on the demand estimation for major investments of walking and biking
infrastructure is generally sound despite of somewhat less accurate estimation.
40
Estimating Bicycling and Walking for Planning and Project Development (3)
One research effort still in progress is the NCHRP project 08-78. This study can be
viewed as one of the follow up studies to the 1999 FHWA study to develop a manual for the
practitioners to easily yet effectively estimate the demand.
The objective of the research is to prepare a guidebook for practitioners on estimating and
forecasting bicycling and walking activity. The guidebook will include transferrable methods for
practitioners working on regional-, corridor-, and project-level analysis to estimate and forecast
bicycling and walking activity in relation to transportation infrastructure characteristics, land use,
topography, weather/climate, and socio-demographic characteristics.
An interim report documenting primary results from several chapters has been submitted.
The research project is expected to be done by the first half of 2013.
H-GAC Area-wide Walking and Biking Modeling Effort
The 2010 Pedestrian and Bicycle Special District Study was based on the 2004 study to
“identify districts where there are significant opportunities to replace vehicle trips with
pedestrian or bicycle trips and to improve pedestrian and bicycle safety.”(4)
The study identified destinations or attractors for biking and walking and assigned a one-
half mile radius, a compromised distance for both walking and biking, to form the area of
analysis (district) for each destination point. The values of a series of indicators (as seen in Table
5-1) originally identified to be correlated to the likeliness of biking and walking in the 2004
study were collected for each district. A score was calculated for each district based on these
values. These districts were then grouped into super neighborhoods due to the close vicinity
with each other. Top 25 districts with the highest score were identified. It was found that high
scoring districts are concentrated in urbanized areas within the city of Houston where population
and employment densities are high, mixed land uses are found, and transit access is widespread.
The method used by the study can be viewed as the first approach described by the
NCHRP 07-14, which links the usage of walking and biking to a series of infrastructure and land
use factors. Although the study considered many influencing factors, no existing collected
counts or household survey data was used to verify the findings. As stated by the report, the
study was intended to serve as a starting point for further study and investment for biking and
walking projects in the H-GAC area, rather than suggesting investment for the high scoring areas
only.
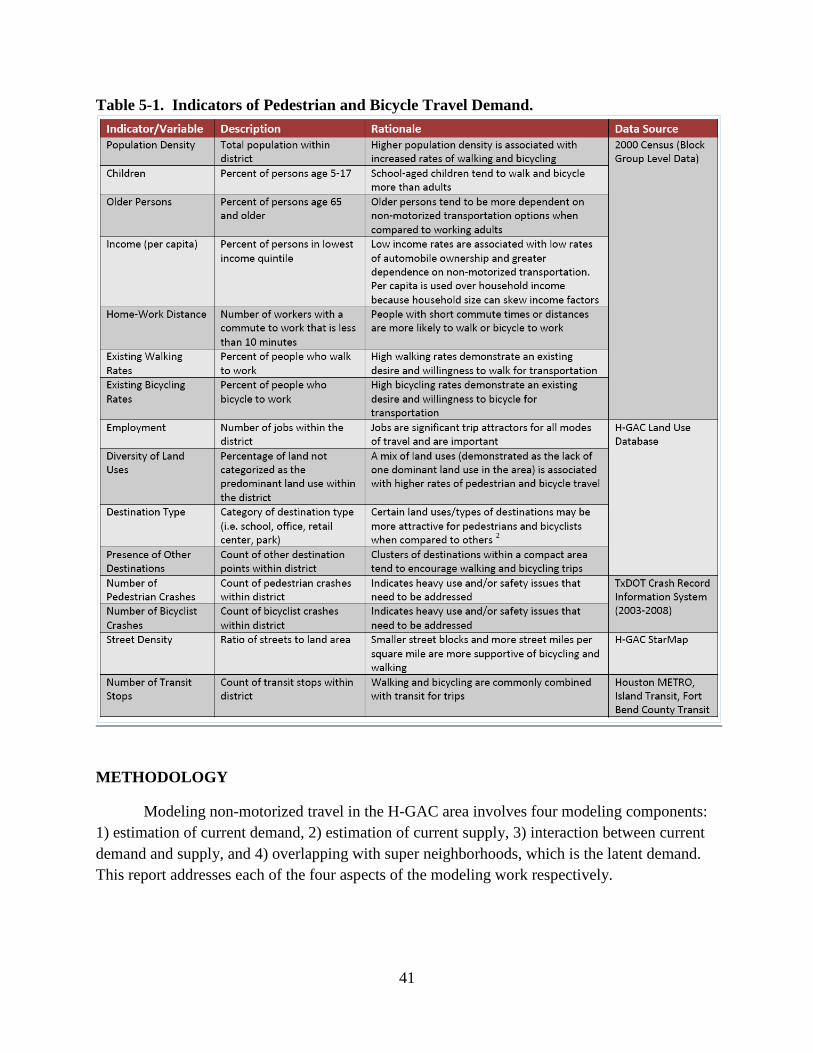
41
Table 5-1. Indicators of Pedestrian and Bicycle Travel Demand.
METHODOLOGY
Modeling non-motorized travel in the H-GAC area involves four modeling components:
1) estimation of current demand, 2) estimation of current supply, 3) interaction between current
demand and supply, and 4) overlapping with super neighborhoods, which is the latent demand.
This report addresses each of the four aspects of the modeling work respectively.
42
Non-Motorized Travel Current Demand
The data used for estimating current demand comes from the H-GAC regional
transportation study 2008 household survey conducted by travel survey group of the Texas A&M
Transportation Institute (TTI). The 2008 H-GAC household survey obtained data and
information on 5,807 households randomly selected in Brazoria, Chambers, Fort Bend,
Galveston, Harris, Liberty, Montgomery, and Waller Counties. The survey data were processed
and expanded to prepare estimates of travel by pre-defined trip purposes.
There are nine different trip purposes used in H-GAC, they are:
Home Based work (HBW),
Home Based Non-Work (HBNW) Retail,
Home Based Non-Work (HBNW) Airport,
Home Based Non-Work (HBNW) Other,
Home Based Non-Work (HBNW) / Non-Home Based (NHB) Education (K to 12) –
School Bus only,
Home Based Non-Work (HBNW) / Non-Home Based (NHB) Education (K to 12) –
by other,
Home Based Non-Work (HBNW) Education (Post Secondary),
Non-Home Based Work (NHBW),
Non-Home Based Other (NHBO).
Stratified trip rates were developed based on the estimated number of trips and number of
households for each trip purpose by worker stratification. Trip rates were developed for person,
motorized, walk and bike trips. Small stratified sampling surveys typically produce results that
are not always consistent with logic or rational. A manual smoothing process was done to
reduce what is referred to as sampling noise. This smoothing process is based on professional
judgement in combination with statistical data from the survey. In all cases, the results are
constrained to produce the same total estimates of travel for each trip purpose.
The resulting walk and bike trip rates for all trip purposes were obtained from the H-
GAC survey results. The summation of these trips by each Traffic Analysis Zone (TAZ)
constitutes the demand of the non-motorized travel. A geographic information system (GIS)
application was used to join the walk, bike, and the sum of the walk and bike (non-motorized)
trips to a TAZ GIS map. The current demand of non-motorized travel by TAZ for the H-GAC
area is shown in Figures 5-1, 5-2 and 5-3.
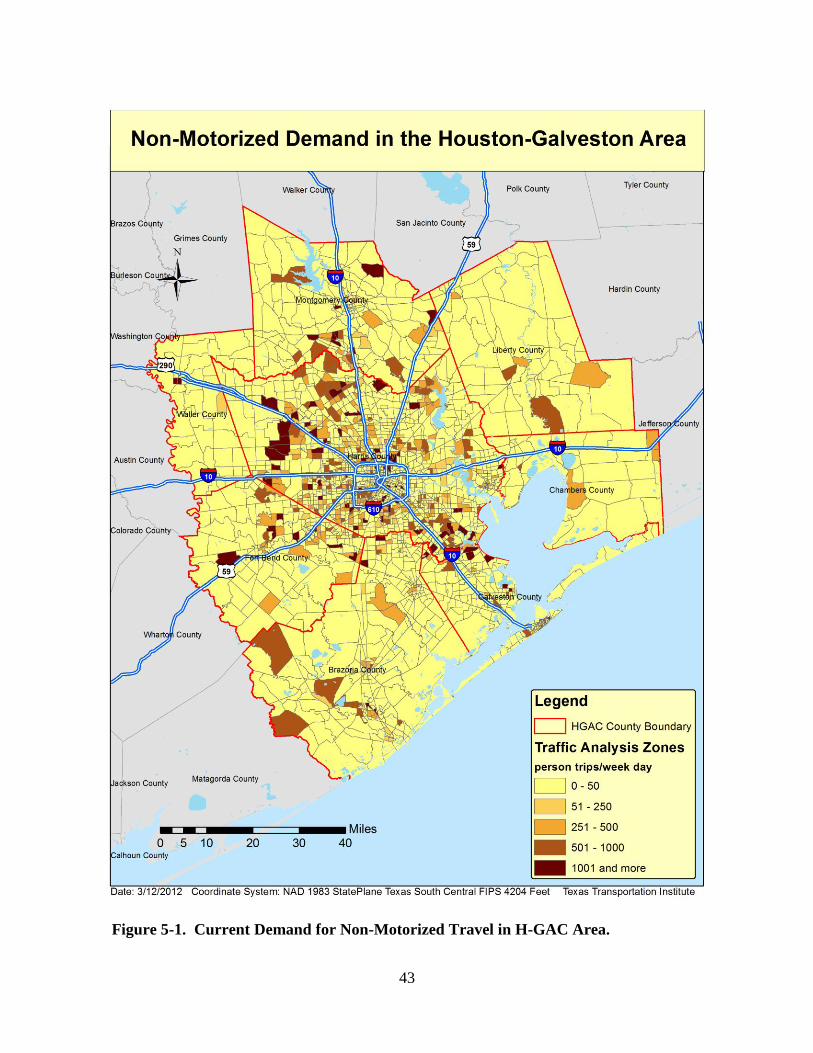
43
Figure 5-1. Current Demand for Non-Motorized Travel in H-GAC Area.

44
Figure 5-2. Current Demand for Walking Travel in H-GAC Area.
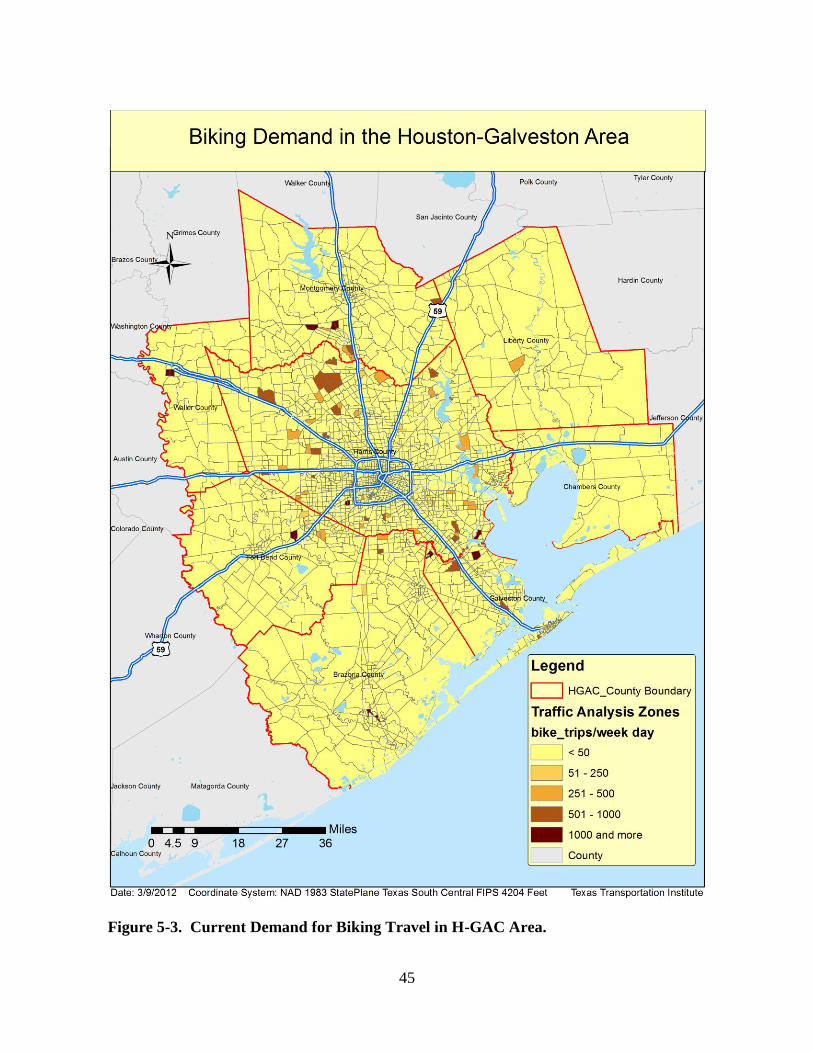
45
Figure 5-3. Current Demand for Biking Travel in H-GAC Area.
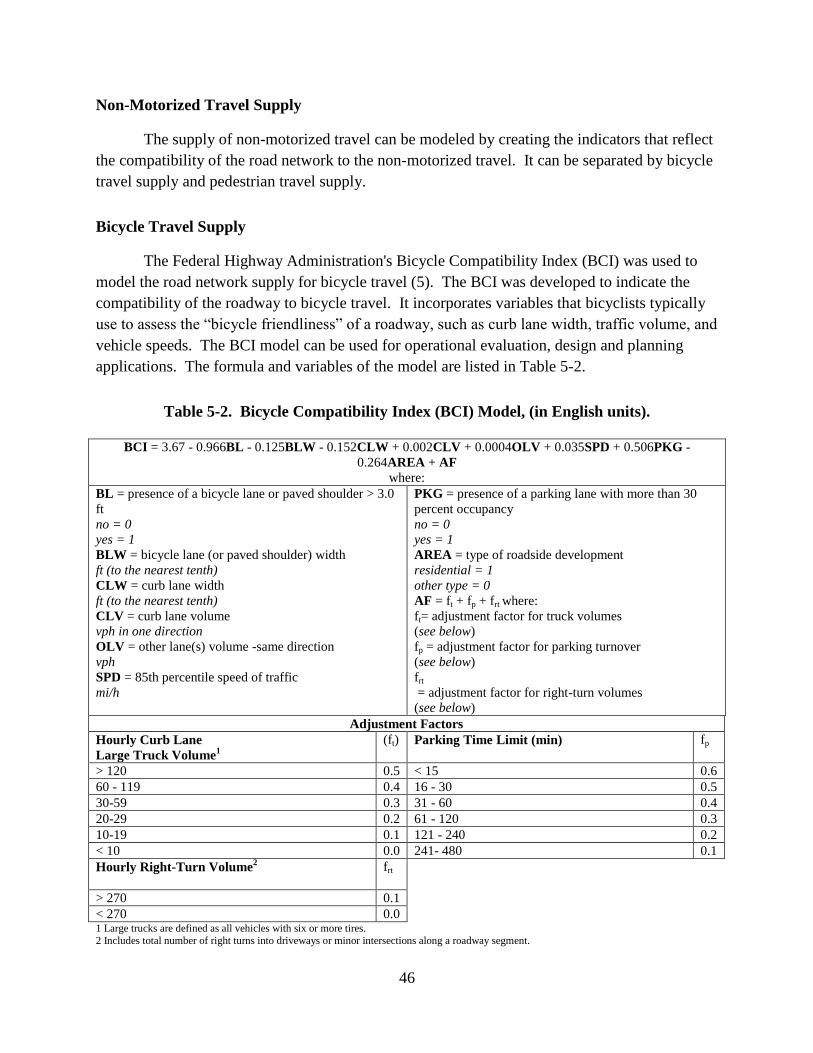
46
Non-Motorized Travel Supply
The supply of non-motorized travel can be modeled by creating the indicators that reflect
the compatibility of the road network to the non-motorized travel. It can be separated by bicycle
travel supply and pedestrian travel supply.
Bicycle Travel Supply
The Federal Highway Administration's Bicycle Compatibility Index (BCI) was used to
model the road network supply for bicycle travel (5). The BCI was developed to indicate the
compatibility of the roadway to bicycle travel. It incorporates variables that bicyclists typically
use to assess the “bicycle friendliness” of a roadway, such as curb lane width, traffic volume, and
vehicle speeds. The BCI model can be used for operational evaluation, design and planning
applications. The formula and variables of the model are listed in Table 5-2.
Table 5-2. Bicycle Compatibility Index (BCI) Model, (in English units).
BCI = 3.67 - 0.966BL - 0.125BLW - 0.152CLW + 0.002CLV + 0.0004OLV + 0.035SPD + 0.506PKG -
0.264AREA + AF
where:
BL = presence of a bicycle lane or paved shoulder > 3.0
ft
no = 0
yes = 1
BLW = bicycle lane (or paved shoulder) width
ft (to the nearest tenth)
CLW = curb lane width
ft (to the nearest tenth)
CLV = curb lane volume
vph in one direction
OLV = other lane(s) volume -same direction
vph
SPD = 85th percentile speed of traffic
mi/h
PKG = presence of a parking lane with more than 30
percent occupancy
no = 0
yes = 1
AREA = type of roadside development
residential = 1
other type = 0
AF = ft + fp + frt where:
ft= adjustment factor for truck volumes
(see below)
fp = adjustment factor for parking turnover
(see below)
frt
= adjustment factor for right-turn volumes
(see below)
Adjustment Factors
Hourly Curb Lane
Large Truck Volume1
(ft) Parking Time Limit (min) fp
> 120 0.5 < 15 0.6
60 - 119 0.4 16 - 30 0.5
30-59 0.3 31 - 60 0.4
20-29 0.2 61 - 120 0.3
10-19 0.1 121 - 240 0.2
< 10 0.0 241- 480 0.1
Hourly Right-Turn Volume2 frt
> 270 0.1
< 270 0.0 1 Large trucks are defined as all vehicles with six or more tires.
2 Includes total number of right turns into driveways or minor intersections along a roadway segment.
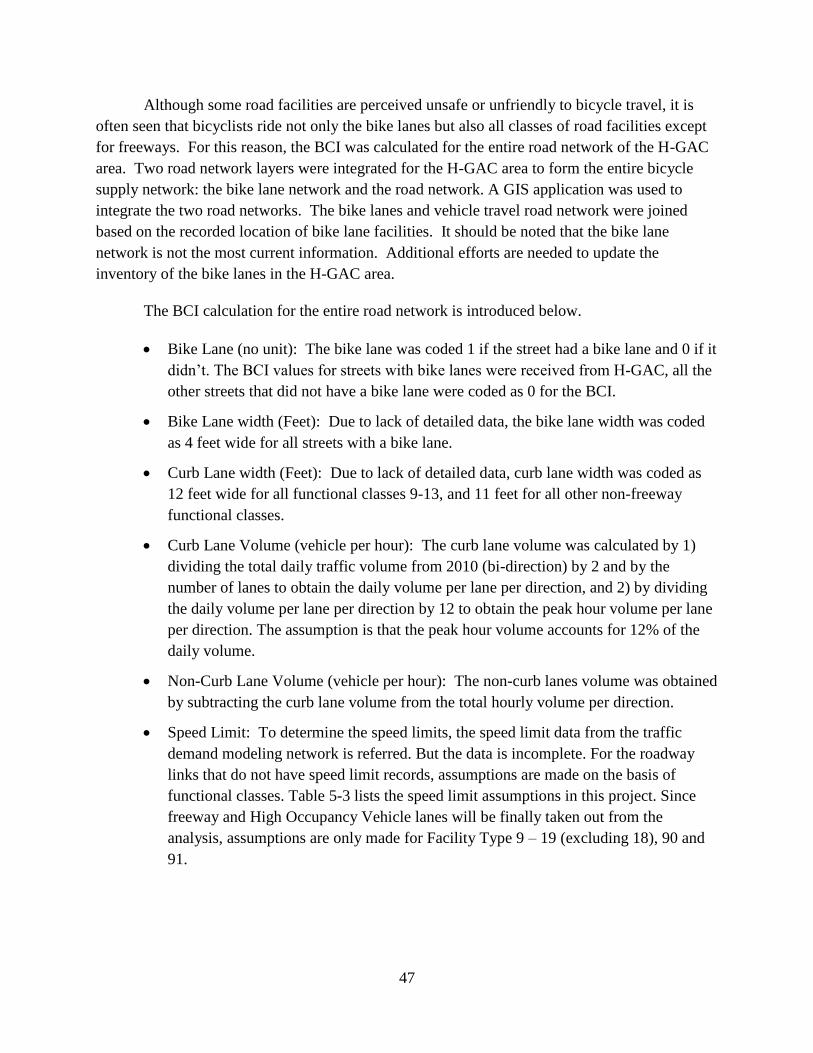
47
Although some road facilities are perceived unsafe or unfriendly to bicycle travel, it is
often seen that bicyclists ride not only the bike lanes but also all classes of road facilities except
for freeways. For this reason, the BCI was calculated for the entire road network of the H-GAC
area. Two road network layers were integrated for the H-GAC area to form the entire bicycle
supply network: the bike lane network and the road network. A GIS application was used to
integrate the two road networks. The bike lanes and vehicle travel road network were joined
based on the recorded location of bike lane facilities. It should be noted that the bike lane
network is not the most current information. Additional efforts are needed to update the
inventory of the bike lanes in the H-GAC area.
The BCI calculation for the entire road network is introduced below.
Bike Lane (no unit): The bike lane was coded 1 if the street had a bike lane and 0 if it
didn’t. The BCI values for streets with bike lanes were received from H-GAC, all the
other streets that did not have a bike lane were coded as 0 for the BCI.
Bike Lane width (Feet): Due to lack of detailed data, the bike lane width was coded
as 4 feet wide for all streets with a bike lane.
Curb Lane width (Feet): Due to lack of detailed data, curb lane width was coded as
12 feet wide for all functional classes 9-13, and 11 feet for all other non-freeway
functional classes.
Curb Lane Volume (vehicle per hour): The curb lane volume was calculated by 1)
dividing the total daily traffic volume from 2010 (bi-direction) by 2 and by the
number of lanes to obtain the daily volume per lane per direction, and 2) by dividing
the daily volume per lane per direction by 12 to obtain the peak hour volume per lane
per direction. The assumption is that the peak hour volume accounts for 12% of the
daily volume.
Non-Curb Lane Volume (vehicle per hour): The non-curb lanes volume was obtained
by subtracting the curb lane volume from the total hourly volume per direction.
Speed Limit: To determine the speed limits, the speed limit data from the traffic
demand modeling network is referred. But the data is incomplete. For the roadway
links that do not have speed limit records, assumptions are made on the basis of
functional classes. Table 5-3 lists the speed limit assumptions in this project. Since
freeway and High Occupancy Vehicle lanes will be finally taken out from the
analysis, assumptions are only made for Facility Type 9 – 19 (excluding 18), 90 and
91.
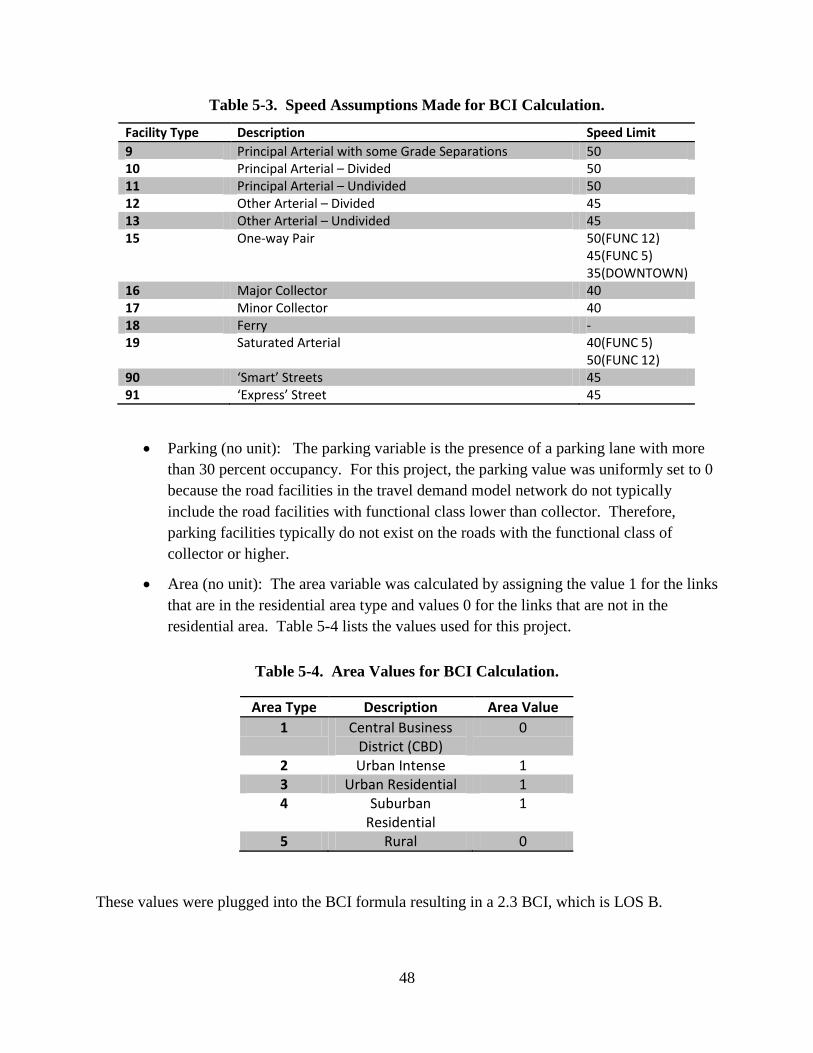
48
Table 5-3. Speed Assumptions Made for BCI Calculation.
Parking (no unit): The parking variable is the presence of a parking lane with more
than 30 percent occupancy. For this project, the parking value was uniformly set to 0
because the road facilities in the travel demand model network do not typically
include the road facilities with functional class lower than collector. Therefore,
parking facilities typically do not exist on the roads with the functional class of
collector or higher.
Area (no unit): The area variable was calculated by assigning the value 1 for the links
that are in the residential area type and values 0 for the links that are not in the
residential area. Table 5-4 lists the values used for this project.
Table 5-4. Area Values for BCI Calculation.
These values were plugged into the BCI formula resulting in a 2.3 BCI, which is LOS B.
Area Type Description Area Value
1 Central Business District (CBD)
0
2 Urban Intense 1 3 Urban Residential 1 4 Suburban
Residential 1
5 Rural 0
Facility Type Description Speed Limit
9 Principal Arterial with some Grade Separations 50 10 Principal Arterial – Divided 50 11 Principal Arterial – Undivided 50 12 Other Arterial – Divided 45 13 Other Arterial – Undivided 45 15 One-way Pair 50(FUNC 12)
45(FUNC 5) 35(DOWNTOWN)
16 Major Collector 40 17 Minor Collector 40 18 Ferry - 19 Saturated Arterial 40(FUNC 5)
50(FUNC 12) 90 ‘Smart’ Streets 45 91 ‘Express’ Street 45
49
Adjustment Factors (no unit): The adjustment factors were assigned based on the
functional class of the highway, with high traffic lanes given the score 1.1, and other
values assigned a score of 0.9. The reason for this is that highways have high truck
volume as well as no parking, but also no right turn facilities. For other major arterial
roads, the parking time and large truck volume are not as high, but there are right turn
lanes. Table 5-5 lists the values used for this project.
Table 5-5. Adjustment Factors for BCI Calculation.
Facility Type Description AF
1 Radial Freeway without Frontage Roads 1.1 2 Radial Freeway with Frontage Roads 1.1 3 Circumferential Freeway without Frontage Roads 1.1 4 Circumferential Freeway with Frontage Roads 1.1 5 Radial Toll way without Frontage Roads 1.1 6 Radial Toll way with Frontage Roads 1.1 7 Circumferential Toll way without Frontage Roads 1.1 8 Circumferential Toll way with Frontage Roads 1.1 9 Principal Arterial with some Grade Separations 0.9 10 Principal Arterial – Divided 0.9 11 Principal Arterial – Undivided 0.9 12 Other Arterial – Divided 0.9 13 Other Arterial – Undivided 0.9 14 One-way Facility 0.9 15 One-way Pair 0.9 16 Major Collector 0.9 17 Minor Collector 0.9 18 Ferry 0.9 19 Saturated Arterial 0.9 20 HOV Lane (High Occupancy Vehicle) 1.1 21 HOV Ramp to Park & Ride/Transit Center (PNR/TC) 1.1 26 PNR/TC access to Roadway 1.1 27 HOV Slip Ramp 1.1 29 HOV Ramp 1.1 30 Guideway / Rail 1.1 40 HOT Lane (High Occupancy Toll) 1.1 41 HOT Ramp to PNR/TC 1.1 47 HOT Slip Ramp 1.1 49 HOT Ramp 1.1 50 Freeway Frontage Road 1.1 51 Tollway Frontage Road 1.1 52 Freeway Ramp 1.1 53 Freeway Direct Connector Ramp 1.1 60 Diamond Lane (non-barrier separated HOV) 1.1 90 ‘Smart’ Streets 0.9 91 ‘Express’ Street 0.9
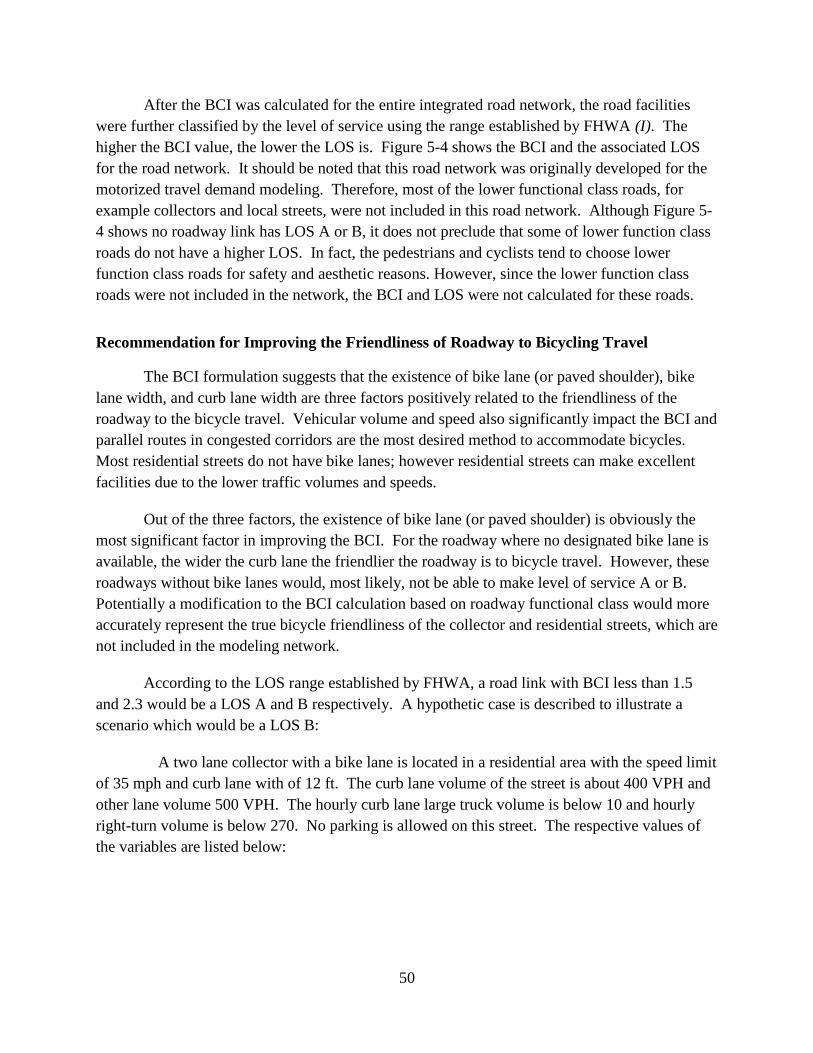
50
After the BCI was calculated for the entire integrated road network, the road facilities
were further classified by the level of service using the range established by FHWA (I). The
higher the BCI value, the lower the LOS is. Figure 5-4 shows the BCI and the associated LOS
for the road network. It should be noted that this road network was originally developed for the
motorized travel demand modeling. Therefore, most of the lower functional class roads, for
example collectors and local streets, were not included in this road network. Although Figure 5-
4 shows no roadway link has LOS A or B, it does not preclude that some of lower function class
roads do not have a higher LOS. In fact, the pedestrians and cyclists tend to choose lower
function class roads for safety and aesthetic reasons. However, since the lower function class
roads were not included in the network, the BCI and LOS were not calculated for these roads.
Recommendation for Improving the Friendliness of Roadway to Bicycling Travel
The BCI formulation suggests that the existence of bike lane (or paved shoulder), bike
lane width, and curb lane width are three factors positively related to the friendliness of the
roadway to the bicycle travel. Vehicular volume and speed also significantly impact the BCI and
parallel routes in congested corridors are the most desired method to accommodate bicycles.
Most residential streets do not have bike lanes; however residential streets can make excellent
facilities due to the lower traffic volumes and speeds.
Out of the three factors, the existence of bike lane (or paved shoulder) is obviously the
most significant factor in improving the BCI. For the roadway where no designated bike lane is
available, the wider the curb lane the friendlier the roadway is to bicycle travel. However, these
roadways without bike lanes would, most likely, not be able to make level of service A or B.
Potentially a modification to the BCI calculation based on roadway functional class would more
accurately represent the true bicycle friendliness of the collector and residential streets, which are
not included in the modeling network.
According to the LOS range established by FHWA, a road link with BCI less than 1.5
and 2.3 would be a LOS A and B respectively. A hypothetic case is described to illustrate a
scenario which would be a LOS B:
A two lane collector with a bike lane is located in a residential area with the speed limit
of 35 mph and curb lane with of 12 ft. The curb lane volume of the street is about 400 VPH and
other lane volume 500 VPH. The hourly curb lane large truck volume is below 10 and hourly
right-turn volume is below 270. No parking is allowed on this street. The respective values of
the variables are listed below:
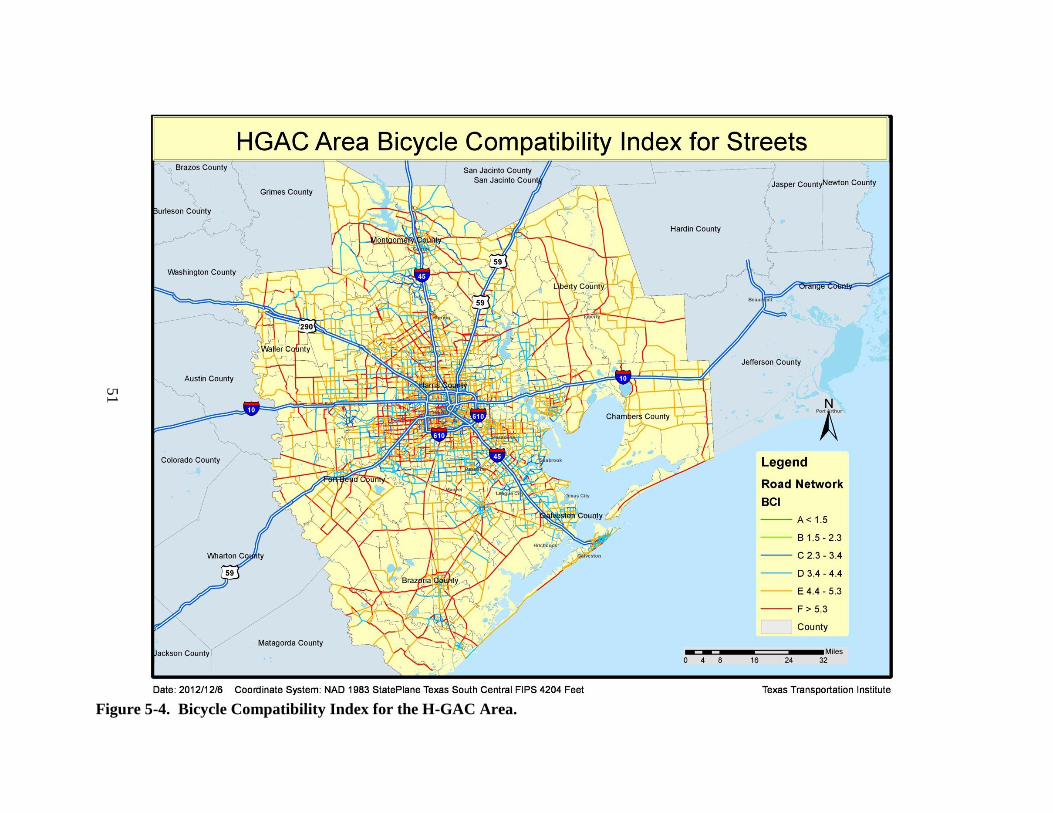
Figure 5-4. Bicycle Compatibility Index for the H-GAC Area.
51
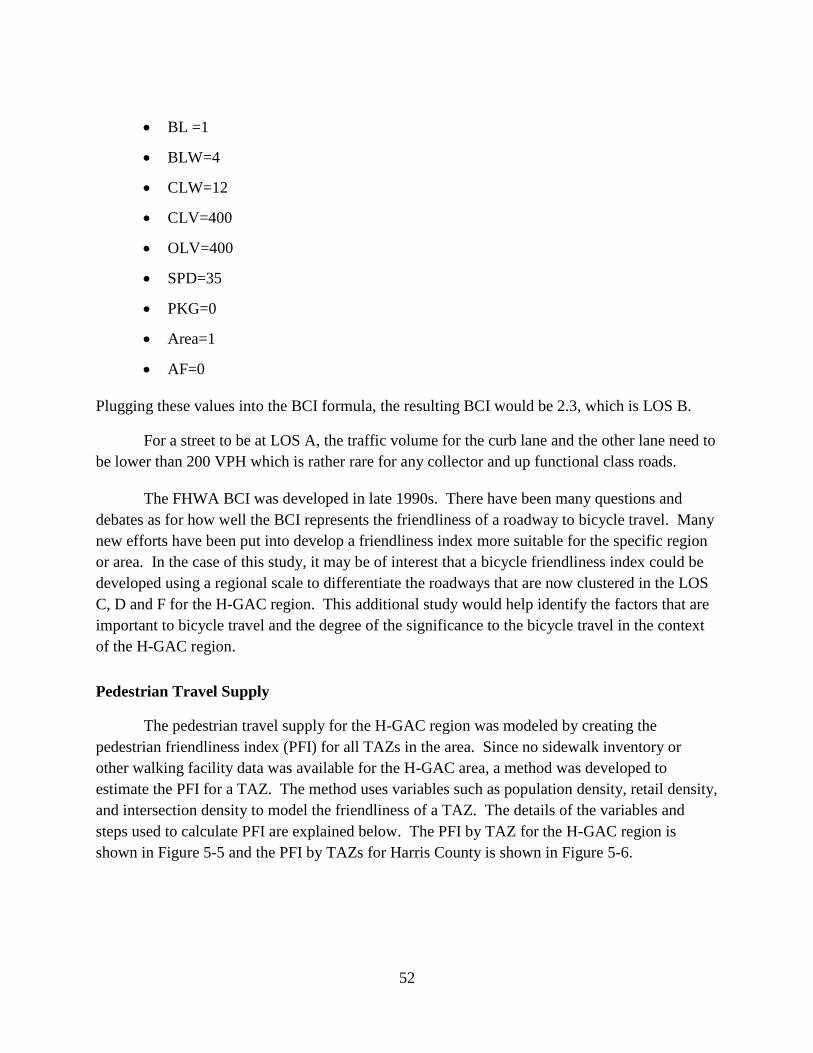
52
BL =1
BLW=4
CLW=12
CLV=400
OLV=400
SPD=35
PKG=0
Area=1
AF=0
Plugging these values into the BCI formula, the resulting BCI would be 2.3, which is LOS B.
For a street to be at LOS A, the traffic volume for the curb lane and the other lane need to
be lower than 200 VPH which is rather rare for any collector and up functional class roads.
The FHWA BCI was developed in late 1990s. There have been many questions and
debates as for how well the BCI represents the friendliness of a roadway to bicycle travel. Many
new efforts have been put into develop a friendliness index more suitable for the specific region
or area. In the case of this study, it may be of interest that a bicycle friendliness index could be
developed using a regional scale to differentiate the roadways that are now clustered in the LOS
C, D and F for the H-GAC region. This additional study would help identify the factors that are
important to bicycle travel and the degree of the significance to the bicycle travel in the context
of the H-GAC region.
Pedestrian Travel Supply
The pedestrian travel supply for the H-GAC region was modeled by creating the
pedestrian friendliness index (PFI) for all TAZs in the area. Since no sidewalk inventory or
other walking facility data was available for the H-GAC area, a method was developed to
estimate the PFI for a TAZ. The method uses variables such as population density, retail density,
and intersection density to model the friendliness of a TAZ. The details of the variables and
steps used to calculate PFI are explained below. The PFI by TAZ for the H-GAC region is
shown in Figure 5-5 and the PFI by TAZs for Harris County is shown in Figure 5-6.
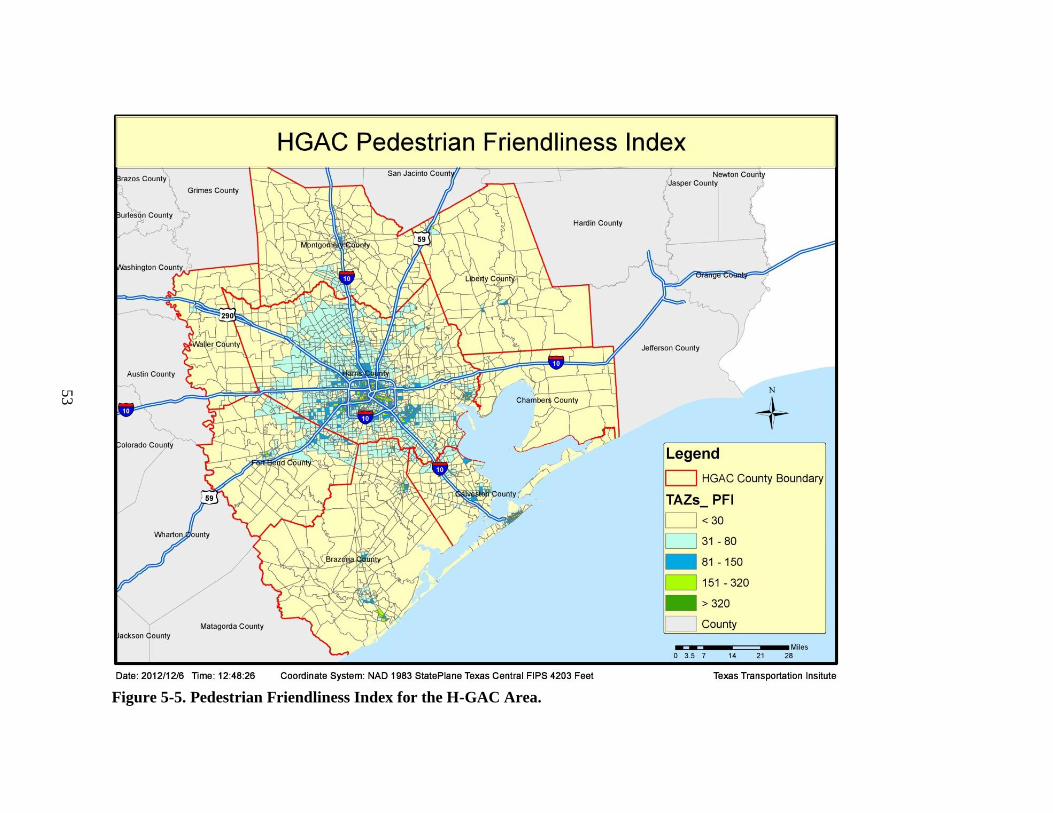
Figure 5-5. Pedestrian Friendliness Index for the H-GAC Area.
53
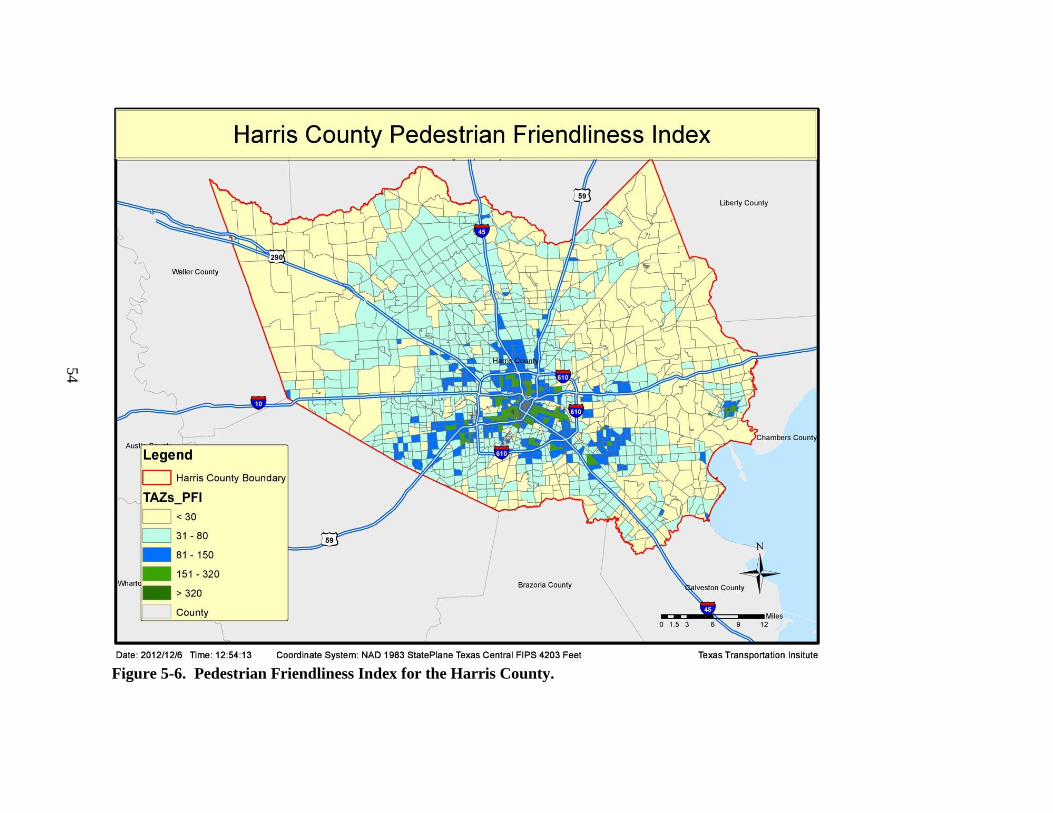
Figure 5-6. Pedestrian Friendliness Index for the Harris County.
54
55
Population density is a straightforward estimate of population in the year 2010 per square
mile (POPpMI), and was calculated by dividing the 2010 population estimate per TAZ by the
number of acres in the TAZ, then multiplying by 640 acres in a square mile. The average
population density in the region for 2010 is 2955.2 per square mile.
Retail density was used as a TAZ-level proxy for distance to a store, calculated as
commercial land use parcels per square mile (COMpMi). The H-GAC model used H-GAC area
parcel level land use data. The average commercial parcel density in the region is
77.7commercial land parcels per square mile.
Intersection density was computed as the number of roadway intersections per square
mile (INTpMI). This variable has a strong relationship to walking mode choice, and is also
relatively challenging to calculate at the regional scale. The average intersection density for the
region was 79.4 intersections per square mile. For comparison, this figure is less dense than Los
Angeles, CA (150 intersections/square mile), but more than the CAMPO region (Austin, TX)
(43.2 intersections/square mile).
Following are the steps undertaken:
1. Prepare pedestrian network
A complete street network of the eight-county region was obtained from the H-GAC
that was updated. Since this study concerns the pedestrian network, segments not
generally accessible by foot were removed, including interstate main lanes and
freeway ramps, for example.
2. Identify street intersections
In order to automate the calculation of street intersection density, a step-by-step
procedure was developed to generate street intersections. It outputs an ESRI point
feature class containing the intersections of the network. The output point file was
refined by removing nodes that are not pedestrian-accessible street intersections,
such as freeway main lanes not coded in the H-GAC dataset, and airport access
roads.
3. Calculate intersection density
The number of intersections was summed by the TAZ using the “Spatial Join” Tool
in ArcGIS tool box. Intersection density was then computed by dividing the number
of intersections in a TAZ by the number of acres in the TAZ, multiplying by 640
acres in a square mile.
56
4. Estimating the Pedestrian Friendliness Index
In order to normalize the three variables to an index value, the maximum value in
each of the TAZ records in the 5-county dataset was divided by 100. The average of
these values was then computed for each TAZ as the Pedestrian Friendliness Index
(PFI). Following Ewing and Cervero's meta-analysis (5), this estimation method is
relatively simple to calculate, yet may be a powerful estimation of pedestrian mode
choice.
Recommendation for Improving Walking Supply
The PFI developed in this study is a rather rough estimation of the pedestrian friendliness
of an area. The three densities used to estimate PFI are indications of pedestrian walking supply.
It should be noted that the method of estimating PFI does not suggest that the way to increase the
walking friendliness of an area is to build high rise buildings (increase population density) and
concentrate all retails (increase retail density) and cut the streets shorter (intersection density). In
fact, it would be rather unsafe to have those high densities without sidewalks and other walking
facilities.
A more accurate estimation of walking supply would need an inventory of the sidewalks
and the condition of the sidewalks in the area. Currently, no such information is available. For
future work, it is recommended that the remote sensing technology be applied on the regional
aerial map to obtain the extensively time consuming information.
Interaction between Demand and Supply
Sketch planning procedures were developed to model the interaction between the demand
and supply for bicycle and pedestrian travel respectively.
Bicycle Travel Demand and Supply
The total bicycle trips by TAZ which is the output of the travel survey were used as the
demand for the bicycle travel. The BCI was used as the indicator of bicycle travel supply for the
road facilities.
A GIS procedure was used to illustrate the interaction of bicycle travel demand and
supply in the region and also identify the links that are undersupplied for bicycle travel. The
steps are described below:
Using colors to represent the Level of Service (supply) for the road links (as in Figure
7);
Using thickness to represent the non-motorized demand of the road links; and
57
Filtering the links that are with the color of LOS F as well as thicker than a threshold
level (1000 trips/day was used for this project).
The assumptions made for these procedures are:
The bicycle demand is evenly distributed within the TAZ. Therefore, the thickness of the
road links are the same within the same TAZ;
The road links that are in LOS F are considered undersupplied for bicycle travel and
further ranked for the level of undersupply with high, medium and low.
Figures 5-7, 5-8 and 5-9 illustrate the demand and supply in the H-GAC region, Harris
County, and downtown Houston area respectively. The road sections that are undersupplied
(LOS F) with over 1000 non-motorized trip demand per day were further ranked with high,
medium and low using 2000 and 1500 trips/day as thresholds. Table 5-6 and Figure 5-10
respectively list and illustrate these undersupplied road links on map.
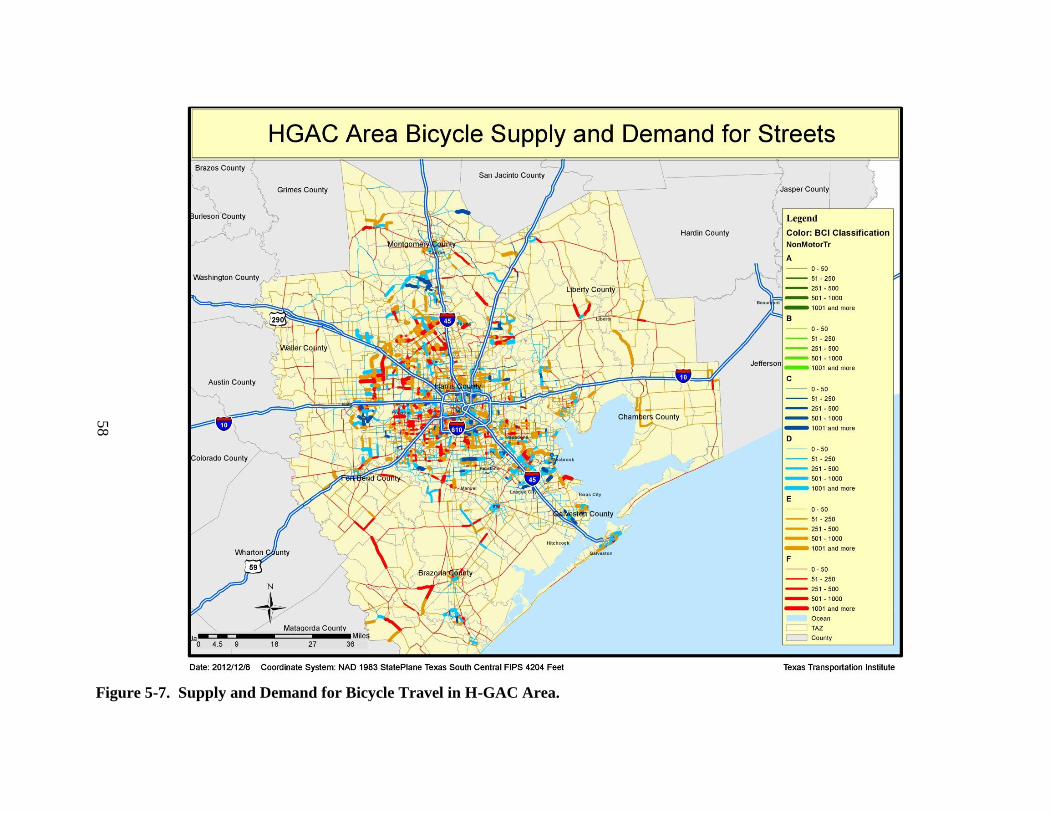
Figure 5-7. Supply and Demand for Bicycle Travel in H-GAC Area.
58
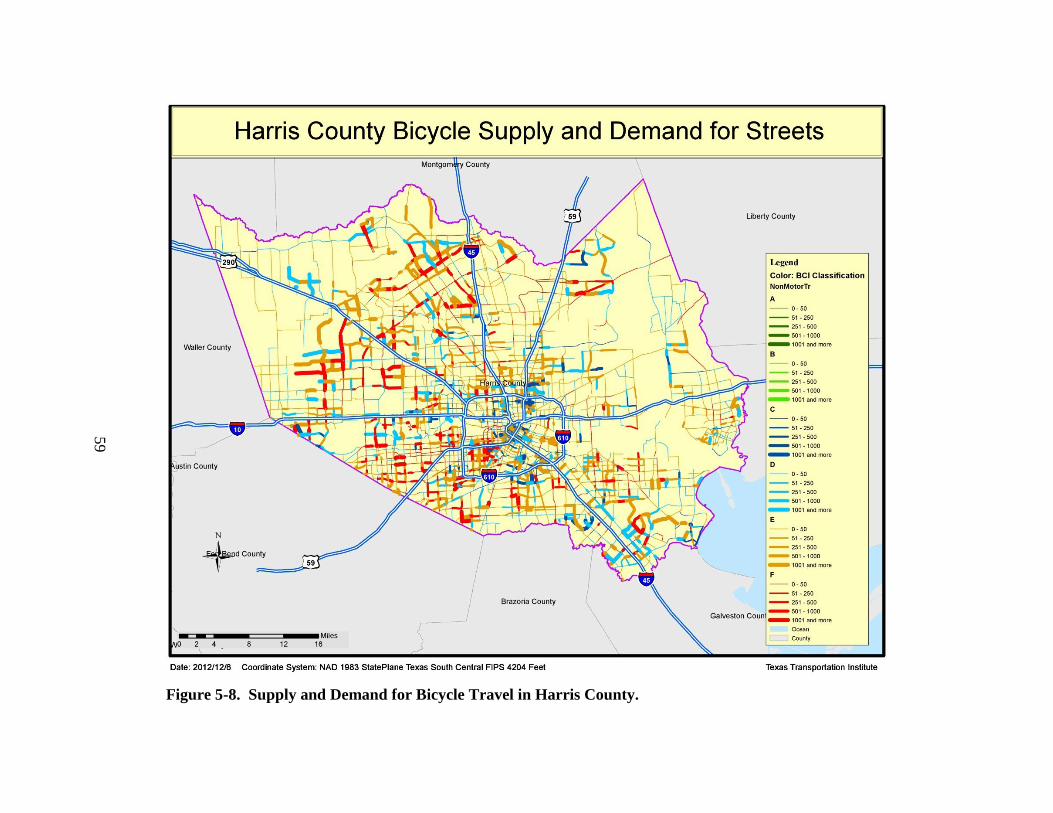
Figure 5-8. Supply and Demand for Bicycle Travel in Harris County.
59
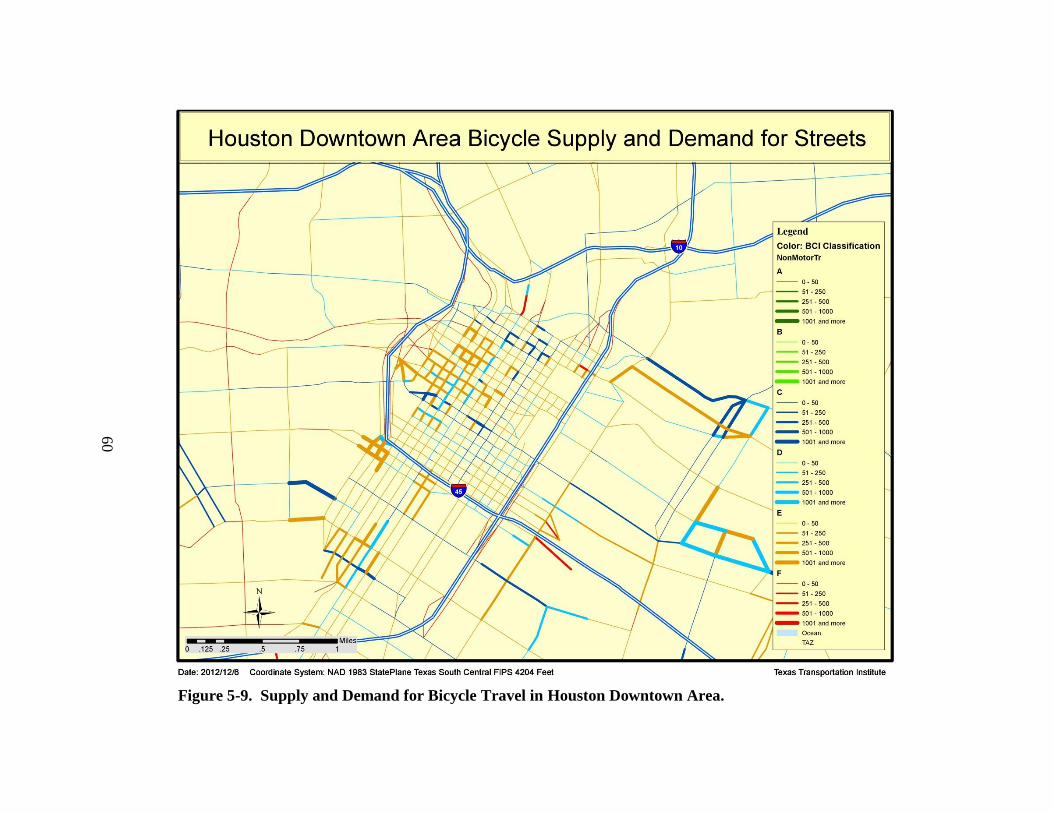
Figure 5-9. Supply and Demand for Bicycle Travel in Houston Downtown Area.
60
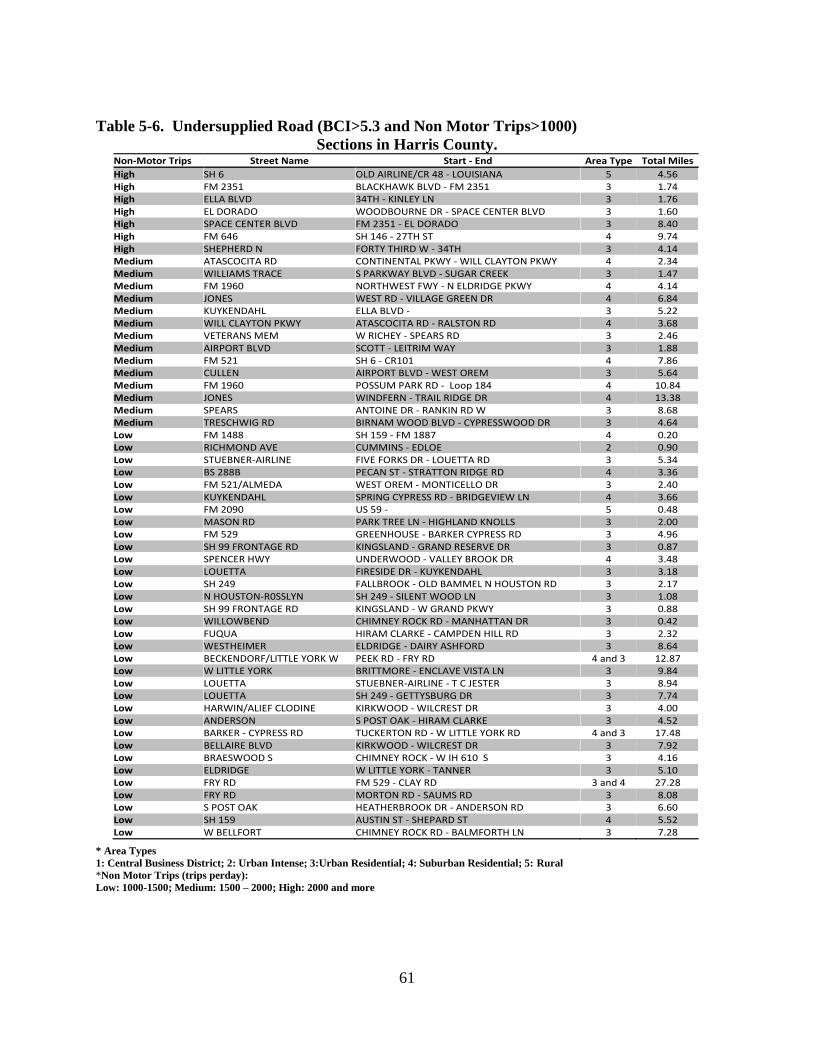
61
Table 5-6. Undersupplied Road (BCI>5.3 and Non Motor Trips>1000)
Sections in Harris County.
* Area Types
1: Central Business District; 2: Urban Intense; 3:Urban Residential; 4: Suburban Residential; 5: Rural
*Non Motor Trips (trips perday):
Low: 1000-1500; Medium: 1500 – 2000; High: 2000 and more
Non-Motor Trips Street Name Start - End Area Type Total Miles
High SH 6 OLD AIRLINE/CR 48 - LOUISIANA 5 4.56 High FM 2351 BLACKHAWK BLVD - FM 2351 3 1.74 High ELLA BLVD 34TH - KINLEY LN 3 1.76 High EL DORADO WOODBOURNE DR - SPACE CENTER BLVD 3 1.60 High SPACE CENTER BLVD FM 2351 - EL DORADO 3 8.40 High FM 646 SH 146 - 27TH ST 4 9.74 High SHEPHERD N FORTY THIRD W - 34TH 3 4.14 Medium ATASCOCITA RD CONTINENTAL PKWY - WILL CLAYTON PKWY 4 2.34 Medium WILLIAMS TRACE S PARKWAY BLVD - SUGAR CREEK 3 1.47 Medium FM 1960 NORTHWEST FWY - N ELDRIDGE PKWY 4 4.14 Medium JONES WEST RD - VILLAGE GREEN DR 4 6.84 Medium KUYKENDAHL ELLA BLVD - 3 5.22 Medium WILL CLAYTON PKWY ATASCOCITA RD - RALSTON RD 4 3.68 Medium VETERANS MEM W RICHEY - SPEARS RD 3 2.46 Medium AIRPORT BLVD SCOTT - LEITRIM WAY 3 1.88 Medium FM 521 SH 6 - CR101 4 7.86 Medium CULLEN AIRPORT BLVD - WEST OREM 3 5.64 Medium FM 1960 POSSUM PARK RD - Loop 184 4 10.84 Medium JONES WINDFERN - TRAIL RIDGE DR 4 13.38 Medium SPEARS ANTOINE DR - RANKIN RD W 3 8.68 Medium TRESCHWIG RD BIRNAM WOOD BLVD - CYPRESSWOOD DR 3 4.64 Low FM 1488 SH 159 - FM 1887 4 0.20 Low RICHMOND AVE CUMMINS - EDLOE 2 0.90 Low STUEBNER-AIRLINE FIVE FORKS DR - LOUETTA RD 3 5.34 Low BS 288B PECAN ST - STRATTON RIDGE RD 4 3.36 Low FM 521/ALMEDA WEST OREM - MONTICELLO DR 3 2.40 Low KUYKENDAHL SPRING CYPRESS RD - BRIDGEVIEW LN 4 3.66 Low FM 2090 US 59 - 5 0.48 Low MASON RD PARK TREE LN - HIGHLAND KNOLLS 3 2.00 Low FM 529 GREENHOUSE - BARKER CYPRESS RD 3 4.96 Low SH 99 FRONTAGE RD KINGSLAND - GRAND RESERVE DR 3 0.87 Low SPENCER HWY UNDERWOOD - VALLEY BROOK DR 4 3.48 Low LOUETTA FIRESIDE DR - KUYKENDAHL 3 3.18 Low SH 249 FALLBROOK - OLD BAMMEL N HOUSTON RD 3 2.17 Low N HOUSTON-R0SSLYN SH 249 - SILENT WOOD LN 3 1.08 Low SH 99 FRONTAGE RD KINGSLAND - W GRAND PKWY 3 0.88 Low WILLOWBEND CHIMNEY ROCK RD - MANHATTAN DR 3 0.42 Low FUQUA HIRAM CLARKE - CAMPDEN HILL RD 3 2.32 Low WESTHEIMER ELDRIDGE - DAIRY ASHFORD 3 8.64 Low BECKENDORF/LITTLE YORK W PEEK RD - FRY RD 4 and 3 12.87 Low W LITTLE YORK BRITTMORE - ENCLAVE VISTA LN 3 9.84 Low LOUETTA STUEBNER-AIRLINE - T C JESTER 3 8.94 Low LOUETTA SH 249 - GETTYSBURG DR 3 7.74 Low HARWIN/ALIEF CLODINE KIRKWOOD - WILCREST DR 3 4.00 Low ANDERSON S POST OAK - HIRAM CLARKE 3 4.52 Low BARKER - CYPRESS RD TUCKERTON RD - W LITTLE YORK RD 4 and 3 17.48 Low BELLAIRE BLVD KIRKWOOD - WILCREST DR 3 7.92 Low BRAESWOOD S CHIMNEY ROCK - W IH 610 S 3 4.16 Low ELDRIDGE W LITTLE YORK - TANNER 3 5.10 Low FRY RD FM 529 - CLAY RD 3 and 4 27.28 Low FRY RD MORTON RD - SAUMS RD 3 8.08 Low S POST OAK HEATHERBROOK DR - ANDERSON RD 3 6.60 Low SH 159 AUSTIN ST - SHEPARD ST 4 5.52 Low W BELLFORT CHIMNEY ROCK RD - BALMFORTH LN 3 7.28
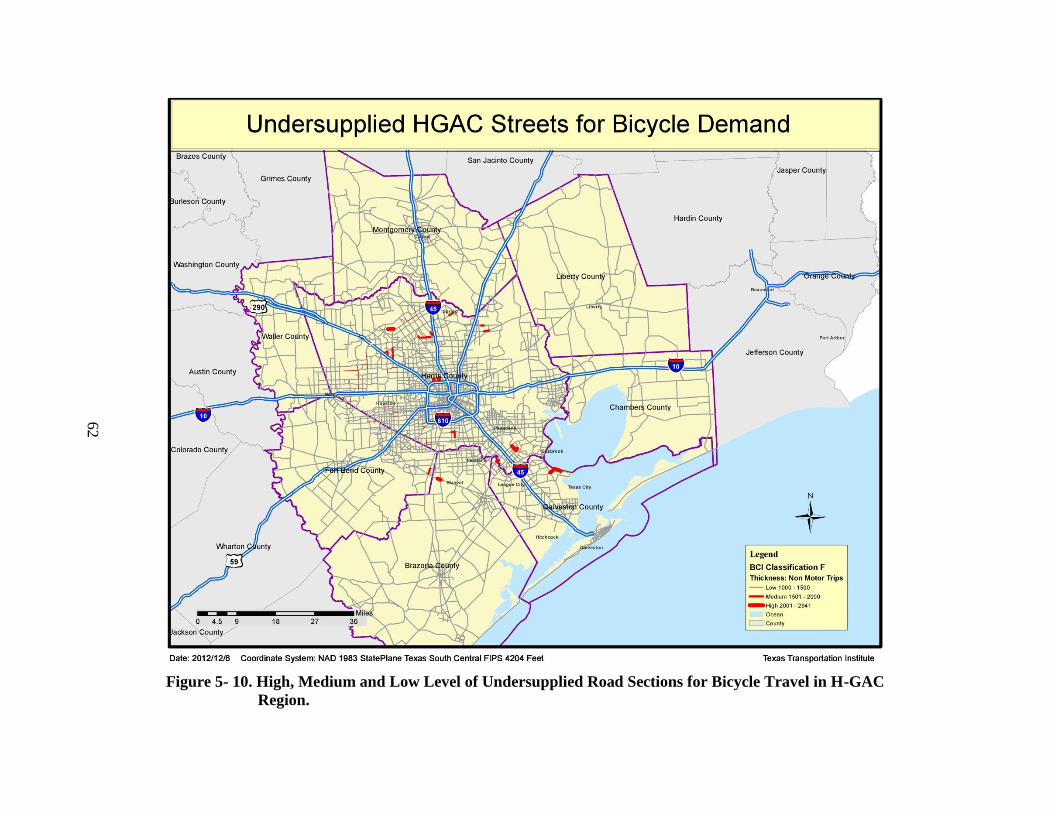
Figure 5- 10. High, Medium and Low Level of Undersupplied Road Sections for Bicycle Travel in H-GAC
Region.
62
63
Pedestrian Travel Demand and Supply
The total walking trips by TAZ was used as the demand for the pedestrian travel. The
PFI was used as the indicator of pedestrian travel supply for the road facilities. A mathematic
relation was used to model the interaction of demand and supply for pedestrian travel. Equation
below illustrates the relationship:
Equation 1
Using the numbers of pedestrian trips per day divided by the PFI indicates the severity of
the demand over supply for pedestrian travel. Due to the different units used for the demand and
supply in Equation 1, the ratio is not exactly the times of demand over supply but nevertheless
represent the degree of difference between the two values. Since there are 0 values of PFI for
some TAZs, 1 was uniformly added to all TAZs on the PFI to avoid an infinity value. Figure 5-
11 shows the results of three levels (high, medium, and low) of demand over supply for the
pedestrian travel.
Integration with Super Neighborhoods
As far as bicycling or walking demand is concerned, there are two essential parts that
should be viewed at the same time. One is the existing demand, which is relatively easy to
observe and identify, while the other is the latent or potential demand for bicycling or walking,
currently being fulfilled by automobile traveling. The latter is more difficult to identify, yet of
greater significance for planning purpose. Potential demand for bicycle, pedestrian travel will
convert into real usage of facilities, and reduce automobile travel, once they are accommodated
properly with good level of service.
In June 2003, The Houston-Galveston Area Council selected the Walter P. Moore
Bicycle and Pedestrian Study Team (WPM Study Team) to perform a study to identify districts
where there are significant opportunities to replace vehicle trips with pedestrian or bicycle trips
and to improve pedestrian and bicycle safety.
This study used activities centers that are likely to generate or attract bicycle and
pedestrian trips and create circles around these centers to delineate study districts. The study area
radii are different due to different traveling mode—biking or walking. A scoring system is
developed to objectively identify a large number of districts, which consists of a group of
indicators believed to represent the potential for biking and walking. The study approach and
methodology was updated in 2010, including the choice of indicators.
The indicators and variables chosen for final composite indicators are shown in Table 5-
7.
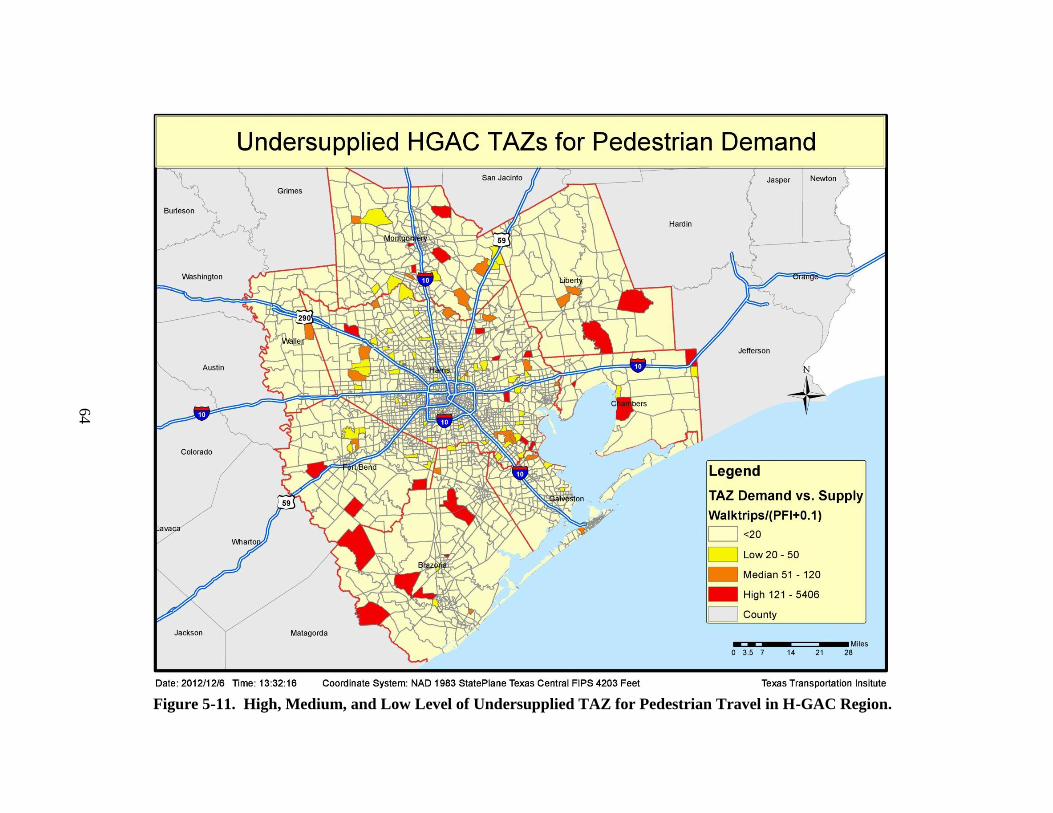
Figure 5-11. High, Medium, and Low Level of Undersupplied TAZ for Pedestrian Travel in H-GAC Region.
64
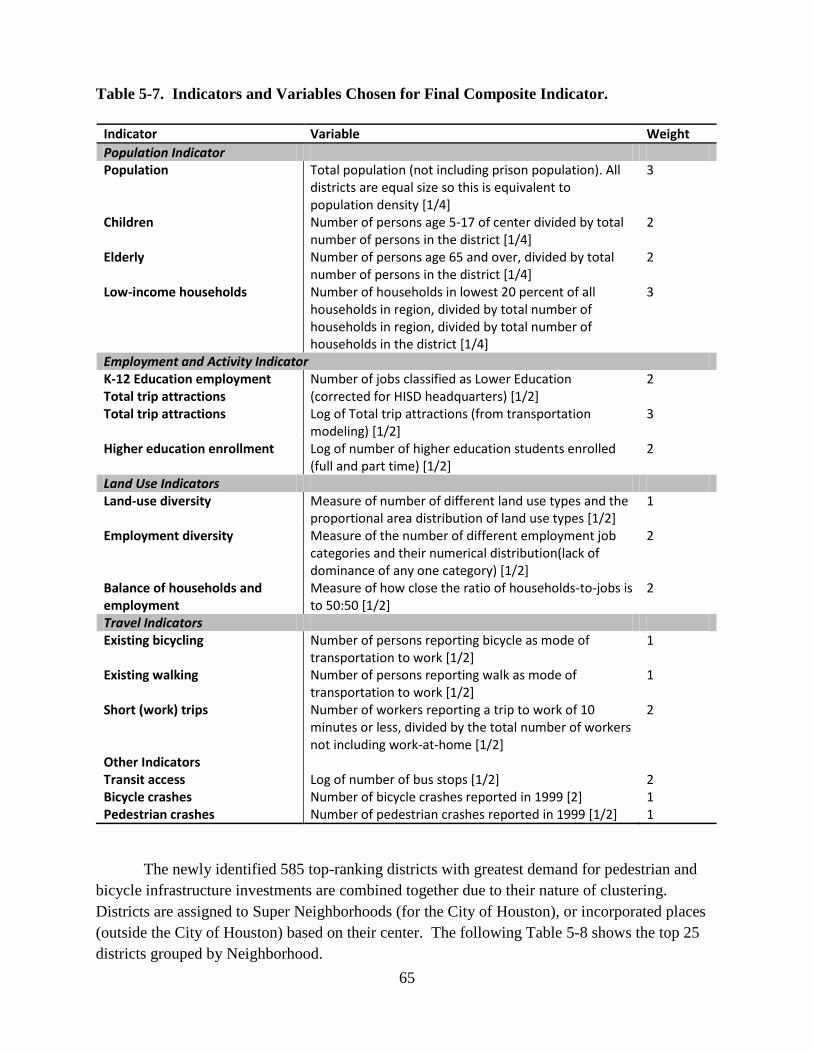
65
Table 5-7. Indicators and Variables Chosen for Final Composite Indicator.
The newly identified 585 top-ranking districts with greatest demand for pedestrian and
bicycle infrastructure investments are combined together due to their nature of clustering.
Districts are assigned to Super Neighborhoods (for the City of Houston), or incorporated places
(outside the City of Houston) based on their center. The following Table 5-8 shows the top 25
districts grouped by Neighborhood.
Indicator Variable Weight
Population Indicator Population Total population (not including prison population). All
districts are equal size so this is equivalent to population density [1/4]
3
Children Number of persons age 5-17 of center divided by total number of persons in the district [1/4]
2
Elderly Number of persons age 65 and over, divided by total number of persons in the district [1/4]
2
Low-income households Number of households in lowest 20 percent of all households in region, divided by total number of households in region, divided by total number of households in the district [1/4]
3
Employment and Activity Indicator K-12 Education employment Total trip attractions
Number of jobs classified as Lower Education (corrected for HISD headquarters) [1/2]
2
Total trip attractions Log of Total trip attractions (from transportation modeling) [1/2]
3
Higher education enrollment Log of number of higher education students enrolled (full and part time) [1/2]
2
Land Use Indicators Land-use diversity Measure of number of different land use types and the
proportional area distribution of land use types [1/2] 1
Employment diversity Measure of the number of different employment job categories and their numerical distribution(lack of dominance of any one category) [1/2]
2
Balance of households and employment
Measure of how close the ratio of households-to-jobs is to 50:50 [1/2]
2
Travel Indicators Existing bicycling Number of persons reporting bicycle as mode of
transportation to work [1/2] 1
Existing walking Number of persons reporting walk as mode of transportation to work [1/2]
1
Short (work) trips Number of workers reporting a trip to work of 10 minutes or less, divided by the total number of workers not including work-at-home [1/2]
2
Other Indicators Transit access Log of number of bus stops [1/2] 2 Bicycle crashes Number of bicycle crashes reported in 1999 [2] 1 Pedestrian crashes Number of pedestrian crashes reported in 1999 [1/2] 1
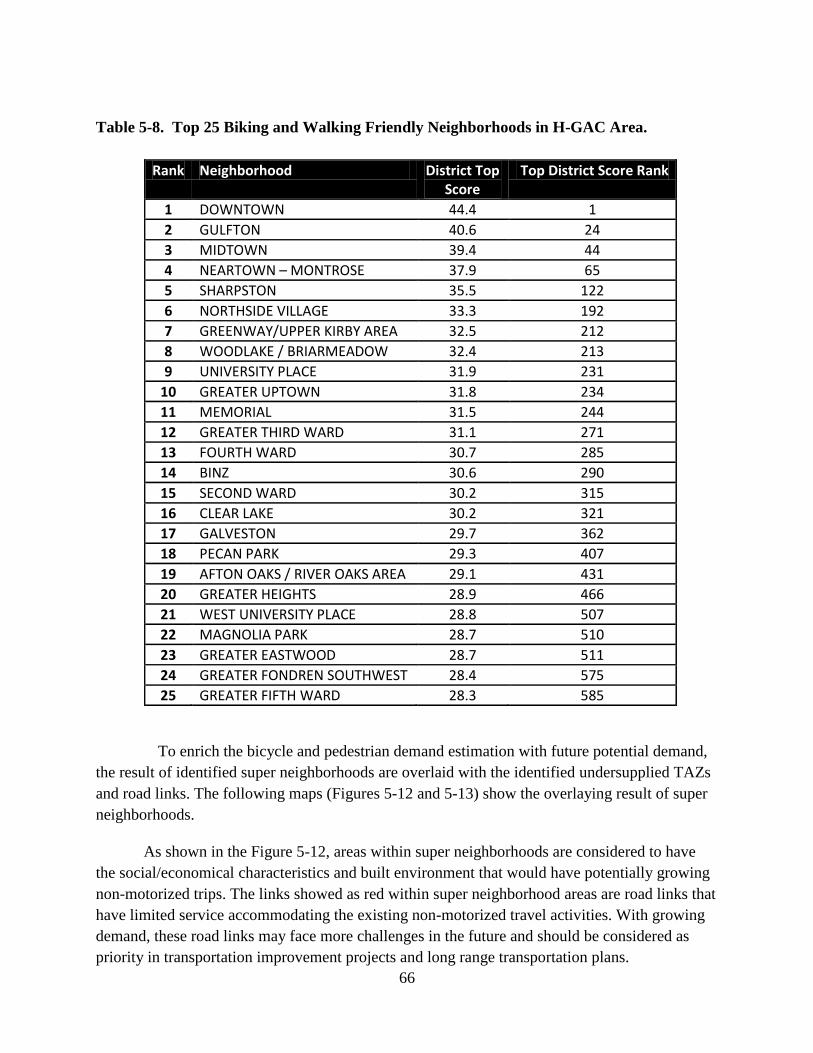
66
Table 5-8. Top 25 Biking and Walking Friendly Neighborhoods in H-GAC Area.
To enrich the bicycle and pedestrian demand estimation with future potential demand,
the result of identified super neighborhoods are overlaid with the identified undersupplied TAZs
and road links. The following maps (Figures 5-12 and 5-13) show the overlaying result of super
neighborhoods.
As shown in the Figure 5-12, areas within super neighborhoods are considered to have
the social/economical characteristics and built environment that would have potentially growing
non-motorized trips. The links showed as red within super neighborhood areas are road links that
have limited service accommodating the existing non-motorized travel activities. With growing
demand, these road links may face more challenges in the future and should be considered as
priority in transportation improvement projects and long range transportation plans.
Rank Neighborhood District Top Score
Top District Score Rank
1 DOWNTOWN 44.4 1
2 GULFTON 40.6 24
3 MIDTOWN 39.4 44
4 NEARTOWN – MONTROSE 37.9 65
5 SHARPSTON 35.5 122
6 NORTHSIDE VILLAGE 33.3 192
7 GREENWAY/UPPER KIRBY AREA 32.5 212
8 WOODLAKE / BRIARMEADOW 32.4 213
9 UNIVERSITY PLACE 31.9 231
10 GREATER UPTOWN 31.8 234
11 MEMORIAL 31.5 244
12 GREATER THIRD WARD 31.1 271
13 FOURTH WARD 30.7 285
14 BINZ 30.6 290
15 SECOND WARD 30.2 315
16 CLEAR LAKE 30.2 321
17 GALVESTON 29.7 362
18 PECAN PARK 29.3 407
19 AFTON OAKS / RIVER OAKS AREA 29.1 431
20 GREATER HEIGHTS 28.9 466
21 WEST UNIVERSITY PLACE 28.8 507
22 MAGNOLIA PARK 28.7 510
23 GREATER EASTWOOD 28.7 511
24 GREATER FONDREN SOUTHWEST 28.4 575
25 GREATER FIFTH WARD 28.3 585
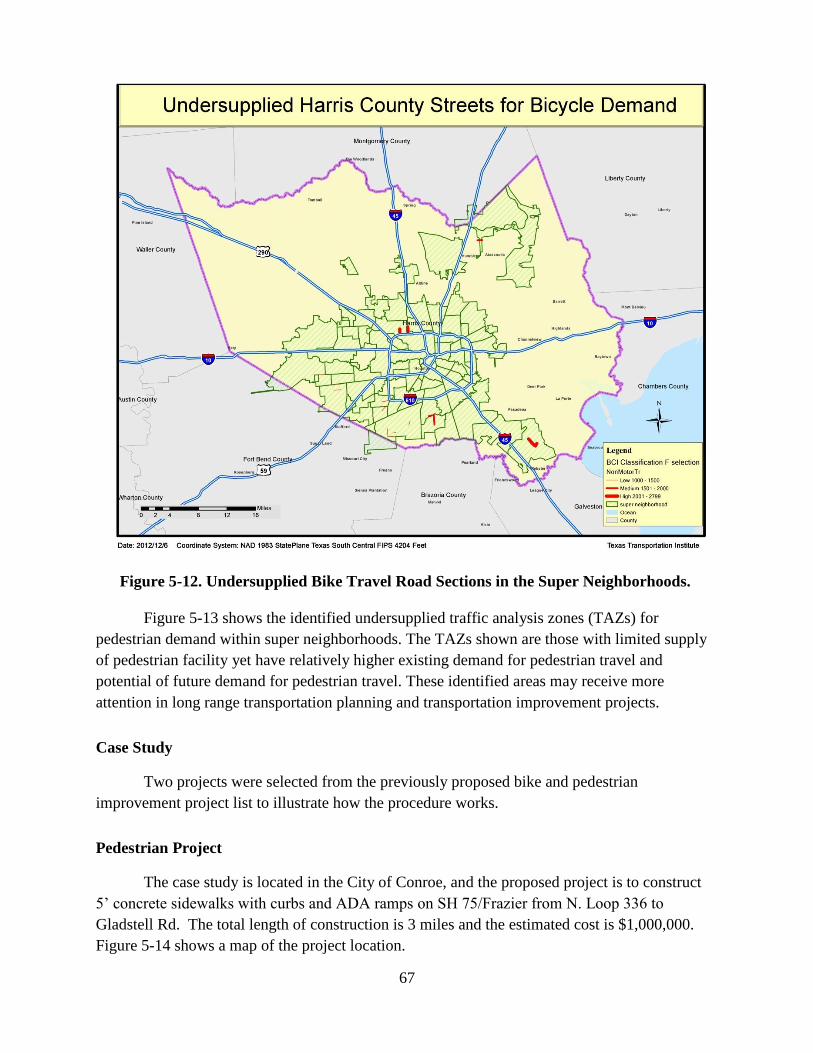
67
Figure 5-12. Undersupplied Bike Travel Road Sections in the Super Neighborhoods.
Figure 5-13 shows the identified undersupplied traffic analysis zones (TAZs) for
pedestrian demand within super neighborhoods. The TAZs shown are those with limited supply
of pedestrian facility yet have relatively higher existing demand for pedestrian travel and
potential of future demand for pedestrian travel. These identified areas may receive more
attention in long range transportation planning and transportation improvement projects.
Case Study
Two projects were selected from the previously proposed bike and pedestrian
improvement project list to illustrate how the procedure works.
Pedestrian Project
The case study is located in the City of Conroe, and the proposed project is to construct
5’ concrete sidewalks with curbs and ADA ramps on SH 75/Frazier from N. Loop 336 to
Gladstell Rd. The total length of construction is 3 miles and the estimated cost is $1,000,000.
Figure 5-14 shows a map of the project location.
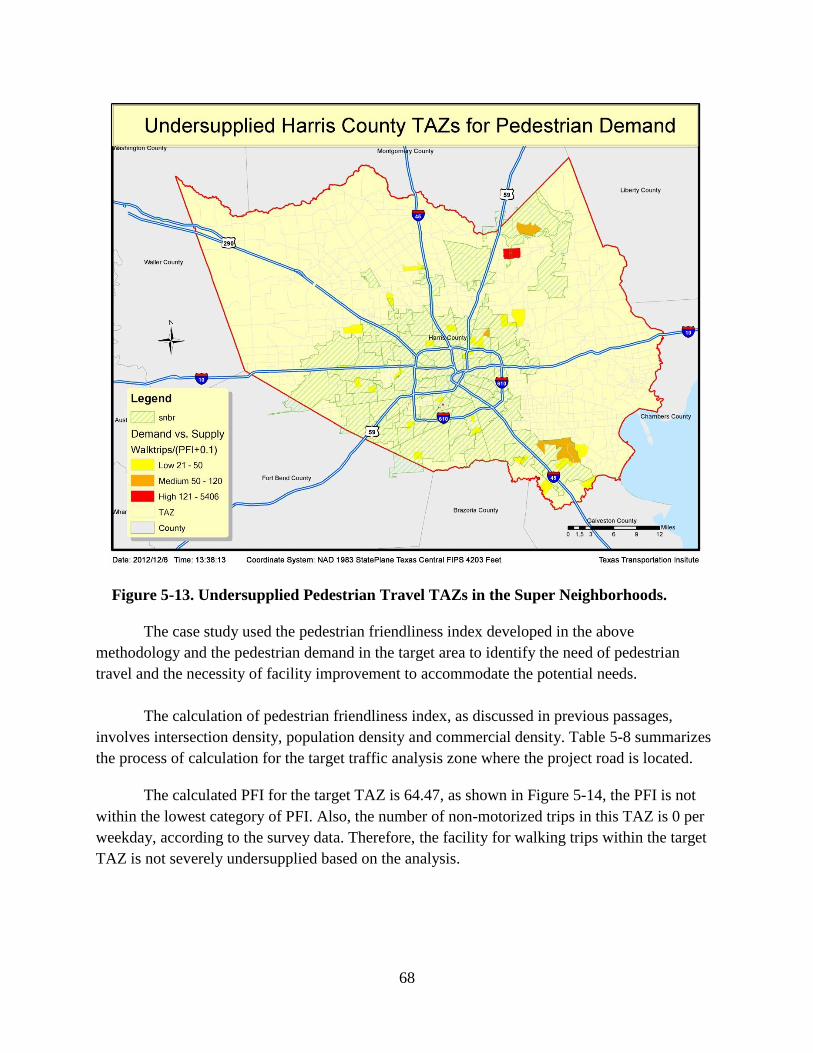
68
Figure 5-13. Undersupplied Pedestrian Travel TAZs in the Super Neighborhoods.
The case study used the pedestrian friendliness index developed in the above
methodology and the pedestrian demand in the target area to identify the need of pedestrian
travel and the necessity of facility improvement to accommodate the potential needs.
The calculation of pedestrian friendliness index, as discussed in previous passages,
involves intersection density, population density and commercial density. Table 5-8 summarizes
the process of calculation for the target traffic analysis zone where the project road is located.
The calculated PFI for the target TAZ is 64.47, as shown in Figure 5-14, the PFI is not
within the lowest category of PFI. Also, the number of non-motorized trips in this TAZ is 0 per
weekday, according to the survey data. Therefore, the facility for walking trips within the target
TAZ is not severely undersupplied based on the analysis.
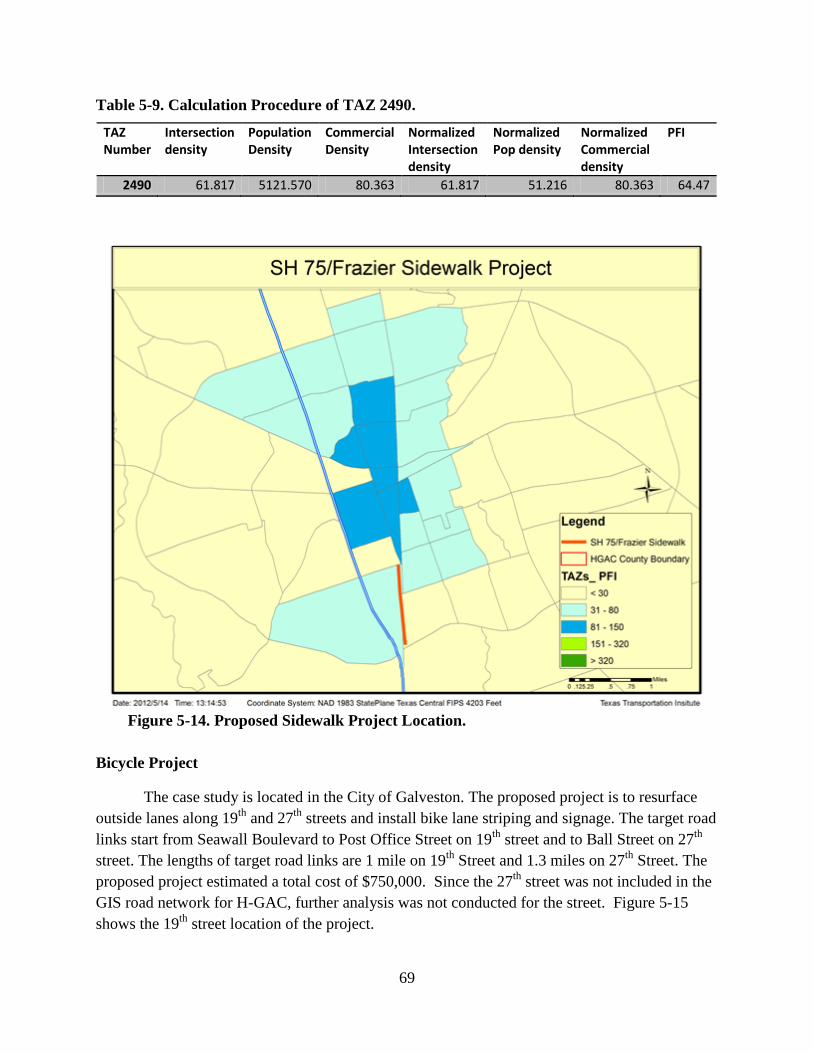
69
Table 5-9. Calculation Procedure of TAZ 2490.
Figure 5-14. Proposed Sidewalk Project Location.
Bicycle Project
The case study is located in the City of Galveston. The proposed project is to resurface
outside lanes along 19th
and 27th
streets and install bike lane striping and signage. The target road
links start from Seawall Boulevard to Post Office Street on 19th
street and to Ball Street on 27th
street. The lengths of target road links are 1 mile on 19th
Street and 1.3 miles on 27th
Street. The
proposed project estimated a total cost of $750,000. Since the 27th
street was not included in the
GIS road network for H-GAC, further analysis was not conducted for the street. Figure 5-15
shows the 19th
street location of the project.
TAZ Number
Intersection density
Population Density
Commercial Density
Normalized Intersection density
Normalized Pop density
Normalized Commercial density
PFI
2490 61.817 5121.570 80.363 61.817 51.216 80.363 64.47
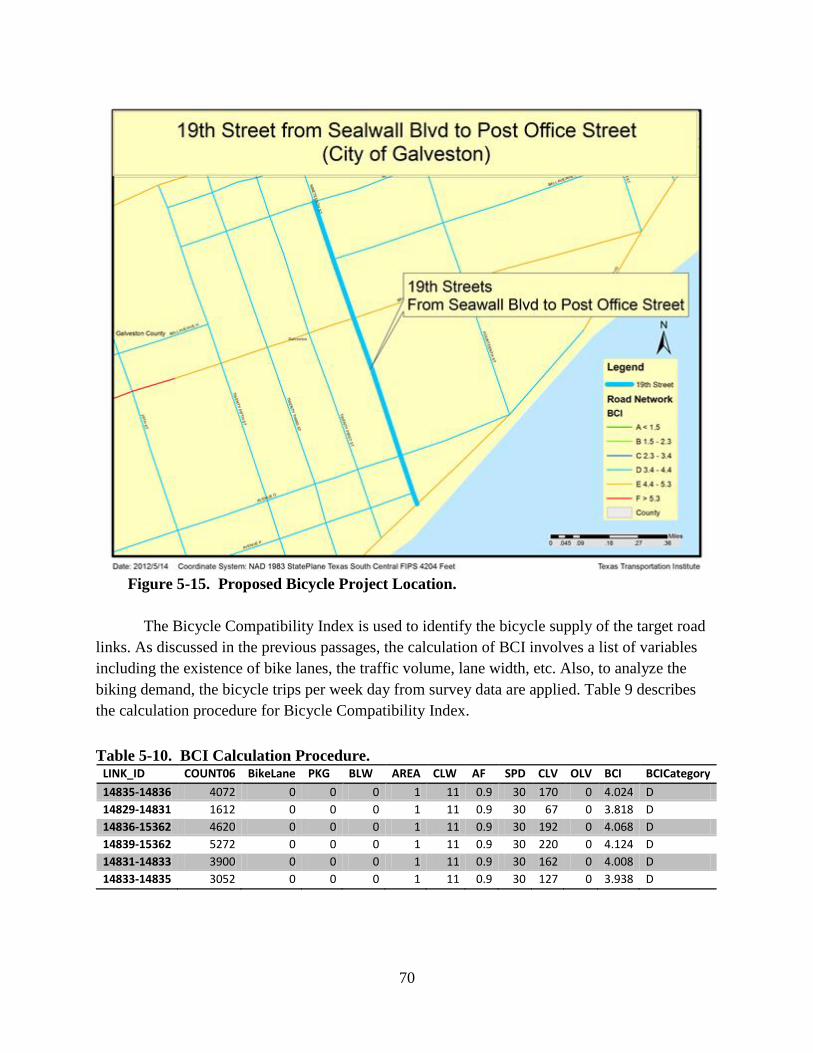
70
Figure 5-15. Proposed Bicycle Project Location.
The Bicycle Compatibility Index is used to identify the bicycle supply of the target road
links. As discussed in the previous passages, the calculation of BCI involves a list of variables
including the existence of bike lanes, the traffic volume, lane width, etc. Also, to analyze the
biking demand, the bicycle trips per week day from survey data are applied. Table 9 describes
the calculation procedure for Bicycle Compatibility Index.
Table 5-10. BCI Calculation Procedure.
LINK_ID COUNT06 BikeLane PKG BLW AREA CLW AF SPD CLV OLV BCI BCICategory
14835-14836 4072 0 0 0 1 11 0.9 30 170 0 4.024 D
14829-14831 1612 0 0 0 1 11 0.9 30 67 0 3.818 D
14836-15362 4620 0 0 0 1 11 0.9 30 192 0 4.068 D
14839-15362 5272 0 0 0 1 11 0.9 30 220 0 4.124 D
14831-14833 3900 0 0 0 1 11 0.9 30 162 0 4.008 D
14833-14835 3052 0 0 0 1 11 0.9 30 127 0 3.938 D
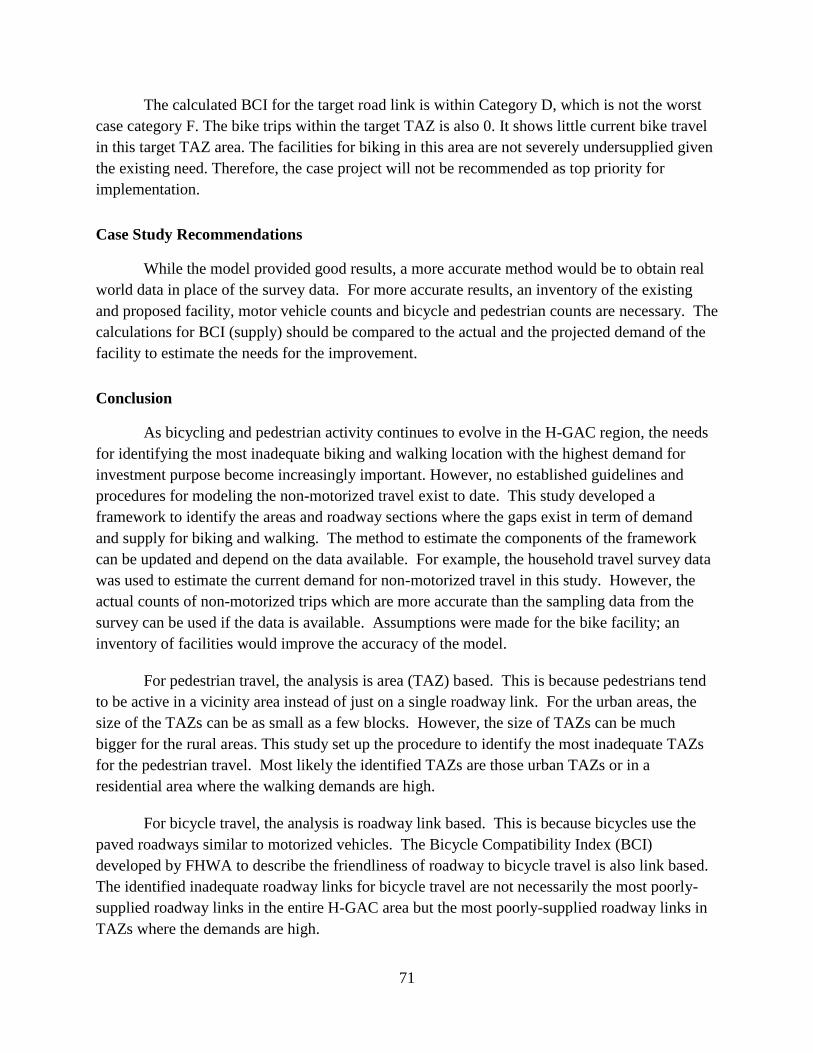
71
The calculated BCI for the target road link is within Category D, which is not the worst
case category F. The bike trips within the target TAZ is also 0. It shows little current bike travel
in this target TAZ area. The facilities for biking in this area are not severely undersupplied given
the existing need. Therefore, the case project will not be recommended as top priority for
implementation.
Case Study Recommendations
While the model provided good results, a more accurate method would be to obtain real
world data in place of the survey data. For more accurate results, an inventory of the existing
and proposed facility, motor vehicle counts and bicycle and pedestrian counts are necessary. The
calculations for BCI (supply) should be compared to the actual and the projected demand of the
facility to estimate the needs for the improvement.
Conclusion
As bicycling and pedestrian activity continues to evolve in the H-GAC region, the needs
for identifying the most inadequate biking and walking location with the highest demand for
investment purpose become increasingly important. However, no established guidelines and
procedures for modeling the non-motorized travel exist to date. This study developed a
framework to identify the areas and roadway sections where the gaps exist in term of demand
and supply for biking and walking. The method to estimate the components of the framework
can be updated and depend on the data available. For example, the household travel survey data
was used to estimate the current demand for non-motorized travel in this study. However, the
actual counts of non-motorized trips which are more accurate than the sampling data from the
survey can be used if the data is available. Assumptions were made for the bike facility; an
inventory of facilities would improve the accuracy of the model.
For pedestrian travel, the analysis is area (TAZ) based. This is because pedestrians tend
to be active in a vicinity area instead of just on a single roadway link. For the urban areas, the
size of the TAZs can be as small as a few blocks. However, the size of TAZs can be much
bigger for the rural areas. This study set up the procedure to identify the most inadequate TAZs
for the pedestrian travel. Most likely the identified TAZs are those urban TAZs or in a
residential area where the walking demands are high.
For bicycle travel, the analysis is roadway link based. This is because bicycles use the
paved roadways similar to motorized vehicles. The Bicycle Compatibility Index (BCI)
developed by FHWA to describe the friendliness of roadway to bicycle travel is also link based.
The identified inadequate roadway links for bicycle travel are not necessarily the most poorly-
supplied roadway links in the entire H-GAC area but the most poorly-supplied roadway links in
TAZs where the demands are high.

72
The procedures developed can also be integrated into the H-GAC Regional Travel
Demand Model with additional inventory of the walking and biking infrastructure. The sketch
model developed for the study can be validated and calibrated once enough data can be collected
from counters installed for the project.
Limitations and Future Research
The methodology developed for this project is at the sketch planning level in that it is
relatively simple to understand and apply; however, the accuracy of the model results is
dependent on the accuracy of the input data.
For the analysis of the current demand, the estimation used the data directly from the
travel survey. Although 5807 households in the region were surveyed, the sample size for
stratified household size and income group may be small. Also, the data was from the most
recent 2008 travel survey. The information could be outdated, especially for non-motorized
travel which appears to be experiencing an increase in recent years with high gas prices. The
travel survey is designed to estimate typical weekday travel. Using the travel survey data as the
estimation for current demand only considered the demand of typical weekday utilitarian biking
and walking trips. Other methods need to be used to estimate non-motorized demand on
weekends and for recreational trips which may account for a significant portion of total non-
motorized travel demand. Validation of this survey data using bicycle and pedestrian count data
would also greatly improve the model.
For the bicycle supply analysis, several road inventory variables have significantly effects
on the BCI value, for example existence of bike lane and bike lane width. At this time, the
inventory of bike facilities in the H-GAC region is incomplete. In addition, it may be of more
interest that an H-GAC regional bicycle friendliness index could be developed using a regional
scale to differentiate the roadways that are now clustered in the LOS C, D and F under the
current FHWA BCI. This future study would help identify the factors that are important to
bicycle travel and the degree of the significance in the context of H-GAC region.
A more accurate estimation of walking supply would need an inventory of the sidewalks
and the condition of the sidewalks in the area. Currently, no such information is available. For
future work, it is recommended that the remote sensing technology be applied on the regional
aerial map to obtain the extensive time consuming information.
The validation analysis is missing in the study because not enough data was collected to
perform the analysis at the time the model was developed. The validation and calibration
process using the collected data would also enhance the accuracy of the model.

71
CHAPTER 6: PROJECT SUMMARY
Chapter 6 provides a summary of the previous five project chapters as listed below.
Included herein is a short description of work activity completed for each chapter. The objective
of the study was to develop a plan for phased implementation of a system of regular pedestrian
and bicycle counting and monitoring sites in the eight county H-GAC Transportation
Management Area that will give H-GAC and local governments adequate data to:
Understand usage of pedestrian and bicyclist facilities in a variety of regional
development contexts;
adjust calculations on estimated air quality benefits of pedestrian and bicyclist
facilities based on data collected in the region on facility usage; and
estimate demand or usage of planned or proposed pedestrian and bicyclist facilities
for project evaluation and selection purposes.
Listed below is a summary of the previous five chapters of the project:
Chapter 1. Pedestrian and Bicyclist Monitoring – Equipment and Methods
Chapter 2. Counting Equipment – Guidance and Installation
Chapter 3. Develop Pedestrian and Bicycle Counting Plan
Chapter 4. Data Collection and Reporting Structure
Chapter 5. Pedestrian and Bicycle Demand Estimation
CHAPTER 1. PEDESTRIAN AND BICYCLIST MONITORING -- EQUIPMENT
AND METHODS
In this chapter, researchers summarized the state-of-the-practice for pedestrian and
bicyclist monitoring (counting) equipment and methods. Below is a list of the equipment and
technologies used to count non-motorized traffic:
Inductance Loop
Infrared–Active
Infrared–Passive
Magnetometer
Pneumatic Tube
Pressure/Acoustic
72
Video Imaging-Automated
Video Imaging-Manual Reduction
Other Emerging Technologies
In general, pedestrian and bicycle monitoring is an emerging practice and definitive
guidance is not well established. Non-motorized traffic monitoring has not typically been
conducted on a systematic or comprehensive basis as compared to vehicular traffic monitoring,
in part because of the following:
There are a smaller number of monitoring locations.
There are no clear criteria available for a representative site selection.
Non-motorized traffic typically has higher use levels on lower functional class roads
and streets, so the use is distributed more over the greater transportation network.
The general practice of using short duration counts due to the perceived difficulty of
automatically counting pedestrians and bicyclists can introduce significant error due
to the low volume and inherently variable nature of non-motorized traffic.
Other challenges in monitoring non-motorized traffic are that bicyclists and pedestrians
do not stay in a fixed lane, they have unpredictable movements, and they may regularly travel in
closely spaced groups.
CHAPTER 2. COUNTING EQUIPMENT – GUIDANCE AND INSTALLATION
The results of Chapter 2 provided H-GAC with guidance on potential deployment for a
mix of permanent versus temporary (or moveable) bicycle and pedestrian counting technologies,
including selections when considering budget constraints and research objectives. TTI
recommended:
two permanent count locations;
three portable pedestrian counters which can be moved throughout the region; and
procedures, classification scheme, and traffic counter settings for standard pneumatic
tube traffic counters to count bicyclists.
TTI also provided in-field supervision of the installation of the two permanent counters
and the setup of data collection mechanisms including connecting loop detectors, achieving
communications via the cellular network, and host website configuration. The two permanent
counters, (“Eco Counters Multi Urban Post”) count bikes and pedestrians separately and have the
ability to distinguish flow by direction and transmit the data using a cell modem.
73
Three portable TRAFx Infrared Trail Counters were also procured by H-GAC for
conducting short-duration pedestrian counts. These counters were tested and modifications were
made to make them more suitable for installation in an urban environment. Metal installation
housings were assembled to provide a secure platform that could be locked and mounted using
large diameter (size range from 3 to 36 inch) hose clamps. The use of automatic pneumatic tube
counts was selected for bicycle counts as they were proven to be effective in counting bicycles,
and several private and public agencies in the region currently utilize this equipment for vehicle
traffic counts. In addition, a bicycle classification scheme, deployment and setup procedures,
and recommendations for tube counter settings were developed.
Draft language for an interlocal agreement for the deployment and use of permanent and
short term counters was provided and modified through H-GAC and local agency legal
departments. The agreements addressed deployment, operation, and maintenance responsibilities
for both the permanent and short term use devices and may be used for interagency loan and use
of the temporary count equipment.
TTI researchers coordinated and assisted in the installation of the initial deployment of
permanent count equipment on January 22, 2013 at: 1) the MKT/SP-Rails to Trails in the
Houston Heights at 5 ½ Street and 2) at the White Oak Bayou Trail at 34th
Street and TC Jester
Blvd.
Guidance on the deployment and use of the pedestrian counters was developed and
presented as a “Pedestrian Tip Sheet”. The tip sheet provides suggestions on selecting count
locations, mounting equipment, and collecting and processing of pedestrian data. A companion
“Bicycle Tip Sheet” was developed to suggest settings, locations, and deployment instructions
for bicycle counters. These tip sheets provide user recommendations for settings to optimize
count setups to obtain the most accurate counts. Location is critical in counter deployment and
factors to consider (such as facility, background, and area or lanes) are included in the tip sheets.
CHAPTER 3. DEVELOP PEDESTRIAN AND BICYCLE COUNTING PLAN
The purpose of Chapter 3 was to develop a pedestrian and bicycle count program plan.
This plan guides a logical framework of count location sites based on various criteria. The
Federal Highway Administration (FHWA) provides some guidance in the Traffic Monitoring
Guide [1]. Count locations should be distributed by area type, facility type, and trip purpose.
Some of the count location criteria include:
counts in key pedestrian and bicyclist activity areas or corridors (downtowns, near
schools, parks, and other non-motorized traffic generators.);
representative count locations in urban, suburban, and rural locations;
counts in key corridors that can be used to gauge the impact of future improvements;
74
count locations where counts have been conducted historically; and
count locations where bicyclist and pedestrian collision numbers are high.
The objectives of this chapter were to:
identify the existing count locations;
solicit input from agencies and bike groups on additional count locations;
determine a framework and criteria to develop a count program; and
develop a draft count plan for consideration.
Very few bicycle and pedestrian counts have been completed in the Houston region, and
these counts were done primarily on a volunteer basis. The most significant count efforts have
included:
2005 - Institute of Transportation Engineers’ (ITE) National Bicycle and Pedestrian
Documentation Project;
2009 - ITE’s National Bicycle and Pedestrian Documentation Project; and
2009-2012 - City of Houston (COH) short term bike counts.
The count locations from each of these efforts were identified, latitude and longitude
locations documented, and the locations plotted. From these existing count locations, the criteria
developed in Chapter 3 and the demand estimation work in Chapter 5, a set of proposed count
locations was developed. The proposed count locations were prepared in graphical format and
presented to the Bicycle and Pedestrian Subcommittee for review and consideration.
CHAPTER 4. DATA COLLECTION AND REPORTING STRUCTURE
The reporting structure will enable H-GAC staff to utilize pedestrian and bicycle count
data from outside data collection efforts (e. g., volunteer spot counts) and integrate it with
ongoing count data collected through both permanent and temporary counters deployed
throughout the region. Chapter 4 included:
a summary of previous non-motorized count efforts in the region to ensure that other
counts (i.e., those undertaken by the City of Houston and/or Houston Parks Board)
are incorporated into data collection and consolidation effort;
an investigation of data storage needs including data aggregation levels, data types,
and data descriptions;
an investigation of existing data warehouse tools and off-the-shelf products; and
75
a methodology to extrapolate spot count data into daily/annual use estimates based on
data collected through permanent count locations.
Existing counts were gathered from various agencies and from two major efforts
including the 2005 and 2010 Bicycle and Pedestrian Documentation Project. The count locations
were identified and plotted on a map. A literature and internet search was conducted to
determine if existing off-the-shelf or data warehouse tools were available. The review indicated
that most agencies build their own software and databases or use private-sector proprietary
software. While any pedestrian and bicycle count information is useful, optimally there would be
a seamless dataset for all transportation data to aid in planning activities and transportation and
air quality model development, calibration, and validation. The most common data types and
aggregation levels were identified along with other characteristics that will allow the inclusion of
data into national reporting efforts and databases. The Transportation Monitoring Guide was
identified as a primary resource to identify data standards and formats. Existing methods for
extrapolating spot counts using local factors were identified in the ITE Manual of Transportation
Engineering Studies and in the Bicycle and Pedestrian Documentation project.
CHAPTER 5. PEDESTRIAN AND BICYCLE DEMAND ESTIMATION
Chapter 5 developed an overall framework to identify the areas and roadway sections
where gaps exist with respect to demand and supply for biking and walking in the H-GAC
region. The framework is established to be adaptive so that the methods to estimate the
components of the framework can be updated depending on the data availability.
The chapter also developed methods to estimate the current demand and supply of non-
motorized travel in the region using the detailed GIS data available. The household travel survey
data was used to estimate the current demand for biking and walking. The chapter also estimated
the suitability of roadway sections for biking based on the Bicycle Compatibility Index (BCI)
developed by FHWA. The Pedestrian Friendliness Index (PFI) of an area was estimated based on
a highly correlated land use factor: an aggregate of population density, retail density, and
intersection density.
The chapter combined the findings from H-GAC’s Special Districts Study which
identified the districts where there are significant opportunities to replace vehicle trips with
pedestrian or bicycle trips. The result of the combination was that the chapter identified the
areas and roadway sections that are not only currently in need for improvements but also with
high potential for more non-motorized travel once improvements are made.
Conclusions and Next Steps
This study provides a foundation upon which H-GAC and other regional agencies can
collect data that can be used to analyze investments in non-motorized transportation facilities.
76
The methods and procedures will need to be used, refined, and institutionalized to develop a base
knowledge of non-motorized activity in the Houston region. Over time, with a concerted effort
to understanding which facilities are utilized and the characteristics that drive that use, sound
reasoning on where and what type of facilities should be deployed with the limited resources
available.
Several items were identified as gaps in the process that could be addressed in the future
as resources become available. These items include:
a regional inventory of bike and pedestrian facilities;
a speed limit inventory as an estimate of operating speed for BCI;
a list of sub-regional count locations (to be revised on a periodic basis);
a workshop to instruct interested agencies and groups on how to deploy both bike and
pedestrian counters;
a regional traffic database that would include motorized and non-motorized
information on traffic volumes;
calibration and validation of the non-motorized travel demand model using counts;
a study of highly utilized facilities (including common characteristics, facility type,
land use, demographics, or other factors);
a study of non-utilized facilities (common characteristics); and
a benefit cost analysis based on actual use and source of funding of the facilities.
77
REFERENCES
1. National Bicycle and Pedestrian Documentation Project, http://bikepeddocumentation.org/,
2012.
2. Traffic Monitoring Guide, http://www.fhwa.dot.gov/ohim/tmguide/.
3. TRAFx Manual
4. TRAFx Infrared Trail Counter Instructions
5. TIME Mark Traffic Counter Manual
6. VIAS Software Manual
7. Nation-Wide Walking and Biking Modeling Effort, Guidebook on the Methods to Estimate
Non-Motorized Travel. U.S. Department of Transportation, McLean, VA, 1999.
8. Krizek, et al. Guidelines for Analysis of Investments in Bicycle Facilities. Appendix A:
Estimating Bicycling Demand. NCHRP Report 552, Transportation Research Board,
Washington, DC, 2006.
9. Kuzmyak, et al. Estimating Bicycling and Walking for Planning and Project Development,
NCHRP Project 08-78, Washington, DC, ongoing.
10. Pedestrian and Bicycle Special Districts Study Update. Houston-Galveston Area Council,
Houston, TX, 2010.
11. Ewing, R. and R. Cervero. Travel and the Built Environment, Journal of American Planning
Association 76-3, pp. 265-294, 2010.


APPENDIX A

A-3
PAPERS, ARTICLES AND REPORTS ON PEDESTRIAN AND BICYCLIST MONITORING Count Methods
2008 San Francisco State of Cycling Report. San Francisco Municipal Transportation Agency (SFMTA), San Francisco, CA, 2008.
Design Portfolio: C.05 Monitoring. Cycling England, pp. 1-5.
Diogenes, Mara Chagas, Ryan Greene-Roesel, Linday S. Arnold, and David R. Ragland. Pedestrian Counting Methods at Intersections: A Comparative Study. Transportation Research Record 2002. Transportation Research Board, Washington, DC, 2007, pp. 26-30. Evaluated the error associated with manual pedestrian counting methods (clicker and tick sheets).
Donlon, Jennifer. The National Bicycle and Pedestrian Documentation Project. Presentation at NATMEC 2010, Seattle, WA, June 2010.
Greene-Roesel, Ryan, Mara Chagas Diόgenes, David R. Ragland, and Luis Antonio Lindau. Effectiveness of a Commercially Available Automated Pedestrian Counting Device in Urban Environments: Comparison with Manual Counts. Paper presented at the 2008 TRB Annual Meeting, Washington, DC, January 2008. Evaluated the error associated with Eco-Counter and manual field counts. Benchmark was video reduced in the office.
Griswold, Julia B., Aditya Medury, and Robert J. Schneider. Pilot Models for Estimating Bicycle Intersection Volumes. Paper presented at the 2011 TRB Annual Meeting, Washington, DC, January 2011.
Haze, G. Counting Pedestrians. The San Francisco Design Department, no date.
Jones, Michael G., Sherry Ryan, Jennifer Donlon, Lauren Ledbetter, David R. Ragland, and Lindsay Arnold. Seamless Travel: Measuring Bicycle and Pedestrian Activity in San Diego County and its Relationship to Land Use, Transportation, Safety, and Facility Type. Caltrans Task Order 6117, UC Berkeley Safe Transportation Research & Education Center, 2010.
Kajala, L., Almik, A., Dahl, R., Dikšaitė, L, Erkkonen, J., Fredman, P., Jensen, F. Søndergaard, Karoles, K., Sievänen, T., Skov-Petersen, H., Vistad, O. I. and Wallsten, P. Visitor Monitoring in Nature Areas – a manual based on experiences from the Nordic and Baltic countries. ISBN 91-620-1258-4. Swedish Environmental Protection Agency, 2007. User-friendly guidebook for visitor counting and visitor surveys, focused primarily on recreational traffic and use.
Kuah, Geok K. Calibration of an Infrared Pedestrian Counting System for Shopping Malls. Transportation Research Record 1210. Transportation Research Board, Washington, DC, 1988, pp. 31-34.
Lindsey, G. and D. B. L. Nguyen. Use of Greenway Trails in Indiana. Journal Of Urban Planning And Development. Vol. 130, No. 4, December 2004, pp. 213-217.
Lindsey, G., J. Wilson, E. Rubchinskaya, J. Yang, and Y. Han. Estimating Urban Trail Traffic: Methods for Existing and Proposed Trails. Landscape and Urban Planning, Volume 81, 2007, pp. 299–315. Good reference, developed various factors for extrapolating and estimating annual trail counts.
A-4
Lindsey, P. and G. Lindsey. Using Pedestrian Count Models to Estimate Urban Trail Traffic. The Journal of Regional Analysis & Policy, Volume 34, No. 1, 2004, pp. 51-68. Developed regression equations based on very short-duration (sub-hour) counts.
Luukkonen, Terhi. Counting of cycling and pedestrian numbers – instructions for practical work. Finnish Transport Agency, Helsinki, 2011 (Full report in Finnish, summary in English).
Monitoring Local Cycle Use. Traffic Advisory Leaflet 1/99, Department for Transport, London, England, April 1999.
Pestalozzi, Stäheli, and D. Sauter. Erhebung des Fuss- und Veloverkehrs: Schlussbericht (Elevation of Foot and Cycle Traffic: Final Report). Switzerland. September 2005 (Report in German, summary in English).
Pulugurtha, Srinivas S., Shashi S. Nambisan, and Pankaj Maheshwari. Estimating Pedestrian Counts in Urban Areas for Transportation Planning and Safety Analyses. ASCE Applications of Advanced Technology in Transportation: Proceedings of 9th International Conference, 2006, pp. 257-262.
Radverkehrsanalyse: Brandenburg (Bicycle Traffic Analysis: Brandenburg). TMB Tourismus-Marketing Brandenburg GmbH, Potsdam, Germany, August 2011 (in German).
Ragland, David. Institutionalization of Pedestrian Volumes. California Walk Bike Conference. 2007. Argues for collecting ped volumes, no methodology.
Richardson, A.J. Estimating Bicycle Usage on National Cycle Network. Transportation Research Record 1982. Transportation Research Board, Washington, DC, 2006, pp. 166-173.
Schneider, Alameda County poster, A Pilot Model for Estimating Pedestrian Intersection Crossing Volumes, poster (2 jpg files)
Schneider, Robert J., Lindsay S. Arnold, and David R. Ragland. Methodology for Counting Pedestrians at Intersections: Use of Automated Counters to Extrapolate Weekly Volumes from Short Manual Counts. Transportation Research Record 2140. Transportation Research Board, Washington, DC, 2009, pp. 1-12.
Schneider, Robert J., Lindsay S. Arnold, and David R. Ragland. Pilot Model for Estimating Pedestrian Intersection Crossing Volumes. Transportation Research Record 2140. Transportation Research Board, Washington, DC, 2009, pp. 13-26.
Schneider, Robert J., Robert S. Patten, and Jennifer L. Toole. Case Study Analysis of Pedestrian and Bicycle Data Collection in U.S. Communities. Transportation Research Record 1939. Transportation Research Board, Washington, DC, 2005, pp.77-90
Schneider, Robert, Lindsay Arnold, and David Ragland. Alameda County Pedestrian and Bicycle Counting Project. UC-Berkeley Traffic Safety Center. September 2008.
Stolz, Elizabeth. Bike Pedestrian Data PowerPoint slides (all contained within NATMEC 2010 presentation).
Stolz, Elizabeth. Colorado’s Statewide Bicycle and Pedestrian Count Project and Program. Presentation at NATMEC 2010, Seattle, WA, June 2010.
A-5
Stolz, Elizabeth. Colorado’s Statewide Bicycle and Pedestrian Travel Monitoring Program. Presentation in FHWA TMIP Webinar. March 8, 2011.
Street, Butch. Public Use Statistics Office. Presentation at NATMEC 2010, Seattle, WA, June 2010.
Zhang, Chen, Lance Jennings, Lisa Aultman-Hall, and Daryl Benoit. Towards More Robust Spatial Sampling Strategies for Non-Motorized Traffic. Submitted to Transportation Research Board 89th Annual Meeting, Washington, DC, January 2010.
Zhang, Chen, Lance Jennings, Lisa Aultman-Hall, and Daryl Benoit. TRB Poster for Paper 10-3308, Towards More Robust Spatial Sampling Strategies for Non-motorized Traffic. January 2010.
Zhang, Chen, Lance Jennings, Lisa Aultman-Hall, and Daryl Benoit. More Robust Spatial Sampling Strategies for Non-motorized Traffic. TRC Report # 10-014. University of Vermont Transportation Research Center, Burlington, VT, September 2010.
Count Equipment
Access Company. Evaluation of People Counters with Specific Recommendations for National Trails in England. National Trails and The Countryside Agency, January 2006. Reviews technologies and manufacturers and makes recommendations for National Trail monitoring in England and Wales.
Access Company. People Counter Information. Extracted from Evaluation of People Counters for National Trails, UK, August 2006, pp. 1-11.
Bell, Amy H. Technology Innovations: Infrared Bicyclist & Pedestrian Counters. The Bike/Ped Professional. APBP Newsletter, Summer 2006.
Bolling, Anne. Tema Cykel Utrustning för mätning av cykeltrafik - En litteraturstudie (Equipment Detecting Cycles: A Literature Study). VTI rapport 663, VTI, 2009 (in Swedish). Reviews the literature regarding technologies capable of automatically detecting (for traffic signal control) and counting bicyclists, as well as various issues associated with sensor accuracy. Summary is in English, full report in Swedish.
Bu, Fanping, Ryan Greene-Roesel, Mara Chaga Diogenes, and David R. Ragland. Estimating Pedestrian Accident Exposure: Automated Pedestrian Counting Devices Report. Paper UCB-TSC-RR-2007-7, UC Berkeley Traffic Safety Center, 2007. Reviews technologies and manufacturers capable of automatically counting pedestrians.
Detektering av Cykeltrafik – Tillforlitliga Cykeltrafikmatningar (Detection of Cycle Traffic: Reliable Cycling Measurements). Publikation 2007:2. Vagverket. Stockholm, 2007 (in Swedish). This report contains evaluation results for both controlled and real-world field tests.
Dharmaraju, Raghuram, David A. Noyce, and Joshua D. Lehman. An Evaluation of Technologies for Automated Detection and Classification of Pedestrians and Bicycles. Compendium of Technical Papers, 71st ITE Annual Meeting. Chicago, IL, 2001.
Foord, Jonathan Gregory. Operating Performance of Automated Pedestrian Detectors at Signalized Intersections. Masters of Science Thesis, University of Manitoba, 2010. Summarizes the field testing of

A-6
three automated pedestrian detectors (for the purpose of traffic signal control): AGD Systems AGD 640, MS Sedco Smartwalk XP, and Xtralis Asim 207 IR.
Gasvoda, Dave. Trail Traffic Counters: Update. Project 9E92A46, Revised guide on Trail Traffic Counters, USDA Forest Service, September 1999. Describes the evaluation of several different trail counter models: Cuesta, Diamond Traffic, Ivan Technologies, TrailMaster, and Compu-Tech.
Glover, Anne. “Monitoring User Numbers: Automatic Pedestrian Counters.” Presentation material, The Access Company and Walk London, no date. Describes use of Eco-Counter equipment for monitoring in London.
Greene-Roesel, Ryan, Mara Chagas Diόgenes, David R. Ragland, and Luis Antonio Lindau. Effectiveness of a Commercially Available Automated Pedestrian Counting Device in Urban Environments: Comparison with Manual Counts. Paper presented at the 2008 TRB Annual Meeting, Washington, DC, January 2008. Evaluated the error associated with Eco-Counter and manual field counts. Benchmark was video reduced in the office.
Greene-Roesel, Ryan, Mara Chagas Diόgenes, David R. Ragland, and Luis Antonio Lindau. Effectiveness of a Commercially Available Automated Pedestrian Counting Device in Urban Environments: Comparison with Manual Counts. Paper UCB-ITS-TSC-RR-2008-5, UC Berkeley Traffic Safety Center, 2008. Evaluated the error associated with Eco-Counter and manual field counts. Benchmark was video reduced in the office.
Harvey, Bruce. Segmented Sensor for High Resolution Detection. FAMU-FSU College of Engineering Department of Electrical and Computer Engineering, PowerPoint presentation, October 2010. Describes the use of improved piezoelectric technology, but only suggests its use for counting pedestrians and bicyclists (i.e., no prototype development or testing).
Hattori, Hiroshi, Akihito Seki, Manabu Nishiyama, and Tomoki Watanabe. Stereo-based Pedestrian Detection using Multiple Patterns. Research & Development Center, TOSHIBA Corporation. Japan. Abstract 243. 2009.
Heikkilä, Janne and Olli Silvén. A Real-Time System for Monitoring of Cyclists and Pedestrians. Infotech Oulu and Department of Electrical Engineering. University of Oulu. Oulu, Finland, 2004.
Horauer, Martin, Markus Ray, Andreas Augustin und Gregor Novak. FlexiCount: Eine flexible Personenzählmatte für den mobilen Indoor und Outdoor Einsatz (FlexiCount: A flexible people counting mat for mobile indoor and outdoor use). REAL CORP, Vienna, May 2010, pp.1095-1100 (in German).
Jordan, Robert. Pleasanton is first in nation using microwave technology to protect cyclists. Online newspaper article in Contra Costa Times, July 31, 2011. Describes the implementation of MS Sedco “Intersector,” a motion and presence detector for traffic and pedestrian signal control.
Macbeth, Andrew G. Automatic Bicycle Counting. IPENZ Transportation Group Technical Conference, New Zealand, September 2002.
Malinovskiy, Yegor., Jianyan Zheng, and Yinhai Wang. Model-Free Video Detection and Tracking of Pedestrians and Bicyclists. In Computer-Aided Civil and Infrastructure Engineering , Volume 24, 2009, pp. 157-168. Describes the use of a video imaging-based prototype for tracking and counting pedestrians and bicyclists.
A-7
Nordback, Krista and Bruce N. Janson. Automated Bicycle Counts: Lessons from Boulder, Colorado. Transportation Research Record 2190. Transportation Research Board, Washington, DC, 2010, pp. 11-18. Summarizes findings regarding best practices for the use of inductance loop detectors for automatically counting bicyclists.
1. Nordback, Krista, Daniel Piatkowski, Bruce N. Janson, Wesley E. Marshall, Kevin J. Krizek, and Deborah S. Main. Using Inductive Loops to Count Bicycles in Mixed Traffic. Journal of Transportation of the Institute of Transportation Engineers. Volume 2, Number 1, October 2011, pp. 39-56.
Noyce, David A, Arunkumar Gajendran, and RaghuramDharmaraju. Development of a Bicycle and Pedestrian Detection and Classification Algorithm for Active-Infrared Overhead Vehicle Imaging Sensors. Transportation Research Record 1982. Transportation Research Board, Washington, DC, 2006, pp. 202-209.
Noyce, David A. and Raghuram Dharmaraju. An Evaluation of Technologies for Automated Detection and Classification of Pedestrians and Bicyclists. Massachusetts Highway Department, University of Massachusetts, May 2002.
O’Rourke, Deb. Trail Traffic Counters for Forest Service Trail Monitoring. Project 2E22A89, USDA Forest Service, April 1994. Describes the evaluation of several different trail counter models: Cuesta, Diamond Traffic, Ivan Technologies, and Compu-Tech.
Ozbay, Kaan, Bekir Bartin, Hong Yang, Ranjit Walla, and Robert Williams. Automatic Pedestrian Counter. Report FHWA-NJ-2010-001, Rutgers University, New Jersey DOT, February 2010. Reviews technologies and manufacturers capable of automatically counting pedestrians. Also describes the field evaluation of the Eco-Counter PYRO and the TrafSys thermal sensor at 5 New Jersey sites. {Very good review and evaluation, well documented report}
People Counter information. (Extracts from The Access Company’s report to the Countryside Agency on
Rogers, Scott and Nikolaos P. Papanikolopoulos. Bicycle Counter. Report MN/RC-2000-08, University of Minnesota, Minnesota DOT, March 2000. Describes the use of a video imaging-based prototype for tracking and counting bicyclists.
Rogers, Scott and Nikolaos P. Papanikolopoulos. Counting Bicycles Using Computer Vision. IEEE Intelligent Transportation Systems Conference Proceedings, Dearborn, MI, October 2000.
Schweizer, Thomas. Methods for Counting Pedestrians. Paper presented at the 6th International Conference on Walking in the 21st Century, Zurich, Switzerland, 2005.
Somasundaram, Guruprasad, Vassilios Morellas, and Nikolaos P. Papanikolopoulos. Practical Methods for Analyzing Pedestrian and Bicycle Use of a Transportation Facility. Report MN/RC 2010-06. Minnesota Department of Transportation, February 2010. Reviews technologies capable of automatically counting bicyclists, and describes the use of a video imaging-based prototype for tracking and counting bicyclists.
Somasundaram, Guruprasad, Vassilios Morellas, and Nikolaos P. Papanikolopoulos. Deployment of Practical Methods for Counting Bicycle and Pedestrian Use of a Transportation Facility. Report CTS 12-01. University of Minnesota, January 2012.
A-8
Tsimhoni, Omer, Michael J. Flannagan, and Takako Minoda. Pedestrian Detection with Night Vision Systems Enhanced by Automatic Warnings. Report No. UMTRI-2005-23. University of Michigan, September 2005.
Turner, Shawn, Dan Middleton, Ryan Longmire, Marcus Brewer, and Ryan Eurek. Testing and Evaluation of Pedestrian Sensors. Report No. SWUTC/07/167762-1, Southwest Region University Transportation Center, September 2007, http://swutc.tamu.edu/publications/technicalreports/167762-1.pdf.
ViaStrada Ltd. Continuous Cycle Counting Trial. Project number 184-2, New Zealand Transport Agency, January 2009. Describes the evaluation of two types of inductance loop detector systems for bicyclists: Eco Counter’s ZELT and the Bicycle Recorder. The use of pneumatic tubes and signal control loops is also discussed.
ViaStrada Ltd. Cycle Counting in New Zealand. ISBN 978-0-478-30952-2, Land Transport New Zealand, Submitted December 2007, Published February 2008. Describes a literature and state-of-the-practice review for cycle traffic monitoring in New Zealand.
Yan, B., R. Blacow, S.E. Prasad and D. Waechter. Perimeter Security Detection System Based on Piezoelectric Strain Measurement. Abstract. Sensor Technology Limited, Collingwood, Ontario, Canada, no date. This research paper describes the development and application of a pressure-sensitive (piezoelectric) plate system for monitoring pedestrian trail traffic.
Count Programs
Bertulis, Tom. Mexico City Cycle Monitoring and Evaluation. Institute for Transportation and Development Policy, April 2009.
Bicycle Account 2010. City of Copenhagen, Denmark, May 2011.
Hudson, Joan, Tong-Bin Qu , and Shawn Turner. Forecasting Bicycle and Pedestrian Usage and Research Data Collection Equipment. Report TTI P2009330. Capital Area Metropolitan Planning Organization, Austin, Texas, December 2010.
Patton, David. Making bicycles and pedestrians count: Arlington County’s bicycle and pedestrian counting project. Department of Environmental Services, Arlington, Virginia, March 15, 2011.
Portland Metro. Regional Trail Counts. PowerPoint Presentation, September 2011.
Portland Metro. Intertwine trail use snapshot: An analysis of National Bicycle and Pedestrian Documentation Project data from 2008 to 2010. September 2011.
Ragland, David R., Lindsay Arnold, Michael G. Jones, Lauren Buckland, and Sherry Ryan. Seamless Travel: Measuring Bicycle and Pedestrian Activity in San Diego County and its Relationship to Land Use, Transportation, Safety, and Facility Type. Caltrans Task Order 6117, UC Berkeley Traffic Safety Center. 2007.
Schneider, Robert J., Robert S. Patten, and Jennifer L. Toole. Case Study Analysis of Pedestrian and Bicycle Data Collection in U.S. Communities. Transportation Research Record 1939. Transportation Research Board, Washington, DC, 2005, pp. 77-90.
A-9
Schneider, Robert, Robert Patton, Jennifer Toole, and Craig Raborn. Pedestrian and Bicycle Data Collection in United States Communities: Quantifying Use, Surveying Users, and Documenting Facility Extent. FHWA, January 2005.
Summit County, Colorado. 2010 Trail Traffic County Study: Summit County Recreational Pathway System. No date.
Vancouver-Clark Parks & Recreation. Clark County Bicycle and Pedestrian Trail Use Snapshot: Fall 2010 Visitor Counts And Surveys. April 2011.
VicRoads. Bicycle Volumes 2005-2011: Inductive Loops in Melbourne, August 2011.
Wilbur Smith Associates. Bicyclist and Pedestrian Data Collection and Analysis Project. Metropolitan Transportation Commission, April 9, 2003.
Wilbur Smith Associates. Handbook for Bicyclist and Pedestrian Counts. Metropolitan Transportation Commission, April 9, 2003.
Multiple Pedestrian and Bicycle Data Collection: Task 1 – Literature Review. Contract No. DTFH61-11-F-00031, Prepared by AMEC E&I and Sprinkle Consulting for Federal Highway Administration, August 29, 2011. Pedestrian and Bicycle Data Collection: Final Report. Contract No. DTFH61-11-F-00031, Prepared by AMEC E&I and Sprinkle Consulting for Federal Highway Administration, December 9, 2011. Sauter, Daniel. Measuring Walking. Presentation handouts for APBP Webinar, July 15, 2009. Donlon, Jennifer and Matt Berkow. National Bicycle and Pedestrian Documentation Project. Presentation handouts for APBP Webinar, July 15, 2009. Donlon, Jennifer. Trail Counts with Automatic Counters. Presentation handouts, June 28, 2011.
A-10
Count Equipment Manufacturers (does not include presence detection) CA Traffic Ltd, Bicycle Recorder bike counter, http://www.ca-traffic.com/ProductCat.aspx?id=19,
accessed November 2, 2011. Carson Electronics, PTC-3 Passive Trail Counter, http://www.carsons.ca/, accessed November 1,
2011. Chambers Electronics UK, various people counters, http://www.chambers-
electronics.com/people_counters.htm, accessed November 2, 2011. Diamond Traffic Products, Trail Counter TTC-4420, https://www.diamondtraffic.com/, accessed
November 2, 2011. Eastek Systems GmbH, Countwasy People Counter, http://www.counteasy.de/en/index.html,
accessed November 1, 2011. Eco-counter, various people counters, http://www.eco-counter.com/, accessed November 2, 2011. Irisys, various people counters, http://www.irisys.co.uk/people-counting/, accessed November 2,
2011. K-Hill Signal Company, Traffic and Pedestrian Counters, http://www.khilltrafficounters.com/,
accessed November 1, 2011. Road Runner TCA Ltd, various pedestrian counters, http://www.roadrunner-tca.co.uk/pcs.html,
accessed November 2, 2011. Sierzega Elektronik GmbH, SR-6 Radar Bicycle Counter, http://www.sierzega.com, accessed
November 2, 2011. Traf-Sys, various people counters, http://trafsys.com/people-counters.aspx, accessed November 2,
2011. TRAFx, various people counters, http://www.trafx.net, accessed November 2, 2011. TrailMaster, various trail monitors, http://www.trailmaster.com/, accessed November 2, 2011.

APPENDIX B

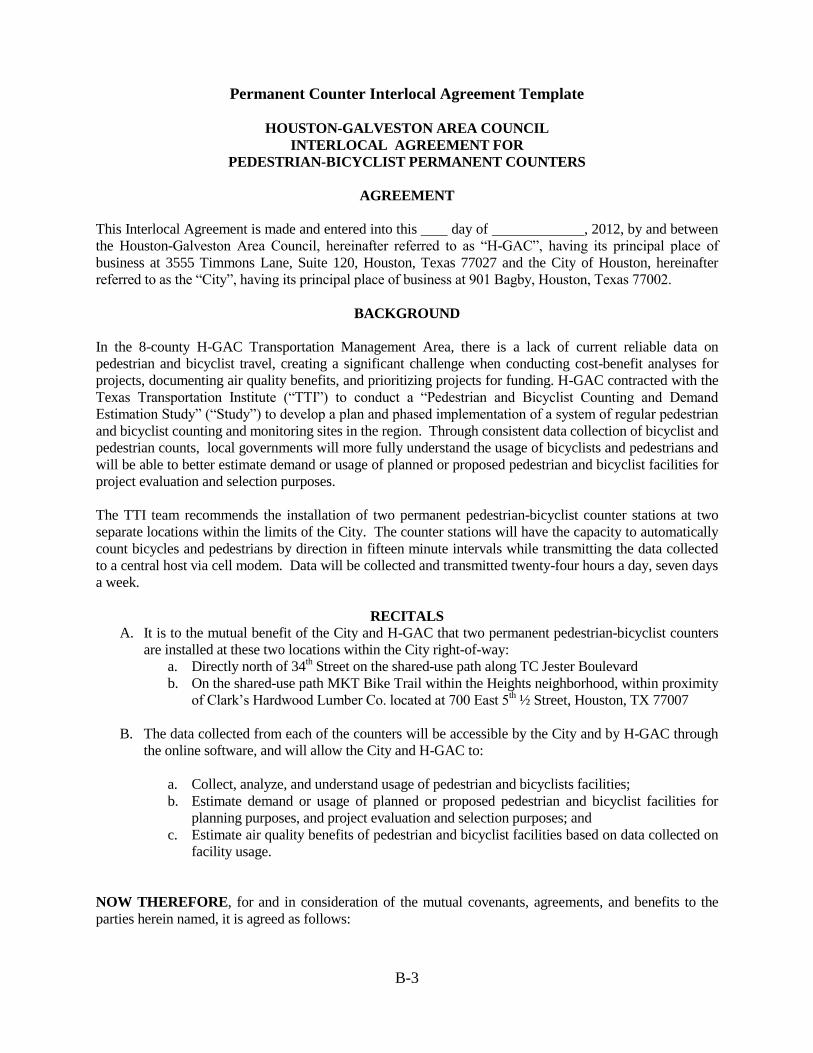
B-3
Permanent Counter Interlocal Agreement Template
HOUSTON-GALVESTON AREA COUNCIL
INTERLOCAL AGREEMENT FOR
PEDESTRIAN-BICYCLIST PERMANENT COUNTERS
AGREEMENT
This Interlocal Agreement is made and entered into this day of , 2012, by and between
the Houston-Galveston Area Council, hereinafter referred to as “H-GAC”, having its principal place of
business at 3555 Timmons Lane, Suite 120, Houston, Texas 77027 and the City of Houston, hereinafter
referred to as the “City”, having its principal place of business at 901 Bagby, Houston, Texas 77002.
BACKGROUND
In the 8-county H-GAC Transportation Management Area, there is a lack of current reliable data on
pedestrian and bicyclist travel, creating a significant challenge when conducting cost-benefit analyses for
projects, documenting air quality benefits, and prioritizing projects for funding. H-GAC contracted with the
Texas Transportation Institute (“TTI”) to conduct a “Pedestrian and Bicyclist Counting and Demand
Estimation Study” (“Study”) to develop a plan and phased implementation of a system of regular pedestrian
and bicyclist counting and monitoring sites in the region. Through consistent data collection of bicyclist and
pedestrian counts, local governments will more fully understand the usage of bicyclists and pedestrians and
will be able to better estimate demand or usage of planned or proposed pedestrian and bicyclist facilities for
project evaluation and selection purposes.
The TTI team recommends the installation of two permanent pedestrian-bicyclist counter stations at two
separate locations within the limits of the City. The counter stations will have the capacity to automatically
count bicycles and pedestrians by direction in fifteen minute intervals while transmitting the data collected
to a central host via cell modem. Data will be collected and transmitted twenty-four hours a day, seven days
a week.
RECITALS
A. It is to the mutual benefit of the City and H-GAC that two permanent pedestrian-bicyclist counters
are installed at these two locations within the City right-of-way:
a. Directly north of 34th Street on the shared-use path along TC Jester Boulevard
b. On the shared-use path MKT Bike Trail within the Heights neighborhood, within proximity
of Clark’s Hardwood Lumber Co. located at 700 East 5th ½ Street, Houston, TX 77007
B. The data collected from each of the counters will be accessible by the City and by H-GAC through
the online software, and will allow the City and H-GAC to:
a. Collect, analyze, and understand usage of pedestrian and bicyclists facilities;
b. Estimate demand or usage of planned or proposed pedestrian and bicyclist facilities for
planning purposes, and project evaluation and selection purposes; and
c. Estimate air quality benefits of pedestrian and bicyclist facilities based on data collected on
facility usage.
NOW THEREFORE, for and in consideration of the mutual covenants, agreements, and benefits to the
parties herein named, it is agreed as follows:
B-4
TERMS
I. Upon execution of this Agreement, H-GAC will purchase the two permanent counters. Upon
receiving the two purchased counters, the City shall install counter equipment at the two designated
locations described in Exhibit A, maintain the counter stations throughout the life of the equipment
(ten plus years), and share the data with H-GAC through the online software.
II. H-GAC shall purchase the permanent counters from a vendor capable of supplying the equipment
necessary to perform the continuous bi-directional pedestrian and bicyclist counts.
III. Upon receiving counter equipment, H-GAC, TTI and the City will coordinate on proper installation
of the counter stations and equipment.
IV. TTI will oversee the installation of the counter stations, and will assist in the set up of the initial
data collection for the City and H-GAC to use with the counters.
V. The City shall provide staff to install the two counter stations. Installation includes but is not
limited to:
a. Installation of a galvanized steel 5.5 inch diameter post into the ground along the trail, that
will hold the data collection equipment;
b. Installation of pedestrian counter equipment with a lens that will be placed in the metal post
in order to transmit pedestrian count data;
c. Saw cuts in the concrete to install the loop detector wire and sealant necessary for bicycle
detection; and
d. Installation of pull boxes that will connect the loop detector wire (two 16 inches by 60
inches) with the counter equipment.
VI. The City will maintain and ensure proper operation of the counters from installation through the life
of the counter equipment. Maintenance and operation includes but not limited to:
a. Pedestrian counter lens cleaning twice a year to ensure accurate pedestrian counts;
b. Yearly battery checks or battery replacements for the two counter stations;
c. Monthly field visits to ensure debris does not impede the proper operation of the counters;
d. Monthly field visits to check that the equipment is functioning properly and to address and
fix any potential equipment problems due to vandalism, flooding, or other disruptions;
e. Monthly payments to the cell modem provider of approximately $40 per counter to ensure
proper data transfer to the cell modem after the first two years of free data/storage
collection for the equipment;
f. Manual yearly counts at the locations to ensure proper calibration of the counter equipment
at each counter station location; and
g. Coordination with the commercial vendor of the counter equipment if any equipment
malfunctions within the equipment two-year warranty period.
VII. The City and H-GAC will have unlimited access to the online database of pedestrian and bicyclist
count data collected using the two permanent counter stations.
VIII. This agreement will be evaluated every two years (from the date the agreement is signed) to ensure
proper coordination between H-GAC and the City.
a. This agreement may be terminated by any of the following conditions:
B-5
b. By mutual agreement and consent of both parties. c. By any party, upon failure of the other party to fulfill the obligations as set forth herein.
The termination of this agreement shall extinguish all rights, duties, obligations, and liabilities of H-GAC and the City under this agreement. If the potential termination of this agreement is due to the failure of any party to fulfill its contractual obligations as set forth herein, the party alleging the breach will notify the other party that possible breach of contract has occurred.
IX. If the City decides to no longer maintain or utilize the permanent counters, or if the City decides to remove the counters, it is the responsibility of the City to physically remove the counter equipment without disrupting activity on the pedestrian-bicyclist facility, and return the equipment to H-GAC.
X. If the City needs to relocate the permanent counters due to construction or other circumstances, the new location should be mutually agreed upon by both the City and H-GAC and should be on a facility that is used for commuting or other transportation related purposes.
XI. It is expressly understood and agreed that the City has the available staff and capacity to satisfy its
obligations under this Agreement.
XII. Any changes in the agreement provisions or obligations of the parties hereto shall be enacted by written amendment executed by both the City and H-GAC.
XIII. All notices required or permitted shall be in writing and shall be deemed delivered when actually
received or, if earlier, on the third day following deposit in a United States Postal Service Post Office or receptacle with proper postage affixed addressed to the other party at the address prescribed below or at such other address as each party may prescribe by written notice from time-to-time. City of Houston: City of Houston 901 Bagby, Houston, Texas 77002 Houston, Texas 77002 Attention: Joe Turner H-GAC: Houston-Galveston Area Council P.O. Box 22777 Houston, Texas 77227 Attention: Jack Steele, H-GAC Executive Director Either party may designate a different address by giving the other party ten days written notice.
XIV. The Parties agree that this Agreement contains all of the terms and conditions of the understanding of the parties relating to the subject matter hereof. All prior negotiations, discussions, correspondence and preliminary understandings between the parties and others relating hereto are superseded by this Agreement.
This instrument, in duplicate originals, has been executed by the parties hereto as follows:
BY_________________________DATE__________
City of Houston
BY_________________________DATE__________
Jack Steele, Executive Director, Houston-Galveston Area Council a political subdivision of the State of Texas
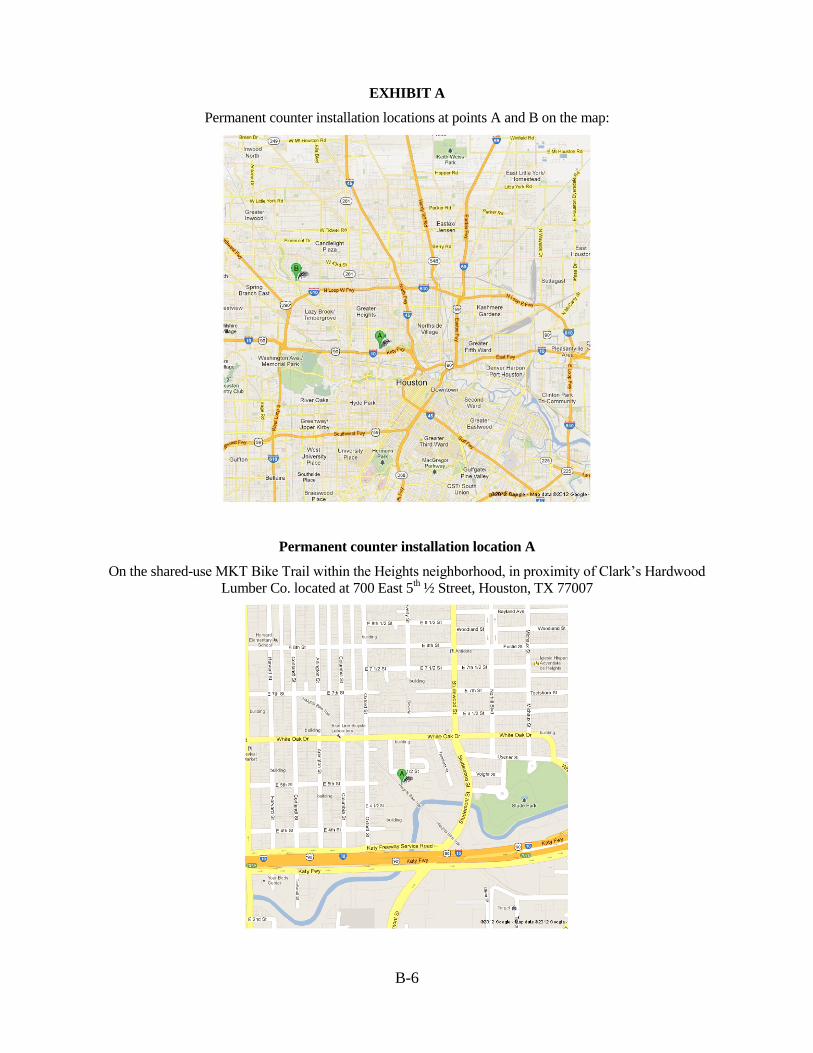
B-6
EXHIBIT A
Permanent counter installation locations at points A and B on the map:
Permanent counter installation location A
On the shared-use MKT Bike Trail within the Heights neighborhood, in proximity of Clark’s Hardwood
Lumber Co. located at 700 East 5th ½ Street, Houston, TX 77007
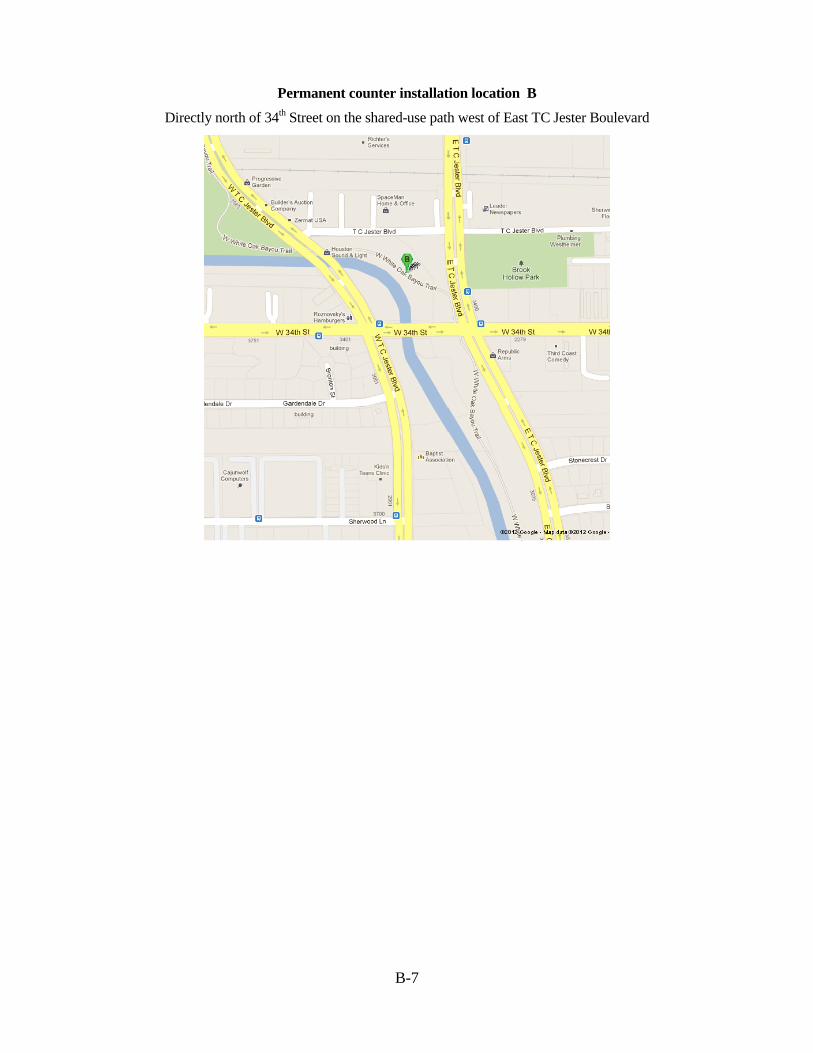
B-7
Permanent counter installation location B
Directly north of 34th Street on the shared-use path west of East TC Jester Boulevard


APPENDIX C

C-3
Temporary Counter Interlocal Loan Agreement Template
(Subject to change as needed upon direct coordination with jurisdictions)
HOUSTON-GALVESTON AREA COUNCIL
LOAN OF BICYCLE AND PEDESTRIAN
MONITORING EQUIPMENT AGREEMENT
1. PARTIES. This agreement is made and entered into this day of , 201_, by
and between the Houston-Galveston Area Council, hereinafter referred to as “H-GAC”, having its
principal place of business at 3555 Timmons Lane, Suite 120, Houston, Texas 77027 and
_________(person), of ______________(organization), who must be an authorized representative
of a governmental jurisdiction or transportation provider, hereinafter referred to as the
“Borrower”.
LOAN OF EQUIPMENT. For and in consideration of the covenants and agreements hereinafter
contained, to be kept and performed by Borrower, H-GAC has loaned and does hereby loan to
borrower the personal property known and described as follows:
__________________(EQUIPMENT LIST) hereinafter designated as “equipment”, to have and
to hold the same unto Borrower for the period of _________________(# of WEEKS) weeks
commencing from ___________________________(DATE).
2. DELIVERY AND RETURN OF PROPERTY. Borrower shall pick up the equipment at H-
GAC’s place of business, 3555 Timmons Lane, Suite 120, Houston, Texas 77027, or at another
location agreed to by both parties. At the end of the term, Borrower shall return equipment to H-
GAC in as good condition as exists at the commencement of the term, reasonable wear and tear in
respect thereto expected.
3. PAYMENT AND LATE FEES. No payment is required for use of the equipment within the
period stated in this agreement. Late fees will be charged to Borrower if the equipment is not
returned within this period under the following schedule: $20 per calendar day.
4. DAMAGES. If the Borrower damages, or loses possession of the equipment at any time, full
costs of repair or replacement, shipping and late fees will be due to H-GAC.
5. REPOSSESSION. If Borrower shall lose possession of the equipment or any interest therein, or
if Borrower defaults in any of the covenants, conditions or provisions of this agreement, it is
agreed that H-GAC may immediately and without notice take possession of the equipment
whereinsoever found and to remove and keep or dispose of the same and any unpaid late fees
shall at once become due and payable.
6. LOCATION AND USE. Borrower shall use equipment only in Harris, Montgomery, Liberty,
Chambers, Galveston, Brazoria, Fort Bend, and Waller Counties in Texas except as may be
permitted by H-GAC by consent thereto in writing. Borrower shall provide HGAC with date,
location of equipment deployment, and electronic data from the count locations.
7. INDEMNIFICATION OF OWNER. Borrower shall and does hereby agree to protect and save
Owner harmless against any and all losses or damage to equipment by fire, flood, explosion,
hurricane, wind or theft and Borrower shall and does hereby assume all liability to any person
whomsoever arising from the location, condition or use of equipment, and shall indemnify Owner
of and from all liability, claim and demand whatsoever arising from the location, condition, or use
of equipment whether in operation or not, and growing out of any cause, and from every other
C-4
liability, claim and demand whatsoever during the term of this Loan or arising while equipment is
in the possession of Borrower.
8. TIME OF ESSENSE. Time is the essence of this agreement.
9.
10. NO ASSIGNMENT. Neither this Loan and agreement nor any right or interest thereunder shall
be assigned by Borrower in any respect whatsoever.
11. CHOICE OF LAW. This Loan and agreement shall be deemed to have been executed and
entered into in the State of Texas and shall be construed, enforced and performed in accordance
with the laws thereof.
12. EXCLUSION OF ORAL STATEMENTS. This instrument contains all of the agreements of
the parties. No oral or other statements shall be binding on either of the parties hereto.
BY_________________________DATE__________
Borrower
_________________________
Title
BY_________________________DATE__________
Houston-Galveston Area Council
_________________________
Title


APPENDIX D

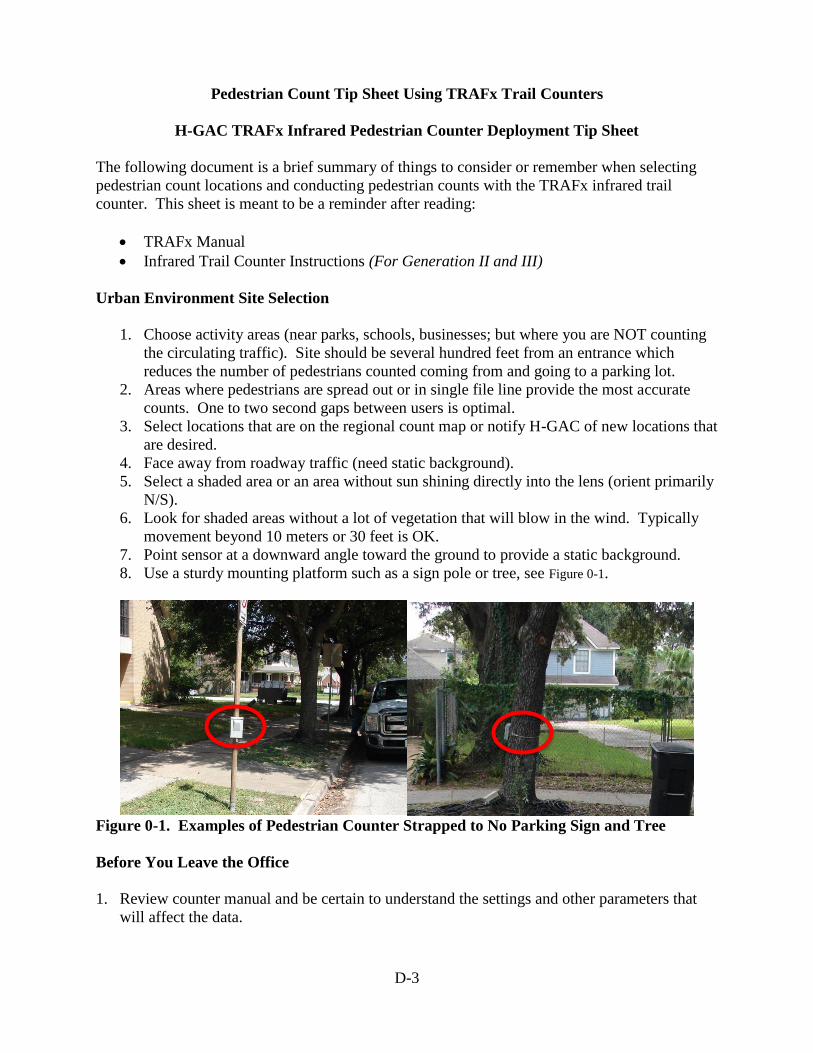
D-3
Pedestrian Count Tip Sheet Using TRAFx Trail Counters
H-GAC TRAFx Infrared Pedestrian Counter Deployment Tip Sheet
The following document is a brief summary of things to consider or remember when selecting
pedestrian count locations and conducting pedestrian counts with the TRAFx infrared trail
counter. This sheet is meant to be a reminder after reading:
TRAFx Manual
Infrared Trail Counter Instructions (For Generation II and III)
Urban Environment Site Selection
1. Choose activity areas (near parks, schools, businesses; but where you are NOT counting
the circulating traffic). Site should be several hundred feet from an entrance which
reduces the number of pedestrians counted coming from and going to a parking lot.
2. Areas where pedestrians are spread out or in single file line provide the most accurate
counts. One to two second gaps between users is optimal.
3. Select locations that are on the regional count map or notify H-GAC of new locations that
are desired.
4. Face away from roadway traffic (need static background).
5. Select a shaded area or an area without sun shining directly into the lens (orient primarily
N/S).
6. Look for shaded areas without a lot of vegetation that will blow in the wind. Typically
movement beyond 10 meters or 30 feet is OK.
7. Point sensor at a downward angle toward the ground to provide a static background.
8. Use a sturdy mounting platform such as a sign pole or tree, see Figure 0-1.
Figure 0-1. Examples of Pedestrian Counter Strapped to No Parking Sign and Tree
Before You Leave the Office
1. Review counter manual and be certain to understand the settings and other parameters that
will affect the data.
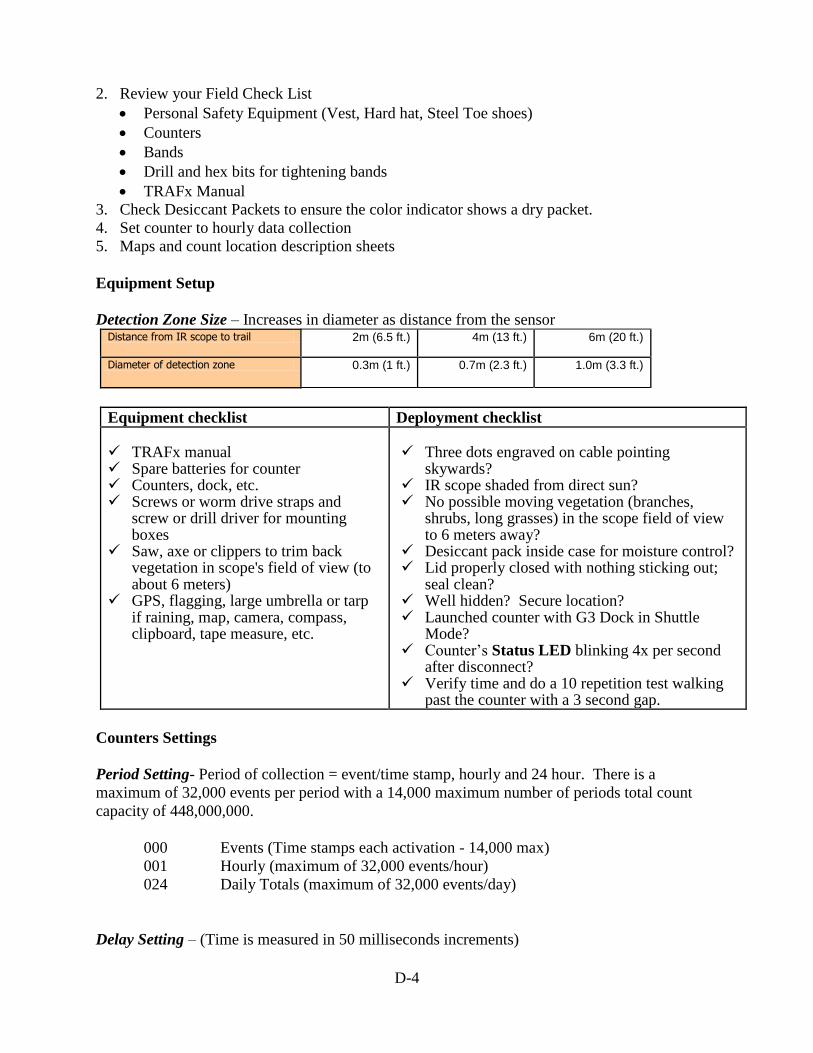
D-4
2. Review your Field Check List
Personal Safety Equipment (Vest, Hard hat, Steel Toe shoes)
Counters
Bands
Drill and hex bits for tightening bands
TRAFx Manual
3. Check Desiccant Packets to ensure the color indicator shows a dry packet.
4. Set counter to hourly data collection
5. Maps and count location description sheets
Equipment Setup
Detection Zone Size – Increases in diameter as distance from the sensor Distance from IR scope to trail 2m (6.5 ft.) 4m (13 ft.) 6m (20 ft.)
Diameter of detection zone 0.3m (1 ft.) 0.7m (2.3 ft.) 1.0m (3.3 ft.)
Equipment checklist Deployment checklist TRAFx manual Spare batteries for counter Counters, dock, etc. Screws or worm drive straps and
screw or drill driver for mounting boxes
Saw, axe or clippers to trim back vegetation in scope's field of view (to about 6 meters)
GPS, flagging, large umbrella or tarp if raining, map, camera, compass, clipboard, tape measure, etc.
Three dots engraved on cable pointing
skywards? IR scope shaded from direct sun? No possible moving vegetation (branches,
shrubs, long grasses) in the scope field of view to 6 meters away?
Desiccant pack inside case for moisture control? Lid properly closed with nothing sticking out;
seal clean? Well hidden? Secure location? Launched counter with G3 Dock in Shuttle
Mode? Counter’s Status LED blinking 4x per second
after disconnect? Verify time and do a 10 repetition test walking
past the counter with a 3 second gap.
Counters Settings
Period Setting- Period of collection = event/time stamp, hourly and 24 hour. There is a
maximum of 32,000 events per period with a 14,000 maximum number of periods total count
capacity of 448,000,000.
000 Events (Time stamps each activation - 14,000 max)
001 Hourly (maximum of 32,000 events/hour)
024 Daily Totals (maximum of 32,000 events/day)
Delay Setting – (Time is measured in 50 milliseconds increments)
D-5
025 = 1.25 second delay
030 = 1.50 second delay (30*50ms = 1500ms)
035 = 1.75 second delay
040 = 2.00 second delay (40*50ms = 2000ms)
050 = 2.50 second delay
060 = 3.00 second delay
080 = 4.00 second delay
100 = 5.00 second delay
Refer to TRAFx Infrared Trail Counter instructions
Data Retrieval
Data can be retrieved in the field or the units can be brought in after data collection. Follow
procedures in the TRAFx Manual to retrieve data. Check counter after the first 24 hours to
ensure you have data, and be sure to restart counter.
QAQC/ Data Storage
Once data is collected and retrieved, a series of quality control checks should be conducted to
ensure accuracy of the count. Import the data into a spread sheet and use pivot tables and charts
to check:
Deployment Day Test
Day of Week Plots
Time of Day Plots
Reasonableness of Data – High/Low
Once data has been through agency QAQC checks, a copy of the data should be sent to H-GAC
to be included in a region non-motorized count database.
Data should include:
TRAFx Electronic Data File
Meta Data
o Count location – general description of the count area and the land use and
activity and area around the count location.
o Latitude and Longitude Coordinates
o Count Conditions – Typical, Special Event, Commuting, Recreation, Mixed, etc.


APPENDIX E


E-3
Bike Count Tip Sheet Using Time Mark Tube Counters
HGAC Bicycle Pneumatic Tube Counter Tip Sheet
Pneumatic tubes or road tubes can be used to count bicycle traffic. Typical vehicle counters are
used with some special settings to conduct off and on street bike counts. This tip sheet
documents site selection and settings for the Time Mark traffic counter. In addition it will cover
user types and best practices.
User Types and Best Practices
Bicycle volume counts are typically conducted for 24 hours a day for seven days a week. An
extra seven days of counts should be conducted if any inclement weather or special events occur
during the original time period. Time of day variations provide an insight to the types of riders.
Recreational riders tend to be in the early morning, evening, and on weekends and holidays.
Commuting riders tend to be during the weekday morning and afternoon peak periods. Utility
trips can be any time of day or day of week, as they are typically quick shopping trips or short
errands.
There are several bicycle rider types:
A (Advanced) – Experienced riders who can operate under most traffic conditions
B (Basic Bicyclists) – Casual riders including adults and teenagers who are less confident
of their ability to operate in traffic without special provisions for bicycles
C (Children) – Pre-teen riders whose roadway use is initially monitored by parents
Many times a facility caters to the trip type or rider type. Almost all riders feel comfortable on a
multi-use trail and typically only the advanced riders feel comfortable on a bike lane on a major
arterial.
Site Selection
The site selection should be based on what is needed for the type of study being conducted.
Some counts are done for operations and others for planning purposes. Count location should be
based on the group of riders targeted for the count (recreational, commuting, utility), and sites
should be in a level tangent area to avoid turns and stopping on the road tubes.
Urban Site Location
There are several urban bike facility types:
Trail / Multi Use Path
Bike Lane and Cycle Tracks
Shared Lane “Sharrows” (mixed traffic - bikes and motor vehicles)
The data recording setups are slightly different if you are counting mixed traffic versus only
bikes. In all cases you should determine a location on a level straight away. Ideally, bicycles
should be counted separately from motor vehicles. So if you are counting on a street with a
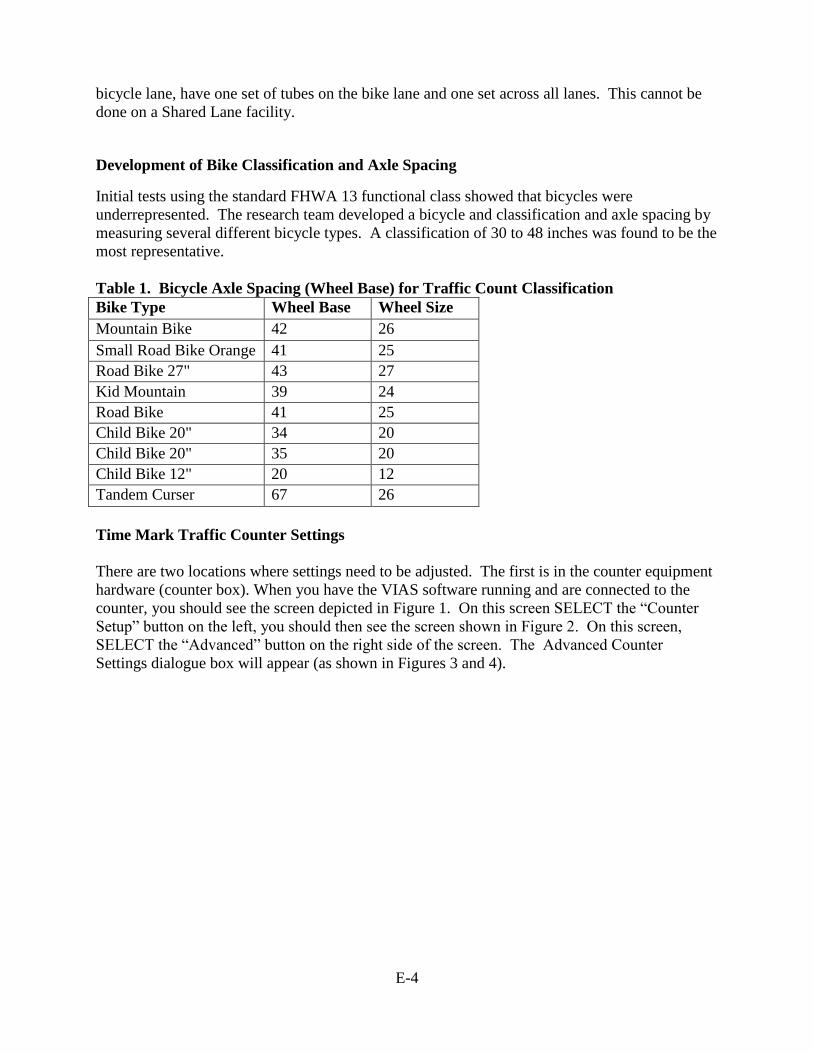
E-4
bicycle lane, have one set of tubes on the bike lane and one set across all lanes. This cannot be
done on a Shared Lane facility.
Development of Bike Classification and Axle Spacing
Initial tests using the standard FHWA 13 functional class showed that bicycles were
underrepresented. The research team developed a bicycle and classification and axle spacing by
measuring several different bicycle types. A classification of 30 to 48 inches was found to be the
most representative.
Table 1. Bicycle Axle Spacing (Wheel Base) for Traffic Count Classification
Bike Type Wheel Base Wheel Size
Mountain Bike 42 26
Small Road Bike Orange 41 25
Road Bike 27" 43 27
Kid Mountain 39 24
Road Bike 41 25
Child Bike 20" 34 20
Child Bike 20" 35 20
Child Bike 12" 20 12
Tandem Curser 67 26
Time Mark Traffic Counter Settings
There are two locations where settings need to be adjusted. The first is in the counter equipment
hardware (counter box). When you have the VIAS software running and are connected to the
counter, you should see the screen depicted in Figure 1. On this screen SELECT the “Counter
Setup” button on the left, you should then see the screen shown in Figure 2. On this screen,
SELECT the “Advanced” button on the right side of the screen. The Advanced Counter
Settings dialogue box will appear (as shown in Figures 3 and 4).
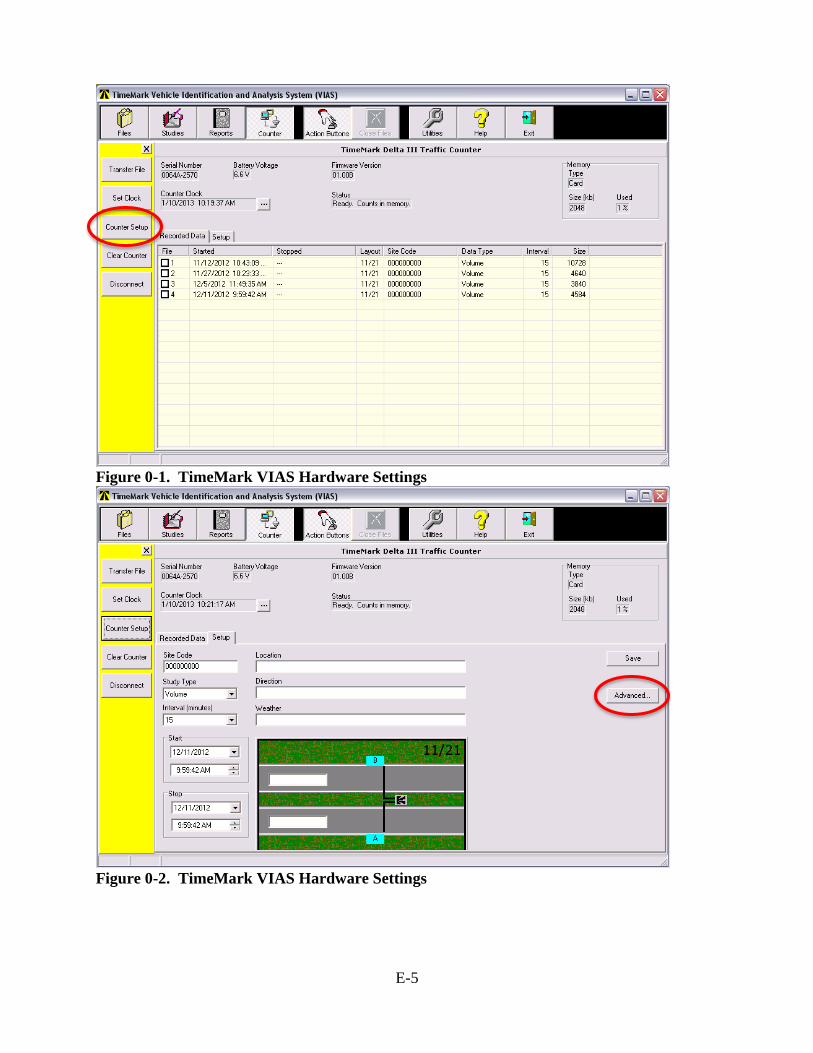
E-5
Figure 0-1. TimeMark VIAS Hardware Settings
Figure 0-2. TimeMark VIAS Hardware Settings
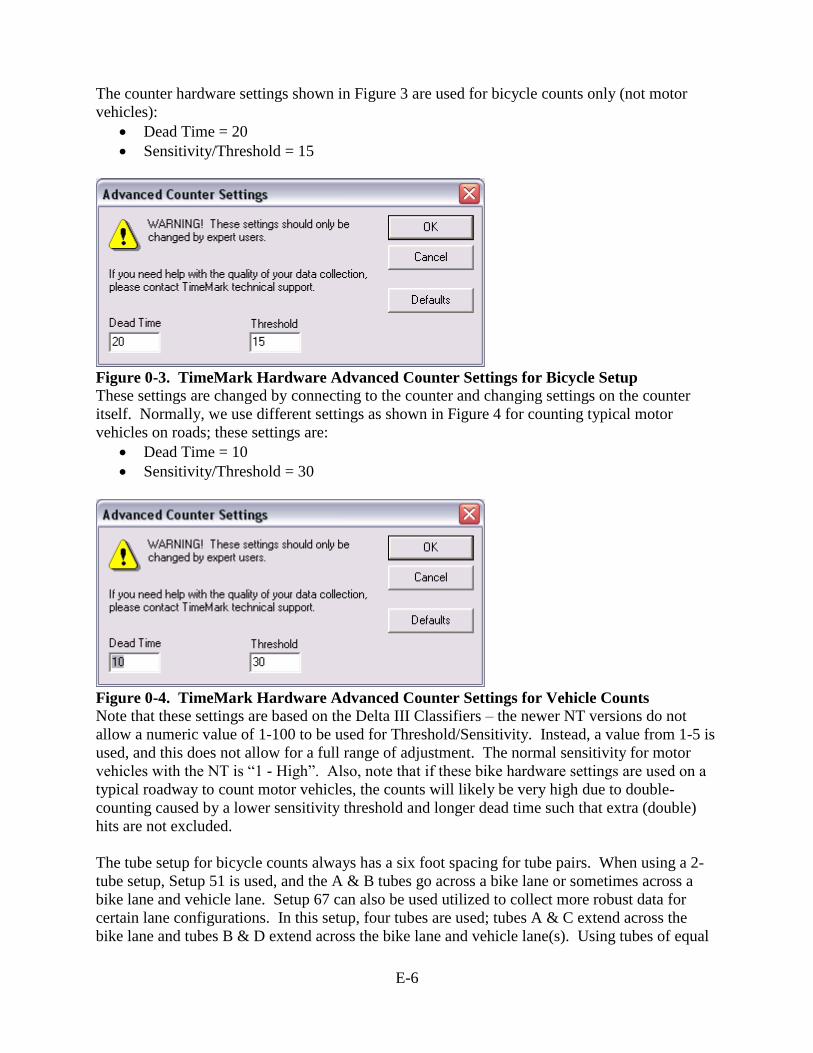
E-6
The counter hardware settings shown in Figure 3 are used for bicycle counts only (not motor
vehicles):
Dead Time = 20
Sensitivity/Threshold = 15
Figure 0-3. TimeMark Hardware Advanced Counter Settings for Bicycle Setup
These settings are changed by connecting to the counter and changing settings on the counter
itself. Normally, we use different settings as shown in Figure 4 for counting typical motor
vehicles on roads; these settings are:
Dead Time = 10
Sensitivity/Threshold = 30
Figure 0-4. TimeMark Hardware Advanced Counter Settings for Vehicle Counts
Note that these settings are based on the Delta III Classifiers – the newer NT versions do not
allow a numeric value of 1-100 to be used for Threshold/Sensitivity. Instead, a value from 1-5 is
used, and this does not allow for a full range of adjustment. The normal sensitivity for motor
vehicles with the NT is “1 - High”. Also, note that if these bike hardware settings are used on a
typical roadway to count motor vehicles, the counts will likely be very high due to double-
counting caused by a lower sensitivity threshold and longer dead time such that extra (double)
hits are not excluded.
The tube setup for bicycle counts always has a six foot spacing for tube pairs. When using a 2-
tube setup, Setup 51 is used, and the A & B tubes go across a bike lane or sometimes across a
bike lane and vehicle lane. Setup 67 can also be used utilized to collect more robust data for
certain lane configurations. In this setup, four tubes are used; tubes A & C extend across the
bike lane and tubes B & D extend across the bike lane and vehicle lane(s). Using tubes of equal
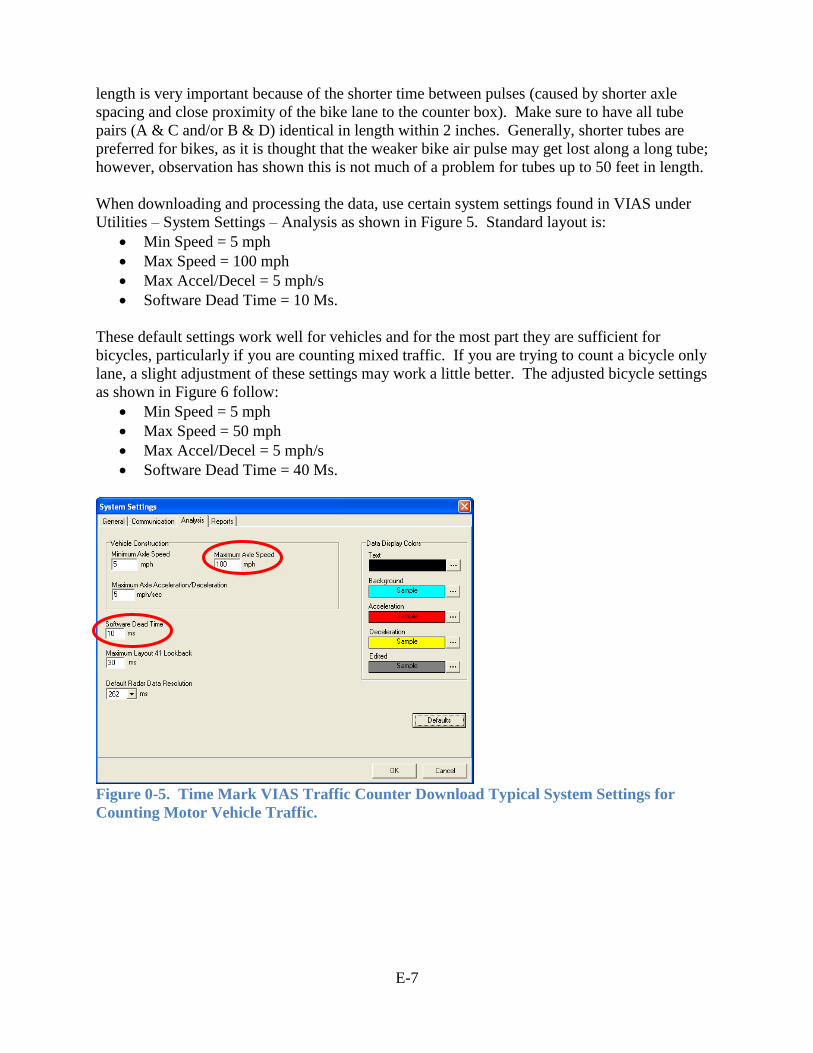
E-7
length is very important because of the shorter time between pulses (caused by shorter axle
spacing and close proximity of the bike lane to the counter box). Make sure to have all tube
pairs (A & C and/or B & D) identical in length within 2 inches. Generally, shorter tubes are
preferred for bikes, as it is thought that the weaker bike air pulse may get lost along a long tube;
however, observation has shown this is not much of a problem for tubes up to 50 feet in length.
When downloading and processing the data, use certain system settings found in VIAS under
Utilities – System Settings – Analysis as shown in Figure 5. Standard layout is:
Min Speed = 5 mph
Max Speed = 100 mph
Max Accel/Decel = 5 mph/s
Software Dead Time = 10 Ms.
These default settings work well for vehicles and for the most part they are sufficient for
bicycles, particularly if you are counting mixed traffic. If you are trying to count a bicycle only
lane, a slight adjustment of these settings may work a little better. The adjusted bicycle settings
as shown in Figure 6 follow:
Min Speed = 5 mph
Max Speed = 50 mph
Max Accel/Decel = 5 mph/s
Software Dead Time = 40 Ms.
Figure 0-5. Time Mark VIAS Traffic Counter Download Typical System Settings for
Counting Motor Vehicle Traffic.
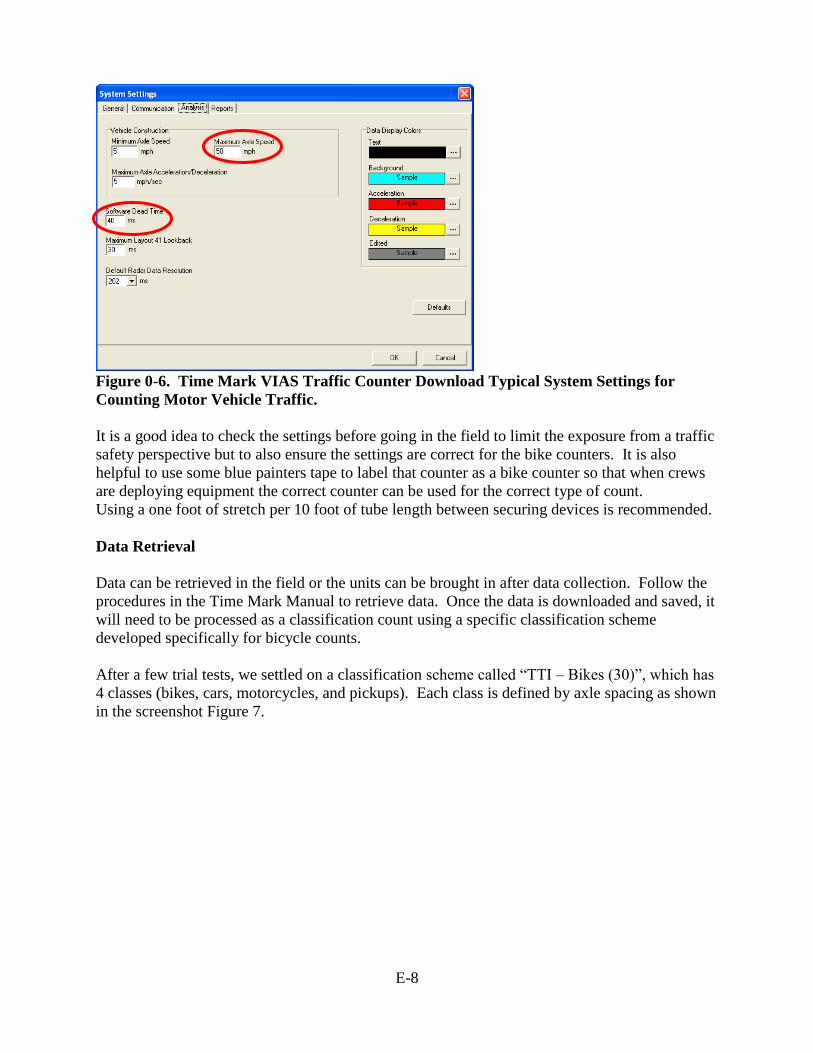
E-8
Figure 0-6. Time Mark VIAS Traffic Counter Download Typical System Settings for
Counting Motor Vehicle Traffic.
It is a good idea to check the settings before going in the field to limit the exposure from a traffic
safety perspective but to also ensure the settings are correct for the bike counters. It is also
helpful to use some blue painters tape to label that counter as a bike counter so that when crews
are deploying equipment the correct counter can be used for the correct type of count.
Using a one foot of stretch per 10 foot of tube length between securing devices is recommended.
Data Retrieval
Data can be retrieved in the field or the units can be brought in after data collection. Follow the
procedures in the Time Mark Manual to retrieve data. Once the data is downloaded and saved, it
will need to be processed as a classification count using a specific classification scheme
developed specifically for bicycle counts.
After a few trial tests, we settled on a classification scheme called “TTI – Bikes (30)”, which has
4 classes (bikes, cars, motorcycles, and pickups). Each class is defined by axle spacing as shown
in the screenshot Figure 7.
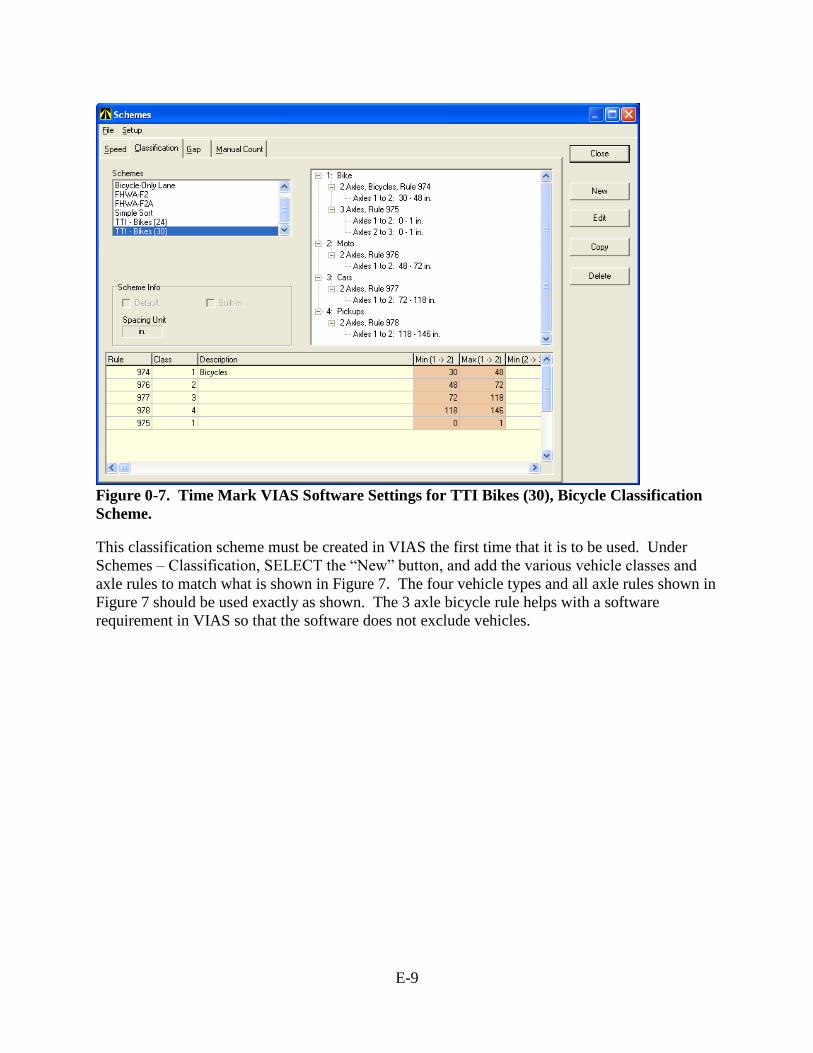
E-9
Figure 0-7. Time Mark VIAS Software Settings for TTI Bikes (30), Bicycle Classification
Scheme.
This classification scheme must be created in VIAS the first time that it is to be used. Under
Schemes – Classification, SELECT the “New” button, and add the various vehicle classes and
axle rules to match what is shown in Figure 7. The four vehicle types and all axle rules shown in
Figure 7 should be used exactly as shown. The 3 axle bicycle rule helps with a software
requirement in VIAS so that the software does not exclude vehicles.
E-10
QAQC/ Data Storage
Once data is collected and retrieved a series of quality control checks should be conducted to
ensure accuracy of the count. Import the data into a spreadsheet and use pivot tables and charts
to check:
Day of Week Plots
Time of Day Plots
Reasonableness of Data – High/Low
Once data has been through agency QAQC checks, a copy of the data should be sent to HGAC to
be included in a region non-motorized count database.
Data should include:
CSV Time Mark Electronic Data File (VIAS Export - Default Volume Format)
Meta Data
o Count Location – general description of the count area and the land use and
activity and area around the count location.
o Latitude and Longitude Coordinates
o Key Map Page and Square
o Direction of Travel by Tube
o Type of Facility (bike lane, shared use path, other)
o Adjacent traffic lane counts (always helpful)
o Count Conditions – Typical, Special Event, Commuting, Recreation, Mixed, etc.
Time Mark Count File Information
o Start of Count Date; August 9, 2012
o Start of Count Time; 14:15
o Sensor Layout; 51
o Location; Heights Blvd. Bike Lane - North of 17th Street
o Direction; Northbound
o Weather; Clear and Hot


APPENDIX F


F-3
List of Existing Non-Motorized Counts Name Description Location Count Type Date Counts
Performed
1 Kirby University Houston Manual 5/13/05
2 Braes Bayou Stella Link & Buffalo Speedway Houston Manual 5/13/05
3 FM 529 Hudson Oaks Dr Harris County Manual 5/13/05
4 TC Jester Park White Oak Bayou Trail Houston Manual 5/12/05
5 Terry Hershey Park E of Dairy Ashford Houston 4-day Tube 5/11/05
6 Terry Hershey Park E of Dairy Ashford Houston 4-day Tube 5/15/05
7 Terry Hershey Park E of Dairy Ashford Houston 4-day Tube 5/19/05
8 Terry Hershey Park E of Dairy Ashford Houston Manual 5/12/05
9 Terry Hershey Park E of Dairy Ashford Houston Manual 10/27/05
10 Brays Bayou Castlewood Houston Manual 10/29/05
11 Brays Bayou Castlewood Houston Manual 10/31/05
12 George Bush Fry and Highland knolls Harris County Manual 10/22/05
13 E TC Jester 34th Houston 7-day tube 5/13/10 - 5/19/10
14 White Oak Frazier Houston 7-day tube 5/13/10 - 5/23/10
15 Terry Hershey Park Memorial Houston Video 5/19/10 - 5/20/10
16 Terry Hershey Park Eldridge Houston Video 5/19/10 - 5/20/10
17 Dairy Ashford IH 10 WB FR Houston Video 5/19/10 - 5/20/10
18 Bertner Pressler Houston Manual 5/17/10
19 Moursund Bertner Houston Manual 5/18/10
20 Brays Link wood Houston Manual 5/21/10
21 Brays Link wood Houston Survey 5/21/10
22 Columbia Tap Trail Wheeler Houston Manual 5/19/10
23 Columbia Tap Trail TSU Houston Manual 5/19/10
24 Columbia Tap Trail TSU Houston Survey 5/19/10
25 Columbia Tap Trail TSU Houston Survey 5/19/10
26 Terry Hersey Park Sport Park Trail Houston Manual 5/18/10
27 Terry Hersey Park Sport Park Trail Houston Manual 5/18/10
28 Terry Hersey Park Dairy Ashford Houston Manual 5/14/10
29 Terry Hersey Park Dairy Ashford Houston Manual 5/14/10
30 Myer Park By baseball field on trail Harris County 7-day Tube 5/17/10 - 5/23/10
31 Bay Area Park T intersection bike & sidewalk Harris County 7-day Tube 5/3/10 - 5/9/10
32 Cambridge Wyndale Houston Manual 5/14/10
33 Cambridge Wyndale Houston Manual 5/14/10
34 Cambridge Wyndale Houston Survey 5/14/10
35 Cambridge Wyndale Houston Survey 5/14/10
36 White Oak Frazier Houston 7-day Tube 5/19/10 - 5/20/10
37 7th street Heights to Yale Houston 7-day Tube 10/20/11-10/26/11
38 1013 Nicholson 1013 Nicholson Houston 7-day Tube 10/20/11-10/26/11
39 TC Jester 34th Houston 7-day Tube 10/20/11-10/26/11
40 White Oak at bridge Houston 7-day Tube 10/20/11-10/26/11
41 TC Jester 34th street Houston 7-day Tube 5/13/10 - 5/24/10
Note: These counts represent counts conducted prior to 2012 and some counts were conducted as testing of equipment that was not included in this list.
Top Related