


Languages
Pages
Legal


Linking Corrosion PhenomenaPrediction to
Corrosion Science andEngineering Fundamentals
R. G. KellyCenter for Electrochemical Sci. & Engr.
Dept. of Materials Sci. & Engr.University of Virginia
Gordon Conference on Aqueous Corrosion 2002

Grand Challenges forCorrosion Science & Engineering• DoD Asset Life Extension
– A/C fleets are aging, must keep operational• How to manage maintenance driven by corrosion?
– New A/C Carrier to be manned by far fewer
• High Level Nuclear Waste Storage– Yucca Mountain Project– Safe storage of nuclear waste for > 104 y
• Civil Infrastructure– New bridges/transportation systems > 80 y service life

A/C Aver. Age* Future PlansKC-135 36 Retain 25+ YrsB-52H 36 Retain 25+ YrsT-38 30 Retain 25+ YrsC-5 20 Retain 25+ YrsC-141B 31 Retire in 8 YrsE-3 18 Retire in 17-25 Yrs* as of 30 Sep 97C-141
KC-135 B-52
Aging Aircraft
KC-135Courtesy D. Peeler

Aging Aircraft Challenge• Corrosion• Fatigue Cracking• Parts Availability• Wiring• Aging Avionics
Repair DensityIncreases
Flow Rates Decrease
Aging Fleet
Modernization$$ Decrease
Mission Capable Rates &A/C Availability Decrease
Maintenance $$ IncreaseCourtesy D. Peeler

Fuselage Floor BeamAA7075-T6 beam + Steel fastener = galvanic corrosion
(from condensation on inside of fuselage)
Courtesy R. Piascik

“Condensed moisture and itscontaminants can be trappedin close fitting, wettablejoints, such as fayingsurfaces and be drawn alongpore lines by capillaryaction.”
FAA Advisory: AC 43-4A (7/25/91)
Classic lap joint corrosion around lower wing access port resulting in pillowing (AA2024)
Courtesy R. Piascik

Occluded Regions Corrode

Currently “Find It-Fix It”Aircraft EntersMaintenance
Corrosion Found (Visual)
Corrosion Repaired
Grind Out,
Check Thickness
Aircraft LeavesMaintenance
Part Replace

Move to “Anticipate & Manage”Aircraft EntersMaintenance
Focus Corrosion Inspection (NDI)
Corrosion Analyzed
Repair
Aircraft LeavesMaintenance
Suppress Defer Repair
or or

Example Hierarchy of Issues forAging Aircraft
• Engineering– What corrosion can we leave & what must be fixed?– What kind of effects does corrosion have on DTDA?
• Applied Science– What chemical variables control the topography and
rate of corrosion in occluded regions?– What properties should be engineered into coating
systems?• Fundamental Science
– What individual electrochemical reactions controlinitial corrosion topography?
– How do we characterize corrosion topography?

Flight Ground Flight Ground.... Specified # Cycles / FH
AssumedDamage Summary Makeup:100% Cyclic
Actual Damage Summary Makeup = ??X % Cyclic Y % Environmental
Actual 1 Calendar Year = 100 Flights, 3 Hours/Flight
Flight Ground Flight Ground
Environmental Cycles
Life Assessment Model AccommodatesTime & Environmental Effects

0
0.05
0.1
0.15
0.2
0.25
0.3
0.35
0.4
0 20000 40000 60000 80000 100000 120000
Cycles
C C
rack
Len
gth
B707 Field Aircraft
Analysis if Corroded withPillowing
Mean IDS
Large (99%)IDS = 0.01"
Without Corrosion
Analysis Details:• 0.063" sheet, 3/16 inch fastener, 1" wide ligament• 8.98 ksi R=0 loading• Tension Stress Ratio = 1• Bearing Stress Ratio = 2.72 (countersink effects)• Typical IDS: 0.0033" (APES)• No account for stiffener effects• 545 cycles/year• 7 year protective system breakdown, thickness loss approx. 17.5% at year 42
Analysis Courtesy of Northrop Grumman Corporation and APES, Inc
Life Analysis Compared toB707 Field Aircraft Experience

Topography Affects Local StressIntensities

Time
ThicknessLoss
Time
Pit Size
Time
PillowingStress
Influence onDamage
Time
TopographyCorrection
Examples of Damage Progression DriversRequiring Laboratory and Field Verification
Must transform cartoons to data

KC-135 Doublers
General - no AlcladGeneral - not thru Alclad
20 µm 20 µm

How to Simulate ConditionsInside These Joints?
32 mils
20 µm
Karen LewisJackie Williams
LJ Simulant20 mM Cl-
4 mM NO2-
4 mM HCO3-
2 mM F-
pH 9.0
20 µm
No COx
Same weight loss after 4 months

12 weeks
2 weeks 4 weeks

Development of TopographyWithin Lap Joint
time (weeks)0 2 4 6 8 10 12
% s
urfa
ce a
rea
corro
ded
0
20
40
60
80
100
Ambient CO2
Minimal CO2
Lateral Extent of Corrosion

Development of TopographyWithin Lap Joint
time (weeks)0 2 4 6 8 10 12
dept
h (m
icro
ns)
0
20
40
60
80
100
120
140
Ambient CO2
Minimal CO2Max Depth

Image
2-D AutocorrelationFunction
“Pit” 1200 grit polish
Classification of Corrosion TopographyUsing the Autocorrelation Function

Determination of τ from ACF τ = correlation length
τ∗
T=τmax/τmin

Pitted 304 Stainless Steel
T ratio = 0.94
τ = 17.35 µm

Electropolished Cu
T ratio = 0.95
τ = 0.59 µm

Classification of CorrosionTopography
polished< 1 µm> 0.5
pitting>1 µm> 0.5
mill finish<1 µm< 0.5
general corrosion>1 µm< 0.5
SurfaceClassification
τ*maxT Ratio

T(t) forCorroding Lap Joint Faying Surfaces

Role of Carbon Dioxide SystemDestabilization of Pits
time (weeks)0 2 4 6 8 10 12 14
pit a
spec
t rat
io
0.15
0.20
0.25
0.30
0.35
0.40
0.45
0.50
0.55
minimal COx
LJSS

Role of Carbon Dioxide SystemInhibition of Cathodic Reaction

Al metal bulkAl metal bulkAl metal bulk
4. 4. Stable pitting Stable pitting
Cl- Na+ H2O Oxide Layer (Al2O3)H+ Al3+
Al metal bulkAl metal bulk
BeginningBeginning
1. 1. ClCl-- adsorption adsorption2. 2. Passive film breakdownPassive film breakdown3. 3. DDissol’nissol’n//repassivationrepassivation
Al metal bulk
Atomistic Framework of Pitting
Donghai Mei
Matt Neurock

KMC Modeling of Pitting of Al and Al/Cu in Chloride SolutionKMC Modeling of Pitting of Al and Al/Cu in Chloride Solution
Aluminum Metal (Al)
Passive Oxide Layer (Al2O3)
Solution (Na+, Cl-, H2O)
Solution with Constant Ion Concentration (C0)
Simple 3D Lattice-gas Model
Pits formed by continuous kinetic events (reaction + diffusion/migration)
),,( NeighborspHEfk appliedi =
Reaction rate calculation
−=
RTEkr i
ii exp ),( 0, NeighborsEfE ii =

Model SystemModel System : Aluminum-copper alloy in aqueous Aluminum-copper alloy in aqueous NaClNaCl solution environment solution environment
Reactions Considered
Metal ion hydrolysisMetal ion hydrolysis
Breakdown of oxide layerBreakdown of oxide layer Cl- + Oxidexide Cl- + Emptympty
Anodic dissolutionAnodic dissolution
k1
k7
(1)
Oxide Formation Oxide Formation 2Al + 3H2O Al2O3 (Oxidexide) + 6H+ + 6e–k18k19
(18,19)
(13,14)
(11,12)
Al3+ + H2O Al(OH)2+ + H+k5k6
(5,6)
Al Al3+ + 3e–k2 (2)
Al(OH)2+ + Cl- Al(OH)Cl+
Al(OH)Cl+ + H2O Al(OH)2Cl + H+
Al3+ + 3H2O Al(OH)3 + 3H+
Al3+ + 3Cl- AlCl3
k11
k9
k8
k10
k12k13k14
(7,8)
(9,10)
Water DissociationWater Dissociation
Water ReductionWater Reduction
H+ + OH- H2O
2H2O + 2e- H2 (g) + 2OH-
k16k17
(16,17)
(15)k15
Cu Cu2+ + 2e–k3 (3,4)k4
Note: WAGs for rate constants in some cases


KMC Modeling of Localized Corrosion of Pure Al in Aqueous Chloride SolutionKMC Modeling of Localized Corrosion of Pure Al in Aqueous Chloride Solution
Initial configuration
Evolution of pitEvolution of pit
LegendAlAl2O3
EmptyCl-
Al3+
H2O
LegendNa+
Al(OH)2+OH-

Effect of Copper Content and Configuration on Pitting Process of
Al and Al-Cu
• Three configurations:– randomly distribution– a 3x3 column of Cu– a cluster of 6-12 Cu atoms

Effect of Copper Content and Configuration
Al-Cu alloy layer Cu distribution

Effect of Cu on Nanopit Morphology
0 20 40 60 80 100 1200.0
0.5
1.0
1.5
2.0
2.5
3.0
3.5
4.0
4.5r/h
Time (s)
Pure Al
Al-2Cu
Al-4Cu
Dish-like
Tunnel
Hemisphere

Effect of Cu on Pit pH
0 20 40 60 80 100 1201.5
2.0
2.5
3.0
3.5
4.0
4.5
5.0
pH
Time(s)
Pure Al
Al-2Cu
Al-4Cu

C=O
Pt-O2.5 Å
C= +1 e
Pt-O2.9 Å
C=-1e
Pt-O2.2 Å
DFT Calculations of Effect of Applied Potentialon Structure of Interfacial Water
• reorientation of the water molecules at the interface• oxidative adsorption of water on Pt upon electron depletion
Increasing potential across interface

Applied Science Issues for Lap Joint
• How often must a joint be exposed to waterto remain wet?
• Does prior corrosion affect kinetics ofwetting and drying?
• How does corrosion rate change duringwetting and drying?
• Can CPC enter lap joints? How long mustthe pool be at mouth?

LP01, co
Long Period Grating LP0n, cl
LP0n, cl
Core
Cladding
Affinity Coating
Long Period Grating Chemical Sensor
Wavelength (nm)
Index = 1.4215Index = 1.4230Index = 1.4245Index = 1.4260
Tran
smis
sion
(dB
)
Shift in Spectral Loss Wavelength withRefractive Index Changes
Environment ofInterest
Long Period Grating SensingMethodology
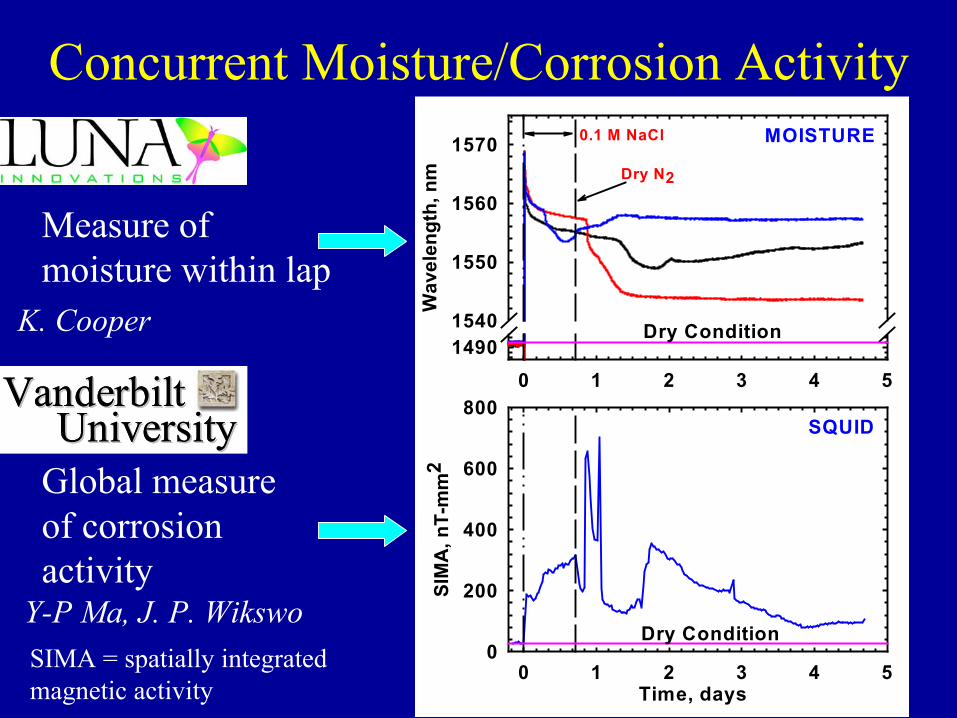
Concurrent Moisture/Corrosion Activity
0 1 2 3 4 5
Wav
elen
gth,
nm
14901540
1550
1560
1570
Time, days0 1 2 3 4 5
SIM
A, n
T-m
m2
0
200
400
600
800
0.1 M NaCl
Dry N2
Dry Condition
Dry Condition
SQUID
MOISTURE
Global measureof corrosionactivity
Measure ofmoisture within lap
SIMA = spatially integratedmagnetic activity
VanderbiltVanderbiltUniversityUniversity
VanderbiltVanderbiltUniversityUniversity
K. Cooper
Y-P Ma, J. P. Wikswo

#1 #2 #3 #4Sensorposition
Mouth
Rivet
hole
Rapid IngressCorresponds to Increasein Corrosion Rate
Time, hours-3 0 3 6 9 12 15
Wav
elen
gth,
nm
1485149014951540
1545
1550
1555
1560
1565
1570
1575LJ#1-1 (Ch#1)LJ#1-2 (Ch#2)LJ#1-4 (Ch#4)ImmerseDrainFibers - Dry
Immerse lap jointin 0.1 M NaCl
Dry Condition
Time, hours-3 0 3 6 9 12 15
SIM
A, n
T-m
m2
0
100
200
300
400
500
600
700
800LJ #1ImmerseDrainSQUID - Dry
Dry Condition

Time, hours12 24 36 48
Wav
elen
gth,
nm
1485149014951540
1545
1550
1555
1560LJ#1-1 (Ch#1)LJ#1-2 (Ch#2)LJ#1-4 (Ch#4)ImmerseDrainFibers - Dry
Time, hours12 24 36 48
SIM
A, n
T-m
m2
0
100
200
300
400
500
600
700
800LJ #1ImmerseDrainSQUID - Dry
0.1 M NaCl
Drain solution,introduce dry N2 gas
Dry Condition
Dry Condition
Slow MoistureEgress Correspondsto ContinuedElevated CorrosionRate
#1 #2 #3 #4Sensorposition
Mouth
Rivet
hole
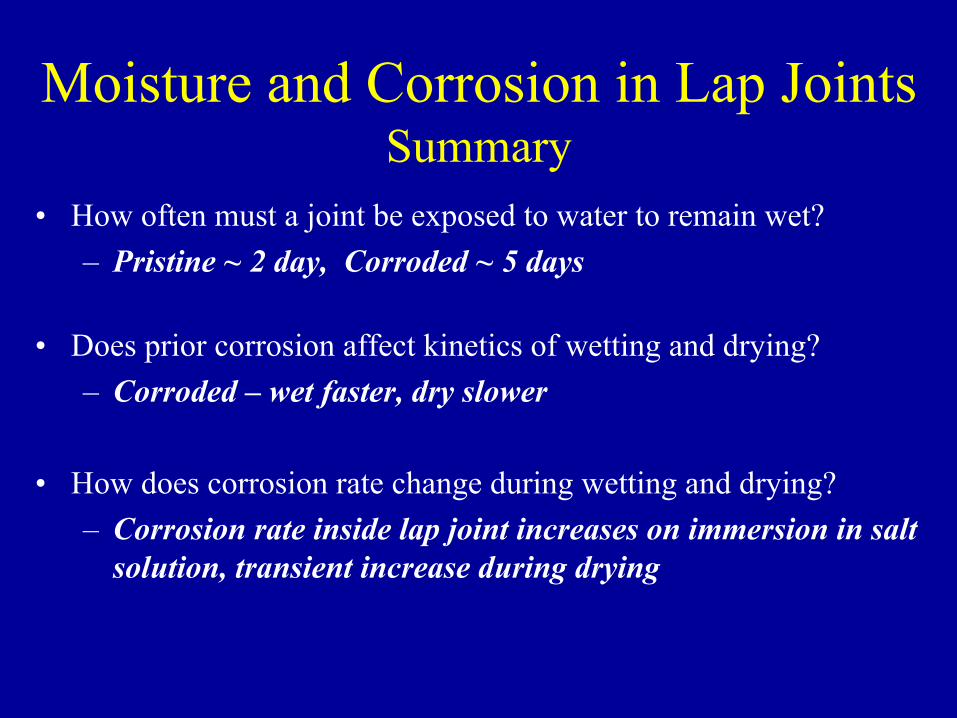
Moisture and Corrosion in Lap JointsSummary
• How often must a joint be exposed to water to remain wet?– Pristine ~ 2 day, Corroded ~ 5 days
• Does prior corrosion affect kinetics of wetting and drying?– Corroded – wet faster, dry slower
• How does corrosion rate change during wetting and drying?– Corrosion rate inside lap joint increases on immersion in salt
solution, transient increase during drying


Modeling to Provide DesignGuidance for Coatings
Alclad 3003-H14. Exposed to flowing seawater for 22 months

-1.2
-1
-0.8
-0.6
-0.4
-0.2
0
0.001 0.01 0.1 1 10Current Density (A/m2)
Pote
ntia
l (V)
vs
SCE
[Cl- ]
idl
-2-1.8-1.6-1.4-1.2
-1-0.8-0.6-0.4-0.2
0.001 0.01 0.1 1 10Current Density (A/m2)
Pote
ntia
l (V)
vs
SCE
ipass (Alclad)
HER
Sample GeometryJ=0 (symmetry)
2S
2 cm
J=0.01 cm
J = Electric Flux
Figure not to scale
Aluminum Clad
AA 2024 T3
Sample GeometryJ=0 (symmetry)
2S
2 cm
J=0.01 cm
2S
2 cm
J=0.01 cm
J = Electric Flux
Figure not to scale
Aluminum Clad
AA 2024 T3
FEM Analysis ofPotential and CurrentDistribution in ThinElectrolytes
Metallic Coatings:Francisco Presuel-Moreno
2024
Alclad

Effect of Scratch Size
-1.8
-1.5
-1.2
-0.9
-0.6
-0.3
0
0 0.002 0.004 0.006 0.008 0.01
Distance (m)
Pote
ntia
l (V)
vs
SCE
500150025005000
[Cl]=0.005 M
ScratchWidth
µm
Ep(Clad)

Sharp Transition in Loss ofProtection
0
20
40
60
80
100
0 1000 2000 3000 4000 5000Scratch Size (µm)
%A
rea
Prot
ecte
d
Dotted linesindicatetransition
ipass maxidl minfor [Cl-] = 0.005 M
Base
ipass minidl max
ipass maxidl minfor [Cl-] >= 0.05 M

More Protection in High [Cl-] Due toBetter Throwing Power
0
1000
2000
3000
4000
5000
0.01 0.1 1
Pro
tect
ed S
crat
ch S
ize
(µm
)
[Cl]=0.005 M[Cl]>=0.05 M
Alclad ipass (A/m2)
5 0.5 0.05 idl AA2024 (A/m2)


Conclusions
• Engineering policy needs are helpful infocusing applied and fundamental sciencestudies without bastardizing them
• Fundamentals are required to define criticalquestions and to assist in design of newmitigation strategies
• Corrosion’s complexities hold manysurprises for fundamental thinking

AcknowledgementsCo-conspirators
• John Scully• Matt Neurock• Rudy Buchheit• Ray Taylor• Hongwei Wang• Francisco Presuel-Moreno• Donghai Mei• Kevin Cooper• Karen Ferrer• Keith Furrow• APES, Inc.
Funding Agencies• NSF (B. Macdonald)• NASA (R. Piascik)• AFRL (S&KT, NCI)
– Deb Peeler– Dick Kinzie– Don Neiser
• AFOSR (P. Trulove)• DOE
– Center for Synthesis &Processing (K. Zavadil)
Top Related