


Languages
Pages
Legal

Junior Algebra 1 of 27 © Queen's Printer for Ontario, 2007
Patterning and Algebra Learning Activities – Grade 4
Picnic Partners .............................................................................................................. 2
Overview...................................................................................................................... 2 Curriculum Expectations.............................................................................................. 3 About the Learning Activity .......................................................................................... 4 About the Math ............................................................................................................ 4 Getting Started – Warm Up (Part 1 of the 3 part lesson) ............................................. 6 Working on It – (Part 2 of the 3 part lesson) ................................................................ 7 Working on It ............................................................................................................... 7 Reflecting and Connecting – (Part 3 of the 3 Part Lesson).......................................... 9 Tiered Instruction ....................................................................................................... 11 Extension................................................................................................................... 12 Home Connection ...................................................................................................... 13 Assessment ............................................................................................................... 13 PA.BLM4a.1 Space Station Challenge .................................................................. 14 PA.BLM 4a.2 Home Connection......................................................................... 16
What’s My Rule?.......................................................................................................... 17 Overview.................................................................................................................... 17 Curriculum Expectations............................................................................................ 17 About the Learning Activity ........................................................................................ 18 About the Math .......................................................................................................... 18 Getting Started .......................................................................................................... 18 Working on It: Part 1 .................................................................................................. 19 Working on It: Part 2 .................................................................................................. 22 Working on It: Part 3 .................................................................................................. 23 Reflecting and Connecting......................................................................................... 24 Tiered Instruction ....................................................................................................... 24 Extensions ................................................................................................................. 25 Home Connection ...................................................................................................... 25 Assessment ............................................................................................................... 26 PA.BLM 4b.1 Home Connection.......................................................................... 27
Picnic Partners
Strand: Patterning and Algebra, Grade 4
Big Ideas: Patterns and relationships
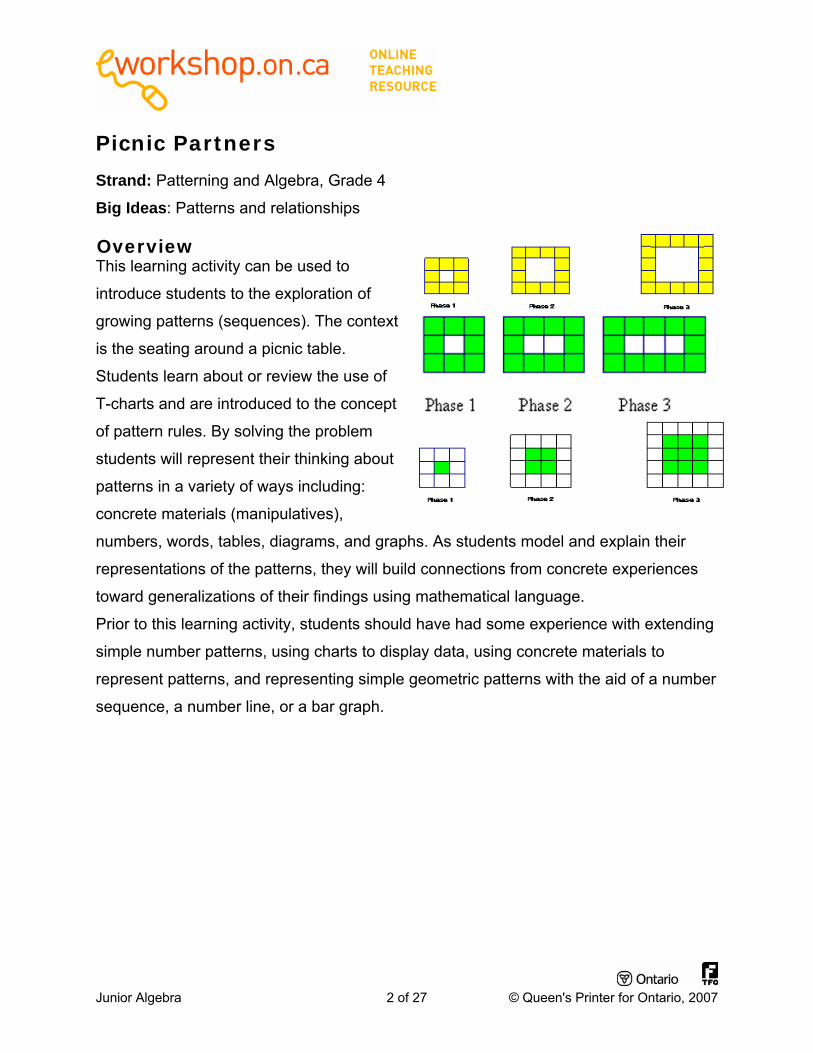
Overview This learning activity can be used to
introduce students to the exploration of
growing patterns (sequences). The context
is the seating around a picnic table.
Students learn about or review the use of
T-charts and are introduced to the concept
of pattern rules. By solving the problem
students will represent their thinking about
patterns in a variety of ways including:
concrete materials (manipulatives),
numbers, words, tables, diagrams, and graphs. As students model and explain their
representations of the patterns, they will build connections from concrete experiences
toward generalizations of their findings using mathematical language.
Prior to this learning activity, students should have had some experience with extending
simple number patterns, using charts to display data, using concrete materials to
represent patterns, and representing simple geometric patterns with the aid of a number
sequence, a number line, or a bar graph.
Junior Algebra 2 of 27 © Queen's Printer for Ontario, 2007
Junior Algebra 3 of 27 © Queen's Printer for Ontario, 2007
Curriculum Expectations
Overall Expectation • describe, extend, and create a variety of numeric and geometric patterns, make
predictions related to the patterns, and investigate repeating patterns involving
reflections.
Specific Expectations • extend, describe, and create repeating, growing, and shrinking number patterns
(e.g., “I created the pattern 1, 3, 4, 6, 7, 9, …. I started at 1, then added 2, then
added 1, then added 2, then added 1, and I kept repeating this.”);
• connect each term in a growing or shrinking pattern with its term number (e.g., in
the sequence 1, 4, 7, 10, …, the first term is 1, the second term is 4, the third
term is 7, and so on), and record the patterns in a table of values that shows the
term number and the term;
• create a number pattern involving addition, subtraction, or multiplication, given a
pattern rule expressed in words (e.g., the pattern rule “start at 1 and multiply
each term by 2 to get the next term” generates the sequence 1, 2, 4, 8, 16, 32,
64,…);
• make predictions related to repeating geometric and numeric patterns.
About the Learning Activity
Length: 120 minutes
Materials • PA.BLM4a.1: Space Station Challenge
• PA.BLM4a.2: Home Connection
• interlocking cubes or two-coloured tiles (about 80 per pair of students)
• graph paper
• grid chart paper, markers
• calculators
Math Language • growing pattern, sequence, border, perimeter area, T-chart
Instructional Grouping: whole group, pairs/small group
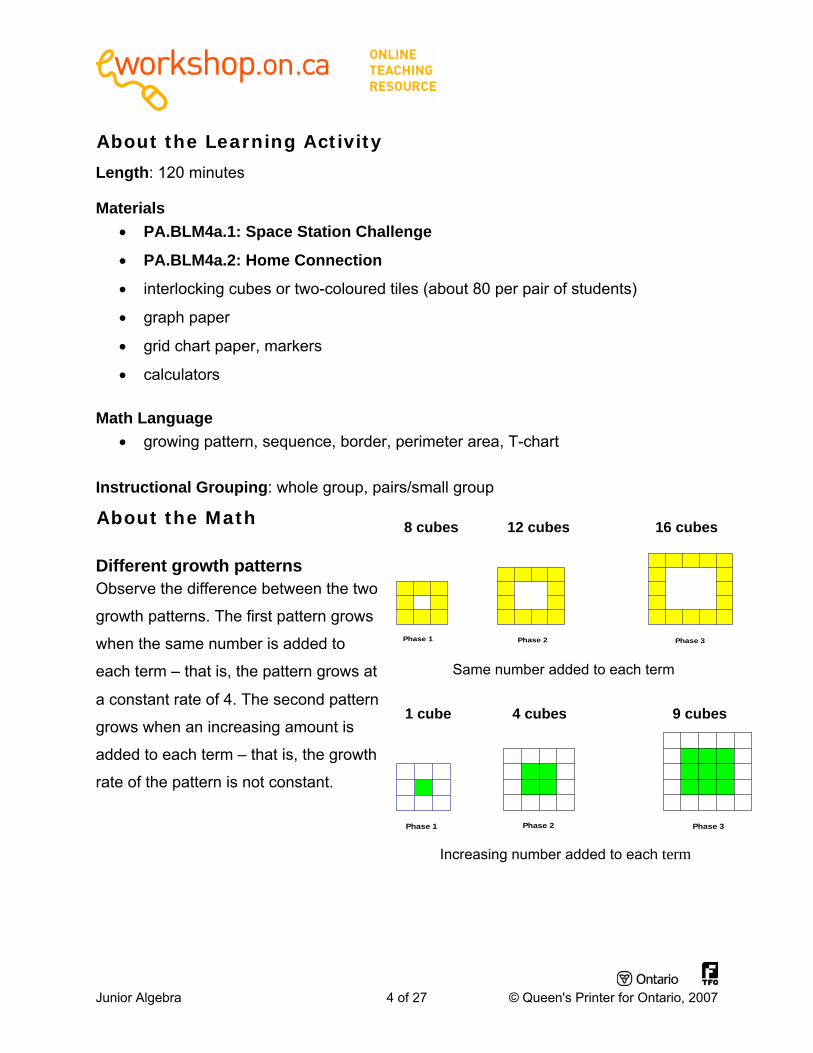
About the Math 8 cubes 12 cubes 16 cubes
Phase 3Phase 2Phase 1
Same number added to each term
Different growth patterns Observe the difference between the two
growth patterns. The first pattern grows
when the same number is added to
each term – that is, the pattern grows at
a constant rate of 4. The second pattern
grows when an increasing amount is
added to each term – that is, the growth
rate of the pattern is not constant.
1 cube 4 cubes 9 cubes
Increasing number added to each term
Phase 3Phase 2Phase 1
Junior Algebra 4 of 27 © Queen's Printer for Ontario, 2007
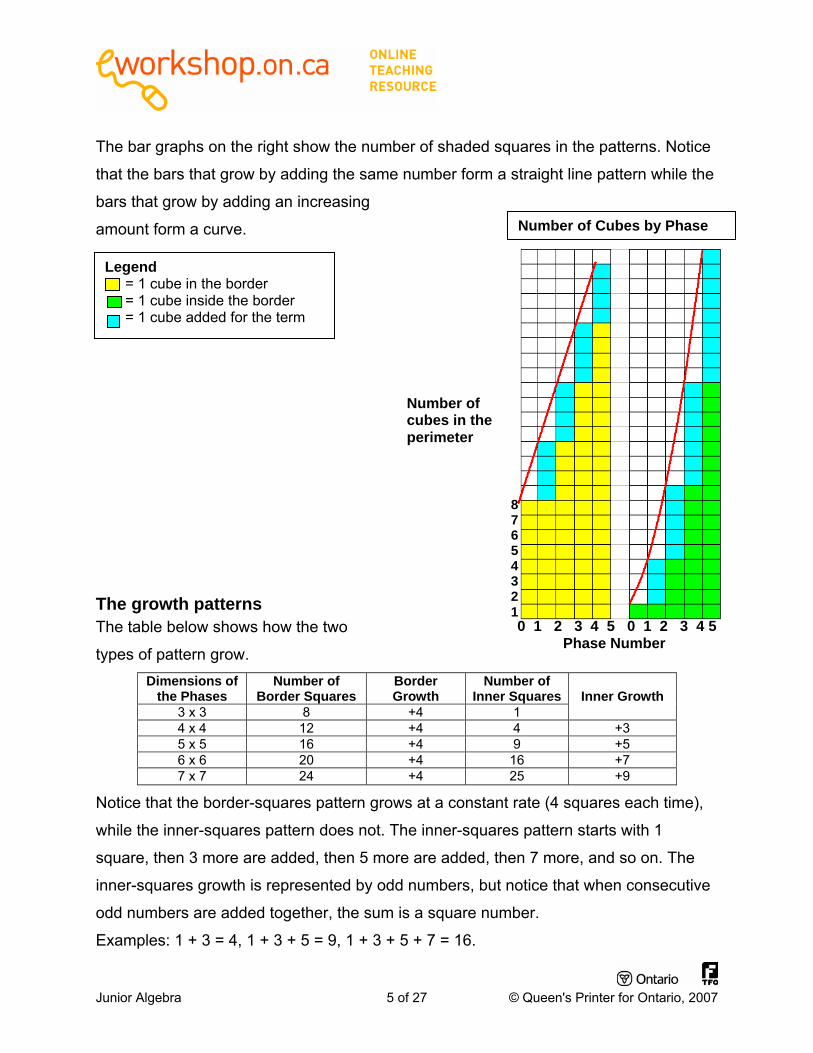
The bar graphs on the right show the number of shaded squares in the patterns. Notice
that the bars that grow by adding the same number form a straight line pattern while the
bars that grow by adding an increasing
amount form a curve. Number of Cubes by Phase
Number of cubes in the perimeter
0 1 2 3 4 5 0 1 2 3 4 5 Phase Number
87654321
Legend = 1 cube in the border = 1 cube inside the border = 1 cube added for the term
The growth patterns The table below shows how the two
types of pattern grow. Dimensions of
the Phases Number of
Border Squares Border Growth
Number of Inner Squares
3 x 3 8 +4 1
Inner Growth
4 x 4 12 +4 4 +3 5 x 5 16 +4 9 +5 6 x 6 20 +4 16 +7 7 x 7 24 +4 25 +9
Notice that the border-squares pattern grows at a constant rate (4 squares each time),
while the inner-squares pattern does not. The inner-squares pattern starts with 1
square, then 3 more are added, then 5 more are added, then 7 more, and so on. The
inner-squares growth is represented by odd numbers, but notice that when consecutive
odd numbers are added together, the sum is a square number.
Examples: 1 + 3 = 4, 1 + 3 + 5 = 9, 1 + 3 + 5 + 7 = 16.
Junior Algebra 5 of 27 © Queen's Printer for Ontario, 2007
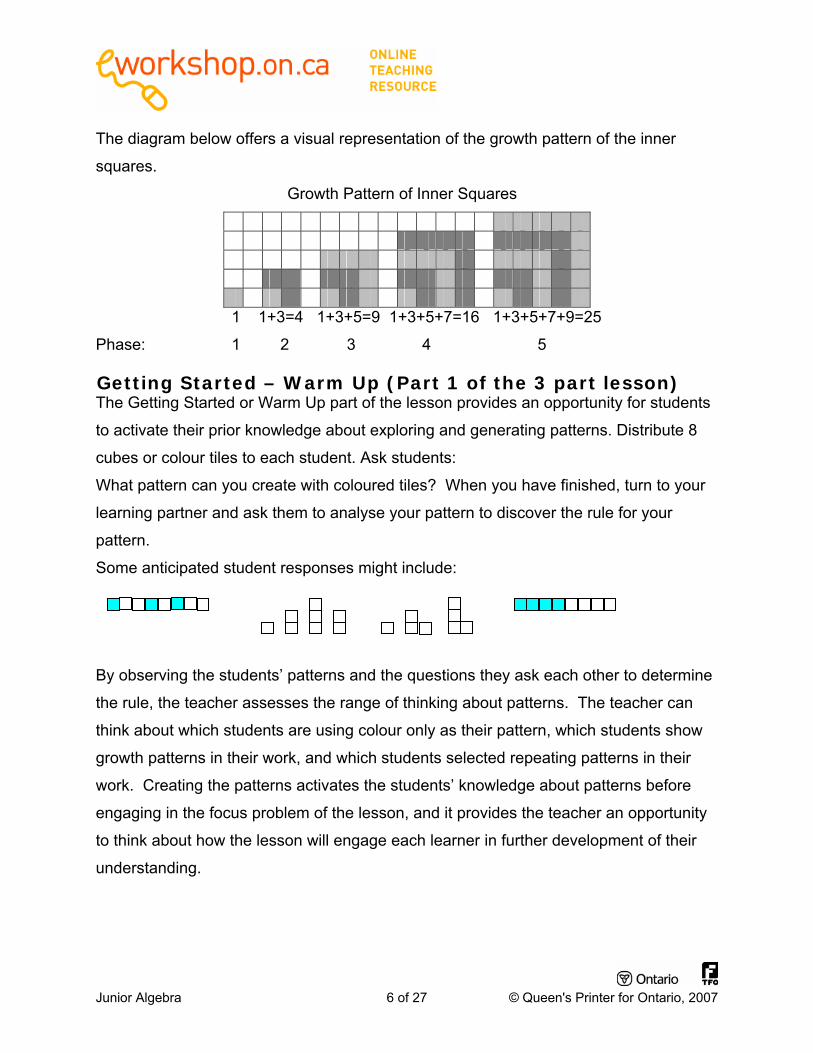
The diagram below offers a visual representation of the growth pattern of the inner
squares.
Growth Pattern of Inner Squares
1 1+3=4 1+3+5=9 1+3+5+7=16 1+3+5+7+9=25
Phase: 1 2 3 4 5
Getting Started – Warm Up (Part 1 of the 3 part lesson) The Getting Started or Warm Up part of the lesson provides an opportunity for students
to activate their prior knowledge about exploring and generating patterns. Distribute 8
cubes or colour tiles to each student. Ask students:
What pattern can you create with coloured tiles? When you have finished, turn to your
learning partner and ask them to analyse your pattern to discover the rule for your
pattern.
Some anticipated student responses might include:
By observing the students’ patterns and the questions they ask each other to determine
the rule, the teacher assesses the range of thinking about patterns. The teacher can
think about which students are using colour only as their pattern, which students show
growth patterns in their work, and which students selected repeating patterns in their
work. Creating the patterns activates the students’ knowledge about patterns before
engaging in the focus problem of the lesson, and it provides the teacher an opportunity
to think about how the lesson will engage each learner in further development of their
understanding.
Junior Algebra 6 of 27 © Queen's Printer for Ontario, 2007
Working on It – (Part 2 of the 3 part lesson) Distribute PA.BLM4a.1 (one copy to each student) and read the scenario together:
Organize students for whole group discussion (e.g., sitting in a circle at their desks or on
the floor). Pose this problem for the students:
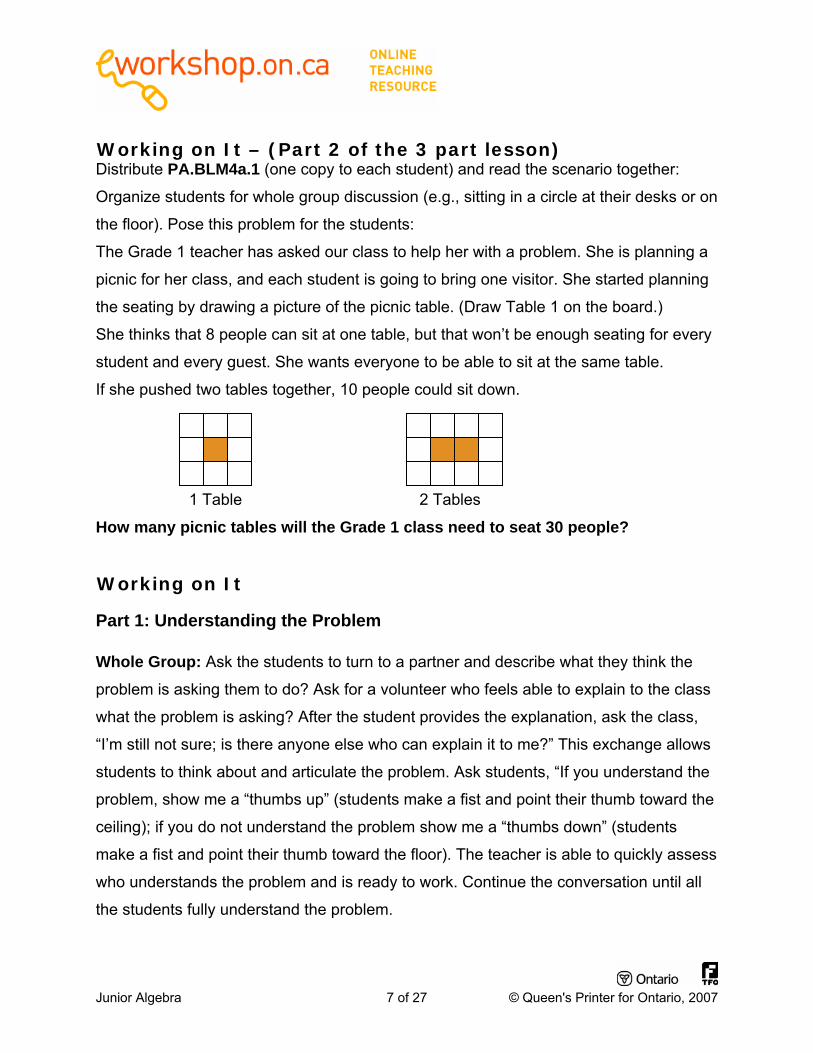
The Grade 1 teacher has asked our class to help her with a problem. She is planning a
picnic for her class, and each student is going to bring one visitor. She started planning
the seating by drawing a picture of the picnic table. (Draw Table 1 on the board.)
She thinks that 8 people can sit at one table, but that won’t be enough seating for every
student and every guest. She wants everyone to be able to sit at the same table.
If she pushed two tables together, 10 people could sit down.
1 Table 2 Tables
How many picnic tables will the Grade 1 class need to seat 30 people?
Working on It
Part 1: Understanding the Problem Whole Group: Ask the students to turn to a partner and describe what they think the
problem is asking them to do? Ask for a volunteer who feels able to explain to the class
what the problem is asking? After the student provides the explanation, ask the class,
“I’m still not sure; is there anyone else who can explain it to me?” This exchange allows
students to think about and articulate the problem. Ask students, “If you understand the
problem, show me a “thumbs up” (students make a fist and point their thumb toward the
ceiling); if you do not understand the problem show me a “thumbs down” (students
make a fist and point their thumb toward the floor). The teacher is able to quickly assess
who understands the problem and is ready to work. Continue the conversation until all
the students fully understand the problem.
Junior Algebra 7 of 27 © Queen's Printer for Ontario, 2007
Junior Algebra 8 of 27 © Queen's Printer for Ontario, 2007
Part 2: Make a Plan Small Group: Provide each small group (3 or 4 students) with grid chart paper,
markers, interlocking cubes, and colour tiles. Remind students that they may use any
tools (manipulatives, calculators, or found materials) they want in order to solve the
problem.
Allow students time to organize themselves and to discuss their thinking about how their
group will solve the problem.
Part 3: Carry Out the Plan – Solve the Problem Small Group: Students continue to work on solving the problem in their small groups.
As students work, the teacher observes the groups and asks them questions to help
them focus their thinking. It is critical that the teacher refrain from telling students how to
solve the problem or from providing hints, as this will interfere with the students’
construction of their own understanding. The teacher may ask questions such as:
Tell me what you are doing?
I don’t understand that; can you explain it to me again?
What are you noticing about the number of tables and the number of guests?
Why did you choose to use the table of values to work on the problem?
I’m still not sure if I understand how many picnic tables you think you will need. Can you
tell me again?
Part 4: Look Back and Reflect Small Group: Ask each group of students to hang their solution on the board or wall.
Provide students with sticky notes and direct them to take a gallery walk around the
room to view each solution. While they are viewing the solutions, ask them to put any
questions they have about the solutions on sticky notes and attach them to the group’s
solution.
Whole Group: Provide opportunities for the students to meet with their groups to
discuss the questions on the sticky notes. Ask each group to answer the sticky note
questions in front of the whole group.
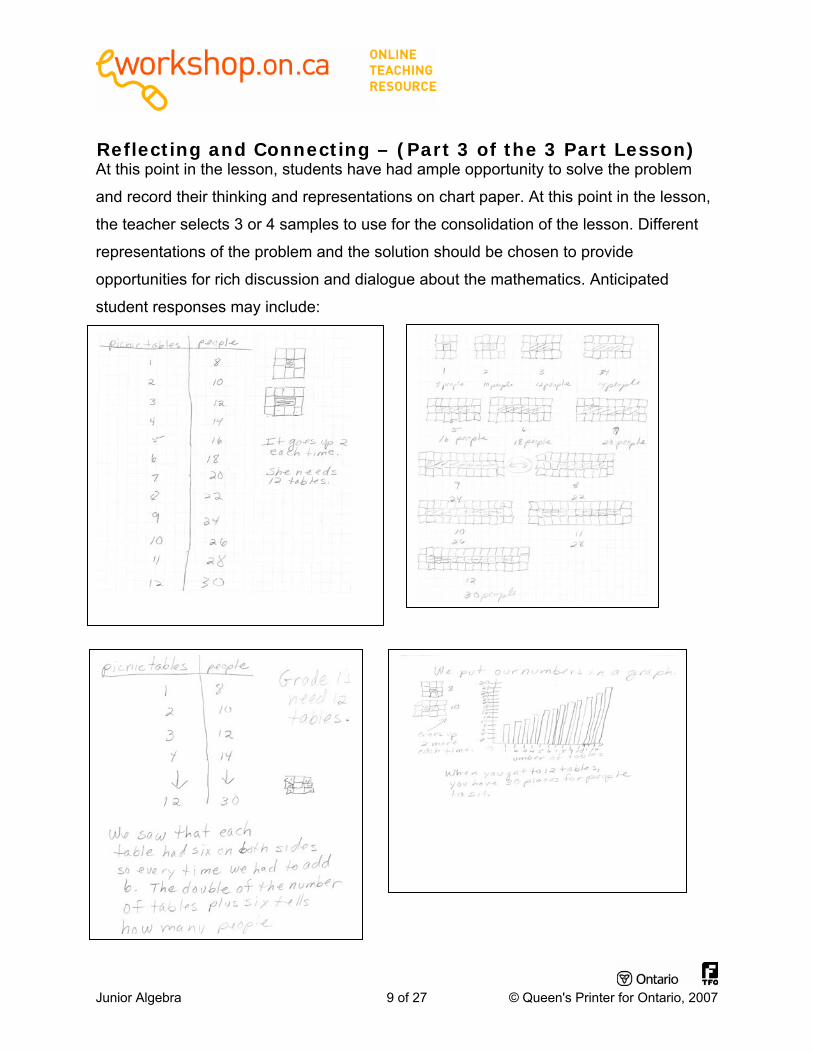
Reflecting and Connecting – (Part 3 of the 3 Part Lesson) At this point in the lesson, students have had ample opportunity to solve the problem
and record their thinking and representations on chart paper. At this point in the lesson,
the teacher selects 3 or 4 samples to use for the consolidation of the lesson. Different
representations of the problem and the solution should be chosen to provide
opportunities for rich discussion and dialogue about the mathematics. Anticipated
student responses may include:
Junior Algebra 9 of 27 © Queen's Printer for Ontario, 2007
Provide time for each group of students to describe their solution. Ask them how they
decided to represent their thinking. As students talk about their thinking, place strips of
paper over the samples to notate their work (e.g., Table of Values, Graphics, Graphs,
Number Sentence). Allow the students in the class to ask the group any clarifying
questions after they have explained their solution. Then ask a student from the class to
repeat in his or her own words what the group explained about their solution.
To demonstrate their understanding, students may have selected to:
• construct the table shapes with manipulatives;
• draw/shade a grid;
• complete a T–chart;
• explain a pattern rule;
• extend the pattern to 12 tables.
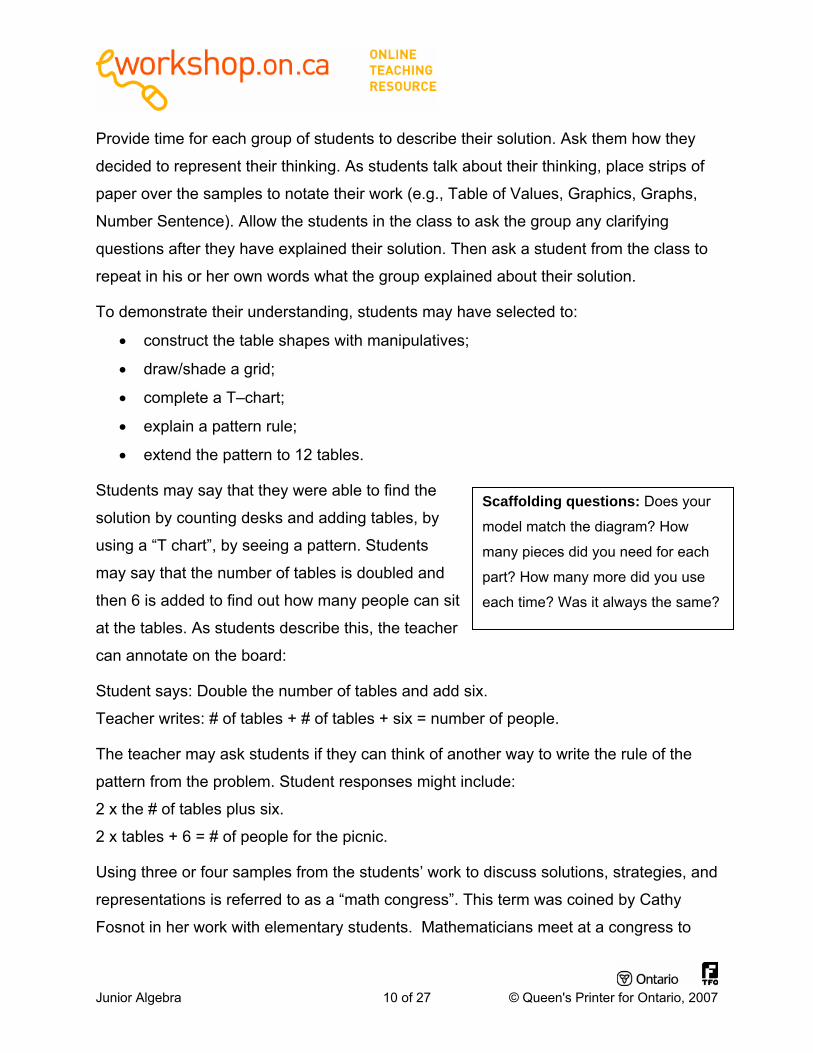
Students may say that they were able to find the
solution by counting desks and adding tables, by
using a “T chart”, by seeing a pattern. Students
may say that the number of tables is doubled and
then 6 is added to find out how many people can sit
at the tables. As students describe this, the teacher
can annotate on the board:
Scaffolding questions: Does your
model match the diagram? How
many pieces did you need for each
part? How many more did you use
each time? Was it always the same?
Student says: Double the number of tables and add six.
Teacher writes: # of tables + # of tables + six = number of people.
The teacher may ask students if they can think of another way to write the rule of the
pattern from the problem. Student responses might include:
2 x the # of tables plus six.
2 x tables + 6 = # of people for the picnic.
Using three or four samples from the students’ work to discuss solutions, strategies, and
representations is referred to as a “math congress”. This term was coined by Cathy
Fosnot in her work with elementary students. Mathematicians meet at a congress to
Junior Algebra 10 of 27 © Queen's Printer for Ontario, 2007
Junior Algebra 11 of 27 © Queen's Printer for Ontario, 2007
discuss their ideas, provide proofs, and dialogue about math. The “math congress”
provides students with an opportunity to learn through problem solving, and the
congress creates differentiated instruction for all students in the learning environment.
The congress helps students to construct the meaning of the mathematics as opposed
to rigidly following rules that they may not understand.
Tiered Instruction Supports and extensions can be beneficial for all students. For any given activity, there
will always be some students who require more or less support, or for whom extensions
will increase interest and deepen understanding.
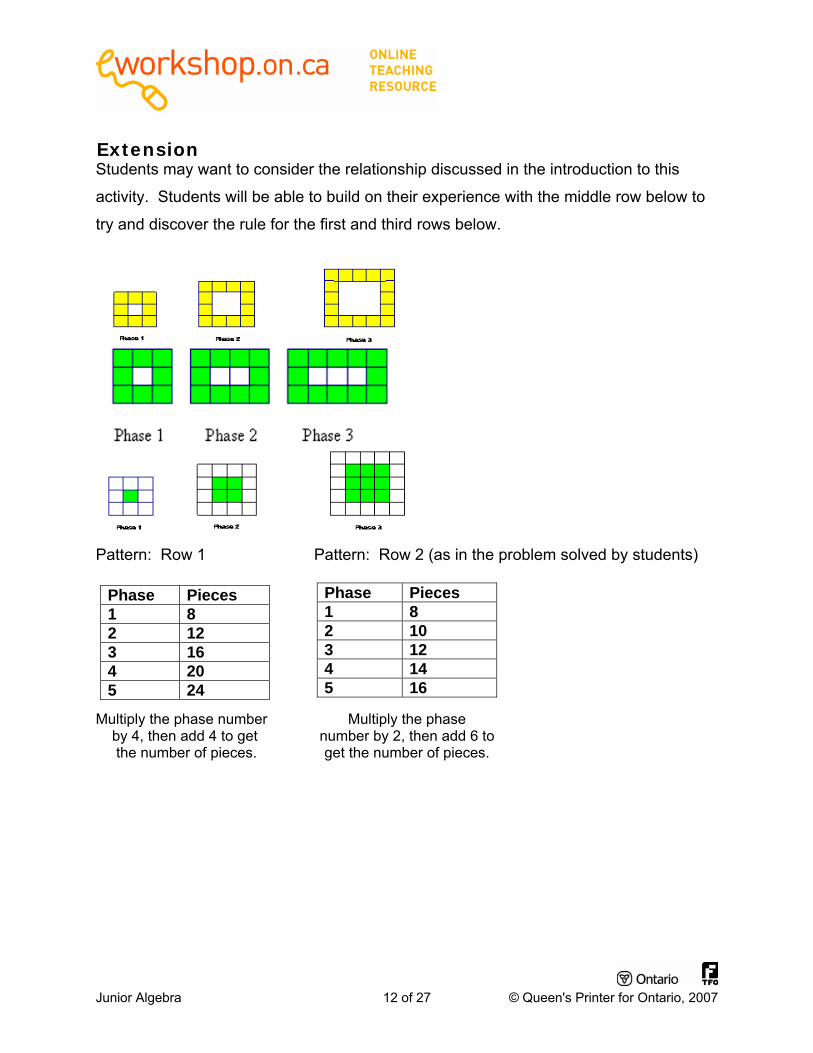
Extension Students may want to consider the relationship discussed in the introduction to this
activity. Students will be able to build on their experience with the middle row below to
try and discover the rule for the first and third rows below.
Pattern: Row 1 Pattern: Row 2 (as in the problem solved by students)
Phase Pieces 1 8 2 12 3 16 4 20 5 24
Phase Pieces 1 8 2 10 3 12 4 14 5 16
Multiply the phase number Multiply the phase by 4, then add 4 to get number by 2, then add 6 to the number of pieces. get the number of pieces.
Junior Algebra 12 of 27 © Queen's Printer for Ontario, 2007
Junior Algebra 13 of 27 © Queen's Printer for Ontario, 2007
Home Connection Extend the activity further by providing students with a different but similar pattern to
work on at home. Distribute PA.BLM4a.2 to students. This activity follows a format
similar to the activity completed in class. Ask students to share with their parents what
they have learned, and demonstrate their understanding of the concept, using numbers,
pictures and words.
Assessment Use the students’ discussions and representations to identify areas of focus for the next
lesson. Assessment for learning uses observation and data collected by the teacher
during the lesson to plan the next instructional focus. Assessment opportunities
include:
• an interview or informal discussion during the activity;
• observation of progress as students move from one part of the lesson to the next;
• student responses to questions posed by fellow students at the math congress
• written representations of the math on the solution charts.
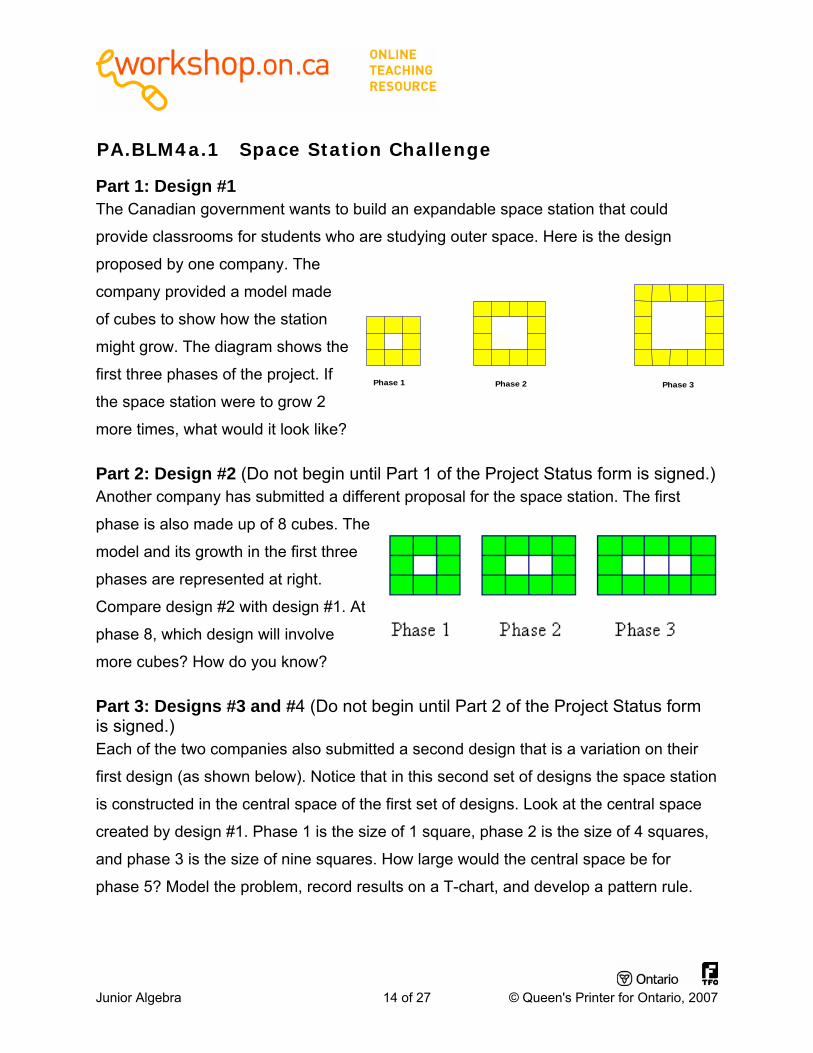
PA.BLM4a.1 Space Station Challenge
Part 1: Design #1 The Canadian government wants to build an expandable space station that could
provide classrooms for students who are studying outer space. Here is the design
proposed by one company. The
company provided a model made
of cubes to show how the station
might grow. The diagram shows the
first three phases of the project. If
the space station were to grow 2
more times, what would it look like?
Phase 3Phase 2Phase 1
Part 2: Design #2 (Do not begin until Part 1 of the Project Status form is signed.) Another company has submitted a different proposal for the space station. The first
phase is also made up of 8 cubes. The
model and its growth in the first three
phases are represented at right.
Compare design #2 with design #1. At
phase 8, which design will involve
more cubes? How do you know?
Part 3: Designs #3 and #4 (Do not begin until Part 2 of the Project Status form is signed.) Each of the two companies also submitted a second design that is a variation on their
first design (as shown below). Notice that in this second set of designs the space station
is constructed in the central space of the first set of designs. Look at the central space
created by design #1. Phase 1 is the size of 1 square, phase 2 is the size of 4 squares,
and phase 3 is the size of nine squares. How large would the central space be for
phase 5? Model the problem, record results on a T-chart, and develop a pattern rule.
Junior Algebra 14 of 27 © Queen's Printer for Ontario, 2007
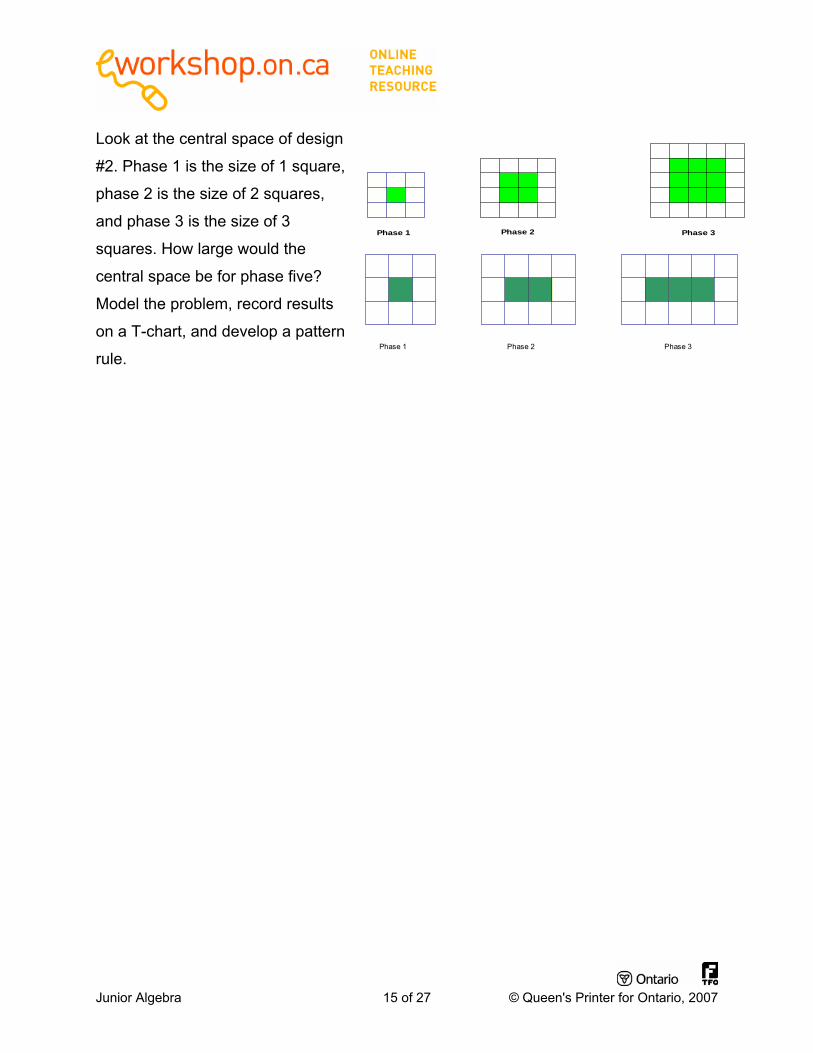
Look at the central space of design
#2. Phase 1 is the size of 1 square,
phase 2 is the size of 2 squares,
and phase 3 is the size of 3
squares. How large would the
central space be for phase five?
Model the problem, record results
on a T-chart, and develop a pattern
rule.
Phase 3Phase 2Phase 1
Phase 1 Phase 2 Phase 3
Junior Algebra 15 of 27 © Queen's Printer for Ontario, 2007
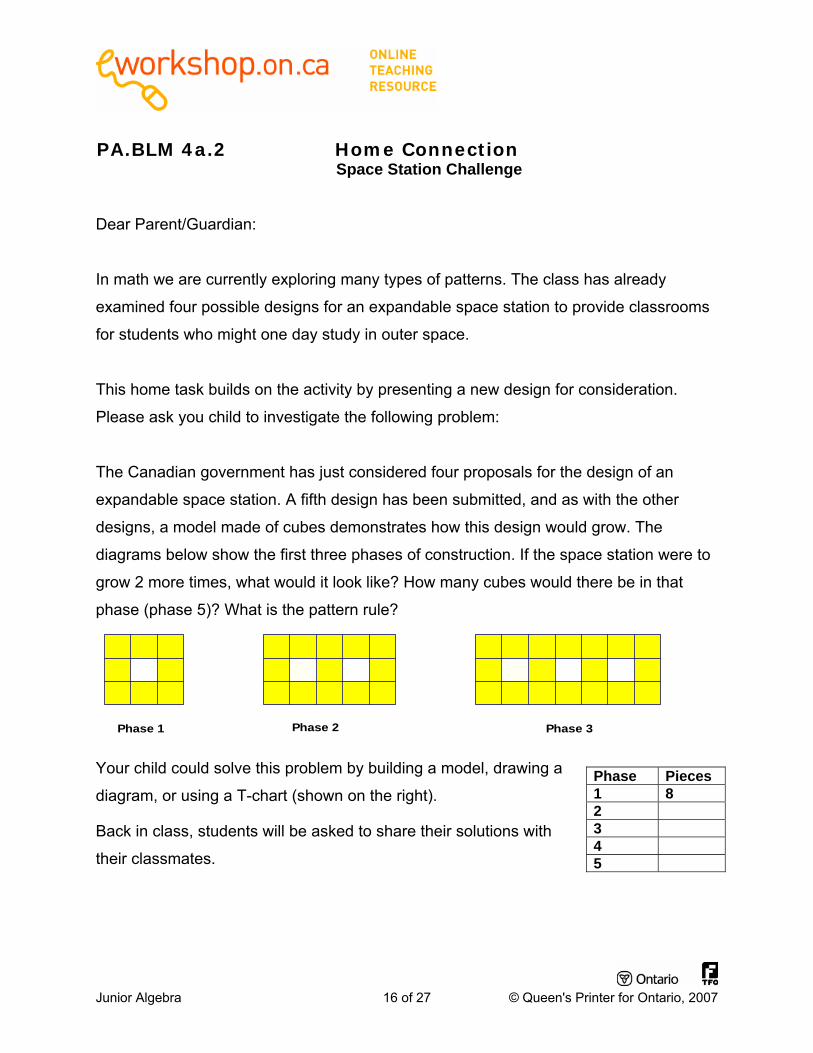
PA.BLM 4a.2 Home Connection Space Station Challenge
Dear Parent/Guardian:
In math we are currently exploring many types of patterns. The class has already
examined four possible designs for an expandable space station to provide classrooms
for students who might one day study in outer space.
This home task builds on the activity by presenting a new design for consideration.
Please ask you child to investigate the following problem:
The Canadian government has just considered four proposals for the design of an
expandable space station. A fifth design has been submitted, and as with the other
designs, a model made of cubes demonstrates how this design would grow. The
diagrams below show the first three phases of construction. If the space station were to
grow 2 more times, what would it look like? How many cubes would there be in that
phase (phase 5)? What is the pattern rule?
Phase 3Phase 2Phase 1
Your child could solve this problem by building a model, drawing a
diagram, or using a T-chart (shown on the right). Phase Pieces 1 8 2 3 4 5
Back in class, students will be asked to share their solutions with
their classmates.
Junior Algebra 16 of 27 © Queen's Printer for Ontario, 2007
What’s My Rule?
Strand: Patterning and Algebra, Grade 4
Big Ideas: Expressions, variables, and equations
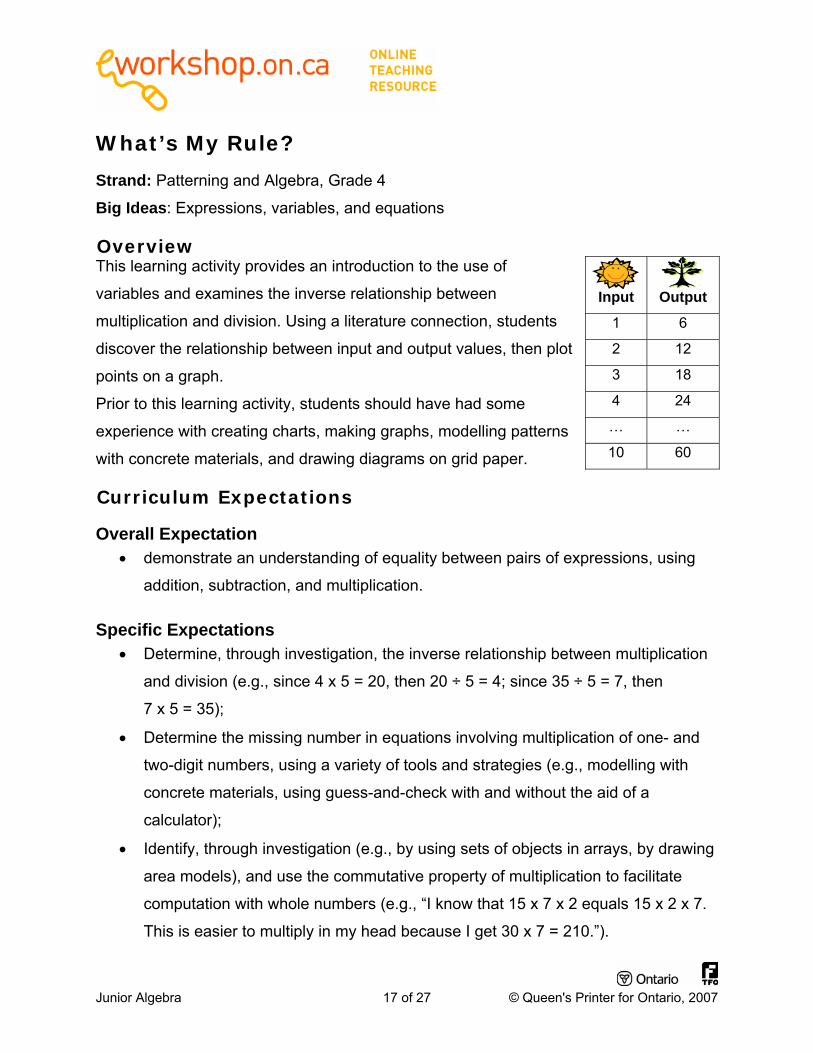
Overview This learning activity provides an introduction to the use of
variables and examines the inverse relationship between
multiplication and division. Using a literature connection, students
discover the relationship between input and output values, then plot
points on a graph.
Junior Algebra 17 of 27 © Queen's Printer for Ontario, 2007
Prior to this learning activity, students should have had some
experience with creating charts, making graphs, modelling patterns
with concrete materials, and drawing diagrams on grid paper.
Curriculum Expectations
Overall Expectation • demonstrate an understanding of equality between pairs of expressions, using
addition, subtraction, and multiplication.
Specific Expectations • Determine, through investigation, the inverse relationship between multiplication
and division (e.g., since 4 x 5 = 20, then 20 ÷ 5 = 4; since 35 ÷ 5 = 7, then
7 x 5 = 35);
• Determine the missing number in equations involving multiplication of one- and
two-digit numbers, using a variety of tools and strategies (e.g., modelling with
concrete materials, using guess-and-check with and without the aid of a
calculator);
• Identify, through investigation (e.g., by using sets of objects in arrays, by drawing
area models), and use the commutative property of multiplication to facilitate
computation with whole numbers (e.g., “I know that 15 x 7 x 2 equals 15 x 2 x 7.
This is easier to multiply in my head because I get 30 x 7 = 210.”).
Input Output
1 6
2 12
3 18
4 24
… …
10 60
About the Learning Activity Time: 120 minutes
Materials • PA.BLM4b.1: Home Connection
• interlocking cubes or coloured tiles
• graph paper
• chart paper
Math Language • array, T-chart, equality, decompose, symbol (variable), input, output
Instructional Grouping: whole class, pairs
About the Math Variable. In algebra terminology, a variable is a letter or symbol that is used to
represent an unknown value (as in 5x = 15) or a varying quantity (such as the input and
output values in P = 4s, where output is P and input is s). The symbols x and y are often
used to represent variables. However, any letter (a or b or c…), any symbol
( or ) or any concrete material (such as a colour tile) may be used to
represent a variable.
Getting Started Start by reading Six Dinner Sid, a story about a clever cat who loves to eat dinner. If the
book or video is not available, use the following text to explain the premise of the story:
“The story Six Dinner Sid is about a very clever and manipulative cat named Sid. He
has convinced six people living on the same street that he belongs to them and to them
alone. As a result, he is able to enjoy six dinners a day. Unfortunately, this also means
that when he gets sick, he has to visit the vet six times and take six doses of medicine,
which leads to a humorous predicament.”
Discuss what else Sid might have access to in all six homes (e.g., how many people will
he have to pet him? how many chairs will he have to sit on?).
Junior Algebra 18 of 27 © Queen's Printer for Ontario, 2007
Working on It: Part 1
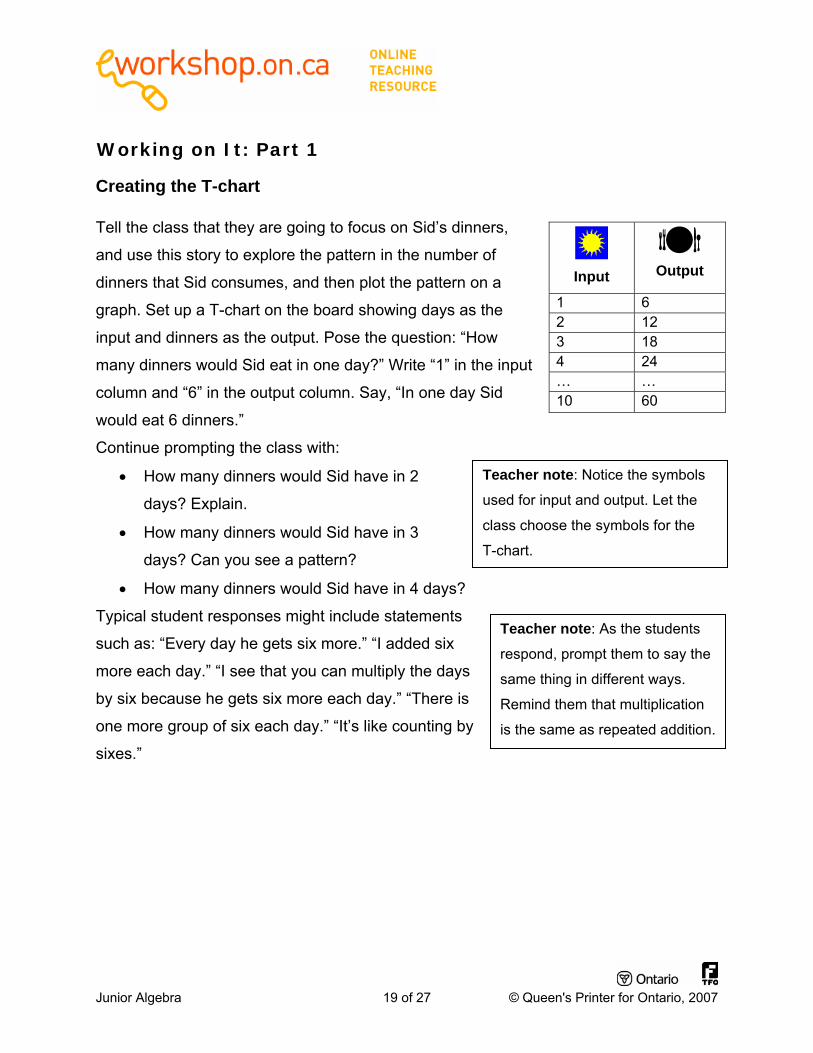
Creating the T-chart Tell the class that they are going to focus on Sid’s dinners,
and use this story to explore the pattern in the number of
dinners that Sid consumes, and then plot the pattern on a
graph. Set up a T-chart on the board showing days as the
input and dinners as the output. Pose the question: “How
many dinners would Sid eat in one day?” Write “1” in the input
column and “6” in the output column. Say, “In one day Sid
would eat 6 dinners.”
Input Output
1 6 2 12 3 18 4 24 … … 10 60
Junior Algebra 19 of 27 © Queen's Printer for Ontario, 2007
Continue prompting the class with:
• How many dinners would Sid have in 2
days? Explain.
• How many dinners would Sid have in 3
days? Can you see a pattern?
• How many dinners would Sid have in 4 days?
Typical student responses might include statements
such as: “Every day he gets six more.” “I added six
more each day.” “I see that you can multiply the days
by six because he gets six more each day.” “There is
one more group of six each day.” “It’s like counting by
sixes.”
Teacher note: Notice the symbols
used for input and output. Let the
class choose the symbols for the
T-chart.
Teacher note: As the students
respond, prompt them to say the
same thing in different ways.
Remind them that multiplication
is the same as repeated addition.
Prompt the students to predict the output for 5
days, and then for a full week. You might then
ask, “If Sid had 60 dinners, how many days
would that have taken? How do you know?”
Responses might include: “I put 60 cubes into
six piles and there were 10 in each pile.” “I put
one cube down for dinner at each house and
when I used all 60 cubes I had ten under each house.” “I continued the pattern of
adding six. I knew he ate 42 dinners in a week, so I added 3 groups of six to get 60.
That meant 10 days.” “I divided 60 into 6 groups, and 60 meals divided by 6 per day
gives 10 days.”
Teacher note: Encourage students
to see that multiplying by 6 and
dividing by 6 are related. If they know
the input value they can multiply by 6
to determine the outcome, and if they
know the output value they can divide
by 6 to determine the input.
Developing a rule Ask for suggestions on how to reword the rule to use terms such as input value and
output value.
The chart should help students to see that the rule
could be expressed in different ways:
Junior Algebra 20 of 27 © Queen's Printer for Ontario, 2007
• the input value x 6 = output value
• the input value + input value + input value +
input value + input value + input value = output value
Teacher Note: Have
manipulatives available so that
students can model the problem.
• the output value ÷ 6 = input value
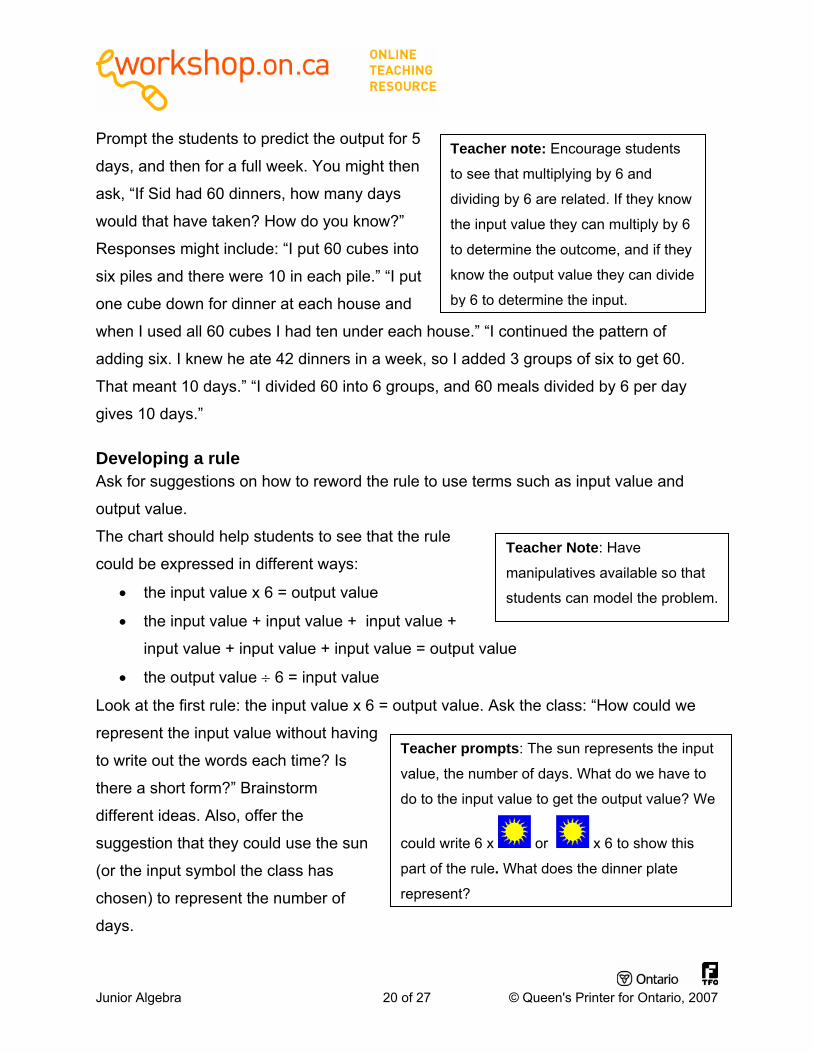
Look at the first rule: the input value x 6 = output value. Ask the class: “How could we
represent the input value without having
to write out the words each time? Is
there a short form?” Brainstorm
different ideas. Also, offer the
suggestion that they could use the sun
(or the input symbol the class has
chosen) to represent the number of
days.
Teacher prompts: The sun represents the input
value, the number of days. What do we have to
do to the input value to get the output value? We
could write 6 x or x 6 to show this
part of the rule. What does the dinner plate
represent?
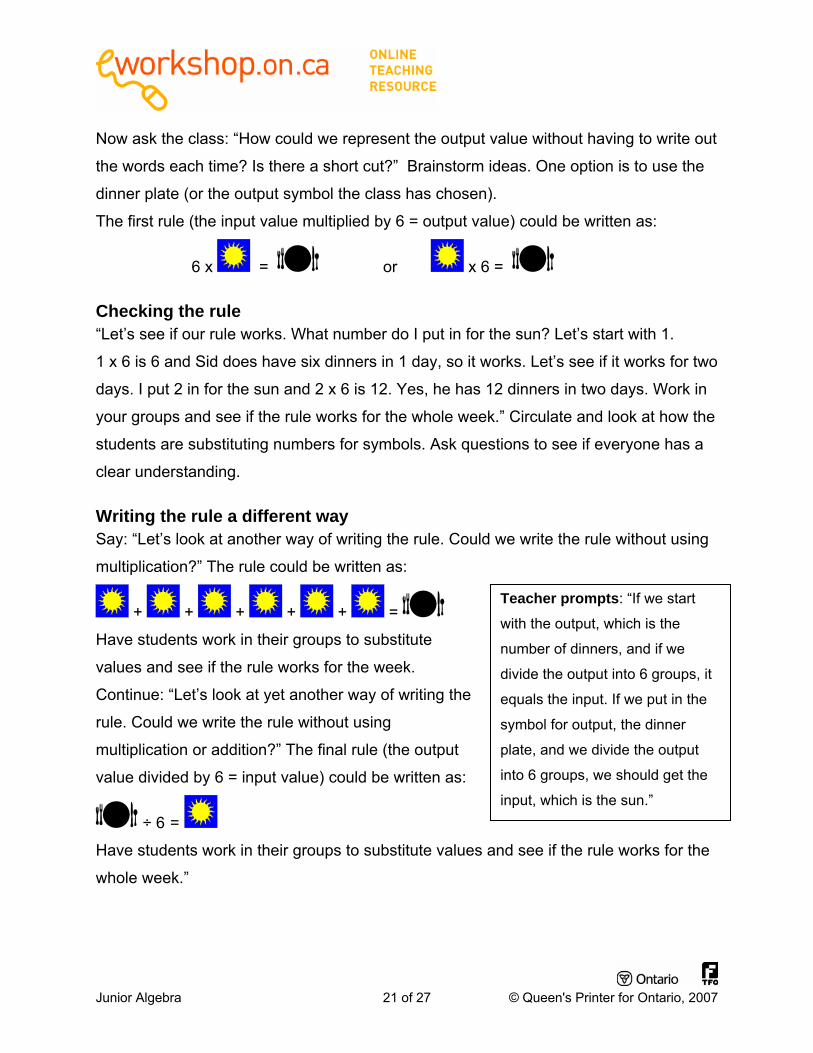
Now ask the class: “How could we represent the output value without having to write out
the words each time? Is there a short cut?” Brainstorm ideas. One option is to use the
dinner plate (or the output symbol the class has chosen).
The first rule (the input value multiplied by 6 = output value) could be written as:
6 x = or x 6 =
Checking the rule “Let’s see if our rule works. What number do I put in for the sun? Let’s start with 1.
1 x 6 is 6 and Sid does have six dinners in 1 day, so it works. Let’s see if it works for two
days. I put 2 in for the sun and 2 x 6 is 12. Yes, he has 12 dinners in two days. Work in
your groups and see if the rule works for the whole week.” Circulate and look at how the
students are substituting numbers for symbols. Ask questions to see if everyone has a
clear understanding.
Writing the rule a different way Say: “Let’s look at another way of writing the rule. Could we write the rule without using
multiplication?” The rule could be written as:
Teacher prompts: “If we start
with the output, which is the
number of dinners, and if we
divide the output into 6 groups, it
equals the input. If we put in the
symbol for output, the dinner
plate, and we divide the output
into 6 groups, we should get the
input, which is the sun.”
+ + + + + =
Have students work in their groups to substitute
values and see if the rule works for the week.
Continue: “Let’s look at yet another way of writing the
rule. Could we write the rule without using
multiplication or addition?” The final rule (the output
value divided by 6 = input value) could be written as:
÷ 6 = Have students work in their groups to substitute values and see if the rule works for the
whole week.”
Junior Algebra 21 of 27 © Queen's Printer for Ontario, 2007
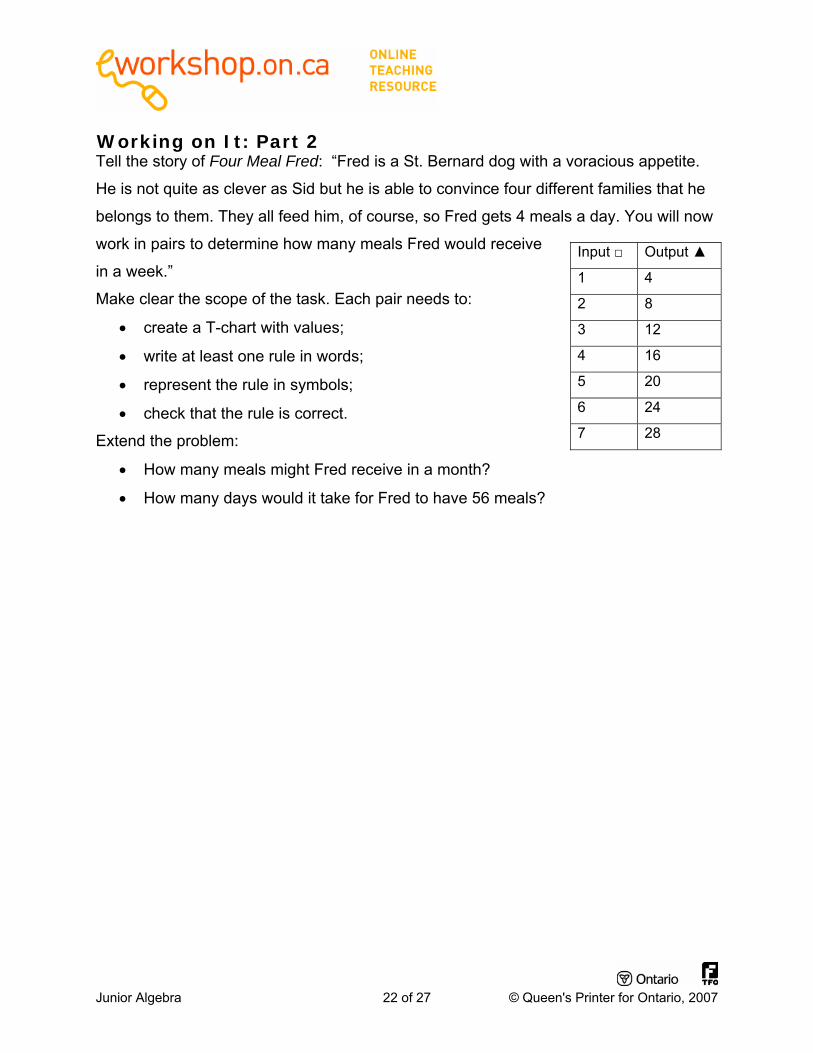
Working on It: Part 2 Tell the story of Four Meal Fred: “Fred is a St. Bernard dog with a voracious appetite.
He is not quite as clever as Sid but he is able to convince four different families that he
belongs to them. They all feed him, of course, so Fred gets 4 meals a day. You will now
work in pairs to determine how many meals Fred would receive
in a week.” Input □ Output ▲
1 4
2 8
3 12
4 16
5 20
6 24
7 28
Make clear the scope of the task. Each pair needs to:
• create a T-chart with values;
• write at least one rule in words;
• represent the rule in symbols;
• check that the rule is correct.
Extend the problem:
• How many meals might Fred receive in a month?
• How many days would it take for Fred to have 56 meals?
Junior Algebra 22 of 27 © Queen's Printer for Ontario, 2007
Working on It: Part 3
5
10
15
20
25
30
35
40
45
Dinners
1 2 3 4 5 6 7 8Days
Sid's Dinners
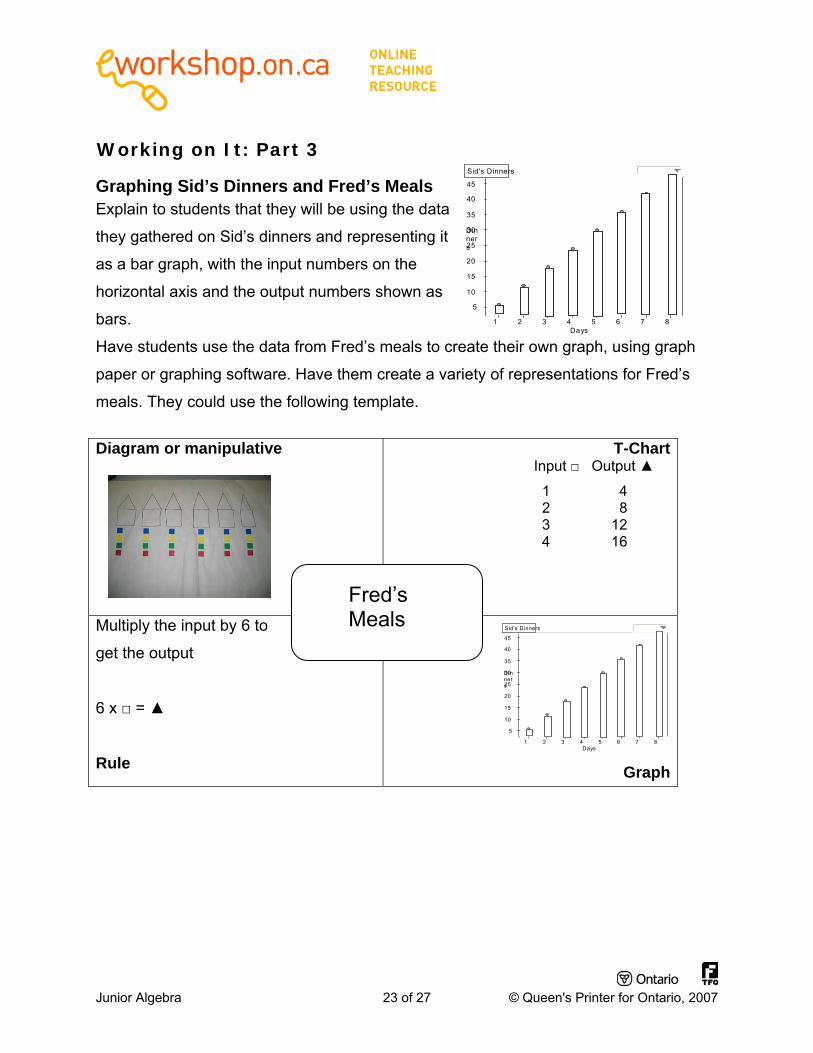
Graphing Sid’s Dinners and Fred’s Meals Explain to students that they will be using the data
they gathered on Sid’s dinners and representing it
as a bar graph, with the input numbers on the
horizontal axis and the output numbers shown as
bars.
Have students use the data from Fred’s meals to create their own graph, using graph
paper or graphing software. Have them create a variety of representations for Fred’s
meals. They could use the following template.
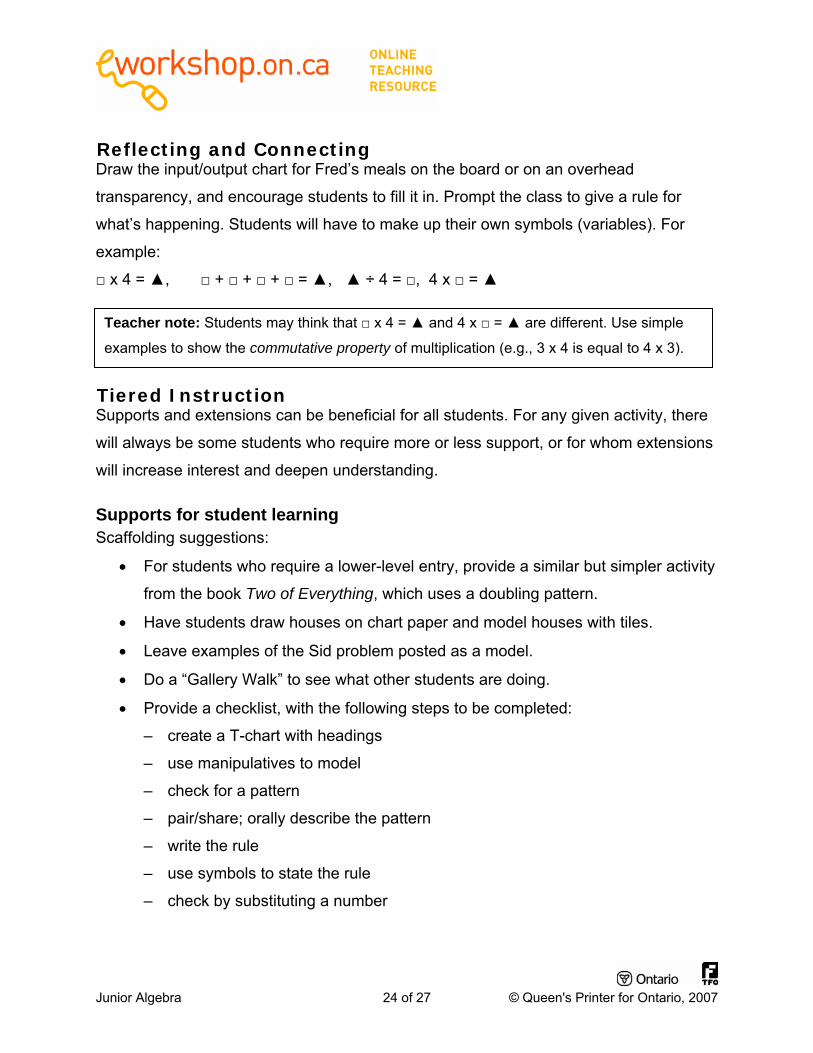
Diagram or manipulative
T-Chart
Junior Algebra 23 of 27 © Queen's Printer for Ontario, 2007
Input □ Output ▲
1 4 2 8 3 12 4 16
Multiply the input by 6 to
get the output
6 x □ = ▲
Rule
Graph
Fred’s Meals
5
10
15
20
25
30
35
40
45
Dinners
1 2 3 4 5 6 7 8Days
Sid's Dinners
Reflecting and Connecting Draw the input/output chart for Fred’s meals on the board or on an overhead
transparency, and encourage students to fill it in. Prompt the class to give a rule for
what’s happening. Students will have to make up their own symbols (variables). For
example:
□ x 4 = ▲, □ + □ + □ + □ = ▲, ▲ ÷ 4 = □, 4 x □ = ▲
Teacher note: Students may think that □ x 4 = ▲ and 4 x □ = ▲ are different. Use simple
examples to show the commutative property of multiplication (e.g., 3 x 4 is equal to 4 x 3).
Tiered Instruction Supports and extensions can be beneficial for all students. For any given activity, there
will always be some students who require more or less support, or for whom extensions
will increase interest and deepen understanding.
Supports for student learning Scaffolding suggestions:
• For students who require a lower-level entry, provide a similar but simpler activity
from the book Two of Everything, which uses a doubling pattern.
• Have students draw houses on chart paper and model houses with tiles.
• Leave examples of the Sid problem posted as a model.
• Do a “Gallery Walk” to see what other students are doing.
• Provide a checklist, with the following steps to be completed:
– create a T-chart with headings
– use manipulatives to model
– check for a pattern
– pair/share; orally describe the pattern
– write the rule
– use symbols to state the rule
– check by substituting a number
Junior Algebra 24 of 27 © Queen's Printer for Ontario, 2007
Junior Algebra 25 of 27 © Queen's Printer for Ontario, 2007
Extensions • Have students write a different problem based on Sid’s experiences.
• Have students read Anno’s Mysterious Multiplying Jar to find the rule for the jar.
• Have students read Multiplying Menace and look for the secret of the stick.
Other literature connections:
• Two of Everything, by Albert Whitman. ISBN 0807581577
• 100 Angry Ants, by Elinor J. Pinczes. ISBN 0395971233
• Spaghetti and Meatballs for All, by Marilyn Burns, 1997. ISBN 0-590-94459-2
• The Number Devil (the third night), by Hans Magnus Enzensberger, 1997.
ISBN 0-8050-6299-8
Home Connection See PA.BLM4b.1.
Junior Algebra 26 of 27 © Queen's Printer for Ontario, 2007
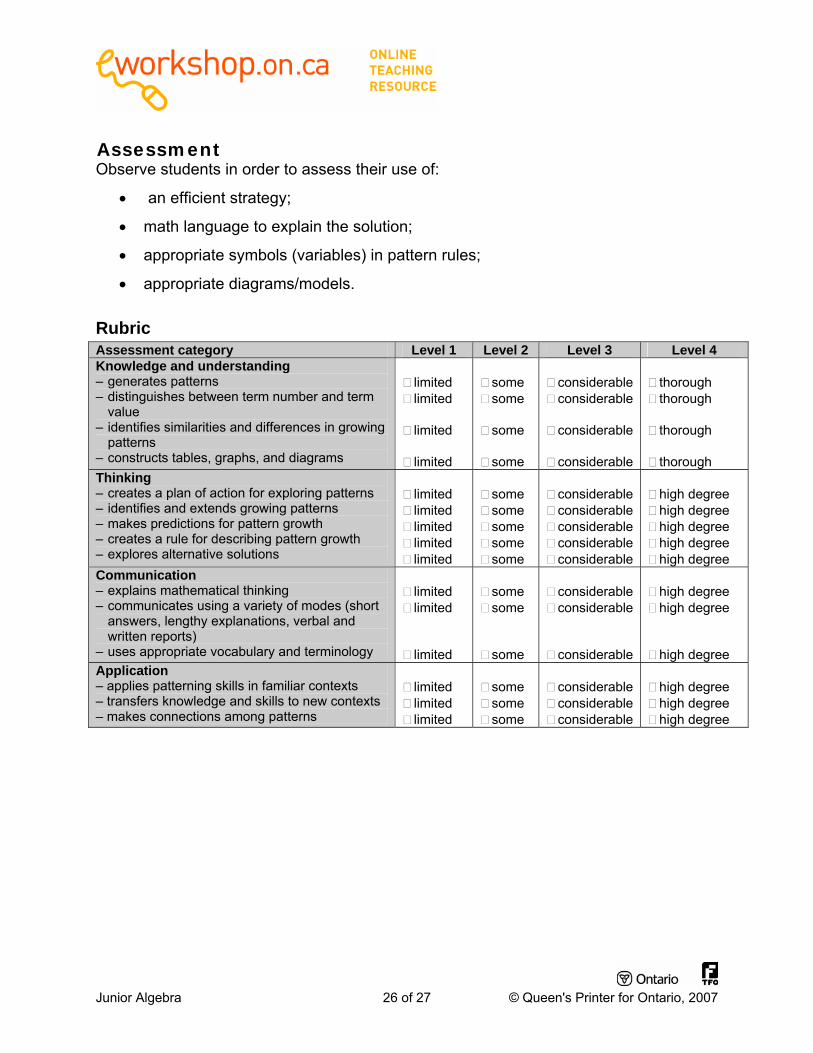
Assessment Observe students in order to assess their use of:
• an efficient strategy;
• math language to explain the solution;
• appropriate symbols (variables) in pattern rules;
• appropriate diagrams/models.
Rubric Assessment category Level 1 Level 2 Level 3 Level 4 Knowledge and understanding – generates patterns – distinguishes between term number and term
value – identifies similarities and differences in growing
patterns – constructs tables, graphs, and diagrams
limited limited
limited
limited
some some
some
some
considerable considerable
considerable
considerable
thorough thorough
thorough
thorough
Thinking – creates a plan of action for exploring patterns – identifies and extends growing patterns – makes predictions for pattern growth – creates a rule for describing pattern growth – explores alternative solutions
limited limited limited limited limited
some some some some some
considerable considerable considerable considerable considerable
high degree high degree high degree high degree high degree
Communication – explains mathematical thinking – communicates using a variety of modes (short
answers, lengthy explanations, verbal and written reports)
– uses appropriate vocabulary and terminology
limited limited
limited
some some
some
considerable considerable
considerable
high degree high degree
high degree Application – applies patterning skills in familiar contexts – transfers knowledge and skills to new contexts – makes connections among patterns
limited limited limited
some some some
considerable considerable considerable
high degree high degree high degree
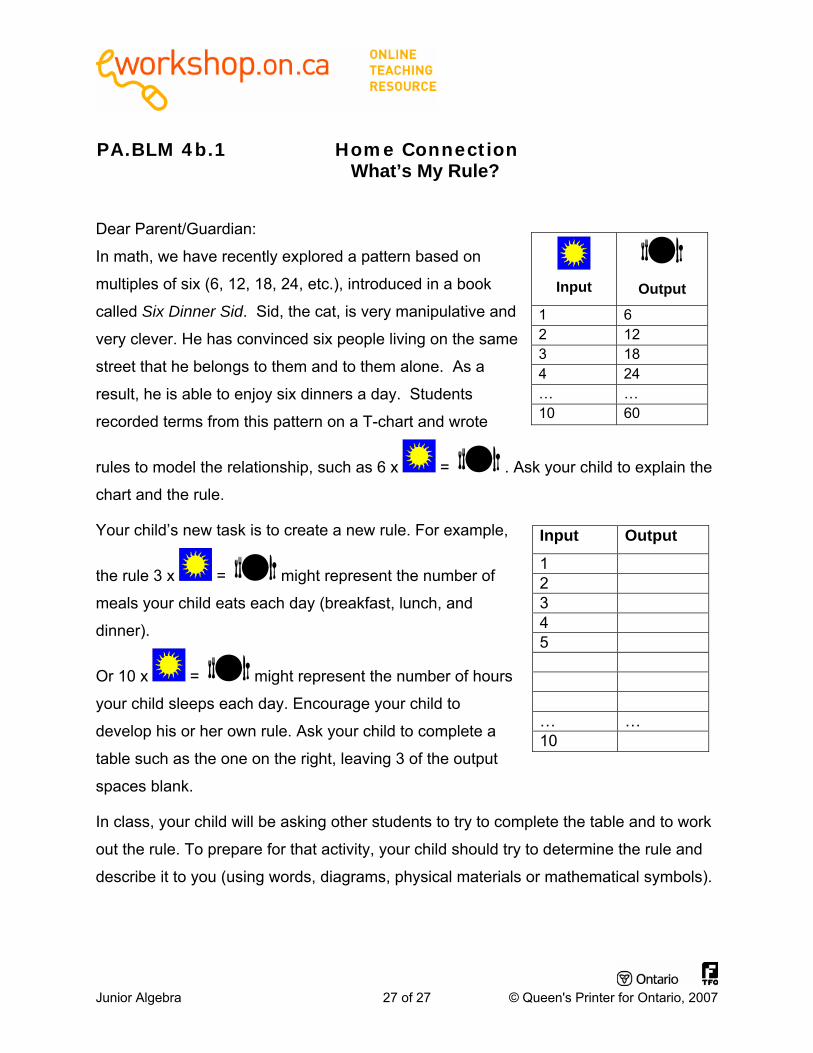
PA.BLM 4b.1 Home Connection What’s My Rule?
Dear Parent/Guardian:
In math, we have recently explored a pattern based on
multiples of six (6, 12, 18, 24, etc.), introduced in a book
called Six Dinner Sid. Sid, the cat, is very manipulative and
very clever. He has convinced six people living on the same
street that he belongs to them and to them alone. As a
result, he is able to enjoy six dinners a day. Students
recorded terms from this pattern on a T-chart and wrote
rules to model the relationship, such as 6 x = . Ask your child to explain the
chart and the rule.
Input
Output
1 6 2 12 3 18 4 24 … … 10 60
Your child’s new task is to create a new rule. For example,
the rule 3 x
Input Output
1 2 3 4 5
= might represent the number of
meals your child eats each day (breakfast, lunch, and
dinner).
Or 10 x = might represent the number of hours
your child sleeps each day. Encourage your child to
develop his or her own rule. Ask your child to complete a
table such as the one on the right, leaving 3 of the output
spaces blank.
… … 10
In class, your child will be asking other students to try to complete the table and to work
out the rule. To prepare for that activity, your child should try to determine the rule and
describe it to you (using words, diagrams, physical materials or mathematical symbols).
Junior Algebra 27 of 27 © Queen's Printer for Ontario, 2007
Top Related