


Languages
Pages
Legal

Data from the Series 13 .t , NATIONAL HiALTH SlJRVEi Number 15.
PatientChargesin Short-Stay Hospitals
UnitedStates- 19684970
Statistics are presented on the utilization of short-stay non-Federal hospitals based on data collected in the Hospital Discharge Survey from a national sample of hospital records of discharged patients. Number of discharges, total charges, average charge per episode of hospitalization, and average charge per day of hospitalization are presented by sex and age of patient, geographic region, bed size of hospital, and type of hospital service. Average charge per day of hospitalization is ” also presented by length of stay of patient.
U.S. DEPARTMENT OF HEALTH, EDUCATION, AND WELFARE Public Health Service
Health Resources Administration National Center for Health Statistics Rockville, Md. May 1974

Library of Congress Cataloging in Publication Data
Patient charges in short-stay hospitals, United States, 1968-1970.
(National Center for Health Statistics. Data from the National Health Survey, series 13, no. 15) (DHEW publication no. (HRA) 74-1766)
@’ a ‘SupC.‘ol.Docs. no.: HE 20.2210:13/5. I p >,+ I Inc\udes bibliographical references.
, ,l,‘.Hospital care-United States-Costs-Statistics. I. Title. II. Series: United States. National Center for Health Statistics. Vital and health statistics. Series 13: Data from the hospital discharge survey, no. 15. III. Series: United States. Dept. of Health, Education, and Welfare. DHEW publication no. (HRA) 74-1766. [DNLM: 1. Costs and cost analysis. 2. Economics, Hospital-U.S. 3. Fees, Medical. W2A N148vm no. 15 19741 RA407.3.A349 no. 15 [RA410.53] 362.1’1’0973s ISBN 0-8406-0001-l [338.4’3362’110973] 74-3217 ,
For saleby the Superintendent of Documents, U.S. Government Printing Office, Washington, D.C. 2040’2- Pdco 85 cents

NATIONAL CENTER FOR HEALTH STATISTICS’
EDWARD B. PERRIN, Ph.D., Director
PHILIP S. LAWRENCE, Sc.D., Deputy Director DEAN E. KRUEGER, &ting Associate Director for Analysis
GAIL F. FISHER, Associate Directorfor the Cooperutiwe Health Statistics System ELIJAH L. WHITE, Associate Director fir Data Sy.st~s
IWAO M. MORIYAMA, Ph.D., Associate Director for International Statistical Programs EDWARD E. MINTY, Associate Director for Management ROBERT A. ISRAEL, Associate Directorfor Operations
QUENTIN R. RJZMEIN, Associate Director for Progrum Devebpment PHILIP S. LAWRENCE, Sc.D., Acting Associate Director for Research
ALICE HAYWOOD, Information Officer
DIVISION OF HEALTH RESOURCES UTILIZATION STATISTICS -
COOPERATION OF THE BUREAU OF THE CENSUS
Under the legislation establishing the National Health Survey, the Public Health Service is authorized to use, insofar as possible, the services or facilities of other Federal, State, or private agencies.
In accordance with specifications established by the National Center for Health Statistics, the Bureau of the Census, under a contractual arrangement, participated in planning the survey and collecting the data.
Vital and Health Statistics-Series 13-N+ 15
DHEW Publication No. (HRA) 74-1766 Library of Congress Catalog Card Ntimbei 74-3217

CONTENTS Page
Introduction ---------------_-_----------------------------------------i 1
Sources and Limitations of Data-------.----------------------------------Background Data on Participating Hospitals----------------------------
Utilization by Type of HospitalService -----------_-----------------------Age a& Sex ofPatient-----------------------------------------------Geographic Region and Bed Size of Hospital ----___---__--_-----________
Total Charges by Type of Hospital Service -----_---------“---_-----------Age and Sex of Patient ----------_“----_------------------------------Geographic Region and Bed Size of Hospital ----_“-“--_------_----------
Average Charge Per Episode of Hospitalization ----------_--_------_______
Average Charge Per Day ofHospitalization-------------------------------.
\List of Detailed Tables ----------^--------------------------------------
Appendix I. Technical Notes on Methods-----__-^-_--_-_---_-----------Statistical Design of the Hospital Discharge Survey---------------------Data Collection andProcessing---------------------------------------General Qualifications ----------_----_------------------------------Reliability of Estimates ------------------_-_I__________________-----
Appendix II. Definitions of Certain Terms Used inThis Report------------Terms Relating to Hospital Charges -----_------_----------------------_-Terms Relating to Hospitalization-------------~---------------------Terms Relating to Hospitals and Hospital Characteristics-------,--------Demographic Terms --------_-------__I-____________________-------
.
1 2
2 2 3.
3 3 4
5
5
7
30 30 32 32 32
40 40 40 40 41
---
--
,
SYMBOLS
Data not available-----------------------
Category not applicable-.----------------- . . . Quantity zero ---__--__---_--__--_------- _
Quantity more than 0, but less than 0.0%
Figure does not meet standards of reliability or precision----------?------- *
iv
0.0

PATIENT CHARGES IN SHORT-STAY HOSPITALS
Mary Moien, Division of Health Resources Utilization Statistics
INTRODUCTION
In 1968, an estimated 13.2 billion dollarswas spent on short-stay non-Federal hospital care (excluding maternity patients and newborn infants). This estimate rose to $15.5 billion in1969 and $17.7 billion by 1970, an increase of approximately 34 percent over the 1968 figure. The estimated average charge per episode of hospitalization was $536 in 1968, $622 in 1969, and $693 in 1970. These are some major findings of the Hospital Discharge Survey (HDS) which since 1965 has been collecting data on the characteristics of patients, their diagnoses and surgical procedures, and on the hospitals from which they were discharged.
For the years 1968-1970, data was also collected on hospital charges and sources of payment. This report is based on hospital charges-the amount charged by the hospital to the patient or third-party insurer. This amount does not reflect the hospital’s cost for treating patients, nor does it necessarily reflect the amount actually received from insurance companies, Medicare, etc. For this survey hospital charges were classified into the following categories: room and care, pharmacy, laboratory, radiology, operating and/ or recovery room, professional services, and other services. Professional services relate only to charges which were billed by the hospital. The great majority of professional fees are billed separately by the physician’s office. The composition of these services is described in appendix II.
SOURCESAND LIMITATIONIS OF DATA
The estimates presented in this report are based on information obtained from the~medical and ledger records of a national sample of patients discharged from general and special short-stay hospitals, excluding Federal hospitals. Cut of a universe of 6,965 hospitals, 465 were in the complete HDS sample for 1968 through 1970. Of these 465, a subsample of drawn into the charges survey participating for all or part or part of 1969, and 130 for
168 hospitals was with 142 hospitals
of 1968, 137 for all all or part of 1970.
The medical abstracts were completed in the medical record department of the hospital. Ledger abstracts for the same sample of discharges were then completed in the business office. After the records were received at the National Center for Health Statistics, they were matched using a computer program, edited, and tabulated, producing a final record which combined patient characteristics and diagnostic data with charges and source of payment data. A copy of the medical and ledger abstracts used in the survey are shown in appendix I.
This report is concerned with the charges ~ data and is presented in terms of total charges as well as average charge per episode by room and care and other specified hospital services, by patient characteristics of age and sex, and by hospital characteristics of bed size and geographic region. Average charge per day of hospitalization is shown by length of stay intervals.
1

Data for newborn infants and females with deliveries are excluded from this report. The common practice of including charges information on one record for both mother and baby hampered analysis of this data.
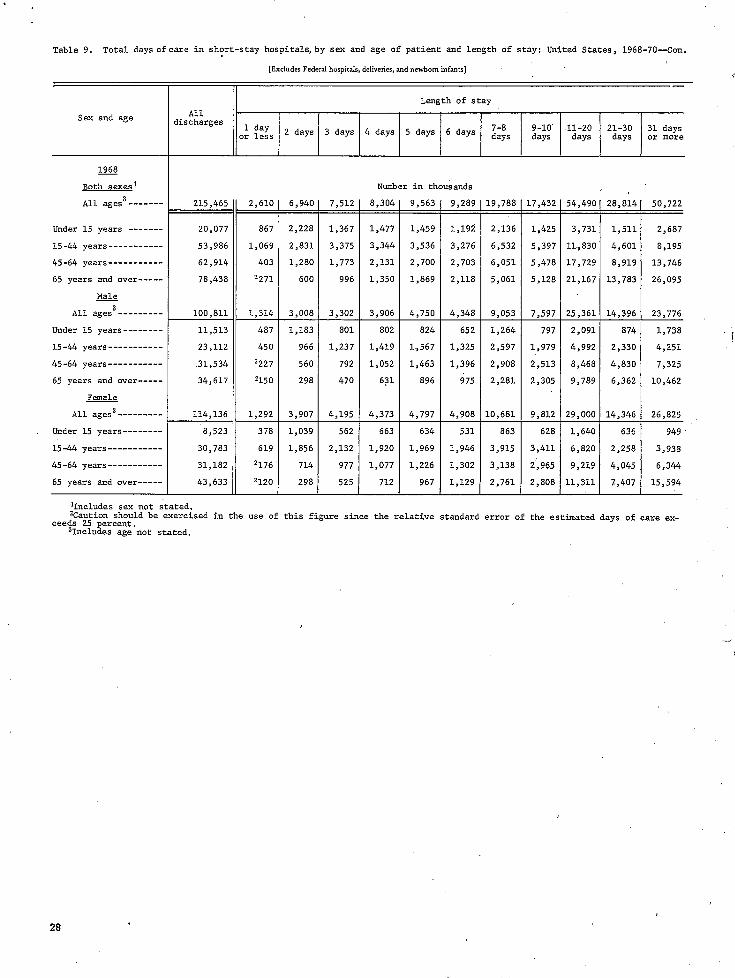
Since the estimates shown in this report are based on a sample of discharges rather than all discharges from all hospitals, they are subject to sampling error. Sampling error data can be found in appendix I. Additional data needed solely for computing standard errors for the average charge per day of hospitalization are found in tables 9 and 10.
Due to the difference in the size of the sample between the ledger survey (approximately 67,000 abstracts per year) and the medical survey (approximately 210,000 abstracts per year), comparability is not always possible between the data reported here and the 1968-1970 data published in other Hospital Discharge Survey reports in Vital and Health Statistics (Series 13,numbers 10-14).
Appendix II contains definitions of terms used in this report relating to hospitalization, hospital charges, and hospitals and their patients. Since several of the terms have specialized meanings for the Hospital Discharge Survey, familiarity with these definitions will aid in interpreting the data.
Ba’ckground Data on Participating Hospitals
The information on charges is affected by procedures used by participating hospitals in billing patients. The great majority of hospitals (90 percent) itemized charges billed for each patient. Two percent of the hospitals were either run by insurance foundations or for charity and had no posted charges, and 8 percent of the. hospitals had a fixed rate per day of hospitalization. Fixed-rate hospitals had no breakdown of charges shown on hospital records; in this report, there-fore, total charges for these hospitals are shown under the room and care heading.
Over half of the hospitals with 1,000 beds or more charged a fixed rate, whereas only 2 per-cent of the remaining hospitals had a fixed rate. By geographic region, 16 percent of the participating hospitals in the Northeast Region had a fixed rate, 11 percent in the West, 3 percent in
the South, and 2 percent in the North Central. Because of the concentration of fixed-rate hospitals by bed size, and to a lesser degree by geographic region, care must be taken when examining utilization by type of service.
UTILIZATION BY TYPE OF HOSPITAL SERVICE
Age and Sex of Patient
The number and percent of total patients who utilized the various types of hospital services are presented by age and sex for 1968 through 1970 in table 1. Virtuany 100 percent of the total discharges had a charge for room and care, and about 90 to 95 percent incurred laboratory and pharmacy charges during each year. Approximately two-thirds of the patients discharged had a radiology charge. There was an operating and/ or recovery room charge for about 42 to 44,per-cent of the discharges andaprofessional services charge for about 11 to 16 percent.
There were variations in the age andsexpatterns for the various types of hospital services. The percent of total discharges with charges for room and care and for laboratory services/were about the same for all sex and age groups for each year. On the other hand, the percent of discharges with a charge for pharmacy, radiology, or professional services generally increased with age. In 1970 the percent of all discharges utilizing the pharmacy increased from an estimated 85 percent for the age group under 15 years to 95 percent for those patients 65 years and over. For radiology the percent increased from 58 to 78 percent as age increased and for professional services from 14 to 18 percent. These trends were the same for both sexes and each year of the study.
The operating and/or, recovery room was the only hospital service for which utilization generally decreased with age for each year. For instance, in 1970 the percent of discharges utilizing the operating and/or recovery room was 49 percent for the age group under 15 years, rose slightly for those 15 to 44 ,years,, and dipped to 32 percent for patients 65 years and over. By sex, females had a higher percent operating and/ or recovery room utilization for 1968-1970. By. age, however, this higher utilization for females
was concentrated in the age groups 15 to 44 and 45 to 64.
Geographic Region and Bed Size of Hospital
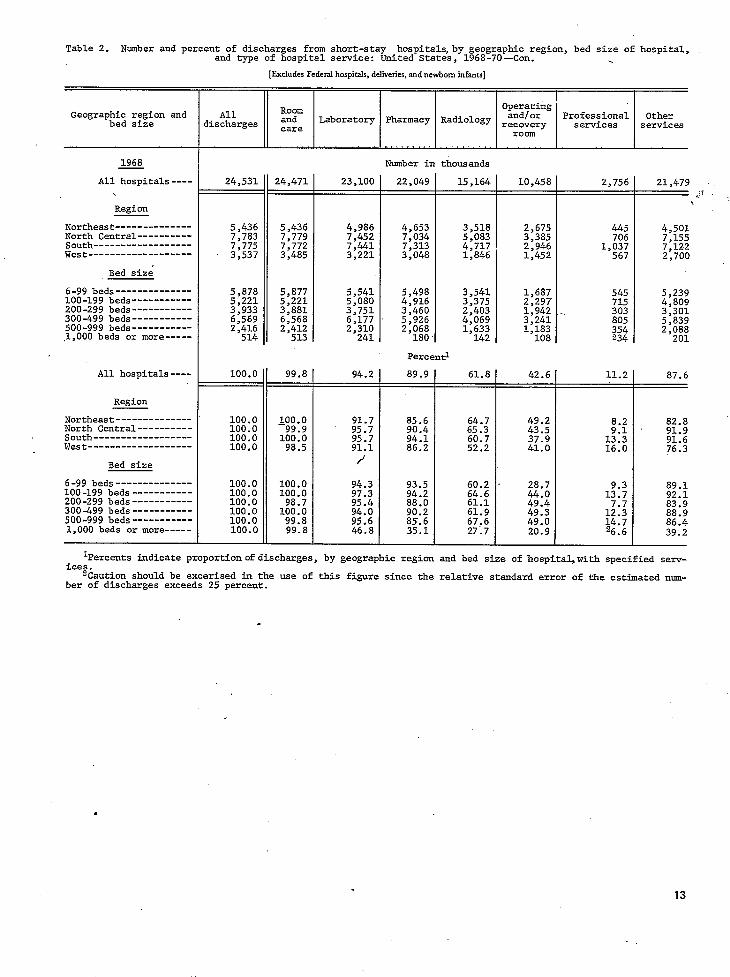
Patient utilization by type of hospital service, geographic region, and bed size of hospital is shown in table 2. In evaluating patient utilization of specific hospital services, points discussed previously concerning fixed-rate hospitals are relevant.
Regional variations were evident in the per-cent of patients with charges for the various hospital services. There were relatively small differences among the regions for percent of patients with charges for room and care and laboratory during each year of the study. There were larger variations among the regions for radiology charges. However, the largest relative differences were found in percent of discharges with a charge for professional services; percents for the West Region were about twice thoseof the Northeast Region for two of the three study years.
With a few exceptions, the relative ranking by region of each type of hospital charge was the same for each year, 1968-1970. The percent of patients with a pharmacy charge was highest in the South and lowest in the Northeast for all 3 years. In 1970, for example, the percents were 94.5 and 86.1, respectively. For each year, the North Central Region had the highest percent utilization of radiology services and the West the lowest. For 1970, 71.7 percent of the discharges in the North Central Region had a radiology charge and only 57.1 percent of those in the West had a similar charge. The Northeast consistently had the highest percent of patients with an operating and/or recovery room charge (49.4 percent in 1970), while for each year the South had the lowest percent utilization (39.7 percent in 1970).
By bed size, differences in the percent of total patients by type of charge were relatively small among hospitals with fewer than 1,000 beds (table 2). The major variations occurred with utilization of operating and/or recovery room and professional services. However, for hospitals with 1,000 beds or more theproportionofpatients with all types of hospital charges except room and care was substantially lower due to the higher percent (53 percent) of fixed-rate hospitals in
this bed size group. For example, only 31.7 per-cent of the patients discharged in 1970 from the largest hospitals had a pharmacy charge compared with 90.4 percent for all hospitals.
Among the hospitals with fewer than 1,000 beds, the percent utilization of operating and/or recovery room for each year was lowest foithe smallest hospitals. Greater specialization in the larger hospitals could account for these differences. In 1970, 29.5 percent of the patients in hospitals with 6-99 beds had operating and/or recovery room charges compared with Sl.Opercent in hospitals with 500-999 beds.
TOTAL CHARGES BY TYPE OF HdSPlTAL SERVICE
Age and Sex of Patient
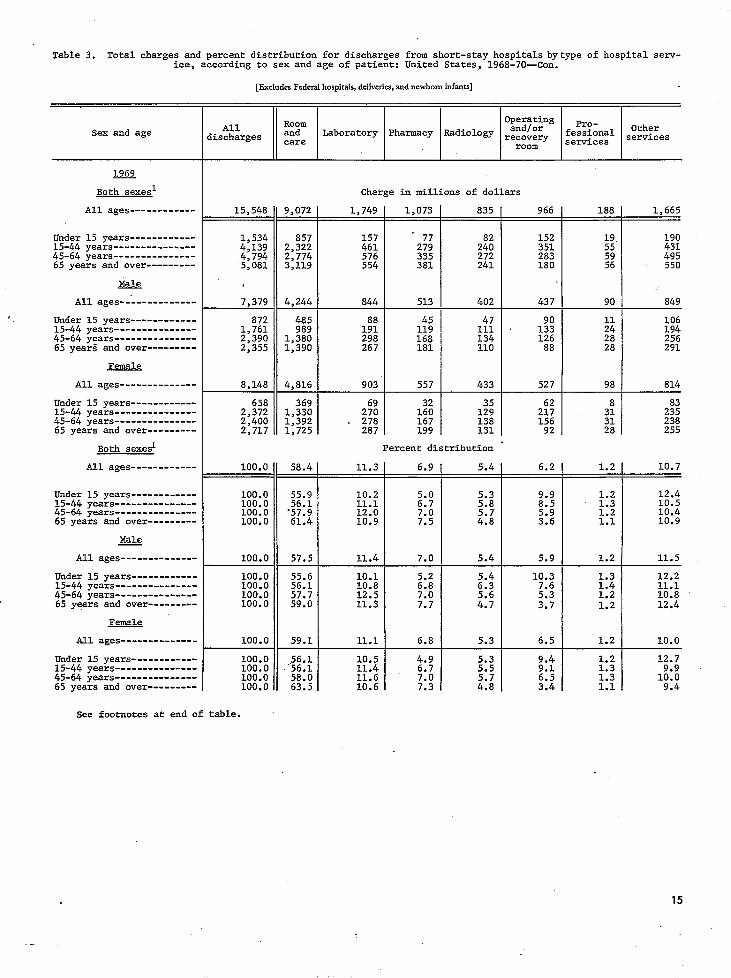
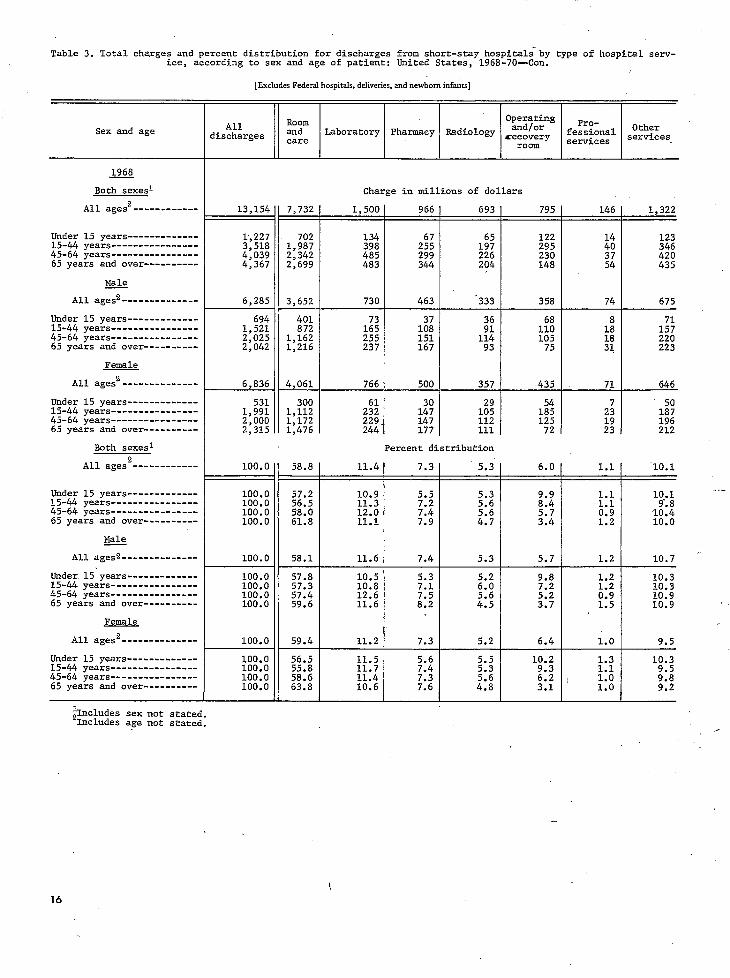
An estimated $13.2 billion was charged for short-stay hospital care in 1968. By 1970, the estimate was $17.7 billion, an increase of 34per-cent in 3 years. Total charges in dollars for each hospital service and the percent of the total bill allocated to each service are shown in table 3 by age and sex of patient. The largest allocationwas for room and care. Although the estimate in‘creased from $7.7 billion in 1968 to $10.1 billion in 1970, the percent of the total bill remained approximately 58 percent.
The percent distribution of charges by type of hospital service remained stable for all 3 years of the study. The approximate percent of the charges allocated to laboratory services was 11 percent, to pharmacy 7 percent, and to radiology 5 percent. only 6 percent of the total was charged to operating and/or recovery room for each year. It must be remembered however that this charge did not include (except in very rare cases) the fee for the surgeon or the anesthesiologist. For this same reason, the dollar allocation for professional services is only 1 percent of total charges. Professional persons almost always bill the patient separately and are out of the scope of this survey. These trends were the same for both sexes for each year of the study.
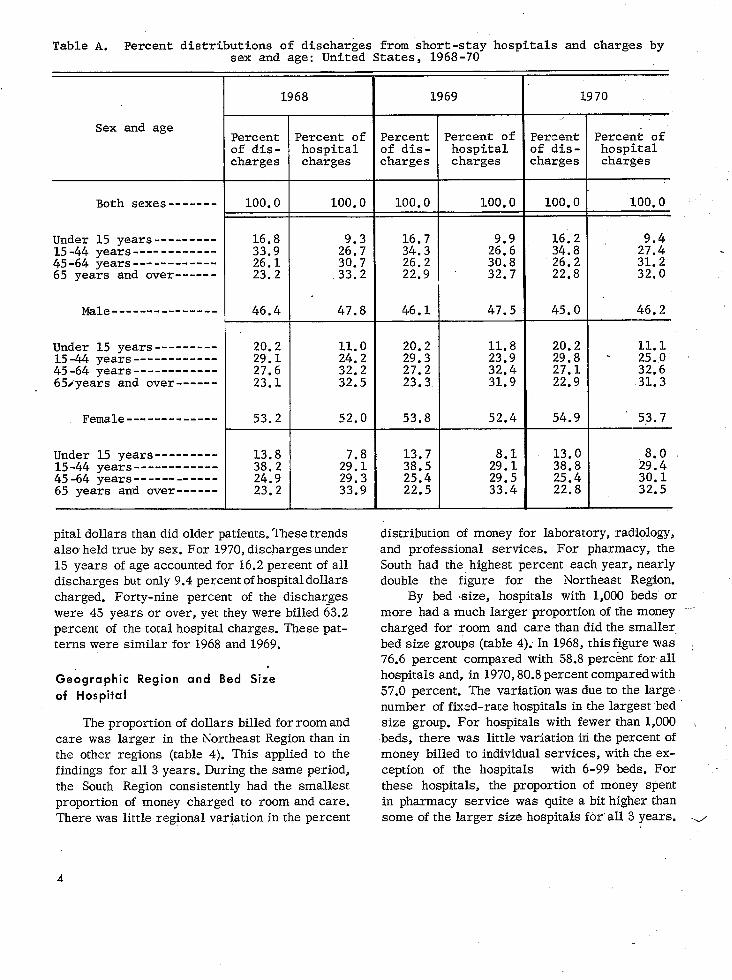
Percent distributions of patients discharged and money billed by age and sex are shown in table A. In general, those discharged under 45 years used proportionately less of the total hos-
3
29.1
Table A. Percent distributions of discharges from short-stay hospitals and charges by sex and age: United States, 1968-70
-
1968 1969 ,Sex and age
Percent Percent of Percent Percent of ,3f dis- hospital of dis- hospital ,charges charges charges charges
Both sexes------- 100.0 100.0 100.0100.0 -I-IUnder 15 years---------
15-44 years------------45-64 years------------
16.8 33.9 26.1
2E 30: 7
16.7 34.3 26.2
296’96 30:8
16.2 34.8 26.2
9.4 27.4 31.2
65 years and over------ 23.2 .33.2 22.9 32.7 22.8 32.0
Male--------------- 46.4 47.8 46.1 47.5 45.0 I 46.2
Under 15 years---------15-44 yea-j-s------------
20.2 29.1 %
20.2 29.8 -
11.1 25.0 r
45-64 years _____ ---__-_ 27.6 32: 2 27.1 32.6 . 65dyears and over------ 23.1 32.5 22.9 31.3
Female------------- 53.2 52.0
Under 15 years---------15-44 years------------
13.8 7.8 13.7 38.5 298’:.
45-64 years-i---------- E-92 29.3 25.4 29:5 65 years and over------ 23: 2 33.9 22.5 33.4
pita1 dollars than did older patients. These trends distribution of money for laboratory, radiology, also held true by sex. For 1970, discharges under and professional services. For pharmacy, the 15 years of age accounted for 16.2 percent of all South had the highest percent each year, nearly discharges but only 9.4 percent of hospitaldollars double the figure for the Northeast Region. charged. Forty-nine percent of the discharges By bed size, hospitals with 1,000 beds or were 45 years or over, yet they were billed 63.2 more had a much larger proportion of the money percent of the total hospital charges. These pat- charged for room and care than did the smaller, terns were similar for 1968 and 1969. bed size groups (table 4); In 1968, this figure was ;
. 76.6 percent compared with 58.8 percent for all Geographic Region and Bed Size hospitals and, in 1970,80.8 percent compared with of Hosp’itai 57.0 percent. The variation was due to the large
number of fixed-rate hospitals in the largest bed The proportion of dollars billed for room and size group. For hospitals with fewer than 1,000 (
care was larger in the Northeast Region than in beds, there was little variation in the percent of the other regions (table 4). This applied to the money billed to individual services, with the ex-findings for all 3 years. During the same period, ception of the hospitals with 6-99 beds. For the South Region consistently had the smallest these hospitals, the proportion of money spent proportion of money charged to room and care. in pharmacy service was quite a bit higher than There was little regional variation in the percent some of the larger size hospitals for’all 3 years. -J
4

-----------------
----------
Table B. Average length of stay in short-stay hospitals by selected patient and hospital characteristics:United States,1968-70
Length of ‘stayin days
Characteristic
1969 L970
ALL stays------- 8.8 8.4
Age
Under 15 years--------15-44 years-----------45-64 years-----------
4.9
962 ::5”
4.9
2: 65 years and over----- 13:8 1297 12: 8
. Sex
Male------------------Female----------------
West------------------
Region .. Northeast--:---------- 10.3 10.4 10.0 iVn$ Central--------- 8.4
i-91 2: 7.6 7:s 8:l 7.5
Bed size of hospital
6-99 beds --_----_----- 6.7loo-199 beds----------200-299 beds Z 300-499 beds----------500-999 beds---------- 98’97 1,000 beds or more---- 11:9
For the same period, the percent of money billed to operating and/or recovery room was lowest for this smallest bed size group.
AVERAGE CHARGE PER EPISODE OF HOSPITALIZATION
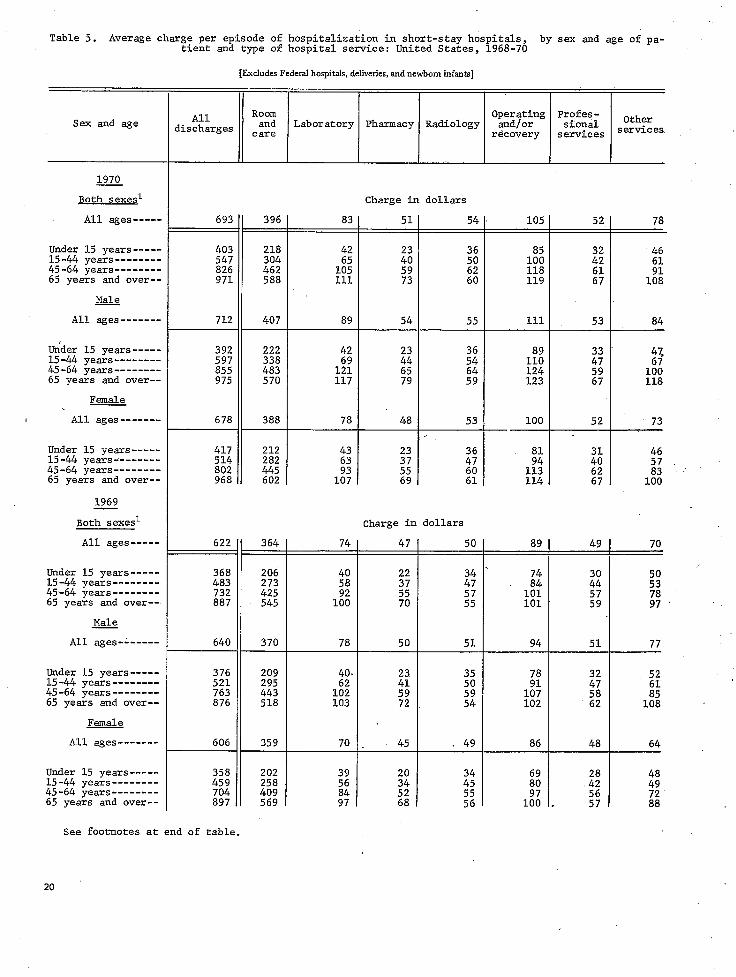
The estimated average charge per episode for patients discharged from short-stayhospitals went from $536 in 1968 ‘to $693 in 1970, an in-crease of approximately .29 percent in 3 years (table 5). By type of service, room and care had the highest average charge (approximately $396 in 1970) and pharmacy had the lowest average charge ($51 per episode in 1970):
Because of the effect of length of stay on average charge per episode of hospitalization, lengths of stay for the variables in this study are shown for 1968-1970 in table B. Average length of stay increased with age and the average charge for 1970 increased from $403 per episode for patients under 15 years to $971 for patients 65 years and over. With few exceptions, the average charge per episode increased with age for each hospital service. This was also true by sex and for each year of the study. In 1970, for example, the average laboratory charge for females rose from $43 for those females under 15 years to $107 for females 65 years and over.
The Northeast Region had a substantially higher average charge per episode than the other geographic regions for all 3 years, 1968-1970 (table 6). As shown in table B, the Northeast also , had the longest average length of stay. The higher charges in the Northeast were concentrated in room and care, laboratory, and professional services. Although the West had the shortest length of stay, it had a higher average charge per episode than both the North Central or the South. For 1970 the average charge per episode was $888 in the Northeast, $677 in the North Central, $548 in the South, and $737 in the West Region.
By bed size, the average charge per episode generally increased as hospital size increased. In 1970, the average overall charge per episode was $431 for the smallest hospitals and $1,289 for the largest ones. This pattern was due to the average length of stay increasing with size of hospital, as shown in table B, and also to the in-creased specialization of services in larger hospitals. Room and care and professional services showed the most marked increases for all 3 years. Ln 1970, room and care increased from $224 to $1,042, and professional services increasedfrom $29 to $256 per episode as bed size increased.
AVERAGE CHARGE PER DAY OF HOSPITALIZATION
The estimated average daily charge for all patients covered in this report was,$61 in 1968, $70 in 1969, and $82 in 1970 (table 7). This was an increase of 34 percent in the 3 years of the study. Hospitalization charges were twice as high per day for stays of 1 day or less as for stays of
5
31 days or more. In 1970, the average daily charge for stays of 1 day or less was $144. This figure tapered off to $82 for the 5th day and remained at about that level through the 30th day. The average daily charge for patients staying longer than 30 days was about 10 percent lower than for patients with shorter stays. This same pattern of charges was evident for each year; 1968-1970.
Patients 65 years and over had rhe lowest average daily charge for all lengths of stay combined. In 1970, the estimate for females 65 years and over was’$73 per day compared with $81 per day for females of all ages. Over the 3-year period charges increased fairly consistently for both sexes and all age groups. These increases averaged $20 to $25 per day of hospitalization. For example, the estimated average daily charge for males under 15 years increased from $60 in 1968 to $79 in 1970 (table 7).
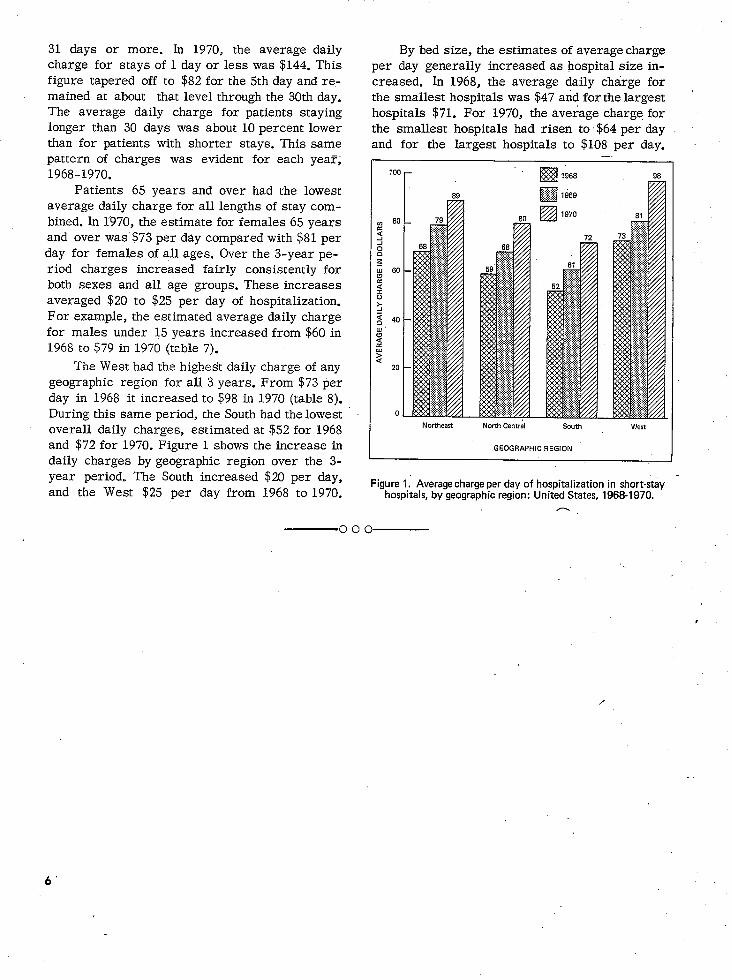
The West had the highest daily charge of any geographic region for all 3 years. From $73 per day in 1968 it increased to $98 in 1970 (table 8). During this same period, the South had the lowest overall daily charges, estimated at $52 for 1968 and $72 for 1970. Figure 1 shows the increase in daily charges by geographic region over the 3-year period. The South increased $20 per day, and the West $25 per day from 1968 to 1970.
000
By bed size, the estimates of average charge per day generally increased as hospital size in-creased. In 1968, the average daily charge for the smallest hospitals was $47 and for the largest hospitals $71. For 1970, the average charge for the smallest hospitals had risen to ‘$64 per day and for the largest hospitals to $108 per day.-
100 1968 98 r -
80 q “‘O
North Centri South
GEOGRAPHIC REGION
Figure I.’ Average charge per day of hospitalization in short-stay hospitals, by geographic region: United States, 1968-1970.
-------------------------------------------------------------------------
-------------------------------------------------------------------------
Table 1.
2.
3.
4.
5.
6.
7.
8.
9.
10.
LIST OF DETAILED TABLES
Page
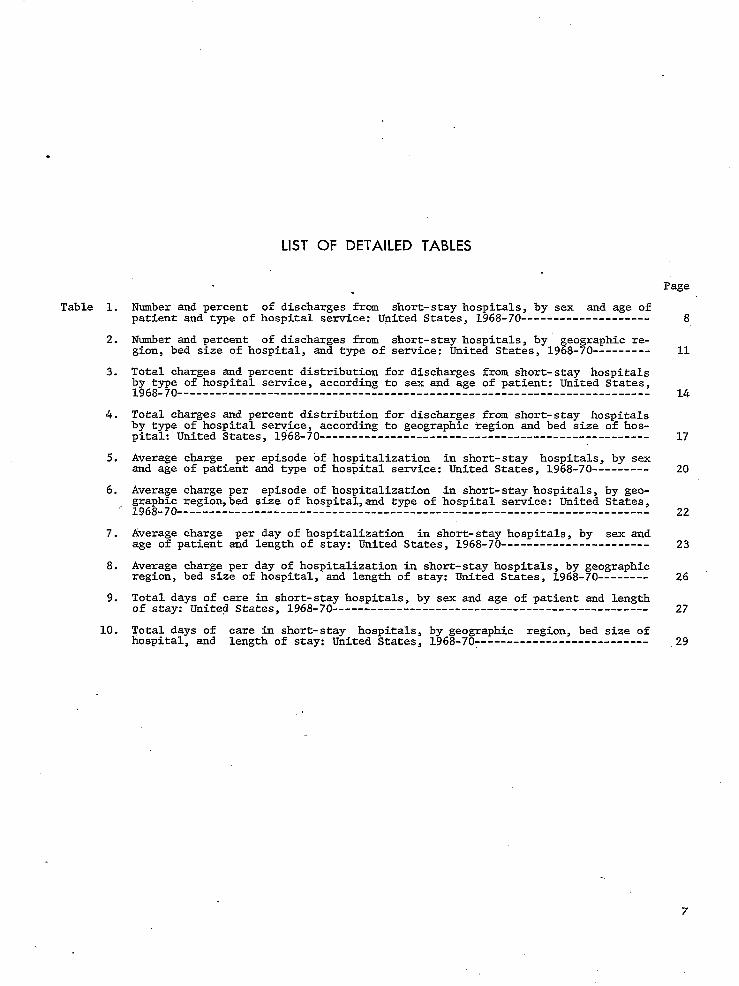
Number and percent of discharges from short-stay hospitals, by sex and age of patient and type of hospital service: united States, 1968-70-------------------- 8
Number and percent of discharges from short-stay hospitals, by' geographic region, bed size of hospital, and type of service: United States, 1968-70--------- 11
Total charges and percent distribution for discharges from short-stay hospitals';g,;yp; of hospital service, according to sex aa age of patient: United States,
- 14
Total charges and percent distribution for discharges from short-stay hospitals
pital: United States, service, according to geographic region and bed size of hos-
17by type of hospital
1968-70---------------------------------------------------
Average charge per episode bf hospitalization in short-stay hospitals, by sex and age of patient and type of hospital service: United States, 1968-70--------- 20
Average charge per episode of hospitalization in short-stay hospitals, by geof;;ih;; region,bed size of hospital,end type of hospital service: United States,
- 22
Average charge per day of hospitalization in short-stay hospitals, by sex and age of patient and length of stay: United States, 1968-70----------------------- 23
Average charge per day of hospitalization in short-stay hospitals, by geographicregion, bed size of hospital, and length of stay: United States, 1968-70-------- 26
of of care in short-stay hospitals, by sex and age of patient and length
27Total
stay:days
United States, 1968-70-------------------------------------------------
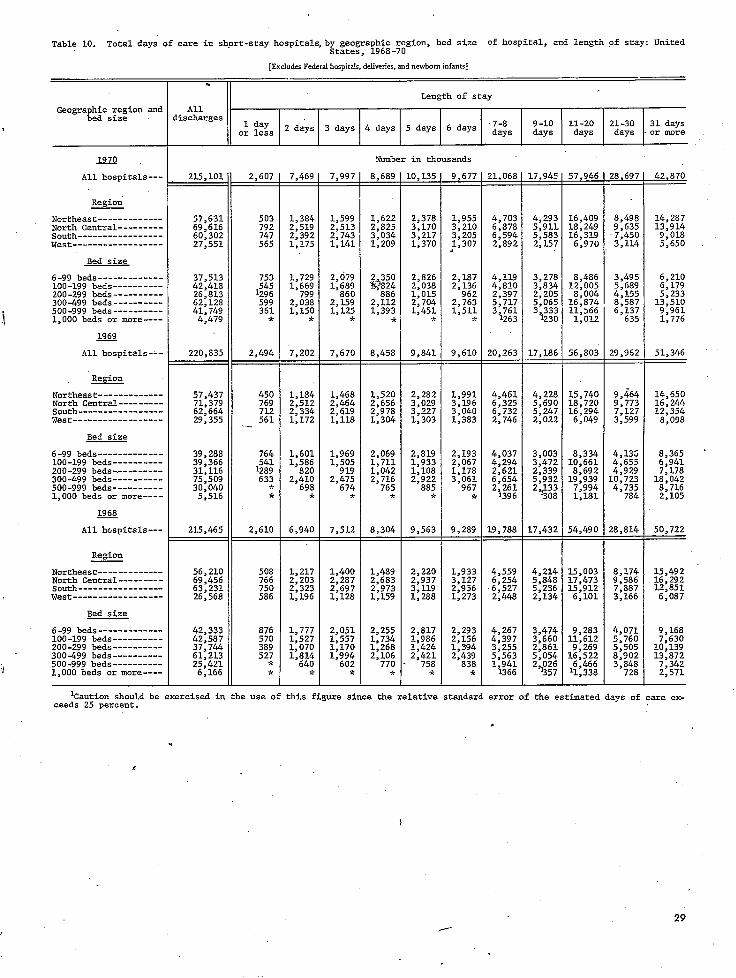
Total days of care in short-stay hospitals, by geographic region, bed size of hospital, and length of stay: United States, 1968-70r-------------------------- (29
7

-----------
---------
-----------
100.0 99.5
100.0 99.7
60.3
Table 1. Number and percent of discharges from short-stay hospitals, by sex and age of patient and type of hospital service: United States, 1968-70
[ExcludesFederalhospitals,deliveries,andnewbominfants]
All Room Operating Sex and age lischarges care
and/or Professional Otherand Laboratory Pharmacy Radiology recoveiy services services room
.
1970
Both sexes' Nmnber in thousands
All ages------ 24,268 23,129 1'/,333 11,311 1 4,090 23,138====I25’506 Under 15 years---------
%i z% 2% 3% 5,360 1,35415-44 years--------2,409 2,050 580 3,574
4544 years -_---------- 6:696 61680 6:407 6:198 4% 1,086 xi 65 years and over------ 5,839 5,838 I 5,662 5,571 259% 1:865 1,070 5:474J
Male All ages --_-------- 11,510 11,484 10,853 10,266 8,P60 L 1,794 10,2904,751
Under 15 years--------- 2,319 2,313 2,207 1,952 1,341 1,125 323 1,98215-44 years-------- 3,435 3,425 3,170 2,984 2,285 ' 1,538 515 3,02345-64 year------------- 3,113 2,932 2,834 1,;;; 485 2,82365 years and over------ x , 2,634 2,545 2,496 XII 472 2,462
Female it
All ages 14,032 11 13,984 13,378 12,828 9,247 6,539 1 2,284 12,813I
Under 15 years--------- 1,746 1,562 1,053 921 1,58615-44 years-------- 5,054 4,842 3,064 2,905 28% 4,88545-64 yea,-s --------m--w 3,466 .3,355 600 3,334-65 years and over------ 3,112 3,069 9%
1,;;; 597 3,0082
Both sexes1 Percent2 All ages 94.9 44.2 1 16.0 90.5’+I gg-7 II
Under 15 years--------- 100.0 99.7 95.4 84.8 58.0 49.4 86.115-4445-64
year--------- 50.1 3 89.1 years ---_-------- 100.0 99.8 E E 74.5 16:2
65 years and over------ 100.0 100.0 97:o 9514 78.3 24:: 18,3 XZi
100.0 /I 99.8 / 94.3 41.3 15.6 ‘89.4-=-PO Under 15 years---------
100.0 99.7 ;524 E z-58 44.8 15.0 88.0 48.5 13.9 85.5
15-44 years-------
45-64 years w----------- 100.0 99.7 93:9 90:s 7613 38.7 15.5 65 years and over------ 100.0 100.0 96.6 94.7 77.5 33.5 17.9 R$
Female All ages 91.4 1, 65.9 46.6 16.3 91.3
Under 15 years--------- 100.0 95.6 85.5 50.4 13.8 86.815-44 y&-s------------ 100.0 92.9 89.0 2-i 15.3 89.845-64 years------------ 100.0 97.2 73:1 E4 16.8 '93.5 65 years and over------ 100.0 97.3 2:: 79.0 30:7 18.7 94.1
See footnotes at end of table..
8

----------- 5:728 5,724
5,172
51437 1% 4'E
--
Table 1. Number and percent of discharges from short-stay hospitals, by sex ad age of patient and type of hospital service: United States, 1968-70-Con.
Sex and age
1969
.Both s&es1
All ages--------
Under 15 years--------15-44 years----------45-64 years 65 years and over-----
Male All ages---------
Under'15 years--------15+& years------45-64 yea,-- -_---------65 years and over-----
Female Al1 ages--------
Uoder 15 years--------15-4445-64
years------ye.y,.s---r-
65 years and over-----
Both sexes1
All.ages-------
- Under 15 years--------15-44 years------45-64 yea,-s------
65 years and over-----
All ages-----
Under 15 years--------15-44 Yeats------45-64 years------
65 years and over-----
Female
Under 15 years--------45-6415-44 years-----
years------
65 years and over-----
All discharges
Number in thousands
25,003 II 24,913 23,640 22,612 1 16,670 1 10,799 3,843 22,265
4,164 4,155 x50: 3,575 2,3868,515
;a;$ 6,519 61239
2,050 627 1,2331,033
1:790 949
4,659 1,771 10,139
1,154 347 1,9651,458 503 2,9191,185 474 2,799
862 448 2,457
2,061 12,101
1,5524,6063,1392,805
43.2 15.4 89.1
15.1 84.6 Ii? f 4218
14.4 15.8
88.0 90.8
31.3 16.6 92.0
40.4 15.4 88.0
49.7 14.9 Sk6 43.2 14.9 86.3 37.8 32.1 23
89.4 91.4
45.5 15.3 90.0
48.6 84.5 52.1 ggi47.3 200 30.4 1614 92:5
9
5,547
11,524 I! 11,473 so ,790
2,322 2,318 2,1983,381 3,357 3,0763,133 II 3,114 2,9332,688 2,684 2,583
13,450 Ij 13,411 12,822
1,837 1,832 1,7504,815
3,410 II xi:: 3,3023,031 3:030 2,955
94.6
2.;95:3 96.8
100.0 !I 99.6 93.6
E%-; 238 94.7
1oo:o 99:4 E 100.0 99.9 96:l
-I-100.0 . 99.7 95.3
100.0 99.7 95.3 100.0 100.0
99.5 99.7
93.1 96.8
100.0 100.0 97.5
X~~ 4:412
10,253 7,872
1,997 1,3372,909 2,2112,8272,519 2:;4,-l-t
Percent*
90.4 66.7
85.9 57.3 88.3 59.4 92.3 94.9 5%
89.0 68.3
86.0 57.686.1 65.4 90.3 72.6 93.7 76.3
91.7 65'.3
85.6 56.9 89.7 94.2 575'55 96.0 7717
See footnotes at end of table.
. .
.., _
-. .L :

----------
685
Table 1. Number and percent- of discharges form short-stay hospitals, by sex and age of patient and type of hospital service: United States, 1968-70-Con.
[ExcludesFederalhospitals,delivelies,andnewbominfants]
ROolll Operating OtherTAll and Laboratory Pharmacy Radiology r~~~~~~y Professional
services,Sex and age discharges care services room
1968
Both sexes? Number in thousands
All ages3----- 24.531 24.471 23,100 2,756 1 21,479 I
Under 15 years---------15-44 yeaj-s----------
4,1128,326
4,1028,301
3,8817,660
396 811
3,3467,21345-64 years _---_-_---__ 6,410 6,386 6,076
65 years and over------ 5,678 5,676 5,478 864 x::,
m All ages3 I-------- 11,370 11,351 10,603 9,826
Under 15 years--------- 2,291 2,284 2,164 1,86615-44 yeay------------ 3,313 3,308 3,008@,-fj&years----------- 3,138 2,924 z2 65 years and over------ 2,623 32%; 2,503 2:370,
-Female
All ages3 13,102 13,061 12,441 11,601
Under 15 years---------15-44 years---------45-64 year-------------
65 years and over------
1,809 1,8064,998 4,9793,257 3,2393,037 3,035
1,7064,6393,1382,957
1,4704,3832,9512,795
Both sexes' Percent2 All ages3 -------- 100.0 89.9 61.8 42.6 11.2 87.6
Under 15 years---------15-44 yea)-s----------45-64 years __-----_-__-65 years and over------
100.0 99.8 100.0 99.7 100.0 99.6 100.0 100.0
94.4 92.0 94.8 96.5
84.8 87.7 . 91.6 94.9
50.8 54.6 68.6 72.6
48.9 48.3 41.8 30.7
9.6
190.3 15:2
81.4 86.6 89.4 91.2
100.0 tI 99.8 1 93.2 88.6 64.0 39.7 11.5 86.4
Under 15 years--------- 100.0 99.7 94.5 84.2 51.2 48.7 190.; 81.415-44 years----------- 100.0 99.8 90.8 86.2 61.6 42.3 85.045-64 yea,-s _----------- 100.0 99.8 93.2 90.0 69.5 10:6 88.2 65 years and over------ 100.0 100.0 95.4 93.7 71.8 26' 15.3 90.3
Female
100.0 99.7 95.0 91.0 59.9 45.2 11.0, 88.5
Under 15 years--------- 100.015-44 years------------ 100.045-64 Gears _-----_-_--- 100.0 65 years and over------ ii---l- 100.0
x 99:s
100.0
94.3 85.4 92.8 88.7 96.4 93.1 97.4 95.9
50.5 50.0 67.8 73.3
49.3 52.3 4%
x
10:7 15.2
81.3 87.7 90.6 92.0
&cludes sex not stated. Percents indicate proportion of
3Includes age not stated. discharges, by age and sex, with specified services.
10

---
, Table 2. Number and percent of discharges from short-stay hospitals,by geographic region, bed size of hospital, *
and type-of hospital service: United States, 1968-70
[Exduda Federalhospitals, deliveries,andncwbominfantsl -Room Operating
OtherGeograpk-i; r&m and All and Laboratory Pharmacy Radiology +~~~~~~, Professional servicesdQFharges care services
room
1970 Number in thousands
All hospitals---- I 24,268 23,129 17,333 11,311 4,090 23,138
Region Northeast-------------- 5,319 4,960 4,030 2,846 599 4,954 North Central---------- 7,954 7,519 5,914 3,703 1,623 7,716 South------------------ 7,573 7,465 5,292 3,132 1,131 7,416 West -.---mm--------- 3,422 3,185 2,097 1,630 738 3,052
Bed size-6-99 be&-------------- 5,320 5,199 3,657 1,647 533 5,150 100-199 beds----------- 5,193 5,063 3,628 2,434 940 5,070 200-299 beds----------- 2,895 2,603 2,148 1,409 384 2,578 300-499 beds----------- 6,602 6,273 '4,847 3,554 1,665 6,304 50,-,-999 beds----------- 4,129 3,871 2,954 2,200 493 3,930 1,000 beds or more----- 131 119 99 67 74 107
Percent]
All hospitals---- 100.0 99.7 94.9 90.4 67.8 44.2 16.0 90.5
Region Northeast-------------- 100.0 99.9 92.3 86.1 70.0 49.4 86.0 North Central---------- 100.0 100.0 96.4 91.1 71.7 44.9 93.5 South------------------ 100.0 99.9 95.9 94.5 67.0 39.7 _ 93.9 West------------------- 100.0 98.5 93.3 86.8 57.1 44.4 83.2
Bed size 6-99 be&-------------- 100.0 99.9 95.3 93.1 65.5 29.5 9.6 92.2 100-199 beds----------- 100.0 99.9 96.0 93.6 67.0 45.0 17.4 93.7 200-299 beds----------- 100.0 98.1 97.9 88.1 72.7 47.7 13.0 87.2 300-499 beds----------- 100.0 99.9 95.1 90.4 69.8 51.2 24.0 90.8 =,00-999 beds----------- 100.0 100.0 95.7 89.7 68.5 51.0 11.4 91.1 1,000 beds or more----- 100.0 99.8 34.8 31.7 26.3 17.9 19.7 28.5
See footnotes at end of table.
11

Table 2. Number and percent of discharges from short-stay hospitals,by geographic region, bed size of hospital,and type of hospital service: United States, 1968-70-Con.
[ExcludesFederalhospitals,deliveries,andnewbominfants]
Operating and OtherGeograpi:i. ;;!g$on and All Room
Laboratory Pharmacy Radiology ,~~~~~:, Professional servicesdischarges care services
room
. 1969 Number in thousands
Ali hospitals--- 25.003 24,913 23,640 22,612 16,670 10,799 3,843 22,265
Region Northeast------------- 5,508 5,478 5,052 4,742 3,834 2,641 555 4,617 North Central--------- 8.102 8,091 7,804 7,398 5,727 3,642 1,519 7,511 South----------------- 7,774 7,768 7,443 7,334 5,072 3,040 .1,163 7,226 West------------------ 3,620 3,575 3,341 3,138 2,036 1,477 604 2,910
Bed size 6-99 beds ________-____ 5,437 5,407 5,135 5,076 3,355 1,543 647 4,942 loo-199 beds---------- 5,005 4,999 4,778 4,652 3,390 2,125 690 4,562 200-299 beds---------- 3,219 3,176 3,149 2,875 2,256 1,524 373 2,836 300-499 beds---------- 8,118 8,117 7,761 7,439 5,552 4,141 1,807 7,339 500-999 beds---------- 1,749 .2,739 2,605 2,377 1,962 1,369 268 2,401 1,000 beds or more---- 474 474 213 194 155 98 58 185
.' .: Percent'
All hospitals--- 100.0 99.6 94.6 90.4 66.7 43.2 15.4 89.1
Region Northeast------------- 100.0 99.5 91.7 86.1 69.6 47.9 10.1 83.8 North Central--------- 100.0 99.9 96.3 91.3 70.7 45.0 18.8 92.7 South----------------- 100.0 99.9 95.7 94.3 65.3 39.1 15.0 93.0 West------------------ 100 .o 98.8 92.3 86.7 56.2 40.8 16.7 80.4
Bed size 6-99 beds------v--v 100.0 99.4 94.4 93.4 61.7 28.4 11.9 90.9 loo-199 beds---------- 100.0 99.9 95.5 93.0 67.7 42.5 13.8 I 91.2 200-299 beds---------- 100.0 98.7 97.8 89.3 70.1 47.3 11.6 88.1. 300-499 beds---------- 100.0 100.0 95.6 91.6 68.4 51.0 22.3 9i.4 500-999 beds---------- 100.0 99.6 94.8 86.5 71.4 49.8 9.7 87.3 1,000 beds or more---- 100.0 100.0 44.8 40.8 32.6 20.8 12.2 39.0
See footnotes at end of table.
12
-------------------
--------------
Table 2. Number and percent of discharges from short-stay hospitals,by geographic region, bed size of hospital,and type'of hospital service: United States, 1968-70-Con.
[ExdudesFcderalhospitals,deliveries,andnewbominfanu]
OtherGe0grapE-i; ;r~$on and dis:&.ges 11 ig 1 Laboratory / Pharmacy 1 Radiology services
1968 Nmber in thousands
All hospitals---- 24,531 24,471 23,100 15,164 10,458 2,756 21,479 - z.3
Region Northeast-------------- 5,436 4,986 4,653 3,518 2,675 445 4,501North Central---------- 57% 7,779 7,034 5,083 3,385 706 7,155South------------------ 7:775 7,772 ?Ei 7,313 2,946 1,037 7,122West------------------- 3,537 3,485 3:221 3,048 X~~ 1,452 567 2,7002
Bed size 6-99 beds------- 5,878 5,877 5,498 3,541 1,687 545 5,239lo‘,-199 be&----------- 5,221 5,221 4,916 3,375 2,297 715 4,809200-299 beds----------- 3,933 3,881 2,403 1,942 303 3,3013O,,d,gg be&----------- 6,569 6,568 x 4,069 3,241 805 5,839=,0,-,-999 beds---------- 2,416 2,412 2:068 1,633 1,183
g," 2,088
,1,000 beds or more----- 514 513 241 180 142 108 201
Percentl
All hospitals---- 100.0 99.8 89.9 61.8 42.6 87.6
Region Northeast-------------- 100.0 LOO.0 85.6 64.7North Central---------- 100.0 99.9 90.4 65.3 t-1’ south------------------ 100.0 100.0 94.1 60.7 13:3West 100.0 98.5 86.2 52.2 16.0
Bed size 6-99 beds 100.0 100.0 94.3 93.5 60.2 28.7 89.1
lo,,-199 beds -w---m----- 100.0 100.0 97.3 94.2 92.1 200-299 beds -m---m----- 100.0 98.7 88.0 24-f Et 83.9300-499 beds----------- 100.0 100.0 E 90.2 61:9 4913 88.9500-999 be& --mm------- 100.0 99.8 95:6 85.6 67,6 49.0 86.41,000 beds or more----- 100.0 99.8 46.8 35.1 27.7 20.9
'Percents indicate proportion of discharges, by geographic region and bed size of hospital,with specified serviceg.
-Caution should be excerised in the use of this figure since the relative standard error of the estimated nuaber of discharges exceeds 25 percent.
13

444
307
152 150
145 273
Table 3. Total charges and percent distribution for discharges from short-stay hospitalsbytype of hospital sew-: ice, according to sex and age of patient: United States, 1968-70
(ExcludesFederalhospitals,deliveries,andnewborninfants]
All BOOIll Operating Pro- OtherSex and age Kscharges and Laboratory Pharmacy Radioldgy ,~~&~y fessional servicescare room services
II
1970
Both sexes1 Charge in millions of dollars All ages-----..------ 1,171 937 1 1,187 1 214 2,W
I I Under 15 years------------15-44 years---------------45-64 years---------------65 years and over---------
1,6734,8605,5335,669
901 2,6913,0893,430
168 536 3% 675 368 630 409
2%
274
175
542 $97 %
243 549 681 633
All ages-------------- 8,196 11 4,675 1 961 557 444 527 95 937
Under 15 years------------ 908 512 45-64 years---------------65 years and over---------
2,668 1,5032,569 1,501
354 184 297 197 121 109 32;
296 312
Female
All ages-------------- 9,5.16 11 5,424 1 1,045 612 491 657 119 1,168
Under 15 years------------15-44 jrears---------------45-1j4 years---------------65 years and over---------
761 2,7982,8603,096
38 32: 1:: 321 184 155 333 212 153
75
196 112
8
;3740
142 324
2;
Both sexes1 Percent distribution All ages------------ 100.0 57.0 11.3 6.6 5.3 6.7 11..9
Under 15 years------------15-44 years---------------45-64 years---------------
100.0 100.0 :x 100.0 5518
10.1 4.8 11.0 12.2 $:I
10.5 9.1 :4-z
15-44 years--------------- 2,051 1,159 291: 1% 14: % E 2;:
65 years and over--------- 100.0 60.5 11.1 . i:; 12:3 11.2 ,
Male
All ages-------------- 100.0 57.0 11.7 6.8 5.4 6.4 11.5
Under 15 years------------15-44
100.0 56.4 10.1 10.9
45-64 years---------------years---------------
65 years and over---------
100.0 100.0 100.0
56.5 56.3 58.4
10.7 13.3 11.6
2z 6:9 7.7
22 1::
%. 22”
11.1 11.1 12.2
Female
811 ages-------------- 100.0 57.0 11.0 6.4 5.2 6.9 12.3
Under 15 years------------15-44 years---------------45-64 years---------------65 years and over---------
100.0 100.0 100.0 100.0
50.9 54.6 55.4 62.2
10.0 11.3 11.2 10.7
4.6
2.: 6:s
18.7 l-l.6 13.3 10.3
See footnotes at end of table.
.
'14
12.4
10.4
10.8
Table 3. Total charges and percent distribution for discharges from short-stay hospitals bytype of hospital service, according to sex and age of patient: United States, 1968-70-Con.
[ExcludesFcderalhospitalr,dctiveria,andnewbominfanu]
All Room Operating Pro- OtherSex and age lischarges and Laboratory Pharmacy Radiology rzti&& fessional servicescare room services
1969
Both sexes.' Charge in millions of dollars All ages------------ 15.548 9.072 I 1.749 1.073 835 966 188 1,665
Under 15 years------------ 1,534 857 157 82 152 45-64 years---------------65 years and over---------
4,7945,081
2,7743,119
2% 554
335 381 29
283 180
495 550
&& All ages--~----------- 7,379 4,244 ] 844 513 402 437 849
Under 15 years------------15-44
872 485 88 106
15-44 years--------------- 4,139 2,322 25; 240 351 t93:
45-64 years--------------- 1,761 989
2: 14; 1:: 1% 194
years--------------- 2,390 1,380 168 134 126 25665 years and over--------- 2,355 1,390 267 181 110 88 291
All ages-------------- 8,148 4,816 1 903 557 433 527 814
Under 15 years------------ 658 36915-4445-64
years--------------- 2,372 2;: 1% 1% 2:; 2:: years--------------- 2,400 P% 278 167 138 156 238
65 years and over--------- 2,717 1:725 * 287 199 131 92 255
Both sexes1 Percent distribution -
All ages------------ 100.0 58.4 11.3 6.2 1.2 10.7
Under 45-64
years---------------years---------------
65 years and over---------%-: 1oo:o
56.1 '57.9 61.4
E-:,10:9
22
2::
i::
E
10.5
10.9
Male
All ages-------------- 100.0 57.5 11.4 5.9 1.2 11.5
Under 15 years------------15-44 years---------------
100.0 100.0 2:
10.1 10.8
10.3 5::
i-2 1:2
12.2 11.1
15 years------------ 100.0 55.9 10.215-44
45-64
45-64 years---------------65 years and over---------
100.0 100.0
5717 59.0
12.5 11.3 3.7 1.2 12.4
Female
All ages-------------- 100.0 59.1 11.1 6.5 1.2 10.0
Under 15 years------------15-44 years---------------
100.0 100.0
56.1 ~'56.1
10.5 years--------------- 100.0 %
65 years and over--------- 100.0 Ex . 10:6
See footnotes at end of table.
15
according
299
--
Table 3. Total charges and percent distribution for discharges from short-stay hospitalsby type of hospital service, to sex and age of patient: United States, 1968-70-Con.- [ExcludesFederalhospitals,ddiveries,andnewbominfants]
AllI<discharges
13,154
1,,2273,5184,0394,367
694 1,5212,0252,042
6,836
531 1,9912,0002,315
100.0
100.0 100.0 100.0 100.0
100.0
100.0 100.0 100.0 100.0
100.0
K%*i 1oo:o 100.0
Room Operating Pro- Otherand Laboratory Pharmacy Radiology &~&~, fessional servicescare services Sex and age
1968
Both sexes1 All ages2 --_--_------
Under 15 years-------------15-44 years----------------45-64 years----------------65 years and over----------
Male
Under 15 years-------------15-44 years----------------45-64 years----------------65 years and over----------
Female
All ages2--------------
Under 15 years-------------15-44 years----------------45-64 years----------------65 years and over----------
Both sexes1 All ~ges2--------
Under 15 years-------------15-44 years----------------45-64 years----------------65 years and over----------
Male
Under 15 years-------------15-44 years----------------45-64 years----------------65 years and over----------
Female
All ages2--------------
Under 15 years-------------15-44 years----------------45-64 years----------------65 years and over---------
room
Charge in millions of dollars
7,732 / 1,500 966 1 693 1 795 1 146 I I I
2:: 122 22
344 204 E148 2
r-t-463 '333 358 74
1% 93: 116: 8
151 114 105 i88 167 93 75 31:
4,061 766 500 357 435 71
300 1,1121,1721,476
2% 229 244
2; 1;;112
1;";125
7
xs
Percent
177
distribution
111 72 23
58.8 1.1
:c: 58:o 61.8
58.1 1.2
57.8 57.3 57.4 59.6
59.4 11.2 7.3 5.2 6.4 1.0
56.5 55.8 it:2 58.6 63.8 Zl
\
1,322
675
1:;
2
646
1% 196 212
10.1
10.1 9.. 8
'10.4 10.0
10.7 '
10.3 10.3 10.9 10.9
9.5
10.3
x*85 9:2
$ncludes sex not stated. Includes age not stated.
16

Table 4. Total charges andpercent distribution for discharges from short-s&y hospitalsbytype of hospital service, according to geographic region and bed size of hospital: United States, 1968-70
[ExcludesFederalhospitals,deliveries,andnewborninfants] = II I I I I
Geographic region and clischarges 11 !z 1 Laboratory 1 Pharmacy 1 Radiology / 225bed size *11
1970 Chargewin millions of dollars
All hospitals------- I 17,735 1-0,111 2,009 1,171 937 1,187 214 1,798
Region
Northeast----------------- 3,184 E 233 284 318 North Central------------- 3,125 402 285 377 % South--------------------- 2,279 517 377 287 577 West---------------------- 1,522 284 159 fl'f 205 373
Bed size
6-99 beds------------------100-199 beds---------------
2,405 1,247 259 227 148 132 267 234 167 191 378
200-299 beds--------------- 9sE 'I% 324: 125 177 215 300-499 beds--------------- $462 31093 . 603 ;9; 401 663
1,000 beds or more--------- 484 391 414 9 12 22"; 4ti
Percent distribution
All hospitals-------- 100.0 57.0 11.3 6.6 5.3 6.7 10.1
Region
Northeast------------------North Central--------------South----------------------West----------------------- /-
100.0 100.0 100.0 100.0
62.2 55.9 52.7 .56.3
11.5 11.1 12.0 10.5
4.6 5.5
i-27 55-i 5:9 417
::;E
122 13:3 13.8
Bed size
500-999 beds--------------- 3,856 2,180, 242 22
6-99 beds------------------ 100.0 51.9 10.8 5.5 11.1100-199 beds-------------- 100.0 56.3 11.7 ;::: g-32 6.0 12.0200-299 beds---------- 100.0 60.0 11.7 5.6 5:3300-499 beds--------------- 100.0 56.6 11.0 5-z 192::.500-999 beds---------- 100.0 56.5 12.3 E z-2 11.9 1,000 beds or more--------- 100.0 80.8 5.6 1:9 2:5 2; 2.9
17

Table 4. Total charges and percent distribution for discharges from short-stay hospita,@bytype of hospital service, according to geographic region and 'bed size of hospital: United States, 1968-70-Con.
[ExcludesFederalhospitals,deliveries,andnewbominfan~]
Room Operating Pro- Other,Geogra$csfr~ion and All and Laboratory Pharmacy Radiology r~$$y fessional servicesdischarges care servicesroom
1969 0 Charge inmillions of dollars
All hospitals------- 15,548 9,072 1,749 1,073 835 966 188 1,557
\ Region
Northeast----------------- 4,515 2,841 527 215 252 254 343 North Central------------- 4,834 2,727 549 360 260 311 t3 590
West---------------------- 2,370 1,418 237 147 114 173 28 2%
Bed size
6-99 beds-----------------100-199 beds------------200-299 beds------------300-499 be&-----------=,,,O-999 beds--------------1,000 beds or more--------
2,0322,4872,3475,7192,476
488
215 221 118 208 145
t97: 123 625 :;:: 300 318 131
31 11 %
:g
404 159
12
1 Ei 23
3: 14
239 277 220 628 279
21
Percent distribution
All hospitals------- 100.0 11.2 6.9 5.4 6.2 1.2 10.0
South--------------------- 3,830 2,086 436 351 208 227 40
Region
Northeast----------------- 100.0 62.9 11.7 4.8 1.8 North Central------------- 100.0 56.4 11.4 13.8 South--------------------- 100.0. 54.5 11.4 i:; E 12:6 West---------------------- 100.0 59.8 10.0 . 1:2 10.7
Bed size
6-99 beds----------------- 100.0 55.2 10.6 10.9 11.8 100-199 beds-------------- 100.0 55.8 11.7 8.4 11.1 200-299 beds---------- 100.0 61.1 11.5 9.4 300-499 beds-------------- 100.0 57.9 10.9 65:; 11.0 500-999 beds-------------- 100.0 57.8 12.8 11.3 1,000 beds or more-------- 100.0 79.1 6.4 2: 4.3
/
18

Table 4. Total charges and percent distribution for discharges from short-stay hospitalsbytype of hospital service, according to geographic region and bed size of hospital: United States, 1968-70-Con.
Geogra;;ps;;ion and . -
.- 1968
All hospitals-------
Region
Northeast-----------------North Central-------------South---------------------West----------------------
Bed size
(j-99 beds-----------------100-199 beds--------------200-299 beds--------------300-499 beds--------------500-999 beds--------------1,000 beds or more--------
All hospitals-------
Region
Northeast-----------------North Central-------------South---------------------West----------------------
Bed size
6-99 beds-----------------100-199 beds-------------200-299 beds--------------300-499 beds-----------500-999 beds--------------1,000 beds/or more-------
[ExcludesFederalhospitals,delivedes,andnewbominfants]
Operating Pro- OtherAll Room Laboratory Pharmacy Radiology recovery -fessional servicesdischarges and and/or
kervicescare room
Charge in millions of dollars
966 693 1,322 ==I== 2,351 193 211 219 305
3:3072% 2,377 322 214 247 468 314 177 192 369
,1,937 1% 136 90 138 182
1,082 227 103 214 xz.2:491 1,387 206 139 256
164 250 3,977 i% 25 260 3741,822 1:030 116 120 195
438 336 9 10 34
Percent distribution
100.0 58.8 ii.4 6.0
12.1Ez-t %z 11.4 1oo:o 56:0 11.1100.0 59.6 10.6
100.0 54.8 11.5 10.8100.0 56.6 8.4 10.4100.0 61.7 10.0100.0 2:: 9.4100.0 ii:*2 10.7100.0 76:6 2: 7.9
19
358 459 704 897
202 258
Table 5. Average charge per episode of hospitalization in short-stay hospitals, by sex and age of patient and type of hospital service: United States, 1968-70
[ExcludesFedelalhospitals,deliveries,andnewbominfants]
I I Operating Profes-
Sex and age Laboratory Pharmacy Radiology and/or sional Other recovery services services
1970
Both sexes1 Charge in dollars
All ages----- 693 396 83 52 78
Under 15 years-----15-44 years--------45-64 years--------65 years and over--
403
584;971
218 304 462 588 73
36
220 60
1% 118 119
Male
All ages------- 712 407 89 54 55 111 84
Under 15 years-----15-44 years--------45-64 years--------65 years and over--
392
5s5957 975
222 338 483 570
42
162: 117
22%
36
2";59
1% 124 123
47. 1% 118
Female
All ages------- 678 388 78 48 I 53
Under 15 years-----15-44 yearsi-------45-64 years--------65 years and over--
417 514 802 968
212 282 445602
43
::107
1969
Both sexes' Charge in dollars
All ages----- 622 364 50 89
Under 15 years-----15-44 years--------45-64 years--------65 years and over--
368 483 732887
206 273
22:
Male
All ages------- 640 370
Under 15 years-----15-44 years--------45-64 years--------65 years and over--
376
5:: 876
209 295443 518
~~~ 102 103
21 59 72
52
:: 108
Female
All ages------- 606 359 64
Under 15 years----- 358 202 15-44 years-------- 459 258 45-64 years-------- 704 65 years and over-- 897 E
See footnotes at end of table.
20

Table 5. Average charge per episode of hospitalization in short-stay hospitals, by sex and age of patient and type of hospital service: United States, 1968-7Q-Con.
[ExcludesFederalhospitals,deliveries,andnewbominfants]
All Room Operating Profes- Otherand Laboratory Pharmacy Radiology and/or sionalSex and age discharges care recovery services services
1968
Both sexes?
All ages'----
Under 15 years-----15-44 years--------45-64 years--------65 years and over-
Male
All ages2------
Under 15 years-----15-44 years--------45-64 years-:-----65 years and over-
Female
All ages2------
Under 15 years-----15-44 years--------45-64 years--------65 years and over-
lIncludes sex not stated. 21ncludes age not stated.
Charge in dollars
536 316 65 44 46 76 53 62
298
2%
171 239367
3’59 51
769 475 64
553 322 69 46
303 175 263
::59 371 778 464
522 311 62 46 74
293
2::
166223 362
$8 76; 486 83
36 56
2
56
21

Table 6. Average charge per episode of hospitalization in short-stay .hospitals, by geographic region, bed size of hospital, and type of hospital service: Uhited States, 1968-70
[ExcludesFederalhospitals,detiveries,andnevribominf~ts]
Geographic region and All Room Otherand Laboratory Pharmacy. Radiology recovery services servicesbed size discharges care room
Charge in dollars
All hospitals----- 693 396 63 51 54 105 52 78
Region
Northeast--------------- 888 553 111 71 112 145 North Central----------- 677 379 102South------------------- 548 289 I2 I; $;West-------------------- 737 421 a3 1%
Bed size
h-99 beds--------------- 431 224 49 80100-199 beds------------ 584 329 2200-299 beds----------- 801 97: 1;:300-499 beds------------ 787 t2 91 113 4;500-999 beds------------ 894 506 115 124 58 1,000 beds or more------ 1,289 .,042 203 181 256
1969
All hospitals----- 622 364 74 50 89 49 70
Region
Northeast--------------- 820 519 104 66 North Central-----------South-------------------West--------------------
597 493 655
337 269 397
E 71
g
tied size
h-99 beds--------------- 374 207100-199 beds------------ 497 278 235 200-299 beds------------ 729 54300-499 beds------------ 704 1% 500-999 beds------------ 901 522 2 1,000 beds or more------ 1,029 813 85
All hospitals----- 536 316 65 46 62
Region
Northeast--------------- 433 North Central-----------South-------------------West--------------------
306 238 331
29 49 64
Bed size
h-99 beds--------------- 336 184100-199 beds------------ 266 2:200-299 beds------------ "e:: 396300-499 beds------------ 605 359 25OfJ-999 beds------------ 754 427 61 1,000 beds or more------ a52 654 75
22
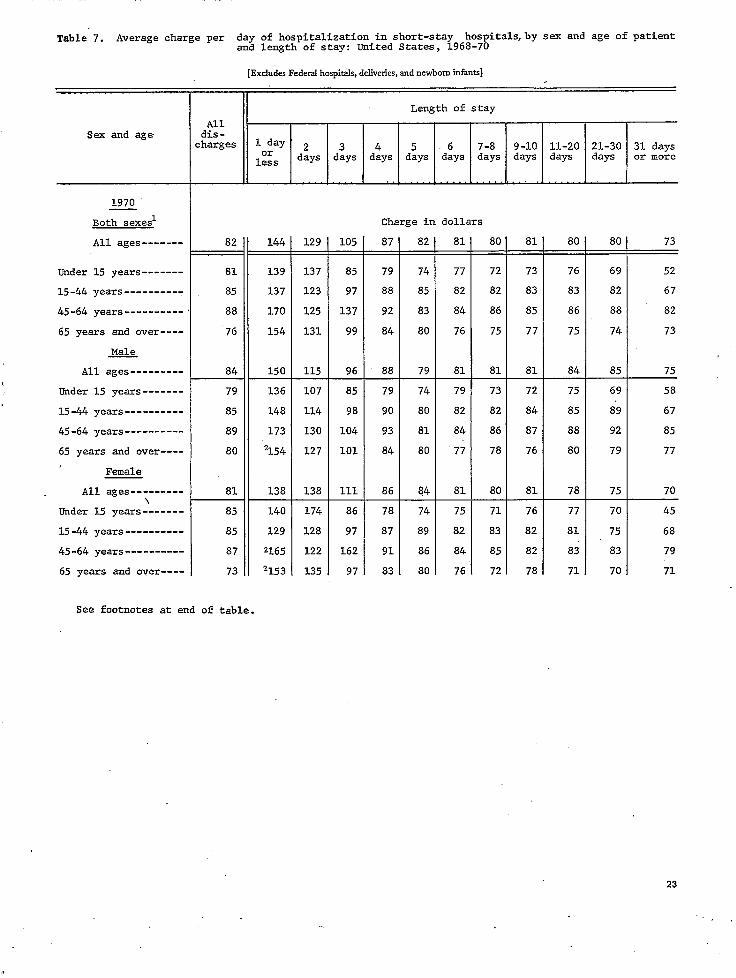
Table 7. Average charge per day of hospitalization in short-stay hospitalqby sex and age of patientand length of stay: United States, 1968-70
[ExcludesFederalhospitals,deliveries,andnewbominfants]
Length of stay All
Sex and age discharges 1dayf2 3 4 5 6 7-8 9-10 11-20 21-30 31 days
ES days days days days 'days days days days days or more
1970
Both sexes.' Charge in dollars
All ages------- 82 144 129 105 87 82 81 80 81 80 80 73
Under 15 years------- 81 139 137 85 79 74 77 72 73 76 69 52
15-44 years---------- 85 137 123 97 88 85 82 82 83 83 82 67
45-64 years---------- 88 170 125 137 92 83 84 86 85 86 88 82
65 years and over---- 76 154 131 99 84 80 76 75 77 75 74 73
m All ages --------- 84 150 115 96 88 79 81 81 81 84 85 75
Under 15 years------- 79 136 107 85 79 74 79 73 72 75 69 58
15-44 years------ 85 148 114 98 90 80 82 82 84 85 89 67
45-64 years---------- 89 173 130 104 93 81 84 86 87 88 92 85
65 years and over---- 80 '2154 127 101 84 80 77 78 76 80 79 77 , Female
All ages ---------\
81 138 138 111 86 84 81 80 81 78 75 70
Under 15 years------- 85 140 174 86 78 74 75 71 76 77 70 45
15-44 years---------- 85 129 128 97 87 89 82 83 82 81 75 68
45-64 years---------- 87 2165 122 162 91 86 84 85 82 83 83 79
65 years and over---- 73 2153 135 97 83 80 76 72 78 71 70 71
See footnotes at end of table.
23

----------
Table 7. Average charge per day of hobpitalization in short-stay hospitalqby sex and age of patientand length of stay: United States, 1968-70-Con.
[ExcludesFederalhospitals,deliveries,andnewborn infants]
Length of stay
Sex and age 2 3
days days ,:.,, ;
1969
Both sexes1 Charge in dollars
All ages------- 70 124 100 86 77 71 72 71 70 69 69 62
Under 15 years------- 71 125 95 75 70 68 66 67 64 66 65 58
15-44 years---------- 75 113 100 87 78 73 75 73 72 72 74 62
45 -64 year- 74 142 108 93 80 71 73 73 72 73 74 68
65 years and over---- 65 136 103 86 75 70 69 66 66 65 66 59
-.Male
All ages--------- i 72 130 100 86 78 69 72 72 70 71 70 66
Under 15 years------- 71 124 95 76 71 67 64 68 64 67 63 61 , I
15-44 years---------- 75 126 103 88 79 70 77 73 74 74 72 65 45-64 years __-_______ 76 2154 107 94 80 68 73 73 72 75 76 74
65 years and over---- 67 2125 104 85 80 71 71 69 68 68 66 62
Female
I All ages--------- 69 118 99 86 76 74 72 70 69 68 69 58
Under 15 years------- 70 127 95 73 67 69 68 64 63 65 68 54
15-44 years---------- 74 104 98 a7 78 76 73 72 71 70 76 58 45-64 years---------- 72 2128 108 92 81 75 73 73 73 71 72 61
\ 65 years and over----- 63 2150 103 - 86 71 69 68 64 63 63 65 57
See footnotes at end of table.
24

----------
Table 7. Average charge per day of hospitalization in short-stay hospitals,by sex and age of patientand length of stay: United States, 1968-70-Con.
[ExcludesFederalhospitals, deliieries, and newborn infants]
Length of stay All
Sex and&age dis-charges lday 2 3 4 5 6 7-8 9-10 11-20 21-30 31 days
days days days days days days days' days days
1968
* . Both sexes1
All ages3------
'Under 15 years-------15-44 years----------
45-64 years----------
65 years and over----
yj3& . All ages3--------
Under 15 years-------
15-44 years----------
45-64 years----------
65 years and over----
Female
All ages3--------
Under 15 years-------
15-44 years----------45-64 year-
65 years and over----
1:;s or more
Charge in dollars
61 111 87 73 68 62 63 61 61 61 59 53 E
61 107 84 65 59 57 56 56 54 57 49 52
65 100 87 73 70 63 64 63 65 63 61 56
64 128 92 78 72 63 66 - 63 63 64 64 58
56 140 91 73 65 62 61 59 57 57 57 49
62 116 86 73 68 61 63 61 61 63 61 55
60 107 84 64 60 58 56 55 53 57 46 51
66 108 87 74 70 62 65 62 66 64 63 61
64 2136 90 78 72 60 65 62 64 67 65 55
59 2136 88 75 70 63 62 62 57 60 60 53
60 106 88 73 67 63 63 61 61 59 57 51
62 106 85 67 58 56 56 57 56 57 53 53
65 94 87 73 71 64 64 63 64 63 60 51
64 2119. 94 78 71 65 67 63 63 62 63 60
53 2145 94 72 61 61 59 57 56 55 54 47
%cludes sex not stated. Waution shouldbeexercised in the use of this figure since the relative standard error of the esti
mated days of care exceeds 25 percent.aIncludes age not stated.
25

Table 8. Average charge per day of' hospitalization in short-stay hospitals,bylength of stay: United States, 1968-70
geographic region, bed size of hospital, and
[ExcludesFederalhospitals,deliveries,andnewborninfants]
Length of stay Geographic region and All'
bed size iischarges .; ;;z, 2 days 3 days 4 days 5 days 6 days ;,;, _. 9-10 11-20 21-30 31 days
days days days or more
Charge in dollars
All hospitals--- 82 105 81 80 81 80 80
Region Northeast-------------North Central---------South-----------------West------------------
Bed size 6-99 beds--------100-199 beds----------200-299 beds----------300-499 beds----------500-999 beds----------1,000 beds or more----
1969 All hospitals---
Region Northeast-------------North Central---------South-----------------West------------------
Bed size 6-99 beds- ---_-----_-100-199 beds----------2,,,,-2gg'l,e& --_-------300-499 beds----------500-999 beds----------1,000 beds or more----
All hospitals---
Region Northeast-------------North Central--------south-----------------West_--_---__-__-____-
Bed size 6-99 be& _-______--__-loo-199 beds----------200-299 beds----------300-499 beds----------500-999 beds----------1,000 beds or more----
2: ::i 113
i: 121 127 z: 69 156 151 167 91
118 156 62 46129 100 ii
1154 130 109 ;?I 2 163 129 142 86 175 12: 110 91 i2* * '115 98
124 72 62
140 124109130
1:: 2136 111 145 111
I162 118* *
87
124 61108
:: 129: 57
1:;128129
* *
1Caution should be exercised in the use of this figure since the relative standard error of the~estimated days of care ex-weds 25 percent.
26 ,, ”
<I /
,’

----------
-------
Table 9. Total days of care in short-stay- hospitals,by sex and age of patient and length of stay: United States, 1968-70
[Exclud.zFederalhospit~,dclivedcr,andncwbominEants~
Length of stay Allsex and age discharges I.; ;:z, 2 days 3 da+ 4 days 5 days 6 days 7-8 9-10 n-20 21-30 31 days
days days days days or more
1970 Both sexes1 All ages-------- 215,101 2,607 7,469 7,997 8,689 -0,135 9,677 .1,068 L7,945 57,946 28,697 42,870
- - -Under 15 years-------- 20,550 791 2,299 1,601 1,437 1,612 1,124 2,255 1,477 3,467 1,419 3,069 15-44 years-------- 57,096 1,154 4,158 3,435 3,541 3,872 3,423 7,214 5,040 13,010 5,259 7,991 45-64 year.------ 62,719 405 1,353 1,915 2,342 2,673 2,870 6,186 6,078 19,177 8,639 11,082 65 years and over----- 74,735 2258 659 1,046 1,369 1,978 2,260 5,413 5,351 22,293 13,381 20,729
-Male All ages _---___-_- 97,835 1,208 3.186 3.541 3.886 5.034 4.403 9.246 7.891 25,889 13,957 19,595
Under 15 years-------- 11,534 415 1,253 918 848 954 625 1,320 863 1,992 787 1,559 15-44 yea-fs------ 24,247 428 1,028 1,302 1,319 1,781 1,440 2,696 1,925 5,458 2,535 4,334 45-64 years------ 29,827 2229 563 807 1,079 1,434 1,403 2,726 2,588 9,013 4,508 5,478 65 years and over----- 32,228 2135 342 514 639 865 936 2,504 2,516 9,427 6,126 8,224
Female All ages 116,980 1,393 4,274 4,446 4,792 5,079 5,271 .1,793 10,013 31,985 14,683 23,251
Under 15 years-------- 8,978 373 1,044 682 587 650 500 935 614 1,475 631 1,486 15-44 year------- 32,742 724 2,126 2,131 2,214 2,077 1,984 4,498 3,090 7,537 2,705 3,657 45-64 years------ 32,840 2174 787 1,101 1,262 1,239 1,467 3,457 3,474 10,156 4,120 5,604 65 years and over----- 42,421 2122 317 532 730 1,113 1,321 2,903 2,835 12,817 7,225 12,505
1969
Both sexes1
All ages-------- 220,835 2,494 7,202 7,670 8,458 9,841 9,610 0,263 -7,186 56,803 29,962 51,346
Under 15 years-------- 21,758 828 2,260 1,497 1,394 1,466 1,414 2,127 1,400 3,649 1,902 3,820 15-44 years------ 55,471 1,033 2,966 3,436 3,530 3,755 3,422 6,944 5,149 12,477 4,658 8,102 45-64 yea*s------ 64,955 381 1,357 1,801 2,056 2,793 2,732 6,081 5,839 18,495 8,939 14,481 65 years and over----- 78,651 *252 618 937 1,478 1,827 2,042 5,110 4,799 22,182 L4,463 24,944
& All ages-- 102,296 1.241 3,168 3.232 3.951 4.943 4,591 9.175 7,574 26,419 L3,610 24,392
Under 15 years-------- 12,256 459 1,224 812 813 767 825 1,201 763 2,267 1,210 1,916 15-44 years------ 23,436 433 1,005 1,164 1,471 1,788 1,437 2,735 1,920 5,120 2,115 4,247 45-64 yea-fs--d--- 31,506 2206 631 781 942 1,485 1,393 2,821 2,620 8,766 4,266 6,020 65 years and over----- 35,098 '142 308 475 726 903 936 2,417 2,271 10,266 6,020 10,635
Female *11 ages----- 118,261 1,250 4,028 4,426 4,508 4,895 5,010 1,059 9,593 30,274 16,276 26,943
Under 15 years-------- 9,459 367 1,035 683 582 699 589 922 637 1,370 675 1,899 15-& yelps------ 31,951 598 1,959 2,266 2,060 1,964 1,982 4,204 3,213 7,354 2,498 3,855 45-64 ye.qrs-------- 33,410 2174 726 1,017 1,114 1,308 1,339 3,251 3,219 9,708 4,673 6,880 65 years and over----- 43,442 * 309 460 752 924 1,100 2,682 2,524 11,841 8,430 14,308
See footnotes at end of table.
27
-------
Table 9. Total days ofcare in short-stay hospitals,by sex and age of patient and length of stay: United States, 1968-70-&n.
hospitals,[Excludes Federal dcliverics, and newborn infants]
Length of stay AllSex and age discharges
,,; f;g, 2 days 3 days 4 days 5 days 6 days ;,;, 9-10' n-20 21-30 31 daysdays days days or more
1968
Both sexes1 Number in thousands All ages" --_---- 215.465 2.610 6.940 7.512 8.304 9.563 9.289 19.788 17.432 50,722
Under 15 years 20,077 867 2,228 1,367 1,477 1,459 1,192 2,136 1,425 2,687 15-44 years---------- 53,986 1,069 2,831 3,375 3,344 3,536 3,276 6,532 5,397 8,195 45-64 years----------- 62,914 403 1,280 1,773 2,131 2,700 2,703 6,051 5,478 13,746 65 years and over----- 78,438 2271 600 996 1,350 1,869 2,118 5,061 5,128 26,095
Male All ages3 --------- 100,811 3.008 3,302 3.906 4.348 7,597 -23,776
Under 15 years--------15-44 years----------
11,513
23,112 487
450
1,183
966
801
1,237
802 824 652 1,419 1,567 1,325
1,264 2,597
797 1,979
1,738 4,251
i
45-64 years __-----_--_ 31,534 '227 560 792 1,052 1,463 1,396 2,908 2,513 7,325 65 years and over----- 34,617 2150 298 470 631 896 975 2,281 2,305 10,462
Female All ages3 --------- 114,136 1,292 3,907 4,195 4,908 9,812 26,825
Under 15 years-------- 8,523 378 1,039 562 663 634 531 863 628 949 15-44 years---------- 30,783 619 1,856 2,132 1,920 1,969 1,946 3,915 3,411 3,938 45-64 years __-------_- 31,182 2176 714 977 1,077 1,226 1,302 3,138 2,965 6,344 65 years and over----- 43,633 2120 298 525 712 967 1,129 2,761 2,808 15,594
'Includes sex not stated. *Caution should be exercised in the use of this figure since the relative standard error of the estimated days of care ex
ceeds 25 percent.31ncludes age not stated.
28
geographic region, bed size of hospital, and length pf stay: UnitedTable 10. Total days of care in shprt-stay- hospitals,by States, 1968-70
[ExcludesFcderalhospitals,dcliverics,andncwbominfanu]
Length of stay All
diischarges I.; ;z;, 2 days 3 days 4 days 5 days 6 days J-8 9-10 11-20 21-30 31 daysdays days days days - or nmre
B.zQ Number in thousands
All hospitals---I
215,101 2,607 7,469 7,997 8,689 Lo,135 9,677 21,068 17,945 57,946 28,697 42.870
Northeast------------- 503 1,384 1,622 2,378 14,287. North Central--------- 2,519 2,825 :31:: 1;s;;;South----------------- % 2,392 3,034 x’l; 161319 West------------------ 565 1,175 1,209 1:370 6,970 5:650
Bed size 6-99 beds----------- 37,513 753 1,729 2,679 2 350 2,826 ;a; 4,119 3,27E 8,486 6,210 100-199 beds----------
42t:z 1;;: 1,:;; 1,689 %$a~ 2,038 4,810 12,005 6,179
200-299 beds---------- 860 1,015 ‘962 2,397 8,004 5,233 300-499 beds---------- 62: 128 599 2,038 2,159 2,112 2,704 2,763 5,717 16,874 13,510500-999 beds---------- 4;,p; 361 1,150 1,125
* 1,393
* 1,451
* 1,511
4 3 3;:; 11,366 9,961
1,000 beds or more---- , * * 1,012 635 1,776
All hospitals--- 220,835 2.494 7,202 7,670 8.458 9,841 9,610 20,263 17,186 56.803 29,962 51,346L
Region Northeast-------------
% 4% 1,468 1,520 2,282 1,991 15,740 9,464 3ENorth Central--------- x:9’ 2,656 3,029 18,720
$,&h ___--_------ _---- 62:664 712 21334 x: 2,978 3,227 x% 1; >;9" x72: 12:354Nest------------------ 29,355 561 1,172 1:118 1,304 1,303 (383 I 3:599 8,098
Bed size 6-99 be&------- 39,288 764 1,601 1,969 2,069 2,819 2,193 4,037 3,003 8,334 4,135 8,365 . 100-199 beds---------- 541 1,586 1,505 1,711 1,933 2,067 10,661200-299 beds-.--------- 22f: 1289 820 919 1,042 1,108 1,178 2”;:; 8,692 %95 % 300-499 beds---------- 75:509 633 2,;;; 2,475 2,716 2,922 3,;;; 5:932 19,939 LO:723 18:042
7,994 4,735 8,716500-999 beds---------- 3;,501; * x * 674
* 765
4 885
* * 2~~~ 1,181 784 2,1051,000 beds or more---- ,
p&3 All hospitals--- 215,465 2,610 6,940 7,512 8,304 9,563 9,289 19.788 17.432 54.490 28.814 50,722
Region Northeast------------- 1,217 1,400 1,489 2,220 1,933 4,214 15,003 :;>;;;North Central--------- 56”: 2,203 2,287 2,683 2,937 South----------------- 750 2,323 2,697 2,973 3,119 m :% 3E 12:851
West -----m-------m--- - 586 1,196 1,128 1,159 1,288 1:273 2;134 61101 6,087
Bed size 6-99 beds- ---_-----_- 42,333 876 1,777 2,051 2,255 3,474 9,283 9,168 loo-199 beds---------- 42,587 1,557 1,734 %Z 1% 7,630200-299 beds---------- 37,744 :;9” :2:; 1,268 ;:;;t 1:394 10,139300-499 beds---------- 61,213 527 1::;; xx 2,106 2,439 1y;;500-999 beds---------- 25,421 * ‘602
4 770
x '758
* 838
1,000 beds or more---- 6,166 * * * 2:571
'Caution should be exercised in the use of this figure since the relative standard error of the estimated days of care exceeds 25 percent.
”
1(
f
29
i
APPENDIX I s
TECHNICAL NOTES ON METHODS ;
Statistical Design of the Hospital Discharge Survey
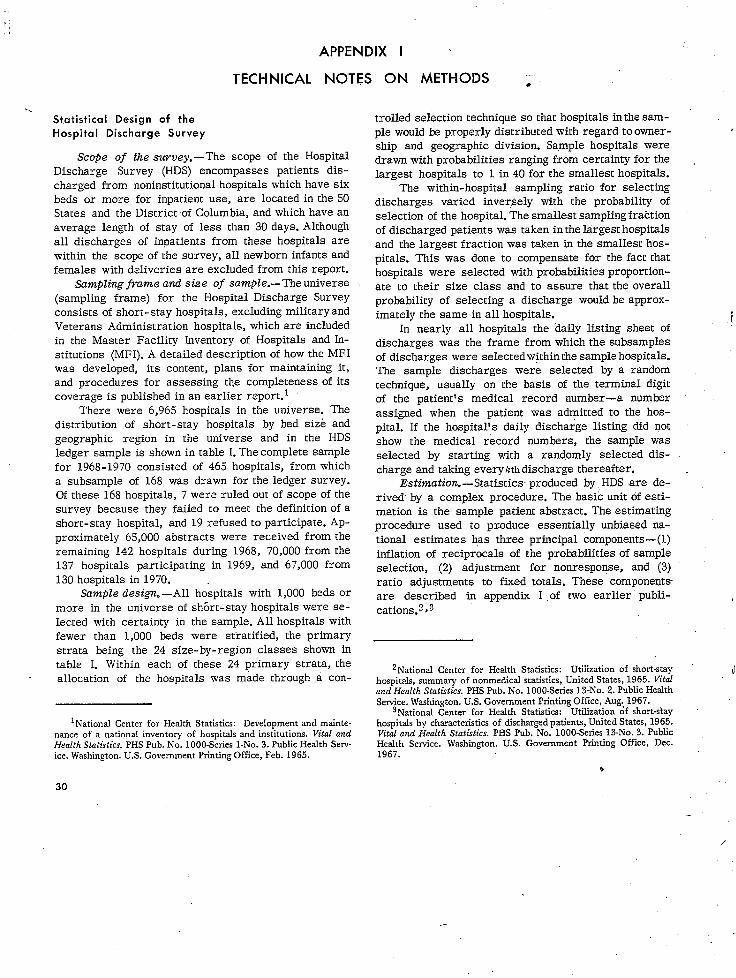
Scope of the survey.-The scope of the Hospital Discharge Survey (HDS) encompasses patients discharged from noninstitutional hospitals which have six beds or more for inpatient use, are located in the 50 States and the District of Columbia, and which have an average length of stay of less than 30 days. Although all discharges of inpatients from these hospitals are within the scope of the survey, all newborn infants and females with deliveries are excluded from this report.
Sampling frame and size of sample.-The universe (sampling frame) for the Hospital Discharge Survey consists of short-stay hospitals, excluding military and Veterans Administration hospitals, which are included in the Master Facility Inventory of Hospitals and Institutions (MFI). A detailed description of how the MFI was developed, its content, plans for maintaining it, and procedures for assessing the completeness of its coverage is published in an earlier rep0rt.t
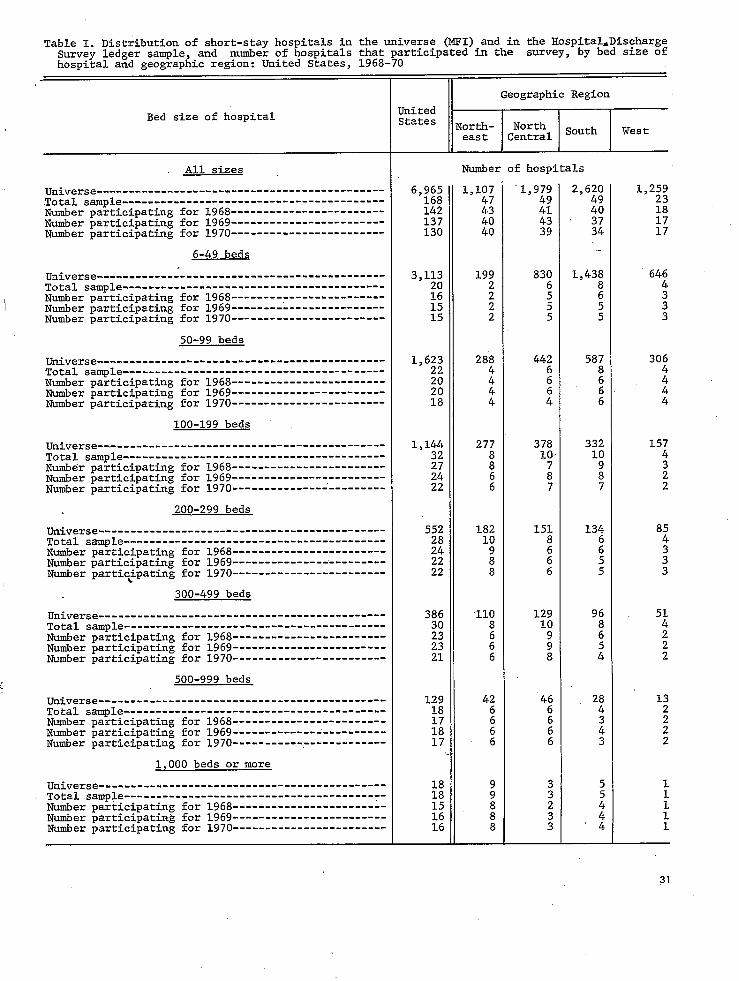
There were 6,965 hospitals in the universe. The distribution of short-stay hospitals by bed size and geographic region in the universe and in the HDS ledger sample is shown in table I. The complete sample for 1968-1970 consisted of 465 hospitals, from which a subsample of 168 was drawn for the ledger survey. Of these 168 hospitals, 7 were ruled out of scope of the survey because they failed to meet the definition of a short-stay hospital, and 19 refused to participate. Approximately 65,000 abstracts were received from the remaining 142 hospitals during 1968, 70,000 from the 137 hospitals participating in, 1969, and 67,000 from 130 hospitals in 1970.
Sample de.&%,--All hospitals with 1,000 beds or more in the universe of short-stay hospitals were selected with certainty in the sample. All hospitals with fewer than 1,000 beds were stratified, the primary strata being the 24 size-by-region classes shown in table I. Within each of these 24 primary strata, the allocation of the hospitais was made through a con
lNational Center for Health Statistics: Development and maintenance of a national inventory of hospitals and institutions. Vital and Health Statistics. PHS Pub. No. 1000~Series l-No. 3. Public Health Sew ice. Washington. U.S. Government Printing Office, Feb. 1965.
30
trolled selection technique so that hospitals inthe Sample would be properly distributed with regard to owner- ,
ship and geographic division. Sample hospitals were drawn with probabilities ranging from certainty for the largest hospitals to 1 in 40 for the smallest hospitals.
The within-hospital sampling ratio for selecting discharges varied inversely with the probability of selection of the hospital. The smallest sampling fraction of discharged patients was taken in the largest hospitals and the largest fraction was taken in the smallest hospitals. This was done to compensate for the fact that hospitals were selected with probabilities proportion-ate to their size class and to assure that the overall probability of selecting a discharge would be approximately the same in all hospitals.
In nearly all hospitals the daily listing sheet of discharges was the frame from which the subsamples of discharges were selected within the sample hospitals. The sample discharges were selected by a random technique, usually on the basis of the terminal digit of the patient’s medical record number-a number assigned when the patient was admitted to the hospital. If the hospital’s daily discharge listing did not show the medical record numbers, the sample was selected by starting with a randomly selected discharge and taking everykthdischarge thereafter.
Estimation .-Statistics, produced by HDS are de-rived’ by a complex procedure. The basic unit of estimation is the sample patient abstract. The estimating procedure used to produce tional estimates has three inflation of reciprocals of selection, (2) adjustment ratio adjustments to fixed are described in appendix cations.s>3
essentially unbiased naprincipal components-(l)
the probabilities of sample for nonresponse, and (3) totals. These components
I of two earlier publi
*National Center for Health Statistics: Utilization of short-stay hospitals, summary of nonmedical statistics, United States, 1965. lrital andHealth Statistics. PHS Pub. No. 1000~Series 13-No. 2. Public Health Service. Washington. U.S. Government Printing Office, Aug. 1967.
3National Center for Health Statistics: Utilization df short-stay hospitals by characteristics of discharged patients, United States, 1965. V&al and Health Statistics. PHS Pub. No. lOOO-Series 13-N& 3. Public Health Service. Washiigton. U.S. Government Printing Office, Dec. 1967.
D
--------
Table I. Distribution of short-stay hospitals in the universe (MFI) and in the Hospital,DischargeSurvey ledger sample, and number of hospitals that participated in the survey, by bed size of hospital and geographic region: United States, 1968-70
Geographic Region
Bed size of hospital United States
All sizes Number of hospitals
Universe--------------------------------------------,T’tal sample----------------------------------------- 6,;;; 1,225; Number participating for 1968------------------------ 142 Number participating for 1969------------------------ 137 :;Number participating for 1970------------------------ 130 17
6-49 beds
Universe--------------------------------------------- 3,113 199 830 1,438 646
I Number participating for 1968--------F---------------Nuder participating for 1969------------------------Nuder participating for 1970------------------------
E
E
;
; : 5
65 5
i
z
50-99 beds
Universe---------------------------------------------Total sample ---------_-----------------------Number participating for 1968------------------------Number participating for 1969------------------------Number participating for 1970------------------------
---m--m-1,623
22
2 18
288
:
::
44z 6
:
587 8
ii 6
306
2
::
loo-199 beds
Total sample ___------_--------______________________- 6 8
Universe---------------------------------------------Total sample _-------_---------_--------------Numb&r participating for 1968------------------------Number participating for 1969---------r--------------Number participating for 1970------------------------
378ia
ii 7
332 10
z 7
157 4
4 2
-.200-299 beds
Universe------------------------------------ ----m-m--Total sample-----------------------------------------Number participating for 1968------------------------Number participating for 1969------------------------
'E 24 22
182 10
:
151
: 13::
!
85 4
z Number partic>pating for 1970------------------------ 22 8 z 5 3
300-499 beds
Universe---------------------------------------------Total sample----------------------------------------- 386 ,110
8 129 51
430 10 Number participating for 1968------------------------ 2 Number participating for 1969------------------------ t: 2 ;Number participating for 1970------------------------ 21 6 8 f
, 500-999 beds
Universe--------------------------------------------- 129 46 28 13 Total sample----------------------------------------- 18 ": 4
Number participating for 1969------------------------Nuder participating for 1970------------------------
2 17
: 6
6 6
2 3
2 2
1,000 beds or more
Universe---------------------------------------------Tot-1 sample---------------------------------------~-
5 5
1
Number participating for 1968------------------------Number participating for 1969------------------------Number participating for 1970------------------------ t
4
:: 1 1
Number participating for 1968------------------------ z I
31
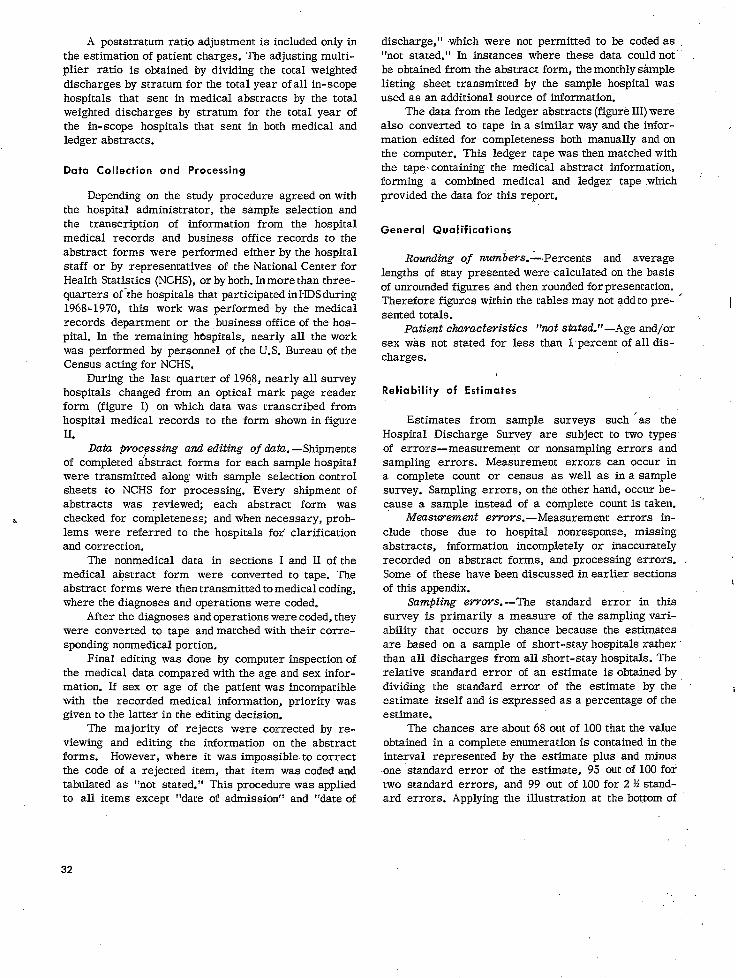
A poststratum ratio adjustment is included only in the estimation of patient charges. The adjusting multiplier ratio is obtained by dividing the total weighted discharges by stratum for the total year of all in-scope hospitals that sent in medical abstracts by the total weighted discharges by stratum for the total year of the in-scope hospitals that sent in both medical and ledger abstracts.
Data Collection and Processing
Depending on the study procedure agreed on with the hospital administrator, the sample selection and the transcription of information from the hospital medical records and business office records to the abstract forms were performed either by the hospital staff or by representatives of the National Center for Health Statistics (NCHS), or by both. In more than three-quarters of -the hospitals that participated in HDS during 1968-1970, this work was performed by the medical records department or the business office of the hospital. In the remaining Wspitals, nearly all the work was performed by personnel of the U.S. Bureau of the Census acting for NCHS.
During the last quarter of 1968, nearly all survey hospitals changed from an optical mark page reader form (figure I) on which data was transcribed from hospital medical records to the form shown in figure II.
Data pYoc/essi~ and editing of dot&-Shipments of completed abstract forms for each sample hospital were transmitted along with sample selection control sheets to NCHS for processing. Every shipment of abstracts was reviewed; each abstract form was checked for completeness; and when necessary, problems were referred to the hospitals for clarification and correction.
The nonmedical data in sections I and II of the medical abstract form were converted to tape. The abstract forms were then transmitted to medical coding, where the diagnoses and operations were coded.
After the diagnoses and operations were coded, they were converted to tape and matched with their corresponding nonmedical portion.
Final editing was done by computer inspection of the medical data compared with the age and sex information. If sex or age of the patient was incompatible with the recorded medical information, priority was given to the latter in the editing decision.
The majority of rejects were corrected by re-viewing and editing the information on the abstract forms. However, where it was impossible.to correct the code of a rejected item, that item was coded and tabulated as “not stated . ” This procedure was applied to all items except “date of admission” and “date of
discharge, I’ ,which were not permitted to be coded as “not stated.” In instances where these data could not be obtained from the abstract form, the monthly sample listing sheet transmitted by the sample hospital was used as an additional source of information.
The data from the ledger abstracts (figure III) were also converted to tape in a similar way and the information edited for completeness both manually and on the computer. This ledger tape was then matched with the tape.containing the medical abstract information, forming a combined medical and ledger tape .which ’ provided the data for this report.
General Qualifications
Rounding of numbevs.i.Percents and average lengths of stay presented were-calculated on the basis of unrounded figures and then rounded for presentation. Therefore figures within the tables may not add to pre- ’ sented totals.
Patient characteristics “‘not stated.“-Age and/or sex was not stated for less than 1 percent of all discharges.
Reliability of Estimates
Estimates from sample surveys such ‘as the Hospital Discharge Survey are subject to two types of errors-measurement or nonsampling errors and sampling errors. Measurement errors can occur in a complete count or census as well as in a sample survey. Sampling errors, on the other hand, occur be-cause a sample instead of a complete count is taken.
Measurement errors.-Measurement errors include those due to hospital nonresponse, missing abstracts, information incompletely or inaccurately recorded on abstract forms, and processing errors. Some of these have been discussed in earlier sections of this appendix.
Sampling errors.--The standard error in this survey is primarily a measure of the sampling variability that occurs by chance because the estimates are based on a sample of short-stay hospitals rather than all discharges from all short-stay hospitals. The relative standard error of an estimate is obtained by dividing the standard error of the estimate by the estimate itself and is expressed as a percentage of the estimate.
The chances are about 68 out of 100 that the value obtained in a complete enumeration is contained in the interval represented by the estimate plus and minus .one ‘standard error of the estimate, 95 out of 100 for two standard errors, and 99 out of 100 for 2 % standard errors. Applying the illustration at the bottom of
32

__-__ _-_--
CONFIDENTIAL-AUinformation which would permit identification of an individual by persons engaged in and for the purposes of the survey and will not be purpose (22 FR 1687).
DEPARTMENT OF
HEALTH. EDUCATION. AND WELFARE PHS4734.2 PUBLIC HEALTH SERVICE REV. II+5
NATlONAL CENTER FOR HEALTH STATISTICS
ABSTRACTOF PATIENT RECORD-Hospital Discharge Survey ’ _--- _-__ -__- •~=: _____ --__ TI-- ~I~ -_--_________--_---- --_-- --__ _--
2. HDS NUMBER
3. MEDICAL RECORD NUMBER
4.a. DATE OF BIRTH
Complete 4b and 4c if
date of biith is not given.
4.b. AGE
4.~. AGE IS STATED IN
5. SEX
6. RACE OR COLOR
7. MARITAL STATUS
8. DATE OF ADMISSION
9. DATE OF DISCHARGE
ID. DISCHARGE STATUS
Figure I. Abstract of patient record.
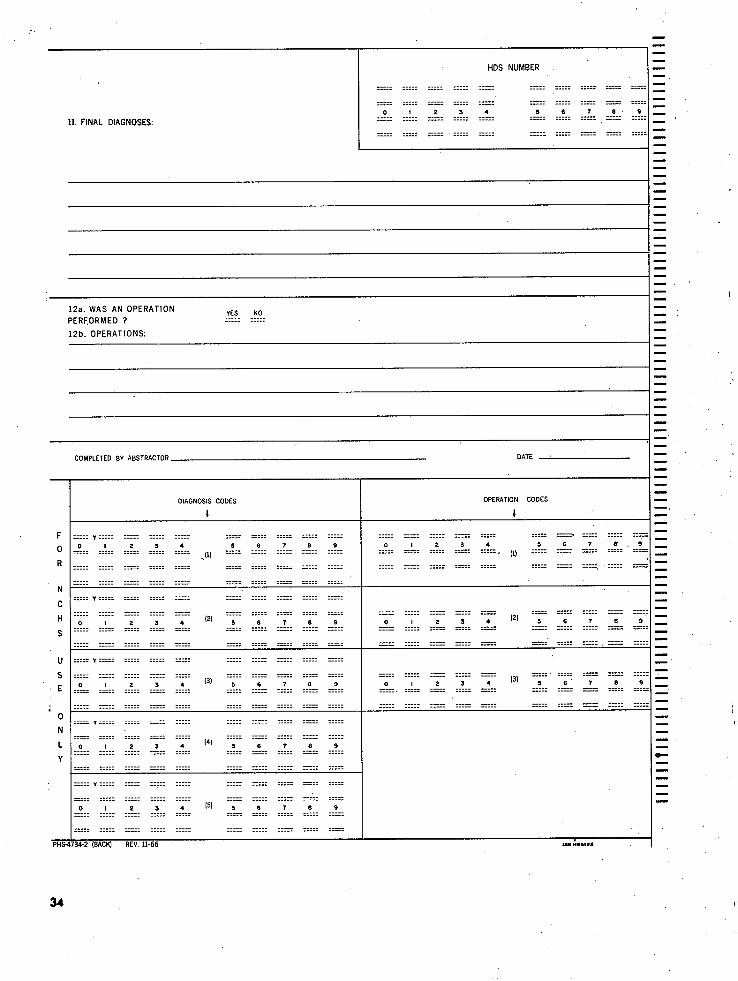
11. FINAL DIAGNOSES:
-
-
-. ’
I 12a. WAS AN OPERATION YES NO PERFORMED 7 ______.___ ___. ____._
12b. OPERATIONS: -
/
-’
COMPLETED BY ABSTFXTOR DATE
-I
OPERATION CODES -,
:;
::
::
::
:: -::
U
S ::
E :z
:: I b
-.
4c
I
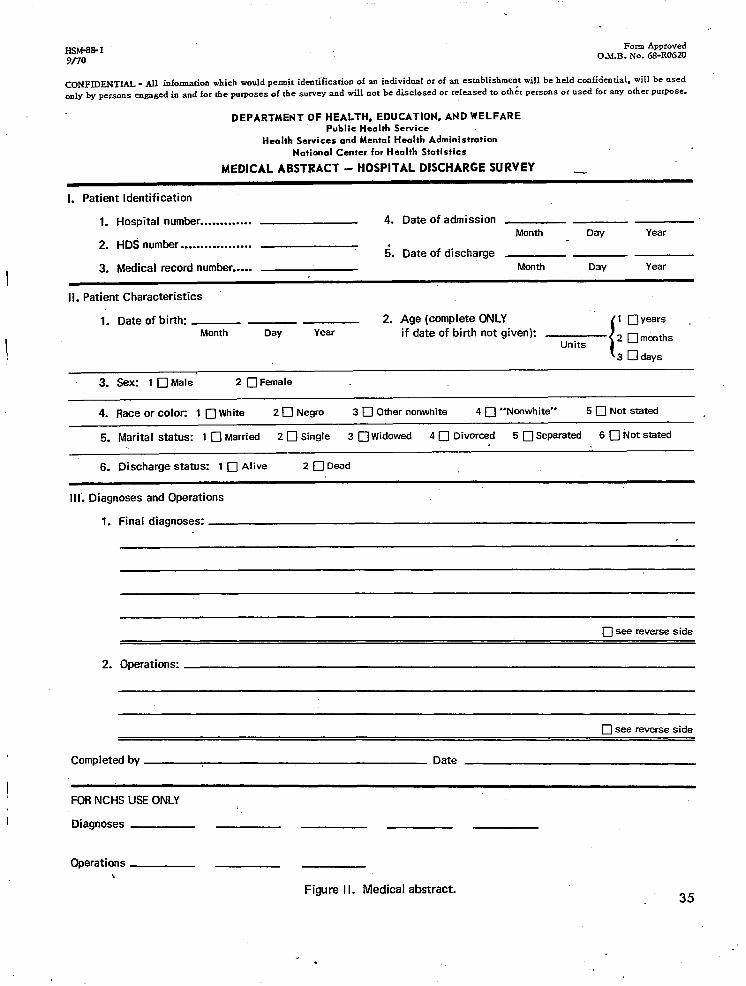
Hshess- 1 Form Approved O.M.B. No. 68-ROGZO9/70
CONFIDENTIAL - All infomation which would permjt idenr~fication of an individual or of an establishmen: will be held confidential. will be used only by persons en-aged in and for rhe purposes of the survey and will nor be disclosed or released to other personaor used for any other pufpos~.
DEPARTMEHT OF HEALTH, EDUCATION, AND WELFARE Public Health Service
Health Services and Mental Health Administration National Center for Health Statistics
MEDICAL ABSTRACT - HOSPITAL DISCHARGE SURVEY _
1. Patient Identification
1. Hospital number . . . . . . . . . . . . . 4. Date of admission Month Day Year
2. HDS number . . . . . . . . . . . . . . . . . . 5. Date of discharge
3. Medical record number..... MOnth 03~ Year
II. Patient Characteristics
1. Date of birth: 2. .Age (complete ONLY 1 q Ye=S , Month Day Year if date of birth not given):
Units 2 q months
t 3 0 days
3. Sex: 1 0 Male 2 aFemale
4. Race or color: 1 0 White 2 0 Negro 3 q Other nonwhite 4 0 “Nonwhite” 5 q Not stated
5. Marital status: 1 0 Married 2 0 Single 3 0 Widowed 4 0 Divorced 5 q Separated 6 j-J iot stated
6. Discharge status: 1 0 Alive 2 0 Dead
III’. Diagnoses and Operations
1. Final diagnoses:
n see reverse side
2. Operations:
0 see reverse side
Completed by Date
FOR NCHS USE ONLY ‘_
Diagnoses
Operations\
Figure I I. Medical abstract.

-- ------ -- ------ ^ . .. . - rr--.-7 ---o-- _.--
CONFIDENTIAL - All information which would permit identification of an individual or an establishment will be held confidential vi11 be used only by persons en
5 aged in and for the purposes of the survey and will not be disclosed or released to other persons~
lsed for.,any other purpose, (22 R 1687).
yi&‘533~,17
DEPARTMENT OF HEALTH, EDUCATION, AND WELFARE PUBLIC HEALTH SERVICE ,
NATIONAL CENTER FOR HEALTH STATISTICS
LEDGER ABSTRACT -.HOSPITAL DISCHARGE SURVEY
. PATIENT IDENTIFICATION
1. Hospital number . . . . . . .
2. HDS number . . . . . . . . . . 4. Date of admission - - - - * * /
Dollars Cents
14. Health insurance 6. Room and care . . . . . . . .
A. Blue Cross/Blue Shield . 7. Laboratory . . . . . . . . . .
B. Commercial Insurance . . . 8. Pharmacy . . . . . . . . . . .
C. Other Health Plans.,. . . . 9. Radiology . . . . . . . . . . .
15. Patient responsibility . . . . . 10. Operating, delivery,
and/or recovery room . . .
11. Professional fees . . . . . 17. Welfare and Medicaid . . . . . .
12. All other charges . . . . . . ,18. Other (specify in notes) . . . . . .
1’3. TOTAL CHARGES. . . . . . (If total does not equal item 13, explain difference in notes) . . .
,
es-
Qotes
Completed by abstracter Date
Figure I I I. Ledger abstract. i
36

Figure IV. Approximate relative standard errors of estimated numbers of patients discharged for patient characteristics (including type of charge) by geographic region and sizt of hospital, and for all hospitals
IO 100 l.ooO 10,000 30,ooo
SIZE OF ESTIMATE IN THOUSANDS
Illustration of use of figure IV: As shown in table 1, an estimated 2,164,OOO male patients under 15 years had a laboratory charge in 1966. The relative standard error of this estimate as read from the line “All hospitals” isapproximately 3.3 percent: the standard error of 2,164,OOO is 71,412 (3.3 percent of 2,164,ODO).
figure IV, the chances are about 68 out of 100 that the ing with which the patient characteristic(s) is cross- value that would be obtained in a complete enumeration classified. The procedures that apply are as follows: is contained in the interval 2J64.000 + 3.3 percent of 2,164,000 (between 2,093,OOO and 2,235,000), 95 out of 1. Estimated numbers of discharges: Approximate 100 for the interval 2,164,OOO -+ 3.3 percent of 2,164,OOO relative standard errors of estimated numbers multiplied by 2, and 99 out of 100 for the interval of discharges are obtained from the curves 2,164,OOO f 3.3 percent of 2,164,OOO multiplied by 2.5. shown in figure IV.
The standard error of one statistic is generally different from that of another, even when the two come 2. Estimated amount of charges: Approximate
from the same survey. In order to derive standard relative standard errors of estimated amount
errors that would be applicable to a wide variety of of charges are obtained from the curves shown
statistics and that could be prepared at a moderate in figure V.
cost, a number of approximations are required. As a 3. Estimated numbers of days of care: Approxresult, f igures IV, V, and VI and tables II and III pro- imate relative standard errors of estimated vide general standard errors for a wide variety of numbers of days of care are obtained from the estimates rather than the specific error for a parti- curves shown in figure VI. cular statistic.
The relative standard errors and approximate 4. Estimated percentages of discharges in a per-cent distribution: Approximate standard errorsstandard errors of percentages that have been pre- of estimated percentages of discharges whenpared for this report are applicable to estimates of the characteristic(s) used to form the numer discharges, charges, and days of care for patient char- ator is a subclass of the denominator are shown acteristics (age, sex, and the cross-classification age in table II.by sex and type of charge) cross-classified by one of
three hospital groupings as follows: (1) by region (e.g., 5. Estimated percentages of charges in a percent South), (2) by bed size (e.g., 100-199 beds), or (3) by distribution: Approximate standard errors of hospitals summed over all regions and all size groups. estimated percentages of charges when the The particular figure or table to which one refers to characteristic(s) used to form the numerator obtain a sampling error is contingent upon both the is a subclass of the denominator are shown in type of estimate (e.g., charges) and the hospital group- table III.
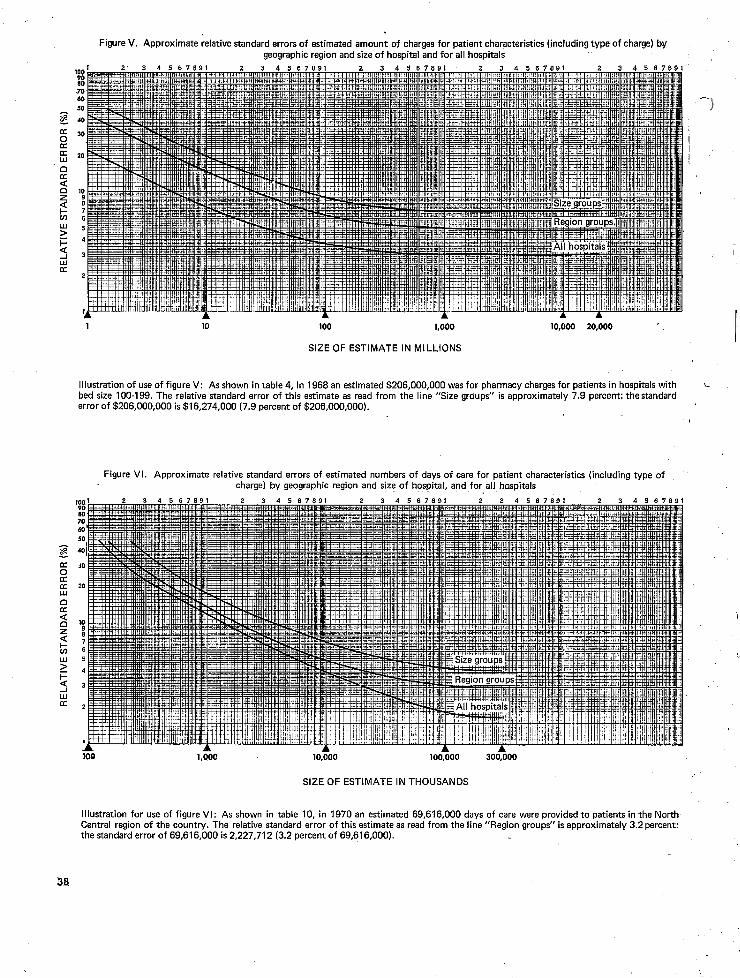
Figure V. Approximate relative standard errors of estimated amount of charges for patient characteristics (including type of charge) by geographic region and size of hospital and for all hospitals
A A A * . 10 100 1,000 10,000 20,000
SIZE OF ESTIMATE IN MILLIONS
Illustration of use of figure V: As shown in table 4, in 1968 an estimated $206,000,000 was for pharmacy charges for patients in hospitals with bed size 100-199. The relative standard error of this estimate as read from the line “Size groups” is approximately 7.9 percent: thestandard error of $206,000,000 is $16,274,000 (7.9 percent of $206,000,000).
Figure VI. Approximate relative standard errors of estimated numbers of days of care for patient characteristics (including type of charge) by geographic region and size of hospital, and for all hospitals
Illustration for use of figure VI: As shown in table 10, in 1970 an estimated 69,616,OOO days of care were provided to patients in the North Central region of the country. The relative standard error of this estimate as read from the line “Region groups” is approximately 3.2 percent: the standard error of 69,616,OOO is 2,227,712 (3.2 percent of 69,616,OOO).
1

0.05 2.6' 118 0.8 0.3 0.2 0.1 0.1 f.98 0.4 0.3 0.1 0.1 0.1 218 1.2 11..7 5.2 0.5 0.4 0.2 0.1 0.1 2.:
----------- ---- ----
--
Table' II. Annroximate standard errors of oercentages sgbwn in this reporf for discharges:patient characteristics (including type of charges) classified by geographic region and for all hospitals
[Standard errors for patient characteristics classified by size of hospital are 1% times the standard errors shown in this table]
Number of Estimated percent discharges
(base of percent inthousands) i$$$$gT
I I I 1 Standard error expressed in
percentage points
16.5
::'i
:::
::5'
X:f I
Illustrationofuse oftable II: Table 2 shows that in 1968 52.2 Dercent of the 3.537.000 oatients discharged ik the West Regio; ha;e a ;adiolqgy charge. Linear interpolation between the values shown in table II will yield an approxiinate standard error of 1.1 percent for anesti.qateof52.2 percent withabaseof3,357,000.
Approximate standard errors of average charge per episode can be calculated as in the following example:
Suppose the standard error (uRf) of the 1968 average charge per episode for females aged 45-64 years with a laboratory charge for all hospitals is desired. The estimated number of discharges for this statistic is 3,138,OOO (table 1) and the estimated amount of charges is $229,000,000 (table 3).
R’= Amount of charges
Number of dischargesLet
The relative standard error ( vX ,) of $229,000,000 (from all 2ospitals2curve in figure V) is 3.3 percent, or .033; VX’ = (.033) .The relative standard error (v,~) of 3,138,OOO (from all $ospitals zurve in figure IV) is 3.2 percent, or .032; V,' = (.032) . The sample correlation coefficient (r)which measures the closeness of the relation between the estimated amount of charges and the estimated number of discharges has been computed to be 0.82.
Table III. Approximate standard errors of percentages shown in this report for charges:patient characteristics (including type of charge) classified by geographic region and for all hospitals
[Standard errors for patient characteristics classified by size of hospital ax 1% times the standard errors shown in this table]
Nmber ofcharges(base of
percent inmillions of
dollars)
5 ------------
51;-- -100 --------- -500 ----------l,OOO-------5,000--------10,000-------15,000-------
Estimated percent
Standard error expressed in percentage pointsI-1:20.6 0.9
I Illustration of use of table III: Table
3 shows that in 1968 7.4 percent of the$6,285,000;000 was, for pliaqnacy charges formalepatients from all hospitals. Linear interpolartion between the values shown in table III willyield an approximate standard error of 0.1 per-cent for an estimate of 7.4 percent with a base of $6,285,000,000.
%I 2 = vxr2 + VyJ2 - 2TVxIVy'
= (.033)' + (0.32)' - 1.64(.033x .032)
= .001089 + -001024 - .001732 = .000381
VRl =JcilmBi = .020
uRr = R'x VRr= $73x -020 = $1.5
Approximate standard errors of average charge per day can be calculated applying the same formula.
Let R’ = Amount of charges
Number of days of care _ -.
where-
Amount of charge = average daily charge x number of days of care
the sample correlation coefficient -(r) which measures the closeness oftherelation between rhe estimated numbers of charges and the estimated number of days of care has beencomputed to be 0.99.
39

APPENDIX II
DEFINITIONS OF CERTAIN TERMS USED IN THIS REPORT
Terms Relating to Hospital Charges
Charge. - A charge is that amount of money billed to a patient, relative, or third-party insurance payor for an episode of hospitalization. The amount does not reflect the hospital cost in providing care nor does it reflect what amount of money was actually collected for an episode of hospitalization.
Room and care.- The room and care charge includes charges for room, food, nursing service, nursery, baby formula, and intensive care. Also included is the total charge for a hospital with a fixed rate.
Laboratory.-The laboratory charge includes blood counts, serology, pathology, tissue examination, basal metabolism rate, electrocardiogram, electroencephalogram, and the like.
Pharmacy.--The pharmacy charge includes items charged to drugs or pharmacy.
Radiology.-The radiology charge includes items charged to diagnostic and therapeutic radiation, e.g., X-ray, cobalt, radium, and isotopes.
Operat&g and/or recovery room.- Use of the operating and/or recovery room is covered by this term.
Professional swvices.- Professional services include charges for such items as staff physician, anesthetist, radiologist, and pathologist. Excluded are charges from outside sources, such as a surgeon’s fee billed directly from his private office to the patient.
All other ..se-rvices.- The other services are those items which are not assigned to previous categories, such as blood, oxygen, medical and surgical supplies, physical therapy, emergency room, and personal charges.
Fixed-rate hospitals.- A hospital with a fixed rate has one all-inclusive charge per patient day of stay. There is no breakdown between room and care and other services.
Average per episode total number
Average / per day is
total number
&a?-ge per episode.--The average charge is the total amount of money divided by the
of discharges. chauge pey &Y.-The average charge
the total amount of money divided by the of inpatient days.
Terms Relating to Hospitalization
Patient. -A patient is any person formally admitted to the inpatient service of a short-stay hospital for observation; care, diagnosis, or treatment. In this re-port the number of patients refers to thenumber of dis
charges during each year 1968-1970, includingmultiple discharges of the same individual (if any), from one short-stay hospital or more. All newborn infants, de-fined as those admitted-by birth to the hospital, and all females who delivered are excluded from this report. Also excluded are those patients who had no charges recorded for their hospital stay. “Inpati&C” and “patient” are used synonymously.
Discharge.-The formal release of a patient by a hospital, that is, the termination of a period of hospitalization by death or by disposition to place of residenc’e, nursing home, or another hospital is considered a discharge. In this report “discharges*’ and “patients discharged” are used synonymously.
Days of care.- Days of care-are the total number of inpatient days accumulated at time of discharge by-.patients discharged -from ‘shor?%~a~h%&is during each year 1968-1970. A stay of less than 1 day (in-patient admission &nd discharge on the same day) is counted as 1 day in the summation of total days of care. For patients admitted and discharged on different days, the number of days of care is computed by counting all days from (and including) the date of admission to (but not including) the-. date of discharge.
Average length of stay.-The average length of stay is the total number of inpatient days accumulated at time of discharge bjr patients discharged during each year 1968-1970 divided by the number of patients discharged during each year.
,Te.rms Relating to Hospitals and Hospital Characteristics
Short-stay hospitals .-.Short-stay hospitals are general and short-term special hospitals having six beds or more for inpatient use and an averCge (mean) lepgth of stay of less than 30 days. Federal hospitals,
I
’
I ’
40
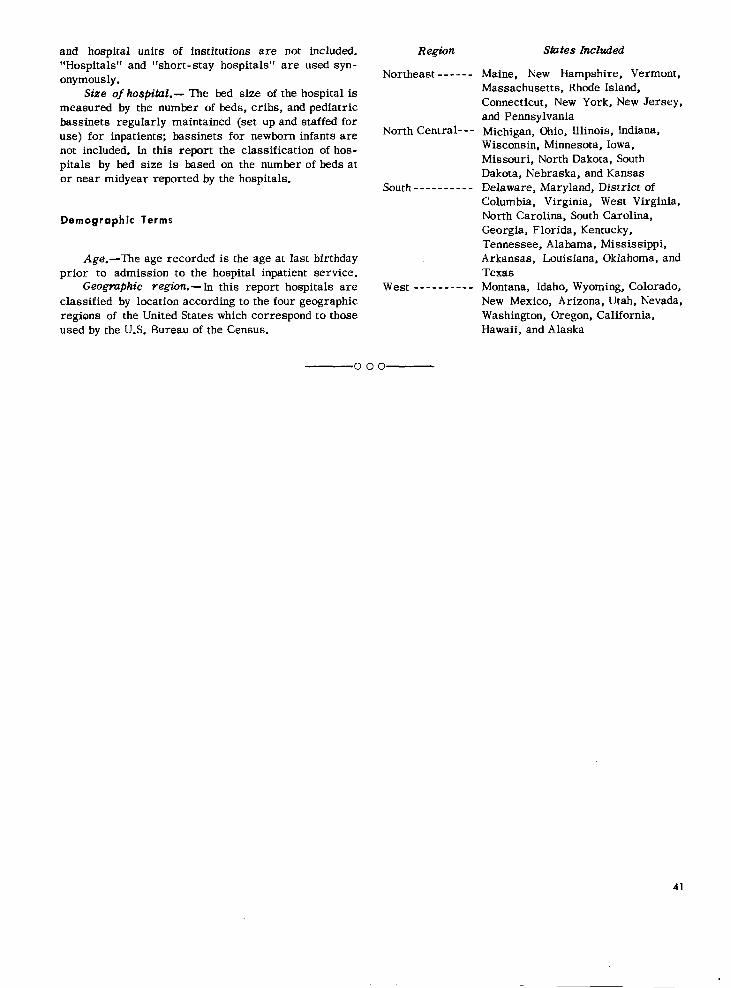
------
- -
and hospital units of institutions are not included. “Hospitals” and “short-stay hospitals” are used synonymously.
Size of hospital.- The bed size of the hospital is measured by the number of beds, cribs, and pediatric bassinets regularly maintained (set up and staffed for use) for inpatients; bassinets for newborn infants are not included. In this report the classification of hospitals by bed size is based on the number of beds at or near midyear reported by the hospitals.
Demographic Terms
Age. -The age recorded is the age at last birthday prior to admission to the hospital inpatient service.
Geogmfihic region. - In this report hospitals are classified by location according to the four geographic regions of the United States which correspond to those used by the U.S. Bureau of the Census.
-000
Region
Northeast
North Central-
South _ _ _ _ _ _ _ _ _ _
West _ __ _ __ ___ _
Sfntes Included
Maine, New Hampshire, Vermont, Massachusetts, Rhode Island, Connecticut, New York, New Jersey, and Pennsylvania Michigan, Ohio, Illinois, Indiana, Wisconsin, Minnesota, Iowa, Missouri, North Dakota, South Dakota, Nebraska, and Kansas Delaware, Maryland, District of Columbia, Virginia, West Virginia, North Carolina, South Carolina, Georgia, Florida, Kentucky, Tennessee, Alabama, Mississippi, Arkansas, Louisiana, Oklahoma, and Texas Montana, Idaho, Wyoming, Colorado, New Mexico, Arizona, Utah, Nevada, Washington, Oregon, California, Hawaii, and Alaska
41
VITAL AND HEALTH STATISTICS PUBLICATION SERIES
Originally Public Health Service Publication NO. 1000
Seriss 1. Programs and collection procedures. -Reports which describe the general programs of the National Center for Health Statistics and its offices gnddivisions, data collection methods used, definitions, and other material necessary for understanding the data.
Series 2. Data evaluation and methods research.- Studies of new statistical methodology including: experimental tests of new survey methods, studies of vital statistics collection methods, new analytical techniques, objective evaluations of reliability of collecteddata, contributions to stadsdcal theory.
Series 3. Analvtical studies.-Reports presenting analytical or interpretive studies basedon vital and health statistics, carrying the analysis further than the expository types of reports in the other series.
Series 4. Documents and committee reports.- Final reports of major committees concerned with vital and health statistics, and documents such as recommended model vital registration laws and revised birth and death certificates.
Series 10. Dataporn the Health Interview Swvev.- Stadsdcs on illness, accidental injuries, disability, use of hospital, medical, dental, and other services, and other health-related topics, based on data collected in a condnuing national household interview survey.
Series Il. Data from the Health Examination Survey. --Data from direct examination, testing, and measurement of national samples of the civilian, noninstitutional population provide the basis for two types of reports: (1) estimates of the medically defined prevalence of specific diseases in the United States and the distributions of the population with respect to physical, physiological, and psycho-logical characteristics; and (2) analysis of relationships among the various measurements without reference to an explicit finite universe of persons.
Series 12. Data from the Institutional Population Surveys. -Statistics relating to the health characteristics of persons in insdtudons, and their medical, nursing, and personal care received, based on national samples of establishments providing these services and samples of the residents or patients.
Series 13. Data f+-om the Hospital Discharge Survey. -Statistics relating to discharged patients in short-stay hospitals, based on a sample of patient records in a national sample of hospitals.
Series 14. Data on health resources: manpower and facilities. -Statistics on the numbers, geographic distribudon, and characteristics of health resources including physicians,dendsts, nurses, other health occupations, hospitals, nursing homes, and outpatient facilides.
Series 20. Data on mortality. -Various statistics on mortality other than as included in regular annual or monthly reports-special analyses by cause of death, age, and other demographic variables, also geographic and time series analyses.
Series 21. Data on natality, mawiage, and diwwce.-Various statisdcs on natality, marriage, and divorce other than as included in regular annual or monthly reports-special analyses by demographic variables, also geographic and time series analyses, studies of fertility.
Series 22. Data from the National Natulity and Mortality Surveys.- Statistics on characteristics of births and deaths not available from the vital records, based on sample surveys stemming from these records, including such topics as mortality by socioeconomic class, hospital experience in the last year of life, medical care during pregnancy, health insurance coverage, etc.
For a list of titles of reports published in these series, write to: Office of Information National Center for Health Statistics Public Health Service, HRA Rockville, Md. 20852
Top Related