

![Partial factor modeling: predictor-dependent shrinkage for ...prhahn/spfr2012Nov.pdf · partial least squares, principal component regression [Hastie et al., 2001] and the lasso [Tibshirani,](https://static.fdocuments.in/doc/165x107/5f579bf3ba55ef0b137f03ed/partial-factor-modeling-predictor-dependent-shrinkage-for-prhahn-partial.jpg)


Languages
Pages
Legal


Package ‘plsRglm’February 20, 2015
Version 1.1.1
Date 2014-12-12
Depends R (>= 2.4.0)
Imports mvtnorm, boot, bipartite, car
Enhances pls
Suggests MASS, plsdof, R.rsp, chemometrics, plsdepot
Title Partial Least Squares Regression for Generalized Linear Models
Author Frederic Bertrand <[email protected]>, Nico-las Meyer <Nicolas.Meyer@[email protected]>, Myriam Maumy-Bertrand <[email protected]>.
Maintainer Frederic Bertrand <[email protected]>
DescriptionProvides (weighted) Partial least squares Regression for generalized linear models and repeated k-fold cross-validation of such models using various criteria. It allows for missing data in the ex-planatory variables. Bootstrap confidence intervals constructions are also available.
License GPL-3
Encoding latin1
URL http://www-irma.u-strasbg.fr/~fbertran/
VignetteBuilder R.rsp
Classification/MSC 62J12, 62J99
NeedsCompilation no
Repository CRAN
Date/Publication 2014-12-17 02:19:56
R topics documented:aic.dof . . . . . . . . . . . . . . . . . . . . . . . . . . . . . . . . . . . . . . . . . . . . 3AICpls . . . . . . . . . . . . . . . . . . . . . . . . . . . . . . . . . . . . . . . . . . . . 5aze . . . . . . . . . . . . . . . . . . . . . . . . . . . . . . . . . . . . . . . . . . . . . . 6aze_compl . . . . . . . . . . . . . . . . . . . . . . . . . . . . . . . . . . . . . . . . . . 8
1

2 R topics documented:
bootpls . . . . . . . . . . . . . . . . . . . . . . . . . . . . . . . . . . . . . . . . . . . . 9bootplsglm . . . . . . . . . . . . . . . . . . . . . . . . . . . . . . . . . . . . . . . . . 12bordeaux . . . . . . . . . . . . . . . . . . . . . . . . . . . . . . . . . . . . . . . . . . 16boxplots.bootpls . . . . . . . . . . . . . . . . . . . . . . . . . . . . . . . . . . . . . . . 17coef.plsRglmmodel . . . . . . . . . . . . . . . . . . . . . . . . . . . . . . . . . . . . . 18coef.plsRmodel . . . . . . . . . . . . . . . . . . . . . . . . . . . . . . . . . . . . . . . 19coefs.plsR . . . . . . . . . . . . . . . . . . . . . . . . . . . . . . . . . . . . . . . . . . 20coefs.plsRglm . . . . . . . . . . . . . . . . . . . . . . . . . . . . . . . . . . . . . . . . 21coefs.plsRglmnp . . . . . . . . . . . . . . . . . . . . . . . . . . . . . . . . . . . . . . 22coefs.plsRnp . . . . . . . . . . . . . . . . . . . . . . . . . . . . . . . . . . . . . . . . . 24confints.bootpls . . . . . . . . . . . . . . . . . . . . . . . . . . . . . . . . . . . . . . . 25CorMat . . . . . . . . . . . . . . . . . . . . . . . . . . . . . . . . . . . . . . . . . . . 26Cornell . . . . . . . . . . . . . . . . . . . . . . . . . . . . . . . . . . . . . . . . . . . 27cv.plsR . . . . . . . . . . . . . . . . . . . . . . . . . . . . . . . . . . . . . . . . . . . 28cv.plsRglm . . . . . . . . . . . . . . . . . . . . . . . . . . . . . . . . . . . . . . . . . 31cvtable . . . . . . . . . . . . . . . . . . . . . . . . . . . . . . . . . . . . . . . . . . . . 42dicho . . . . . . . . . . . . . . . . . . . . . . . . . . . . . . . . . . . . . . . . . . . . 43fowlkes . . . . . . . . . . . . . . . . . . . . . . . . . . . . . . . . . . . . . . . . . . . 44infcrit.dof . . . . . . . . . . . . . . . . . . . . . . . . . . . . . . . . . . . . . . . . . . 45kfolds2Chisq . . . . . . . . . . . . . . . . . . . . . . . . . . . . . . . . . . . . . . . . 46kfolds2Chisqind . . . . . . . . . . . . . . . . . . . . . . . . . . . . . . . . . . . . . . . 48kfolds2coeff . . . . . . . . . . . . . . . . . . . . . . . . . . . . . . . . . . . . . . . . . 50kfolds2CVinfos_glm . . . . . . . . . . . . . . . . . . . . . . . . . . . . . . . . . . . . 51kfolds2Mclassed . . . . . . . . . . . . . . . . . . . . . . . . . . . . . . . . . . . . . . 53kfolds2Mclassedind . . . . . . . . . . . . . . . . . . . . . . . . . . . . . . . . . . . . . 55kfolds2Press . . . . . . . . . . . . . . . . . . . . . . . . . . . . . . . . . . . . . . . . . 56kfolds2Pressind . . . . . . . . . . . . . . . . . . . . . . . . . . . . . . . . . . . . . . . 57loglikpls . . . . . . . . . . . . . . . . . . . . . . . . . . . . . . . . . . . . . . . . . . . 59permcoefs.plsR . . . . . . . . . . . . . . . . . . . . . . . . . . . . . . . . . . . . . . . 60permcoefs.plsRglm . . . . . . . . . . . . . . . . . . . . . . . . . . . . . . . . . . . . . 61permcoefs.plsRglmnp . . . . . . . . . . . . . . . . . . . . . . . . . . . . . . . . . . . . 62permcoefs.plsRnp . . . . . . . . . . . . . . . . . . . . . . . . . . . . . . . . . . . . . . 63pine . . . . . . . . . . . . . . . . . . . . . . . . . . . . . . . . . . . . . . . . . . . . . 64pine_full . . . . . . . . . . . . . . . . . . . . . . . . . . . . . . . . . . . . . . . . . . . 65pine_sup . . . . . . . . . . . . . . . . . . . . . . . . . . . . . . . . . . . . . . . . . . . 67plot.table.summary.cv.plsRglmmodel . . . . . . . . . . . . . . . . . . . . . . . . . . . . 68plot.table.summary.cv.plsRmodel . . . . . . . . . . . . . . . . . . . . . . . . . . . . . . 69plots.confints.bootpls . . . . . . . . . . . . . . . . . . . . . . . . . . . . . . . . . . . . 70plsR . . . . . . . . . . . . . . . . . . . . . . . . . . . . . . . . . . . . . . . . . . . . . 73plsR.dof . . . . . . . . . . . . . . . . . . . . . . . . . . . . . . . . . . . . . . . . . . . 79plsRglm . . . . . . . . . . . . . . . . . . . . . . . . . . . . . . . . . . . . . . . . . . . 81PLS_glm_wvc . . . . . . . . . . . . . . . . . . . . . . . . . . . . . . . . . . . . . . . . 89PLS_lm_wvc . . . . . . . . . . . . . . . . . . . . . . . . . . . . . . . . . . . . . . . . 92predict.plsRglmmodel . . . . . . . . . . . . . . . . . . . . . . . . . . . . . . . . . . . . 94predict.plsRmodel . . . . . . . . . . . . . . . . . . . . . . . . . . . . . . . . . . . . . . 97print.coef.plsRglmmodel . . . . . . . . . . . . . . . . . . . . . . . . . . . . . . . . . . 99print.coef.plsRmodel . . . . . . . . . . . . . . . . . . . . . . . . . . . . . . . . . . . . 100print.cv.plsRglmmodel . . . . . . . . . . . . . . . . . . . . . . . . . . . . . . . . . . . 101
aic.dof 3
print.cv.plsRmodel . . . . . . . . . . . . . . . . . . . . . . . . . . . . . . . . . . . . . 102print.plsRglmmodel . . . . . . . . . . . . . . . . . . . . . . . . . . . . . . . . . . . . . 103print.plsRmodel . . . . . . . . . . . . . . . . . . . . . . . . . . . . . . . . . . . . . . . 104print.summary.plsRglmmodel . . . . . . . . . . . . . . . . . . . . . . . . . . . . . . . . 105print.summary.plsRmodel . . . . . . . . . . . . . . . . . . . . . . . . . . . . . . . . . . 106signpred . . . . . . . . . . . . . . . . . . . . . . . . . . . . . . . . . . . . . . . . . . . 107simul_data_complete . . . . . . . . . . . . . . . . . . . . . . . . . . . . . . . . . . . . 108simul_data_UniYX . . . . . . . . . . . . . . . . . . . . . . . . . . . . . . . . . . . . . 110simul_data_UniYX_binom . . . . . . . . . . . . . . . . . . . . . . . . . . . . . . . . . 111simul_data_YX . . . . . . . . . . . . . . . . . . . . . . . . . . . . . . . . . . . . . . . 113summary.cv.plsRglmmodel . . . . . . . . . . . . . . . . . . . . . . . . . . . . . . . . . 115summary.cv.plsRmodel . . . . . . . . . . . . . . . . . . . . . . . . . . . . . . . . . . . 116summary.plsRglmmodel . . . . . . . . . . . . . . . . . . . . . . . . . . . . . . . . . . 117summary.plsRmodel . . . . . . . . . . . . . . . . . . . . . . . . . . . . . . . . . . . . 118tilt.bootpls . . . . . . . . . . . . . . . . . . . . . . . . . . . . . . . . . . . . . . . . . . 119tilt.bootplsglm . . . . . . . . . . . . . . . . . . . . . . . . . . . . . . . . . . . . . . . . 121XbordeauxNA . . . . . . . . . . . . . . . . . . . . . . . . . . . . . . . . . . . . . . . . 122XpineNAX21 . . . . . . . . . . . . . . . . . . . . . . . . . . . . . . . . . . . . . . . . 123
Index 125
aic.dof Akaike and Bayesian Information Criteria and Generalized minimumdescription length
Description
This function computes the Akaike and Bayesian Information Criteria and the Generalized mini-mum description length.
Usage
aic.dof(RSS, n, DoF, sigmahat)bic.dof(RSS, n, DoF, sigmahat)gmdl.dof(sigmahat, n, DoF, yhat)
Arguments
RSS vector of residual sum of squares.
n number of observations.
DoF vector of Degrees of Freedom. The length of DoF is the same as the length ofRSS.
sigmahat Estimated model error. The length of sigmahat is the same as the length of RSS.
yhat vector of squared norm of Yhat. The length of yhat is the same as the length ofsigmahat.

4 aic.dof
Details
The gmdl criterion is defined as
gmdl =n
2log(S) +
DoF
2log(F ) +
1
2log(n)
withS = σ̂2
Value
vector numerical values of the requested AIC, BIC or GMDL.
Author(s)
Frederic Bertrand<[email protected]>http://www-irma.u-strasbg.fr/~fbertran/
References
M. Hansen, B. Yu. (2001). Model Selection and Minimum Descripion Length Principle, Journal ofthe American Statistical Association, 96, 746-774.N. Kraemer, M. Sugiyama. (2011). The Degrees of Freedom of Partial Least Squares Regression.Journal of the American Statistical Association, 106(494), 697-705.N. Kraemer, M.L. Braun, Kernelizing PLS, Degrees of Freedom, and Efficient Model Selection,Proceedings of the 24th International Conference on Machine Learning, Omni Press, (2007) 441-448.
See Also
plsR.dof for degrees of freedom computation and infcrit.dof for computing information criteriadirectly from a previously fitted plsR model.
Examples
data(Cornell)XCornell<-Cornell[,1:7]yCornell<-Cornell[,8]modpls <- plsR(yCornell,XCornell,4)dof.object <- plsR.dof(modpls)aic.dof(modpls$RSS,modpls$nr,dof.object$DoF,dof.object$sigmahat)bic.dof(modpls$RSS,modpls$nr,dof.object$DoF,dof.object$sigmahat)gmdl.dof(dof.object$sigmahat,modpls$nr,dof.object$DoF,dof.object$yhat)naive.object <- plsR.dof(modpls,naive=TRUE)aic.dof(modpls$RSS,modpls$nr,naive.object$DoF,naive.object$sigmahat)bic.dof(modpls$RSS,modpls$nr,naive.object$DoF,naive.object$sigmahat)gmdl.dof(naive.object$sigmahat,modpls$nr,naive.object$DoF,naive.object$yhat)

AICpls 5
AICpls AIC function for plsR models
Description
This function provides AIC computation for an univariate plsR model.
Usage
AICpls(ncomp, residpls, weights=rep.int(1,length(residpls)))
Arguments
ncomp Number of components
residpls Residuals of a fitted univariate plsR model
weights Weights of observations
Details
AIC function for plsR models with univariate response.
Value
real AIC value
Author(s)
Frederic Bertrand<[email protected]>http://www-irma.u-strasbg.fr/~fbertran/
References
Baibing Li, Julian Morris, Elaine B. Martin, Model selection for partial least squares regression,Chemometrics and Intelligent Laboratory Systems 64 (2002) 79-89. http://dx.doi.org/10.1016/S0169-7439(02)00051-5
See Also
loglikpls for loglikelihood computations for plsR models and AIC for AIC computation for alinear models
6 aze
Examples
data(pine)ypine <- pine[,11]Xpine <- pine[,1:10](Pinscaled <- as.data.frame(cbind(scale(ypine),scale(as.matrix(Xpine)))))colnames(Pinscaled)[1] <- "yy"
lm(yy~x1+x2+x3+x4+x5+x6+x7+x8+x9+x10,data=Pinscaled)
modpls <- plsR(ypine,Xpine,10)modpls$Std.Coeffslm(yy~x1+x2+x3+x4+x5+x6+x7+x8+x9+x10,data=Pinscaled)
AIC(lm(yy~x1+x2+x3+x4+x5+x6+x7+x8+x9+x10,data=Pinscaled))print(logLik(lm(yy~x1+x2+x3+x4+x5+x6+x7+x8+x9+x10,data=Pinscaled)))
sum(dnorm(modpls$RepY, modpls$Std.ValsPredictY, sqrt(mean(modpls$residY^2)), log=TRUE))sum(dnorm(Pinscaled$yy,fitted(lm(yy~x1+x2+x3+x4+x5+x6+x7+x8+x9+x10,data=Pinscaled)),sqrt(mean(residuals(lm(yy~x1+x2+x3+x4+x5+x6+x7+x8+x9+x10,data=Pinscaled))^2)), log=TRUE))loglikpls(modpls$residY)loglikpls(residuals(lm(yy~x1+x2+x3+x4+x5+x6+x7+x8+x9+x10,data=Pinscaled)))AICpls(10,residuals(lm(yy~x1+x2+x3+x4+x5+x6+x7+x8+x9+x10,data=Pinscaled)))AICpls(10,modpls$residY)
aze Microsatellites Dataset
Description
This database was collected on patients carrying a colon adenocarcinoma. It has 104 observationson 33 binary qualitative explanatory variables and one response variable y representing the cancerstage according to the to Astler-Coller classification (Astler and Coller, 1954). This dataset hassome missing data due to technical limits. A microsattelite is a non-coding DNA sequence.
Usage
data(aze)
Format
A data frame with 104 observations on the following 34 variables.
y the response: a binary vector (Astler-Coller score).
D2S138 a binary vector that indicates whether this microsatellite is altered or not.
D18S61 a binary vector that indicates whether this microsatellite is altered or not.
D16S422 a binary vector that indicates whether this microsatellite is altered or not.
D17S794 a binary vector that indicates whether this microsatellite is altered or not.

aze 7
D6S264 a binary vector that indicates whether this microsatellite is altered or not.
D14S65 a binary vector that indicates whether this microsatellite is altered or not.
D18S53 a binary vector that indicates whether this microsatellite is altered or not.
D17S790 a binary vector that indicates whether this microsatellite is altered or not.
D1S225 a binary vector that indicates whether this microsatellite is altered or not.
D3S1282 a binary vector that indicates whether this microsatellite is altered or not.
D9S179 a binary vector that indicates whether this microsatellite is altered or not.
D5S430 a binary vector that indicates whether this microsatellite is altered or not.
D8S283 a binary vector that indicates whether this microsatellite is altered or not.
D11S916 a binary vector that indicates whether this microsatellite is altered or not.
D2S159 a binary vector that indicates whether this microsatellite is altered or not.
D16S408 a binary vector that indicates whether this microsatellite is altered or not.
D5S346 a binary vector that indicates whether this microsatellite is altered or not.
D10S191 a binary vector that indicates whether this microsatellite is altered or not.
D13S173 a binary vector that indicates whether this microsatellite is altered or not.
D6S275 a binary vector that indicates whether this microsatellite is altered or not.
D15S127 a binary vector that indicates whether this microsatellite is altered or not.
D1S305 a binary vector that indicates whether this microsatellite is altered or not.
D4S394 a binary vector that indicates whether this microsatellite is altered or not.
D20S107 a binary vector that indicates whether this microsatellite is altered or not.
D1S197 a binary vector that indicates whether this microsatellite is altered or not.
D1S207 a binary vector that indicates whether this microsatellite is altered or not.
D10S192 a binary vector that indicates whether this microsatellite is altered or not.
D3S1283 a binary vector that indicates whether this microsatellite is altered or not.
D4S414 a binary vector that indicates whether this microsatellite is altered or not.
D8S264 a binary vector that indicates whether this microsatellite is altered or not.
D22S928 a binary vector that indicates whether this microsatellite is altered or not.
TP53 a binary vector that indicates whether this microsatellite is altered or not.
D9S171 a binary vector that indicates whether this microsatellite is altered or not.
Source
Weber et al. (2007). Allelotyping analyzes of synchronous primary and metastasis CIN coloncancers identified different subtypes. Int J Cancer, 120(3), pages 524-32.
References
Nicolas Meyer, Myriam Maumy-Bertrand et Frederic Bertrand (2010). Comparing the linear andthe logistic PLS regression with qualitative predictors: application to allelotyping data. Journal dela Societe Francaise de Statistique, 151(2), pages 1-18.
8 aze_compl
Examples
data(aze)str(aze)
aze_compl As aze without missing values
Description
This is a single imputation of the aze dataset which was collected on patients carrying a colonadenocarcinoma. It has 104 observations on 33 binary qualitative explanatory variables and oneresponse variable y representing the cancer stage according to the to Astler-Coller classification(Astler and Coller, 1954). A microsattelite is a non-coding DNA sequence.
Usage
data(aze_compl)
Format
A data frame with 104 observations on the following 34 variables.
y the response: a binary vector (Astler-Coller score).
D2S138 a binary vector that indicates whether this microsatellite is altered or not.
D18S61 a binary vector that indicates whether this microsatellite is altered or not.
D16S422 a binary vector that indicates whether this microsatellite is altered or not.
D17S794 a binary vector that indicates whether this microsatellite is altered or not.
D6S264 a binary vector that indicates whether this microsatellite is altered or not.
D14S65 a binary vector that indicates whether this microsatellite is altered or not.
D18S53 a binary vector that indicates whether this microsatellite is altered or not.
D17S790 a binary vector that indicates whether this microsatellite is altered or not.
D1S225 a binary vector that indicates whether this microsatellite is altered or not.
D3S1282 a binary vector that indicates whether this microsatellite is altered or not.
D9S179 a binary vector that indicates whether this microsatellite is altered or not.
D5S430 a binary vector that indicates whether this microsatellite is altered or not.
D8S283 a binary vector that indicates whether this microsatellite is altered or not.
D11S916 a binary vector that indicates whether this microsatellite is altered or not.
D2S159 a binary vector that indicates whether this microsatellite is altered or not.
D16S408 a binary vector that indicates whether this microsatellite is altered or not.
D5S346 a binary vector that indicates whether this microsatellite is altered or not.
D10S191 a binary vector that indicates whether this microsatellite is altered or not.
bootpls 9
D13S173 a binary vector that indicates whether this microsatellite is altered or not.
D6S275 a binary vector that indicates whether this microsatellite is altered or not.
D15S127 a binary vector that indicates whether this microsatellite is altered or not.
D1S305 a binary vector that indicates whether this microsatellite is altered or not.
D4S394 a binary vector that indicates whether this microsatellite is altered or not.
D20S107 a binary vector that indicates whether this microsatellite is altered or not.
D1S197 a binary vector that indicates whether this microsatellite is altered or not.
D1S207 a binary vector that indicates whether this microsatellite is altered or not.
D10S192 a binary vector that indicates whether this microsatellite is altered or not.
D3S1283 a binary vector that indicates whether this microsatellite is altered or not.
D4S414 a binary vector that indicates whether this microsatellite is altered or not.
D8S264 a binary vector that indicates whether this microsatellite is altered or not.
D22S928 a binary vector that indicates whether this microsatellite is altered or not.
TP53 a binary vector that indicates whether this microsatellite is altered or not.
D9S171 a binary vector that indicates whether this microsatellite is altered or not.
Source
Weber et al. (2007). Allelotyping analyzes of synchronous primary and metastasis CIN coloncancers identified different subtypes. Int J Cancer, 120(3), pages 524-32.
References
Nicolas Meyer, Myriam Maumy-Bertrand et Frederic Bertrand (2010). Comparing the linear andthe logistic PLS regression with qualitative predictors: application to allelotyping data. Journal dela Societe Francaise de Statistique, 151(2), pages 1-18.
Examples
data(aze_compl)str(aze_compl)
bootpls Non-parametric Bootstrap for PLS models
Description
Provides a wrapper for the bootstrap function boot from the boot R package.Implements non-parametric bootstraps for PLS Regression models by either (Y,X) or (Y,T) resam-pling.
10 bootpls
Usage
bootpls(object, typeboot="plsmodel", R=250, statistic=coefs.plsR, sim="ordinary",stype="i", stabvalue=1e6, verbose=TRUE,...)
Arguments
object An object of class plsRmodel to bootstrap
typeboot The type of bootstrap. Either (Y,X) boostrap (typeboot="plsmodel") or (Y,T)bootstrap (typeboot="fmodel_np"). Defaults to (Y,X) resampling.
R The number of bootstrap replicates. Usually this will be a single positive integer.For importance resampling, some resamples may use one set of weights andothers use a different set of weights. In this case R would be a vector of integerswhere each component gives the number of resamples from each of the rows ofweights.
statistic A function which when applied to data returns a vector containing the statistic(s)of interest. statistic must take at least two arguments. The first argumentpassed will always be the original data. The second will be a vector of indices,frequencies or weights which define the bootstrap sample. Further, if predic-tions are required, then a third argument is required which would be a vectorof the random indices used to generate the bootstrap predictions. Any furtherarguments can be passed to statistic through the ... argument.
sim A character string indicating the type of simulation required. Possible values are"ordinary" (the default), "balanced", "permutation", or "antithetic".
stype A character string indicating what the second argument of statistic repre-sents. Possible values of stype are "i" (indices - the default), "f" (frequencies),or "w" (weights).
stabvalue A value to hard threshold bootstrap estimates computed from atypical resam-plings. Especially useful for Generalized Linear Models.
verbose should info messages be displayed ?
... Other named arguments for statistic which are passed unchanged each time itis called. Any such arguments to statistic should follow the arguments whichstatistic is required to have for the simulation. Beware of partial matching toarguments of boot listed above.
Details
More details on bootstrap techniques are available in the help of the boot function.
Value
An object of class "boot". See the Value part of the help of the function boot.
Author(s)
Frederic Bertrand<[email protected]>http://www-irma.u-strasbg.fr/~fbertran/
bootpls 11
References
A. Lazraq, R. Cleroux, and J.-P. Gauchi. (2003). Selecting both latent and explanatory variables inthe PLS1 regression model. Chemometrics and Intelligent Laboratory Systems, 66(2):117-126.P. Bastien, V. Esposito-Vinzi, and M. Tenenhaus. (2005). PLS generalised linear regression. Com-putational Statistics & Data Analysis, 48(1):17-46.A. C. Davison and D. V. Hinkley. (1997). Bootstrap Methods and Their Applications. CambridgeUniversity Press, Cambridge.
See Also
boot
Examples
data(Cornell)XCornell<-Cornell[,1:7]yCornell<-Cornell[,8]
# Lazraq-Cleroux PLS ordinary bootstrapset.seed(250)modpls <- plsR(yCornell,XCornell,3)
#(Y,X) resamplingCornell.bootYX <- bootpls(modpls, R=250)
#(Y,T) resamplingCornell.bootYT <- bootpls(modpls, typeboot="fmodel_np", R=250)
# Using the boxplots.bootpls functionboxplots.bootpls(Cornell.bootYX,indices=2:8)# Confidence intervals plottingconfints.bootpls(Cornell.bootYX,indices=2:8)plots.confints.bootpls(confints.bootpls(Cornell.bootYX,indices=2:8))# Graph similar to the one of Bastien et al. in CSDA 2005boxplot(as.vector(Cornell.bootYX$t[,-1])~factor(rep(1:7,rep(250,7))),main="Bootstrap distributions of standardised bj (j = 1, ..., 7).")points(c(1:7),Cornell.bootYX$t0[-1],col="red",pch=19)
library(boot)boot.ci(Cornell.bootYX, conf = c(0.90,0.95), type = c("norm","basic","perc","bca"), index=2)plot(Cornell.bootYX,index=2)jack.after.boot(Cornell.bootYX, index=2, useJ=TRUE, nt=3)plot(Cornell.bootYX,index=2,jack=TRUE)
car::dataEllipse(Cornell.bootYX$t[,2], Cornell.bootYX$t[,3], cex=.3,levels=c(.5, .95, .99), robust=TRUE)rm(Cornell.bootYX)
12 bootplsglm
# PLS balanced bootstrap
set.seed(225)Cornell.bootYX <- bootpls(modpls, sim="balanced", R=250)boot.array(Cornell.bootYX, indices=TRUE)
# Using the boxplots.bootpls functionboxplots.bootpls(Cornell.bootYX,indices=2:8)# Confidence intervals plottingconfints.bootpls(Cornell.bootYX,indices=2:8)plots.confints.bootpls(confints.bootpls(Cornell.bootYX,indices=2:8))# Graph similar to the one of Bastien et al. in CSDA 2005boxplot(as.vector(Cornell.bootYX$t[,-1])~factor(rep(1:7,rep(250,7))),main="Bootstrap distributions of standardised bj (j = 1, ..., 7).")points(c(1:7),Cornell.bootYX$t0[-1],col="red",pch=19)
library(boot)boot.ci(Cornell.bootYX, conf = c(0.90,0.95), type = c("norm","basic","perc","bca"), index=2)plot(Cornell.bootYX,index=2)jack.after.boot(Cornell.bootYX, index=2, useJ=TRUE, nt=3)plot(Cornell.bootYX,index=2,jack=TRUE)
rm(Cornell.bootYX)
# PLS permutation bootstrap
set.seed(500)Cornell.bootYX <- bootpls(modpls, sim="permutation", R=1000)boot.array(Cornell.bootYX, indices=TRUE)
# Graph of bootstrap distributionsboxplot(as.vector(Cornell.bootYX$t[,-1])~factor(rep(1:7,rep(1000,7))),main="Bootstrap distributions of standardised bj (j = 1, ..., 7).")points(c(1:7),Cornell.bootYX$t0[-1],col="red",pch=19)# Using the boxplots.bootpls functionboxplots.bootpls(Cornell.bootYX,indices=2:8)
library(boot)plot(Cornell.bootYX,index=2)
qqnorm(Cornell.bootYX$t[,2],ylim=c(-1,1))abline(h=Cornell.bootYX$t0[2],lty=2)(sum(abs(Cornell.bootYX$t[,2])>=abs(Cornell.bootYX$t0[2]))+1)/(length(Cornell.bootYX$t[,2])+1)
rm(Cornell.bootYX)
bootplsglm Non-parametric Bootstrap for PLS generalized linear models
bootplsglm 13
Description
Provides a wrapper for the bootstrap function boot from the boot R package.Implements non-parametric bootstraps for PLS Generalized Linear Regression models by either(Y,X) or (Y,T) resampling.
Usage
bootplsglm(object, typeboot="fmodel_np", R=250, statistic=coefs.plsRglmnp,sim="ordinary", stype="i", stabvalue=1e6, verbose=TRUE,...)
Arguments
object An object of class plsRglmmodel to bootstrap
typeboot The type of bootstrap. Either (Y,X) boostrap (typeboot="plsmodel") or (Y,T)bootstrap (typeboot="fmodel_np"). Defaults to (Y,T) resampling.
R The number of bootstrap replicates. Usually this will be a single positive integer.For importance resampling, some resamples may use one set of weights andothers use a different set of weights. In this case R would be a vector of integerswhere each component gives the number of resamples from each of the rows ofweights.
statistic A function which when applied to data returns a vector containing the statistic(s)of interest. statistic must take at least two arguments. The first argumentpassed will always be the original data. The second will be a vector of indices,frequencies or weights which define the bootstrap sample. Further, if predic-tions are required, then a third argument is required which would be a vectorof the random indices used to generate the bootstrap predictions. Any furtherarguments can be passed to statistic through the ... argument.
sim A character string indicating the type of simulation required. Possible values are"ordinary" (the default), "balanced", "permutation", or "antithetic".
stype A character string indicating what the second argument of statistic repre-sents. Possible values of stype are "i" (indices - the default), "f" (frequencies),or "w" (weights).
stabvalue A value to hard threshold bootstrap estimates computed from atypical resam-plings. Especially useful for Generalized Linear Models.
verbose should info messages be displayed ?
... Other named arguments for statistic which are passed unchanged each time itis called. Any such arguments to statistic should follow the arguments whichstatistic is required to have for the simulation. Beware of partial matching toarguments of boot listed above.
Details
More details on bootstrap techniques are available in the help of the boot function.
Value
An object of class "boot". See the Value part of the help of the function boot.
14 bootplsglm
Author(s)
Frederic Bertrand<[email protected]>http://www-irma.u-strasbg.fr/~fbertran/
References
A. Lazraq, R. Cleroux, and J.-P. Gauchi. (2003). Selecting both latent and explanatory variables inthe PLS1 regression model. Chemometrics and Intelligent Laboratory Systems, 66(2):117-126.P. Bastien, V. Esposito-Vinzi, and M. Tenenhaus. (2005). PLS generalised linear regression. Com-putational Statistics & Data Analysis, 48(1):17-46.A. C. Davison and D. V. Hinkley. (1997). Bootstrap Methods and Their Applications. CambridgeUniversity Press, Cambridge.
See Also
boot
Examples
#Imputed aze datasetdata(aze_compl)Xaze_compl<-aze_compl[,2:34]yaze_compl<-aze_compl$y
dataset <- cbind(y=yaze_compl,Xaze_compl)modplsglm <- plsRglm(y~.,data=dataset,3,modele="pls-glm-logistic")
library(boot)# Bastien (Y,T) PLS bootstrapaze_compl.bootYT <- bootplsglm(modplsglm, R=250)boxplots.bootpls(aze_compl.bootYT)confints.bootpls(aze_compl.bootYT)plots.confints.bootpls(confints.bootpls(aze_compl.bootYT))
plot(aze_compl.bootYT,index=2)jack.after.boot(aze_compl.bootYT, index=2, useJ=TRUE, nt=3)plot(aze_compl.bootYT, index=2,jack=TRUE)aze_compl.tilt.boot <- tilt.bootplsglm(modplsglm, statistic=coefs.plsRglm,R=c(499, 100, 100), alpha=c(0.025, 0.975), sim="ordinary", stype="i", index=1)
# PLS bootstrap balancedaze_compl.bootYT <- bootplsglm(modplsglm, sim="balanced", R=250)boxplots.bootpls(aze_compl.bootYT)confints.bootpls(aze_compl.bootYT)plots.confints.bootpls(confints.bootpls(aze_compl.bootYT))
plot(aze_compl.bootYT)jack.after.boot(aze_compl.bootYT, index=1, useJ=TRUE, nt=3)
bootplsglm 15
plot(aze_compl.bootYT,jack=TRUE)aze_compl.tilt.boot <- tilt.bootplsglm(modplsglm, statistic=coefs.plsR,R=c(499, 100, 100), alpha=c(0.025, 0.975), sim="balanced", stype="i", index=1)
# PLS permutation bootstrap
aze_compl.bootYT <- bootplsglm(modplsglm, sim="permutation", R=250)boxplots.bootpls(aze_compl.bootYT)plot(aze_compl.bootYT)
#Original aze dataset with missing valuesdata(aze)Xaze<-aze[,2:34]yaze<-aze$y
library(boot)modplsglm2 <- plsRglm(yaze,Xaze,3,modele="pls-glm-logistic")aze.bootYT <- bootplsglm(modplsglm2, R=250)boxplots.bootpls(aze.bootYT)confints.bootpls(aze.bootYT)plots.confints.bootpls(confints.bootpls(aze.bootYT))
#Ordinal logistic regressiondata(bordeaux)Xbordeaux<-bordeaux[,1:4]ybordeaux<-factor(bordeaux$Quality,ordered=TRUE)dataset <- cbind(y=ybordeaux,Xbordeaux)options(contrasts = c("contr.treatment", "contr.poly"))modplsglm3 <- plsRglm(ybordeaux,Xbordeaux,1,modele="pls-glm-polr")bordeaux.bootYT<- bootplsglm(modplsglm3, sim="permutation", R=250)boxplots.bootpls(bordeaux.bootYT)boxplots.bootpls(bordeaux.bootYT,ranget0=TRUE)
bordeaux.bootYT2<- bootplsglm(modplsglm3, sim="permutation", R=250,strata=unclass(ybordeaux))boxplots.bootpls(bordeaux.bootYT2,ranget0=TRUE)
if(require(chemometrics)){data(hyptis)hyptisyhyptis <- factor(hyptis$Group,ordered=TRUE)Xhyptis <- as.data.frame(hyptis[,c(1:6)])dataset <- cbind(y=yhyptis,Xhyptis)options(contrasts = c("contr.treatment", "contr.poly"))modplsglm4 <- plsRglm(yhyptis,Xhyptis,3,modele="pls-glm-polr")hyptis.bootYT3<- bootplsglm(modplsglm4, sim="permutation", R=250)rownames(hyptis.bootYT3$t0)<-c("Sabi\nnene","Pin\nene",
16 bordeaux
"Cine\nole","Terpi\nnene","Fenc\nhone","Terpi\nnolene")boxplots.bootpls(hyptis.bootYT3)boxplots.bootpls(hyptis.bootYT3,xaxisticks=FALSE)boxplots.bootpls(hyptis.bootYT3,ranget0=TRUE)boxplots.bootpls(hyptis.bootYT3,ranget0=TRUE,xaxisticks=FALSE)}
bordeaux Quality of wine dataset
Description
Quality of Bordeaux wines (Quality) and four potentially predictive variables (Temperature,Sunshine, Heat and Rain).
Usage
data(bordeaux)
Format
A data frame with 34 observations on the following 5 variables.
Temperature a numeric vector
Sunshine a numeric vector
Heat a numeric vector
Rain a numeric vector
Quality an ordered factor with levels 1 < 2 < 3
Source
P. Bastien, V. Esposito-Vinzi, and M. Tenenhaus. (2005). PLS generalised linear regression. Com-putational Statistics & Data Analysis, 48(1):17-46.
References
M. Tenenhaus. (2005). La regression logistique PLS. In J.-J. Droesbeke, M. Lejeune, and G.Saporta, editors, Modeles statistiques pour donnees qualitatives. Editions Technip, Paris.
Examples
data(bordeaux)str(bordeaux)
boxplots.bootpls 17
boxplots.bootpls Boxplot bootstrap distributions
Description
Boxplots for bootstrap distributions.
Usage
boxplots.bootpls(bootobject, indices = NULL, prednames = TRUE,articlestyle = TRUE, xaxisticks=TRUE, ranget0= FALSE, las = par("las"),mar, mgp, ...)
Arguments
bootobject a object of class "boot"indices vector of indices of the variables to plot. Defaults to NULL: all the predictors will
be used.prednames do the original names of the predictors shall be plotted ? Defaults to TRUE: the
names are plotted.articlestyle do the extra blank zones of the margin shall be removed from the plot ? Defaults
to TRUE: the margins are removed.xaxisticks do ticks for the x axis shall be plotted ? Defaults to TRUE: the ticks are plotted.ranget0 does the vertival range of the plot shall be computed to include the initial es-
timates of the coefficients ? Defaults to FALSE: the vertical range is calculatedonly using the bootstrapped values of the statistics. Especially using for permu-tation bootstrap.
las numeric in 0,1,2,3; the style of axis labels. 0: always parallel to the axis [de-fault], 1: always horizontal, 2: always perpendicular to the axis, 3: alwaysvertical.
mar A numerical vector of the form c(bottom, left, top, right) which givesthe number of lines of margin to be specified on the four sides of the plot. Thedefault is c(5, 4, 4, 2) + 0.1.
mgp The margin line (in mex units) for the axis title, axis labels and axis line. Notethat mgp[1] affects title whereas mgp[2:3] affect axis. The default is c(3, 1, 0).
... further options to pass to the boxplot function.
Value
NULL
Author(s)
Frederic Bertrand<[email protected]>http://www-irma.u-strasbg.fr/~fbertran/
18 coef.plsRglmmodel
See Also
bootpls
Examples
data(Cornell)XCornell<-Cornell[,1:7]yCornell<-Cornell[,8]
# Lazraq-Cleroux PLS ordinary bootstrapset.seed(250)modpls <- plsR(yCornell,XCornell,3)Cornell.bootYX <- bootpls(modpls, R=250)
# Graph similar to the one of Bastien et al. in CSDA 2005boxplots.bootpls(Cornell.bootYX,indices=2:8)
data(aze_compl)modplsglm<-plsRglm(y~.,data=aze_compl,3,modele="pls-glm-logistic")aze_compl.boot3 <- bootplsglm(modplsglm, R=250)boxplots.bootpls(aze_compl.boot3)boxplots.bootpls(aze_compl.boot3,las=3,mar=c(5,2,1,1))boxplots.bootpls(aze_compl.boot3,indices=c(2,4,6),prednames=FALSE)
coef.plsRglmmodel coef method for plsR models
Description
This function provides a coef method for the class "plsRglmmodel"
Usage
## S3 method for class 'plsRglmmodel'coef(object,type=c("scaled","original"), ...)
Arguments
object an object of the class "plsRglmmodel"
type if scaled, the coefficients of the predictors are given for the scaled predictors,if original the coefficients are to be used with the predictors on their originalscale.
... not used

coef.plsRmodel 19
Value
An object of class coef.plsRglmmodel.
CoeffC Coefficients of the components.
Std.Coeffs Coefficients of the scaled predictors in the regression function.
Coeffs Coefficients of the untransformed predictors (on their original scale).
Author(s)
Frederic Bertrand<[email protected]>http://www-irma.u-strasbg.fr/~fbertran/
See Also
coef
Examples
data(Cornell)XCornell<-Cornell[,1:7]yCornell<-Cornell[,8]modpls <- plsRglm(yCornell,XCornell,3,modele="pls-glm-family",family=gaussian())class(modpls)coef(modpls)coef(modpls,type="scaled")rm(list=c("XCornell","yCornell","modpls"))
coef.plsRmodel coef method for plsR models
Description
This function provides a coef method for the class "plsRmodel"
Usage
## S3 method for class 'plsRmodel'coef(object,type=c("scaled","original"), ...)
Arguments
object an object of the class "plsRmodel"
type if scaled, the coefficients of the predictors are given for the scaled predictors,if original the coefficients are to be used with the predictors on their originalscale.
... not used
20 coefs.plsR
Value
An object of class coef.plsRmodel.
CoeffC Coefficients of the components.
Std.Coeffs Coefficients of the scaled predictors.
Coeffs Coefficients of the untransformed predictors (on their original scale).
Author(s)
Frederic Bertrand<[email protected]>http://www-irma.u-strasbg.fr/~fbertran/
See Also
coef
Examples
data(Cornell)XCornell<-Cornell[,1:7]yCornell<-Cornell[,8]modpls <- plsRglm(yCornell,XCornell,3,modele="pls")class(modpls)coef(modpls)coef(modpls,type="scaled")rm(list=c("XCornell","yCornell","modpls"))
coefs.plsR Coefficients for bootstrap computations of PLSR models
Description
A function passed to boot to perform bootstrap.
Usage
coefs.plsR(dataset,ind,nt,modele, maxcoefvalues,ifbootfail,verbose)
Arguments
dataset dataset to resample
ind indices for resampling
nt number of components to use
modele type of modele to use, see plsR
coefs.plsRglm 21
maxcoefvalues maximum values allowed for the estimates of the coefficients to discard thosecoming from singular bootstrap samples
ifbootfail value to return if the estimation fails on a bootstrap sample
verbose should info messages be displayed ?
Value
estimates on a bootstrap sample or ifbootfail value if the bootstrap computation fails.
Author(s)
Frederic Bertrand<[email protected]>http://www-irma.u-strasbg.fr/~fbertran/
See Also
See also bootpls.
Examples
data(Cornell)XCornell<-Cornell[,1:7]yCornell<-Cornell[,8]
# Lazraq-Cleroux PLS (Y,X) bootstrap# statistic=coefs.plsR is the default for (Y,X) resampling of PLSR models.set.seed(250)modpls <- plsR(yCornell,XCornell,1)Cornell.bootYX <- bootpls(modpls, R=250, statistic=coefs.plsR)
coefs.plsRglm Coefficients for bootstrap computations of PLSGLR models
Description
A function passed to boot to perform bootstrap.
Usage
coefs.plsRglm(dataset, ind, nt, modele, family=NULL, maxcoefvalues,ifbootfail,verbose)

22 coefs.plsRglmnp
Arguments
dataset dataset to resample
ind indices for resampling
nt number of components to use
modele type of modele to use, see plsRglm
family glm family to use, see plsRglm
maxcoefvalues maximum values allowed for the estimates of the coefficients to discard thosecoming from singular bootstrap samples
ifbootfail value to return if the estimation fails on a bootstrap sample
verbose should info messages be displayed ?
Value
estimates on a bootstrap sample or ifbootfail value if the bootstrap computation fails.
Author(s)
Frederic Bertrand<[email protected]>http://www-irma.u-strasbg.fr/~fbertran/
See Also
See also bootplsglm.
Examples
data(Cornell)
# (Y,X) bootstrap of a PLSGLR model# statistic=coefs.plsRglm is the default for (Y,X) bootstrap of a PLSGLR models.set.seed(250)modplsglm <- plsRglm(Y~.,data=Cornell,1,modele="pls-glm-family",family=gaussian)Cornell.bootYX <- bootplsglm(modplsglm, R=250, typeboot="plsmodel", statistic=coefs.plsRglm)
coefs.plsRglmnp Coefficients for bootstrap computations of PLSGLR models
Description
A function passed to boot to perform bootstrap.
Usage
coefs.plsRglmnp(dataRepYtt, ind, nt, modele, family=NULL,maxcoefvalues, wwetoile,ifbootfail)

coefs.plsRglmnp 23
Arguments
dataRepYtt components’ coordinates to bootstrap
ind indices for resampling
nt number of components to use
modele type of modele to use, see plsRglm
family glm family to use, see plsRglm
maxcoefvalues maximum values allowed for the estimates of the coefficients to discard thosecoming from singular bootstrap samples
wwetoile values of the Wstar matrix in the original fit
ifbootfail value to return if the estimation fails on a bootstrap sample
Value
estimates on a bootstrap sample or ifbootfail value if the bootstrap computation fails.
Note
~~some notes~~
Author(s)
Frederic Bertrand<[email protected]>http://www-irma.u-strasbg.fr/~fbertran/
See Also
See also bootplsglm
Examples
data(Cornell)
# (Y,X) bootstrap of a PLSGLR model# statistic=coefs.plsRglm is the default for (Y,X) bootstrap of a PLSGLR models.set.seed(250)modplsglm <- plsRglm(Y~.,data=Cornell,1,modele="pls-glm-family",family=gaussian)Cornell.bootYT <- bootplsglm(modplsglm, R=250, statistic=coefs.plsRglmnp)

24 coefs.plsRnp
coefs.plsRnp Coefficients for bootstrap computations of PLSR models
Description
A function passed to boot to perform bootstrap.
Usage
coefs.plsRnp(dataRepYtt,ind,nt,modele, maxcoefvalues,wwetoile,ifbootfail)
Arguments
dataRepYtt components’ coordinates to bootstrap
ind indices for resampling
nt number of components to use
modele type of modele to use, see plsRglm
maxcoefvalues maximum values allowed for the estimates of the coefficients to discard thosecoming from singular bootstrap samples
wwetoile values of the Wstar matrix in the original fit
ifbootfail value to return if the estimation fails on a bootstrap sample
Value
estimates on a bootstrap sample or ifbootfail value if the bootstrap computation fails.
Author(s)
Frederic Bertrand<[email protected]>http://www-irma.u-strasbg.fr/~fbertran/
See Also
See also bootpls
Examples
data(Cornell)XCornell<-Cornell[,1:7]yCornell<-Cornell[,8]
# Lazraq-Cleroux PLS (Y,X) bootstrap# statistic=coefs.plsR is the default for (Y,X) resampling of PLSR models.set.seed(250)modpls <- plsR(yCornell,XCornell,1)Cornell.bootYT <- bootpls(modpls, R=250, typeboot="fmodel_np", statistic=coefs.plsRnp)

confints.bootpls 25
confints.bootpls Bootstrap confidence intervals
Description
This function is a wrapper for boot.ci to derive bootstrap-based confidence intervals from a"boot" object.
Usage
confints.bootpls(bootobject, indices = NULL, typeBCa=TRUE)
Arguments
bootobject an object of class "boot"indices the indices of the predictor for which CIs should be calculated. Defaults to NULL:
all the predictors will be used.typeBCa shall BCa bootstrap based CI derived ? Defaults to TRUE. This is a safety op-
tion since sometimes computing BCa bootstrap based CI fails whereas the othertypes of CI can still be derived.
Value
Matrix with the limits of bootstrap based CI for all (defaults) or only the selected predictors (indicesoption). The limits are given in that order: Normal Lower then Upper Limit, Basic Lower then Up-per Limit, Percentile Lower then Upper Limit, BCa Lower then Upper Limit.
Author(s)
Frederic Bertrand<[email protected]>http://www-irma.u-strasbg.fr/~fbertran/
See Also
See also bootpls and bootplsglm.
Examples
data(Cornell)
#Lazraq-Cleroux PLS (Y,X) bootstrapset.seed(250)modpls <- plsR(Y~.,data=Cornell,3)Cornell.bootYX <- bootpls(modpls, R=250)confints.bootpls(Cornell.bootYX,2:8)confints.bootpls(Cornell.bootYX,2:8,typeBCa=FALSE)
26 CorMat
CorMat Correlation matrix for simulating plsR datasets
Description
A correlation matrix to simulate datasets
Usage
data(CorMat)
Format
A data frame with 17 observations on the following 17 variables.
y a numeric vector
x11 a numeric vector
x12 a numeric vector
x13 a numeric vector
x21 a numeric vector
x22 a numeric vector
x31 a numeric vector
x32 a numeric vector
x33 a numeric vector
x34 a numeric vector
x41 a numeric vector
x42 a numeric vector
x51 a numeric vector
x61 a numeric vector
x62 a numeric vector
x63 a numeric vector
x64 a numeric vector
Source
Handmade.
References
Nicolas Meyer, Myriam Maumy-Bertrand et Frederic Bertrand (2010). Comparing the linear andthe logistic PLS regression with qualitative predictors: application to allelotyping data. Journal dela Societe Francaise de Statistique, 151(2), pages 1-18. http://smf4.emath.fr/Publications/JSFdS/151_2/pdf/sfds_jsfds_151_2_1-18.pdf
Cornell 27
Examples
data(CorMat)str(CorMat)
Cornell Cornell dataset
Description
The famous Cornell dataset. A mixture experiment on X1, X2, X3, X4, X5, X6 and X7 to analyseoctane degree (Y) in gazoline.
Usage
data(Cornell)
Format
A data frame with 12 observations on the following 8 variables.
X1 a numeric vector
X2 a numeric vector
X3 a numeric vector
X4 a numeric vector
X5 a numeric vector
X6 a numeric vector
X7 a numeric vector
Y response value: a numeric vector
Source
M. Tenenhaus. (1998). La regression PLS, Theorie et pratique. Editions Technip, Paris.
References
N. Kettaneh-Wold. Analysis of mixture data with partial least squares. (1992). Chemometrics andIntelligent Laboratory Systems, 14(1):57-69.
Examples
data(Cornell)str(Cornell)
28 cv.plsR
cv.plsR Partial least squares regression models with k-fold cross-validation
Description
This function implements k-fold cross-validation on complete or incomplete datasets for partialleast squares regression models
Usage
cv.plsR(x, ...)## Default S3 method:cv.plsRmodel(dataY,dataX,nt=2,limQ2set=.0975,modele="pls",K=5, NK=1, grouplist=NULL, random=TRUE, scaleX=TRUE,scaleY=NULL, keepcoeffs=FALSE, keepfolds=FALSE, keepdataY=TRUE,keepMclassed=FALSE, tol_Xi=10^(-12), weights, verbose=TRUE)## S3 method for class 'formula'cv.plsRmodel(formula,data=NULL,nt=2,limQ2set=.0975,modele="pls",K=5, NK=1, grouplist=NULL, random=TRUE, scaleX=TRUE,scaleY=NULL, keepcoeffs=FALSE, keepfolds=FALSE, keepdataY=TRUE,keepMclassed=FALSE, tol_Xi=10^(-12), weights,subset,contrasts=NULL, verbose=TRUE)PLS_lm_kfoldcv(dataY, dataX, nt = 2, limQ2set = 0.0975, modele = "pls",K = 5, NK = 1, grouplist = NULL, random = TRUE, scaleX = TRUE,scaleY = NULL, keepcoeffs = FALSE, keepfolds = FALSE, keepdataY = TRUE,keepMclassed=FALSE, tol_Xi = 10^(-12), weights, verbose=TRUE)PLS_lm_kfoldcv_formula(formula,data=NULL,nt=2,limQ2set=.0975,modele="pls",K=5, NK=1, grouplist=NULL, random=TRUE, scaleX=TRUE,scaleY=NULL, keepcoeffs=FALSE, keepfolds=FALSE, keepdataY=TRUE,keepMclassed=FALSE, tol_Xi=10^(-12), weights,subset,contrasts=NULL,verbose=TRUE)
Arguments
x a formula or a response (training) dataset
dataY response (training) dataset
dataX predictor(s) (training) dataset
formula an object of class "formula" (or one that can be coerced to that class): a sym-bolic description of the model to be fitted. The details of model specification aregiven under ’Details’.
data an optional data frame, list or environment (or object coercible by as.data.frameto a data frame) containing the variables in the model. If not found in data,the variables are taken from environment(formula), typically the environmentfrom which plsRglm is called.
nt number of components to be extracted
limQ2set limit value for the Q2
modele name of the PLS model to be fitted, only ("pls" available for this fonction.

cv.plsR 29
K number of groups. Defaults to 5.
NK number of times the group division is made
grouplist to specify the members of the K groups
random should the K groups be made randomly. Defaults to TRUE
scaleX scale the predictor(s) : must be set to TRUE for modele="pls" and should befor glms pls.
scaleY scale the response : Yes/No. Ignored since non always possible for glm re-sponses.
keepcoeffs shall the coefficients for each model be returned
keepfolds shall the groups’ composition be returned
keepdataY shall the observed value of the response for each one of the predicted value bereturned
keepMclassed shall the number of miss classed be returned
tol_Xi minimal value for Norm2(Xi) and det(pp′× pp) if there is any missing value inthe dataX. It defaults to 10−12
weights an optional vector of ’prior weights’ to be used in the fitting process. Should beNULL or a numeric vector.
subset an optional vector specifying a subset of observations to be used in the fittingprocess.
contrasts an optional list. See the contrasts.arg of model.matrix.default.
verbose should info messages be displayed ?
... arguments to pass to cv.plsRmodel.default or to cv.plsRmodel.formula
Details
Predicts 1 group with the K-1 other groups. Leave one out cross validation is thus obtained forK==nrow(dataX).
A typical predictor has the form response ~ terms where response is the (numeric) response vectorand terms is a series of terms which specifies a linear predictor for response. A terms specificationof the form first + second indicates all the terms in first together with all the terms in second withany duplicates removed.
A specification of the form first:second indicates the the set of terms obtained by taking the interac-tions of all terms in first with all terms in second. The specification first*second indicates the crossof first and second. This is the same as first + second + first:second.
The terms in the formula will be re-ordered so that main effects come first, followed by the interac-tions, all second-order, all third-order and so on: to avoid this pass a terms object as the formula.
Non-NULL weights can be used to indicate that different observations have different dispersions(with the values in weights being inversely proportional to the dispersions); or equivalently, whenthe elements of weights are positive integers w_i, that each response y_i is the mean of w_i unit-weight observations.

30 cv.plsR
Value
An object of class "cv.plsRmodel".
results_kfolds list of NK. Each element of the list sums up the results for a group division:
list of K matrices of size about nrow(dataX)/K * nt with the predicted valuesfor a growing number of components
. . . . . .list of K matrices of size about nrow(dataX)/K * nt with the predicted values
for a growing number of components
folds list of NK. Each element of the list sums up the results for a group division:
list of K vectors of length about nrow(dataX) with the numbers of the rows ofdataX that were used as a training set
. . . . . .list of K vectors of length about nrow(dataX) with the numbers of the rows of
dataX that were used as a training set
dataY_kfolds list of NK. Each element of the list sums up the results for a group division:
list of K matrices of size about nrow(dataX)/K * 1 with the observed valuesof the response
. . . . . .list of K matrices of size about nrow(dataX)/K * 1 with the observed values
of the response
call the call of the function
Note
Work for complete and incomplete datasets.
Author(s)
Frederic Bertrand<[email protected]>http://www-irma.u-strasbg.fr/~fbertran/
References
Nicolas Meyer, Myriam Maumy-Bertrand et Frederic Bertrand (2010). Comparing the linear andthe logistic PLS regression with qualitative predictors: application to allelotyping data. Journal dela Societe Francaise de Statistique, 151(2), pages 1-18. http://smf4.emath.fr/Publications/JSFdS/151_2/pdf/sfds_jsfds_151_2_1-18.pdf
See Also
Summary method summary.cv.plsRmodel. kfolds2coeff, kfolds2Pressind, kfolds2Press,kfolds2Mclassedind, kfolds2Mclassed and kfolds2CVinfos_lm to extract and transform re-sults from k-fold cross-validation.
cv.plsRglm 31
Examples
data(Cornell)XCornell<-Cornell[,1:7]yCornell<-Cornell[,8]
#Leave one out CV (K=nrow(Cornell)) one time (NK=1)bbb <- cv.plsR(dataY=yCornell,dataX=XCornell,nt=6,K=nrow(Cornell),NK=1)bbb2 <- cv.plsR(Y~.,data=Cornell,nt=6,K=12,NK=1)(sum1<-summary(bbb))
#6-fold CV (K=6) two times (NK=2)#use random=TRUE to randomly create folds for repeated CVbbb3 <- cv.plsR(dataY=yCornell,dataX=XCornell,nt=6,K=6,NK=2)bbb4 <- cv.plsR(Y~.,data=Cornell,nt=6,K=6,NK=2)(sum3<-summary(bbb3))
cvtable(sum1)cvtable(sum3)rm(list=c("XCornell","yCornell","bbb","bbb2","bbb3","bbb4"))
cv.plsRglm Partial least squares regression glm models with k-fold cross valida-tion
Description
This function implements k-fold cross-validation on complete or incomplete datasets for partialleast squares regression generalized linear models
Usage
cv.plsRglm(x, ...)## Default S3 method:cv.plsRglmmodel(dataY,dataX,nt=2,limQ2set=.0975,modele="pls", family=NULL, K=5, NK=1, grouplist=NULL, random=TRUE,scaleX=TRUE, scaleY=NULL, keepcoeffs=FALSE, keepfolds=FALSE,keepdataY=TRUE, keepMclassed=FALSE, tol_Xi=10^(-12), weights, method,verbose=TRUE)## S3 method for class 'formula'cv.plsRglmmodel(formula,data=NULL,nt=2,limQ2set=.0975,modele="pls", family=NULL, K=5, NK=1, grouplist=NULL, random=TRUE,scaleX=TRUE, scaleY=NULL, keepcoeffs=FALSE, keepfolds=FALSE,keepdataY=TRUE, keepMclassed=FALSE, tol_Xi=10^(-12),weights,subset,start=NULL,etastart,mustart,offset,method,control= list(),contrasts=NULL,verbose=TRUE)PLS_glm_kfoldcv(dataY, dataX, nt = 2, limQ2set = 0.0975, modele = "pls",family = NULL, K = 5, NK = 1, grouplist = NULL, random = TRUE,scaleX = TRUE, scaleY = NULL, keepcoeffs = FALSE, keepfolds = FALSE,
32 cv.plsRglm
keepdataY = TRUE, keepMclassed=FALSE, tol_Xi = 10^(-12), weights, method,verbose=TRUE)PLS_glm_kfoldcv_formula(formula,data=NULL,nt=2,limQ2set=.0975,modele="pls",family=NULL, K=5, NK=1, grouplist=NULL, random=TRUE,scaleX=TRUE, scaleY=NULL, keepcoeffs=FALSE, keepfolds=FALSE, keepdataY=TRUE,keepMclassed=FALSE, tol_Xi=10^(-12),weights,subset,start=NULL,etastart,mustart,offset,method,control= list(),contrasts=NULL, verbose=TRUE)
Arguments
x a formula or a response (training) dataset
dataY response (training) dataset
dataX predictor(s) (training) dataset
formula an object of class "formula" (or one that can be coerced to that class): a sym-bolic description of the model to be fitted. The details of model specification aregiven under ’Details’.
data an optional data frame, list or environment (or object coercible by as.data.frameto a data frame) containing the variables in the model. If not found in data,the variables are taken from environment(formula), typically the environmentfrom which plsRglm is called.
nt number of components to be extracted
limQ2set limit value for the Q2
modele name of the PLS glm model to be fitted ("pls", "pls-glm-Gamma", "pls-glm-gaussian","pls-glm-inverse.gaussian", "pls-glm-logistic", "pls-glm-poisson","pls-glm-polr"). Use "modele=pls-glm-family" to enable the family op-tion.
family a description of the error distribution and link function to be used in the model.This can be a character string naming a family function, a family function or theresult of a call to a family function. (See family for details of family functions.)To use the family option, please set modele="pls-glm-family". User definedfamilies can also be defined. See details.
K number of groups. Defaults to 5.
NK number of times the group division is made
grouplist to specify the members of the K groups
random should the K groups be made randomly. Defaults to TRUE
scaleX scale the predictor(s) : must be set to TRUE for modele="pls" and should befor glms pls.
scaleY scale the response : Yes/No. Ignored since non always possible for glm re-sponses.
keepcoeffs shall the coefficients for each model be returned
keepfolds shall the groups’ composition be returned
keepdataY shall the observed value of the response for each one of the predicted value bereturned
cv.plsRglm 33
keepMclassed shall the number of miss classed be returned (unavailable)
tol_Xi minimal value for Norm2(Xi) and det(pp′× pp) if there is any missing value inthe dataX. It defaults to 10−12
weights an optional vector of ’prior weights’ to be used in the fitting process. Should beNULL or a numeric vector.
subset an optional vector specifying a subset of observations to be used in the fittingprocess.
start starting values for the parameters in the linear predictor.
etastart starting values for the linear predictor.
mustart starting values for the vector of means.
offset this can be used to specify an a priori known component to be included in thelinear predictor during fitting. This should be NULL or a numeric vector of lengthequal to the number of cases. One or more offset terms can be included in theformula instead or as well, and if more than one is specified their sum is used.See model.offset.
method for fitting glms with glm ("pls-glm-Gamma", "pls-glm-gaussian", "pls-glm-inverse.gaussian", "pls-glm-logistic", "pls-glm-poisson", "modele=pls-glm-family")the method to be used in fitting the model. The default method "glm.fit"uses iteratively reweighted least squares (IWLS). User-supplied fitting func-tions can be supplied either as a function or a character string naming afunction, with a function which takes the same arguments as glm.fit. If"model.frame", the model frame is returned.
pls-glm-polr logistic, probit, complementary log-log or cauchit (correspond-ing to a Cauchy latent variable).
control a list of parameters for controlling the fitting process. For glm.fit this is passedto glm.control.
contrasts an optional list. See the contrasts.arg of model.matrix.default.
verbose should info messages be displayed ?
... arguments to pass to cv.plsRglmmodel.default or to cv.plsRglmmodel.formula
Details
Predicts 1 group with the K-1 other groups. Leave one out cross validation is thus obtained forK==nrow(dataX).
There are seven different predefined models with predefined link functions available :
"pls" ordinary pls models
"pls-glm-Gamma" glm gaussian with inverse link pls models
"pls-glm-gaussian" glm gaussian with identity link pls models
"pls-glm-inverse-gamma" glm binomial with square inverse link pls models
"pls-glm-logistic" glm binomial with logit link pls models
"pls-glm-poisson" glm poisson with log link pls models
"pls-glm-polr" glm polr with logit link pls models
34 cv.plsRglm
Using the "family=" option and setting "modele=pls-glm-family" allows changing the familyand link function the same way as for the glm function. As a consequence user-specified familiescan also be used.
The gaussian family accepts the links (as names) identity, log and inverse.
The binomial family accepts the links logit, probit, cauchit, (corresponding to logistic, nor-mal and Cauchy CDFs respectively) log and cloglog (complementary log-log).
The Gamma family accepts the links inverse, identity and log.
The poisson family accepts the links log, identity, and sqrt.
The inverse.gaussian family accepts the links 1/mu^2, inverse, identity and log.
The quasi family accepts the links logit, probit, cloglog, identity, inverse, log, 1/mu^2and sqrt.
The function power can be used to create a power link function.
. . . arguments to pass to cv.plsRglmmodel.default or to cv.plsRglmmodel.formula
A typical predictor has the form response ~ terms where response is the (numeric) response vectorand terms is a series of terms which specifies a linear predictor for response. A terms specificationof the form first + second indicates all the terms in first together with all the terms in second withany duplicates removed.
A specification of the form first:second indicates the the set of terms obtained by taking the interac-tions of all terms in first with all terms in second. The specification first*second indicates the crossof first and second. This is the same as first + second + first:second.
The terms in the formula will be re-ordered so that main effects come first, followed by the interac-tions, all second-order, all third-order and so on: to avoid this pass a terms object as the formula.
Non-NULL weights can be used to indicate that different observations have different dispersions(with the values in weights being inversely proportional to the dispersions); or equivalently, whenthe elements of weights are positive integers w_i, that each response y_i is the mean of w_i unit-weight observations.
Value
An object of class "cv.plsRglmmodel".
results_kfolds list of NK. Each element of the list sums up the results for a group division:
list of K matrices of size about nrow(dataX)/K * nt with the predicted valuesfor a growing number of components
. . . . . .list of K matrices of size about nrow(dataX)/K * nt with the predicted values
for a growing number of components
folds list of NK. Each element of the list sums up the informations for a group division:
list of K vectors of length about nrow(dataX) with the numbers of the rows ofdataX that were used as a training set
. . . . . .

cv.plsRglm 35
list of K vectors of length about nrow(dataX) with the numbers of the rows ofdataX that were used as a training set
dataY_kfolds list of NK. Each element of the list sums up the results for a group division:
list of K matrices of size about nrow(dataX)/K * 1 with the observed valuesof the response
. . . . . .list of K matrices of size about nrow(dataX)/K * 1 with the observed values
of the response
call the call of the function
Note
Work for complete and incomplete datasets.
Author(s)
Frederic Bertrand<[email protected]>http://www-irma.u-strasbg.fr/~fbertran/
References
Nicolas Meyer, Myriam Maumy-Bertrand et Frederic Bertrand (2010). Comparing the linear andthe logistic PLS regression with qualitative predictors: application to allelotyping data. Journal dela Societe Francaise de Statistique, 151(2), pages 1-18.
See Also
Summary method summary.cv.plsRglmmodel. kfolds2coeff, kfolds2Pressind, kfolds2Press,kfolds2Mclassedind, kfolds2Mclassed and summary to extract and transform results from k-foldcross validation.
Examples
data(Cornell)XCornell<-Cornell[,1:7]yCornell<-Cornell[,8]bbb <- cv.plsRglm(dataY=yCornell,dataX=XCornell,nt=10)(sum1<-summary(bbb))cvtable(sum1)
bbb2 <- cv.plsRglm(dataY=yCornell,dataX=XCornell,nt=3,modele="pls-glm-family",family=gaussian(),K=12)(sum2<-summary(bbb2))cvtable(sum2)
#random=TRUE is the default to randomly create folds for repeated CVbbb3 <- cv.plsRglm(dataY=yCornell,dataX=XCornell,nt=3,modele="pls-glm-family",family=gaussian(),K=6,NK=10)(sum3<-summary(bbb3))
36 cv.plsRglm
plot(cvtable(sum3))
data(aze_compl)Xaze_compl<-aze_compl[,2:34]yaze_compl<-aze_compl$ybbb <- cv.plsRglm(yaze_compl,Xaze_compl,nt=10,K=10,modele="pls",keepcoeffs=TRUE)
#For Jackknife computationskfolds2coeff(bbb)bbb2 <- cv.plsRglm(yaze_compl,Xaze_compl,nt=10,K=10,modele="pls-glm-family",family=binomial(probit),keepcoeffs=TRUE)bbb2 <- cv.plsRglm(yaze_compl,Xaze_compl,nt=10,K=10,modele="pls-glm-logistic",keepcoeffs=TRUE)summary(bbb,MClassed=TRUE)summary(bbb2,MClassed=TRUE)kfolds2coeff(bbb2)
kfolds2Chisqind(bbb2)kfolds2Chisq(bbb2)summary(bbb2)rm(list=c("Xaze_compl","yaze_compl","bbb","bbb2"))
data(pine)Xpine<-pine[,1:10]ypine<-pine[,11]bbb <- cv.plsRglm(dataY=round(ypine),dataX=Xpine,nt=10,modele="pls-glm-family",family=poisson(log),K=10,keepcoeffs=TRUE,keepfolds=FALSE)bbb <- cv.plsRglm(dataY=round(ypine),dataX=Xpine,nt=10,modele="pls-glm-poisson",K=10,keepcoeffs=TRUE,keepfolds=FALSE)
#For Jackknife computationskfolds2coeff(bbb)boxplot(kfolds2coeff(bbb)[,1])
kfolds2Chisqind(bbb)kfolds2Chisq(bbb)summary(bbb)PLS_lm(ypine,Xpine,10,typeVC="standard")$InfCrit
XpineNAX21 <- XpineXpineNAX21[1,2] <- NAbbb2 <- cv.plsRglm(dataY=round(ypine),dataX=XpineNAX21,nt=10,modele="pls-glm-family",family=poisson(log),K=10,keepcoeffs=TRUE,keepfolds=FALSE)bbb2 <- cv.plsRglm(dataY=round(ypine),dataX=XpineNAX21,nt=10,modele="pls-glm-poisson",K=10,keepcoeffs=TRUE,keepfolds=FALSE)
#For Jackknife computationskfolds2coeff(bbb2)boxplot(kfolds2coeff(bbb2)[,1])
cv.plsRglm 37
kfolds2Chisqind(bbb2)kfolds2Chisq(bbb2)summary(bbb2)PLS_lm(ypine,XpineNAX21,10,typeVC="standard")$InfCritrm(list=c("Xpine","XpineNAX21","ypine","bbb","bbb2"))
data(pine)Xpine<-pine[,1:10]ypine<-pine[,11]bbb <- cv.plsRglm(dataY=ypine,dataX=Xpine,nt=10,modele="pls-glm-family",family=Gamma,K=10,keepcoeffs=TRUE,keepfolds=FALSE)bbb <- cv.plsRglm(dataY=ypine,dataX=Xpine,nt=10,modele="pls-glm-Gamma",K=10,keepcoeffs=TRUE,keepfolds=FALSE)
#For Jackknife computationskfolds2coeff(bbb)boxplot(kfolds2coeff(bbb)[,1])
kfolds2Chisqind(bbb)kfolds2Chisq(bbb)summary(bbb)PLS_lm(ypine,Xpine,10,typeVC="standard")$InfCrit
XpineNAX21 <- XpineXpineNAX21[1,2] <- NAbbb2 <- cv.plsRglm(dataY=ypine,dataX=XpineNAX21,nt=10,modele="pls-glm-family",family=Gamma(),K=10,keepcoeffs=TRUE,keepfolds=FALSE)bbb2 <- cv.plsRglm(dataY=ypine,dataX=XpineNAX21,nt=10,modele="pls-glm-Gamma",K=10,keepcoeffs=TRUE,keepfolds=FALSE)
#For Jackknife computationskfolds2coeff(bbb2)boxplot(kfolds2coeff(bbb2)[,1])
kfolds2Chisqind(bbb2)kfolds2Chisq(bbb2)summary(bbb2)PLS_lm(ypine,XpineNAX21,10,typeVC="standard")$InfCritrm(list=c("Xpine","XpineNAX21","ypine","bbb","bbb2"))
data(Cornell)XCornell<-Cornell[,1:7]yCornell<-Cornell[,8]bbb <- cv.plsRglm(dataY=yCornell,dataX=XCornell,nt=10,NK=1,modele="pls")summary(bbb)
cv.plsRglm(dataY=yCornell,dataX=XCornell,nt=3,modele="pls-glm-inverse.gaussian",K=12)cv.plsRglm(dataY=yCornell,dataX=XCornell,nt=3,modele="pls-glm-family",family=inverse.gaussian,K=12)
38 cv.plsRglm
cv.plsRglm(dataY=yCornell,dataX=XCornell,nt=3,modele="pls-glm-inverse.gaussian",K=6,NK=2)$results_kfoldscv.plsRglm(dataY=yCornell,dataX=XCornell,nt=3,modele="pls-glm-family",family=inverse.gaussian(),K=6,NK=2)$results_kfoldscv.plsRglm(dataY=yCornell,dataX=XCornell,nt=3,modele="pls-glm-inverse.gaussian",K=6,NK=2)$results_kfoldscv.plsRglm(dataY=yCornell,dataX=XCornell,nt=3,modele="pls-glm-family",family=inverse.gaussian(link = "1/mu^2"),K=6,NK=2)$results_kfolds
bbb2 <- cv.plsRglm(dataY=yCornell,dataX=XCornell,nt=10,modele="pls-glm-inverse.gaussian",keepcoeffs=TRUE)
#For Jackknife computationskfolds2coeff(bbb2)boxplot(kfolds2coeff(bbb2)[,1])
kfolds2Chisqind(bbb2)kfolds2Chisq(bbb2)summary(bbb2)PLS_lm(yCornell,XCornell,10,typeVC="standard")$InfCritrm(list=c("XCornell","yCornell","bbb","bbb2"))
data(Cornell)bbb <- cv.plsRglm(Y~.,data=Cornell,nt=10,NK=1,modele="pls")summary(bbb)
cv.plsRglm(Y~.,data=Cornell,nt=3,modele="pls-glm-family",family=gaussian(),K=12)cv.plsRglm(Y~.,data=Cornell,nt=3,modele="pls-glm-family",family=gaussian(),K=6,NK=2,random=TRUE,keepfolds=TRUE)$results_kfolds
#Different ways of model specificationscv.plsRglm(Y~.,data=Cornell,nt=3,modele="pls-glm-family",family=gaussian(),K=6,NK=2)$results_kfoldscv.plsRglm(Y~.,data=Cornell,nt=3,modele="pls-glm-family",family=gaussian,K=6,NK=2)$results_kfoldscv.plsRglm(Y~.,data=Cornell,nt=3,modele="pls-glm-family",family=gaussian(),K=6,NK=2)$results_kfoldscv.plsRglm(Y~.,data=Cornell,nt=3,modele="pls-glm-family",family=gaussian(link=log),K=6,NK=2)$results_kfolds
bbb2 <- cv.plsRglm(Y~.,data=Cornell,nt=10,modele="pls-glm-gaussian",keepcoeffs=TRUE)bbb2 <- cv.plsRglm(Y~.,data=Cornell,nt=3,modele="pls-glm-family",family=gaussian(link=log),K=6,keepcoeffs=TRUE)
#For Jackknife computationskfolds2coeff(bbb2)boxplot(kfolds2coeff(bbb2)[,1])
kfolds2Chisqind(bbb2)kfolds2Chisq(bbb2)summary(bbb2)
cv.plsRglm 39
PLS_lm_formula(Y~.,data=Cornell,10,typeVC="standard")$InfCritrm(list=c("bbb","bbb2"))
data(pine)bbb <- cv.plsRglm(x11~.,data=pine,nt=10,modele="pls-glm-family",family=gaussian(log),K=10,keepcoeffs=TRUE,keepfolds=FALSE)bbb <- cv.plsRglm(x11~.,data=pine,nt=10,modele="pls-glm-family",family=gaussian(),K=10,keepcoeffs=TRUE,keepfolds=FALSE)
#For Jackknife computationskfolds2coeff(bbb)boxplot(kfolds2coeff(bbb)[,1])
kfolds2Chisqind(bbb)kfolds2Chisq(bbb)summary(bbb)PLS_lm_formula(x11~.,data=pine,nt=10,typeVC="standard")$InfCrit
pineNAX21 <- pinepineNAX21[1,2] <- NAbbb2 <- cv.plsRglm(x11~.,data=pineNAX21,nt=10,modele="pls-glm-family",family=gaussian(log),K=10,keepcoeffs=TRUE,keepfolds=FALSE)bbb2 <- cv.plsRglm(x11~.,data=pineNAX21,nt=10,modele="pls-glm-gaussian",K=10,keepcoeffs=TRUE,keepfolds=FALSE)
#For Jackknife computationskfolds2coeff(bbb2)boxplot(kfolds2coeff(bbb2)[,1])
kfolds2Chisqind(bbb2)kfolds2Chisq(bbb2)summary(bbb2)PLS_lm_formula(x11~.,data=pineNAX21,nt=10,typeVC="standard")$InfCritrm(list=c("pineNAX21","bbb","bbb2"))
data(aze_compl)bbb <- cv.plsRglm(y~.,data=aze_compl,nt=10,K=10,modele="pls",keepcoeffs=TRUE)
#For Jackknife computationskfolds2coeff(bbb)bbb2 <- cv.plsRglm(y~.,data=aze_compl,nt=3,K=10,modele="pls-glm-family",family=binomial(probit),keepcoeffs=TRUE)bbb2 <- cv.plsRglm(y~.,data=aze_compl,nt=3,K=10,modele="pls-glm-logistic",keepcoeffs=TRUE)summary(bbb,MClassed=TRUE)summary(bbb2,MClassed=TRUE)kfolds2coeff(bbb2)
kfolds2Chisqind(bbb2)kfolds2Chisq(bbb2)
40 cv.plsRglm
summary(bbb2)rm(list=c("bbb","bbb2"))
data(pine)bbb <- cv.plsRglm(round(x11)~.,data=pine,nt=10,modele="pls-glm-family",family=poisson(log),K=10,keepcoeffs=TRUE,keepfolds=FALSE)bbb <- cv.plsRglm(round(x11)~.,data=pine,nt=10,modele="pls-glm-poisson",K=10,keepcoeffs=TRUE,keepfolds=FALSE)
#For Jackknife computationskfolds2coeff(bbb)boxplot(kfolds2coeff(bbb)[,1])
kfolds2Chisqind(bbb)kfolds2Chisq(bbb)summary(bbb)PLS_lm_formula(x11~.,data=pine,10,typeVC="standard")$InfCrit
pineNAX21 <- pinepineNAX21[1,2] <- NAbbb2 <- cv.plsRglm(round(x11)~.,data=pineNAX21,nt=10,modele="pls-glm-family",family=poisson(log),K=10,keepcoeffs=TRUE,keepfolds=FALSE)bbb2 <- cv.plsRglm(round(x11)~.,data=pineNAX21,nt=10,modele="pls-glm-poisson",K=10,keepcoeffs=TRUE,keepfolds=FALSE)
#For Jackknife computationskfolds2coeff(bbb2)boxplot(kfolds2coeff(bbb2)[,1])
kfolds2Chisqind(bbb2)kfolds2Chisq(bbb2)summary(bbb2)PLS_lm_formula(x11~.,data=pineNAX21,10,typeVC="standard")$InfCritrm(list=c("pineNAX21","bbb","bbb2"))
data(pine)bbb <- cv.plsRglm(x11~.,data=pine,nt=10,modele="pls-glm-family",family=Gamma,K=10,keepcoeffs=TRUE,keepfolds=FALSE)bbb <- cv.plsRglm(x11~.,data=pine,nt=10,modele="pls-glm-Gamma",K=10,keepcoeffs=TRUE,keepfolds=FALSE)
#For Jackknife computationskfolds2coeff(bbb)boxplot(kfolds2coeff(bbb)[,1])
kfolds2Chisqind(bbb)kfolds2Chisq(bbb)summary(bbb)PLS_lm_formula(x11~.,data=pine,10,typeVC="standard")$InfCrit
cv.plsRglm 41
pineNAX21 <- pinepineNAX21[1,2] <- NAbbb2 <- cv.plsRglm(x11~.,data=pineNAX21,nt=10,modele="pls-glm-family",family=Gamma(),K=10,keepcoeffs=TRUE,keepfolds=FALSE)bbb2 <- cv.plsRglm(x11~.,data=pineNAX21,nt=10,modele="pls-glm-Gamma",K=10,keepcoeffs=TRUE,keepfolds=FALSE)
#For Jackknife computationskfolds2coeff(bbb2)boxplot(kfolds2coeff(bbb2)[,1])
kfolds2Chisqind(bbb2)kfolds2Chisq(bbb2)summary(bbb2)PLS_lm_formula(x11~.,data=pineNAX21,10,typeVC="standard")$InfCritrm(list=c("pineNAX21","bbb","bbb2"))
data(Cornell)bbb <- cv.plsRglm(Y~.,data=Cornell,nt=10,NK=1,modele="pls")summary(bbb)
cv.plsRglm(Y~.,data=Cornell,nt=3,modele="pls-glm-inverse.gaussian",K=12)cv.plsRglm(Y~.,data=Cornell,nt=3,modele="pls-glm-family",family=inverse.gaussian,K=12)cv.plsRglm(Y~.,data=Cornell,nt=3,modele="pls-glm-inverse.gaussian",K=6,NK=2)$results_kfoldscv.plsRglm(Y~.,data=Cornell,nt=3,modele="pls-glm-family",family=inverse.gaussian(),K=6,NK=2)$results_kfoldscv.plsRglm(Y~.,data=Cornell,nt=3,modele="pls-glm-inverse.gaussian",K=6,NK=2)$results_kfoldscv.plsRglm(Y~.,data=Cornell,nt=3,modele="pls-glm-family",family=inverse.gaussian(link = "1/mu^2"),K=6,NK=2)$results_kfolds
bbb2 <- cv.plsRglm(Y~.,data=Cornell,nt=10,modele="pls-glm-inverse.gaussian",keepcoeffs=TRUE)
#For Jackknife computationskfolds2coeff(bbb2)boxplot(kfolds2coeff(bbb2)[,1])
kfolds2Chisqind(bbb2)kfolds2Chisq(bbb2)summary(bbb2)PLS_lm_formula(Y~.,data=Cornell,10,typeVC="standard")$InfCritrm(list=c("bbb","bbb2"))
data(bordeaux)bbb <- cv.plsRglm(Quality~.,data=bordeaux,10,modele="pls-glm-polr",K=7)summary(bbb)
42 cvtable
bordeauxNA<-bordeauxbordeauxNA[1,1] <- NAbbbNA <- cv.plsRglm(Quality~Temperature+Sunshine+Heat+Rain,data=bordeauxNA,10,modele="pls-glm-polr",K=10)summary(bbbNA)rm(list=c("bbb","bbbNA"))
bbb2 <- cv.plsRglm(Quality~.,data=bordeaux,nt=2,K=7,modele="pls-glm-polr",method="logistic")bbb3 <- cv.plsRglm(Quality~.,data=bordeaux,nt=2,K=7,modele="pls-glm-polr",method="probit")bbb4 <- cv.plsRglm(Quality~.,data=bordeaux,nt=2,K=7,modele="pls-glm-polr",method="cloglog")bbb5 <- cv.plsRglm(Quality~.,data=bordeaux,nt=2,K=7,modele="pls-glm-polr",method="cauchit")
summary(bbb2)summary(bbb3)summary(bbb4)summary(bbb5)rm(list=c("bbb","bbbNA","bbb2","bbb3","bbb4","bbb5"))
cvtable Table method for summary of cross validated PLSR and PLSGLR mod-els
Description
The function cvtable is wrapper of cvtable.plsR and cvtable.plsRglm that provides a tablesummary for the classes "summary.cv.plsRmodel" and "summary.cv.plsRglmmodel"
Usage
cvtable.plsR(x,verbose=TRUE, ...)cvtable.plsRglm(x,verbose=TRUE, ...)
Arguments
x an object of the class "summary.cv.plsRmodel"
verbose should results be displayed ?
... further arguments to be passed to or from methods.
Value
listList of Information Criteria computed for each fold.

dicho 43
Author(s)
Frederic Bertrand<[email protected]>http://www-irma.u-strasbg.fr/~fbertran/
References
Nicolas Meyer, Myriam Maumy-Bertrand et Frederic Bertrand (2010). Comparing the linear andthe logistic PLS regression with qualitative predictors: application to allelotyping data. Journal dela Societe Francaise de Statistique, 151(2), pages 1-18. http://smf4.emath.fr/Publications/JSFdS/151_2/pdf/sfds_jsfds_151_2_1-18.pdf
See Also
summary
Examples
data(Cornell)XCornell<-Cornell[,1:7]yCornell<-Cornell[,8]cv.modpls <- cv.plsR(dataY=yCornell,dataX=XCornell,nt=6,K=6,NK=100)res.cv.modpls <- cvtable(summary(cv.modpls))plot(res.cv.modpls) #defaults to type="CVQ2"rm(list=c("XCornell","yCornell","cv.modpls","res.cv.modpls"))
data(Cornell)XCornell<-Cornell[,1:7]yCornell<-Cornell[,8]cv.modplsglm <- cv.plsRglm(dataY=yCornell,dataX=XCornell,nt=6,K=6,modele="pls-glm-gaussian",NK=100)res.cv.modplsglm <- cvtable(summary(cv.modplsglm))plot(res.cv.modplsglm) #defaults to type="CVQ2Chi2"rm(list=c("XCornell","yCornell","res.cv.modplsglm"))
dicho Dichotomization
Description
This function takes a real value and converts it to 1 if it is positive and else to 0.
Usage
dicho(val)
44 fowlkes
Arguments
val A real value
Value
0 or 1.
Author(s)
Frédéric Bertrand<[email protected]>http://www-irma.u-strasbg.fr/~fbertran/
See Also
ifelse
Examples
dimX <- 6Astar <- 4(dataAstar4 <- t(replicate(10,simul_data_YX(dimX,Astar))))
dicho(dataAstar4)
rm(list=c("dimX","Astar"))
fowlkes Fowlkes dataset
Description
A classic dataset from Fowlkes.
Usage
data(fowlkes)
Format
A data frame with 9949 observations on the following 13 variables.
Y binary response
MA a numeric vector
MW a numeric vector
NE a numeric vector
NW a numeric vector
infcrit.dof 45
PA a numeric vector
SO a numeric vector
SW a numeric vector
color a numeric vector
age1 a numeric vector
age2 a numeric vector
age3 a numeric vector
sexe a numeric vector
Examples
data(fowlkes)str(fowlkes)
infcrit.dof Information criteria
Description
This function computes information criteria for existing plsR model using Degrees of Freedomestimation.
Usage
infcrit.dof(modplsR, naive = FALSE)
Arguments
modplsR A plsR model i.e. an object returned by one of the functions plsR, plsRmodel.default,plsRmodel.formula, PLS_lm or PLS_lm_formula.
naive A boolean.
Details
If naive=FALSE returns AIC, BIC and gmdl values for estimated and naive degrees of freedom. Ifnaive=TRUE returns NULL.
Value
matrix AIC, BIC and gmdl values or NULL.
Author(s)
Frederic Bertrand<[email protected]>http://www-irma.u-strasbg.fr/~fbertran/
46 kfolds2Chisq
References
M. Hansen, B. Yu. (2001). Model Selection and Minimum Descripion Length Principle, Journal ofthe American Statistical Association, 96, 746-774.N. Kraemer, M. Sugiyama. (2011). The Degrees of Freedom of Partial Least Squares Regression.Journal of the American Statistical Association, 106(494), 697-705.N. Kraemer, M. Sugiyama, M.L. Braun. (2009). Lanczos Approximations for the Speedup ofKernel Partial Least Squares Regression, Proceedings of the Twelfth International Conference onArtificial Intelligence and Statistics (AISTATS), 272-279.
See Also
plsR.dof for degrees of freedom computation and infcrit.dof for computing information criteriadirectly from a previously fitted plsR model.
Examples
data(Cornell)XCornell<-Cornell[,1:7]yCornell<-Cornell[,8]modpls <- plsR(yCornell,XCornell,4)infcrit.dof(modpls)
kfolds2Chisq Computes Predicted Chisquare for k-fold cross-validated partial leastsquares regression models.
Description
This function computes Predicted Chisquare for k-fold cross validated partial least squares regres-sion models.
Usage
kfolds2Chisq(pls_kfolds)
Arguments
pls_kfolds a k-fold cross validated partial least squares regression glm model
Value
list Total Predicted Chisquare vs number of components for the first group partition
... . . .
list Total Predicted Chisquare vs number of components for the last group partition
Note
Use cv.plsRglm to create k-fold cross validated partial least squares regression glm models.

kfolds2Chisq 47
Author(s)
Frederic Bertrand<[email protected]>http://www-irma.u-strasbg.fr/~fbertran/
References
Nicolas Meyer, Myriam Maumy-Bertrand et Frederic Bertrand (2010). Comparing the linear andthe logistic PLS regression with qualitative predictors: application to allelotyping data. Journal dela Societe Francaise de Statistique, 151(2), pages 1-18. http://smf4.emath.fr/Publications/JSFdS/151_2/pdf/sfds_jsfds_151_2_1-18.pdf
See Also
kfolds2coeff, kfolds2Press, kfolds2Pressind, kfolds2Chisqind, kfolds2Mclassedind andkfolds2Mclassed to extract and transforms results from k-fold cross validation.
Examples
data(Cornell)XCornell<-Cornell[,1:7]yCornell<-Cornell[,8]bbb <- cv.plsRglm(dataY=yCornell,dataX=XCornell,nt=3,modele="pls-glm-gaussian",K=16)bbb2 <- cv.plsRglm(dataY=yCornell,dataX=XCornell,nt=3,modele="pls-glm-gaussian",K=5)kfolds2Chisq(bbb)kfolds2Chisq(bbb2)rm(list=c("XCornell","yCornell","bbb","bbb2"))
data(pine)Xpine<-pine[,1:10]ypine<-pine[,11]bbb <- cv.plsRglm(dataY=ypine,dataX=Xpine,nt=4,modele="pls-glm-gaussian")bbb2 <- cv.plsRglm(dataY=ypine,dataX=Xpine,nt=10,modele="pls-glm-gaussian",K=10)kfolds2Chisq(bbb)kfolds2Chisq(bbb2)
XpineNAX21 <- XpineXpineNAX21[1,2] <- NAbbbNA <- cv.plsRglm(dataY=ypine,dataX=XpineNAX21,nt=10,modele="pls",K=10)kfolds2Press(bbbNA)kfolds2Chisq(bbbNA)bbbNA2 <- cv.plsRglm(dataY=ypine,dataX=XpineNAX21,nt=4,modele="pls-glm-gaussian")bbbNA3 <- cv.plsRglm(dataY=ypine,dataX=XpineNAX21,nt=10,modele="pls-glm-gaussian",K=10)kfolds2Chisq(bbbNA2)kfolds2Chisq(bbbNA3)rm(list=c("Xpine","XpineNAX21","ypine","bbb","bbb2","bbbNA","bbbNA2","bbbNA3"))
data(aze_compl)

48 kfolds2Chisqind
Xaze_compl<-aze_compl[,2:34]yaze_compl<-aze_compl$ybbb <- cv.plsRglm(dataY=yaze_compl,dataX=Xaze_compl,nt=4,modele="pls-glm-family",family="binomial")bbb <- cv.plsRglm(dataY=yaze_compl,dataX=Xaze_compl,nt=4,modele="pls-glm-logistic")bbb2 <- cv.plsRglm(dataY=yaze_compl,dataX=Xaze_compl,nt=10,modele="pls-glm-family",family=binomial(),K=10)bbb2 <- cv.plsRglm(dataY=yaze_compl,dataX=Xaze_compl,nt=10,modele="pls-glm-logistic",K=10)kfolds2Chisq(bbb)kfolds2Chisq(bbb2)rm(list=c("Xaze_compl","yaze_compl","bbb","bbb2"))
kfolds2Chisqind Computes individual Predicted Chisquare for k-fold cross validatedpartial least squares regression models.
Description
This function computes individual Predicted Chisquare for k-fold cross validated partial least squaresregression models.
Usage
kfolds2Chisqind(pls_kfolds)
Arguments
pls_kfolds a k-fold cross validated partial least squares regression glm model
Value
list Individual PChisq vs number of components for the first group partition
... . . .
list Individual PChisq vs number of components for the last group partition
Note
Use cv.plsRglm to create k-fold cross validated partial least squares regression glm models.
Author(s)
Frederic Bertrand<[email protected]>http://www-irma.u-strasbg.fr/~fbertran/
kfolds2Chisqind 49
References
Nicolas Meyer, Myriam Maumy-Bertrand et Frederic Bertrand (2010). Comparing the linear andthe logistic PLS regression with qualitative predictors: application to allelotyping data. Journal dela Societe Francaise de Statistique, 151(2), pages 1-18. http://smf4.emath.fr/Publications/JSFdS/151_2/pdf/sfds_jsfds_151_2_1-18.pdf
See Also
kfolds2coeff, kfolds2Press, kfolds2Pressind, kfolds2Chisq, kfolds2Mclassedind and kfolds2Mclassedto extract and transforms results from k-fold cross-validation.
Examples
data(Cornell)XCornell<-Cornell[,1:7]yCornell<-Cornell[,8]bbb <- cv.plsRglm(dataY=yCornell,dataX=XCornell,nt=3,modele="pls-glm-gaussian",K=16)bbb2 <- cv.plsRglm(dataY=yCornell,dataX=XCornell,nt=3,modele="pls-glm-gaussian",K=5)kfolds2Chisqind(bbb)kfolds2Chisqind(bbb2)rm(list=c("XCornell","yCornell","bbb","bbb2"))
data(pine)Xpine<-pine[,1:10]ypine<-pine[,11]bbb <- cv.plsRglm(dataY=ypine,dataX=Xpine,nt=4,modele="pls-glm-gaussian")bbb2 <- cv.plsRglm(dataY=ypine,dataX=Xpine,nt=10,modele="pls-glm-gaussian",K=10)kfolds2Chisqind(bbb)kfolds2Chisqind(bbb2)
XpineNAX21 <- XpineXpineNAX21[1,2] <- NAbbbNA <- cv.plsRglm(dataY=ypine,dataX=XpineNAX21,nt=10,modele="pls",K=10)kfolds2Pressind(bbbNA)kfolds2Chisqind(bbbNA)bbbNA2 <- cv.plsRglm(dataY=ypine,dataX=XpineNAX21,nt=4,modele="pls-glm-gaussian")bbbNA3 <- cv.plsRglm(dataY=ypine,dataX=XpineNAX21,nt=10,modele="pls-glm-gaussian",K=10)kfolds2Chisqind(bbbNA2)kfolds2Chisqind(bbbNA3)rm(list=c("Xpine","XpineNAX21","ypine","bbb","bbb2","bbbNA","bbbNA2","bbbNA3"))
data(aze_compl)Xaze_compl<-aze_compl[,2:34]yaze_compl<-aze_compl$ybbb <- cv.plsRglm(dataY=yaze_compl,dataX=Xaze_compl,nt=4,modele="pls-glm-family",family=binomial())bbb <- cv.plsRglm(dataY=yaze_compl,dataX=Xaze_compl,nt=4,modele="pls-glm-logistic")bbb2 <- cv.plsRglm(dataY=yaze_compl,dataX=Xaze_compl,nt=10,modele="pls-glm-family",family=binomial(),K=10)

50 kfolds2coeff
bbb2 <- cv.plsRglm(dataY=yaze_compl,dataX=Xaze_compl,nt=10,modele="pls-glm-logistic",K=10)kfolds2Chisqind(bbb)kfolds2Chisqind(bbb2)rm(list=c("Xaze_compl","yaze_compl","bbb","bbb2"))
kfolds2coeff Extracts coefficients from k-fold cross validated partial least squaresregression models
Description
This fonction extracts coefficients from k-fold cross validated partial least squares regression mod-els
Usage
kfolds2coeff(pls_kfolds)
Arguments
pls_kfolds an object that is a k-fold cross validated partial least squares regression modelseither lm or glm
Details
This fonctions works for plsR and plsRglm models.
Value
coef.all matrix with the values of the coefficients for each leave one out step or NULL ifanother type of cross validation was used.
Note
Only for NK=1 and leave one out CV
Author(s)
Frederic Bertrand<[email protected]>http://www-irma.u-strasbg.fr/~fbertran/
References
Nicolas Meyer, Myriam Maumy-Bertrand et Frederic Bertrand (2010). Comparing the linear andthe logistic PLS regression with qualitative predictors: application to allelotyping data. Journal dela Societe Francaise de Statistique, 151(2), pages 1-18. http://smf4.emath.fr/Publications/JSFdS/151_2/pdf/sfds_jsfds_151_2_1-18.pdf
kfolds2CVinfos_glm 51
See Also
kfolds2Pressind, kfolds2Press, kfolds2Mclassedind, kfolds2Mclassed and summary to ex-tract and transform results from k-fold cross validation.
Examples
data(Cornell)XCornell<-Cornell[,1:7]yCornell<-Cornell[,8]bbb <- PLS_lm_kfoldcv(dataY=yCornell,dataX=XCornell,nt=3,K=nrow(XCornell),keepcoeffs=TRUE)kfolds2coeff(bbb)boxplot(kfolds2coeff(bbb)[,2])rm(list=c("XCornell","yCornell","Xpine","ypine","bbb"))
data(pine)Xpine<-pine[,1:10]ypine<-pine[,11]bbb2 <- cv.plsR(dataY=ypine,dataX=Xpine,nt=4,K=nrow(Xpine),keepcoeffs=TRUE)kfolds2coeff(bbb2)boxplot(kfolds2coeff(bbb2)[,1])rm(list=c("Xpine","ypine","Xpine","ypine","bbb2"))
kfolds2CVinfos_glm Extracts and computes information criteria and fits statistics for k-foldcross validated partial least squares glm models
Description
This function extracts and computes information criteria and fits statistics for k-fold cross validatedpartial least squares glm models for both formula or classic specifications of the model.
Usage
kfolds2CVinfos_glm(pls_kfolds, MClassed = FALSE,verbose=TRUE)
Arguments
pls_kfolds an object computed using cv.plsRglm
MClassed should number of miss classed be computed ?
verbose should infos be displayed ?
Details
The Mclassed option should only set to TRUE if the response is binary.
52 kfolds2CVinfos_glm
Value
list table of fit statistics for first group partition
... . . .
list table of fit statistics for last group partition
Note
Use summary and cv.plsRglm instead.
Author(s)
Frederic Bertrand<[email protected]>http://www-irma.u-strasbg.fr/~fbertran/
References
Nicolas Meyer, Myriam Maumy-Bertrand et Frederic Bertrand (2010). Comparing the linear andthe logistic PLS regression with qualitative predictors: application to allelotyping data. Journal dela Societe Francaise de Statistique, 151(2), pages 1-18. http://smf4.emath.fr/Publications/JSFdS/151_2/pdf/sfds_jsfds_151_2_1-18.pdf
See Also
kfolds2coeff, kfolds2Pressind, kfolds2Press, kfolds2Mclassedind and kfolds2Mclassedto extract and transforms results from k-fold cross-validation.
Examples
data(Cornell)XCornell<-Cornell[,1:7]yCornell<-Cornell[,8]bbb <- cv.plsRglm(dataY=yCornell,dataX=data.frame(scale(as.matrix(XCornell))[,]),nt=6,K=12,NK=1,keepfolds=FALSE,keepdataY=TRUE,modele="pls")summary(bbb,MClassed=TRUE)rm(list=c("XCornell","yCornell","bbb"))
data(aze_compl)Xaze_compl<-aze_compl[,2:34]yaze_compl<-aze_compl$ybbb <- cv.plsR(yaze_compl,Xaze_compl,nt=10,K=8,modele="pls")summary(bbb,MClassed=TRUE)bbbbis <- cv.plsRglm(yaze_compl,Xaze_compl,nt=10,K=8,modele="pls")summary(bbbbis,MClassed=TRUE)bbba <- cv.plsRglm(yaze_compl,Xaze_compl,nt=10,K=8,modele="pls-glm-family",family=gaussian())summary(bbba,MClassed=TRUE)bbb2 <- cv.plsRglm(yaze_compl,Xaze_compl,nt=10,K=8,
kfolds2Mclassed 53
modele="pls-glm-logistic")summary(bbb2,MClassed=TRUE)bbb2a <- cv.plsRglm(yaze_compl,Xaze_compl,nt=10,K=8,modele="pls-glm-family",family=binomial())summary(bbb2a,MClassed=TRUE)rm(list=c("Xaze_compl","yaze_compl","bbb","bbbbis","bbb2","bbba","bbb2a"))
if(require(chemometrics)){data(hyptis)hyptisyhyptis <- factor(hyptis$Group,ordered=TRUE)Xhyptis <- as.data.frame(hyptis[,c(1:6)])options(contrasts = c("contr.treatment", "contr.poly"))modpls2 <- plsRglm(yhyptis,Xhyptis,6,modele="pls-glm-polr")modpls2$Coeffsmodel_valsmodpls2$InfCritmodpls2$Coeffsmodpls2$std.coeffs
table(yhyptis,predict(modpls2$FinalModel,type="class"))
modpls3 <- PLS_glm(yhyptis[-c(1,2,3)],Xhyptis[-c(1,2,3),],3,modele="pls-glm-polr",dataPredictY=Xhyptis[c(1,2,3),])bbb <- cv.plsRglm(yhyptis,Xhyptis,nt=4,K=10,random=TRUE,modele="pls-glm-polr",keepcoeffs=TRUE)summary(bbb,MClassed=TRUE)}
kfolds2Mclassed Number of missclassified individuals for k-fold cross validated partialleast squares regression models.
Description
This function indicates the total number of missclassified individuals for k-fold cross validatedpartial least squares regression models.
Usage
kfolds2Mclassed(pls_kfolds)
Arguments
pls_kfolds a k-fold cross validated partial least squares regression model used on binarydata

54 kfolds2Mclassed
Value
list Total number of missclassified individuals vs number of components for the firstgroup partition
... . . .
list Total number of missclassified individuals vs number of components for the lastgroup partition
Note
Use cv.plsR to create k-fold cross validated partial least squares regression models.
Author(s)
Frederic Bertrand<[email protected]>http://www-irma.u-strasbg.fr/~fbertran/
References
Nicolas Meyer, Myriam Maumy-Bertrand et Frederic Bertrand (2010). Comparing the linear andthe logistic PLS regression with qualitative predictors: application to allelotyping data. Journal dela Societe Francaise de Statistique, 151(2), pages 1-18. http://smf4.emath.fr/Publications/JSFdS/151_2/pdf/sfds_jsfds_151_2_1-18.pdf
See Also
kfolds2coeff, kfolds2Press, kfolds2Pressind and kfolds2Mclassedind to extract and trans-forms results from k-fold cross validation.
Examples
data(aze_compl)Xaze_compl<-aze_compl[,2:34]yaze_compl<-aze_compl$ybbb <- cv.plsR(dataY=yaze_compl,dataX=Xaze_compl,nt=10,K=8,NK=1)bbb2 <- cv.plsR(dataY=yaze_compl,dataX=Xaze_compl,nt=10,K=8,NK=2)kfolds2Mclassed(bbb)kfolds2Mclassed(bbb2)rm(list=c("Xaze_compl","yaze_compl","bbb","bbb2"))

kfolds2Mclassedind 55
kfolds2Mclassedind Number of missclassified individuals per group for k-fold cross vali-dated partial least squares regression models.
Description
This function indicates the number of missclassified individuals per group for k-fold cross validatedpartial least squares regression models.
Usage
kfolds2Mclassedind(pls_kfolds)
Arguments
pls_kfolds a k-fold cross validated partial least squares regression model used on binarydata
Value
list Number of missclassified individuals per group vs number of components forthe first group partition
... . . .
list Number of missclassified individuals per group vs number of components forthe last group partition
Note
Use cv.plsR or cv.plsRglm to create k-fold cross validated partial least squares regression modelsor generalized linear ones.
Author(s)
Frederic Bertrand<[email protected]>http://www-irma.u-strasbg.fr/~fbertran/
References
Nicolas Meyer, Myriam Maumy-Bertrand et Frederic Bertrand (2010). Comparing the linear andthe logistic PLS regression with qualitative predictors: application to allelotyping data. Journal dela Societe Francaise de Statistique, 151(2), pages 1-18. http://smf4.emath.fr/Publications/JSFdS/151_2/pdf/sfds_jsfds_151_2_1-18.pdf
See Also
kfolds2coeff, kfolds2Press, kfolds2Pressind and kfolds2Mclassed to extract and trans-forms results from k-fold cross-validation.
56 kfolds2Press
Examples
data(aze_compl)Xaze_compl<-aze_compl[,2:34]yaze_compl<-aze_compl$ybbb <- cv.plsR(dataY=yaze_compl,dataX=Xaze_compl,nt=10,K=8,NK=1)bbb2 <- cv.plsR(dataY=yaze_compl,dataX=Xaze_compl,nt=10,K=8,NK=2)kfolds2Mclassedind(bbb)kfolds2Mclassedind(bbb2)rm(list=c("Xaze_compl","yaze_compl","bbb","bbb2"))
kfolds2Press Computes PRESS for k-fold cross validated partial least squares re-gression models.
Description
This function computes PRESS for k-fold cross validated partial least squares regression models.
Usage
kfolds2Press(pls_kfolds)
Arguments
pls_kfolds a k-fold cross validated partial least squares regression model
Value
list Press vs number of components for the first group partition
... . . .
list Press vs number of components for the last group partition
Note
Use cv.plsR to create k-fold cross validated partial least squares regression models.
Author(s)
Frederic Bertrand<[email protected]>http://www-irma.u-strasbg.fr/~fbertran/
kfolds2Pressind 57
References
Nicolas Meyer, Myriam Maumy-Bertrand et Frederic Bertrand (2010). Comparing the linear andthe logistic PLS regression with qualitative predictors: application to allelotyping data. Journal dela Societe Francaise de Statistique, 151(2), pages 1-18. http://smf4.emath.fr/Publications/JSFdS/151_2/pdf/sfds_jsfds_151_2_1-18.pdf
See Also
kfolds2coeff, kfolds2Pressind, kfolds2Mclassedind and kfolds2Mclassed to extract andtransforms results from k-fold cross validation.
Examples
data(Cornell)XCornell<-Cornell[,1:7]yCornell<-Cornell[,8]bbb <- cv.plsR(dataY=yCornell,dataX=data.frame(scale(as.matrix(XCornell))[,]),nt=6,K=12,NK=1)bbb2 <- cv.plsR(dataY=yCornell,dataX=data.frame(scale(as.matrix(XCornell))[,]),nt=6,K=6,NK=1)kfolds2Press(bbb)kfolds2Press(bbb2)rm(list=c("XCornell","yCornell","bbb","bbb2"))
data(pine)Xpine<-pine[,1:10]ypine<-pine[,11]bbb <- cv.plsR(dataY=ypine,dataX=Xpine,nt=10,NK=1)bbb2 <- cv.plsR(dataY=ypine,dataX=Xpine,nt=10,NK=2)kfolds2Press(bbb)kfolds2Press(bbb2)
XpineNAX21 <- XpineXpineNAX21[1,2] <- NAbbbNA <- cv.plsR(dataY=ypine,dataX=XpineNAX21,nt=10,NK=1)bbbNA2 <- cv.plsR(dataY=ypine,dataX=XpineNAX21,nt=10,NK=2)kfolds2Press(bbbNA)kfolds2Press(bbbNA2)rm(list=c("Xpine","XpineNAX21","ypine","bbb","bbb2","bbbNA","bbbNA2"))
kfolds2Pressind Computes individual PRESS for k-fold cross validated partial leastsquares regression models.
Description
This function computes individual PRESS for k-fold cross validated partial least squares regressionmodels.

58 kfolds2Pressind
Usage
kfolds2Pressind(pls_kfolds)
Arguments
pls_kfolds a k-fold cross validated partial least squares regression model
Value
list Individual Press vs number of components for the first group partition
... . . .
list Individual Press vs number of components for the last group partition
Note
Use cv.plsR to create k-fold cross validated partial least squares regression models.
Author(s)
Frederic Bertrand<[email protected]>http://www-irma.u-strasbg.fr/~fbertran/
References
Nicolas Meyer, Myriam Maumy-Bertrand et Frederic Bertrand (2010). Comparing the linear andthe logistic PLS regression with qualitative predictors: application to allelotyping data. Journal dela Societe Francaise de Statistique, 151(2), pages 1-18. http://smf4.emath.fr/Publications/JSFdS/151_2/pdf/sfds_jsfds_151_2_1-18.pdf
See Also
kfolds2coeff, kfolds2Press, kfolds2Mclassedind and kfolds2Mclassed to extract and trans-forms results from k-fold cross validation.
Examples
data(Cornell)XCornell<-Cornell[,1:7]yCornell<-Cornell[,8]bbb <- cv.plsR(dataY=yCornell,dataX=data.frame(scale(as.matrix(XCornell))[,]),nt=6,K=12,NK=1)bbb2 <- cv.plsR(dataY=yCornell,dataX=data.frame(scale(as.matrix(XCornell))[,]),nt=6,K=6,NK=1)kfolds2Pressind(bbb)kfolds2Pressind(bbb2)rm(list=c("XCornell","yCornell","bbb","bbb2"))
data(pine)Xpine<-pine[,1:10]ypine<-pine[,11]
loglikpls 59
bbb <- cv.plsR(dataY=ypine,dataX=Xpine,nt=10,NK=1)bbb2 <- cv.plsR(dataY=ypine,dataX=Xpine,nt=10,NK=2)kfolds2Pressind(bbb)kfolds2Pressind(bbb2)
XpineNAX21 <- XpineXpineNAX21[1,2] <- NAbbbNA <- cv.plsR(dataY=ypine,dataX=XpineNAX21,nt=10,NK=1)bbbNA2 <- cv.plsR(dataY=ypine,dataX=XpineNAX21,nt=10,NK=2)kfolds2Pressind(bbbNA)kfolds2Pressind(bbbNA2)rm(list=c("Xpine","XpineNAX21","ypine","bbb","bbb2","bbbNA","bbbNA2"))
loglikpls loglikelihood function for plsR models
Description
This function provides loglikelihood computation for an univariate plsR model.
Usage
loglikpls(residpls, weights=rep.int(1,length(residpls)))
Arguments
residpls Residuals of a fitted univariate plsR model
weights Weights of observations
Details
Loglikelihood functions for plsR models with univariate response.
Value
real Loglikelihood value
Author(s)
Frederic Bertrand<[email protected]>http://www-irma.u-strasbg.fr/~fbertran/
References
Baibing Li, Julian Morris, Elaine B. Martin, Model selection for partial least squares regression,Chemometrics and Intelligent Laboratory Systems 64 (2002) 79-89. http://dx.doi.org/10.1016/S0169-7439(02)00051-5
60 permcoefs.plsR
See Also
AICpls for AIC computation and logLik for loglikelihood computations for linear models
Examples
data(pine)ypine <- pine[,11]Xpine <- pine[,1:10](Pinscaled <- as.data.frame(cbind(scale(ypine),scale(as.matrix(Xpine)))))colnames(Pinscaled)[1] <- "yy"
lm(yy~x1+x2+x3+x4+x5+x6+x7+x8+x9+x10,data=Pinscaled)
modpls <- plsR(ypine,Xpine,10)modpls$Std.Coeffslm(yy~x1+x2+x3+x4+x5+x6+x7+x8+x9+x10,data=Pinscaled)
AIC(lm(yy~x1+x2+x3+x4+x5+x6+x7+x8+x9+x10,data=Pinscaled))print(logLik(lm(yy~x1+x2+x3+x4+x5+x6+x7+x8+x9+x10,data=Pinscaled)))
sum(dnorm(modpls$RepY, modpls$Std.ValsPredictY, sqrt(mean(modpls$residY^2)), log=TRUE))sum(dnorm(Pinscaled$yy,fitted(lm(yy~x1+x2+x3+x4+x5+x6+x7+x8+x9+x10,data=Pinscaled)),sqrt(mean(residuals(lm(yy~x1+x2+x3+x4+x5+x6+x7+x8+x9+x10,data=Pinscaled))^2)), log=TRUE))loglikpls(modpls$residY)loglikpls(residuals(lm(yy~x1+x2+x3+x4+x5+x6+x7+x8+x9+x10,data=Pinscaled)))AICpls(10,residuals(lm(yy~x1+x2+x3+x4+x5+x6+x7+x8+x9+x10,data=Pinscaled)))AICpls(10,modpls$residY)
permcoefs.plsR Coefficients for permutation bootstrap computations of PLSR models
Description
A function passed to boot to perform bootstrap.
Usage
permcoefs.plsR(dataset,ind,nt,modele, maxcoefvalues,ifbootfail,verbose)
Arguments
dataset dataset to resampleind indices for resamplingnt number of components to usemodele type of modele to use, see plsRmaxcoefvalues maximum values allowed for the estimates of the coefficients to discard those
coming from singular bootstrap samplesifbootfail value to return if the estimation fails on a bootstrap sampleverbose should info messages be displayed ?
permcoefs.plsRglm 61
Value
estimates on a bootstrap sample or ifbootfail value if the bootstrap computation fails.
Author(s)
Frederic Bertrand<[email protected]>http://www-irma.u-strasbg.fr/~fbertran/
See Also
See also bootpls.
Examples
data(Cornell)XCornell<-Cornell[,1:7]yCornell<-Cornell[,8]
# Lazraq-Cleroux PLS (Y,X) bootstrap# statistic=permcoefs.plsR is the default for (Y,X) permutation resampling of PLSR models.set.seed(250)modpls <- plsR(yCornell,XCornell,1)Cornell.bootYX <- bootpls(modpls, sim="permutation", R=250, statistic=permcoefs.plsR)
permcoefs.plsRglm Coefficients for permutation bootstrap computations of PLSGLR mod-els
Description
A function passed to boot to perform bootstrap.
Usage
permcoefs.plsRglm(dataset, ind, nt, modele, family=NULL, maxcoefvalues,ifbootfail,verbose)
Arguments
dataset dataset to resampleind indices for resamplingnt number of components to usemodele type of modele to use, see plsRglmfamily glm family to use, see plsRglmmaxcoefvalues maximum values allowed for the estimates of the coefficients to discard those
coming from singular bootstrap samplesifbootfail value to return if the estimation fails on a bootstrap sampleverbose should info messages be displayed ?
62 permcoefs.plsRglmnp
Value
estimates on a bootstrap sample or ifbootfail value if the bootstrap computation fails.
Author(s)
Frederic Bertrand<[email protected]>http://www-irma.u-strasbg.fr/~fbertran/
See Also
See also bootplsglm.
Examples
data(Cornell)
# (Y,X) bootstrap of a PLSGLR model# statistic=coefs.plsRglm is the default for (Y,X) bootstrap of a PLSGLR models.set.seed(250)modplsglm <- plsRglm(Y~.,data=Cornell,1,modele="pls-glm-family",family=gaussian)Cornell.bootYX <- bootplsglm(modplsglm, R=250, typeboot="plsmodel",sim="permutation", statistic=permcoefs.plsRglm)
permcoefs.plsRglmnp Coefficients for permutation bootstrap computations of PLSGLR mod-els
Description
A function passed to boot to perform bootstrap.
Usage
permcoefs.plsRglmnp(dataRepYtt, ind, nt, modele, family=NULL,maxcoefvalues, wwetoile,ifbootfail)
Arguments
dataRepYtt components’ coordinates to bootstrapind indices for resamplingnt number of components to usemodele type of modele to use, see plsRglmfamily glm family to use, see plsRglmmaxcoefvalues maximum values allowed for the estimates of the coefficients to discard those
coming from singular bootstrap sampleswwetoile values of the Wstar matrix in the original fitifbootfail value to return if the estimation fails on a bootstrap sample

permcoefs.plsRnp 63
Value
estimates on a bootstrap sample or ifbootfail value if the bootstrap computation fails.
Note
~~some notes~~
Author(s)
Frederic Bertrand<[email protected]>http://www-irma.u-strasbg.fr/~fbertran/
See Also
See also bootplsglm
Examples
data(Cornell)
# (Y,X) bootstrap of a PLSGLR model# statistic=coefs.plsRglm is the default for (Y,X) bootstrap of a PLSGLR models.set.seed(250)modplsglm <- plsRglm(Y~.,data=Cornell,1,modele="pls-glm-family",family=gaussian)Cornell.bootYT <- bootplsglm(modplsglm, R=250, statistic=permcoefs.plsRglmnp)
permcoefs.plsRnp Coefficients computation for permutation bootstrap
Description
A function passed to boot to perform bootstrap.
Usage
permcoefs.plsRnp(dataRepYtt,ind,nt,modele, maxcoefvalues,wwetoile,ifbootfail)
Arguments
dataRepYtt components’ coordinates to bootstrapind indices for resamplingnt number of components to usemodele type of modele to use, see plsRglmmaxcoefvalues maximum values allowed for the estimates of the coefficients to discard those
coming from singular bootstrap sampleswwetoile values of the Wstar matrix in the original fitifbootfail value to return if the estimation fails on a bootstrap sample
64 pine
Value
estimates on a bootstrap sample or ifbootfail value if the bootstrap computation fails.
Author(s)
Frederic Bertrand<[email protected]>http://www-irma.u-strasbg.fr/~fbertran/
See Also
See also bootpls
Examples
data(Cornell)XCornell<-Cornell[,1:7]yCornell<-Cornell[,8]
# Lazraq-Cleroux PLS (Y,X) bootstrap# statistic=coefs.plsR is the default for (Y,X) resampling of PLSR models.set.seed(250)modpls <- plsR(yCornell,XCornell,1)Cornell.bootYT <- bootpls(modpls, R=250, typeboot="fmodel_np", sim="permutation",statistic=permcoefs.plsRnp)
pine Pine dataset
Description
The caterpillar dataset was extracted from a 1973 study on pine processionary caterpillars. It as-sesses the influence of some forest settlement characteristics on the development of caterpillarcolonies. The response variable is the logarithmic transform of the average number of nests ofcaterpillars per tree in an area of 500 square meters (x11). There are k=10 potentially explanatoryvariables defined on n=33 areas.
Usage
data(pine)
Format
A data frame with 33 observations on the following 11 variables.
x1 altitude (in meters)
x2 slope (en degrees)
x3 number of pines in the area
pine_full 65
x4 height (in meters) of the tree sampled at the center of the area
x5 diameter (in meters) of the tree sampled at the center of the area
x6 index of the settlement density
x7 orientation of the area (from 1 if southbound to 2 otherwise)
x8 height (in meters) of the dominant tree
x9 number of vegetation strata
x10 mix settlement index (from 1 if not mixed to 2 if mixed)
x11 logarithmic transform of the average number of nests of caterpillars per tree
Details
These caterpillars got their names from their habit of moving over the ground in incredibly longhead-to-tail processions when leaving their nest to create a new colony.
The pine_sup dataset can be used as a test set to assess model prediction error of a model trainedon the pine dataset.
Source
Tomassone R., Audrain S., Lesquoy-de Turckeim E., Millier C. (1992), “La regression, nouveauxregards sur une ancienne methode statistique”, INRA, Actualites Scientifiques et Agronomiques,Masson, Paris.
References
J.-M. Marin, C. Robert. (2007). Bayesian Core: A Practical Approach to Computational BayesianStatistics. Springer, New-York, pages 48-49.
Examples
data(pine)str(pine)
pine_full Complete Pine dataset
Description
This is the complete caterpillar dataset from a 1973 study on pine_full processionary caterpillars.It assesses the influence of some forest settlement characteristics on the development of caterpillarcolonies. The response variable is the logarithmic transform of the average number of nests ofcaterpillars per tree in an area of 500 square meters (x11). There are k=10 potentially explanatoryvariables defined on n=55 areas.
66 pine_full
Usage
data(pine_full)
Format
A data frame with 55 observations on the following 11 variables.
x1 altitude (in meters)
x2 slope (en degrees)
x3 number of pine_fulls in the area
x4 height (in meters) of the tree sampled at the center of the area
x5 diameter (in meters) of the tree sampled at the center of the area
x6 index of the settlement density
x7 orientation of the area (from 1 if southbound to 2 otherwise)
x8 height (in meters) of the dominant tree
x9 number of vegetation strata
x10 mix settlement index (from 1 if not mixed to 2 if mixed)
x11 logarithmic transform of the average number of nests of caterpillars per tree
Details
These caterpillars got their names from their habit of moving over the ground in incredibly longhead-to-tail processions when leaving their nest to create a new colony.
Source
Tomassone R., Audrain S., Lesquoy-de Turckeim E., Millier C. (1992), “La regression, nouveauxregards sur une ancienne methode statistique”, INRA, Actualites Scientifiques et Agronomiques,Masson, Paris.
References
J.-M. Marin, C. Robert. (2007). Bayesian Core: A Practical Approach to Computational BayesianStatistics. Springer, New-York, pages 48-49.
Examples
data(pine_full)str(pine_full)
pine_sup 67
pine_sup Complete Pine dataset
Description
This is a supplementary dataset (used as a test set for the pine dataset) that was extracted from a1973 study on pine_sup processionary caterpillars. It assesses the influence of some forest settle-ment characteristics on the development of caterpillar colonies. The response variable is the log-arithmic transform of the average number of nests of caterpillars per tree in an area of 500 squaremeters (x11). There are k=10 potentially explanatory variables defined on n=22 areas.
Usage
data(pine_sup)
Format
A data frame with 22 observations on the following 11 variables.
x1 altitude (in meters)
x2 slope (en degrees)
x3 number of pine_sups in the area
x4 height (in meters) of the tree sampled at the center of the area
x5 diameter (in meters) of the tree sampled at the center of the area
x6 index of the settlement density
x7 orientation of the area (from 1 if southbound to 2 otherwise)
x8 height (in meters) of the dominant tree
x9 number of vegetation strata
x10 mix settlement index (from 1 if not mixed to 2 if mixed)
x11 logarithmic transform of the average number of nests of caterpillars per tree
Details
These caterpillars got their names from their habit of moving over the ground in incredibly longhead-to-tail processions when leaving their nest to create a new colony.
The pine_sup dataset can be used as a test set to assess model prediction error of a model trainedon the pine dataset.
Source
Tomassone R., Audrain S., Lesquoy-de Turckeim E., Millier C. (1992), “La regression, nouveauxregards sur une ancienne methode statistique”, INRA, Actualites Scientifiques et Agronomiques,Masson, Paris.

68 plot.table.summary.cv.plsRglmmodel
References
J.-M. Marin, C. Robert. (2007). Bayesian Core: A Practical Approach to Computational BayesianStatistics. Springer, New-York, pages 48-49.
Examples
data(pine_sup)str(pine_sup)
plot.table.summary.cv.plsRglmmodel
Plot method for table of summary of cross validated plsRglm models
Description
This function provides a table method for the class "summary.cv.plsRglmmodel"
Usage
## S3 method for class 'table.summary.cv.plsRglmmodel'plot(x, type=c("CVMC","CVQ2Chi2","CVPreChi2"), ...)
Arguments
x an object of the class "table.summary.cv.plsRglmmodel"
type the type of cross validation criterion to plot.
... further arguments to be passed to or from methods.
Value
NULL
Author(s)
Frederic Bertrand<[email protected]>http://www-irma.u-strasbg.fr/~fbertran/
References
Nicolas Meyer, Myriam Maumy-Bertrand et Frederic Bertrand (2010). Comparing the linear andthe logistic PLS regression with qualitative predictors: application to allelotyping data. Journal dela Societe Francaise de Statistique, 151(2), pages 1-18. http://smf4.emath.fr/Publications/JSFdS/151_2/pdf/sfds_jsfds_151_2_1-18.pdf
See Also
summary

plot.table.summary.cv.plsRmodel 69
Examples
data(Cornell)XCornell<-Cornell[,1:7]yCornell<-Cornell[,8]bbb <- cv.plsRglm(dataY=yCornell,dataX=XCornell,nt=10,NK=1,modele="pls-glm-family",family=gaussian())plot(cvtable(summary(bbb)),type="CVQ2Chi2")rm(list=c("XCornell","yCornell","bbb"))
plot.table.summary.cv.plsRmodel
Plot method for table of summary of cross validated plsR models
Description
This function provides a table method for the class "summary.cv.plsRmodel"
Usage
## S3 method for class 'table.summary.cv.plsRmodel'plot(x, type=c("CVMC","CVQ2","CVPress"), ...)
Arguments
x an object of the class "table.summary.cv.plsRmodel"
type the type of cross validation criterion to plot.
... further arguments to be passed to or from methods.
Value
NULL
Author(s)
Frederic Bertrand<[email protected]>http://www-irma.u-strasbg.fr/~fbertran/
References
Nicolas Meyer, Myriam Maumy-Bertrand et Frederic Bertrand (2010). Comparing the linear andthe logistic PLS regression with qualitative predictors: application to allelotyping data. Journal dela Societe Francaise de Statistique, 151(2), pages 1-18. http://smf4.emath.fr/Publications/JSFdS/151_2/pdf/sfds_jsfds_151_2_1-18.pdf
See Also
summary
70 plots.confints.bootpls
Examples
data(Cornell)XCornell<-Cornell[,1:7]yCornell<-Cornell[,8]bbb <- cv.plsR(dataY=yCornell,dataX=XCornell,nt=6,K=6,NK=100)plot(cvtable(summary(bbb)),type="CVQ2")rm(list=c("XCornell","yCornell","bbb"))
plots.confints.bootpls
Plot bootstrap confidence intervals
Description
This function plots the confidence intervals derived using the function confints.bootpls fromfrom a bootpls based object.
Usage
plots.confints.bootpls(ic_bootobject, indices = NULL, legendpos = "topleft",prednames = TRUE, articlestyle = TRUE, xaxisticks=TRUE, ltyIC=c(2, 4, 5, 1),colIC=c("darkgreen", "blue", "red", "black"), typeIC, las = par("las"),mar, mgp, ...)
Arguments
ic_bootobject an object created with the confints.bootpls function.
indices vector of indices of the variables to plot. Defaults to NULL: all the predictors willbe used.
legendpos position of the legend as in legend, defaults to "topleft".
prednames do the original names of the predictors shall be plotted ? Defaults to TRUE: thenames are plotted.
articlestyle do the extra blank zones of the margin shall be removed from the plot ? Defaultsto TRUE: the margins are removed.
xaxisticks do ticks for the x axis shall be plotted ? Defaults to TRUE: the ticks are plotted.
ltyIC lty as in plot
colIC col as in plot
typeIC type of CI to plot. Defaults to typeIC=c("Normal", "Basic", "Percentile", "BCa")if BCa intervals limits were computed and to typeIC=c("Normal", "Basic", "Percentile")otherwise.
las numeric in 0,1,2,3; the style of axis labels. 0: always parallel to the axis [de-fault], 1: always horizontal, 2: always perpendicular to the axis, 3: alwaysvertical.
plots.confints.bootpls 71
mar A numerical vector of the form c(bottom, left, top, right) which givesthe number of lines of margin to be specified on the four sides of the plot. Thedefault is c(5, 4, 4, 2) + 0.1.
mgp The margin line (in mex units) for the axis title, axis labels and axis line. Notethat mgp[1] affects title whereas mgp[2:3] affect axis. The default is c(3, 1, 0).
... further options to pass to the plot function.
Value
NULL
Author(s)
Frederic Bertrand<[email protected]>http://www-irma.u-strasbg.fr/~fbertran/
See Also
confints.bootpls
Examples
data(Cornell)modpls <- plsR(Y~.,data=Cornell,3)
# Lazraq-Cleroux PLS (Y,X) bootstrapset.seed(250)Cornell.bootYX <- bootpls(modpls, R=250)temp.ci <- confints.bootpls(Cornell.bootYX,2:8)
plots.confints.bootpls(temp.ci)plots.confints.bootpls(temp.ci,prednames=FALSE)plots.confints.bootpls(temp.ci,prednames=FALSE,articlestyle=FALSE,main="Bootstrap confidence intervals for the bj")plots.confints.bootpls(temp.ci,indices=1:3,prednames=FALSE)plots.confints.bootpls(temp.ci,c(2,4,6),"bottomright")plots.confints.bootpls(temp.ci,c(2,4,6),articlestyle=FALSE,main="Bootstrap confidence intervals for some of the bj")
temp.ci <- confints.bootpls(Cornell.bootYX,typeBCa=FALSE)plots.confints.bootpls(temp.ci)plots.confints.bootpls(temp.ci,2:8)plots.confints.bootpls(temp.ci,prednames=FALSE)
# Bastien CSDA 2005 (Y,T) bootstrapCornell.boot <- bootpls(modpls, typeboot="fmodel_np", R=250)temp.ci <- confints.bootpls(Cornell.boot,2:8)
plots.confints.bootpls(temp.ci)
72 plots.confints.bootpls
plots.confints.bootpls(temp.ci,prednames=FALSE)plots.confints.bootpls(temp.ci,prednames=FALSE,articlestyle=FALSE,main="Bootstrap confidence intervals for the bj")plots.confints.bootpls(temp.ci,indices=1:3,prednames=FALSE)plots.confints.bootpls(temp.ci,c(2,4,6),"bottomright")plots.confints.bootpls(temp.ci,c(2,4,6),articlestyle=FALSE,main="Bootstrap confidence intervals for some of the bj")
temp.ci <- confints.bootpls(Cornell.boot,typeBCa=FALSE)plots.confints.bootpls(temp.ci)plots.confints.bootpls(temp.ci,2:8)plots.confints.bootpls(temp.ci,prednames=FALSE)
data(aze_compl)modplsglm <- plsRglm(y~.,data=aze_compl,3,modele="pls-glm-logistic")
# Lazraq-Cleroux PLS (Y,X) bootstrap# should be run with R=1000 but takes much longer timeaze_compl.bootYX3 <- bootplsglm(modplsglm, typeboot="plsmodel", R=250)temp.ci <- confints.bootpls(aze_compl.bootYX3)
plots.confints.bootpls(temp.ci)plots.confints.bootpls(temp.ci,prednames=FALSE)plots.confints.bootpls(temp.ci,prednames=FALSE,articlestyle=FALSE,main="Bootstrap confidence intervals for the bj")plots.confints.bootpls(temp.ci,indices=1:33,prednames=FALSE)plots.confints.bootpls(temp.ci,c(2,4,6),"bottomleft")plots.confints.bootpls(temp.ci,c(2,4,6),articlestyle=FALSE,main="Bootstrap confidence intervals for some of the bj")plots.confints.bootpls(temp.ci,indices=1:34,prednames=FALSE)plots.confints.bootpls(temp.ci,indices=1:33,prednames=FALSE,ltyIC=1,colIC=c(1,2))
temp.ci <- confints.bootpls(aze_compl.bootYX3,1:34,typeBCa=FALSE)plots.confints.bootpls(temp.ci,indices=1:33,prednames=FALSE)
# Bastien CSDA 2005 (Y,T) Bootstrap# much fasteraze_compl.bootYT3 <- bootplsglm(modplsglm, R=1000)temp.ci <- confints.bootpls(aze_compl.bootYT3)
plots.confints.bootpls(temp.ci)plots.confints.bootpls(temp.ci,typeIC="Normal")plots.confints.bootpls(temp.ci,typeIC=c("Normal","Basic"))plots.confints.bootpls(temp.ci,typeIC="BCa",legendpos="bottomleft")plots.confints.bootpls(temp.ci,prednames=FALSE)plots.confints.bootpls(temp.ci,prednames=FALSE,articlestyle=FALSE,main="Bootstrap confidence intervals for the bj")plots.confints.bootpls(temp.ci,indices=1:33,prednames=FALSE)plots.confints.bootpls(temp.ci,c(2,4,6),"bottomleft")plots.confints.bootpls(temp.ci,c(2,4,6),articlestyle=FALSE,
plsR 73
main="Bootstrap confidence intervals for some of the bj")plots.confints.bootpls(temp.ci,prednames=FALSE,ltyIC=c(2,1),colIC=c(1,2))
temp.ci <- confints.bootpls(aze_compl.bootYT3,1:33,typeBCa=FALSE)plots.confints.bootpls(temp.ci,prednames=FALSE)
plsR Partial least squares Regression models with leave one out cross vali-dation
Description
This function implements Partial least squares Regression models with leave one out cross valida-tion for complete or incomplete datasets.
Usage
plsR(x, ...)## Default S3 method:plsRmodel(dataY, dataX, nt = 2, limQ2set = 0.0975,dataPredictY = dataX, modele = "pls", family = NULL, typeVC = "none",EstimXNA = FALSE, scaleX = TRUE, scaleY = NULL, pvals.expli = FALSE,alpha.pvals.expli = 0.05, MClassed = FALSE, tol_Xi = 10^(-12), weights,sparse = FALSE, sparseStop = TRUE, naive = FALSE,verbose=TRUE)## S3 method for class 'formula'plsRmodel(formula, data, nt = 2, limQ2set = 0.0975,dataPredictY, modele = "pls", family = NULL, typeVC = "none",EstimXNA = FALSE, scaleX = TRUE, scaleY = NULL, pvals.expli = FALSE,alpha.pvals.expli = 0.05, MClassed = FALSE, tol_Xi = 10^(-12), weights,subset, contrasts = NULL, sparse = FALSE, sparseStop = TRUE, naive = FALSE,verbose=TRUE)PLS_lm(dataY, dataX, nt = 2, limQ2set = 0.0975, dataPredictY = dataX,modele = "pls", family = NULL, typeVC = "none", EstimXNA = FALSE,scaleX = TRUE, scaleY = NULL, pvals.expli = FALSE,alpha.pvals.expli = 0.05, MClassed = FALSE, tol_Xi = 10^(-12),weights,sparse=FALSE,sparseStop=FALSE,naive=FALSE,verbose=TRUE)PLS_lm_formula(formula,data=NULL,nt=2,limQ2set=.0975,dataPredictY=dataX,modele="pls",family=NULL,typeVC="none",EstimXNA=FALSE,scaleX=TRUE,scaleY=NULL,pvals.expli=FALSE,alpha.pvals.expli=.05,MClassed=FALSE,tol_Xi=10^(-12),weights,subset,contrasts=NULL,sparse=FALSE,sparseStop=FALSE,naive=FALSE,verbose=TRUE)
Arguments
x a formula or a response (training) dataset
dataY response (training) dataset
74 plsR
dataX predictor(s) (training) dataset
formula an object of class "formula" (or one that can be coerced to that class): a sym-bolic description of the model to be fitted. The details of model specification aregiven under ’Details’.
data an optional data frame, list or environment (or object coercible by as.data.frameto a data frame) containing the variables in the model. If not found in data,the variables are taken from environment(formula), typically the environmentfrom which plsR is called.
nt number of components to be extracted
limQ2set limit value for the Q2
dataPredictY predictor(s) (testing) dataset
modele name of the PLS model to be fitted, only ("pls" available for this fonction.
family for the present moment the family argument is ignored and set thanks to thevalue of modele.
typeVC type of leave one out cross validation. Several procedures are available. If crossvalidation is required, one needs to selects the way of predicting the responsefor left out observations. For complete rows, without any missing value, thereare two different ways of computing these predictions. As a consequence, formixed datasets, with complete and incomplete rows, there are two ways of com-puting prediction : either predicts any row as if there were missing values in it(missingdata) or selects the prediction method accordingly to the completenessof the row (adaptative).
none no cross validationstandard as in SIMCA for datasets without any missing value. For datasets
with any missing value, it is the as using missingdata
missingdata all values predicted as those with missing values for datasets withany missing values
adaptative predict a response value for an x with any missing value as thosewith missing values and for an x without any missing value as those withoutmissing values.
EstimXNA only for modele="pls". Set whether the missing X values have to be estimated.
scaleX scale the predictor(s) : must be set to TRUE for modele="pls" and should befor glms pls.
scaleY scale the response : Yes/No. Ignored since non always possible for glm re-sponses.
pvals.expli should individual p-values be reported to tune model selection ?alpha.pvals.expli
level of significance for predictors when pvals.expli=TRUE
MClassed number of missclassified cases, should only be used for binary responses
tol_Xi minimal value for Norm2(Xi) and det(pp′× pp) if there is any missing value inthe dataX. It defaults to 10−12
weights an optional vector of ’prior weights’ to be used in the fitting process. Should beNULL or a numeric vector.
plsR 75
subset an optional vector specifying a subset of observations to be used in the fittingprocess.
contrasts an optional list. See the contrasts.arg of model.matrix.default.
sparse should the coefficients of non-significant predictors (<alpha.pvals.expli) beset to 0
sparseStop should component extraction stop when no significant predictors (<alpha.pvals.expli)are found
naive Use the naive estimates for the Degrees of Freedom in plsR? Default is FALSE.
verbose should info messages be displayed ?
... arguments to pass to plsRmodel.default or to plsRmodel.formula
Details
There are several ways to deal with missing values that leads to different computations of leave oneout cross validation criteria.
A typical predictor has the form response ~ terms where response is the (numeric) response vectorand terms is a series of terms which specifies a linear predictor for response. A terms specificationof the form first + second indicates all the terms in first together with all the terms in second withany duplicates removed.
A specification of the form first:second indicates the the set of terms obtained by taking the interac-tions of all terms in first with all terms in second. The specification first*second indicates the crossof first and second. This is the same as first + second + first:second.
The terms in the formula will be re-ordered so that main effects come first, followed by the interac-tions, all second-order, all third-order and so on: to avoid this pass a terms object as the formula.
Non-NULL weights can be used to indicate that different observations have different dispersions(with the values in weights being inversely proportional to the dispersions); or equivalently, whenthe elements of weights are positive integers w_i, that each response y_i is the mean of w_i unit-weight observations.
The default estimator for Degrees of Freedom is the Kramer and Sugiyama’s one. Informationcriteria are computed accordingly to these estimations. Naive Degrees of Freedom and InformationCriteria are also provided for comparison purposes. For more details, see N. Kraemer and M.Sugiyama. (2011). The Degrees of Freedom of Partial Least Squares Regression. Journal of theAmerican Statistical Association, 106(494), 697-705, 2011.
Value
nr Number of observations
nc Number of predictors
nt Number of requested components
ww raw weights (before L2-normalization)
wwnorm L2 normed weights (to be used with deflated matrices of predictor variables)
wwetoile modified weights (to be used with original matrix of predictor variables)
tt PLS components
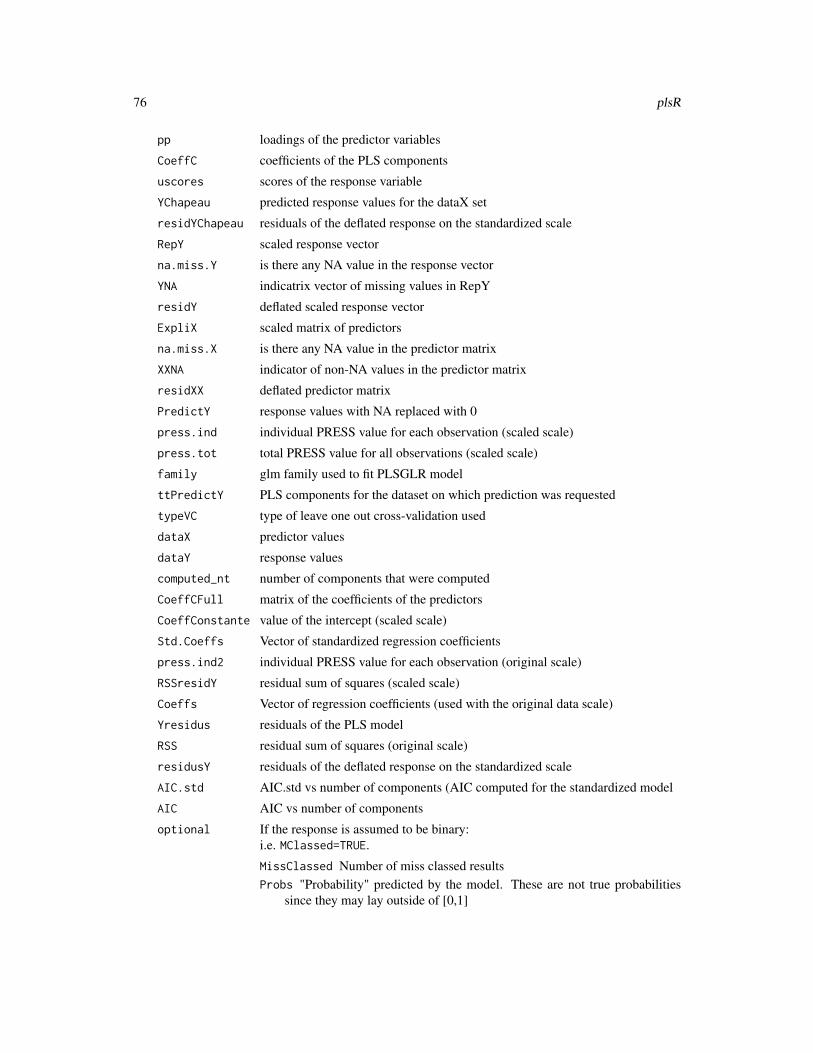
76 plsR
pp loadings of the predictor variables
CoeffC coefficients of the PLS components
uscores scores of the response variable
YChapeau predicted response values for the dataX set
residYChapeau residuals of the deflated response on the standardized scale
RepY scaled response vector
na.miss.Y is there any NA value in the response vector
YNA indicatrix vector of missing values in RepY
residY deflated scaled response vector
ExpliX scaled matrix of predictors
na.miss.X is there any NA value in the predictor matrix
XXNA indicator of non-NA values in the predictor matrix
residXX deflated predictor matrix
PredictY response values with NA replaced with 0
press.ind individual PRESS value for each observation (scaled scale)
press.tot total PRESS value for all observations (scaled scale)
family glm family used to fit PLSGLR model
ttPredictY PLS components for the dataset on which prediction was requested
typeVC type of leave one out cross-validation used
dataX predictor values
dataY response values
computed_nt number of components that were computed
CoeffCFull matrix of the coefficients of the predictors
CoeffConstante value of the intercept (scaled scale)
Std.Coeffs Vector of standardized regression coefficients
press.ind2 individual PRESS value for each observation (original scale)
RSSresidY residual sum of squares (scaled scale)
Coeffs Vector of regression coefficients (used with the original data scale)
Yresidus residuals of the PLS model
RSS residual sum of squares (original scale)
residusY residuals of the deflated response on the standardized scale
AIC.std AIC.std vs number of components (AIC computed for the standardized model
AIC AIC vs number of components
optional If the response is assumed to be binary:i.e. MClassed=TRUE.
MissClassed Number of miss classed resultsProbs "Probability" predicted by the model. These are not true probabilities
since they may lay outside of [0,1]

plsR 77
Probs.trc Probability predicted by the model and constrained to belong to[0,1]
ttPredictFittedMissingY
Description of ’comp2’
optional If cross validation was requested:i.e. typeVC="standard", typeVC="missingdata" or typeVC="adaptative".
R2residY R2 coefficient value on the standardized scale
R2 R2 coefficient value on the original scale
press.tot2 total PRESS value for all observations (original scale)
Q2 Q2 value (standardized scale)
limQ2 limit of the Q2 value
Q2_2 Q2 value (original scale)
Q2cum cumulated Q2 (standardized scale)
Q2cum_2 cumulated Q2 (original scale)
InfCrit table of Information CriteriaStd.ValsPredictY
predicted response values for supplementary dataset (standardized scale)
ValsPredictY predicted response values for supplementary dataset (original scale)
Std.XChapeau estimated values for missing values in the predictor matrix (standardized scale)
XXwotNA predictor matrix with missing values replaced with 0
Note
Use cv.plsR to cross-validate the plsRglm models and bootpls to bootstrap them.
Author(s)
Frederic Bertrand<[email protected]>http://www-irma.u-strasbg.fr/~fbertran/
References
Nicolas Meyer, Myriam Maumy-Bertrand et Frederic Bertrand (2010). Comparing the linear andthe logistic PLS regression with qualitative predictors: application to allelotyping data. Journal dela Societe Francaise de Statistique, 151(2), pages 1-18. http://smf4.emath.fr/Publications/JSFdS/151_2/pdf/sfds_jsfds_151_2_1-18.pdf
See Also
See also plsRglm to fit PLSGLR models.
78 plsR
Examples
data(Cornell)XCornell<-Cornell[,1:7]yCornell<-Cornell[,8]
#maximum 6 components could be extracted from this dataset#trying 10 to trigger automatic stopping criterionmodpls10<-plsR(yCornell,XCornell,10)modpls10
#With iterative leave one out CV PRESSmodpls6cv<-plsR(yCornell,XCornell,6,typeVC="standard")modpls6cvcv.modpls<-cv.plsR(yCornell,XCornell,6,NK=100)res.cv.modpls<-cvtable(summary(cv.modpls))plot(res.cv.modpls)
rm(list=c("XCornell","yCornell","modpls10","modpls6cv"))
#A binary response exampledata(aze_compl)Xaze_compl<-aze_compl[,2:34]yaze_compl<-aze_compl$ymodpls.aze <- plsR(yaze_compl,Xaze_compl,10,MClassed=TRUE,typeVC="standard")modpls.aze
#Direct access to not cross validated valuesmodpls.aze$AICmodpls.aze$AIC.stdmodpls.aze$MissClassed
#Raw predicted values (not really probabily since not constrained in [0,1]modpls.aze$Probs#Truncated to [0;1] predicted values (true probabilities)modpls.aze$Probs.trcmodpls.aze$Probs-modpls.aze$Probs.trc
#Repeated cross validation of the model (NK=100 times)cv.modpls.aze<-cv.plsR(yaze_compl,Xaze_compl,10,NK=100)res.cv.modpls.aze<-cvtable(summary(cv.modpls.aze,MClassed=TRUE))#High discrepancy in the number of component choice using repeated cross validation#and missclassed criterionplot(res.cv.modpls.aze)
rm(list=c("Xaze_compl","yaze_compl","modpls.aze","cv.modpls.aze","res.cv.modpls.aze"))
#24 predictorsdimX <- 24#2 componentsAstar <- 2simul_data_UniYX(dimX,Astar)
plsR.dof 79
dataAstar2 <- t(replicate(250,simul_data_UniYX(dimX,Astar)))ydataAstar2 <- dataAstar2[,1]XdataAstar2 <- dataAstar2[,2:(dimX+1)]modpls.A2<- plsR(ydataAstar2,XdataAstar2,10,typeVC="standard")modpls.A2cv.modpls.A2<-cv.plsR(ydataAstar2,XdataAstar2,10,NK=100)res.cv.modpls.A2<-cvtable(summary(cv.modpls.A2))#Perfect choice for the Q2 criterion in PLSRplot(res.cv.modpls.A2)
#Binarized responseysimbin1 <- dicho(ydataAstar2)#Binarized predictorsXsimbin1 <- dicho(XdataAstar2)modpls.B2 <- plsR(ysimbin1,Xsimbin1,10,typeVC="standard",MClassed=TRUE)modpls.B2modpls.B2$Probsmodpls.B2$Probs.trcmodpls.B2$MissClassedplsR(ysimbin1,XdataAstar2,10,typeVC="standard",MClassed=TRUE)$InfCritcv.modpls.B2<-cv.plsR(ysimbin1,Xsimbin1,2,NK=100)res.cv.modpls.B2<-cvtable(summary(cv.modpls.B2,MClassed=TRUE))#Only one component found by repeated CV missclassed criterionplot(res.cv.modpls.B2)
rm(list=c("dimX","Astar","dataAstar2","XdataAstar2","ydataAstar2","modpls.A2","cv.modpls.A2","res.cv.modpls.A2","Xsimbin1","ysimbin1","modpls.B2","cv.modpls.B2","res.cv.modpls.B2"))
plsR.dof Computation of the Degrees of Freedom
Description
This function computes the Degrees of Freedom using the Krylov representation of PLS and otherquantities that are used to get information criteria values. For the time present, it only works withcomplete datasets.
Usage
plsR.dof(modplsR, naive = FALSE)
Arguments
modplsR A plsR model i.e. an object returned by one of the functions plsR, plsRmodel.default,plsRmodel.formula, PLS_lm or PLS_lm_formula.
naive A boolean.
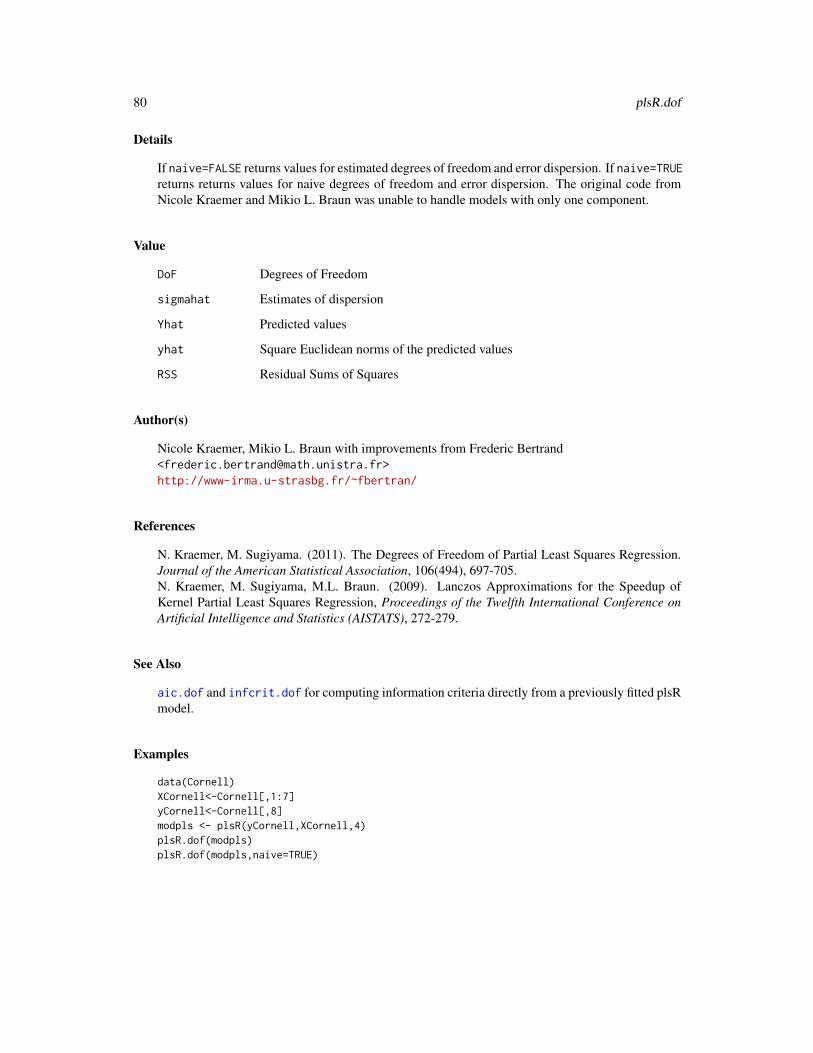
80 plsR.dof
Details
If naive=FALSE returns values for estimated degrees of freedom and error dispersion. If naive=TRUEreturns returns values for naive degrees of freedom and error dispersion. The original code fromNicole Kraemer and Mikio L. Braun was unable to handle models with only one component.
Value
DoF Degrees of Freedom
sigmahat Estimates of dispersion
Yhat Predicted values
yhat Square Euclidean norms of the predicted values
RSS Residual Sums of Squares
Author(s)
Nicole Kraemer, Mikio L. Braun with improvements from Frederic Bertrand<[email protected]>http://www-irma.u-strasbg.fr/~fbertran/
References
N. Kraemer, M. Sugiyama. (2011). The Degrees of Freedom of Partial Least Squares Regression.Journal of the American Statistical Association, 106(494), 697-705.N. Kraemer, M. Sugiyama, M.L. Braun. (2009). Lanczos Approximations for the Speedup ofKernel Partial Least Squares Regression, Proceedings of the Twelfth International Conference onArtificial Intelligence and Statistics (AISTATS), 272-279.
See Also
aic.dof and infcrit.dof for computing information criteria directly from a previously fitted plsRmodel.
Examples
data(Cornell)XCornell<-Cornell[,1:7]yCornell<-Cornell[,8]modpls <- plsR(yCornell,XCornell,4)plsR.dof(modpls)plsR.dof(modpls,naive=TRUE)
plsRglm 81
plsRglm Partial least squares Regression generalized linear models
Description
This function implements Partial least squares Regression generalized linear models complete orincomplete datasets.
Usage
plsRglm(x, ...)## Default S3 method:plsRglmmodel(dataY,dataX,nt=2,limQ2set=.0975,dataPredictY=dataX,modele="pls",family=NULL,typeVC="none",EstimXNA=FALSE,scaleX=TRUE,scaleY=NULL,pvals.expli=FALSE,alpha.pvals.expli=.05,MClassed=FALSE,tol_Xi=10^(-12),weights,sparse=FALSE,sparseStop=TRUE,naive=FALSE,verbose=TRUE)## S3 method for class 'formula'plsRglmmodel(formula,data=NULL,nt=2,limQ2set=.0975,dataPredictY,modele="pls",family=NULL,typeVC="none",EstimXNA=FALSE,scaleX=TRUE,scaleY=NULL,pvals.expli=FALSE,alpha.pvals.expli=.05,MClassed=FALSE,tol_Xi=10^(-12),weights,subset,start=NULL,etastart,mustart,offset,method="glm.fit",control= list(),contrasts=NULL,sparse=FALSE,sparseStop=TRUE,naive=FALSE,verbose=TRUE)PLS_glm(dataY, dataX, nt = 2, limQ2set = 0.0975, dataPredictY = dataX,modele = "pls", family = NULL, typeVC = "none", EstimXNA = FALSE,scaleX = TRUE, scaleY = NULL, pvals.expli = FALSE,alpha.pvals.expli = 0.05, MClassed = FALSE, tol_Xi = 10^(-12), weights,method, sparse = FALSE, sparseStop=FALSE, naive=FALSE,verbose=TRUE)PLS_glm_formula(formula,data=NULL,nt=2,limQ2set=.0975,dataPredictY=dataX,modele="pls",family=NULL,typeVC="none",EstimXNA=FALSE,scaleX=TRUE,scaleY=NULL,pvals.expli=FALSE,alpha.pvals.expli=.05,MClassed=FALSE,tol_Xi=10^(-12),weights,subset,start=NULL,etastart,mustart,offset,method,control= list(),contrasts=NULL,sparse=FALSE,sparseStop=FALSE,naive=FALSE,verbose=TRUE)
Arguments
x a formula or a response (training) datasetdataY response (training) datasetdataX predictor(s) (training) datasetformula an object of class "formula" (or one that can be coerced to that class): a sym-
bolic description of the model to be fitted. The details of model specification aregiven under ’Details’.
data an optional data frame, list or environment (or object coercible by as.data.frameto a data frame) containing the variables in the model. If not found in data,the variables are taken from environment(formula), typically the environmentfrom which plsRglm is called.
82 plsRglm
nt number of components to be extractedlimQ2set limit value for the Q2dataPredictY predictor(s) (testing) datasetmodele name of the PLS glm model to be fitted ("pls", "pls-glm-Gamma", "pls-glm-gaussian",
"pls-glm-inverse.gaussian", "pls-glm-logistic", "pls-glm-poisson","pls-glm-polr"). Use "modele=pls-glm-family" to enable the family op-tion.
family a description of the error distribution and link function to be used in the model.This can be a character string naming a family function, a family function or theresult of a call to a family function. (See family for details of family functions.)To use the family option, please set modele="pls-glm-family". User definedfamilies can also be defined. See details.
typeVC type of leave one out cross validation. For back compatibility purpose.none no cross validation
EstimXNA only for modele="pls". Set whether the missing X values have to be estimated.scaleX scale the predictor(s) : must be set to TRUE for modele="pls" and should be
for glms pls.scaleY scale the response : Yes/No. Ignored since non always possible for glm re-
sponses.pvals.expli should individual p-values be reported to tune model selection ?alpha.pvals.expli
level of significance for predictors when pvals.expli=TRUEMClassed number of missclassified cases, should only be used for binary responsestol_Xi minimal value for Norm2(Xi) and det(pp′× pp) if there is any missing value in
the dataX. It defaults to 10−12
weights an optional vector of ’prior weights’ to be used in the fitting process. Should beNULL or a numeric vector.
subset an optional vector specifying a subset of observations to be used in the fittingprocess.
start starting values for the parameters in the linear predictor.etastart starting values for the linear predictor.mustart starting values for the vector of means.offset this can be used to specify an a priori known component to be included in the
linear predictor during fitting. This should be NULL or a numeric vector of lengthequal to the number of cases. One or more offset terms can be included in theformula instead or as well, and if more than one is specified their sum is used.See model.offset.
method For a glm model (modele="pls-glm-family"), the method to be used in fit-ting the model. The default method "glm.fit" uses iteratively reweighted leastsquares (IWLS). User-supplied fitting functions can be supplied either as a func-tion or a character string naming a function, with a function which takes the samearguments as glm.fit. For a polr model (modele="pls-glm-polr"), logisticor probit or (complementary) log-log (loglog or cloglog) or cauchit (corre-sponding to a Cauchy latent variable).

plsRglm 83
control a list of parameters for controlling the fitting process. For glm.fit this is passedto glm.control.
contrasts an optional list. See the contrasts.arg of model.matrix.default.
sparse should the coefficients of non-significant predictors (<alpha.pvals.expli) beset to 0
sparseStop should component extraction stop when no significant predictors (<alpha.pvals.expli)are found
naive Use the naive estimates for the Degrees of Freedom in plsR? Default is FALSE.
verbose Should details be displayed ?
... arguments to pass to plsRmodel.default or to plsRmodel.formula
Details
There are seven different predefined models with predefined link functions available :
"pls" ordinary pls models
"pls-glm-Gamma" glm gaussian with inverse link pls models
"pls-glm-gaussian" glm gaussian with identity link pls models
"pls-glm-inverse-gamma" glm binomial with square inverse link pls models
"pls-glm-logistic" glm binomial with logit link pls models
"pls-glm-poisson" glm poisson with log link pls models
"pls-glm-polr" glm polr with logit link pls models
Using the "family=" option and setting "modele=pls-glm-family" allows changing the familyand link function the same way as for the glm function. As a consequence user-specified familiescan also be used.
The gaussian family accepts the links (as names) identity, log and inverse.
The binomial family accepts the links logit, probit, cauchit, (corresponding to logistic, nor-mal and Cauchy CDFs respectively) log and cloglog (complementary log-log).
The Gamma family accepts the links inverse, identity and log.
The poisson family accepts the links log, identity, and sqrt.
The inverse.gaussian family accepts the links 1/mu^2, inverse, identity and log.
The quasi family accepts the links logit, probit, cloglog, identity, inverse, log, 1/mu^2and sqrt.
The function power can be used to create a power link function.
A typical predictor has the form response ~ terms where response is the (numeric) response vectorand terms is a series of terms which specifies a linear predictor for response. A terms specificationof the form first + second indicates all the terms in first together with all the terms in second withany duplicates removed.
A specification of the form first:second indicates the the set of terms obtained by taking the interac-tions of all terms in first with all terms in second. The specification first*second indicates the crossof first and second. This is the same as first + second + first:second.
84 plsRglm
The terms in the formula will be re-ordered so that main effects come first, followed by the interac-tions, all second-order, all third-order and so on: to avoid this pass a terms object as the formula.
Non-NULL weights can be used to indicate that different observations have different dispersions(with the values in weights being inversely proportional to the dispersions); or equivalently, whenthe elements of weights are positive integers w_i, that each response y_i is the mean of w_i unit-weight observations.
The default estimator for Degrees of Freedom is the Kramer and Sugiyama’s one which only worksfor classical plsR models. For these models, Information criteria are computed accordingly to theseestimations. Naive Degrees of Freedom and Information Criteria are also provided for comparisonpurposes. For more details, see N. Kraemer and M. Sugiyama. (2011). The Degrees of Freedomof Partial Least Squares Regression. Journal of the American Statistical Association, 106(494),697-705, 2011.
Value
Depends on the model that was used to fit the model. You can generally at least find these items.
nr Number of observations
nc Number of predictors
nt Number of requested components
ww raw weights (before L2-normalization)
wwnorm L2 normed weights (to be used with deflated matrices of predictor variables)
wwetoile modified weights (to be used with original matrix of predictor variables)
tt PLS components
pp loadings of the predictor variables
CoeffC coefficients of the PLS components
uscores scores of the response variable
YChapeau predicted response values for the dataX set
residYChapeau residuals of the deflated response on the standardized scale
RepY scaled response vector
na.miss.Y is there any NA value in the response vector
YNA indicatrix vector of missing values in RepY
residY deflated scaled response vector
ExpliX scaled matrix of predictors
na.miss.X is there any NA value in the predictor matrix
XXNA indicator of non-NA values in the predictor matrix
residXX deflated predictor matrix
PredictY response values with NA replaced with 0
RSS residual sum of squares (original scale)
RSSresidY residual sum of squares (scaled scale)
plsRglm 85
R2residY R2 coefficient value on the standardized scaleR2 R2 coefficient value on the original scalepress.ind individual PRESS value for each observation (scaled scale)press.tot total PRESS value for all observations (scaled scale)Q2cum cumulated Q2 (standardized scale)family glm family used to fit PLSGLR modelttPredictY PLS components for the dataset on which prediction was requestedtypeVC type of leave one out cross-validation useddataX predictor valuesdataY response valuesweights weights of the observationscomputed_nt number of components that were computedAIC AIC vs number of componentsBIC BIC vs number of componentsCoeffsmodel_vals
ChisqPearson
CoeffCFull matrix of the coefficients of the predictorsCoeffConstante value of the intercept (scaled scale)Std.Coeffs Vector of standardized regression coefficientsCoeffs Vector of regression coefficients (used with the original data scale)Yresidus residuals of the PLS modelresidusY residuals of the deflated response on the standardized scaleInfCrit table of Information Criteria:
AIC AIC vs number of componentsBIC BIC vs number of componentsMissClassed Number of miss classed resultsChi2_Pearson_Y Q2 value (standardized scale)RSS residual sum of squares (original scale)R2 R2 coefficient value on the original scaleR2residY R2 coefficient value on the standardized scaleRSSresidY residual sum of squares (scaled scale)
Std.ValsPredictY
predicted response values for supplementary dataset (standardized scale)ValsPredictY predicted response values for supplementary dataset (original scale)Std.XChapeau estimated values for missing values in the predictor matrix (standardized scale)FinalModel final GLR model on the PLS componentsXXwotNA predictor matrix with missing values replaced with 0call callAIC.std AIC.std vs number of components (AIC computed for the standardized model

86 plsRglm
Note
Use cv.plsRglm to cross-validate the plsRglm models and bootpls to bootstrap them.
Author(s)
Frederic Bertrand<[email protected]>http://www-irma.u-strasbg.fr/~fbertran/
References
Nicolas Meyer, Myriam Maumy-Bertrand et Frederic Bertrand (2010). Comparaison de la regres-sion PLS et de la regression logistique PLS : application aux donnees d’allelotypage. Journal dela Societe Francaise de Statistique, 151(2), pages 1-18. http://smf4.emath.fr/Publications/JSFdS/151_2/pdf/sfds_jsfds_151_2_1-18.pdf
See Also
See also plsR.
Examples
data(Cornell)XCornell<-Cornell[,1:7]yCornell<-Cornell[,8]
modplsglm <- plsRglm(yCornell,XCornell,10,modele="pls-glm-gaussian")
#To retrieve the final GLR model on the PLS componentsfinalmod <- plsRglm(yCornell,XCornell,10,modele="pls-glm-gaussian")$FinalModel#It is a glm object.plot(finalmod)
#Cross validationcv.modplsglm<-cv.plsRglm(yCornell,XCornell,6,NK=100,modele="pls-glm-gaussian")res.cv.modplsglm<-cvtable(summary(cv.modplsglm))plot(res.cv.modplsglm)
#If no model specified, classic PLSR modelmodpls <- plsRglm(yCornell,XCornell,6)modplsmodpls$ttmodpls$uscoresmodpls$ppmodpls$Coeffs
#rm(list=c("XCornell","yCornell",modpls,cv.modplsglm,res.cv.modplsglm))
data(aze_compl)

plsRglm 87
Xaze_compl<-aze_compl[,2:34]yaze_compl<-aze_compl$yplsRglm(yaze_compl,Xaze_compl,nt=10,modele="pls",MClassed=TRUE)$InfCritmodpls <- plsRglm(yaze_compl,Xaze_compl,nt=10,modele="pls-glm-logistic",MClassed=TRUE,pvals.expli=TRUE)modplscolSums(modpls$pvalstep)modpls$Coeffsmodel_vals
plot(plsRglm(yaze_compl,Xaze_compl,4,modele="pls-glm-logistic")$FinalModel)plsRglm(yaze_compl[-c(99,72)],Xaze_compl[-c(99,72),],4,modele="pls-glm-logistic",pvals.expli=TRUE)$pvalstepplot(plsRglm(yaze_compl[-c(99,72)],Xaze_compl[-c(99,72),],4,modele="pls-glm-logistic",pvals.expli=TRUE)$FinalModel)rm(list=c("Xaze_compl","yaze_compl","modpls"))
data(bordeaux)Xbordeaux<-bordeaux[,1:4]ybordeaux<-factor(bordeaux$Quality,ordered=TRUE)modpls <- plsRglm(ybordeaux,Xbordeaux,10,modele="pls-glm-polr",pvals.expli=TRUE)modplscolSums(modpls$pvalstep)
XbordeauxNA<-XbordeauxXbordeauxNA[1,1] <- NAmodplsNA <- plsRglm(ybordeaux,XbordeauxNA,10,modele="pls-glm-polr",pvals.expli=TRUE)modplscolSums(modpls$pvalstep)rm(list=c("Xbordeaux","XbordeauxNA","ybordeaux","modplsNA"))
data(pine)Xpine<-pine[,1:10]ypine<-pine[,11]modpls1 <- plsRglm(ypine,Xpine,1)modpls1$Std.Coeffsmodpls1$Coeffsmodpls4 <- plsRglm(ypine,Xpine,4)modpls4$Std.Coeffsmodpls4$Coeffsmodpls4$PredictY[1,]plsRglm(ypine,Xpine,4,dataPredictY=Xpine[1,])$PredictY[1,]
XpineNAX21 <- XpineXpineNAX21[1,2] <- NAmodpls4NA <- plsRglm(ypine,XpineNAX21,4)modpls4NA$Std.Coeffsmodpls4NA$YChapeau[1,]modpls4$YChapeau[1,]modpls4NA$CoeffCplsRglm(ypine,XpineNAX21,4,EstimXNA=TRUE)$XChapeau
88 plsRglm
plsRglm(ypine,XpineNAX21,4,EstimXNA=TRUE)$XChapeauNA
# compare pls-glm-gaussian with classic plsRmodplsglm4 <- plsRglm(ypine,Xpine,4,modele="pls-glm-gaussian")cbind(modpls4$Std.Coeffs,modplsglm4$Std.Coeffs)
# without missing datacbind(ypine,modpls4$ValsPredictY,modplsglm4$ValsPredictY)
# with missing datamodplsglm4NA <- plsRglm(ypine,XpineNAX21,4,modele="pls-glm-gaussian")cbind((ypine),modpls4NA$ValsPredictY,modplsglm4NA$ValsPredictY)rm(list=c("Xpine","ypine","modpls4","modpls4NA","modplsglm4","modplsglm4NA"))
data(fowlkes)Xfowlkes <- fowlkes[,2:13]yfowlkes <- fowlkes[,1]modpls <- plsRglm(yfowlkes,Xfowlkes,4,modele="pls-glm-logistic",pvals.expli=TRUE)modplscolSums(modpls$pvalstep)rm(list=c("Xfowlkes","yfowlkes","modpls"))
if(require(chemometrics)){data(hyptis)yhyptis <- factor(hyptis$Group,ordered=TRUE)Xhyptis <- as.data.frame(hyptis[,c(1:6)])options(contrasts = c("contr.treatment", "contr.poly"))modpls2 <- plsRglm(yhyptis,Xhyptis,6,modele="pls-glm-polr")modpls2$Coeffsmodel_valsmodpls2$InfCritmodpls2$Coeffsmodpls2$Std.Coeffs
table(yhyptis,predict(modpls2$FinalModel,type="class"))rm(list=c("yhyptis","Xhyptis","modpls2"))}
dimX <- 24Astar <- 6dataAstar6 <- t(replicate(250,simul_data_UniYX(dimX,Astar)))ysimbin1 <- dicho(dataAstar6)[,1]Xsimbin1 <- dicho(dataAstar6)[,2:(dimX+1)]modplsglm <- plsRglm(ysimbin1,Xsimbin1,10,modele="pls-glm-logistic")modplsglmcv.modplsglm <- cv.plsRglm(ysimbin1,Xsimbin1,nt=10,modele="pls-glm-logistic",NK=100)res.cv.modplsglm <- cvtable(summary(cv.modplsglm,MClassed=TRUE))plot(res.cv.modplsglm) #defaults to type="CVMC"
rm(list=c("dimX","Astar","dataAstar6","ysimbin1","Xsimbin1","modplsglm","cv.modplsglm","res.cv.modplsglm"))
PLS_glm_wvc 89
PLS_glm_wvc Light version of PLS\_glm for cross validation purposes
Description
Light version of PLS_glm for cross validation purposes either on complete or incomplete datasets.
Usage
PLS_glm_wvc(dataY, dataX, nt = 2, dataPredictY = dataX, modele = "pls",family = NULL, scaleX = TRUE, scaleY = NULL, keepcoeffs = FALSE,keepstd.coeffs=FALSE, tol_Xi = 10^(-12), weights, method = "logistic",verbose = TRUE)
Arguments
dataY response (training) dataset
dataX predictor(s) (training) dataset
nt number of components to be extracted
dataPredictY predictor(s) (testing) dataset
modele name of the PLS glm model to be fitted ("pls", "pls-glm-Gamma", "pls-glm-gaussian","pls-glm-inverse.gaussian", "pls-glm-logistic", "pls-glm-poisson","pls-glm-polr"). Use "modele=pls-glm-family" to enable the family op-tion.
family a description of the error distribution and link function to be used in the model.This can be a character string naming a family function, a family function or theresult of a call to a family function. (See family for details of family functions.)To use the family option, please set modele="pls-glm-family". User definedfamilies can also be defined. See details.
scaleX scale the predictor(s) : must be set to TRUE for modele="pls" and should befor glms pls.
scaleY scale the response : Yes/No. Ignored since non always possible for glm re-sponses.
keepcoeffs whether the coefficients of the linear fit on link scale of unstandardized eXplana-tory variables should be returned or not.
keepstd.coeffs whether the coefficients of the linear fit on link scale of standardized eXplana-tory variables should be returned or not.
tol_Xi minimal value for Norm2(Xi) and det(pp′× pp) if there is any missing value inthe dataX. It defaults to 10−12
weights an optional vector of ’prior weights’ to be used in the fitting process. Should beNULL or a numeric vector.
method logistic, probit, complementary log-log or cauchit (corresponding to a Cauchylatent variable).
verbose should info messages be displayed ?

90 PLS_glm_wvc
Details
This function is called by PLS_glm_kfoldcv_formula in order to perform cross-validation eitheron complete or incomplete datasets.
There are seven different predefined models with predefined link functions available :
"pls" ordinary pls models
"pls-glm-Gamma" glm gaussian with inverse link pls models
"pls-glm-gaussian" glm gaussian with identity link pls models
"pls-glm-inverse-gamma" glm binomial with square inverse link pls models
"pls-glm-logistic" glm binomial with logit link pls models
"pls-glm-poisson" glm poisson with log link pls models
"pls-glm-polr" glm polr with logit link pls models
Using the "family=" option and setting "modele=pls-glm-family" allows changing the familyand link function the same way as for the glm function. As a consequence user-specified familiescan also be used.
The gaussian family accepts the links (as names) identity, log and inverse.
The binomial family accepts the links logit, probit, cauchit, (corresponding to logistic, nor-mal and Cauchy CDFs respectively) log and cloglog (complementary log-log).
The Gamma family accepts the links inverse, identity and log.
The poisson family accepts the links log, identity, and sqrt.
The inverse.gaussian family accepts the links 1/mu^2, inverse, identity and log.
The quasi family accepts the links logit, probit, cloglog, identity, inverse, log, 1/mu^2and sqrt.
The function power can be used to create a power link function.
Non-NULL weights can be used to indicate that different observations have different dispersions(with the values in weights being inversely proportional to the dispersions); or equivalently, whenthe elements of weights are positive integers w_i, that each response y_i is the mean of w_i unit-weight observations.
Value
valsPredict nrow(dataPredictY) * nt matrix of the predicted values
coeffs If the coefficients of the eXplanatory variables were requested:i.e. keepcoeffs=TRUE.ncol(dataX) * 1 matrix of the coefficients of the the eXplanatory variables
Author(s)
Frederic Bertrand<[email protected]>http://www-irma.u-strasbg.fr/~fbertran/
PLS_glm_wvc 91
References
Nicolas Meyer, Myriam Maumy-Bertrand et Frederic Bertrand (2010). Comparing the linear andthe logistic PLS regression with qualitative predictors: application to allelotyping data. Journal dela Societe Francaise de Statistique, 151(2), pages 1-18. http://smf4.emath.fr/Publications/JSFdS/151_2/pdf/sfds_jsfds_151_2_1-18.pdf
See Also
PLS_glm for more detailed results, PLS_glm_kfoldcv for cross-validating models and PLS_lm_wvcfor the same function dedicated to plsR models
Examples
data(Cornell)XCornell<-Cornell[,1:7]yCornell<-Cornell[,8]PLS_glm_wvc(dataY=yCornell,dataX=XCornell,nt=3,modele="pls-glm-gaussian",dataPredictY=XCornell[1,])PLS_glm_wvc(dataY=yCornell,dataX=XCornell,nt=3,modele="pls-glm-family",family=gaussian(),dataPredictY=XCornell[1,])PLS_glm_wvc(dataY=yCornell[-1],dataX=XCornell[-1,],nt=3,modele="pls-glm-gaussian",dataPredictY=XCornell[1,])PLS_glm_wvc(dataY=yCornell[-1],dataX=XCornell[-1,],nt=3,modele="pls-glm-family",family=gaussian(),dataPredictY=XCornell[1,])rm("XCornell","yCornell")
## With an incomplete dataset (X[1,2] is NA)data(pine)ypine <- pine[,11]data(XpineNAX21)PLS_glm_wvc(dataY=ypine,dataX=XpineNAX21,nt=10,modele="pls-glm-gaussian")rm("XpineNAX21","ypine")
data(pine)Xpine<-pine[,1:10]ypine<-pine[,11]PLS_glm_wvc(ypine,Xpine,10,modele="pls")PLS_glm_wvc(ypine,Xpine,10,modele="pls-glm-Gamma")PLS_glm_wvc(ypine,Xpine,10,modele="pls-glm-family",family=Gamma())PLS_glm_wvc(ypine,Xpine,10,modele="pls-glm-gaussian")PLS_glm_wvc(ypine,Xpine,10,modele="pls-glm-family",family=gaussian(log))PLS_glm_wvc(round(ypine),Xpine,10,modele="pls-glm-poisson")PLS_glm_wvc(round(ypine),Xpine,10,modele="pls-glm-family",family=poisson(log))rm(list=c("pine","ypine","Xpine"))
data(Cornell)XCornell<-Cornell[,1:7]yCornell<-Cornell[,8]PLS_glm_wvc(yCornell,XCornell,10,modele="pls-glm-inverse.gaussian")PLS_glm_wvc(yCornell,XCornell,10,modele="pls-glm-family",
92 PLS_lm_wvc
family=inverse.gaussian())rm(list=c("XCornell","yCornell"))
data(Cornell)XCornell<-Cornell[,1:7]yCornell<-Cornell[,8]PLS_glm_wvc(dataY=yCornell,dataX=XCornell,nt=3,modele="pls-glm-gaussian",dataPredictY=XCornell[1,])PLS_glm_wvc(dataY=yCornell[-1],dataX=XCornell[-1,],nt=3,modele="pls-glm-gaussian",dataPredictY=XCornell[1,])rm("XCornell","yCornell")
data(aze_compl)Xaze_compl<-aze_compl[,2:34]yaze_compl<-aze_compl$yPLS_glm(yaze_compl,Xaze_compl,10,modele="pls-glm-logistic",typeVC="none")$InfCritPLS_glm_wvc(yaze_compl,Xaze_compl,10,modele="pls-glm-logistic", keepcoeffs=TRUE)rm("Xaze_compl","yaze_compl")
PLS_lm_wvc Light version of PLS\_lm for cross validation purposes
Description
Light version of PLS_lm for cross validation purposes either on complete or incomplete datasets.
Usage
PLS_lm_wvc(dataY, dataX, nt = 2, dataPredictY = dataX, modele = "pls",scaleX = TRUE, scaleY = NULL, keepcoeffs = FALSE,keepstd.coeffs=FALSE, tol_Xi = 10^(-12), weights, verbose=TRUE)
Arguments
dataY response (training) dataset
dataX predictor(s) (training) dataset
nt number of components to be extracted
dataPredictY predictor(s) (testing) dataset
modele name of the PLS model to be fitted, only ("pls" available for this fonction.
scaleX scale the predictor(s) : must be set to TRUE for modele="pls" and should befor glms pls.
scaleY scale the response : Yes/No. Ignored since non always possible for glm re-sponses.
keepcoeffs whether the coefficients of unstandardized eXplanatory variables should be re-turned or not.
PLS_lm_wvc 93
keepstd.coeffs whether the coefficients of standardized eXplanatory variables should be re-turned or not.
tol_Xi minimal value for Norm2(Xi) and det(pp′× pp) if there is any missing value inthe dataX. It defaults to 10−12
weights an optional vector of ’prior weights’ to be used in the fitting process. Should beNULL or a numeric vector.
verbose should info messages be displayed ?
Details
This function is called by PLS_lm_kfoldcv in order to perform cross-validation either on completeor incomplete datasets.
Non-NULL weights can be used to indicate that different observations have different dispersions(with the values in weights being inversely proportional to the dispersions); or equivalently, whenthe elements of weights are positive integers w_i, that each response y_i is the mean of w_i unit-weight observations.
Value
valsPredict nrow(dataPredictY) * nt matrix of the predicted values
coeffs If the coefficients of the eXplanatory variables were requested:i.e. keepcoeffs=TRUE.ncol(dataX) * 1 matrix of the coefficients of the the eXplanatory variables
Note
Use PLS_lm_kfoldcv for a wrapper in view of cross-validation.
Author(s)
Frederic Bertrand<[email protected]>http://www-irma.u-strasbg.fr/~fbertran/
References
Nicolas Meyer, Myriam Maumy-Bertrand et Frederic Bertrand (2010). Comparing the linear andthe logistic PLS regression with qualitative predictors: application to allelotyping data. Journal dela Societe Francaise de Statistique, 151(2), pages 1-18. http://smf4.emath.fr/Publications/JSFdS/151_2/pdf/sfds_jsfds_151_2_1-18.pdf
See Also
PLS_lm for more detailed results, PLS_lm_kfoldcv for cross-validating models and PLS_glm_wvcfor the same function dedicated to plsRglm models
94 predict.plsRglmmodel
Examples
data(Cornell)XCornell<-Cornell[,1:7]yCornell<-Cornell[,8]PLS_lm_wvc(dataY=yCornell,dataX=XCornell,nt=3,dataPredictY=XCornell[1,])PLS_lm_wvc(dataY=yCornell[-c(1,2)],dataX=XCornell[-c(1,2),],nt=3,dataPredictY=XCornell[c(1,2),])PLS_lm_wvc(dataY=yCornell[-c(1,2)],dataX=XCornell[-c(1,2),],nt=3,dataPredictY=XCornell[c(1,2),],keepcoeffs=TRUE)rm("XCornell","yCornell")
## With an incomplete dataset (X[1,2] is NA)data(pine)ypine <- pine[,11]data(XpineNAX21)PLS_lm_wvc(dataY=ypine[-1],dataX=XpineNAX21[-1,],nt=3)PLS_lm_wvc(dataY=ypine[-1],dataX=XpineNAX21[-1,],nt=3,dataPredictY=XpineNAX21[1,])PLS_lm_wvc(dataY=ypine[-2],dataX=XpineNAX21[-2,],nt=3,dataPredictY=XpineNAX21[2,])PLS_lm_wvc(dataY=ypine,dataX=XpineNAX21,nt=3)rm("XpineNAX21","ypine")
predict.plsRglmmodel Print method for plsRcox models
Description
This function provides a predict method for the class "plsRglmmodel"
Usage
## S3 method for class 'plsRglmmodel'predict(object,newdata,comps=object$computed_nt,type=c("link", "response", "terms", "scores", "class", "probs"),se.fit=FALSE,weights, dispersion = NULL,methodNA="adaptative",verbose=TRUE,...)
Arguments
object An object of the class "plsRmodel".
newdata An optional data frame in which to look for variables with which to predict. Ifomitted, the fitted values are used.
comps A value with a single value of component to use for prediction.
type Type of predicted value. Available choices are the glms ones ("link", "response","terms"), the polr ones ("class", "probs") or the scores ("scores").
se.fit If TRUE, pointwise standard errors are produced for the predictions using theCox model.
weights Vector of case weights. If weights is a vector of integers, then the estimatedcoefficients are equivalent to estimating the model from data with the individualcases replicated as many times as indicated by weights.
predict.plsRglmmodel 95
dispersion the dispersion of the GLM fit to be assumed in computing the standard errors.If omitted, that returned by summary applied to the object is used.
methodNA Selects the way of predicting the response or the scores of the new data. Forcomplete rows, without any missing value, there are two different ways of com-puting the prediction. As a consequence, for mixed datasets, with complete andincomplete rows, there are two ways of computing prediction : either predictsany row as if there were missing values in it (missingdata) or selects the pre-diction method accordingly to the completeness of the row (adaptative).
verbose should info messages be displayed ?
... Arguments to be passed on to stats::glm and plsRglm::plsRglm.
Value
When type is "response", a matrix of predicted response values is returned.When type is "scores", a score matrix is returned.
Author(s)
Frederic Bertrand<[email protected]>http://www-irma.u-strasbg.fr/~fbertran/
References
Nicolas Meyer, Myriam Maumy-Bertrand et Frederic Bertrand (2010). Comparing the linear andthe logistic PLS regression with qualitative predictors: application to allelotyping data. Journal dela Societe Francaise de Statistique, 151(2), pages 1-18. http://smf4.emath.fr/Publications/JSFdS/151_2/pdf/sfds_jsfds_151_2_1-18.pdf
See Also
See Also predict.glm
Examples
data(pine)Xpine<-pine[,1:10]ypine<-pine[,11]data(pine_sup)Xpine_sup<-pine_sup[,1:10]Xpine_supNA<-Xpine_supXpine_supNA[1,1]<-NA
modpls=plsRglm(dataY=ypine,dataX=Xpine,nt=6,modele="pls-glm-family",family="gaussian")modplsform=plsRglm(x11~.,data=pine,nt=6,modele="pls-glm-family",family="gaussian")modpls2=plsRglm(dataY=ypine,dataX=Xpine,nt=6,modele="pls-glm-family",dataPredictY=Xpine_sup,family="gaussian")modpls2NA=plsRglm(dataY=ypine,dataX=Xpine,nt=6,modele="pls-glm-family",dataPredictY=Xpine_supNA,family="gaussian")

96 predict.plsRglmmodel
#Identical to predict(modpls,type="link") or modpls$Std.ValsPredictYcbind(modpls$Std.ValsPredictY,modplsform$Std.ValsPredictY,predict(modpls),predict(modplsform))
#Identical to predict(modpls,type="response") or modpls$ValsPredictYcbind(modpls$ValsPredictY,modplsform$ValsPredictY,predict(modpls,type="response"),predict(modplsform,type="response"))
#Identical to modpls$ttPredictYpredict(modpls,type="scores")predict(modplsform,type="scores")
#Identical to modpls2$ValsPredictYcbind(predict(modpls,newdata=Xpine_sup,type="response"),predict(modplsform,newdata=Xpine_sup,type="response"))
#Select the number of components to use to derive the predictionpredict(modpls,newdata=Xpine_sup,type="response",comps=1)predict(modpls,newdata=Xpine_sup,type="response",comps=3)predict(modpls,newdata=Xpine_sup,type="response",comps=6)try(predict(modpls,newdata=Xpine_sup,type="response",comps=8))
#Identical to modpls2$ttValsPredictYpredict(modpls,newdata=Xpine_sup,type="scores")
#Select the number of components in the scores matrixpredict(modpls,newdata=Xpine_sup,type="scores",comps=1)predict(modpls,newdata=Xpine_sup,type="scores",comps=3)predict(modpls,newdata=Xpine_sup,type="scores",comps=6)try(predict(modpls,newdata=Xpine_sup,type="scores",comps=8))
#Identical to modpls2NA$ValsPredictYpredict(modpls,newdata=Xpine_supNA,type="response",methodNA="missingdata")
cbind(predict(modpls,newdata=Xpine_supNA,type="response"),predict(modplsform,newdata=Xpine_supNA,type="response"))
predict(modpls,newdata=Xpine_supNA,type="response",comps=1)predict(modpls,newdata=Xpine_supNA,type="response",comps=3)predict(modpls,newdata=Xpine_supNA,type="response",comps=6)try(predict(modpls,newdata=Xpine_supNA,type="response",comps=8))
#Identical to modpls2NA$ttPredictYpredict(modpls,newdata=Xpine_supNA,type="scores",methodNA="missingdata")predict(modplsform,newdata=Xpine_supNA,type="scores",methodNA="missingdata")
predict(modpls,newdata=Xpine_supNA,type="scores")predict(modplsform,newdata=Xpine_supNA,type="scores")predict(modpls,newdata=Xpine_supNA,type="scores",comps=1)predict(modpls,newdata=Xpine_supNA,type="scores",comps=3)predict(modpls,newdata=Xpine_supNA,type="scores",comps=6)try(predict(modpls,newdata=Xpine_supNA,type="scores",comps=8))

predict.plsRmodel 97
predict.plsRmodel Print method for plsRcox models
Description
This function provides a predict method for the class "plsRcoxmodel"
Usage
## S3 method for class 'plsRmodel'predict(object,newdata,comps=object$computed_nt,type=c("response","scores"),weights,methodNA="adaptative",verbose=TRUE,...)
Arguments
object An object of the class "plsRmodel".
newdata An optional data frame in which to look for variables with which to predict. Ifomitted, the fitted values are used.
comps A value with a single value of component to use for prediction.
type Type of predicted value. Available choices are the response values ("response")or the scores ("scores").
weights Vector of case weights. If weights is a vector of integers, then the estimatedcoefficients are equivalent to estimating the model from data with the individualcases replicated as many times as indicated by weights.
methodNA Selects the way of predicting the response or the scores of the new data. Forcomplete rows, without any missing value, there are two different ways of com-puting the prediction. As a consequence, for mixed datasets, with complete andincomplete rows, there are two ways of computing prediction : either predictsany row as if there were missing values in it (missingdata) or selects the pre-diction method accordingly to the completeness of the row (adaptative).
verbose should info messages be displayed ?
... Arguments to be passed on to plsRglm::plsR.
Value
When type is "response", a matrix of predicted response values is returned.When type is "scores", a score matrix is returned.
Author(s)
Frederic Bertrand<[email protected]>http://www-irma.u-strasbg.fr/~fbertran/

98 predict.plsRmodel
References
Nicolas Meyer, Myriam Maumy-Bertrand et Frederic Bertrand (2010). Comparing the linear andthe logistic PLS regression with qualitative predictors: application to allelotyping data. Journal dela Societe Francaise de Statistique, 151(2), pages 1-18. http://smf4.emath.fr/Publications/JSFdS/151_2/pdf/sfds_jsfds_151_2_1-18.pdf
Examples
data(pine)Xpine<-pine[,1:10]ypine<-pine[,11]data(pine_sup)Xpine_sup<-pine_sup[,1:10]Xpine_supNA<-Xpine_supXpine_supNA[1,1]<-NA
modpls=plsR(dataY=ypine,dataX=Xpine,nt=6,modele="pls")modplsform=plsR(x11~.,data=pine,nt=6,modele="pls")modpls2=plsR(dataY=ypine,dataX=Xpine,nt=6,modele="pls",dataPredictY=Xpine_sup)modpls2NA=plsR(dataY=ypine,dataX=Xpine,nt=6,modele="pls",dataPredictY=Xpine_supNA)
#Identical to predict(modpls,type="response") or modpls$ValsPredictYcbind(predict(modpls),predict(modplsform))
#Identical to modpls$ttPredictYpredict(modpls,type="scores")predict(modplsform,type="scores")
#Identical to modpls2$ValsPredictYcbind(predict(modpls,newdata=Xpine_sup,type="response"),predict(modplsform,newdata=Xpine_sup,type="response"))
#Select the number of components to use to derive the predictionpredict(modpls,newdata=Xpine_sup,type="response",comps=1)predict(modpls,newdata=Xpine_sup,type="response",comps=3)predict(modpls,newdata=Xpine_sup,type="response",comps=6)try(predict(modpls,newdata=Xpine_sup,type="response",comps=8))
#Identical to modpls2$ttValsPredictYpredict(modpls,newdata=Xpine_sup,type="scores")
#Select the number of components in the scores matrixpredict(modpls,newdata=Xpine_sup,type="scores",comps=1)predict(modpls,newdata=Xpine_sup,type="scores",comps=3)predict(modpls,newdata=Xpine_sup,type="scores",comps=6)try(predict(modpls,newdata=Xpine_sup,type="scores",comps=8))
#Identical to modpls2NA$ValsPredictYpredict(modpls,newdata=Xpine_supNA,type="response",methodNA="missingdata")
cbind(predict(modpls,newdata=Xpine_supNA,type="response"),

print.coef.plsRglmmodel 99
predict(modplsform,newdata=Xpine_supNA,type="response"))
predict(modpls,newdata=Xpine_supNA,type="response",comps=1)predict(modpls,newdata=Xpine_supNA,type="response",comps=3)predict(modpls,newdata=Xpine_supNA,type="response",comps=6)try(predict(modpls,newdata=Xpine_supNA,type="response",comps=8))
#Identical to modpls2NA$ttPredictYpredict(modpls,newdata=Xpine_supNA,type="scores",methodNA="missingdata")predict(modplsform,newdata=Xpine_supNA,type="scores",methodNA="missingdata")
predict(modpls,newdata=Xpine_supNA,type="scores")predict(modplsform,newdata=Xpine_supNA,type="scores")predict(modpls,newdata=Xpine_supNA,type="scores",comps=1)predict(modpls,newdata=Xpine_supNA,type="scores",comps=3)predict(modpls,newdata=Xpine_supNA,type="scores",comps=6)try(predict(modpls,newdata=Xpine_supNA,type="scores",comps=8))
print.coef.plsRglmmodel
Print method for plsRglm models
Description
This function provides a print method for the class "coef.plsRglmmodel"
Usage
## S3 method for class 'coef.plsRglmmodel'print(x, ...)
Arguments
x an object of the class "coef.plsRglmmodel"
... not used
Value
NULL
Author(s)
Frederic Bertrand<[email protected]>http://www-irma.u-strasbg.fr/~fbertran/

100 print.coef.plsRmodel
References
Nicolas Meyer, Myriam Maumy-Bertrand et Frederic Bertrand (2010). Comparing the linear andthe logistic PLS regression with qualitative predictors: application to allelotyping data. Journal dela Societe Francaise de Statistique, 151(2), pages 1-18. http://smf4.emath.fr/Publications/JSFdS/151_2/pdf/sfds_jsfds_151_2_1-18.pdf
See Also
Examples
data(Cornell)XCornell<-Cornell[,1:7]yCornell<-Cornell[,8]modplsglm <- plsRglm(yCornell,XCornell,3,modele="pls-glm-family",family=gaussian())class(modplsglm)print(coef(modplsglm))rm(list=c("XCornell","yCornell","modplsglm"))
print.coef.plsRmodel Print method for plsR models
Description
This function provides a print method for the class "coef.plsRmodel"
Usage
## S3 method for class 'coef.plsRmodel'print(x, ...)
Arguments
x an object of the class "coef.plsRmodel"
... not used
Value
NULL
Author(s)
Frederic Bertrand<[email protected]>http://www-irma.u-strasbg.fr/~fbertran/

print.cv.plsRglmmodel 101
References
Nicolas Meyer, Myriam Maumy-Bertrand et Frederic Bertrand (2010). Comparing the linear andthe logistic PLS regression with qualitative predictors: application to allelotyping data. Journal dela Societe Francaise de Statistique, 151(2), pages 1-18. http://smf4.emath.fr/Publications/JSFdS/151_2/pdf/sfds_jsfds_151_2_1-18.pdf
See Also
Examples
data(Cornell)XCornell<-Cornell[,1:7]yCornell<-Cornell[,8]modpls <- plsRglm(yCornell,XCornell,3,modele="pls")class(modpls)print(coef(modpls))rm(list=c("XCornell","yCornell","modpls"))
print.cv.plsRglmmodel Print method for plsRglm models
Description
This function provides a print method for the class "cv.plsRglmmodel"
Usage
## S3 method for class 'cv.plsRglmmodel'print(x, ...)
Arguments
x an object of the class "cv.plsRglmmodel"
... not used
Value
NULL
Author(s)
Frederic Bertrand<[email protected]>http://www-irma.u-strasbg.fr/~fbertran/

102 print.cv.plsRmodel
References
Nicolas Meyer, Myriam Maumy-Bertrand et Frédéric Bertrand (2010). Comparaison de larégression PLS et de la r?gression logistique PLS : application aux donn?es d’allélotypage.Journal de la Société Française de Statistique, 151(2), pages 1-18. http://smf4.emath.fr/Publications/JSFdS/151_2/pdf/sfds_jsfds_151_2_1-18.pdf
See Also
Examples
data(Cornell)XCornell<-Cornell[,1:7]yCornell<-Cornell[,8]bbb <- cv.plsRglm(dataY=yCornell,dataX=XCornell,nt=10,NK=1,modele="pls-glm-family",family=gaussian())print(bbb)rm(list=c("XCornell","yCornell","bbb"))
print.cv.plsRmodel Print method for plsR models
Description
This function provides a print method for the class "cv.plsRmodel"
Usage
## S3 method for class 'cv.plsRmodel'print(x, ...)
Arguments
x an object of the class "cv.plsRmodel"
... not used
Value
NULL
Author(s)
Frederic Bertrand<[email protected]>http://www-irma.u-strasbg.fr/~fbertran/

print.plsRglmmodel 103
References
Nicolas Meyer, Myriam Maumy-Bertrand et Frederic Bertrand (2010). Comparing the linear andthe logistic PLS regression with qualitative predictors: application to allelotyping data. Journal dela Societe Francaise de Statistique, 151(2), pages 1-18. http://smf4.emath.fr/Publications/JSFdS/151_2/pdf/sfds_jsfds_151_2_1-18.pdf
See Also
Examples
data(Cornell)XCornell<-Cornell[,1:7]yCornell<-Cornell[,8]bbb <- cv.plsR(dataY=yCornell,dataX=XCornell,nt=10,K=6)print(bbb)rm(list=c("XCornell","yCornell","bbb"))
print.plsRglmmodel Print method for plsRglm models
Description
This function provides a print method for the class "plsRglmmodel"
Usage
## S3 method for class 'plsRglmmodel'print(x, ...)
Arguments
x an object of the class "plsRglmmodel"
... not used
Value
NULL
Author(s)
Frédéric Bertrand<[email protected]>http://www-irma.u-strasbg.fr/~fbertran/

104 print.plsRmodel
References
Nicolas Meyer, Myriam Maumy-Bertrand et Frédéric Bertrand (2010). Comparaison de la régres-sion PLS et de la régression logistique PLS : application aux données d’allélotypage. Journal dela Société Française de Statistique, 151(2), pages 1-18. http://smf4.emath.fr/Publications/JSFdS/151_2/pdf/sfds_jsfds_151_2_1-18.pdf
See Also
Examples
data(Cornell)XCornell<-Cornell[,1:7]yCornell<-Cornell[,8]modplsglm <- plsRglm(yCornell,XCornell,3,modele="pls-glm-gaussian")class(modplsglm)print(modplsglm)rm(list=c("XCornell","yCornell","modplsglm"))
print.plsRmodel Print method for plsR models
Description
This function provides a print method for the class "plsRmodel"
Usage
## S3 method for class 'plsRmodel'print(x, ...)
Arguments
x an object of the class "plsRmodel"
... not used
Value
NULL
Author(s)
Frédéric Bertrand<[email protected]>http://www-irma.u-strasbg.fr/~fbertran/

print.summary.plsRglmmodel 105
References
Nicolas Meyer, Myriam Maumy-Bertrand et Frédéric Bertrand (2010). Comparaison de la régres-sion PLS et de la régression logistique PLS : application aux données d’allélotypage. Journal dela Société Française de Statistique, 151(2), pages 1-18. http://smf4.emath.fr/Publications/JSFdS/151_2/pdf/sfds_jsfds_151_2_1-18.pdf
See Also
Examples
data(Cornell)XCornell<-Cornell[,1:7]yCornell<-Cornell[,8]modpls <- plsRglm(yCornell,XCornell,3,modele="pls")class(modpls)print(modpls)rm(list=c("XCornell","yCornell","modpls"))
print.summary.plsRglmmodel
Print method for summaries of plsRglm models
Description
This function provides a print method for the class "summary.plsRglmmodel"
Usage
## S3 method for class 'summary.plsRglmmodel'print(x, ...)
Arguments
x an object of the class "summary.plsRglmmodel"
... not used
Value
language call of the model
Author(s)
Frédéric Bertrand<[email protected]>http://www-irma.u-strasbg.fr/~fbertran/

106 print.summary.plsRmodel
References
Nicolas Meyer, Myriam Maumy-Bertrand et Frédéric Bertrand (2010). Comparaison de la régres-sion PLS et de la régression logistique PLS : application aux données d’allélotypage. Journal dela Société Française de Statistique, 151(2), pages 1-18. http://smf4.emath.fr/Publications/JSFdS/151_2/pdf/sfds_jsfds_151_2_1-18.pdf
See Also
print and summary
Examples
data(Cornell)XCornell<-Cornell[,1:7]yCornell<-Cornell[,8]modplsglm <- plsRglm(yCornell,XCornell,3,modele="pls-glm-gaussian")class(modplsglm)print(summary(modplsglm))rm(list=c("XCornell","yCornell","modplsglm"))
print.summary.plsRmodel
Print method for summaries of plsR models
Description
This function provides a print method for the class "summary.plsRmodel"
Usage
## S3 method for class 'summary.plsRmodel'print(x, ...)
Arguments
x an object of the class "summary.plsRmodel"
... not used
Value
language call of the model
Author(s)
Frédéric Bertrand<[email protected]>http://www-irma.u-strasbg.fr/~fbertran/

signpred 107
References
Nicolas Meyer, Myriam Maumy-Bertrand et Frédéric Bertrand (2010). Comparaison de la régres-sion PLS et de la régression logistique PLS : application aux données d’allélotypage. Journal dela Société Française de Statistique, 151(2), pages 1-18. http://smf4.emath.fr/Publications/JSFdS/151_2/pdf/sfds_jsfds_151_2_1-18.pdf
See Also
print and summary
Examples
data(Cornell)XCornell<-Cornell[,1:7]yCornell<-Cornell[,8]modpls <- plsRglm(yCornell,XCornell,3,modele="pls")class(modpls)print(summary(modpls))rm(list=c("XCornell","yCornell","modpls"))
signpred Graphical assessment of the stability of selected variables
Description
This fonctions plots, for each of the model, the
Usage
signpred(matbin, pred.lablength = max(sapply(rownames(matbin), nchar)),labsize = 1, plotsize = 12)
Arguments
matbin Matrix with 0 or 1 entries. Each row per predictor and a column for every model.0 means the predictor is not significant in the model and 1 that, on the contrary,it is significant.
pred.lablength Maximum length of the predictors labels. Defaults to full label length.
labsize Size of the predictors labels.
plotsize Global size of the graph.
Details
This function is based on the visweb function from the bipartite package.
Value
A plot window.
108 simul_data_complete
Author(s)
Bernd Gruber with minor modifications from Frederic Bertrand<[email protected]>http://www-irma.u-strasbg.fr/~fbertran/
References
Vazquez, P.D., Chacoff, N.,P. and Cagnolo, L. (2009) Evaluating multiple determinants of the struc-ture of plant-animal mutualistic networks. Ecology, 90:2039-2046.
See Also
See Also visweb
Examples
signpred(matrix(rbinom(160,1,.2),ncol=8,dimnames=list(as.character(1:20),as.character(1:8))))
simul_data_complete Data generating detailed process for multivariate plsR models
Description
This function generates a single multivariate response value Y and a vector of explinatory variables(X1, . . . , Xtotdim) drawn from a model with a given number of latent components.
Usage
simul_data_complete(totdim, ncomp)
Arguments
totdim Number of columns of the X vector (from ncomp to hardware limits)
ncomp Number of latent components in the model (from 2 to 6)
Details
This function should be combined with the replicate function to give rise to a larger dataset. Thealgorithm used is a R port of the one described in the article of Li which is a multivariate general-ization of the algorithm of Naes and Martens.

simul_data_complete 109
Value
simX Vector of explanatory variables
HH Dimension of the response Y
eta See Li et al.
r See Li et al.
epsilon See Li et al.
ksi See Li et al.
f See Li et al.
z See Li et al.
Y See Li et al.
Note
The value of r depends on the value of ncomp :
ncomp r2 33 34 4
Author(s)
Frederic Bertrand<[email protected]>http://www-irma.u-strasbg.fr/~fbertran/
References
T. Naes, H. Martens, Comparison of prediction methods for multicollinear data, Commun. Stat.,Simul. 14 (1985) 545-576.http://dx.doi.org/10.1080/03610918508812458Baibing Li, Julian Morris, Elaine B. Martin, Model selection for partial least squares regression,Chemometrics and Intelligent Laboratory Systems 64 (2002) 79-89.http://dx.doi.org/10.1016/S0169-7439(02)00051-5
See Also
simul_data_YX for data simulation purpose
Examples
simul_data_complete(20,6)
dimX <- 6Astar <- 2simul_data_complete(dimX,Astar)
110 simul_data_UniYX
dimX <- 6Astar <- 3simul_data_complete(dimX,Astar)
dimX <- 6Astar <- 4simul_data_complete(dimX,Astar)
rm(list=c("dimX","Astar"))
simul_data_UniYX Data generating function for univariate plsR models
Description
This function generates a single univariate response value Y and a vector of explanatory variables(X1, . . . , Xtotdim) drawn from a model with a given number of latent components.
Usage
simul_data_UniYX(totdim, ncomp)
Arguments
totdim Number of columns of the X vector (from ncomp to hardware limits)
ncomp Number of latent components in the model (from 2 to 6)
Details
This function should be combined with the replicate function to give rise to a larger dataset. Thealgorithm used is a R port of the one described in the article of Li which is a multivariate general-ization of the algorithm of Naes and Martens.
Value
vector (Y,X1, . . . , Xtotdim)
Author(s)
Frederic Bertrand<[email protected]>http://www-irma.u-strasbg.fr/~fbertran/
simul_data_UniYX_binom 111
References
T. Naes, H. Martens, Comparison of prediction methods for multicollinear data, Commun. Stat.,Simul. 14 (1985) 545-576.http://dx.doi.org/10.1080/03610918508812458Baibing Li, Julian Morris, Elaine B. Martin, Model selection for partial least squares regression,Chemometrics and Intelligent Laboratory Systems 64 (2002) 79-89.http://dx.doi.org/10.1016/S0169-7439(02)00051-5
See Also
simul_data_YX and simul_data_complete for generating multivariate data
Examples
simul_data_UniYX(20,6)
dimX <- 6Astar <- 2simul_data_UniYX(dimX,Astar)(dataAstar2 <- t(replicate(50,simul_data_UniYX(dimX,Astar))))cvtable(summary(cv.plsR(dataAstar2[,1],dataAstar2[,2:7],5,NK=100)))
dimX <- 6Astar <- 3simul_data_UniYX(dimX,Astar)(dataAstar3 <- t(replicate(50,simul_data_UniYX(dimX,Astar))))cvtable(summary(cv.plsR(dataAstar3[,1],dataAstar3[,2:7],5,NK=100)))
dimX <- 6Astar <- 4simul_data_UniYX(dimX,Astar)(dataAstar4 <- t(replicate(50,simul_data_UniYX(dimX,Astar))))cvtable(summary(cv.plsR(dataAstar4[,1],dataAstar4[,2:7],5,NK=100)))
rm(list=c("dimX","Astar"))
simul_data_UniYX_binom
Data generating function for univariate binomial plsR models
Description
This function generates a single univariate binomial response value Y and a vector of explanatoryvariables (X1, . . . , Xtotdim) drawn from a model with a given number of latent components.

112 simul_data_UniYX_binom
Usage
simul_data_UniYX_binom(totdim, ncomp, link="logit", offset = 0)
Arguments
totdim Number of columns of the X vector (from ncomp to hardware limits)
ncomp Number of latent components in the model (from 2 to 6)
link Character specification of the link function in the mean model (mu). Currently,"logit", "probit", "cloglog", "cauchit", "log", "loglog" are supported. Al-ternatively, an object of class "link-glm" can be supplied.
offset Offset on the linear scale
Details
This function should be combined with the replicate function to give rise to a larger dataset. Thealgorithm used is a modification of a R port of the one described in the article of Li which is amultivariate generalization of the algorithm of Naes and Martens.
Value
vector (Y,X1, . . . , Xtotdim)
Author(s)
Fr?d?ric Bertrand<[email protected]>http://www-irma.u-strasbg.fr/~fbertran/
References
T. Naes, H. Martens, Comparison of prediction methods for multicollinear data, Commun. Stat.,Simul. 14 (1985) 545-576.http://dx.doi.org/10.1080/03610918508812458Baibing Li, Julian Morris, Elaine B. Martin, Model selection for partial least squares regression,Chemometrics and Intelligent Laboratory Systems 64 (2002) 79-89.http://dx.doi.org/10.1016/S0169-7439(02)00051-5
See Also
simul_data_UniYX
Examples
layout(matrix(1:6,nrow=2))# logit linkhist(t(replicate(100,simul_data_UniYX_binom(4,4)))[,1])# probit linkhist(t(replicate(100,simul_data_UniYX_binom(4,4,link="probit")))[,1])
simul_data_YX 113
# cloglog linkhist(t(replicate(100,simul_data_UniYX_binom(4,4,link="cloglog")))[,1])# cauchit linkhist(t(replicate(100,simul_data_UniYX_binom(4,4,link="cauchit")))[,1])# loglog linkhist(t(replicate(100,simul_data_UniYX_binom(4,4,link="loglog")))[,1])# log linkhist(t(replicate(100,simul_data_UniYX_binom(4,4,link="log")))[,1])layout(1)
layout(matrix(1:6,nrow=2))# logit linkhist(t(replicate(100,simul_data_UniYX_binom(4,4,offset=5)))[,1])# probit linkhist(t(replicate(100,simul_data_UniYX_binom(4,4,link="probit",offset=5)))[,1])# cloglog linkhist(t(replicate(100,simul_data_UniYX_binom(4,4,link="cloglog",offset=5)))[,1])# cauchit linkhist(t(replicate(100,simul_data_UniYX_binom(4,4,link="cauchit",offset=5)))[,1])# loglog linkhist(t(replicate(100,simul_data_UniYX_binom(4,4,link="loglog",offset=5)))[,1])# log linkhist(t(replicate(100,simul_data_UniYX_binom(4,4,link="log",offset=5)))[,1])layout(1)
layout(matrix(1:6,nrow=2))# logit linkhist(t(replicate(100,simul_data_UniYX_binom(4,4,offset=-5)))[,1])# probit linkhist(t(replicate(100,simul_data_UniYX_binom(4,4,link="probit",offset=-5)))[,1])# cloglog linkhist(t(replicate(100,simul_data_UniYX_binom(4,4,link="cloglog",offset=-5)))[,1])# cauchit linkhist(t(replicate(100,simul_data_UniYX_binom(4,4,link="cauchit",offset=-5)))[,1])# loglog linkhist(t(replicate(100,simul_data_UniYX_binom(4,4,link="loglog",offset=-5)))[,1])# log linkhist(t(replicate(100,simul_data_UniYX_binom(4,4,link="log",offset=-5)))[,1])layout(1)
simul_data_YX Data generating function for multivariate plsR models
Description
This function generates a single multivariate response value Y and a vector of explinatory variables(X1, . . . , Xtotdim) drawn from a model with a given number of latent components.
114 simul_data_YX
Usage
simul_data_YX(totdim, ncomp)
Arguments
totdim Number of column of the X vector (from ncomp to hardware limits)
ncomp Number of latent components in the model (from 2 to 6)
Details
This function should be combined with the replicate function to give rise to a larger dataset. Thealgorithm used is a R port of the one described in the article of Li which is a multivariate general-ization of the algorithm of Naes and Martens.
Value
vector (Y1, . . . , Yr, X1, . . . , Xtotdim)
Note
The value of r depends on the value of ncomp :
ncomp r2 33 34 4
Author(s)
Frederic Bertrand<[email protected]>http://www-irma.u-strasbg.fr/~fbertran/
References
T. Naes, H. Martens, Comparison of prediction methods for multicollinear data, Commun. Stat.,Simul. 14 (1985) 545-576.http://dx.doi.org/10.1080/03610918508812458Baibing Li, Julian Morris, Elaine B. Martin, Model selection for partial least squares regression,Chemometrics and Intelligent Laboratory Systems 64 (2002) 79-89.http://dx.doi.org/10.1016/S0169-7439(02)00051-5
See Also
simul_data_complete for highlighting the simulations parameters
Examples
simul_data_YX(20,6)
summary.cv.plsRglmmodel 115
if(require(plsdepot)){dimX <- 6Astar <- 2(dataAstar2 <- t(replicate(50,simul_data_YX(dimX,Astar))))library(plsdepot)resAstar2 <- plsreg2(dataAstar2[,4:9],dataAstar2[,1:3],comps=5)resAstar2$Q2resAstar2$Q2[,4]>0.0975
dimX <- 6Astar <- 3(dataAstar3 <- t(replicate(50,simul_data_YX(dimX,Astar))))library(plsdepot)resAstar3 <- plsreg2(dataAstar3[,4:9],dataAstar3[,1:3],comps=5)resAstar3$Q2resAstar3$Q2[,4]>0.0975
dimX <- 6Astar <- 4(dataAstar4 <- t(replicate(50,simul_data_YX(dimX,Astar))))library(plsdepot)resAstar4 <- plsreg2(dataAstar4[,5:10],dataAstar4[,1:4],comps=5)resAstar4$Q2resAstar4$Q2[,5]>0.0975
rm(list=c("dimX","Astar"))}
summary.cv.plsRglmmodel
Summary method for plsRglm models
Description
This function provides a summary method for the class "cv.plsRglmmodel"
Usage
## S3 method for class 'cv.plsRglmmodel'summary(object, ...)
Arguments
object an object of the class "cv.plsRglmmodel"
... further arguments to be passed to or from methods.
116 summary.cv.plsRmodel
Value
An object of class "summary.cv.plsRmodel" if model is missing or model="pls". Otherwise anobject of class "summary.cv.plsRglmmodel".
Author(s)
Frederic Bertrand<[email protected]>http://www-irma.u-strasbg.fr/~fbertran/
References
Nicolas Meyer, Myriam Maumy-Bertrand et Frederic Bertrand (2010). Comparing the linear andthe logistic PLS regression with qualitative predictors: application to allelotyping data. Journal dela Societe Francaise de Statistique, 151(2), pages 1-18. http://smf4.emath.fr/Publications/JSFdS/151_2/pdf/sfds_jsfds_151_2_1-18.pdf
See Also
summary
Examples
data(Cornell)XCornell<-Cornell[,1:7]yCornell<-Cornell[,8]bbb <- cv.plsRglm(dataY=yCornell,dataX=XCornell,nt=10,NK=1,modele="pls-glm-family",family=gaussian())summary(bbb)rm(list=c("XCornell","yCornell","bbb"))
summary.cv.plsRmodel Summary method for plsR models
Description
This function provides a summary method for the class "cv.plsRmodel"
Usage
## S3 method for class 'cv.plsRmodel'summary(object, ...)
Arguments
object an object of the class "cv.plsRmodel"
... further arguments to be passed to or from methods.

summary.plsRglmmodel 117
Value
An object of class "summary.cv.plsRglmmodel".
Author(s)
Frederic Bertrand<[email protected]>http://www-irma.u-strasbg.fr/~fbertran/
References
Nicolas Meyer, Myriam Maumy-Bertrand et Frederic Bertrand (2010). Comparing the linear andthe logistic PLS regression with qualitative predictors: application to allelotyping data. Journal dela Societe Francaise de Statistique, 151(2), pages 1-18. http://smf4.emath.fr/Publications/JSFdS/151_2/pdf/sfds_jsfds_151_2_1-18.pdf
See Also
summary
Examples
data(Cornell)XCornell<-Cornell[,1:7]yCornell<-Cornell[,8]bbb <- cv.plsR(dataY=yCornell,dataX=XCornell,nt=10,K=6)summary(bbb)rm(list=c("XCornell","yCornell","bbb"))
summary.plsRglmmodel Summary method for plsRglm models
Description
This function provides a summary method for the class "plsRglmmodel"
Usage
## S3 method for class 'plsRglmmodel'summary(object, ...)
Arguments
object an object of the class "plsRglmmodel"
... further arguments to be passed to or from methods.
118 summary.plsRmodel
Value
call function call of plsRglmmodel
Author(s)
Frederic Bertrand<[email protected]>http://www-irma.u-strasbg.fr/~fbertran/
References
Nicolas Meyer, Myriam Maumy-Bertrand et Frederic Bertrand (2010). Comparing the linear andthe logistic PLS regression with qualitative predictors: application to allelotyping data. Journal dela Societe Francaise de Statistique, 151(2), pages 1-18. http://smf4.emath.fr/Publications/JSFdS/151_2/pdf/sfds_jsfds_151_2_1-18.pdf
See Also
summary
Examples
data(Cornell)XCornell<-Cornell[,1:7]yCornell<-Cornell[,8]modplsglm <- plsRglm(yCornell,XCornell,3,modele="pls-glm-gaussian")class(modplsglm)summary(modplsglm)rm(list=c("XCornell","yCornell","modplsglm"))
summary.plsRmodel Summary method for plsR models
Description
This function provides a summary method for the class "plsRmodel"
Usage
## S3 method for class 'plsRmodel'summary(object, ...)
Arguments
object an object of the class "plsRmodel"
... further arguments to be passed to or from methods.
tilt.bootpls 119
Value
call function call of plsRmodel
Author(s)
Frederic Bertrand<[email protected]>http://www-irma.u-strasbg.fr/~fbertran/
References
Nicolas Meyer, Myriam Maumy-Bertrand et Frederic Bertrand (2010). Comparing the linear andthe logistic PLS regression with qualitative predictors: application to allelotyping data. Journal dela Societe Francaise de Statistique, 151(2), pages 1-18. http://smf4.emath.fr/Publications/JSFdS/151_2/pdf/sfds_jsfds_151_2_1-18.pdf
See Also
summary
Examples
data(Cornell)XCornell<-Cornell[,1:7]yCornell<-Cornell[,8]modpls <- plsR(yCornell,XCornell,3,modele="pls")class(modpls)summary(modpls)rm(list=c("XCornell","yCornell","modpls"))
tilt.bootpls Tilted bootstrap for PLS models
Description
~~ A (1-5 lines) description of what the function does. ~~
Usage
tilt.bootpls(object, typeboot="plsmodel", statistic=coefs.plsR,R=c(499, 250, 250), alpha=c(0.025, 0.975), sim="ordinary",stype="i", index=1, stabvalue=1e6,...)

120 tilt.bootpls
Arguments
object ~~Explain object here~~
typeboot ~~Explain typeboot here~~
statistic ~~Explain statistic here~~
R ~~Explain R here~~
alpha ~~Explain alpha here~~
sim ~~Explain sim here~~
stype ~~Explain stype here~~
index ~~Explain index here~~
stabvalue ~~Explain stabvalue here~~
... ~~Explain ... here~~
Details
~~ More details than the description above ~~
Value
~Describe the value returned If it is a LIST, use
comp1 Description of ’comp1’
comp2 Description of ’comp2’
...
Author(s)
Frederic Bertrand<[email protected]>http://www-irma.u-strasbg.fr/~fbertran/
See Also
tilt.boot
Examples
## Not run:data(Cornell)XCornell<-Cornell[,1:7]yCornell<-Cornell[,8]
set.seed(1385)Cornell.tilt.boot <- tilt.bootpls(plsR(yCornell,XCornell,3), statistic=coefs.plsR,R=c(499, 100, 100), alpha=c(0.025, 0.975), sim="ordinary", stype="i", index=1)Cornell.tilt.bootstr(Cornell.tilt.boot)
tilt.bootplsglm 121
boxplots.bootpls(Cornell.tilt.boot,indices=2:7)
rm(Cornell.tilt.boot)
## End(Not run)
tilt.bootplsglm Tilted bootstrap for PLS models
Description
~~ A (1-5 lines) description of what the function does. ~~
Usage
tilt.bootplsglm(object, typeboot="fmodel_np", statistic=coefs.plsRglm,R=c(499, 250, 250), alpha=c(0.025, 0.975), sim="ordinary",stype="i", index=1, stabvalue=1e6,...)
Arguments
object ~~Explain object here~~
typeboot ~~Explain typeboot here~~
statistic ~~Explain statistic here~~
R ~~Explain R here~~
alpha ~~Explain alpha here~~
sim ~~Explain sim here~~
stype ~~Explain stype here~~
index ~~Explain index here~~
stabvalue ~~Explain stabvalue here~~
... ~~Explain ... here~~
Details
~~ More details than the description above ~~
Value
~Describe the value returned If it is a LIST, use
comp1 Description of ’comp1’
comp2 Description of ’comp2’
...
122 XbordeauxNA
Author(s)
Frederic Bertrand<[email protected]>http://www-irma.u-strasbg.fr/~fbertran/
See Also
tilt.boot
Examples
data(aze_compl)Xaze_compl<-aze_compl[,2:34]yaze_compl<-aze_compl$y
dataset <- cbind(y=yaze_compl,Xaze_compl)
# Lazraq-Cleroux PLS bootstrap Classic
aze_compl.tilt.boot <- tilt.bootplsglm(plsRglm(yaze_compl,Xaze_compl,3,modele="pls-glm-logistic", family=NULL), statistic=coefs.plsRglm, R=c(499, 100, 100),alpha=c(0.025, 0.975), sim="ordinary", stype="i", index=1)aze_compl.tilt.boot <- tilt.bootplsglm(plsRglm(yaze_compl,Xaze_compl,3,modele="pls-glm-logistic"), statistic=coefs.plsRglm, R=c(499, 100, 100),alpha=c(0.025, 0.975), sim="ordinary", stype="i", index=1)aze_compl.tilt.boot <- tilt.bootplsglm(plsRglm(yaze_compl,Xaze_compl,3,modele="pls-glm-family", family=binomial), statistic=coefs.plsRglm, R=c(499, 100, 100),alpha=c(0.025, 0.975), sim="ordinary", stype="i", index=1)
boxplots.bootpls(aze_compl.tilt.boot,1:2)
# PLS bootstrap balanced
aze_compl.tilt.boot <- tilt.bootplsglm(plsRglm(yaze_compl,Xaze_compl,3,modele="pls-glm-logistic"), statistic=coefs.plsRglm, R=c(499, 100, 100),alpha=c(0.025, 0.975), sim="balanced", stype="i", index=1)
XbordeauxNA Incomplete dataset for the quality of wine dataset
Description
Quality of Bordeaux wines (Quality) and four potentially predictive variables (Temperature,Sunshine, Heat and Rain).The value of Temperature for the first observation was remove from the matrix of predictors onpurpose.
XpineNAX21 123
Usage
data(XbordeauxNA)
Format
A data frame with 34 observations on the following 4 variables.
Temperature a numeric vector
Sunshine a numeric vector
Heat a numeric vector
Rain a numeric vector
Source
P. Bastien, V. Esposito-Vinzi, and M. Tenenhaus. (2005). PLS generalised linear regression. Com-putational Statistics & Data Analysis, 48(1):17-46.
References
M. Tenenhaus. (2005). La regression logistique PLS. In J.-J. Droesbeke, M. Lejeune, and G.Saporta, editors, Modeles statistiques pour donnees qualitatives. Editions Technip, Paris.
Examples
data(XbordeauxNA)str(XbordeauxNA)
XpineNAX21 Incomplete dataset from the pine caterpillars example
Description
The caterpillar dataset was extracted from a 1973 study on pine processionary caterpillars. Itassesses the influence of some forest settlement characteristics on the development of caterpillarcolonies. There are k=10 potentially explanatory variables defined on n=33 areas.The value of x2 for the first observation was remove from the matrix of predictors on purpose.
Usage
data(XpineNAX21)

124 XpineNAX21
Format
A data frame with 33 observations on the following 10 variables.
x1 altitude (in meters)
x2 slope (en degrees)
x3 number of pines in the area
x4 height (in meters) of the tree sampled at the center of the area
x5 diameter (in meters) of the tree sampled at the center of the area
x6 index of the settlement density
x7 orientation of the area (from 1 if southbound to 2 otherwise)
x8 height (in meters) of the dominant tree
x9 number of vegetation strata
x10 mix settlement index (from 1 if not mixed to 2 if mixed)
Details
These caterpillars got their names from their habit of moving over the ground in incredibly longhead-to-tail processions when leaving their nest to create a new colony.The XpineNAX21 is a dataset with a missing value for testing purpose.
Source
Tomassone R., Audrain S., Lesquoy-de Turckeim E., Millier C. (1992). “La regression, nouveauxregards sur une ancienne methode statistique”, INRA, Actualit?s Scientifiques et Agronomiques,Masson, Paris.
Examples
data(XpineNAX21)str(XpineNAX21)
Index
∗Topic coefcoef.plsRglmmodel, 18coef.plsRmodel, 19
∗Topic datagensimul_data_complete, 108simul_data_UniYX, 110simul_data_UniYX_binom, 111simul_data_YX, 113
∗Topic datasetsaze, 6aze_compl, 8bordeaux, 16CorMat, 26Cornell, 27fowlkes, 44pine, 64pine_full, 65pine_sup, 67XbordeauxNA, 122XpineNAX21, 123
∗Topic hplotsignpred, 107
∗Topic methodscoef.plsRglmmodel, 18coef.plsRmodel, 19cvtable, 42plot.table.summary.cv.plsRglmmodel,
68plot.table.summary.cv.plsRmodel,
69predict.plsRglmmodel, 94predict.plsRmodel, 97print.coef.plsRglmmodel, 99print.coef.plsRmodel, 100print.cv.plsRglmmodel, 101print.cv.plsRmodel, 102print.plsRglmmodel, 103print.plsRmodel, 104print.summary.plsRglmmodel, 105
print.summary.plsRmodel, 106summary.cv.plsRglmmodel, 115summary.cv.plsRmodel, 116summary.plsRglmmodel, 117summary.plsRmodel, 118
∗Topic modelsaic.dof, 3AICpls, 5bootpls, 9bootplsglm, 13boxplots.bootpls, 17coefs.plsR, 20coefs.plsRglm, 21coefs.plsRglmnp, 22coefs.plsRnp, 24confints.bootpls, 25cv.plsR, 28cv.plsRglm, 31infcrit.dof, 45kfolds2Chisq, 46kfolds2Chisqind, 48kfolds2coeff, 50kfolds2CVinfos_glm, 51kfolds2Mclassed, 53kfolds2Mclassedind, 55kfolds2Press, 56kfolds2Pressind, 57loglikpls, 59permcoefs.plsR, 60permcoefs.plsRglm, 61permcoefs.plsRglmnp, 62permcoefs.plsRnp, 63plots.confints.bootpls, 70PLS_glm_wvc, 89PLS_lm_wvc, 92plsR, 73plsR.dof, 79plsRglm, 81tilt.bootpls, 119
125

126 INDEX
tilt.bootplsglm, 121∗Topic predict
predict.plsRglmmodel, 94predict.plsRmodel, 97
∗Topic printcvtable, 42plot.table.summary.cv.plsRglmmodel,
68plot.table.summary.cv.plsRmodel,
69print.coef.plsRglmmodel, 99print.coef.plsRmodel, 100print.cv.plsRglmmodel, 101print.cv.plsRmodel, 102print.plsRglmmodel, 103print.plsRmodel, 104print.summary.plsRglmmodel, 105print.summary.plsRmodel, 106summary.cv.plsRglmmodel, 115summary.cv.plsRmodel, 116summary.plsRglmmodel, 117summary.plsRmodel, 118
∗Topic regressionaic.dof, 3AICpls, 5boxplots.bootpls, 17confints.bootpls, 25cv.plsR, 28cv.plsRglm, 31infcrit.dof, 45kfolds2Chisq, 46kfolds2Chisqind, 48kfolds2coeff, 50kfolds2CVinfos_glm, 51kfolds2Mclassed, 53kfolds2Mclassedind, 55kfolds2Press, 56kfolds2Pressind, 57loglikpls, 59plots.confints.bootpls, 70PLS_glm_wvc, 89PLS_lm_wvc, 92plsR, 73plsR.dof, 79plsRglm, 81
∗Topic utilitiesaic.dof, 3AICpls, 5
dicho, 43infcrit.dof, 45loglikpls, 59plsR.dof, 79simul_data_complete, 108simul_data_UniYX, 110simul_data_UniYX_binom, 111simul_data_YX, 113
AIC, 5aic.dof, 3, 80AICpls, 5, 60as.data.frame, 28, 32, 74, 81aze, 6, 8aze_compl, 8
bic.dof (aic.dof), 3boot, 10, 11, 13, 14boot.ci, 25bootpls, 9, 18, 21, 24, 25, 61, 64, 77, 86bootplsglm, 12, 22, 23, 25, 62, 63bordeaux, 16boxplot, 17boxplots.bootpls, 17
coef, 19, 20coef.plsRglmmodel, 18coef.plsRmodel, 19coefs.plsR, 20coefs.plsRglm, 21coefs.plsRglmnp, 22coefs.plsRnp, 24confints.bootpls, 25, 71CorMat, 26Cornell, 27cv.plsR, 28, 54–56, 58, 77cv.plsRglm, 31, 46, 48, 51, 52, 55, 86cv.plsRglmmodel.default (cv.plsRglm), 31cv.plsRglmmodel.formula (cv.plsRglm), 31cv.plsRmodel.default (cv.plsR), 28cv.plsRmodel.formula (cv.plsR), 28cvtable, 42
dicho, 43
family, 32, 82, 89formula, 28, 32, 74, 81fowlkes, 44
glm, 34, 83, 90
INDEX 127
glm.control, 33, 83gmdl.dof (aic.dof), 3
ifelse, 44infcrit.dof, 4, 45, 46, 80
kfolds2Chisq, 46, 49kfolds2Chisqind, 47, 48kfolds2coeff, 30, 35, 47, 49, 50, 52, 54, 55,
57, 58kfolds2CVinfos_glm, 51kfolds2CVinfos_lm, 30kfolds2Mclassed, 30, 35, 47, 49, 51, 52, 53,
55, 57, 58kfolds2Mclassedind, 30, 35, 47, 49, 51, 52,
54, 55, 57, 58kfolds2Press, 30, 35, 47, 49, 51, 52, 54, 55,
56, 58kfolds2Pressind, 30, 35, 47, 49, 51, 52, 54,
55, 57, 57
legend, 70logLik, 60loglikpls, 5, 59
model.offset, 33, 82
offset, 33, 82
permcoefs.plsR, 60permcoefs.plsRglm, 61permcoefs.plsRglmnp, 62permcoefs.plsRnp, 63pine, 64pine_full, 65pine_sup, 67plot, 70, 71plot.table.summary.cv.plsRglmmodel, 68plot.table.summary.cv.plsRmodel, 69plots.confints.bootpls, 70PLS_glm, 91PLS_glm (plsRglm), 81PLS_glm_formula (plsRglm), 81PLS_glm_kfoldcv, 91PLS_glm_kfoldcv (cv.plsRglm), 31PLS_glm_kfoldcv_formula, 90PLS_glm_kfoldcv_formula (cv.plsRglm), 31PLS_glm_wvc, 89, 93PLS_lm, 93PLS_lm (plsR), 73
PLS_lm_formula (plsR), 73PLS_lm_kfoldcv, 93PLS_lm_kfoldcv (cv.plsR), 28PLS_lm_kfoldcv_formula (cv.plsR), 28PLS_lm_wvc, 91, 92plsR, 20, 60, 73, 86plsR.dof, 4, 46, 79plsRglm, 22–24, 61–63, 77, 81plsRglmmodel.default (plsRglm), 81plsRglmmodel.formula (plsRglm), 81plsRmodel.default (plsR), 73plsRmodel.formula (plsR), 73predict.glm, 95predict.plsRglmmodel, 94predict.plsRmodel, 97print, 100–107print.coef.plsRglmmodel, 99print.coef.plsRmodel, 100print.cv.plsRglmmodel, 101print.cv.plsRmodel, 102print.plsRglmmodel, 103print.plsRmodel, 104print.summary.plsRglmmodel, 105print.summary.plsRmodel, 106
signpred, 107simul_data_complete, 108, 111, 114simul_data_UniYX, 110, 112simul_data_UniYX_binom, 111simul_data_YX, 109, 111, 113summary, 35, 43, 51, 52, 68, 69, 106, 107,
116–119summary.cv.plsRglmmodel, 115summary.cv.plsRmodel, 116summary.plsRglmmodel, 117summary.plsRmodel, 118
tilt.boot, 120, 122tilt.bootpls, 119tilt.bootplsglm, 121
visweb, 107, 108
XbordeauxNA, 122XpineNAX21, 123
Top Related