


Languages
Pages
Legal


8/14/2019 PARKER COUNTY - Poolville ISD - 2005 Texas School Survey of Drug and Alcohol Use
http://slidepdf.com/reader/full/parker-county-poolville-isd-2005-texas-school-survey-of-drug-and-alcohol 1/89

8/14/2019 PARKER COUNTY - Poolville ISD - 2005 Texas School Survey of Drug and Alcohol Use
http://slidepdf.com/reader/full/parker-county-poolville-isd-2005-texas-school-survey-of-drug-and-alcohol 2/89

8/14/2019 PARKER COUNTY - Poolville ISD - 2005 Texas School Survey of Drug and Alcohol Use
http://slidepdf.com/reader/full/parker-county-poolville-isd-2005-texas-school-survey-of-drug-and-alcohol 3/89
PoolvilleSpring 2005
________________________________________________________________________________
Table T-3: In the past 30 days, how many cigarettes have you smoked?
>1 But >10 But >1 Pack<1 Per <10 Per <1 Pack But <2 >2 Packs
None Day Day Per Day Packs/Day Per Day
All 76.8% 5.2% 10.2% 5.2% 2.6% * %Grades 7-8 87.5% 5.0% 4.2% 3.3% * % * %Grades 9-12 71.5% 5.3% 13.2% 6.1% 3.8% * %
________________________________________________________________________________
Table T-4: Average age of first use of:
Grades 7-8 Grades 9-12
Tobacco 10.8 12.2
________________________________________________________________________________
Table T-5: If you wanted some, how difficult would it be to get...
Cigarettes?
Never Very Somewhat Somewhat VeryHeard Of Impossible Difficult Difficult Easy Easy
All 9.6% 9.8% 6.2% 7.6% 21.6% 45.1%Grades 7-8 15.6% 14.7% 11.0% 13.4% 20.4% 24.9%Grades 9-12 6.4% 7.2% 3.7% 4.6% 22.3% 55.9%
Smokeless Tobacco?
Never Very Somewhat Somewhat VeryHeard Of Impossible Difficult Difficult Easy Easy
All 16.9% 14.9% 5.5% 4.8% 16.3% 41.5%Grades 7-8 29.4% 24.5% 7.4% 10.6% 10.6% 17.5%Grades 9-12 10.3% 9.8% 4.6% 1.8% 19.3% 54.2%
________________________________________________________________________________
Table T-6: About how many of your close friends...
Use any tobacco product?
Never heardNone A Few Some Most All
All 28.0% 28.7 % 16.1% 18.7% 8.5%Grades 7-8 44.9% 36.8 % 10.4% 6.4% 1.6%Grades 9-12 18.9% 24.3 % 19.2% 25.4% 12.2%

8/14/2019 PARKER COUNTY - Poolville ISD - 2005 Texas School Survey of Drug and Alcohol Use
http://slidepdf.com/reader/full/parker-county-poolville-isd-2005-texas-school-survey-of-drug-and-alcohol 4/89
PoolvilleSpring 2005
________________________________________________________________________________
Smoke cigarettes?
Never heardNone A Few Some Most All
All 30.9% 33.9 % 13.6% 17.1% 4.5%Grades 7-8 44.1% 41.8 % 7.3% 6.9% * %Grades 9-12 24.2% 29.8 % 16.8% 22.3% 6.9%
Use a smokeless tobacco product?
Never heardNone A Few Some Most All
All 51.1% 19.6 % 12.6% 9.8% 6.9%Grades 7-8 75.9% 15.3 % 5.4% 1.7% 1.7%Grades 9-12 38.2% 21.9 % 16.3% 14.0% 9.7%
________________________________________________________________________________
Table T-7: How do your parents feel about kids your age smoking cigarettes?
Strongly Mildly Mildly Strongly Don'tDisapprove Disapprove Neither Approve Approve Know
All 59.8% 7.2% 14.8% 1.1% 3.6% 13.5%Grades 7-8 74.9% 3.4% 3.8% * % 1.7% 16.2%Grades 9-12 52.4% 9.0% 20.1% 1.7% 4.5% 12.2%
________________________________________________________________________________
Table T-8: How dangerous do you think it is for kids your age to use tobacco?
Very Somewhat Not Very Not at All Do NotDangerous Dangerous Dangerous Dangerous Know
All 42.1% 25.7% 16.3% 7.7% 8.1%Grades 7-8 50.4% 31.2% 7.1% 1.7% 9.6%Grades 9-12 37.9% 22.9% 21.0% 10.8% 7.3%

8/14/2019 PARKER COUNTY - Poolville ISD - 2005 Texas School Survey of Drug and Alcohol Use
http://slidepdf.com/reader/full/parker-county-poolville-isd-2005-texas-school-survey-of-drug-and-alcohol 5/89

8/14/2019 PARKER COUNTY - Poolville ISD - 2005 Texas School Survey of Drug and Alcohol Use
http://slidepdf.com/reader/full/parker-county-poolville-isd-2005-texas-school-survey-of-drug-and-alcohol 6/89

8/14/2019 PARKER COUNTY - Poolville ISD - 2005 Texas School Survey of Drug and Alcohol Use
http://slidepdf.com/reader/full/parker-county-poolville-isd-2005-texas-school-survey-of-drug-and-alcohol 7/89
PoolvilleSpring 2005
________________________________________________________________________________
Wine?
Several Several About About Less ThanNever Every Times Times Once a Once a Once aUsed Day a Week a Month Month Year Year
All 53.3% * % 2.7% 6.9% 13.4% 11.2% 12.5%Grades 7-8 55.0% * % 3.4% * % 15.0% 15.9% 10.7%Grades 9-12 52.4% * % 2.3% 10.5% 12.5% 8.8% 13.4%
Liquor?
Several Several About About Less ThanNever Every Times Times Once a Once a Once aUsed Day a Week a Month Month Year Year
All 47.2% * % 3.5% 13.3% 18.7% 9.3% 8.1%Grades 7-8 56.7% * % 1.7% 7.1% 18.9% 8.5% 7.1%
Grades 9-12 42.3% * % 4.4% 16.4% 18.6% 9.7% 8.6%
________________________________________________________________________________
Table A-3: When you drink the following alcoholic beverages, how many drinks doyou usually have at one time, on average?
Beer
Never Ever 5 or More 1 to 4 Less Than 1
All 37.2% 62.8% 26.8% 23.5% 12.4%Grades 7-8 37.5% 62.5% 17.1% 23.3% 22.1%Grades 9-12 37.0% 63.0% 31.8% 23.7% 7.6%
Wine Coolers
Never Ever 5 or More 1 to 4 Less Than 1
All 43.1% 56.9% 15.6% 32.2% 9.1%Grades 7-8 43.8% 56.2% 8.7% 30.8% 16.7%Grades 9-12 42.8% 57.2% 19.1% 32.9% 5.2%
Wine
Never Ever 5 or More 1 to 4 Less Than 1
All 50.7% 49.3% 6.6% 24.6% 18.1%Grades 7-8 44.2% 55.8% 3.4% 23.4% 29.0%Grades 9-12 54.1% 45.9% 8.3% 25.2% 12.4%
Liquor
Never Ever 5 or More 1 to 4 Less Than 1
All 43.0% 57.0% 19.2% 30.8% 7.1%Grades 7-8 49.4% 50.6% 10.1% 25.1% 15.3%Grades 9-12 39.8% 60.2% 23.6% 33.6% 3.0%

8/14/2019 PARKER COUNTY - Poolville ISD - 2005 Texas School Survey of Drug and Alcohol Use
http://slidepdf.com/reader/full/parker-county-poolville-isd-2005-texas-school-survey-of-drug-and-alcohol 8/89
PoolvilleSpring 2005
________________________________________________________________________________
Table A-4: During the past twelve months, how often have you had five or more
drinks at one time?
BeerSeveral Several Less Than
Never Ever Times/Week Times/Month Once/Month
All 52.3% 47.7% 4.7% 24.5% 18.6%Grades 7-8 52.1% 47.9% 3.4% 19.1% 25.5%Grades 9-12 52.4% 47.6% 5.3% 27.1% 15.2%
Wine CoolersSeveral Several Less Than
Never Ever Times/Week Times/Month Once/Month
All 59.9% 40.1% 1.8% 19.1% 19.1%Grades 7-8 64.6% 35.4% 1.7% 10.3% 23.4%Grades 9-12 57.6% 42.4% 1.9% 23.5% 17.0%
WineSeveral Several Less Than
Never Ever Times/Week Times/Month Once/Month
All 64.8% 35.2% 1.9% 13.9% 19.4%Grades 7-8 66.5% 33.5% 1.8% 5.7% 26.0%Grades 9-12 64.0% 36.0% 1.9% 17.9% 16.2%
LiquorSeveral Several Less Than
Never Ever Times/Week Times/Month Once/Month
All 55.2% 44.8% 2.4% 22.2% 20.3%Grades 7-8 62.6% 37.4% 1.7% 8.9% 26.8%Grades 9-12 51.4% 48.6% 2.8% 28.9% 17.0%
________________________________________________________________________________
Table A-5: Average age of first use of:
Grades 7-8 Grades 9-12
Alcohol 10.6 11.9Beer 10.6 12.4Wine Coolers 10.6 12.2Wine 11.1 12.4Liquor 11.0 12.8
________________________________________________________________________________
Table A-6: If you wanted some, how difficult would it be to get...
Beer?
Never Very Somewhat Somewhat VeryHeard Of Impossible Difficult Difficult Easy Easy
All 7.1% 9.9% 9.6% 11.5% 19.6% 42.2%Grades 7-8 11.7% 11.2% 10.4% 15.1% 16.4% 35.2%Grades 9-12 4.6% 9.2% 9.2% 9.4% 21.4% 46.1%

8/14/2019 PARKER COUNTY - Poolville ISD - 2005 Texas School Survey of Drug and Alcohol Use
http://slidepdf.com/reader/full/parker-county-poolville-isd-2005-texas-school-survey-of-drug-and-alcohol 9/89
PoolvilleSpring 2005
________________________________________________________________________________
Wine coolers?
Never Very Somewhat Somewhat VeryHeard Of Impossible Difficult Difficult Easy Easy
All 9.6% 14.3% 7.8% 10.5% 18.1% 39.7%Grades 7-8 17.6% 24.1% 3.7% 16.6% 10.6% 27.4%Grades 9-12 5.2% 9.1% 10.0% 7.2% 22.1% 46.4%
Wine?
Never Very Somewhat Somewhat VeryHeard Of Impossible Difficult Difficult Easy Easy
All 11.4% 16.2% 9.6% 8.3% 19.9% 34.7%Grades 7-8 17.5% 23.6% 10.5% 8.1% 18.3% 22.0%Grades 9-12 8.0% 12.1% 9.1% 8.4% 20.7% 41.6%
Liquor?
Never Very Somewhat Somewhat VeryHeard Of Impossible Difficult Difficult Easy Easy
All 7.0% 16.5% 8.2% 9.9% 18.7% 39.6%Grades 7-8 11.7% 25.4% 8.7% 9.2% 19.6% 25.4%Grades 9-12 4.6% 11.9% 7.9% 10.3% 18.2% 47.1%
________________________________________________________________________________
Table A-7: Since school began in the fall, on how many days (if any) have you...
Attended class while drunk on alcohol?
None 1-3 Days 4-9 Days 10+ Days
All 86% 10.1% 2.6% 1.7%Grades 7-8 86% 10.6% * % 3.4%Grades 9-12 85% 9.8% 3.9% 0.9%
Gotten into trouble with teachers because of your drinking?
None 1-3 Days 4-9 Days 10+ Days
All 97% 2.0% 0.7% * %Grades 7-8 100% * % * % * %Grades 9-12 96% 3.0% 1.0% * %

8/14/2019 PARKER COUNTY - Poolville ISD - 2005 Texas School Survey of Drug and Alcohol Use
http://slidepdf.com/reader/full/parker-county-poolville-isd-2005-texas-school-survey-of-drug-and-alcohol 10/89
PoolvilleSpring 2005
________________________________________________________________________________
Table A-8: School year use of alcohol by absences and conduct problems:
Average days absent due to illness or other reasons:
Alcohol Users: 4.6 days per studentAlcohol Non-users: 3.8 days per student
Average days conduct problems reported:
Alcohol Users: 3.5 days per studentAlcohol Non-users: 1.4 days per student
________________________________________________________________________________
Table A-9: During the past twelve months, how many times have you...
Driven a car when you've had a good bit to drink?
None 1-3 Times 4-9 Times 10+ Times
All 89.7% 8.9% 1.4% * %Grades 9-12 89.7% 8.9% 1.4% * %
Gotten into trouble with the police because of drinking?
None 1-3 Times 4-9 Times 10+ Times
All 94.1% 5.9% * % * %Grades 7-8 94.4% 5.6% * % * %Grades 9-12 93.9% 6.1% * % * %
________________________________________________________________________________
Table A-10: About how many of your close friends use...
Any alcohol product?
Never heardNone A Few Some Most All
All 19.6% 26.0 % 16.2% 21.5% 16.8%Grades 7-8 26.5% 30.9 % 8.5% 28.4% 5.7%Grades 9-12 16.2% 23.5 % 20.1% 17.9% 22.4%
Beer?
Never heardNone A Few Some Most All
All 21.0% 25.9 % 15.2% 22.1% 15.8%Grades 7-8 28.0% 32.6 % 9.0% 24.4% 6.0%Grades 9-12 17.4% 22.5 % 18.4% 21.0% 20.7%
8/14/2019 PARKER COUNTY - Poolville ISD - 2005 Texas School Survey of Drug and Alcohol Use
http://slidepdf.com/reader/full/parker-county-poolville-isd-2005-texas-school-survey-of-drug-and-alcohol 11/89
PoolvilleSpring 2005
________________________________________________________________________________
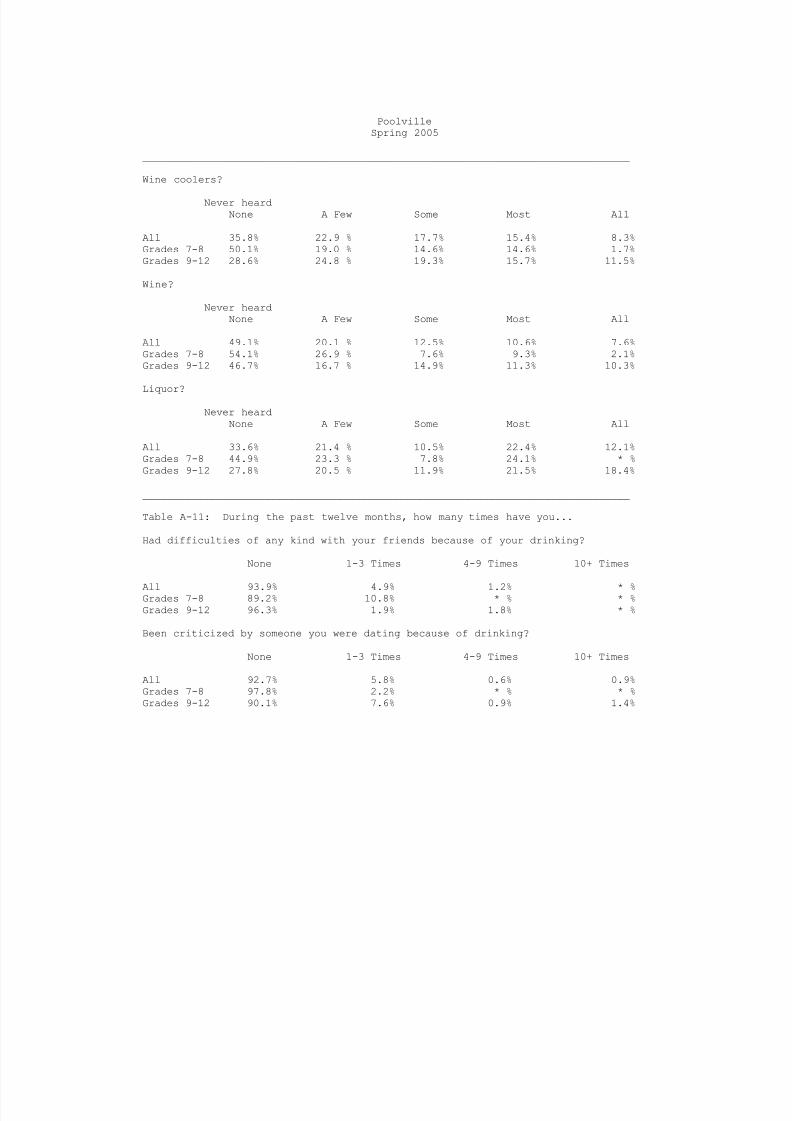
Wine coolers?
Never heardNone A Few Some Most All
All 35.8% 22.9 % 17.7% 15.4% 8.3%Grades 7-8 50.1% 19.0 % 14.6% 14.6% 1.7%Grades 9-12 28.6% 24.8 % 19.3% 15.7% 11.5%
Wine?
Never heardNone A Few Some Most All
All 49.1% 20.1 % 12.5% 10.6% 7.6%Grades 7-8 54.1% 26.9 % 7.6% 9.3% 2.1%Grades 9-12 46.7% 16.7 % 14.9% 11.3% 10.3%
Liquor?
Never heardNone A Few Some Most All
All 33.6% 21.4 % 10.5% 22.4% 12.1%Grades 7-8 44.9% 23.3 % 7.8% 24.1% * %Grades 9-12 27.8% 20.5 % 11.9% 21.5% 18.4%
________________________________________________________________________________
Table A-11: During the past twelve months, how many times have you...
Had difficulties of any kind with your friends because of your drinking?
None 1-3 Times 4-9 Times 10+ Times
All 93.9% 4.9% 1.2% * %Grades 7-8 89.2% 10.8% * % * %Grades 9-12 96.3% 1.9% 1.8% * %
Been criticized by someone you were dating because of drinking?
None 1-3 Times 4-9 Times 10+ Times
All 92.7% 5.8% 0.6% 0.9%Grades 7-8 97.8% 2.2% * % * %Grades 9-12 90.1% 7.6% 0.9% 1.4%

8/14/2019 PARKER COUNTY - Poolville ISD - 2005 Texas School Survey of Drug and Alcohol Use
http://slidepdf.com/reader/full/parker-county-poolville-isd-2005-texas-school-survey-of-drug-and-alcohol 12/89
PoolvilleSpring 2005
________________________________________________________________________________
Table A-12: Thinking of parties you attended this school year, how often was
alcohol used? *
Half Most Of Don't Didn'tNever Seldom the Time the Time Always Know Attend
All 41% 9.5% 8.7% 7.0% 26.8% 1.2% 5.6%Grades 7-8 49% 11.5% 7.8% 4.9% 15.5% 3.7% 7.4%Grades 9-12 37% 8.4% 9.2% 8.1% 32.5% * % 4.7%
________________________________________________________________________________
Table A-13: How often, if ever, do you get alcoholic beverages from..
At home
Do Not Most ofDrink Never Seldom the time Always
All 39.6% 21.1% 30.7% 5.4% 3.1%Grades 7-8 39.6% 23.3% 33.8% 3.3% * %Grades 9-12 39.6% 20.0% 29.1% 6.5% 4.8%
From friends
Do Not Most ofDrink Never Seldom the time Always
All 35.2% 14.7% 14.6% 24.0% 11.5%Grades 7-8 36.6% 18.7% 19.6% 18.3% 6.8%Grades 9-12 34.4% 12.7% 12.1% 26.9% 13.9%
From a store
Do Not Most of
Drink Never Seldom the time Always
All 38.1% 47.9% 9.0% 3.1% 1.9%Grades 7-8 37.1% 51.9% 11.0% * % * %Grades 9-12 38.6% 45.9% 7.9% 4.6% 2.9%
At parties
Do Not Most ofDrink Never Seldom the time Always
All 31.7% 12.5% 15.0% 15.6% 25.1%Grades 7-8 30.5% 18.3% 17.5% 15.0% 18.7%Grades 9-12 32.4% 9.5% 13.8% 16.0% 28.4%
Other source
Do Not Most ofDrink Never Seldom the time Always
All 37.4% 21.8% 15.7% 13.2% 12.0%Grades 7-8 36.6% 24.2% 15.8% 18.3% 5.1%Grades 9-12 37.8% 20.6% 15.6% 10.5% 15.6%

8/14/2019 PARKER COUNTY - Poolville ISD - 2005 Texas School Survey of Drug and Alcohol Use
http://slidepdf.com/reader/full/parker-county-poolville-isd-2005-texas-school-survey-of-drug-and-alcohol 13/89
PoolvilleSpring 2005
________________________________________________________________________________
Table A-14: How do your parents feel about kids your age drinking beer?
Strongly Mildly Mildly Strongly Don'tDisapprove Disapprove Neither Approve Approve Know
All 56.4% 14.9% 10.5% 5.1% 3.8% 9.4%Grades 7-8 61.8% 11.3% 9.6% 3.9% 3.5% 10.0%Grades 9-12 53.8% 16.6% 10.9% 5.6% 4.0% 9.1%
________________________________________________________________________________
Table A-15: How dangerous do you think it is for kids your age to use alcohol?
Very Somewhat Not Very Not at All Do NotDangerous Dangerous Dangerous Dangerous Know
All 42.3% 26.8% 18.0% 6.7% 6.3%Grades 7-8 48.3% 25.8% 16.7% 5.4% 3.8%
Grades 9-12 39.1% 27.2% 18.6% 7.4% 7.6%

8/14/2019 PARKER COUNTY - Poolville ISD - 2005 Texas School Survey of Drug and Alcohol Use
http://slidepdf.com/reader/full/parker-county-poolville-isd-2005-texas-school-survey-of-drug-and-alcohol 14/89
PoolvilleSpring 2005
________________________________________________________________________________
Table D-1: How recently, if ever, have you used...
Past School Ever NeverMonth Year Used Used
________________________________________________________________________________Marijuana? All 11.5% 20.1% 35.1% 64.9%
Grades 7-8 10.2% 19.1% 25.6% 74.4%Grades 9-12 12.2% 20.6% 40.0% 60.0%
________________________________________________________________________________Cocaine? All 1.3% 2.4% 4.3% 95.7%
Grades 7-8 3.8% 5.4% 5.4% 94.6%Grades 9-12 * % 0.9% 3.7% 96.3%
________________________________________________________________________________Crack? All 0.7% 0.7% 2.6% 97.4%
Grades 7-8 2.1% 2.8% 2.8% 97.2%Grades 9-12 * % 2.8% 5.6% 94.4%
________________________________________________________________________________Hallucinogens? All 1.3% 2.6% 6.1% 93.9%
Grades 7-8 * % 2.1% 3.7% 96.3%Grades 9-12 2.0% 2.8% 7.4% 92.6%________________________________________________________________________________Uppers? All 1.8% 2.4% 4.9% 95.1%
Grades 7-8 1.6% 1.6% 3.7% 96.3%Grades 9-12 1.9% 2.8% 5.5% 94.5%
________________________________________________________________________________Downers? All 0.7% 1.8% 4.2% 95.8%
Grades 7-8 * % * % 1.6% 98.4%Grades 9-12 1.0% 2.8% 5.5% 94.5%
________________________________________________________________________________Rohypnol? All 0.6% 0.6% 1.2% 98.8%
Grades 7-8 1.7% 2.3% 2.3% 97.7%Grades 9-12 * % 2.3% 3.2% 96.8%
________________________________________________________________________________Steroids? All 0.6% 0.6% 1.9% 98.1%
Grades 7-8 1.7% 2.3% 2.3% 97.7%
Grades 9-12 * % 2.3% 4.3% 95.7%________________________________________________________________________________Ecstasy? All 1.3% 1.9% 6.5% 93.5%
Grades 7-8 4.0% 5.7% 9.7% 90.3%Grades 9-12 * % * % 5.0% 95.0%
________________________________________________________________________________Heroin? All 1.3% 1.9% 1.9% 98.1%
Grades 7-8 4.0% 5.7% 7.6% 92.4%Grades 9-12 * % * % 7.6% 92.4%
________________________________________________________________________________
Table D-2: How often do you normally use...
Marijuana?
Several Several About About Less Than
Never Every Times Times Once a Once a Once aUsed Day a Week a Month Month Year Year
All 69.3% * % 5.8% 3.1% 4.9% 6.2% 10.7%Grades 7-8 73.6% * % 9.9% 1.8% 4.0% 3.6% 7.1%Grades 9-12 67.2% * % 3.8% 3.8% 5.4% 7.5% 12.4%

8/14/2019 PARKER COUNTY - Poolville ISD - 2005 Texas School Survey of Drug and Alcohol Use
http://slidepdf.com/reader/full/parker-county-poolville-isd-2005-texas-school-survey-of-drug-and-alcohol 15/89
PoolvilleSpring 2005
________________________________________________________________________________
Cocaine?
Several Several About About Less ThanNever Every Times Times Once a Once a Once aUsed Day a Week a Month Month Year Year
All 96.1% * % 0.6% * % 0.7% 0.7% 1.9%Grades 7-8 96.0% * % 1.8% * % 2.2% * % * %Grades 9-12 96.1% * % * % * % * % 1.0% 2.8%
Crack?
Several Several About About Less ThanNever Every Times Times Once a Once a Once aUsed Day a Week a Month Month Year Year
All 97.3% * % 0.6% * % 0.8% * % 1.3%Grades 7-8 95.8% * % 1.9% * % 2.4% * % * %
Grades 9-12 98.1% * % * % * % * % * % 1.9%
Hallucinogens?
Several Several About About Less ThanNever Every Times Times Once a Once a Once aUsed Day a Week a Month Month Year Year
All 94.8% * % * % * % 0.7% 1.3% 3.2%Grades 7-8 96.1% * % * % * % 2.2% 1.7% * %Grades 9-12 94.2% * % * % * % * % 1.0% 4.8%
Uppers?
Several Several About About Less ThanNever Every Times Times Once a Once a Once aUsed Day a Week a Month Month Year Year
All 96.8% * % * % * % 0.7% 1.4% 1.2%Grades 7-8 97.8% * % * % * % * % 2.2% * %Grades 9-12 96.2% * % * % * % 1.0% 1.0% 1.7%
Downers?
Several Several About About Less ThanNever Every Times Times Once a Once a Once aUsed Day a Week a Month Month Year Year
All 96.8% * % * % * % 1.3% 0.7% 1.2%Grades 7-8 98.2% * % * % * % 1.8% * % * %Grades 9-12 96.1% * % * % * % 1.1% 1.1% 1.8%
Rohypnol?
Several Several About About Less ThanNever Every Times Times Once a Once a Once aUsed Day a Week a Month Month Year Year
All 98.8% * % * % * % * % * % 1.2%Grades 7-8 98.2% * % * % * % * % * % 1.8%Grades 9-12 99.1% * % * % * % * % * % 0.9%

8/14/2019 PARKER COUNTY - Poolville ISD - 2005 Texas School Survey of Drug and Alcohol Use
http://slidepdf.com/reader/full/parker-county-poolville-isd-2005-texas-school-survey-of-drug-and-alcohol 16/89
PoolvilleSpring 2005
________________________________________________________________________________
Steroids?
Several Several About About Less ThanNever Every Times Times Once a Once a Once aUsed Day a Week a Month Month Year Year
All 98.6% * % * % * % * % 0.7% 0.7%Grades 7-8 100.0% * % * % * % * % * % * %Grades 9-12 97.9% * % * % * % * % 1.1% 1.1%
Ecstasy?
Several Several About About Less ThanNever Every Times Times Once a Once a Once aUsed Day a Week a Month Month Year Year
All 95.4% * % 0.6% 0.8% * % 0.7% 2.6%Grades 7-8 91.9% * % 1.8% 2.3% * % * % 4.0%
Grades 9-12 97.1% * % * % * % * % 1.0% 1.8%
Heroin?
Several Several About About Less ThanNever Every Times Times Once a Once a Once aUsed Day a Week a Month Month Year Year
All 98.7% * % 0.6% * % 0.7% * % * %Grades 7-8 96.0% * % 1.8% * % 2.2% * % * %Grades 9-12 100.0% * % * % * % * % * % * %
________________________________________________________________________________
Table D-3: Average age of first use of:
Grades 7-8 Grades 9-12
Marijuana 12.2 13.7Cocaine * *Crack * *Hallucinogens * *Uppers * *Downers * *Rohypnol * *Steroids * *Ecstasy * *Heroin * *
8/14/2019 PARKER COUNTY - Poolville ISD - 2005 Texas School Survey of Drug and Alcohol Use
http://slidepdf.com/reader/full/parker-county-poolville-isd-2005-texas-school-survey-of-drug-and-alcohol 17/89
PoolvilleSpring 2005
________________________________________________________________________________
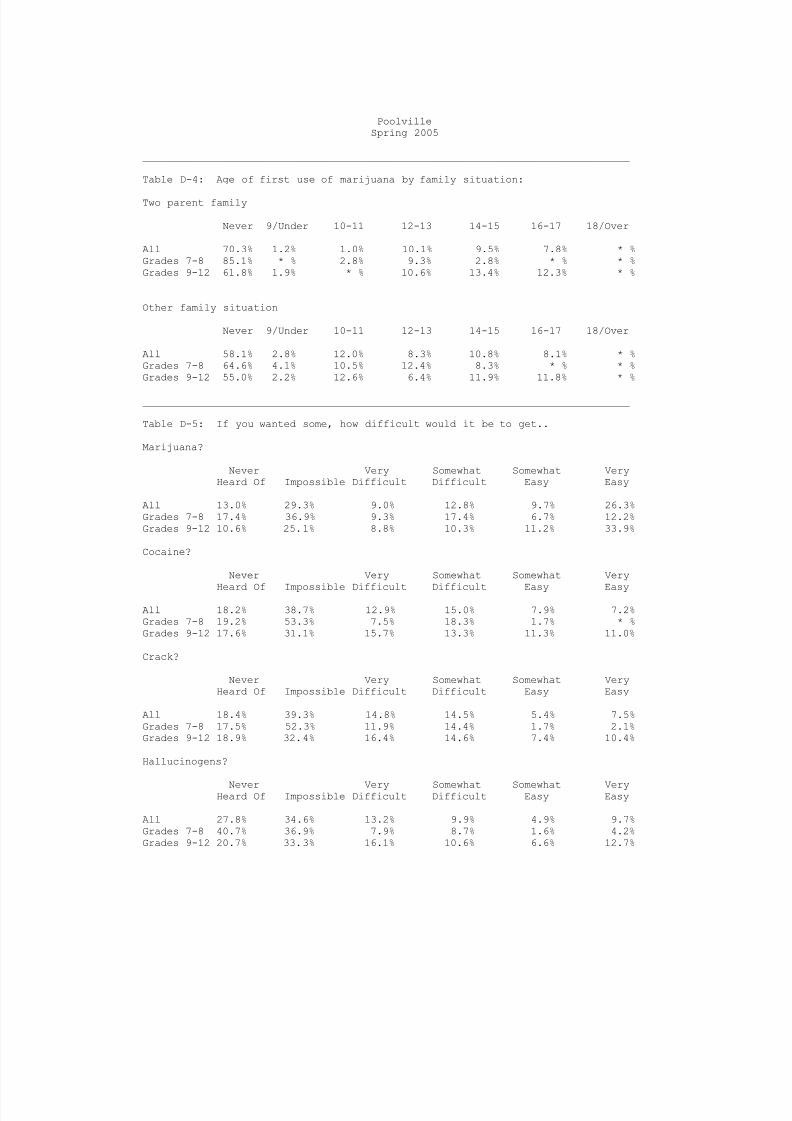
Table D-4: Age of first use of marijuana by family situation:
Two parent family
Never 9/Under 10-11 12-13 14-15 16-17 18/Over
All 70.3% 1.2% 1.0% 10.1% 9.5% 7.8% * %Grades 7-8 85.1% * % 2.8% 9.3% 2.8% * % * %Grades 9-12 61.8% 1.9% * % 10.6% 13.4% 12.3% * %
Other family situation
Never 9/Under 10-11 12-13 14-15 16-17 18/Over
All 58.1% 2.8% 12.0% 8.3% 10.8% 8.1% * %Grades 7-8 64.6% 4.1% 10.5% 12.4% 8.3% * % * %Grades 9-12 55.0% 2.2% 12.6% 6.4% 11.9% 11.8% * %
________________________________________________________________________________
Table D-5: If you wanted some, how difficult would it be to get..
Marijuana?
Never Very Somewhat Somewhat VeryHeard Of Impossible Difficult Difficult Easy Easy
All 13.0% 29.3% 9.0% 12.8% 9.7% 26.3%Grades 7-8 17.4% 36.9% 9.3% 17.4% 6.7% 12.2%Grades 9-12 10.6% 25.1% 8.8% 10.3% 11.2% 33.9%
Cocaine?
Never Very Somewhat Somewhat Very
Heard Of Impossible Difficult Difficult Easy Easy
All 18.2% 38.7% 12.9% 15.0% 7.9% 7.2%Grades 7-8 19.2% 53.3% 7.5% 18.3% 1.7% * %Grades 9-12 17.6% 31.1% 15.7% 13.3% 11.3% 11.0%
Crack?
Never Very Somewhat Somewhat VeryHeard Of Impossible Difficult Difficult Easy Easy
All 18.4% 39.3% 14.8% 14.5% 5.4% 7.5%Grades 7-8 17.5% 52.3% 11.9% 14.4% 1.7% 2.1%Grades 9-12 18.9% 32.4% 16.4% 14.6% 7.4% 10.4%
Hallucinogens?
Never Very Somewhat Somewhat VeryHeard Of Impossible Difficult Difficult Easy Easy
All 27.8% 34.6% 13.2% 9.9% 4.9% 9.7%Grades 7-8 40.7% 36.9% 7.9% 8.7% 1.6% 4.2%Grades 9-12 20.7% 33.3% 16.1% 10.6% 6.6% 12.7%

8/14/2019 PARKER COUNTY - Poolville ISD - 2005 Texas School Survey of Drug and Alcohol Use
http://slidepdf.com/reader/full/parker-county-poolville-isd-2005-texas-school-survey-of-drug-and-alcohol 18/89
PoolvilleSpring 2005
________________________________________________________________________________
Uppers?
Never Very Somewhat Somewhat VeryHeard Of Impossible Difficult Difficult Easy Easy
All 30.7% 36.3% 10.7% 7.2% 3.7% 11.4%Grades 7-8 41.0% 45.2% 8.7% 3.4% * % 1.7%Grades 9-12 25.5% 31.8% 11.8% 9.1% 5.5% 16.3%
Downers?
Never Very Somewhat Somewhat VeryHeard Of Impossible Difficult Difficult Easy Easy
All 31.4% 36.5% 9.4% 7.9% 3.7% 11.0%Grades 7-8 44.3% 44.6% 6.0% 3.4% * % 1.7%Grades 9-12 24.5% 32.1% 11.2% 10.3% 5.8% 16.1%
Rohypnol?
Never Very Somewhat Somewhat VeryHeard Of Impossible Difficult Difficult Easy Easy
All 43.4% 31.5% 8.2% 5.6% 4.1% 7.1%Grades 7-8 48.1% 37.4% 2.2% 3.4% 3.4% 5.6%Grades 9-12 40.8% 28.3% 11.6% 6.8% 4.5% 8.0%
Steroids?
Never Very Somewhat Somewhat VeryHeard Of Impossible Difficult Difficult Easy Easy
All 22.1% 37.1% 11.8% 10.7% 6.9% 11.3%Grades 7-8 28.6% 50.9% 8.1% 12.4% * % * %Grades 9-12 19.0% 30.6% 13.6% 9.9% 10.2% 16.6%
Ecstasy?
Never Very Somewhat Somewhat VeryHeard Of Impossible Difficult Difficult Easy Easy
All 24.3% 38.8% 11.7% 8.0% 11.2% 6.1%Grades 7-8 30.5% 47.0% 9.6% 7.5% 3.8% 1.7%Grades 9-12 21.0% 34.4% 12.8% 8.2% 15.2% 8.4%
Heroin?
Never Very Somewhat Somewhat VeryHeard Of Impossible Difficult Difficult Easy Easy
All 24.0% 41.7% 15.8% 7.5% 7.1% 3.8%Grades 7-8 26.0% 52.0% 12.6% 7.7% 1.6% * %
Grades 9-12 22.8% 36.3% 17.6% 7.3% 10.1% 5.9%
8/14/2019 PARKER COUNTY - Poolville ISD - 2005 Texas School Survey of Drug and Alcohol Use
http://slidepdf.com/reader/full/parker-county-poolville-isd-2005-texas-school-survey-of-drug-and-alcohol 19/89
PoolvilleSpring 2005
________________________________________________________________________________
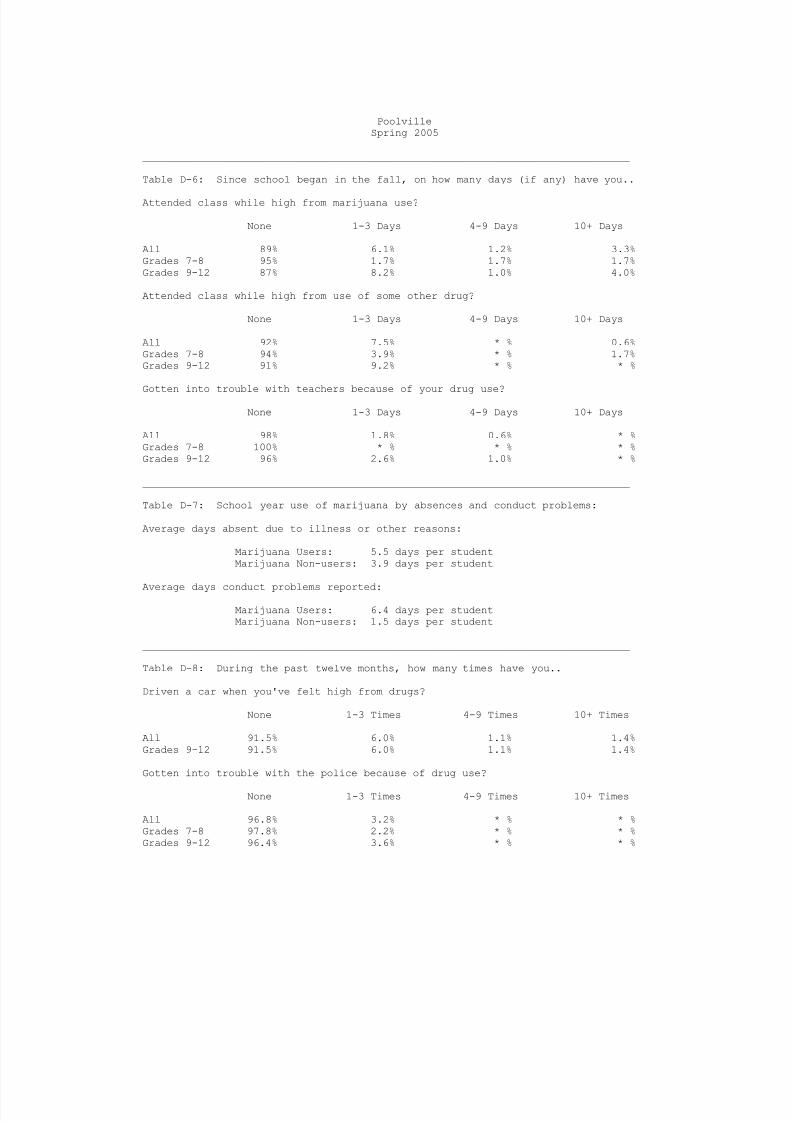
Table D-6: Since school began in the fall, on how many days (if any) have you..
Attended class while high from marijuana use?
None 1-3 Days 4-9 Days 10+ Days
All 89% 6.1% 1.2% 3.3%Grades 7-8 95% 1.7% 1.7% 1.7%Grades 9-12 87% 8.2% 1.0% 4.0%
Attended class while high from use of some other drug?
None 1-3 Days 4-9 Days 10+ Days
All 92% 7.5% * % 0.6%Grades 7-8 94% 3.9% * % 1.7%Grades 9-12 91% 9.2% * % * %
Gotten into trouble with teachers because of your drug use?
None 1-3 Days 4-9 Days 10+ Days
All 98% 1.8% 0.6% * %Grades 7-8 100% * % * % * %Grades 9-12 96% 2.6% 1.0% * %
________________________________________________________________________________
Table D-7: School year use of marijuana by absences and conduct problems:
Average days absent due to illness or other reasons:
Marijuana Users: 5.5 days per studentMarijuana Non-users: 3.9 days per student
Average days conduct problems reported:
Marijuana Users: 6.4 days per studentMarijuana Non-users: 1.5 days per student
________________________________________________________________________________
Table D-8: During the past twelve months, how many times have you..
Driven a car when you've felt high from drugs?
None 1-3 Times 4-9 Times 10+ Times
All 91.5% 6.0% 1.1% 1.4%Grades 9-12 91.5% 6.0% 1.1% 1.4%
Gotten into trouble with the police because of drug use?
None 1-3 Times 4-9 Times 10+ Times
All 96.8% 3.2% * % * %Grades 7-8 97.8% 2.2% * % * %Grades 9-12 96.4% 3.6% * % * %

8/14/2019 PARKER COUNTY - Poolville ISD - 2005 Texas School Survey of Drug and Alcohol Use
http://slidepdf.com/reader/full/parker-county-poolville-isd-2005-texas-school-survey-of-drug-and-alcohol 20/89
PoolvilleSpring 2005
________________________________________________________________________________
Table D-9: About how many of your close friends use marijuana?
Never heardNone A Few Some Most All
All 50.6% 22.2 % 13.3% 10.4% 3.5%Grades 7-8 63.0% 14.6 % 7.1% 13.7% 1.7%Grades 9-12 44.2% 26.1 % 16.6% 8.7% 4.5%
________________________________________________________________________________
Table D-10: During the past twelve months, how many times have you..
Had difficulties of any kind with your friends because of your drug use?
None 1-3 Times 4-9 Times 10+ Times
All 93.9% 6.1% * % * %
Grades 7-8 90.9% 9.1% * % * %Grades 9-12 95.4% 4.6% * % * %
Been criticized by someone you were dating because of drug use?
None 1-3 Times 4-9 Times 10+ Times
All 96.2% 3.0% * % 0.8%Grades 7-8 97.7% * % * % 2.3%Grades 9-12 95.4% 4.6% * % * %
________________________________________________________________________________
Table D-11: Thinking of parties you attended this school year, how often wasmarijuana used?*
Half Most Of Don't Didn't
Never Seldom the Time the Time Always Know Attend
All 57% 15.5% 6.9% 6.4% 6.2% 2.9% 5.5%Grades 7-8 65% 12.2% 2.1% 3.2% 4.9% 5.3% 7.4%Grades 9-12 52% 17.1% 9.3% 7.9% 6.9% 1.7% 4.6%
________________________________________________________________________________
Table D-12: How often, if ever, do you smoke marijuana in..
Joints?
Half the Most of Don'tNever Seldom Time the Time Always Know
All 75.5% 9.6% 4.7% 6.6% 1.6% 2.0%Grades 7-8 81.2% 8.4% * % 7.2% 3.2% * %
Grades 9-1 72.5% 10.3% 7.1% 6.4% 0.8% 3.0%

8/14/2019 PARKER COUNTY - Poolville ISD - 2005 Texas School Survey of Drug and Alcohol Use
http://slidepdf.com/reader/full/parker-county-poolville-isd-2005-texas-school-survey-of-drug-and-alcohol 21/89
PoolvilleSpring 2005
________________________________________________________________________________
Blunts?
Half the Most of Don'tNever Seldom Time the Time Always Know
All 83.5% 5.6% 4.9% 2.6% 2.3% 1.1%Grades 7-8 85.9% 5.0% 3.8% 2.1% 3.3% * %Grades 9-1 82.4% 5.9% 5.4% 2.8% 1.7% 1.7%
Bongs or water pipes?
Half the Most of Don'tNever Seldom Time the Time Always Know
All 81.9% 3.3% 5.6% 2.6% 4.9% 1.7%Grades 7-8 88.0% 1.7% 3.3% 2.1% 3.3% 1.7%Grades 9-1 78.7% 4.1% 6.8% 2.9% 5.7% 1.7%
Pipes?
Half the Most of Don'tNever Seldom Time the Time Always Know
All 78.8% 3.4% 4.8% 4.3% 6.2% 2.4%Grades 7-8 78.9% 4.1% 5.4% 2.3% 7.6% 1.8%Grades 9-1 78.8% 3.1% 4.6% 5.2% 5.5% 2.8%
Some other way?
Half the Most of Don'tNever Seldom Time the Time Always Know
All 86.2% 3.6% 1.1% 2.0% 2.6% 4.4%Grades 7-8 92.2% 1.7% * % 4.4% 1.7% * %Grades 9-1 83.4% 4.5% 1.7% 0.9% 3.0% 6.5%
________________________________________________________________________________
Table D-13: How do your parents feel about kids your age using marijuana?
Strongly Mildly Mildly Strongly Don'tDisapprove Disapprove Neither Approve Approve Know
All 78.0% 5.8% 3.0% 0.6% 3.9% 8.8%Grades 7-8 76.2% 2.1% 3.8% * % 4.3% 13.6%Grades 9-12 78.9% 7.7% 2.5% 0.9% 3.7% 6.4%
8/14/2019 PARKER COUNTY - Poolville ISD - 2005 Texas School Survey of Drug and Alcohol Use
http://slidepdf.com/reader/full/parker-county-poolville-isd-2005-texas-school-survey-of-drug-and-alcohol 22/89
PoolvilleSpring 2005
________________________________________________________________________________
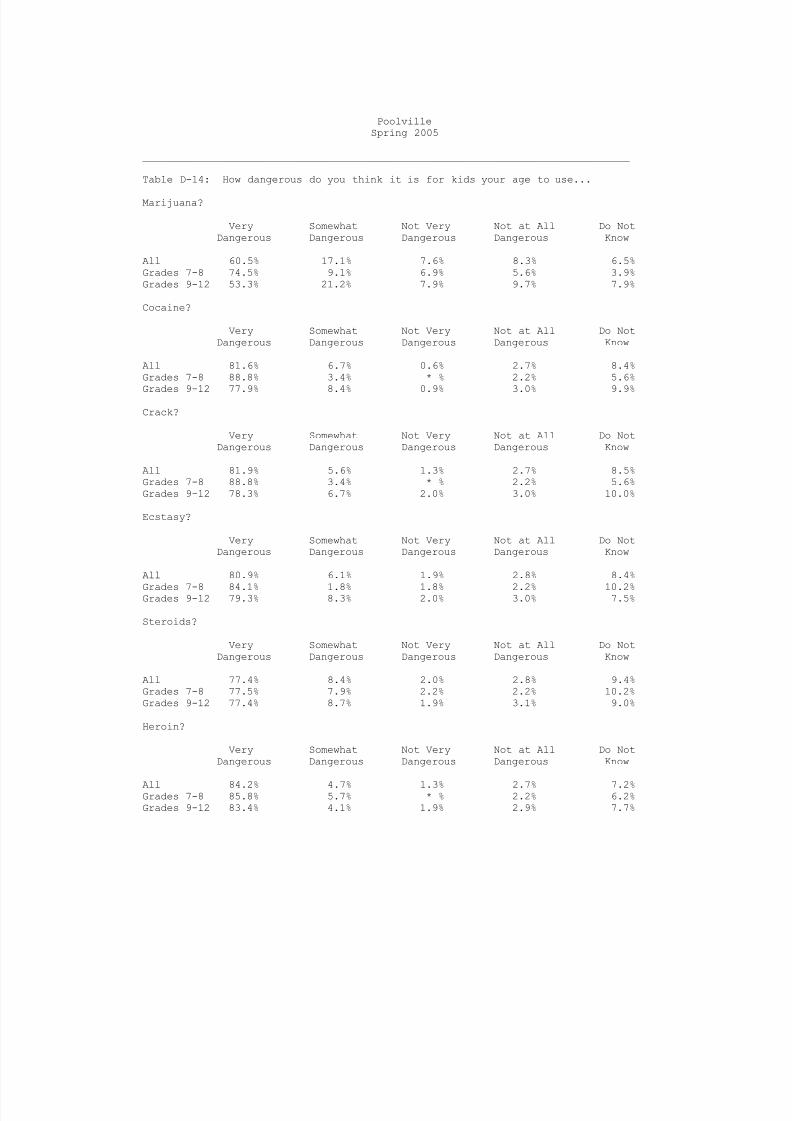
Table D-14: How dangerous do you think it is for kids your age to use...
Marijuana?
Very Somewhat Not Very Not at All Do NotDangerous Dangerous Dangerous Dangerous Know
All 60.5% 17.1% 7.6% 8.3% 6.5%Grades 7-8 74.5% 9.1% 6.9% 5.6% 3.9%Grades 9-12 53.3% 21.2% 7.9% 9.7% 7.9%
Cocaine?
Very Somewhat Not Very Not at All Do NotDangerous Dangerous Dangerous Dangerous Know
All 81.6% 6.7% 0.6% 2.7% 8.4%Grades 7-8 88.8% 3.4% * % 2.2% 5.6%
Grades 9-12 77.9% 8.4% 0.9% 3.0% 9.9%
Crack?
Very Somewhat Not Very Not at All Do NotDangerous Dangerous Dangerous Dangerous Know
All 81.9% 5.6% 1.3% 2.7% 8.5%Grades 7-8 88.8% 3.4% * % 2.2% 5.6%Grades 9-12 78.3% 6.7% 2.0% 3.0% 10.0%
Ecstasy?
Very Somewhat Not Very Not at All Do NotDangerous Dangerous Dangerous Dangerous Know
All 80.9% 6.1% 1.9% 2.8% 8.4%
Grades 7-8 84.1% 1.8% 1.8% 2.2% 10.2%Grades 9-12 79.3% 8.3% 2.0% 3.0% 7.5%
Steroids?
Very Somewhat Not Very Not at All Do NotDangerous Dangerous Dangerous Dangerous Know
All 77.4% 8.4% 2.0% 2.8% 9.4%Grades 7-8 77.5% 7.9% 2.2% 2.2% 10.2%Grades 9-12 77.4% 8.7% 1.9% 3.1% 9.0%
Heroin?
Very Somewhat Not Very Not at All Do NotDangerous Dangerous Dangerous Dangerous Know
All 84.2% 4.7% 1.3% 2.7% 7.2%Grades 7-8 85.8% 5.7% * % 2.2% 6.2%Grades 9-12 83.4% 4.1% 1.9% 2.9% 7.7%

8/14/2019 PARKER COUNTY - Poolville ISD - 2005 Texas School Survey of Drug and Alcohol Use
http://slidepdf.com/reader/full/parker-county-poolville-isd-2005-texas-school-survey-of-drug-and-alcohol 23/89

8/14/2019 PARKER COUNTY - Poolville ISD - 2005 Texas School Survey of Drug and Alcohol Use
http://slidepdf.com/reader/full/parker-county-poolville-isd-2005-texas-school-survey-of-drug-and-alcohol 24/89
PoolvilleSpring 2005
________________________________________________________________________________
Table I-1: How recently, if ever, have you used...
Past School Ever NeverMonth Year Used Used
________________________________________________________________________________Any inhalant? All 10.6% 16.3% 26.2% 73.8%
Grades 7-8 10.0% 14.7% 27.1% 72.9%Grades 9-12 10.9% 17.1% 25.7% 74.3%
________________________________________________________________________________Liquid or spray paint? All 5.7% 7.9% 9.7% 90.3%
Grades 7-8 3.7% 8.5% 8.5% 91.5%Grades 9-12 6.7% 7.6% 10.2% 89.8%
________________________________________________________________________________Whiteout, correction fld?All 3.5% 6.4% 12.3% 87.7%
Grades 7-8 1.6% 4.8% 12.6% 87.4%Grades 9-12 4.5% 7.2% 12.1% 87.9%
________________________________________________________________________________Gasoline? All 4.0% 5.8% 10.1% 89.9%
Grades 7-8 5.1% 8.5% 15.7% 84.3%Grades 9-12 3.5% 4.4% 7.3% 92.7%________________________________________________________________________________Freon? All 0.6% 0.6% 2.6% 97.4%
Grades 7-8 * % 0.6% 2.4% 97.6%Grades 9-12 0.9% 1.5% 3.5% 96.5%
________________________________________________________________________________Poppers, Locker Room? All 2.7% 3.3% 6.3% 93.7%
Grades 7-8 * % * % 1.7% 98.3%Grades 9-12 4.1% 5.0% 8.6% 91.4%
________________________________________________________________________________Glue? All 2.3% 3.5% 5.5% 94.5%
Grades 7-8 2.1% 3.8% 3.8% 96.2%Grades 9-12 2.4% 3.3% 6.3% 93.7%
________________________________________________________________________________Paint,lacquer thinner? All 2.2% 4.0% 9.8% 90.2%
Grades 7-8 1.7% 3.4% 10.6% 89.4%
Grades 9-12 2.4% 4.4% 9.4% 90.6%________________________________________________________________________________Nitrous oxide? All 2.0% 5.0% 7.8% 92.2%
Grades 7-8 3.3% 4.9% 4.9% 95.1%Grades 9-12 1.4% 5.0% 9.3% 90.7%
________________________________________________________________________________Octane booster? All 0.9% 1.5% 2.7% 97.3%
Grades 7-8 * % * % * % 100.0%Grades 9-12 1.4% 2.2% 4.1% 95.9%
________________________________________________________________________________Other sprays? All 2.1% 5.2% 10.4% 89.6%
Grades 7-8 1.7% 5.6% 10.8% 89.2%Grades 9-12 2.3% 5.0% 10.1% 89.9%
________________________________________________________________________________Other inhalants? All 4.0% 8.1% 12.2% 87.8%
Grades 7-8 5.4% 8.7% 12.0% 88.0%Grades 9-12 3.3% 7.8% 12.4% 87.6%

8/14/2019 PARKER COUNTY - Poolville ISD - 2005 Texas School Survey of Drug and Alcohol Use
http://slidepdf.com/reader/full/parker-county-poolville-isd-2005-texas-school-survey-of-drug-and-alcohol 25/89
PoolvilleSpring 2005
________________________________________________________________________________
Table I-2: How often do you normally use inhalants?
Several Several About About Less ThanNever Every Times Times Once a Once a Once aUsed Day a Week a Month Month Year Year
All 88.2% 1.3% 0.6% 1.4% 0.6% 0.6% 7.4%Grades 7-8 84.3% 1.6% 1.6% 2.1% 1.6% 1.6% 7.0%Grades 9-12 90.3% 1.0% * % 1.0% * % * % 7.6%
________________________________________________________________________________
Table I-3: Number of different kinds of inhalants used:
0 1 2-3 4+
All 75.4% 10.8% 6.1% 7.7%Grades 7-8 72.9% 14.0% 4.8% 8.4%
Grades 9-12 76.7% 9.2% 6.8% 7.4%
________________________________________________________________________________
Table I-4: Average age of first use of:
Grades 7-8 Grades 9-12
Inhalants 11.7 11.3
________________________________________________________________________________
Table I-5: Since school began in the fall, on how many days (if any) have youattended class while high from inhalant use?
None 1-3 Days 4-9 Days 10+ Days
All 95% 3.5% * % 1.8%Grades 7-8 93% 5.4% * % 1.6%Grades 9-12 96% 2.6% * % 1.9%
________________________________________________________________________________
Table I-6: School year use of inhalants by absences and conduct problems:
Average days absent due to illness or other reasons:
Inhalants Users: 5.5 days per studentInhalants Non-users: 4.0 days per student
Average days conduct problems reported:
Inhalants Users: 8.3 days per studentInhalants Non-users: 1.4 days per student

8/14/2019 PARKER COUNTY - Poolville ISD - 2005 Texas School Survey of Drug and Alcohol Use
http://slidepdf.com/reader/full/parker-county-poolville-isd-2005-texas-school-survey-of-drug-and-alcohol 26/89
PoolvilleSpring 2005
________________________________________________________________________________
Table I-7: About how many of your close friends use inhalants?
Never heardNone A Few Some Most All
All 74.5% 16.5 % 5.1% 3.4% 0.6%Grades 7-8 66.3% 21.5 % 5.3% 6.9% * %Grades 9-12 78.9% 13.8 % 5.0% 1.4% 0.9%
________________________________________________________________________________
Table I-8: How dangerous do you think it is for kids your age to use inhalants?
Very Somewhat Not Very Not at All Do NotDangerous Dangerous Dangerous Dangerous Know
All 74.9% 12.9% 2.6% 2.7% 6.9%Grades 7-8 77.1% 9.3% 3.8% 2.1% 7.6%
Grades 9-12 73.8% 14.8% 2.0% 3.0% 6.5%

8/14/2019 PARKER COUNTY - Poolville ISD - 2005 Texas School Survey of Drug and Alcohol Use
http://slidepdf.com/reader/full/parker-county-poolville-isd-2005-texas-school-survey-of-drug-and-alcohol 27/89

8/14/2019 PARKER COUNTY - Poolville ISD - 2005 Texas School Survey of Drug and Alcohol Use
http://slidepdf.com/reader/full/parker-county-poolville-isd-2005-texas-school-survey-of-drug-and-alcohol 28/89
PoolvilleSpring 2005
________________________________________________________________________________
Table X-1: Since school began in the fall, have you gotten any information
on drugs or alcohol from the following sources?
Health class
No Yes
All 45.5% 54.5%Grades 7-8 43.2% 56.8%Grades 9-12 46.6% 53.4%
An assembly program
No Yes
All 45.8% 54.2%Grades 7-8 32.2% 67.8%Grades 9-12 51.9% 48.1%
Guidance counselor
No Yes
All 52.5% 47.5%Grades 7-8 32.1% 67.9%Grades 9-12 62.6% 37.4%
Science class
No Yes
All 64.9% 35.1%Grades 7-8 39.4% 60.6%Grades 9-12 77.3% 22.7%
Social studies class
No Yes
All 86.9% 13.1%Grades 7-8 92.8% 7.2%Grades 9-12 84.0% 16.0%
Student group session
No Yes
All 79.7% 20.3%Grades 7-8 71.7% 28.3%Grades 9-12 83.4% 16.6%
An invited school guest
No Yes
All 52.2% 47.8%Grades 7-8 40.8% 59.2%Grades 9-12 57.7% 42.3%

8/14/2019 PARKER COUNTY - Poolville ISD - 2005 Texas School Survey of Drug and Alcohol Use
http://slidepdf.com/reader/full/parker-county-poolville-isd-2005-texas-school-survey-of-drug-and-alcohol 29/89
PoolvilleSpring 2005
________________________________________________________________________________
Some other school source
No Yes
All 62.8% 37.2%Grades 7-8 61.9% 38.1%Grades 9-12 63.3% 36.7%
Any school source
No Yes
All 41.2% 58.8%Grades 7-8 31.2% 68.8%Grades 9-12 46.1% 53.9%
________________________________________________________________________________
Table X-2: If you had a drug or alcohol problem and needed help, who would yougo to?
A counselor or program in school
No Yes
All 58.7% 41.3%Grades 7-8 59.6% 40.4%Grades 9-12 58.3% 41.7%
Another adult in school (such as a nurse or teacher)
No Yes
All 66.1% 33.9%Grades 7-8 70.3% 29.7%
Grades 9-12 64.1% 35.9%
A counselor or program outside of school
No Yes
All 61.7% 38.3%Grades 7-8 66.8% 33.2%Grades 9-12 59.1% 40.9%
Your parents
No Yes
All 49.0% 51.0%Grades 7-8 53.2% 46.8%Grades 9-12 46.9% 53.1%

8/14/2019 PARKER COUNTY - Poolville ISD - 2005 Texas School Survey of Drug and Alcohol Use
http://slidepdf.com/reader/full/parker-county-poolville-isd-2005-texas-school-survey-of-drug-and-alcohol 30/89
PoolvilleSpring 2005
________________________________________________________________________________
A medical doctor
No Yes
All 55.3% 44.7%Grades 7-8 60.8% 39.2%Grades 9-12 52.4% 47.6%
Your friends
No Yes
All 34.4% 65.6%Grades 7-8 34.4% 65.6%Grades 9-12 34.3% 65.7%
Another adult (a relative, clergyman, or other family friend)
No Yes
All 48.7% 51.3%Grades 7-8 50.9% 49.1%Grades 9-12 47.6% 52.4%
________________________________________________________________________________
Table X-3: Since school began in the fall, have you sought help, other thanfrom family or friends, for problems in any way connected with your use ofalcohol, marijuana, or other drugs?
No Yes
All 93.2% 6.8%Grades 7-8 88.2% 11.8%Grades 9-12 95.7% 4.3%
________________________________________________________________________________
Table X-4: About how many of your friends:
Feel close to their parents?
None A Few Some Most All
All 8.6% 37.3% 28.7% 20.7% 4.7%Grades 7-8 11.5% 36.3% 13.8% 32.6% 5.7%Grades 9-12 7.2% 37.8% 36.0% 14.8% 4.2%
Sometimes carry weapons?
None A Few Some Most All
All 35.6% 23.2% 14.9% 13.7% 12.5%Grades 7-8 50.3% 29.0% 11.4% 7.8% 1.6%Grades 9-12 28.2% 20.3% 16.7% 16.7% 18.0%

8/14/2019 PARKER COUNTY - Poolville ISD - 2005 Texas School Survey of Drug and Alcohol Use
http://slidepdf.com/reader/full/parker-county-poolville-isd-2005-texas-school-survey-of-drug-and-alcohol 31/89
PoolvilleSpring 2005
________________________________________________________________________________
Care about making good grades?
None A Few Some Most All
All 4.5% 29.0% 31.5% 25.3% 9.7%Grades 7-8 4.4% 25.6% 31.3% 28.6% 10.2%Grades 9-12 4.6% 30.7% 31.6% 23.7% 9.5%
Belong/want to belong to a gang?
None A Few Some Most All
All 66.3% 16.1% 8.6% 4.0% 5.0%Grades 7-8 63.1% 18.2% 13.3% 1.6% 3.7%Grades 9-12 67.9% 15.1% 6.2% 5.2% 5.6%
Wish they could drop out of school?
None A Few Some Most All
All 42.8% 38.0% 9.1% 6.9% 3.1%Grades 7-8 32.2% 44.5% 14.3% 9.0% * %Grades 9-12 48.1% 34.7% 6.6% 5.9% 4.7%
8/14/2019 PARKER COUNTY - Poolville ISD - 2005 Texas School Survey of Drug and Alcohol Use
http://slidepdf.com/reader/full/parker-county-poolville-isd-2005-texas-school-survey-of-drug-and-alcohol 32/89
PoolvilleSpring 2005
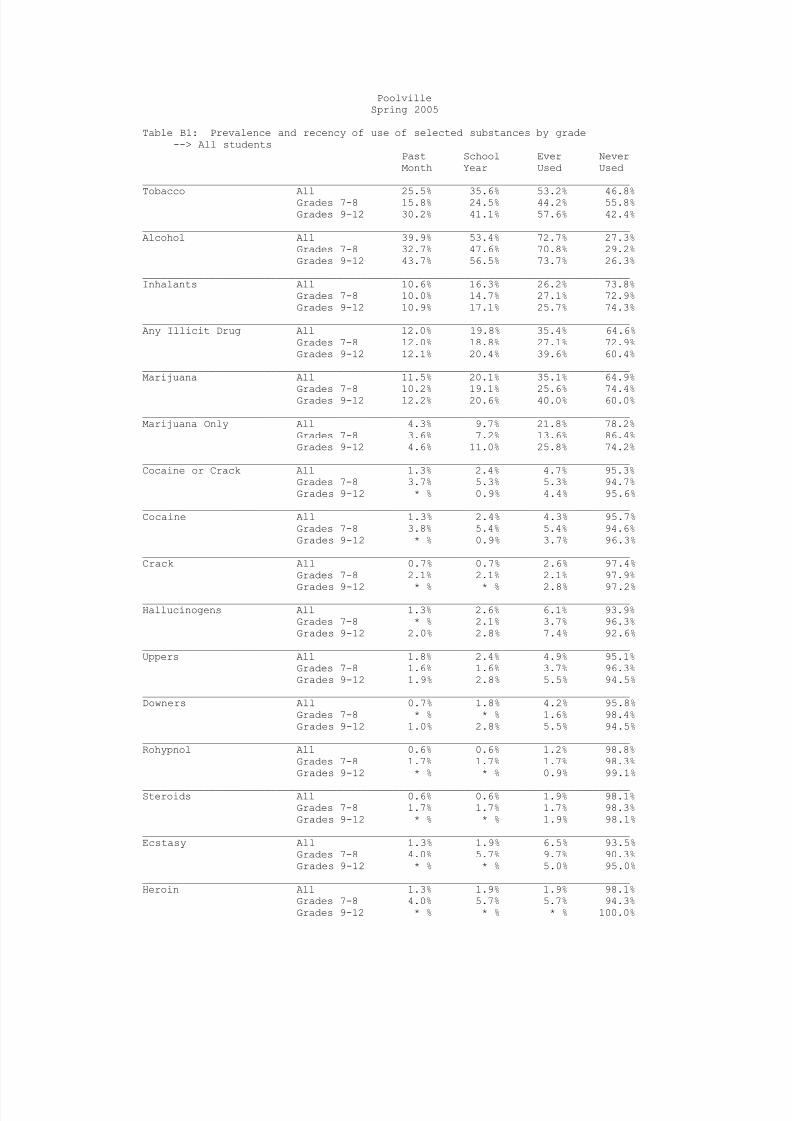
Table B1: Prevalence and recency of use of selected substances by grade--> All students
Past School Ever NeverMonth Year Used Used
________________________________________________________________________________
Tobacco All 25.5% 35.6% 53.2% 46.8%Grades 7-8 15.8% 24.5% 44.2% 55.8%Grades 9-12 30.2% 41.1% 57.6% 42.4%
________________________________________________________________________________Alcohol All 39.9% 53.4% 72.7% 27.3%
Grades 7-8 32.7% 47.6% 70.8% 29.2%Grades 9-12 43.7% 56.5% 73.7% 26.3%
________________________________________________________________________________Inhalants All 10.6% 16.3% 26.2% 73.8%
Grades 7-8 10.0% 14.7% 27.1% 72.9%Grades 9-12 10.9% 17.1% 25.7% 74.3%
________________________________________________________________________________Any Illicit Drug All 12.0% 19.8% 35.4% 64.6%
Grades 7-8 12.0% 18.8% 27.1% 72.9%Grades 9-12 12.1% 20.4% 39.6% 60.4%
________________________________________________________________________________Marijuana All 11.5% 20.1% 35.1% 64.9%
Grades 7-8 10.2% 19.1% 25.6% 74.4%Grades 9-12 12.2% 20.6% 40.0% 60.0%________________________________________________________________________________Marijuana Only All 4.3% 9.7% 21.8% 78.2%
Grades 7-8 3.6% 7.2% 13.6% 86.4%Grades 9-12 4.6% 11.0% 25.8% 74.2%
________________________________________________________________________________Cocaine or Crack All 1.3% 2.4% 4.7% 95.3%
Grades 7-8 3.7% 5.3% 5.3% 94.7%Grades 9-12 * % 0.9% 4.4% 95.6%
________________________________________________________________________________Cocaine All 1.3% 2.4% 4.3% 95.7%
Grades 7-8 3.8% 5.4% 5.4% 94.6%Grades 9-12 * % 0.9% 3.7% 96.3%
________________________________________________________________________________Crack All 0.7% 0.7% 2.6% 97.4%
Grades 7-8 2.1% 2.1% 2.1% 97.9%
Grades 9-12 * % * % 2.8% 97.2%________________________________________________________________________________Hallucinogens All 1.3% 2.6% 6.1% 93.9%
Grades 7-8 * % 2.1% 3.7% 96.3%Grades 9-12 2.0% 2.8% 7.4% 92.6%
________________________________________________________________________________Uppers All 1.8% 2.4% 4.9% 95.1%
Grades 7-8 1.6% 1.6% 3.7% 96.3%Grades 9-12 1.9% 2.8% 5.5% 94.5%
________________________________________________________________________________Downers All 0.7% 1.8% 4.2% 95.8%
Grades 7-8 * % * % 1.6% 98.4%Grades 9-12 1.0% 2.8% 5.5% 94.5%
________________________________________________________________________________Rohypnol All 0.6% 0.6% 1.2% 98.8%
Grades 7-8 1.7% 1.7% 1.7% 98.3%Grades 9-12 * % * % 0.9% 99.1%
________________________________________________________________________________Steroids All 0.6% 0.6% 1.9% 98.1%
Grades 7-8 1.7% 1.7% 1.7% 98.3%Grades 9-12 * % * % 1.9% 98.1%
________________________________________________________________________________Ecstasy All 1.3% 1.9% 6.5% 93.5%
Grades 7-8 4.0% 5.7% 9.7% 90.3%Grades 9-12 * % * % 5.0% 95.0%
________________________________________________________________________________Heroin All 1.3% 1.9% 1.9% 98.1%
Grades 7-8 4.0% 5.7% 5.7% 94.3%Grades 9-12 * % * % * % 100.0%

8/14/2019 PARKER COUNTY - Poolville ISD - 2005 Texas School Survey of Drug and Alcohol Use
http://slidepdf.com/reader/full/parker-county-poolville-isd-2005-texas-school-survey-of-drug-and-alcohol 33/89
PoolvilleSpring 2005
Table B2: Prevalence and recency of use of selected substances by grade--> Male students
Past School Ever NeverMonth Year Used Used
________________________________________________________________________________
Tobacco All 37.0% 43.3% 57.4% 42.6%Grades 7-8 25.3% 33.0% 53.4% 46.6%Grades 9-12 42.0% 47.8% 59.1% 40.9%
________________________________________________________________________________Alcohol All 43.2% 55.8% 69.2% 30.8%
Grades 7-8 31.6% 43.0% 61.7% 38.3%Grades 9-12 48.6% 61.7% 72.6% 27.4%
________________________________________________________________________________Inhalants All 13.0% 18.4% 28.0% 72.0%
Grades 7-8 13.8% 20.2% 27.5% 72.5%Grades 9-12 12.7% 17.6% 28.3% 71.7%
________________________________________________________________________________Any Illicit Drug All 15.0% 20.7% 35.9% 64.1%
Grades 7-8 17.9% 21.9% 29.2% 70.8%Grades 9-12 13.7% 20.1% 38.9% 61.1%
________________________________________________________________________________Marijuana All 13.9% 20.9% 35.1% 64.9%
Grades 7-8 13.8% 21.9% 25.2% 74.8%Grades 9-12 14.0% 20.5% 39.6% 60.4%________________________________________________________________________________Marijuana Only All 6.0% 9.6% 21.2% 78.8%
Grades 7-8 4.1% 8.2% 11.4% 88.6%Grades 9-12 6.8% 10.2% 25.6% 74.4%
________________________________________________________________________________Cocaine or Crack All 2.4% 3.4% 5.7% 94.3%
Grades 7-8 7.3% 7.3% 7.3% 92.7%Grades 9-12 * % 1.6% 5.0% 95.0%
________________________________________________________________________________Cocaine All 2.5% 3.6% 5.9% 94.1%
Grades 7-8 7.6% 7.6% 7.6% 92.4%Grades 9-12 * % 1.6% 5.1% 94.9%
________________________________________________________________________________Crack All 1.4% 1.4% 2.7% 97.3%
Grades 7-8 4.2% 4.2% 4.2% 95.8%
Grades 9-12 * % * % 1.9% 98.1%________________________________________________________________________________Hallucinogens All 1.2% 2.6% 7.1% 92.9%
Grades 7-8 * % 4.3% 4.3% 95.7%Grades 9-12 1.8% 1.8% 8.4% 91.6%
________________________________________________________________________________Uppers All 1.3% 2.4% 7.3% 92.7%
Grades 7-8 * % * % 4.3% 95.7%Grades 9-12 1.9% 3.5% 8.7% 91.3%
________________________________________________________________________________Downers All 1.3% 2.4% 6.9% 93.1%
Grades 7-8 * % * % 3.3% 96.7%Grades 9-12 1.9% 3.5% 8.7% 91.3%
________________________________________________________________________________Rohypnol All 1.1% 1.1% 2.3% 97.7%
Grades 7-8 3.5% 3.5% 3.5% 96.5%Grades 9-12 * % * % 1.7% 98.3%
________________________________________________________________________________Steroids All 1.2% 1.2% 3.7% 96.3%
Grades 7-8 3.6% 3.6% 3.6% 96.4%Grades 9-12 * % * % 3.7% 96.3%
________________________________________________________________________________Ecstasy All 2.5% 2.5% 8.6% 91.4%
Grades 7-8 8.3% 8.3% 12.9% 87.1%Grades 9-12 * % * % 6.7% 93.3%
________________________________________________________________________________Heroin All 2.5% 2.5% 2.5% 97.5%
Grades 7-8 8.3% 8.3% 8.3% 91.7%Grades 9-12 * % * % * % 100.0%

8/14/2019 PARKER COUNTY - Poolville ISD - 2005 Texas School Survey of Drug and Alcohol Use
http://slidepdf.com/reader/full/parker-county-poolville-isd-2005-texas-school-survey-of-drug-and-alcohol 34/89
PoolvilleSpring 2005
Table B3: Prevalence and recency of use of selected substances by grade--> Female students
Past School Ever NeverMonth Year Used Used
________________________________________________________________________________
Tobacco All 12.1% 26.7% 48.4% 51.6%Grades 7-8 6.5% 16.3% 35.2% 64.8%Grades 9-12 15.3% 32.6% 55.8% 44.2%
________________________________________________________________________________Alcohol All 36.1% 50.7% 76.7% 23.3%
Grades 7-8 33.8% 52.0% 79.5% 20.5%Grades 9-12 37.5% 50.0% 75.0% 25.0%
________________________________________________________________________________Inhalants All 7.7% 13.8% 24.0% 76.0%
Grades 7-8 6.3% 9.4% 26.7% 73.3%Grades 9-12 8.6% 16.5% 22.4% 77.6%
________________________________________________________________________________Any Illicit Drug All 8.6% 18.9% 34.7% 65.3%
Grades 7-8 6.3% 15.7% 25.1% 74.9%Grades 9-12 10.0% 20.8% 40.4% 59.6%
________________________________________________________________________________Marijuana All 8.8% 19.2% 35.2% 64.8%
Grades 7-8 6.5% 16.3% 26.1% 73.9%Grades 9-12 10.0% 20.8% 40.4% 59.6%________________________________________________________________________________Marijuana Only All 2.3% 10.0% 22.4% 77.6%
Grades 7-8 3.1% 6.3% 15.7% 84.3%Grades 9-12 1.8% 12.0% 26.2% 73.8%
________________________________________________________________________________Cocaine or Crack All * % 1.2% 3.6% 96.4%
Grades 7-8 * % 3.3% 3.3% 96.7%Grades 9-12 * % * % 3.7% 96.3%
________________________________________________________________________________Cocaine All * % 1.2% 2.4% 97.6%
Grades 7-8 * % 3.3% 3.3% 96.7%Grades 9-12 * % * % 1.9% 98.1%
________________________________________________________________________________Crack All * % * % 2.4% 97.6%
Grades 7-8 * % * % * % 100.0%
Grades 9-12 * % * % 3.7% 96.3%________________________________________________________________________________Hallucinogens All 1.4% 2.6% 5.1% 94.9%
Grades 7-8 * % * % 3.1% 96.9%Grades 9-12 2.2% 4.1% 6.2% 93.8%
________________________________________________________________________________Uppers All 2.3% 2.3% 2.3% 97.7%
Grades 7-8 3.1% 3.1% 3.1% 96.9%Grades 9-12 1.9% 1.9% 1.9% 98.1%
________________________________________________________________________________Downers All * % 1.2% 1.2% 98.8%
Grades 7-8 * % * % * % 100.0%Grades 9-12 * % 1.9% 1.9% 98.1%
________________________________________________________________________________Rohypnol All * % * % * % 100.0%
Grades 7-8 * % * % * % 100.0%Grades 9-12 * % * % * % 100.0%
________________________________________________________________________________Steroids All * % * % * % 100.0%
Grades 7-8 * % * % * % 100.0%Grades 9-12 * % * % * % 100.0%
________________________________________________________________________________Ecstasy All * % 1.2% 4.3% 95.7%
Grades 7-8 * % 3.4% 6.7% 93.3%Grades 9-12 * % * % 2.9% 97.1%
________________________________________________________________________________Heroin All * % 1.2% 1.2% 98.8%
Grades 7-8 * % 3.4% 3.4% 96.6%Grades 9-12 * % * % * % 100.0%
8/14/2019 PARKER COUNTY - Poolville ISD - 2005 Texas School Survey of Drug and Alcohol Use
http://slidepdf.com/reader/full/parker-county-poolville-isd-2005-texas-school-survey-of-drug-and-alcohol 35/89

8/14/2019 PARKER COUNTY - Poolville ISD - 2005 Texas School Survey of Drug and Alcohol Use
http://slidepdf.com/reader/full/parker-county-poolville-isd-2005-texas-school-survey-of-drug-and-alcohol 36/89
PoolvilleSpring 2005
Table B5: Prevalence and recency of use of selected substances by grade--> Black students
Past School Ever NeverMonth Year Used Used
________________________________________________________________________________
Tobacco All * % * % * % 100.0%Grades 9-12 * % * % * % 100.0%________________________________________________________________________________Alcohol All * % * % * % 100.0%
Grades 9-12 * % * % * % 100.0%________________________________________________________________________________Inhalants All * % * % * % 100.0%
Grades 9-12 * % * % * % 100.0%________________________________________________________________________________Any Illicit Drug All * % * % * % 100.0%
Grades 9-12 * % * % * % 100.0%________________________________________________________________________________Marijuana * * % * % * % 100.0%________________________________________________________________________________Marijuana Only All * % * % * % 100.0%
Grades 9-12 * % * % * % 100.0%________________________________________________________________________________
Cocaine or Crack * * % * % * % 100.0%________________________________________________________________________________Cocaine * * % * % * % 100.0%________________________________________________________________________________Crack * * % * % * % 100.0%________________________________________________________________________________Hallucinogens All * % * % * % 100.0%
Grades 9-12 * % * % * % 100.0%________________________________________________________________________________Uppers * * % * % * % 100.0%________________________________________________________________________________Downers * * % * % * % 100.0%________________________________________________________________________________Rohypnol All * % * % * % 100.0%
Grades 9-12 * % * % * % 100.0%________________________________________________________________________________Steroids * * % * % * % 100.0%
________________________________________________________________________________Ecstasy All * % * % * % 100.0%
Grades 9-12 * % * % * % 100.0%________________________________________________________________________________Heroin All * % * % * % 100.0%
Grades 9-12 * % * % * % 100.0%

8/14/2019 PARKER COUNTY - Poolville ISD - 2005 Texas School Survey of Drug and Alcohol Use
http://slidepdf.com/reader/full/parker-county-poolville-isd-2005-texas-school-survey-of-drug-and-alcohol 37/89
PoolvilleSpring 2005
Table B6: Prevalence and recency of use of selected substances by grade--> Mexican/American students
Past School Ever NeverMonth Year Used Used
________________________________________________________________________________
Tobacco All 21.2% 29.9% 46.6% 53.4%Grades 7-8 * % * % * % 100.0%Grades 9-12 13.6% 27.2% 44.7% 55.3%
________________________________________________________________________________Alcohol All 55.6% 70.8% 76.3% 23.7%
Grades 7-8 * % * % * % 100.0%Grades 9-12 58.7% 82.4% 82.4% 17.6%
________________________________________________________________________________Inhalants All 6.9% 6.9% 21.2% 78.8%
Grades 7-8 * % * % * % 100.0%Grades 9-12 * % * % 13.6% 86.4%
________________________________________________________________________________Any Illicit Drug All 6.9% 26.8% 46.5% 53.5%
Grades 7-8 * % * % * % 100.0%Grades 9-12 * % 22.4% 36.0% 64.0%
________________________________________________________________________________Marijuana All * % 26.8% 46.5% 53.5%
Grades 7-8 * % * % * % 100.0%Grades 9-12 * % 22.4% 36.0% 64.0%________________________________________________________________________________Marijuana Only All * % 19.9% 30.8% 69.2%
Grades 7-8 * % * % * % 100.0%Grades 9-12 * % 22.4% 22.4% 77.6%
________________________________________________________________________________Cocaine or Crack All 6.9% 6.9% 6.9% 93.1%
Grades 7-8 * % * % * % 100.0%Grades 9-12 * % * % * % 100.0%
________________________________________________________________________________Cocaine All 6.9% 6.9% 6.9% 93.1%
Grades 7-8 * % * % * % 100.0%Grades 9-12 * % * % * % 100.0%
________________________________________________________________________________Crack All 6.9% 6.9% 6.9% 93.1%
Grades 7-8 * % * % * % 100.0%
Grades 9-12 * % * % * % 100.0%________________________________________________________________________________Hallucinogens All * % 6.9% 6.9% 93.1%
Grades 7-8 * % * % * % 100.0%Grades 9-12 * % * % * % 100.0%
________________________________________________________________________________Uppers All * % * % 6.9% 93.1%
Grades 7-8 * % * % * % 100.0%Grades 9-12 * % * % * % 100.0%
________________________________________________________________________________Downers All * % * % * % 100.0%
Grades 7-8 * % * % * % 100.0%Grades 9-12 * % * % * % 100.0%
________________________________________________________________________________Rohypnol All * % * % * % 100.0%
Grades 7-8 * % * % * % 100.0%Grades 9-12 * % * % * % 100.0%
________________________________________________________________________________Steroids All * % * % * % 100.0%
Grades 7-8 * % * % * % 100.0%Grades 9-12 * % * % * % 100.0%
________________________________________________________________________________Ecstasy All 6.9% 6.9% 15.7% 84.3%
Grades 7-8 * % * % * % 100.0%Grades 9-12 * % * % 13.6% 86.4%
________________________________________________________________________________Heroin All 6.9% 6.9% 6.9% 93.1%
Grades 7-8 * % * % * % 100.0%Grades 9-12 * % * % * % 100.0%

8/14/2019 PARKER COUNTY - Poolville ISD - 2005 Texas School Survey of Drug and Alcohol Use
http://slidepdf.com/reader/full/parker-county-poolville-isd-2005-texas-school-survey-of-drug-and-alcohol 38/89
PoolvilleSpring 2005
Table B7: Prevalence and recency of use of selected substances by grade--> Students reporting A and B grades
Past School Ever NeverMonth Year Used Used
________________________________________________________________________________
Tobacco All 24.5% 34.6% 51.0% 49.0%Grades 7-8 13.9% 19.2% 40.4% 59.6%Grades 9-12 28.5% 40.3% 55.0% 45.0%
________________________________________________________________________________Alcohol All 39.9% 55.2% 74.7% 25.3%
Grades 7-8 30.1% 50.7% 75.0% 25.0%Grades 9-12 43.7% 57.0% 74.6% 25.4%
________________________________________________________________________________Inhalants All 7.3% 13.4% 21.9% 78.1%
Grades 7-8 7.7% 10.2% 23.6% 76.4%Grades 9-12 7.2% 14.6% 21.3% 78.7%
________________________________________________________________________________Any Illicit Drug All 8.9% 16.6% 31.7% 68.3%
Grades 7-8 2.6% 10.2% 23.6% 76.4%Grades 9-12 11.3% 19.1% 34.8% 65.2%
________________________________________________________________________________Marijuana All 9.0% 16.8% 31.1% 68.9%
Grades 7-8 2.6% 10.2% 20.4% 79.6%Grades 9-12 11.4% 19.3% 35.2% 64.8%________________________________________________________________________________Marijuana Only All 4.0% 8.9% 21.0% 79.0%
Grades 7-8 2.6% 5.1% 15.3% 84.7%Grades 9-12 4.6% 10.3% 23.1% 76.9%
________________________________________________________________________________Cocaine or Crack All * % 0.7% 3.1% 96.9%
Grades 7-8 * % 2.6% 2.6% 97.4%Grades 9-12 * % * % 3.3% 96.7%
________________________________________________________________________________Cocaine All * % 0.7% 2.4% 97.6%
Grades 7-8 * % 2.6% 2.6% 97.4%Grades 9-12 * % * % 2.3% 97.7%
________________________________________________________________________________Crack All * % * % 2.4% 97.6%
Grades 7-8 * % * % * % 100.0%
Grades 9-12 * % * % 3.3% 96.7%________________________________________________________________________________Hallucinogens All 0.9% 1.6% 4.0% 96.0%
Grades 7-8 * % * % 2.6% 97.4%Grades 9-12 1.2% 2.2% 4.5% 95.5%
________________________________________________________________________________Uppers All 1.6% 2.4% 3.2% 96.8%
Grades 7-8 * % * % * % 100.0%Grades 9-12 2.3% 3.3% 4.5% 95.5%
________________________________________________________________________________Downers All 0.9% 2.4% 3.2% 96.8%
Grades 7-8 * % * % * % 100.0%Grades 9-12 1.2% 3.3% 4.5% 95.5%
________________________________________________________________________________Rohypnol All * % * % * % 100.0%
Grades 7-8 * % * % * % 100.0%Grades 9-12 * % * % * % 100.0%
________________________________________________________________________________Steroids All * % * % * % 100.0%
Grades 7-8 * % * % * % 100.0%Grades 9-12 * % * % * % 100.0%
________________________________________________________________________________Ecstasy All * % 0.8% 5.3% 94.7%
Grades 7-8 * % 2.8% 9.1% 90.9%Grades 9-12 * % * % 3.9% 96.1%
________________________________________________________________________________Heroin All * % 0.7% 0.7% 99.3%
Grades 7-8 * % 2.8% 2.8% 97.2%Grades 9-12 * % * % * % 100.0%

8/14/2019 PARKER COUNTY - Poolville ISD - 2005 Texas School Survey of Drug and Alcohol Use
http://slidepdf.com/reader/full/parker-county-poolville-isd-2005-texas-school-survey-of-drug-and-alcohol 39/89
PoolvilleSpring 2005
Table B8: Prevalence and recency of use of selected substances by grade--> Students reporting C, D, and F grades
Past School Ever NeverMonth Year Used Used
________________________________________________________________________________
Tobacco All 25.7% 36.6% 58.7% 41.3%Grades 7-8 19.0% 33.5% 50.4% 49.6%Grades 9-12 33.9% 40.2% 68.6% 31.4%
________________________________________________________________________________Alcohol All 42.9% 51.0% 70.8% 29.2%
Grades 7-8 39.2% 44.8% 67.4% 32.6%Grades 9-12 47.4% 58.4% 75.0% 25.0%
________________________________________________________________________________Inhalants All 22.9% 27.8% 36.8% 63.2%
Grades 7-8 14.5% 23.4% 34.7% 65.3%Grades 9-12 33.0% 33.0% 39.4% 60.6%
________________________________________________________________________________Any Illicit Drug All 23.8% 32.2% 50.5% 49.5%
Grades 7-8 29.1% 34.7% 34.7% 65.3%Grades 9-12 17.4% 29.2% 69.5% 30.5%
________________________________________________________________________________Marijuana All 20.7% 32.2% 50.5% 49.5%
Grades 7-8 23.4% 34.7% 34.7% 65.3%Grades 9-12 17.4% 29.2% 69.5% 30.5%________________________________________________________________________________Marijuana Only All 5.6% 14.0% 27.3% 72.7%
Grades 7-8 5.6% 11.3% 11.3% 88.7%Grades 9-12 5.5% 17.4% 46.6% 53.4%
________________________________________________________________________________Cocaine or Crack All 5.5% 8.0% 10.5% 89.5%
Grades 7-8 10.1% 10.1% 10.1% 89.9%Grades 9-12 * % 5.5% 11.0% 89.0%
________________________________________________________________________________Cocaine All 5.7% 8.3% 10.8% 89.2%
Grades 7-8 10.1% 10.1% 10.1% 89.9%Grades 9-12 * % 5.9% 11.7% 88.3%
________________________________________________________________________________Crack All 3.2% 3.2% 3.2% 96.8%
Grades 7-8 5.9% 5.9% 5.9% 94.1%
Grades 9-12 * % * % * % 100.0%________________________________________________________________________________Hallucinogens All 2.9% 6.0% 13.4% 86.6%
Grades 7-8 * % 5.6% 5.6% 94.4%Grades 9-12 6.3% 6.3% 22.8% 77.2%
________________________________________________________________________________Uppers All 2.4% 2.4% 10.5% 89.5%
Grades 7-8 4.5% 4.5% 10.1% 89.9%Grades 9-12 * % * % 11.0% 89.0%
________________________________________________________________________________Downers All * % * % 7.4% 92.6%
Grades 7-8 * % * % 4.5% 95.5%Grades 9-12 * % * % 11.0% 89.0%
________________________________________________________________________________Rohypnol All 2.6% 2.6% 5.2% 94.8%
Grades 7-8 4.7% 4.7% 4.7% 95.3%Grades 9-12 * % * % 5.8% 94.2%
________________________________________________________________________________Steroids All 2.5% 2.5% 8.0% 92.0%
Grades 7-8 4.7% 4.7% 4.7% 95.3%Grades 9-12 * % * % 11.8% 88.2%
________________________________________________________________________________Ecstasy All 5.7% 5.7% 10.8% 89.2%
Grades 7-8 10.7% 10.7% 10.7% 89.3%Grades 9-12 * % * % 11.0% 89.0%
________________________________________________________________________________Heroin All 5.7% 5.7% 5.7% 94.3%
Grades 7-8 10.7% 10.7% 10.7% 89.3%Grades 9-12 * % * % * % 100.0%

8/14/2019 PARKER COUNTY - Poolville ISD - 2005 Texas School Survey of Drug and Alcohol Use
http://slidepdf.com/reader/full/parker-county-poolville-isd-2005-texas-school-survey-of-drug-and-alcohol 40/89
PoolvilleSpring 2005
Table B9: Prevalence and recency of use of selected substances by grade--> Students living with two parents
Past School Ever NeverMonth Year Used Used
________________________________________________________________________________
Tobacco All 21.0% 31.1% 39.6% 60.4%Grades 7-8 6.4% 15.7% 25.7% 74.3%Grades 9-12 28.6% 39.0% 46.7% 53.3%
________________________________________________________________________________Alcohol All 36.9% 42.6% 62.2% 37.8%
Grades 7-8 27.6% 27.6% 53.1% 46.9%Grades 9-12 42.0% 50.7% 67.2% 32.8%
________________________________________________________________________________Inhalants All 9.7% 12.6% 25.6% 74.4%
Grades 7-8 5.5% 5.5% 17.9% 82.1%Grades 9-12 12.0% 16.5% 29.7% 70.3%
________________________________________________________________________________Any Illicit Drug All 5.3% 14.3% 28.4% 71.6%
Grades 7-8 2.7% 6.2% 14.4% 85.6%Grades 9-12 6.7% 18.6% 35.9% 64.1%
________________________________________________________________________________Marijuana All 5.4% 14.4% 28.8% 71.2%
Grades 7-8 2.8% 6.4% 14.9% 85.1%Grades 9-12 6.7% 18.6% 35.9% 64.1%________________________________________________________________________________Marijuana Only All * % 7.8% 19.2% 80.8%
Grades 7-8 * % 3.5% 11.7% 88.3%Grades 9-12 * % 10.1% 23.1% 76.9%
________________________________________________________________________________Cocaine or Crack All * % * % 1.2% 98.8%
Grades 7-8 * % * % * % 100.0%Grades 9-12 * % * % 1.8% 98.2%
________________________________________________________________________________Cocaine All * % * % 1.2% 98.8%
Grades 7-8 * % * % * % 100.0%Grades 9-12 * % * % 1.9% 98.1%
________________________________________________________________________________Crack All * % * % 1.2% 98.8%
Grades 7-8 * % * % * % 100.0%
Grades 9-12 * % * % 1.8% 98.2%________________________________________________________________________________Hallucinogens All 1.1% 2.1% 4.3% 95.7%
Grades 7-8 * % * % * % 100.0%Grades 9-12 1.8% 3.3% 6.6% 93.4%
________________________________________________________________________________Uppers All 3.1% 3.1% 4.2% 95.8%
Grades 7-8 2.7% 2.7% 2.7% 97.3%Grades 9-12 3.3% 3.3% 5.1% 94.9%
________________________________________________________________________________Downers All 1.2% 2.2% 3.3% 96.7%
Grades 7-8 * % * % * % 100.0%Grades 9-12 1.8% 3.3% 5.1% 94.9%
________________________________________________________________________________Rohypnol All * % * % * % 100.0%
Grades 7-8 * % * % * % 100.0%Grades 9-12 * % * % * % 100.0%
________________________________________________________________________________Steroids All * % * % 1.2% 98.8%
Grades 7-8 * % * % * % 100.0%Grades 9-12 * % * % 1.9% 98.1%
________________________________________________________________________________Ecstasy All * % * % 3.8% 96.2%
Grades 7-8 * % * % * % 100.0%Grades 9-12 * % * % 5.8% 94.2%
________________________________________________________________________________Heroin All * % * % * % 100.0%
Grades 7-8 * % * % * % 100.0%Grades 9-12 * % * % * % 100.0%

8/14/2019 PARKER COUNTY - Poolville ISD - 2005 Texas School Survey of Drug and Alcohol Use
http://slidepdf.com/reader/full/parker-county-poolville-isd-2005-texas-school-survey-of-drug-and-alcohol 41/89
PoolvilleSpring 2005
Table B10: Prevalence and recency of use of selected substances by grade--> Students not living with two parents
Past School Ever NeverMonth Year Used Used
________________________________________________________________________________
Tobacco All 31.3% 41.5% 71.0% 29.0%Grades 7-8 28.9% 36.9% 70.0% 30.0%Grades 9-12 32.3% 43.7% 71.4% 28.6%
________________________________________________________________________________Alcohol All 43.8% 67.4% 86.2% 13.8%
Grades 7-8 39.9% 75.3% 95.2% 4.8%Grades 9-12 45.7% 63.5% 81.8% 18.2%
________________________________________________________________________________Inhalants All 11.7% 21.0% 26.9% 73.1%
Grades 7-8 16.2% 27.5% 39.9% 60.1%Grades 9-12 9.6% 17.8% 20.7% 79.3%
________________________________________________________________________________Any Illicit Drug All 20.9% 27.1% 44.4% 55.6%
Grades 7-8 24.7% 36.1% 44.7% 55.3%Grades 9-12 19.0% 22.7% 44.3% 55.7%
________________________________________________________________________________Marijuana All 19.6% 27.5% 43.5% 56.5%
Grades 7-8 20.0% 36.1% 39.9% 60.1%Grades 9-12 19.4% 23.2% 45.3% 54.7%________________________________________________________________________________Marijuana Only All 10.0% 12.4% 25.5% 74.5%
Grades 7-8 8.6% 12.4% 16.2% 83.8%Grades 9-12 10.6% 12.5% 30.0% 70.0%
________________________________________________________________________________Cocaine or Crack All 2.9% 5.5% 9.4% 90.6%
Grades 7-8 8.6% 12.4% 12.4% 87.6%Grades 9-12 * % 2.0% 7.8% 92.2%
________________________________________________________________________________Cocaine All 2.9% 5.6% 8.2% 91.8%
Grades 7-8 9.0% 13.0% 13.0% 87.0%Grades 9-12 * % 2.0% 5.9% 94.1%
________________________________________________________________________________Crack All 1.7% 1.7% 4.4% 95.6%
Grades 7-8 5.0% 5.0% 5.0% 95.0%
Grades 9-12 * % * % 4.0% 96.0%________________________________________________________________________________Hallucinogens All 1.5% 3.2% 8.6% 91.4%
Grades 7-8 * % 5.0% 9.0% 91.0%Grades 9-12 2.3% 2.3% 8.5% 91.5%
________________________________________________________________________________Uppers All * % 1.4% 5.8% 94.2%
Grades 7-8 * % * % 5.0% 95.0%Grades 9-12 * % 2.1% 6.2% 93.8%
________________________________________________________________________________Downers All * % 1.3% 5.3% 94.7%
Grades 7-8 * % * % 3.9% 96.1%Grades 9-12 * % 2.0% 6.0% 94.0%
________________________________________________________________________________Rohypnol All 1.3% 1.3% 2.6% 97.4%
Grades 7-8 4.1% 4.1% 4.1% 95.9%Grades 9-12 * % * % 1.9% 98.1%
________________________________________________________________________________Steroids All 1.3% 1.3% 2.7% 97.3%
Grades 7-8 4.1% 4.1% 4.1% 95.9%Grades 9-12 * % * % 2.0% 98.0%
________________________________________________________________________________Ecstasy All 3.0% 4.4% 10.2% 89.8%
Grades 7-8 9.8% 14.1% 23.9% 76.1%Grades 9-12 * % * % 4.0% 96.0%
________________________________________________________________________________Heroin All 3.0% 4.3% 4.3% 95.7%
Grades 7-8 9.4% 13.5% 13.5% 86.5%Grades 9-12 * % * % * % 100.0%

8/14/2019 PARKER COUNTY - Poolville ISD - 2005 Texas School Survey of Drug and Alcohol Use
http://slidepdf.com/reader/full/parker-county-poolville-isd-2005-texas-school-survey-of-drug-and-alcohol 42/89
PoolvilleSpring 2005
Table B11: Prevalence and recency of use of selected substances by grade--> Students would seek help from adults for substance abuse problems
Past School Ever NeverMonth Year Used Used
________________________________________________________________________________
Tobacco All 18.0% 27.9% 46.1% 53.9%Grades 7-8 4.6% 11.6% 33.1% 66.9%Grades 9-12 24.2% 35.4% 52.0% 48.0%
________________________________________________________________________________Alcohol All 35.4% 47.1% 68.9% 31.1%
Grades 7-8 21.4% 37.8% 68.6% 31.4%Grades 9-12 42.0% 51.5% 69.0% 31.0%
________________________________________________________________________________Inhalants All 7.1% 11.8% 19.3% 80.7%
Grades 7-8 4.6% 6.9% 19.7% 80.3%Grades 9-12 8.3% 14.1% 19.2% 80.8%
________________________________________________________________________________Any Illicit Drug All 7.9% 17.3% 33.7% 66.3%
Grades 7-8 4.6% 14.5% 22.0% 78.0%Grades 9-12 9.4% 18.5% 39.0% 61.0%
________________________________________________________________________________Marijuana All 7.9% 17.4% 33.0% 67.0%
Grades 7-8 4.6% 14.5% 19.1% 80.9%Grades 9-12 9.5% 18.8% 39.5% 60.5%________________________________________________________________________________Marijuana Only All 3.1% 9.5% 22.2% 77.8%
Grades 7-8 2.3% 7.6% 12.2% 87.8%Grades 9-12 3.4% 10.3% 26.8% 73.2%
________________________________________________________________________________Cocaine or Crack All * % 0.7% 3.9% 96.1%
Grades 7-8 * % 2.3% 2.3% 97.7%Grades 9-12 * % * % 4.6% 95.4%
________________________________________________________________________________Cocaine All * % 0.8% 3.2% 96.8%
Grades 7-8 * % 2.3% 2.3% 97.7%Grades 9-12 * % * % 3.6% 96.4%
________________________________________________________________________________Crack All * % * % 2.5% 97.5%
Grades 7-8 * % * % * % 100.0%
Grades 9-12 * % * % 3.6% 96.4%________________________________________________________________________________Hallucinogens All 0.9% 1.6% 4.0% 96.0%
Grades 7-8 * % * % 2.3% 97.7%Grades 9-12 1.3% 2.4% 4.8% 95.2%
________________________________________________________________________________Uppers All 2.4% 3.2% 4.9% 95.1%
Grades 7-8 2.3% 2.3% 2.3% 97.7%Grades 9-12 2.5% 3.6% 6.1% 93.9%
________________________________________________________________________________Downers All 0.9% 2.4% 4.1% 95.9%
Grades 7-8 * % * % * % 100.0%Grades 9-12 1.3% 3.6% 6.0% 94.0%
________________________________________________________________________________Rohypnol All * % * % 0.8% 99.2%
Grades 7-8 * % * % * % 100.0%Grades 9-12 * % * % 1.1% 98.9%
________________________________________________________________________________Steroids All * % * % 0.8% 99.2%
Grades 7-8 * % * % * % 100.0%Grades 9-12 * % * % 1.2% 98.8%
________________________________________________________________________________Ecstasy All * % 0.8% 6.2% 93.8%
Grades 7-8 * % 2.4% 7.9% 92.1%Grades 9-12 * % * % 5.4% 94.6%
________________________________________________________________________________Heroin All * % 0.8% 0.8% 99.2%
Grades 7-8 * % 2.4% 2.4% 97.6%Grades 9-12 * % * % * % 100.0%

8/14/2019 PARKER COUNTY - Poolville ISD - 2005 Texas School Survey of Drug and Alcohol Use
http://slidepdf.com/reader/full/parker-county-poolville-isd-2005-texas-school-survey-of-drug-and-alcohol 43/89
PoolvilleSpring 2005
Table B12: Prevalence and recency of use of selected substances by grade--> Students wouldn't seek help from adults for substance abuse problems
Past School Ever NeverMonth Year Used Used
________________________________________________________________________________
Tobacco All 46.6% 57.9% 74.0% 26.0%Grades 7-8 44.0% 57.2% 72.0% 28.0%Grades 9-12 48.2% 58.3% 75.2% 24.8%
________________________________________________________________________________Alcohol All 51.5% 70.5% 83.1% 16.9%
Grades 7-8 57.6% 69.2% 75.6% 24.4%Grades 9-12 47.2% 71.4% 88.4% 11.6%
________________________________________________________________________________Inhalants All 18.5% 27.2% 44.0% 56.0%
Grades 7-8 21.7% 31.9% 43.4% 56.6%Grades 9-12 16.3% 24.0% 44.5% 55.5%
________________________________________________________________________________Any Illicit Drug All 22.2% 25.6% 38.9% 61.1%
Grades 7-8 28.1% 28.1% 38.3% 61.7%Grades 9-12 18.1% 23.8% 39.3% 60.7%
________________________________________________________________________________Marijuana All 20.1% 26.3% 39.9% 60.1%
Grades 7-8 23.2% 30.1% 40.9% 59.1%Grades 9-12 18.1% 23.8% 39.3% 60.7%________________________________________________________________________________Marijuana Only All 8.0% 11.3% 22.2% 77.8%
Grades 7-8 6.4% 6.4% 16.6% 83.4%Grades 9-12 9.2% 14.7% 26.0% 74.0%
________________________________________________________________________________Cocaine or Crack All 5.0% 5.0% 5.0% 95.0%
Grades 7-8 12.3% 12.3% 12.3% 87.7%Grades 9-12 * % * % * % 100.0%
________________________________________________________________________________Cocaine All 5.4% 5.4% 5.4% 94.6%
Grades 7-8 13.2% 13.2% 13.2% 86.8%Grades 9-12 * % * % * % 100.0%
________________________________________________________________________________Crack All 2.9% 2.9% 2.9% 97.1%
Grades 7-8 7.3% 7.3% 7.3% 92.7%
Grades 9-12 * % * % * % 100.0%________________________________________________________________________________Hallucinogens All 2.6% 5.4% 10.4% 89.6%
Grades 7-8 * % 6.9% 6.9% 93.1%Grades 9-12 4.4% 4.4% 12.8% 87.2%
________________________________________________________________________________Uppers All * % * % 2.8% 97.2%
Grades 7-8 * % * % 6.9% 93.1%Grades 9-12 * % * % * % 100.0%
________________________________________________________________________________Downers All * % * % 2.3% 97.7%
Grades 7-8 * % * % 5.4% 94.6%Grades 9-12 * % * % * % 100.0%
________________________________________________________________________________Rohypnol All 2.5% 2.5% 2.5% 97.5%
Grades 7-8 6.3% 6.3% 6.3% 93.7%Grades 9-12 * % * % * % 100.0%
________________________________________________________________________________Steroids All 2.4% 2.4% 5.2% 94.8%
Grades 7-8 5.7% 5.7% 5.7% 94.3%Grades 9-12 * % * % 4.8% 95.2%
________________________________________________________________________________Ecstasy All 5.3% 5.3% 5.3% 94.7%
Grades 7-8 14.3% 14.3% 14.3% 85.7%Grades 9-12 * % * % * % 100.0%
________________________________________________________________________________Heroin All 5.2% 5.2% 5.2% 94.8%
Grades 7-8 14.3% 14.3% 14.3% 85.7%Grades 9-12 * % * % * % 100.0%

8/14/2019 PARKER COUNTY - Poolville ISD - 2005 Texas School Survey of Drug and Alcohol Use
http://slidepdf.com/reader/full/parker-county-poolville-isd-2005-texas-school-survey-of-drug-and-alcohol 44/89
PoolvilleSpring 2005
Table B13: Prevalence and recency of use of selected substances by grade--> Students living in town three years or less
Past School Ever NeverMonth Year Used Used
________________________________________________________________________________
Tobacco All 27.5% 43.5% 63.6% 36.4%Grades 7-8 27.9% 44.8% 63.9% 36.1%Grades 9-12 27.3% 42.8% 63.5% 36.5%
________________________________________________________________________________Alcohol All 41.0% 57.8% 74.2% 25.8%
Grades 7-8 43.7% 56.1% 73.2% 26.8%Grades 9-12 39.6% 58.8% 74.8% 25.2%
________________________________________________________________________________Inhalants All 16.8% 22.2% 25.7% 74.3%
Grades 7-8 15.2% 26.5% 30.3% 69.7%Grades 9-12 17.7% 19.8% 23.1% 76.9%
________________________________________________________________________________Any Illicit Drug All 14.5% 29.6% 47.1% 52.9%
Grades 7-8 15.2% 31.3% 42.7% 57.3%Grades 9-12 14.1% 28.6% 49.5% 50.5%
________________________________________________________________________________Marijuana All 14.5% 29.6% 47.1% 52.9%
Grades 7-8 15.2% 31.3% 42.7% 57.3%Grades 9-12 14.1% 28.6% 49.5% 50.5%________________________________________________________________________________Marijuana Only All 1.4% 10.9% 25.5% 74.5%
Grades 7-8 * % 8.6% 20.0% 80.0%Grades 9-12 2.1% 12.2% 28.5% 71.5%
________________________________________________________________________________Cocaine or Crack All 1.3% 4.1% 7.0% 93.0%
Grades 7-8 3.8% 7.6% 7.6% 92.4%Grades 9-12 * % 2.1% 6.7% 93.3%
________________________________________________________________________________Cocaine All 1.4% 4.3% 7.3% 92.7%
Grades 7-8 4.0% 8.0% 8.0% 92.0%Grades 9-12 * % 2.2% 7.0% 93.0%
________________________________________________________________________________Crack All * % * % 1.6% 98.4%
Grades 7-8 * % * % * % 100.0%
Grades 9-12 * % * % 2.5% 97.5%________________________________________________________________________________Hallucinogens All 1.6% 1.6% 10.4% 89.6%
Grades 7-8 * % * % 4.0% 96.0%Grades 9-12 2.5% 2.5% 13.7% 86.3%
________________________________________________________________________________Uppers All 3.0% 4.4% 8.8% 91.2%
Grades 7-8 4.0% 4.0% 4.0% 96.0%Grades 9-12 2.5% 4.6% 11.2% 88.8%
________________________________________________________________________________Downers All 1.6% 3.0% 8.7% 91.3%
Grades 7-8 * % * % 3.8% 96.2%Grades 9-12 2.5% 4.7% 11.5% 88.5%
________________________________________________________________________________Rohypnol All 1.4% 1.4% 2.8% 97.2%
Grades 7-8 4.2% 4.2% 4.2% 95.8%Grades 9-12 * % * % 2.1% 97.9%
________________________________________________________________________________Steroids All 1.4% 1.4% 2.7% 97.3%
Grades 7-8 3.8% 3.8% 3.8% 96.2%Grades 9-12 * % * % 2.2% 97.8%
________________________________________________________________________________Ecstasy All 1.4% 2.8% 10.0% 90.0%
Grades 7-8 4.2% 8.4% 12.6% 87.4%Grades 9-12 * % * % 8.8% 91.2%
________________________________________________________________________________Heroin All 1.4% 2.8% 2.8% 97.2%
Grades 7-8 4.2% 8.4% 8.4% 91.6%Grades 9-12 * % * % * % 100.0%
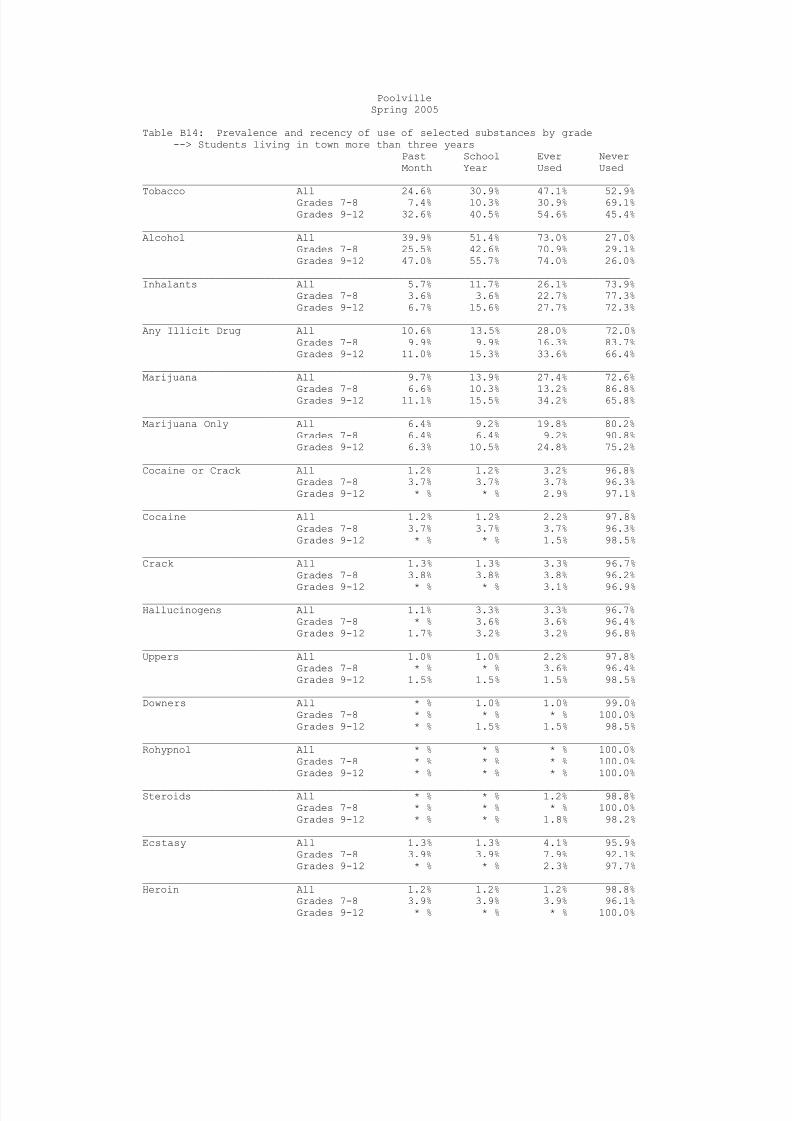
8/14/2019 PARKER COUNTY - Poolville ISD - 2005 Texas School Survey of Drug and Alcohol Use
http://slidepdf.com/reader/full/parker-county-poolville-isd-2005-texas-school-survey-of-drug-and-alcohol 45/89
PoolvilleSpring 2005
Table B14: Prevalence and recency of use of selected substances by grade--> Students living in town more than three years
Past School Ever NeverMonth Year Used Used
________________________________________________________________________________
Tobacco All 24.6% 30.9% 47.1% 52.9%Grades 7-8 7.4% 10.3% 30.9% 69.1%Grades 9-12 32.6% 40.5% 54.6% 45.4%
________________________________________________________________________________Alcohol All 39.9% 51.4% 73.0% 27.0%
Grades 7-8 25.5% 42.6% 70.9% 29.1%Grades 9-12 47.0% 55.7% 74.0% 26.0%
________________________________________________________________________________Inhalants All 5.7% 11.7% 26.1% 73.9%
Grades 7-8 3.6% 3.6% 22.7% 77.3%Grades 9-12 6.7% 15.6% 27.7% 72.3%
________________________________________________________________________________Any Illicit Drug All 10.6% 13.5% 28.0% 72.0%
Grades 7-8 9.9% 9.9% 16.3% 83.7%Grades 9-12 11.0% 15.3% 33.6% 66.4%
________________________________________________________________________________Marijuana All 9.7% 13.9% 27.4% 72.6%
Grades 7-8 6.6% 10.3% 13.2% 86.8%Grades 9-12 11.1% 15.5% 34.2% 65.8%________________________________________________________________________________Marijuana Only All 6.4% 9.2% 19.8% 80.2%
Grades 7-8 6.4% 6.4% 9.2% 90.8%Grades 9-12 6.3% 10.5% 24.8% 75.2%
________________________________________________________________________________Cocaine or Crack All 1.2% 1.2% 3.2% 96.8%
Grades 7-8 3.7% 3.7% 3.7% 96.3%Grades 9-12 * % * % 2.9% 97.1%
________________________________________________________________________________Cocaine All 1.2% 1.2% 2.2% 97.8%
Grades 7-8 3.7% 3.7% 3.7% 96.3%Grades 9-12 * % * % 1.5% 98.5%
________________________________________________________________________________Crack All 1.3% 1.3% 3.3% 96.7%
Grades 7-8 3.8% 3.8% 3.8% 96.2%
Grades 9-12 * % * % 3.1% 96.9%________________________________________________________________________________Hallucinogens All 1.1% 3.3% 3.3% 96.7%
Grades 7-8 * % 3.6% 3.6% 96.4%Grades 9-12 1.7% 3.2% 3.2% 96.8%
________________________________________________________________________________Uppers All 1.0% 1.0% 2.2% 97.8%
Grades 7-8 * % * % 3.6% 96.4%Grades 9-12 1.5% 1.5% 1.5% 98.5%
________________________________________________________________________________Downers All * % 1.0% 1.0% 99.0%
Grades 7-8 * % * % * % 100.0%Grades 9-12 * % 1.5% 1.5% 98.5%
________________________________________________________________________________Rohypnol All * % * % * % 100.0%
Grades 7-8 * % * % * % 100.0%Grades 9-12 * % * % * % 100.0%
________________________________________________________________________________Steroids All * % * % 1.2% 98.8%
Grades 7-8 * % * % * % 100.0%Grades 9-12 * % * % 1.8% 98.2%
________________________________________________________________________________Ecstasy All 1.3% 1.3% 4.1% 95.9%
Grades 7-8 3.9% 3.9% 7.9% 92.1%Grades 9-12 * % * % 2.3% 97.7%
________________________________________________________________________________Heroin All 1.2% 1.2% 1.2% 98.8%
Grades 7-8 3.9% 3.9% 3.9% 96.1%Grades 9-12 * % * % * % 100.0%

8/14/2019 PARKER COUNTY - Poolville ISD - 2005 Texas School Survey of Drug and Alcohol Use
http://slidepdf.com/reader/full/parker-county-poolville-isd-2005-texas-school-survey-of-drug-and-alcohol 46/89
PoolvilleSpring 2005
The FREQ Procedure
GENDER
q1 Frequency Percent
-------------------------------Female 77.90089 46.65Male 89.09911 53.35
GRADE
q2 Frequency Percent------------------------------------Grade 7 28.90385 17.31Grade 8 26.33462 15.77Grade 9 37.89615 22.69Grade 10 26.97692 16.15Grade 11 23.12308 13.85Grade 12 23.76538 14.23
LIVE WITH BOTH PARENTS q3 Frequency Percent-----------------------------------No 71.52963 43.10Yes 94.43279 56.90
Frequency Missing = 1.0375739645
AGE
q4 Frequency Percent--------------------------------------11 or younger 1.397964 0.8512 6.670118 4.0513 21.29826 12.92
14 27.2075 16.5015 37.65876 22.8416 27.18985 16.4917 21.67702 13.1518 20.86192 12.6619 or older 0.889349 0.54
Frequency Missing = 2.149260355
ETHNICITY
q5 Frequency Percent-----------------------------------------African/American 1.037574 0.63Asian/American 3.621337 2.21Mexican/American 16.00653 9.76
Native/American 1.037574 0.63Other 4.818719 2.94White 137.4267 83.82
Frequency Missing = 3.0515497323
The frequencies have been weighted so that theanalysis reflects the distribution of students by grade
level in the district

8/14/2019 PARKER COUNTY - Poolville ISD - 2005 Texas School Survey of Drug and Alcohol Use
http://slidepdf.com/reader/full/parker-county-poolville-isd-2005-texas-school-survey-of-drug-and-alcohol 47/89
PoolvilleSpring 2005
The FREQ Procedure
ON AVERAGE WHAT GRADES DO YOU GET
q6 Frequency Percent
-----------------------------------Mostly A's 42.39433 26.08Mostly B's 84.08746 51.73Mostly C's 32.25014 19.84Mostly D's 2.916265 1.79Mostly F's 0.902289 0.56
Frequency Missing = 4.4495135332
LENGTH OF TIME IN THIS DISTRICT
q7 Frequency Percent----------------------------------<1 year 29.80802 18.162-3 years 36.56779 22.27>4 years 97.80651 59.57
Frequency Missing = 2.8176838546
DO YOU HAVE A JOB
q8 Frequency Percent-----------------------------------No 109.7676 66.95Yes 54.18086 33.05
Frequency Missing = 3.0515497323
DO YOU GET AN ALLOWANCE
q9 Frequency Percent
-----------------------------------No 114.3326 70.11Yes 48.73799 29.89
Frequency Missing = 3.9293702451
EITHER PARENT COLLEGE GRADUATE
q10 Frequency Percent-----------------------------------Don't Know 20.15476 12.29No 94.46139 57.62Yes 49.3323 30.09
Frequency Missing = 3.0515497323
The frequencies have been weighted so that theanalysis reflects the distribution of students by grade
level in the district

8/14/2019 PARKER COUNTY - Poolville ISD - 2005 Texas School Survey of Drug and Alcohol Use
http://slidepdf.com/reader/full/parker-county-poolville-isd-2005-texas-school-survey-of-drug-and-alcohol 48/89

8/14/2019 PARKER COUNTY - Poolville ISD - 2005 Texas School Survey of Drug and Alcohol Use
http://slidepdf.com/reader/full/parker-county-poolville-isd-2005-texas-school-survey-of-drug-and-alcohol 49/89
PoolvilleSpring 2005
The FREQ Procedure
PARTICIPATE IN STUDENT GOVERNMENT
q12f Frequency Percent
-----------------------------------No 125.1919 94.15Yes 7.774456 5.85
Frequency Missing = 34.033616263
PARTICIPATE IN SCHOOL NEWSPAPER/YEARBOOK
q12g Frequency Percent-----------------------------------No 121.9541 88.64Yes 15.6352 11.36
Frequency Missing = 29.410703181
PARTICIPATE IN ACADEMIC CLUBS/SOCIETIES q12h Frequency Percent-----------------------------------No 107.8773 81.43Yes 24.60704 18.57
Frequency Missing = 34.515699949
PARTICIPATE IN SERVICE CLUBS
q12i Frequency Percent-----------------------------------No 134.0638 96.55Yes 4.796963 3.45
Frequency Missing = 28.139207979
PARTICIPATE IN VOE/DE/WORK-STUDY
q12j Frequency Percent-----------------------------------No 139.7876 99.01Yes 1.397964 0.99
Frequency Missing = 25.814485936
PARTICIPATE IN OTHER CLUBS
q12k Frequency Percent-----------------------------------
No 99.6616 69.48Yes 43.78399 30.52
Frequency Missing = 23.554409859
The frequencies have been weighted so that theanalysis reflects the distribution of students by grade
level in the district

8/14/2019 PARKER COUNTY - Poolville ISD - 2005 Texas School Survey of Drug and Alcohol Use
http://slidepdf.com/reader/full/parker-county-poolville-isd-2005-texas-school-survey-of-drug-and-alcohol 50/89
PoolvilleSpring 2005
The FREQ Procedure
DO YOU FEEL SAFE IN YOUR HOME
q13a Frequency Percent
----------------------------------------Very Safe 117.8859 71.64Somewhat Safe 34.09419 20.72Not Very Safe 6.354736 3.86Not Safe At All 4.28976 2.61Don't Know 1.939863 1.18
Frequency Missing = 2.4355377654
DO YOU FEEL SAFE IN YOUR NEIGHBORHOOD
q13b Frequency Percent----------------------------------------Very Safe 66.22273 40.51Somewhat Safe 69.56199 42.56Not Very Safe 16.24638 9.94
Not Safe At All 9.617094 5.88Don't Know 1.804579 1.10
Frequency Missing = 3.5472241559
DO YOU FEEL SAFE AT SCHOOL
q13c Frequency Percent----------------------------------------Very Safe 67.77219 41.69Somewhat Safe 63.52555 39.07Not Very Safe 9.650379 5.94Not Safe At All 16.11522 9.91Don't Know 5.511612 3.39
Frequency Missing = 4.4250446688
FRIENDS FEELING CLOSE TO THEIR PARENTS
q14a Frequency Percent------------------------------None 14.03872 8.59A Few 60.9749 37.30Some 46.86489 28.67Most 33.8855 20.73All 7.688759 4.70
Frequency Missing = 3.5472241559
The frequencies have been weighted so that theanalysis reflects the distribution of students by grade
level in the district

8/14/2019 PARKER COUNTY - Poolville ISD - 2005 Texas School Survey of Drug and Alcohol Use
http://slidepdf.com/reader/full/parker-county-poolville-isd-2005-texas-school-survey-of-drug-and-alcohol 51/89
PoolvilleSpring 2005
The FREQ Procedure
HOW MANY FRIENDS CARRY WEAPONS
q14b Frequency Percent
------------------------------None 57.5405 35.59A Few 37.543 23.22Some 24.11137 14.91Most 22.18504 13.72All 20.28123 12.55
Frequency Missing = 5.3388626456
HOW MANY FRIENDS CARE ABOUT GOOD GRADES
q14c Frequency Percent------------------------------None 7.005389 4.52A Few 45.02367 29.03Some 48.8047 31.46
Most 39.16596 25.25All 15.11159 9.74
Frequency Missing = 11.888698805
HOW MANY FRIENDS BELONG TO A GANG
q14d Frequency Percent------------------------------None 107.7663 66.29A Few 26.17846 16.10Some 13.91149 8.56Most 6.562126 4.04All 8.156547 5.02
Frequency Missing = 4.4250446688
FRIENDS WISHING TO DROP OUT OF SCHOOL
q14e Frequency Percent------------------------------None 69.98963 42.82A Few 62.08458 37.98Some 14.94172 9.14Most 11.29444 6.91All 5.142406 3.15
Frequency Missing = 3.5472241559
PARENTS ATTEND PTA/SCHOOL OPEN HOUSES
q15 Frequency Percent-----------------------------------No 93.46651 68.30Yes 43.38831 31.70
Frequency Missing = 30.14518431
The frequencies have been weighted so that theanalysis reflects the distribution of students by grade
level in the district

8/14/2019 PARKER COUNTY - Poolville ISD - 2005 Texas School Survey of Drug and Alcohol Use
http://slidepdf.com/reader/full/parker-county-poolville-isd-2005-texas-school-survey-of-drug-and-alcohol 52/89
PoolvilleSpring 2005
The FREQ Procedure
EVER INHALED SPRAY PAINT FOR KICKS
q16a Frequency Percent
-------------------------------------------Never Heard/Used 146.8561 90.34In Your Lifetime 2.829212 1.74Since School Began 3.671036 2.26In the Past Month 9.207061 5.66
Frequency Missing = 4.4365732684
EVER INHALED WHITEOUT FOR KICKS
q16b Frequency Percent-------------------------------------------Never Heard/Used 140.4273 87.71In Your Lifetime 9.46469 5.91Since School Began 4.597794 2.87In the Past Month 5.613611 3.51
Frequency Missing = 6.8966352577
EVER INHALED GASOLINE FOR KICKS
q16c Frequency Percent-------------------------------------------Never Heard/Used 135.8697 89.86In Your Lifetime 6.57436 4.35Since School Began 2.65793 1.76In the Past Month 6.106573 4.04
Frequency Missing = 15.791482688
EVER INHALED FREON FOR KICKS
q16d Frequency Percent
-------------------------------------------Never Heard/Used 146.5481 97.44In Your Lifetime 2.952968 1.96In the Past Month 0.902289 0.60
Frequency Missing = 16.596657799
EVER INHALED POPPERS, ETC. FOR KICKS
q16e Frequency Percent-------------------------------------------Never Heard/Used 145.3453 93.73In Your Lifetime 4.596382 2.96Since School Began 0.902289 0.58
In the Past Month 4.227176 2.73
Frequency Missing = 11.928875905
The frequencies have been weighted so that theanalysis reflects the distribution of students by grade
level in the district

8/14/2019 PARKER COUNTY - Poolville ISD - 2005 Texas School Survey of Drug and Alcohol Use
http://slidepdf.com/reader/full/parker-county-poolville-isd-2005-texas-school-survey-of-drug-and-alcohol 53/89
PoolvilleSpring 2005
The FREQ Procedure
EVER INHALED GLUE FOR KICKS
q16f Frequency Percent
-------------------------------------------Never Heard/Used 143.7292 94.55In Your Lifetime 2.964497 1.95Since School Began 1.78011 1.17In the Past Month 3.547224 2.33
Frequency Missing = 14.979013972
EVER INHALED PAINT THINNERS FOR KICKS
q16g Frequency Percent-------------------------------------------Never Heard/Used 137.2404 90.20In Your Lifetime 8.784793 5.77Since School Began 2.817684 1.85In the Past Month 3.313358 2.18
Frequency Missing = 14.843729385
EVER INHALED NITROUS OXIDE FOR KICKS
q16h Frequency Percent-------------------------------------------Never Heard/Used 143.1681 92.21In Your Lifetime 4.362461 2.81Since School Began 4.576037 2.95In the Past Month 3.153605 2.03
Frequency Missing = 11.73982348
EVER INHALED OCTANE BOOSTER FOR KICKS
q16i Frequency Percent
-------------------------------------------Never Heard/Used 149.8472 97.26In Your Lifetime 1.926923 1.25Since School Began 0.902289 0.59In the Past Month 1.397964 0.91
Frequency Missing = 12.925622296
EVER INHALED OTHER SPRAYS FOR KICKS
q16j Frequency Percent-------------------------------------------Never Heard/Used 140.0941 89.65In Your Lifetime 8.046437 5.15
Since School Began 4.818719 3.08In the Past Month 3.313358 2.12
Frequency Missing = 10.727368853
The frequencies have been weighted so that theanalysis reflects the distribution of students by grade
level in the district

8/14/2019 PARKER COUNTY - Poolville ISD - 2005 Texas School Survey of Drug and Alcohol Use
http://slidepdf.com/reader/full/parker-county-poolville-isd-2005-texas-school-survey-of-drug-and-alcohol 54/89

8/14/2019 PARKER COUNTY - Poolville ISD - 2005 Texas School Survey of Drug and Alcohol Use
http://slidepdf.com/reader/full/parker-county-poolville-isd-2005-texas-school-survey-of-drug-and-alcohol 55/89

8/14/2019 PARKER COUNTY - Poolville ISD - 2005 Texas School Survey of Drug and Alcohol Use
http://slidepdf.com/reader/full/parker-county-poolville-isd-2005-texas-school-survey-of-drug-and-alcohol 56/89
PoolvilleSpring 2005
The FREQ Procedure
RECENT HALLUCINOGEN USE
q18e Frequency Percent
-------------------------------------------Never Heard/Used 148.7485 93.86In Your Lifetime 5.646896 3.56Since School Began 2.001036 1.26In the Past Month 2.075148 1.31
Frequency Missing = 8.5284649363
RECENT UPPER USE
q18f Frequency Percent-------------------------------------------Never Heard/Used 148.401 95.11In Your Lifetime 3.940899 2.53Since School Began 0.889349 0.57In the Past Month 2.804744 1.80
Frequency Missing = 10.964002702
RECENT DOWNER USE
q18g Frequency Percent-------------------------------------------Never Heard/Used 149.3644 95.82In Your Lifetime 3.707033 2.38Since School Began 1.778698 1.14In the Past Month 1.037574 0.67
Frequency Missing = 11.112282913
RECENT ROHYPNOL USE
q18h Frequency Percent
-------------------------------------------Never Heard/Used 149.376 98.83In Your Lifetime 0.889349 0.59In the Past Month 0.877821 0.58
Frequency Missing = 15.856834485
RECENT STEROID USE
q18i Frequency Percent-------------------------------------------Never Heard/Used 146.6569 98.12In Your Lifetime 1.926923 1.29In the Past Month 0.877821 0.59
Frequency Missing = 17.538363085
The frequencies have been weighted so that theanalysis reflects the distribution of students by grade
level in the district

8/14/2019 PARKER COUNTY - Poolville ISD - 2005 Texas School Survey of Drug and Alcohol Use
http://slidepdf.com/reader/full/parker-county-poolville-isd-2005-texas-school-survey-of-drug-and-alcohol 57/89
PoolvilleSpring 2005
The FREQ Procedure
RECENT ECSTASY USE
q18j Frequency Percent
-------------------------------------------Never Heard/Used 143.1212 93.49In Your Lifetime 7.106032 4.64Since School Began 0.877821 0.57In the Past Month 1.989507 1.30
Frequency Missing = 13.905442544
RECENT HEROIN USE
q18k Frequency Percent-------------------------------------------Never Heard/Used 151.1166 98.14Since School Began 0.877821 0.57In the Past Month 1.989507 1.29
Frequency Missing = 13.016093431
TOBACCO USE IN PAST MONTH
q19a Frequency Percent-----------------------------------------Never Heard/Used 110.6562 69.701-2 times 13.81986 8.703-10 times 5.327389 3.3611+ times 28.96733 18.24
Frequency Missing = 8.229247261
ALCOHOL USE IN PAST MONTH
q19b Frequency Percent-----------------------------------------Never Heard/Used 93.56656 59.651-2 times 36.77382 23.443-10 times 11.61542 7.4111+ times 14.89956 9.50
Frequency Missing = 10.144641738
INHALANT USE IN PAST MONTH
q19c Frequency Percent-----------------------------------------Never Heard/Used 145.6336 94.371-2 times 6.698116 4.343-10 times 1.111686 0.72
11+ times 0.877821 0.57
Frequency Missing = 12.678816154
The frequencies have been weighted so that theanalysis reflects the distribution of students by grade
level in the district

8/14/2019 PARKER COUNTY - Poolville ISD - 2005 Texas School Survey of Drug and Alcohol Use
http://slidepdf.com/reader/full/parker-county-poolville-isd-2005-texas-school-survey-of-drug-and-alcohol 58/89
PoolvilleSpring 2005
The FREQ Procedure
MARIJUANA USE IN PAST MONTH
q19d Frequency Percent
-----------------------------------------Never Heard/Used 128.614 82.071-2 times 17.94568 11.453-10 times 3.571748 2.2811+ times 6.574305 4.20
Frequency Missing = 10.294222896
COCAINE USE IN PAST MONTH
q19e Frequency Percent-----------------------------------------Never Heard/Used 153.5672 98.711-2 times 0.902289 0.5811+ times 1.111686 0.71
Frequency Missing = 11.418849552
CRACK USE IN PAST MONTH
q19f Frequency Percent-----------------------------------------Never Heard/Used 154.0758 98.723-10 times 1.111686 0.7111+ times 0.889349 0.57
Frequency Missing = 10.923175128
CLOSE FRIENDS USE CIGARETTES
q20a Frequency Percent
-----------------------------------------Never heard/None 47.0104 30.90A few 51.51355 33.86Some 20.6742 13.59Most 26.01184 17.10All 6.921104 4.55
Frequency Missing = 14.868904082
CLOSE FRIENDS USE SMOKELESS TOBACCO
q20b Frequency Percent-----------------------------------------Never heard/None 79.13755 51.08A few 30.42528 19.64Some 19.45446 12.56
Most 15.18982 9.80All 10.7172 6.92
Frequency Missing = 12.075689092
The frequencies have been weighted so that theanalysis reflects the distribution of students by grade
level in the district

8/14/2019 PARKER COUNTY - Poolville ISD - 2005 Texas School Survey of Drug and Alcohol Use
http://slidepdf.com/reader/full/parker-county-poolville-isd-2005-texas-school-survey-of-drug-and-alcohol 59/89
PoolvilleSpring 2005
The FREQ Procedure
CLOSE FRIENDS USE BEER
q20c Frequency Percent
-----------------------------------------Never heard/None 32.01975 20.99A few 39.5174 25.91Some 23.18325 15.20Most 33.75016 22.13All 24.04262 15.76
Frequency Missing = 14.486813353
CLOSE FRIENDS USE WINE COOLERS
q20d Frequency Percent-----------------------------------------Never heard/None 54.79563 35.77A few 35.03389 22.87Some 27.16503 17.73
Most 23.54294 15.37All 12.64412 8.25
Frequency Missing = 13.818389853
CLOSE FRIENDS USE WINE
q20e Frequency Percent-----------------------------------------Never heard/None 77.62538 49.14A few 31.78589 20.12Some 19.76109 12.51Most 16.81758 10.65All 11.98864 7.59
Frequency Missing = 9.0214267482
CLOSE FRIENDS USE LIQUOR
q20f Frequency Percent-----------------------------------------Never heard/None 50.6685 33.59A few 32.30114 21.41Some 15.83036 10.50Most 33.7414 22.37All 18.29373 12.13
Frequency Missing = 16.164868148
The frequencies have been weighted so that theanalysis reflects the distribution of students by grade
level in the district

8/14/2019 PARKER COUNTY - Poolville ISD - 2005 Texas School Survey of Drug and Alcohol Use
http://slidepdf.com/reader/full/parker-county-poolville-isd-2005-texas-school-survey-of-drug-and-alcohol 60/89
PoolvilleSpring 2005
The FREQ Procedure
CLOSE FRIENDS USE INHALANTS
q20g Frequency Percent
-----------------------------------------Never heard/None 114.1551 74.46A few 25.33322 16.52Some 7.771688 5.07Most 5.143112 3.35All 0.902289 0.59
Frequency Missing = 13.694633865
CLOSE FRIENDS USE MARIJUANA
q20h Frequency Percent-----------------------------------------Never heard/None 79.26332 50.59A few 34.74357 22.17Some 20.91148 13.35
Most 16.23974 10.36All 5.524552 3.53
Frequency Missing = 10.317335455
DIFFICULT TO GET CIGARETTES
q21a Frequency Percent---------------------------------------Never heard of 14.96613 9.58Impossible 15.29869 9.80Very difficult 9.712963 6.22Somewhat diff 11.90316 7.62Somewhat easy 33.80786 21.65Very easy 70.49542 45.14
Frequency Missing = 10.81577785
DIFFICULT TO GET SMOKELESS TOBACCO
q21b Frequency Percent---------------------------------------Never heard of 26.33615 16.93Impossible 23.20778 14.92Very difficult 8.625745 5.55Somewhat diff 7.539234 4.85Somewhat easy 25.34469 16.29Very easy 64.48672 41.46
Frequency Missing = 11.459677125
The frequencies have been weighted so that theanalysis reflects the distribution of students by grade
level in the district

8/14/2019 PARKER COUNTY - Poolville ISD - 2005 Texas School Survey of Drug and Alcohol Use
http://slidepdf.com/reader/full/parker-county-poolville-isd-2005-texas-school-survey-of-drug-and-alcohol 61/89
PoolvilleSpring 2005
The FREQ Procedure
DIFFICULT TO GET BEER
q21c Frequency Percent
---------------------------------------Never heard of 11.03676 7.14Impossible 15.34762 9.93Very difficult 14.89207 9.64Somewhat diff 17.7377 11.48Somewhat easy 30.26476 19.59Very easy 65.21366 42.21
Frequency Missing = 12.507423384
DIFFICULT TO GET WINE COOLERS
q21d Frequency Percent---------------------------------------Never heard of 14.81514 9.57Impossible 22.20691 14.35
Very difficult 12.03627 7.78Somewhat diff 16.30651 10.53Somewhat easy 27.95434 18.06Very easy 61.4671 39.71
Frequency Missing = 12.213741651
DIFFICULT TO GET WINE
q21e Frequency Percent---------------------------------------Never heard of 17.50906 11.41Impossible 24.80225 16.16Very difficult 14.75679 9.62Somewhat diff 12.72111 8.29Somewhat easy 30.48498 19.86
Very easy 53.19974 34.66
Frequency Missing = 13.526064426
DIFFICULT TO GET LIQUOR
q21f Frequency Percent---------------------------------------Never heard of 10.80289 7.02Impossible 25.44621 16.54Very difficult 12.60753 8.19Somewhat diff 15.25105 9.91Somewhat easy 28.75522 18.69Very easy 61.0109 39.65
Frequency Missing = 13.126203322
The frequencies have been weighted so that theanalysis reflects the distribution of students by grade
level in the district
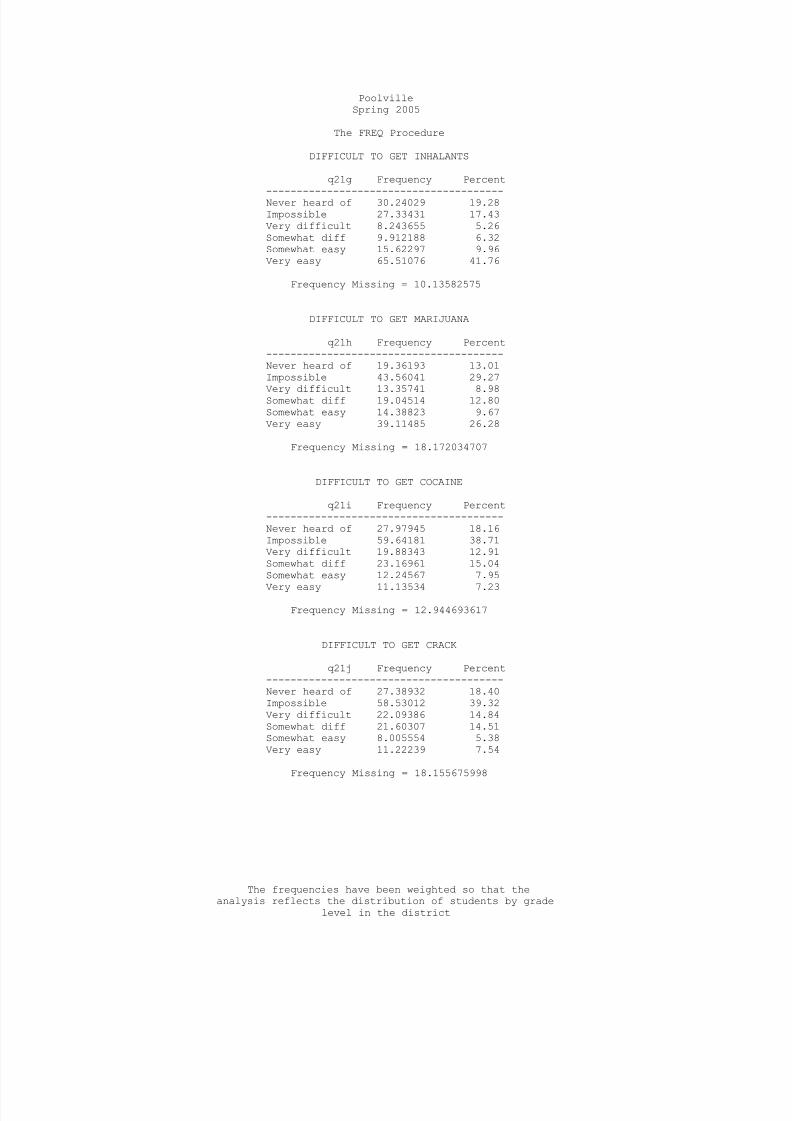
8/14/2019 PARKER COUNTY - Poolville ISD - 2005 Texas School Survey of Drug and Alcohol Use
http://slidepdf.com/reader/full/parker-county-poolville-isd-2005-texas-school-survey-of-drug-and-alcohol 62/89
PoolvilleSpring 2005
The FREQ Procedure
DIFFICULT TO GET INHALANTS
q21g Frequency Percent
---------------------------------------Never heard of 30.24029 19.28Impossible 27.33431 17.43Very difficult 8.243655 5.26Somewhat diff 9.912188 6.32Somewhat easy 15.62297 9.96Very easy 65.51076 41.76
Frequency Missing = 10.13582575
DIFFICULT TO GET MARIJUANA
q21h Frequency Percent---------------------------------------Never heard of 19.36193 13.01Impossible 43.56041 29.27
Very difficult 13.35741 8.98Somewhat diff 19.04514 12.80Somewhat easy 14.38823 9.67Very easy 39.11485 26.28
Frequency Missing = 18.172034707
DIFFICULT TO GET COCAINE
q21i Frequency Percent---------------------------------------Never heard of 27.97945 18.16Impossible 59.64181 38.71Very difficult 19.88343 12.91Somewhat diff 23.16961 15.04Somewhat easy 12.24567 7.95
Very easy 11.13534 7.23
Frequency Missing = 12.944693617
DIFFICULT TO GET CRACK
q21j Frequency Percent---------------------------------------Never heard of 27.38932 18.40Impossible 58.53012 39.32Very difficult 22.09386 14.84Somewhat diff 21.60307 14.51Somewhat easy 8.005554 5.38Very easy 11.22239 7.54
Frequency Missing = 18.155675998
The frequencies have been weighted so that theanalysis reflects the distribution of students by grade
level in the district

8/14/2019 PARKER COUNTY - Poolville ISD - 2005 Texas School Survey of Drug and Alcohol Use
http://slidepdf.com/reader/full/parker-county-poolville-isd-2005-texas-school-survey-of-drug-and-alcohol 63/89
PoolvilleSpring 2005
The FREQ Procedure
DIFFICULT TO GET HALLUCINOGENS
q21l Frequency Percent
---------------------------------------Never heard of 41.7749 27.79Impossible 51.94211 34.55Very difficult 19.85891 13.21Somewhat diff 14.87636 9.90Somewhat easy 7.315429 4.87Very easy 14.55745 9.68
Frequency Missing = 16.674839143
DIFFICULT TO GET UPPERS
q21m Frequency Percent---------------------------------------Never heard of 46.54392 30.72Impossible 55.07266 36.35
Very difficult 16.24633 10.72Somewhat diff 10.83618 7.15Somewhat easy 5.54826 3.66Very easy 17.26497 11.40
Frequency Missing = 15.48768402
DIFFICULT TO GET DOWNERS
q21n Frequency Percent---------------------------------------Never heard of 46.62685 31.44Impossible 54.15743 36.52Very difficult 13.87614 9.36Somewhat diff 11.72553 7.91Somewhat easy 5.54826 3.74
Very easy 16.37562 11.04
Frequency Missing = 18.690171216
DIFFICULT TO GET ROHYPNOL
q21o Frequency Percent---------------------------------------Never heard of 62.59726 43.42Impossible 45.45404 31.53Very difficult 11.88664 8.25Somewhat diff 8.032846 5.57Somewhat easy 5.905937 4.10Very easy 10.28411 7.13
Frequency Missing = 22.839166128
The frequencies have been weighted so that theanalysis reflects the distribution of students by grade
level in the district

8/14/2019 PARKER COUNTY - Poolville ISD - 2005 Texas School Survey of Drug and Alcohol Use
http://slidepdf.com/reader/full/parker-county-poolville-isd-2005-texas-school-survey-of-drug-and-alcohol 64/89
PoolvilleSpring 2005
The FREQ Procedure
DIFFICULT TO GET STEROIDS
q21p Frequency Percent
---------------------------------------Never heard of 32.00882 22.12Impossible 53.70993 37.11Very difficult 17.13715 11.84Somewhat diff 15.45909 10.68Somewhat easy 10.03383 6.93Very easy 16.36681 11.31
Frequency Missing = 22.284381682
DIFFICULT TO GET ECSTASY
q21q Frequency Percent---------------------------------------Never heard of 36.79013 24.31Impossible 58.74228 38.81
Very difficult 17.64435 11.66Somewhat diff 12.08592 7.99Somewhat easy 16.90181 11.17Very easy 9.183948 6.07
Frequency Missing = 15.651561749
DIFFICULT TO GET HEROIN
q21r Frequency Percent---------------------------------------Never heard of 37.46126 23.95Impossible 65.26695 41.73Very difficult 24.78708 15.85Somewhat diff 11.68882 7.47Somewhat easy 11.18222 7.15
Very easy 6.018815 3.85
Frequency Missing = 10.594852237
AGE WHEN FIRST USED CIGARETTES
q22a Frequency Percent--------------------------------------9 or younger 27.05346 33.0710 years old 6.213915 7.6011 years old 4.584853 5.6012 years old 6.893867 8.4313 years old 7.985264 9.7614 years old 12.90392 15.7715 years old 4.362461 5.3316 years old 8.640637 10.56
17 years old 3.176662 3.88
Frequency Missing = 85.184960884
The frequencies have been weighted so that theanalysis reflects the distribution of students by grade
level in the district

8/14/2019 PARKER COUNTY - Poolville ISD - 2005 Texas School Survey of Drug and Alcohol Use
http://slidepdf.com/reader/full/parker-county-poolville-isd-2005-texas-school-survey-of-drug-and-alcohol 65/89
PoolvilleSpring 2005
The FREQ Procedure
AGE WHEN FIRST USED SMOKELESS TOBACCO
q22b Frequency Percent
--------------------------------------9 or younger 8.999726 21.8410 years old 3.038609 7.3711 years old 3.927959 9.5312 years old 1.926923 4.6813 years old 4.917301 11.9314 years old 4.633791 11.2515 years old 6.527429 15.8416 years old 4.066011 9.8717 years old 0.889349 2.1618 or older 2.275784 5.52
Frequency Missing = 125.79711717
AGE WHEN FIRST USED BEER
q22c Frequency Percent--------------------------------------9 or younger 32.40743 29.8510 years old 9.872716 9.0911 years old 14.29635 13.1712 years old 7.747219 7.1413 years old 11.28221 10.3914 years old 16.13834 14.8615 years old 5.6122 5.1716 years old 8.047738 7.4117 years old 2.287313 2.1118 or older 0.877821 0.81
Frequency Missing = 58.430665722
AGE WHEN FIRST USED WINE COOLERS
q22d Frequency Percent
--------------------------------------9 or younger 25.11506 26.6810 years old 10.56908 11.2311 years old 12.21979 12.9812 years old 10.12158 10.7513 years old 10.50644 11.1614 years old 12.27155 13.0415 years old 8.216307 8.7316 years old 3.176662 3.3717 years old 1.926923 2.05
Frequency Missing = 72.876596141
The frequencies have been weighted so that theanalysis reflects the distribution of students by grade
level in the district

8/14/2019 PARKER COUNTY - Poolville ISD - 2005 Texas School Survey of Drug and Alcohol Use
http://slidepdf.com/reader/full/parker-county-poolville-isd-2005-texas-school-survey-of-drug-and-alcohol 66/89
PoolvilleSpring 2005
The FREQ Procedure
AGE WHEN FIRST USED WINE
q22e Frequency Percent
--------------------------------------9 or younger 17.39161 20.7210 years old 4.671906 5.5711 years old 13.46953 16.0512 years old 14.51869 17.3013 years old 12.632 15.0514 years old 8.314944 9.9115 years old 7.326958 8.7316 years old 2.287313 2.7317 years old 3.324887 3.96
Frequency Missing = 83.062176172
AGE WHEN FIRST USED LIQUOR
q22f Frequency Percent
--------------------------------------9 or younger 18.15855 19.4610 years old 10.35551 11.1011 years old 10.93953 11.7212 years old 9.00713 9.6513 years old 13.23501 14.1814 years old 11.30532 12.1115 years old 7.178733 7.6916 years old 7.539123 8.0817 years old 4.214236 4.5218 or older 1.397964 1.50
Frequency Missing = 73.668886347
AGE WHEN FIRST USED INHALANTS
q22g Frequency Percent--------------------------------------9 or younger 3.842318 19.5510 years old 0.902289 4.5911 years old 5.388506 27.4212 years old 2.867327 14.5913 years old 4.573325 23.2814 years old 2.075148 10.56
Frequency Missing = 147.35108664
The frequencies have been weighted so that theanalysis reflects the distribution of students by grade
level in the district

8/14/2019 PARKER COUNTY - Poolville ISD - 2005 Texas School Survey of Drug and Alcohol Use
http://slidepdf.com/reader/full/parker-county-poolville-isd-2005-texas-school-survey-of-drug-and-alcohol 67/89

8/14/2019 PARKER COUNTY - Poolville ISD - 2005 Texas School Survey of Drug and Alcohol Use
http://slidepdf.com/reader/full/parker-county-poolville-isd-2005-texas-school-survey-of-drug-and-alcohol 68/89
PoolvilleSpring 2005
The FREQ Procedure
AGE WHEN FIRST USED UPPERS
q22m Frequency Percent
--------------------------------------11 years old 2.890385 49.3713 years old 0.889349 15.1914 years old 1.037574 17.7215 years old 1.037574 17.72
Frequency Missing = 161.14511834
AGE WHEN FIRST USED DOWNERS
q22n Frequency Percent--------------------------------------11 years old 1.778698 31.6412 years old 0.877821 15.6213 years old 0.889349 15.8214 years old 1.037574 18.46
15 years old 1.037574 18.46
Frequency Missing = 161.37898422
AGE WHEN FIRST USED ROHYPNOL
q22o Frequency Percent--------------------------------------12 years old 0.877821 49.6715 years old 0.889349 50.33
Frequency Missing = 165.23283037
AGE WHEN FIRST USED STEROIDS
q22p Frequency Percent--------------------------------------13 years old 0.889349 46.1515 years old 1.037574 53.85
Frequency Missing = 165.07307692
AGE WHEN FIRST USED ECSTASY
q22q Frequency Percent--------------------------------------9 or younger 2.795928 23.5110 years old 2.013976 16.9411 years old 1.111686 9.3512 years old 1.755641 14.7615 years old 1.926923 16.20
17 years old 2.287313 19.23
Frequency Missing = 155.10853322
The frequencies have been weighted so that theanalysis reflects the distribution of students by grade
level in the district
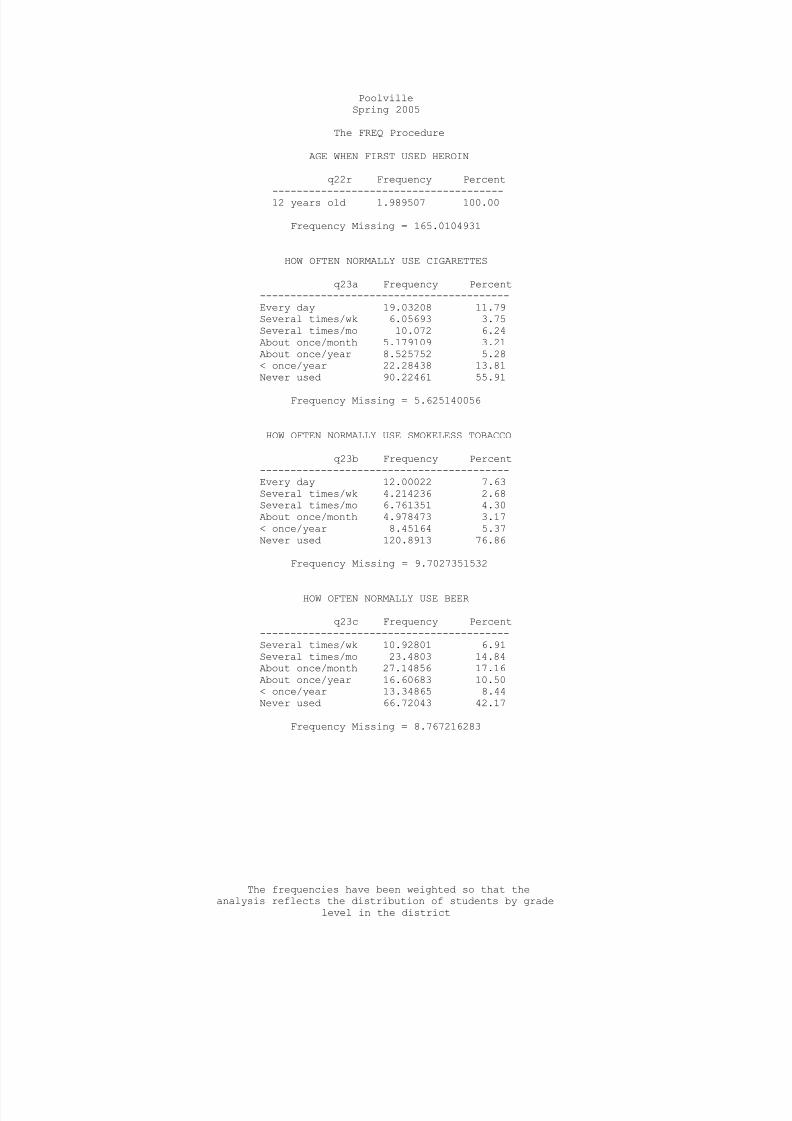
8/14/2019 PARKER COUNTY - Poolville ISD - 2005 Texas School Survey of Drug and Alcohol Use
http://slidepdf.com/reader/full/parker-county-poolville-isd-2005-texas-school-survey-of-drug-and-alcohol 69/89
PoolvilleSpring 2005
The FREQ Procedure
AGE WHEN FIRST USED HEROIN
q22r Frequency Percent
--------------------------------------12 years old 1.989507 100.00
Frequency Missing = 165.0104931
HOW OFTEN NORMALLY USE CIGARETTES
q23a Frequency Percent-----------------------------------------Every day 19.03208 11.79Several times/wk 6.05693 3.75Several times/mo 10.072 6.24About once/month 5.179109 3.21About once/year 8.525752 5.28< once/year 22.28438 13.81Never used 90.22461 55.91
Frequency Missing = 5.625140056
HOW OFTEN NORMALLY USE SMOKELESS TOBACCO
q23b Frequency Percent-----------------------------------------Every day 12.00022 7.63Several times/wk 4.214236 2.68Several times/mo 6.761351 4.30About once/month 4.978473 3.17< once/year 8.45164 5.37Never used 120.8913 76.86
Frequency Missing = 9.7027351532
HOW OFTEN NORMALLY USE BEER
q23c Frequency Percent-----------------------------------------Several times/wk 10.92801 6.91Several times/mo 23.4803 14.84About once/month 27.14856 17.16About once/year 16.60683 10.50< once/year 13.34865 8.44Never used 66.72043 42.17
Frequency Missing = 8.767216283
The frequencies have been weighted so that theanalysis reflects the distribution of students by grade
level in the district

8/14/2019 PARKER COUNTY - Poolville ISD - 2005 Texas School Survey of Drug and Alcohol Use
http://slidepdf.com/reader/full/parker-county-poolville-isd-2005-texas-school-survey-of-drug-and-alcohol 70/89
PoolvilleSpring 2005
The FREQ Procedure
HOW OFTEN NORMALLY USE WINE COOLERS
q23d Frequency Percent
-----------------------------------------Several times/wk 4.042954 2.64Several times/mo 12.66729 8.28About once/month 30.94401 20.23About once/year 15.28504 9.99< once/year 20.29352 13.27Never used 69.72505 45.58
Frequency Missing = 14.042138796
HOW OFTEN NORMALLY USE WINE
q23e Frequency Percent-----------------------------------------Several times/wk 4.042954 2.66Several times/mo 10.5295 6.94
About once/month 20.29075 13.37About once/year 17.0658 11.24< once/year 18.96967 12.50Never used 80.91145 53.30
Frequency Missing = 15.18987801
HOW OFTEN NORMALLY USE LIQUOR
q23f Frequency Percent-----------------------------------------Several times/wk 5.465387 3.47Several times/mo 20.93736 13.31About once/month 29.40935 18.69About once/year 14.59074 9.27< once/year 12.7414 8.10
Never used 74.18626 47.15
Frequency Missing = 9.6695056603
HOW OFTEN NORMALLY USE INHALANTS
q23g Frequency Percent-----------------------------------------Every day 1.915394 1.25Several times/wk 0.877821 0.57Several times/mo 2.14926 1.41About once/month 0.877821 0.57About once/year 0.877821 0.57< once/year 11.31015 7.41Never used 134.6811 88.21
Frequency Missing = 14.310645832
The frequencies have been weighted so that theanalysis reflects the distribution of students by grade
level in the district

8/14/2019 PARKER COUNTY - Poolville ISD - 2005 Texas School Survey of Drug and Alcohol Use
http://slidepdf.com/reader/full/parker-county-poolville-isd-2005-texas-school-survey-of-drug-and-alcohol 71/89
PoolvilleSpring 2005
The FREQ Procedure
HOW OFTEN NORMALLY USE MARIJUANA
q23h Frequency Percent
-----------------------------------------Several times/wk 8.723621 5.75Several times/mo 4.744607 3.13About once/month 7.499707 4.94About once/year 9.455929 6.23< once/year 16.19281 10.68Never used 105.0711 69.27
Frequency Missing = 15.312222333
HOW OFTEN NORMALLY USE COCAINE
q23i Frequency Percent-----------------------------------------Several times/wk 0.877821 0.59About once/month 1.111686 0.74
About once/year 1.037574 0.69< once/year 2.829212 1.89Never used 144.027 96.09
Frequency Missing = 17.116745728
HOW OFTEN NORMALLY USE CRACK
q23j Frequency Percent-----------------------------------------Several times/wk 0.877821 0.60About once/month 1.111686 0.76< once/year 1.926923 1.31Never used 143.1648 97.34
Frequency Missing = 19.918776706
HOW OFTEN NORMALLY USE HALLUCINOGENS
q23l Frequency Percent-----------------------------------------About once/month 1.111686 0.74About once/year 1.915394 1.27< once/year 4.756136 3.15Never used 143.039 94.84
Frequency Missing = 16.177808413
The frequencies have been weighted so that theanalysis reflects the distribution of students by grade
level in the district

8/14/2019 PARKER COUNTY - Poolville ISD - 2005 Texas School Survey of Drug and Alcohol Use
http://slidepdf.com/reader/full/parker-county-poolville-isd-2005-texas-school-survey-of-drug-and-alcohol 72/89
PoolvilleSpring 2005
The FREQ Procedure
HOW OFTEN NORMALLY USE UPPERS
q23m Frequency Percent
-----------------------------------------About once/month 1.037574 0.68About once/year 2.14926 1.40< once/year 1.778698 1.16Never used 148.6872 96.77
Frequency Missing = 13.347239653
HOW OFTEN NORMALLY USE DOWNERS
q23n Frequency Percent-----------------------------------------About once/month 1.915394 1.29About once/year 1.037574 0.70< once/year 1.778698 1.20Never used 144.1024 96.82
Frequency Missing = 18.165903651
HOW OFTEN NORMALLY USE ROHYPNOL
q23o Frequency Percent-----------------------------------------< once/year 1.76717 1.19Never used 146.5583 98.81
Frequency Missing = 18.67451834
HOW OFTEN NORMALLY USE STEROIDS
q23p Frequency Percent
-----------------------------------------About once/year 1.037574 0.72< once/year 1.037574 0.72Never used 142.1727 98.56
Frequency Missing = 22.752168797
HOW OFTEN NORMALLY USE ECSTASY
q23q Frequency Percent-----------------------------------------Several times/wk 0.877821 0.59Several times/mo 1.111686 0.75About once/year 1.037574 0.70< once/year 3.781145 2.55Never used 141.2963 95.40
Frequency Missing = 18.895499312
The frequencies have been weighted so that theanalysis reflects the distribution of students by grade
level in the district

8/14/2019 PARKER COUNTY - Poolville ISD - 2005 Texas School Survey of Drug and Alcohol Use
http://slidepdf.com/reader/full/parker-county-poolville-isd-2005-texas-school-survey-of-drug-and-alcohol 73/89

8/14/2019 PARKER COUNTY - Poolville ISD - 2005 Texas School Survey of Drug and Alcohol Use
http://slidepdf.com/reader/full/parker-county-poolville-isd-2005-texas-school-survey-of-drug-and-alcohol 74/89
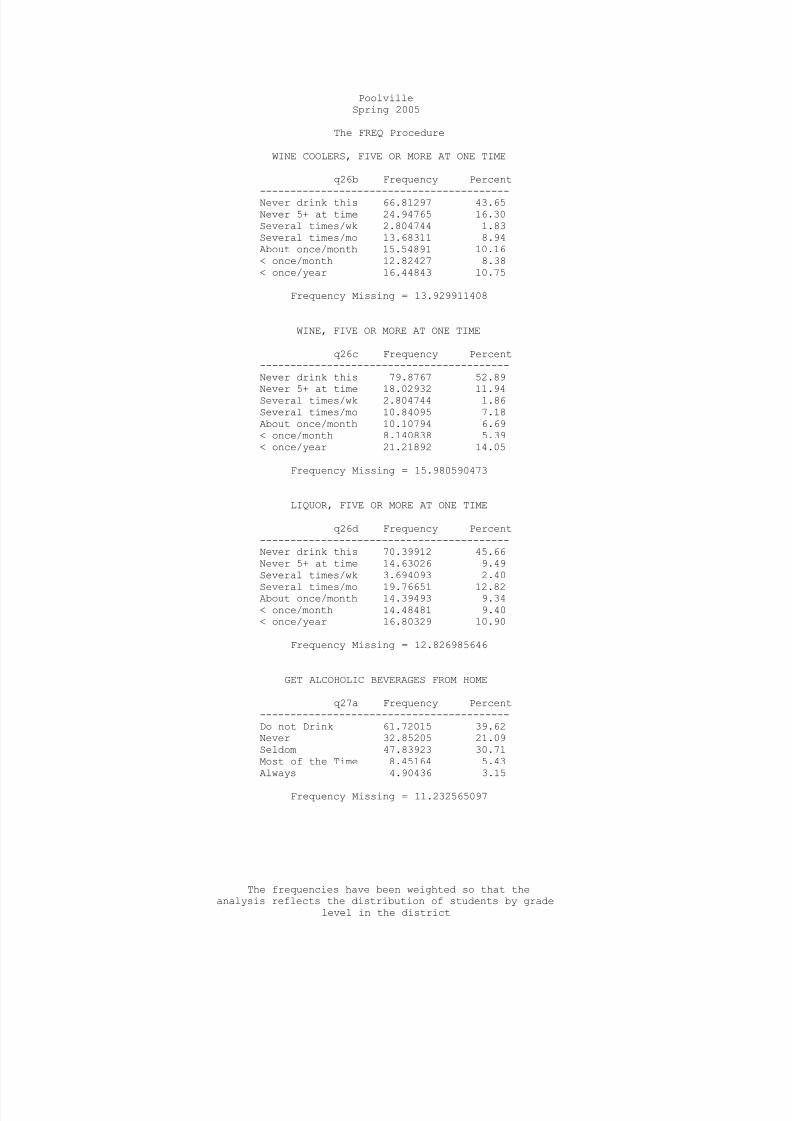
8/14/2019 PARKER COUNTY - Poolville ISD - 2005 Texas School Survey of Drug and Alcohol Use
http://slidepdf.com/reader/full/parker-county-poolville-isd-2005-texas-school-survey-of-drug-and-alcohol 75/89

8/14/2019 PARKER COUNTY - Poolville ISD - 2005 Texas School Survey of Drug and Alcohol Use
http://slidepdf.com/reader/full/parker-county-poolville-isd-2005-texas-school-survey-of-drug-and-alcohol 76/89
PoolvilleSpring 2005
The FREQ Procedure
GET ALCOHOLIC BEVERAGES FROM FRIENDS
q27b Frequency Percent
-----------------------------------------Do not Drink 53.93216 35.16Never 22.61553 14.74Seldom 22.46448 14.64Most of the Time 36.79013 23.98Always 17.60371 11.48
Frequency Missing = 13.593990436
GET ALCOHOLIC BEVERAGES FROM A STORE
q27c Frequency Percent-----------------------------------------Do not Drink 59.13433 38.10Never 74.37803 47.92Seldom 13.92584 8.97
Most of the Time 4.782016 3.08Always 2.977437 1.92
Frequency Missing = 11.802351947
GET ALCOHOLIC BEVERAGES AT PARTIES
q27d Frequency Percent-----------------------------------------Do not Drink 49.74299 31.72Never 19.62515 12.52Seldom 23.57828 15.04Most of the Time 24.52745 15.64Always 39.33114 25.08
Frequency Missing = 10.194991133
GET ALCOHOLIC BEVERAGES FROM OTHER
q27e Frequency Percent-----------------------------------------Do not Drink 56.61315 37.38Never 33.0682 21.83Seldom 23.71557 15.66Most of the Time 19.93796 13.16Always 18.11832 11.96
Frequency Missing = 15.546794043
The frequencies have been weighted so that theanalysis reflects the distribution of students by grade
level in the district

8/14/2019 PARKER COUNTY - Poolville ISD - 2005 Texas School Survey of Drug and Alcohol Use
http://slidepdf.com/reader/full/parker-county-poolville-isd-2005-texas-school-survey-of-drug-and-alcohol 77/89
PoolvilleSpring 2005
The FREQ Procedure
USE MARIJUANA AS JOINTS
q28a Frequency Percent
-----------------------------------------Never 122.7333 75.46Seldom 15.64814 9.62Half the time 7.585348 4.66Most of the time 10.8103 6.65Always 2.65793 1.63Don't know 3.202543 1.97
Frequency Missing = 4.3624608423
USE MARIJUANA AS BLUNTS
q28b Frequency Percent-----------------------------------------Never 131.2128 83.54Seldom 8.774621 5.59
Half the time 7.647932 4.87Most of the time 4.076183 2.60Always 3.54728 2.26Don't know 1.804579 1.15
Frequency Missing = 9.9366010309
USE MARIJUANA IN BONGS OR WATER PIPES
q28c Frequency Percent-----------------------------------------Never 128.0593 81.86Seldom 5.117937 3.27Half the time 8.786149 5.62Most of the time 4.089124 2.61Always 7.697575 4.92
Don't know 2.682399 1.71
Frequency Missing = 10.567560042
USE MARIJUANA IN PIPES
q28d Frequency Percent-----------------------------------------Never 119.9781 78.84Seldom 5.192049 3.41Half the time 7.376657 4.85Most of the time 6.511721 4.28Always 9.403573 6.18Don't know 3.719973 2.44
Frequency Missing = 14.817904215
The frequencies have been weighted so that theanalysis reflects the distribution of students by grade
level in the district

8/14/2019 PARKER COUNTY - Poolville ISD - 2005 Texas School Survey of Drug and Alcohol Use
http://slidepdf.com/reader/full/parker-county-poolville-isd-2005-texas-school-survey-of-drug-and-alcohol 78/89
PoolvilleSpring 2005
The FREQ Procedure
USE MARIJUANA OTHER WAYS
q28e Frequency Percent
-----------------------------------------Never 134.4406 86.24Seldom 5.633956 3.61Half the time 1.778698 1.14Most of the time 3.125662 2.01Always 4.067423 2.61Don't know 6.844224 4.39
Frequency Missing = 11.109459583
TAKE DXM, TRIPLE C'S, ETC. TO GET HIGH
q29a Frequency Percent--------------------------------------------Never heard/used 150.0199 94.99At least once/year 2.435538 1.54
At least once/life 5.474203 3.47
Frequency Missing = 9.0703644772
TAKE CODEINE COUGH SYRUP TO GET HIGH
q29b Frequency Percent--------------------------------------------Never heard/used 148.3227 92.22At least once/month 3.337827 2.08At least once/life 9.17242 5.70
Frequency Missing = 6.1670395969
DANGEROUS FOR KIDS TO USE TOBACCO
q30a Frequency Percent
-----------------------------------Very 66.24389 42.14Somewhat 40.44898 25.73Not very 25.65544 16.32Not at all 12.16139 7.74Don't know 12.68899 8.07
Frequency Missing = 9.8013164437
DANGEROUS FOR KIDS TO USE ALCOHOL
q30b Frequency Percent-----------------------------------Very 65.77133 42.25
Somewhat 41.65985 26.76Not very 27.95575 17.96Not at all 10.46562 6.72Don't know 9.8129 6.30
Frequency Missing = 11.334564832
The frequencies have been weighted so that theanalysis reflects the distribution of students by grade
level in the district

8/14/2019 PARKER COUNTY - Poolville ISD - 2005 Texas School Survey of Drug and Alcohol Use
http://slidepdf.com/reader/full/parker-county-poolville-isd-2005-texas-school-survey-of-drug-and-alcohol 79/89

8/14/2019 PARKER COUNTY - Poolville ISD - 2005 Texas School Survey of Drug and Alcohol Use
http://slidepdf.com/reader/full/parker-county-poolville-isd-2005-texas-school-survey-of-drug-and-alcohol 80/89
PoolvilleSpring 2005
The FREQ Procedure
DANGEROUS FOR KIDS TO USE ECSTASY
q30g Frequency Percent
-----------------------------------Very 119.7891 80.88Somewhat 8.984723 6.07Not very 2.817684 1.90Not at all 4.089124 2.76Don't know 12.43136 8.39
Frequency Missing = 18.88803963
DANGEROUS FOR KIDS TO USE STEROIDS
q30h Frequency Percent-----------------------------------Very 114.2523 77.44Somewhat 12.44631 8.44Not very 2.916265 1.98
Not at all 4.089124 2.77Don't know 13.82932 9.37
Frequency Missing = 19.466642468
DANGEROUS FOR KIDS TO USE HEROIN
q30i Frequency Percent-----------------------------------Very 128.2319 84.19Somewhat 7.107444 4.67Not very 1.939863 1.27Not at all 4.089124 2.68Don't know 10.93753 7.18
Frequency Missing = 14.694148227
DAYS SKIPPED SINCE SEPTEMBER
q31a Frequency Percent---------------------------------None 113.6983 70.721-3 days 31.12959 19.364-9 days 8.390468 5.2210+ days 7.552063 4.70
Frequency Missing = 6.2296234233
The frequencies have been weighted so that theanalysis reflects the distribution of students by grade
level in the district

8/14/2019 PARKER COUNTY - Poolville ISD - 2005 Texas School Survey of Drug and Alcohol Use
http://slidepdf.com/reader/full/parker-county-poolville-isd-2005-texas-school-survey-of-drug-and-alcohol 81/89

8/14/2019 PARKER COUNTY - Poolville ISD - 2005 Texas School Survey of Drug and Alcohol Use
http://slidepdf.com/reader/full/parker-county-poolville-isd-2005-texas-school-survey-of-drug-and-alcohol 82/89
PoolvilleSpring 2005
The FREQ Procedure
IN TROUBLE FOR DRUG USE SINCE SEPTEMBER
q31g Frequency Percent
---------------------------------None 156.805 97.591-3 days 2.829212 1.764-9 days 1.037574 0.65
Frequency Missing = 6.3282047138
TROUBLE WITH FRIENDS BECAUSE OF DRINKING
q32a Frequency Percent----------------------------------None 147.8311 93.901-3 times 7.674518 4.874-9 times 1.926923 1.22
Frequency Missing = 9.567450566
DRIVEN A CAR AFTER A GOOD BIT TO DRINK
q32b Frequency Percent----------------------------------None 141.6831 92.041-3 times 9.976072 6.484-9 times 2.275784 1.48
Frequency Missing = 13.06503116
CRITICIZED BY DATE BECAUSE OF DRINKING
q32c Frequency Percent----------------------------------
None 139.3904 92.691-3 times 8.709975 5.794-9 times 0.889349 0.5910+ times 1.397964 0.93
Frequency Missing = 16.612310676
TROUBLE WITH POLICE BECAUSE OF DRINKING
q32d Frequency Percent----------------------------------None 143.1205 94.071-3 times 9.021427 5.93
Frequency Missing = 14.858081315
The frequencies have been weighted so that theanalysis reflects the distribution of students by grade
level in the district
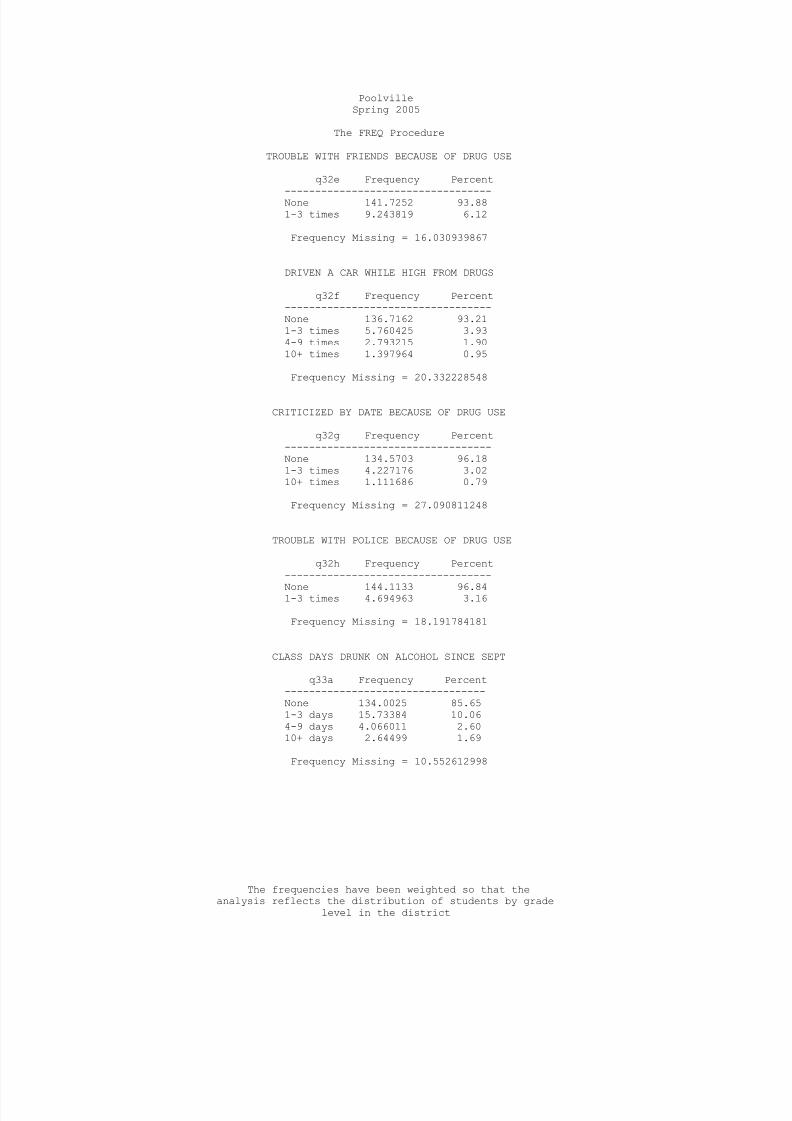
8/14/2019 PARKER COUNTY - Poolville ISD - 2005 Texas School Survey of Drug and Alcohol Use
http://slidepdf.com/reader/full/parker-county-poolville-isd-2005-texas-school-survey-of-drug-and-alcohol 83/89
PoolvilleSpring 2005
The FREQ Procedure
TROUBLE WITH FRIENDS BECAUSE OF DRUG USE
q32e Frequency Percent
----------------------------------None 141.7252 93.881-3 times 9.243819 6.12
Frequency Missing = 16.030939867
DRIVEN A CAR WHILE HIGH FROM DRUGS
q32f Frequency Percent----------------------------------None 136.7162 93.211-3 times 5.760425 3.934-9 times 2.793215 1.9010+ times 1.397964 0.95
Frequency Missing = 20.332228548
CRITICIZED BY DATE BECAUSE OF DRUG USE
q32g Frequency Percent----------------------------------None 134.5703 96.181-3 times 4.227176 3.0210+ times 1.111686 0.79
Frequency Missing = 27.090811248
TROUBLE WITH POLICE BECAUSE OF DRUG USE
q32h Frequency Percent----------------------------------
None 144.1133 96.841-3 times 4.694963 3.16
Frequency Missing = 18.191784181
CLASS DAYS DRUNK ON ALCOHOL SINCE SEPT
q33a Frequency Percent---------------------------------None 134.0025 85.651-3 days 15.73384 10.064-9 days 4.066011 2.6010+ days 2.64499 1.69
Frequency Missing = 10.552612998
The frequencies have been weighted so that theanalysis reflects the distribution of students by grade
level in the district

8/14/2019 PARKER COUNTY - Poolville ISD - 2005 Texas School Survey of Drug and Alcohol Use
http://slidepdf.com/reader/full/parker-county-poolville-isd-2005-texas-school-survey-of-drug-and-alcohol 84/89

8/14/2019 PARKER COUNTY - Poolville ISD - 2005 Texas School Survey of Drug and Alcohol Use
http://slidepdf.com/reader/full/parker-county-poolville-isd-2005-texas-school-survey-of-drug-and-alcohol 85/89
PoolvilleSpring 2005
The FREQ Procedure
DRUG USE AT PARTIES THIS SCHOOL YEAR
q34b Frequency Percent
-----------------------------------------Never 91.48929 56.65Seldom 24.96537 15.46Half the time 11.09929 6.87Most of the time 10.26916 6.36Always 10.08352 6.24Don't know 4.658966 2.88Didn't attend 8.947314 5.54
Frequency Missing = 5.4870874977
SOUGHT HELP FOR DRUG/ALCOHOL PROBLEM
q35 Frequency Percent-----------------------------------No 136.5597 93.19
Yes 9.974771 6.81
Frequency Missing = 20.465506356
WOULD SEEK HELP FROM SCHOOL COUNSELOR
q36a Frequency Percent-----------------------------------No 91.18937 58.70Yes 64.14633 41.30
Frequency Missing = 11.664299388
WOULD SEEK HELP OUTSIDE OF SCHOOL
q36b Frequency Percent-----------------------------------No 102.8076 66.15Yes 52.61096 33.85
Frequency Missing = 11.581426334
WOULD SEEK HELP FROM OTHER COUNSELOR
q36c Frequency Percent-----------------------------------No 94.03293 61.65Yes 58.48508 38.35
Frequency Missing = 14.481983243
The frequencies have been weighted so that theanalysis reflects the distribution of students by grade
level in the district
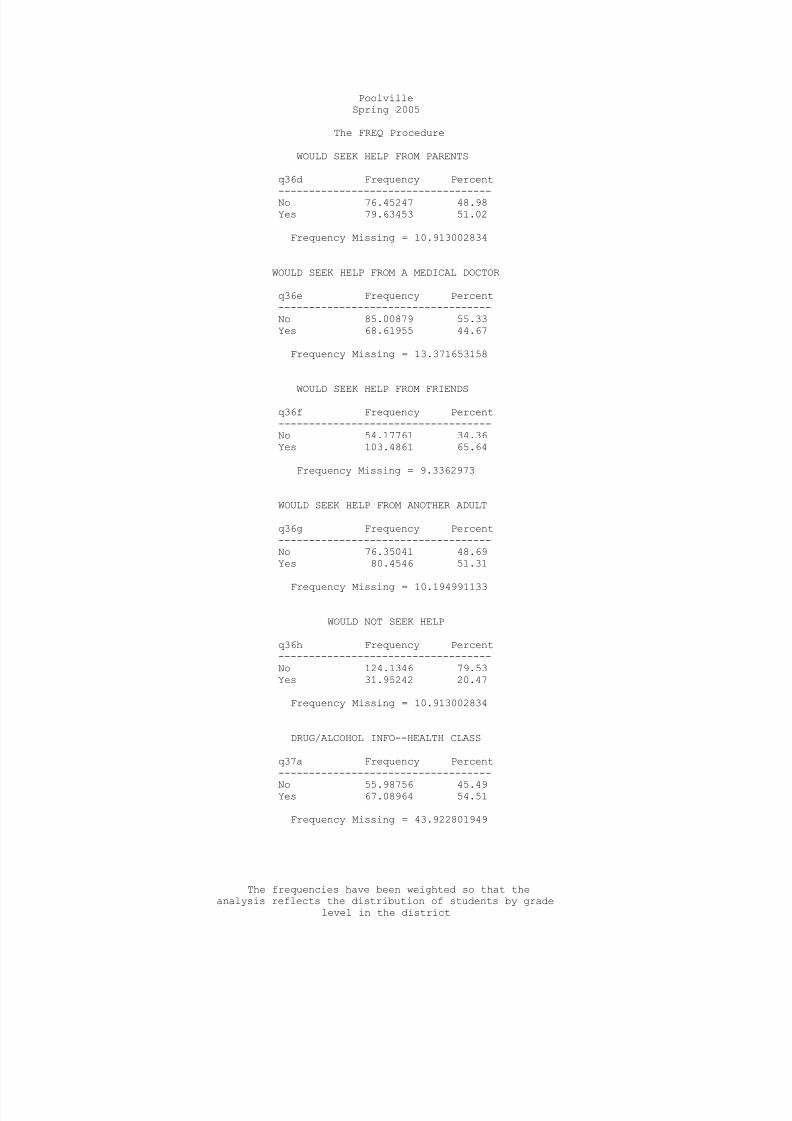
8/14/2019 PARKER COUNTY - Poolville ISD - 2005 Texas School Survey of Drug and Alcohol Use
http://slidepdf.com/reader/full/parker-county-poolville-isd-2005-texas-school-survey-of-drug-and-alcohol 86/89

8/14/2019 PARKER COUNTY - Poolville ISD - 2005 Texas School Survey of Drug and Alcohol Use
http://slidepdf.com/reader/full/parker-county-poolville-isd-2005-texas-school-survey-of-drug-and-alcohol 87/89

8/14/2019 PARKER COUNTY - Poolville ISD - 2005 Texas School Survey of Drug and Alcohol Use
http://slidepdf.com/reader/full/parker-county-poolville-isd-2005-texas-school-survey-of-drug-and-alcohol 88/89
PoolvilleSpring 2005
The FREQ Procedure
DRUG/ALCOHOL INFO--OTHER SCHOOL SOURCE
q37h Frequency Percent
-----------------------------------No 78.94636 62.83Yes 46.70172 37.17
Frequency Missing = 41.351924237
PARENTS FEEL ABOUT KIDS SMOKING CIGARET
q38a Frequency Percent------------------------------------------Strong disapprove 94.758 59.78Mild disapprove 11.4032 7.19Neither 23.44696 14.79Mildly approve 1.804579 1.14Strongly approve 5.646896 3.56Don't know 21.4629 13.54
Frequency Missing = 8.4774650689
PARENTS FEEL ABOUT KIDS DRINKING BEER
q38b Frequency Percent------------------------------------------Strong disapprove 88.72407 56.36Mild disapprove 23.38448 14.86Neither 16.50819 10.49Mildly approve 8.008322 5.09Strongly approve 5.995758 3.81Don't know 14.79002 9.40
Frequency Missing = 9.5891514594
PARENTS FEEL ABOUT KIDS USING MARIJUANA
q38c Frequency Percent------------------------------------------Strong disapprove 122.7007 77.98Mild disapprove 9.192709 5.84Neither 4.670495 2.97Mildly approve 0.902289 0.57Strongly approve 6.103099 3.88Don't know 13.78915 8.76
Frequency Missing = 9.6415629921
PURCHASED LOTTERY TICKET IN PAST YEAR
q39 Frequency Percent-----------------------------------No 123.8524 77.65Yes 35.64657 22.35
Frequency Missing = 7.5010632655
The frequencies have been weighted so that theanalysis reflects the distribution of students by grade
level in the district

8/14/2019 PARKER COUNTY - Poolville ISD - 2005 Texas School Survey of Drug and Alcohol Use
http://slidepdf.com/reader/full/parker-county-poolville-isd-2005-texas-school-survey-of-drug-and-alcohol 89/89
Top Related